Article

Catalytic Production of Glycolic Acid from Glycerol Oxidation: An Optimization Using Response Surface Methodology †

by
Claudia Patricia Tavera Ruiz
1,2,
Franck Dumeignil
1 and
Mickaël Capron
1,*
1
Univ. Lille, CRNS, Centrale Lille, ENSCL, Univ. Artois, UMR 8181-UCCS-Unité de Catalyse et Chimie du Solide, F-59000 Lille, France
2
FIELDS, Universidad de Investigación y Desarrollo, Calle 9 # 23-55, Bucaramanga, Colombia
*
Author to whom correspondence should be addressed.
In memory of Prof. Elzbieta Skrzynska.
Catalysts 2021, 11(2), 257; https://doi.org/10.3390/catal11020257
Submission received: 25 January 2021 / Revised: 8 February 2021 / Accepted: 9 February 2021 / Published: 15 February 2021

Abstract

:
This study aimed at optimizing the production of glycolic acid from glycerol catalytic oxidation over a silver catalyst supported on a mixed cerium-zirconium oxide, to progress towards the industrialization of a derived process. Optimization of the operating conditions was performed using the response surface methodology. We concluded that the production of glycolic acid depends mainly of glycerol concentration, NaOH/glycerol ratio, catalyst/glycerol ratio, and O2/glycerol ratio. The optimal conditions we found were a temperature of 60 °C, a NaOH/glycerol molar ratio of 2, an O2/glycerol molar ratio of 0.23, and a catalyst/glycerol mass ratio of 0.07. With these optimal conditions, it was possible to increase the glycerol concentration from 0.3 M to 2 M, obtaining an increase in the concentration of glycolic acid in the liquid fraction, from 0.27 mol/L of glycolic acid (with initial glycerol solution 0.3 M) to 0.88 mol/L (with initial solution 2 M), while keeping a 100% glycerol conversion.

Graphical Abstract

1. Introduction

Due to the oil crisis and the negative environmental impacts that the production and use of fossil fuels represent, the consumption of renewable energies has become a priority worldwide and research towards that direction has exhibited rapid growth and evolution. In the last decade, biodiesel has become an important alternative to fossil fuels, which has led to an increase in its production from different vegetable and animal fats. This high production of biodiesel leads to an excess production of its main by-product: crude glycerol (10 kg of biodiesel generates ca. 1 kg of glycerol) [1,2,3]. The excess of crude glycerol has caused a fall in the sale price (less than 0.5 €/kg for the lowest quality), as well as environmental and economic issues due to the fact that its final disposal is quite difficult and expensive [1,4].
Different glycerol valorization pathways have been studied to generate alternative energy carriers and to obtain high-value-added compounds of interest in different industrial applications, such as food, cosmetics, paints, and pharmaceuticals, among others [1,5].
The various identified routes to generate energy are combustion, pyrolysis, and hydrogen production (through reforming and/or partial oxidation). Combustion is an inexpensive process and is carried out without a catalyst, but glycerol presents a low heating value (18 MJ/kg) [5] and the production of CO2 is an environmental disadvantage. On the other hand, pyrolysis requires catalysts, from which H2/syngas, aldehydes, ketones, and aromatics of low molecular weight can be obtained. However, H2 yields are very low, and optimization of the yields is required. Finally, different routes have been studied to obtain hydrogen, such as steam reforming, partial oxidation, autothermal reforming, aqueous-phase reforming, and supercritical water reforming [6]; such routes are considered as a promising for glycerol valorization.
For the production of molecules with high added value for industrial applications, different reactions have been studied, among which selective oxidation, etherification, hydrogenolysis, dehydration, and fermentation, notably to 1,3-propanediol, stand out [7,8,9,10,11,12].
Within all these glycerol valorization routes, oxidation in the liquid phase using metal catalysts has been studied extensively, targeting various products of industrial value (i.e., glyceric acid (GA), glycolic acid (GLYA), or tartronic acid (TA)) [3,13,14,15,16,17,18,19,20,21], among which GLYA has the greatest commercial value and the highest price (ca. 570 €/kg) [22]. It is used in a wide range of applications in the cosmetics, pharmaceutical, and food industries [1,4]. For example, GLYA is currently widely used in the cosmetic industry as an active ingredient in different high-demand products, such as a peeling agents, anti-aging creams and acne removal creams, photoaging, melasma, and other skin-related diseases [23].
Glycerol oxidation in the liquid phase using heterogeneous catalysis is a promising process for transforming glycerol into high-value-added products. Previous studies have shown that using silver-based catalysts, it is possible to obtain a high glycerol conversion and also good selectivity towards GLYA [3,13,21]. In these previous investigations, a 0.3 M glycerol-water solution was used, and NaOH was added to promote the reaction. Even if the results obtained with these studies have so far been successful and promising, it is necessary before envisioning industrialization to solve some technical points, such as increasing the initial concentration of glycerol, decreasing the amount of water to facilitate the separation of the final products, reducing the amount of soda in the solution, and maximizing the amount of GLYA.
The present study aimed at finding conditions that allow lifting these technical locks, thus progressing toward industrialization of the process. For this, a three-stage strategy was used: First, we identified the most sensitive reaction parameters for GLYA production maximization using the response surface methodology, which was followed by an optimization of the as-identified reaction parameters. Finally, the optimal conditions we found were tested with increased glycerol concentrations.

2. Results and Discussion

2.1. Catalyst Characterization

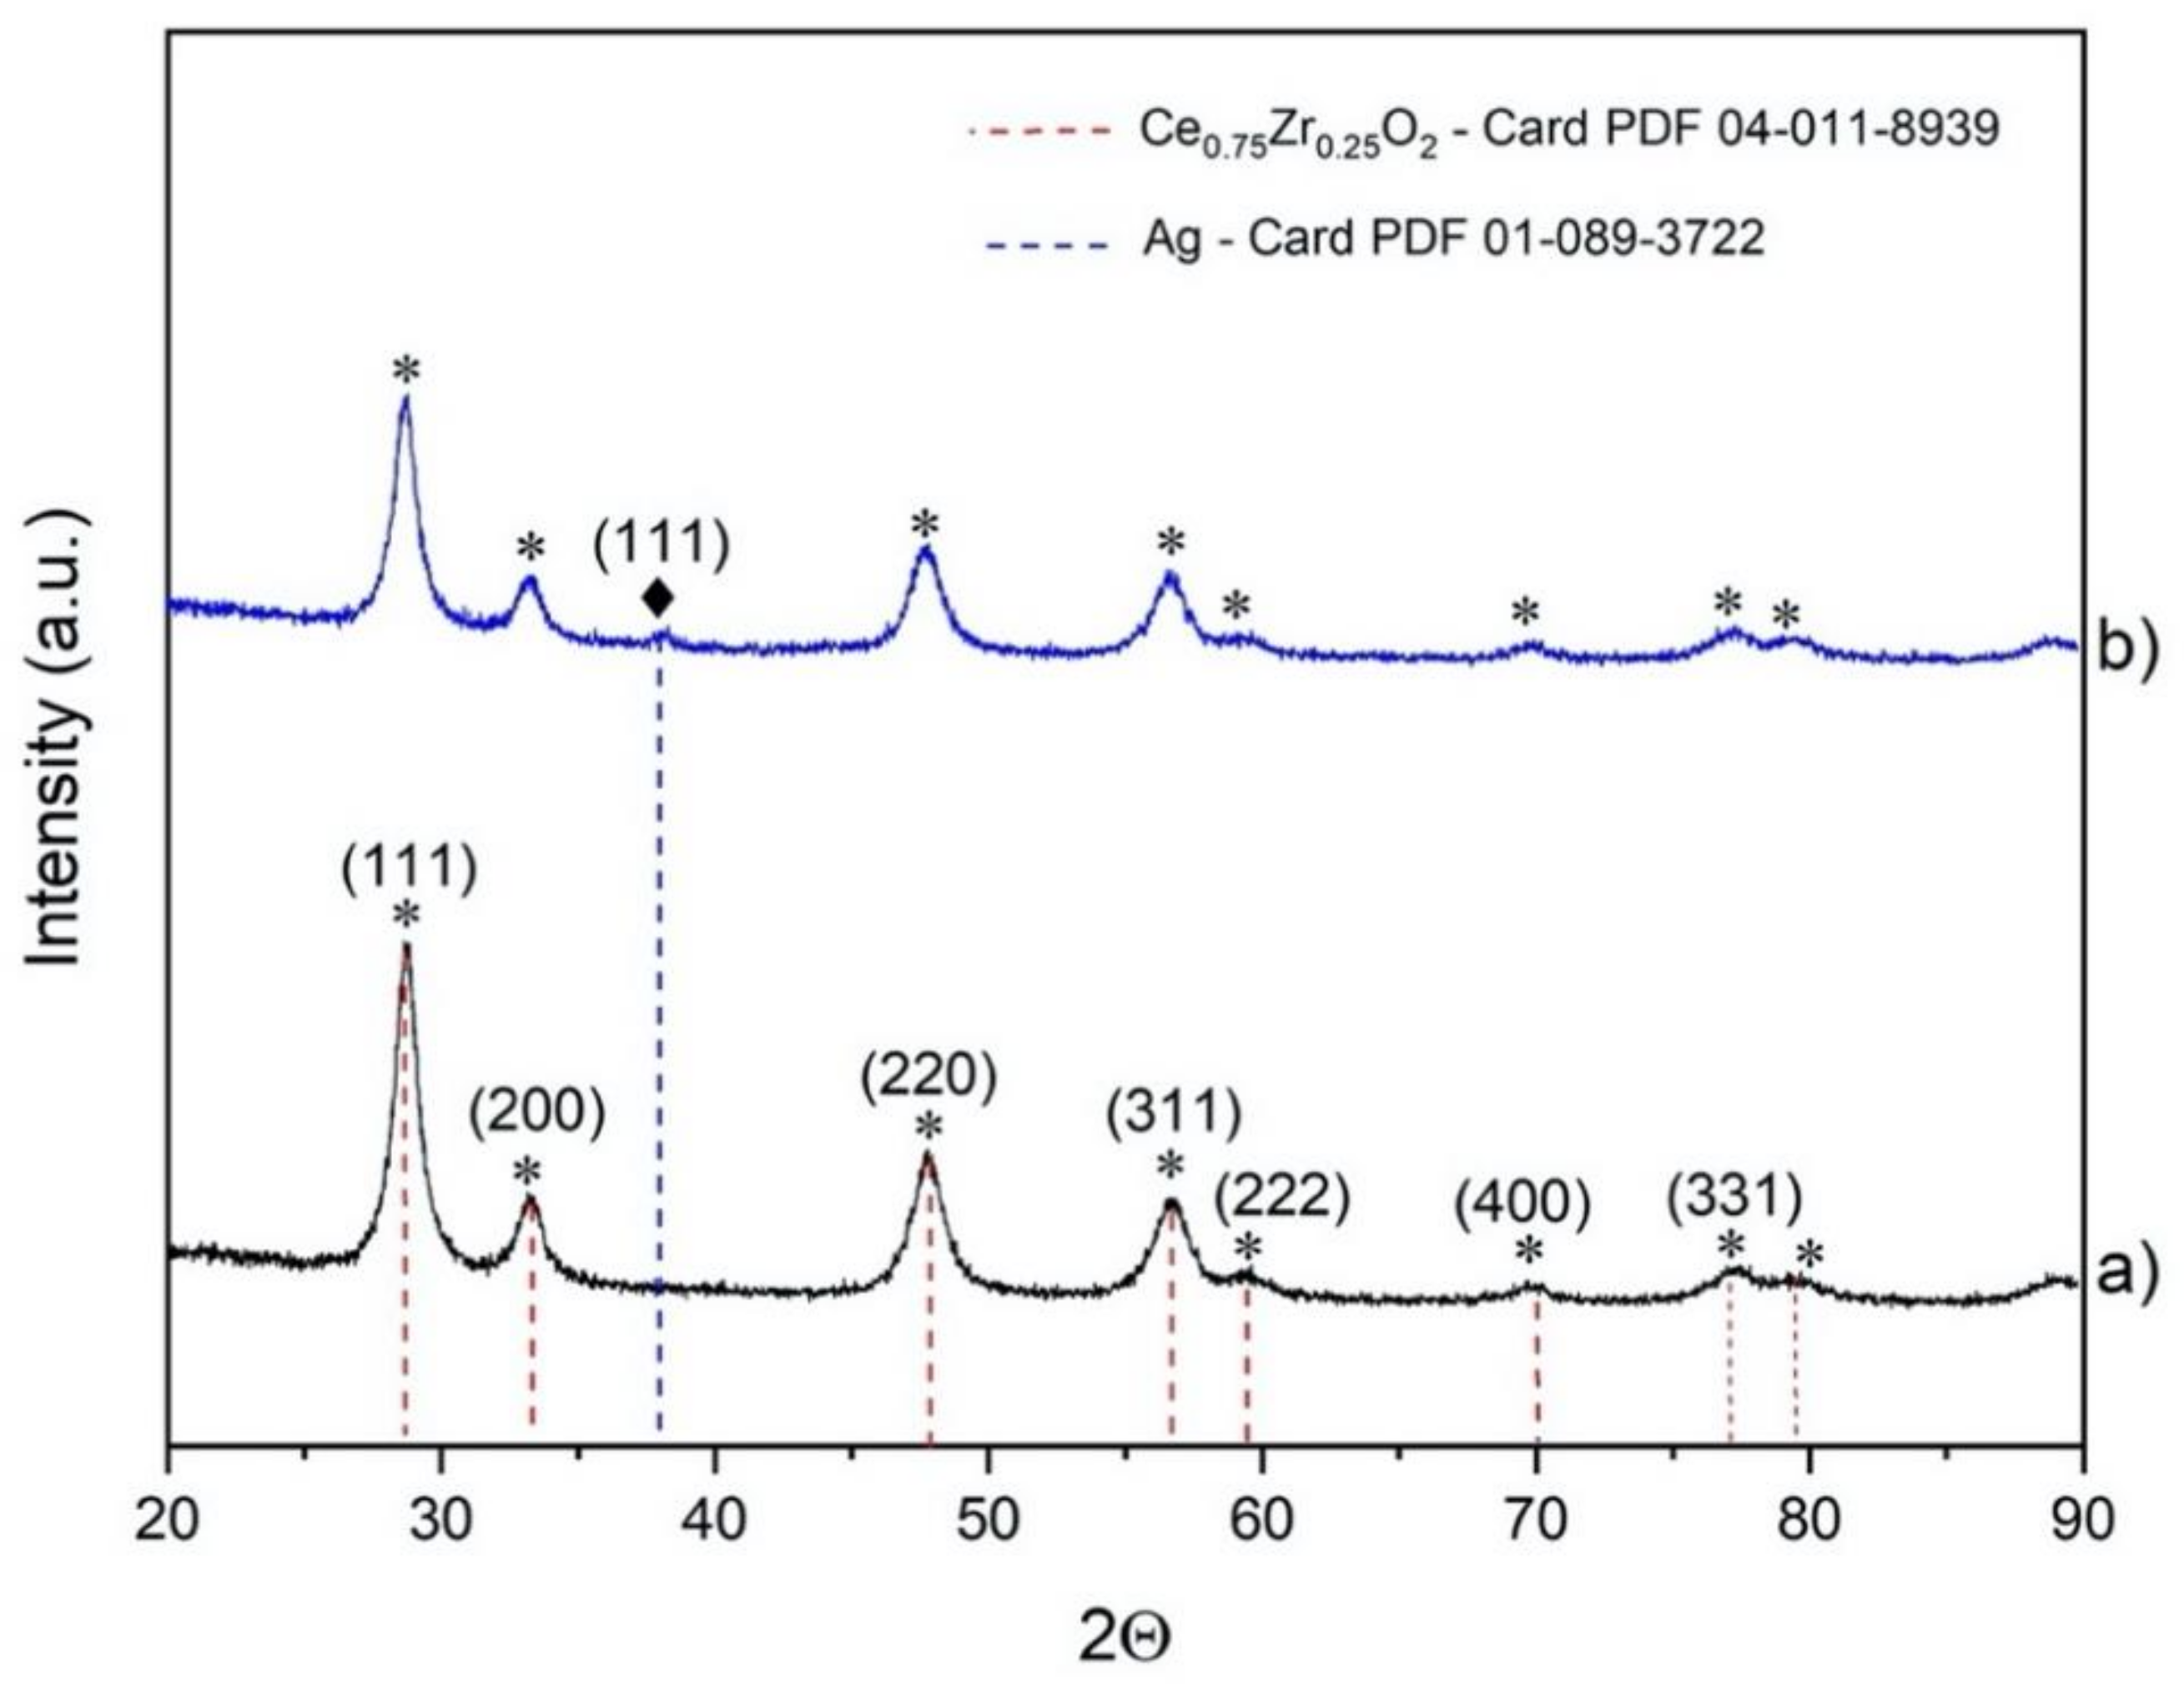
The diffractograms of the Ce0.75Zr0.25O2 support and the 5% Ag/Ce0.75Zr0.25O2 catalyst are shown in Figure 1. The characteristic peaks of the cubic Ce0.75Zr0.25O2 phase were detected in both cases. The highest peak was observed at 2Θ = 28.66°, which corresponded to the (111) plane. We also identified the main characteristic peaks of the (200) at 2Θ = 33.19°, (220) at 2Θ = 47.74°, (311) at 2Θ = 56.68°, (222) at 2Θ = 59.44°, (400) at 2Θ = 70.06°, and (331) planes at 2Θ = 76.99°, which suggested the presence of a pure cubic phase (JCPDS file: 04-011-8939) [24]. The size of the support crystallites was estimated from the peak at 2Θ = 28.6°, obtaining a value of 5.8 nm. The characteristic peaks of the precursors were not found, which suggested a rather high purity of the obtained support. After silver deposition, the same peaks were still observed, indicating that the support structure was preserved upon deposition. A small peak located at 2Θ = 38°, corresponding to the (111) plane of the metallic silver phase, was then detected (JCPDS file: 01-089-3722). No peaks due to impurities or silver precursors were observed.
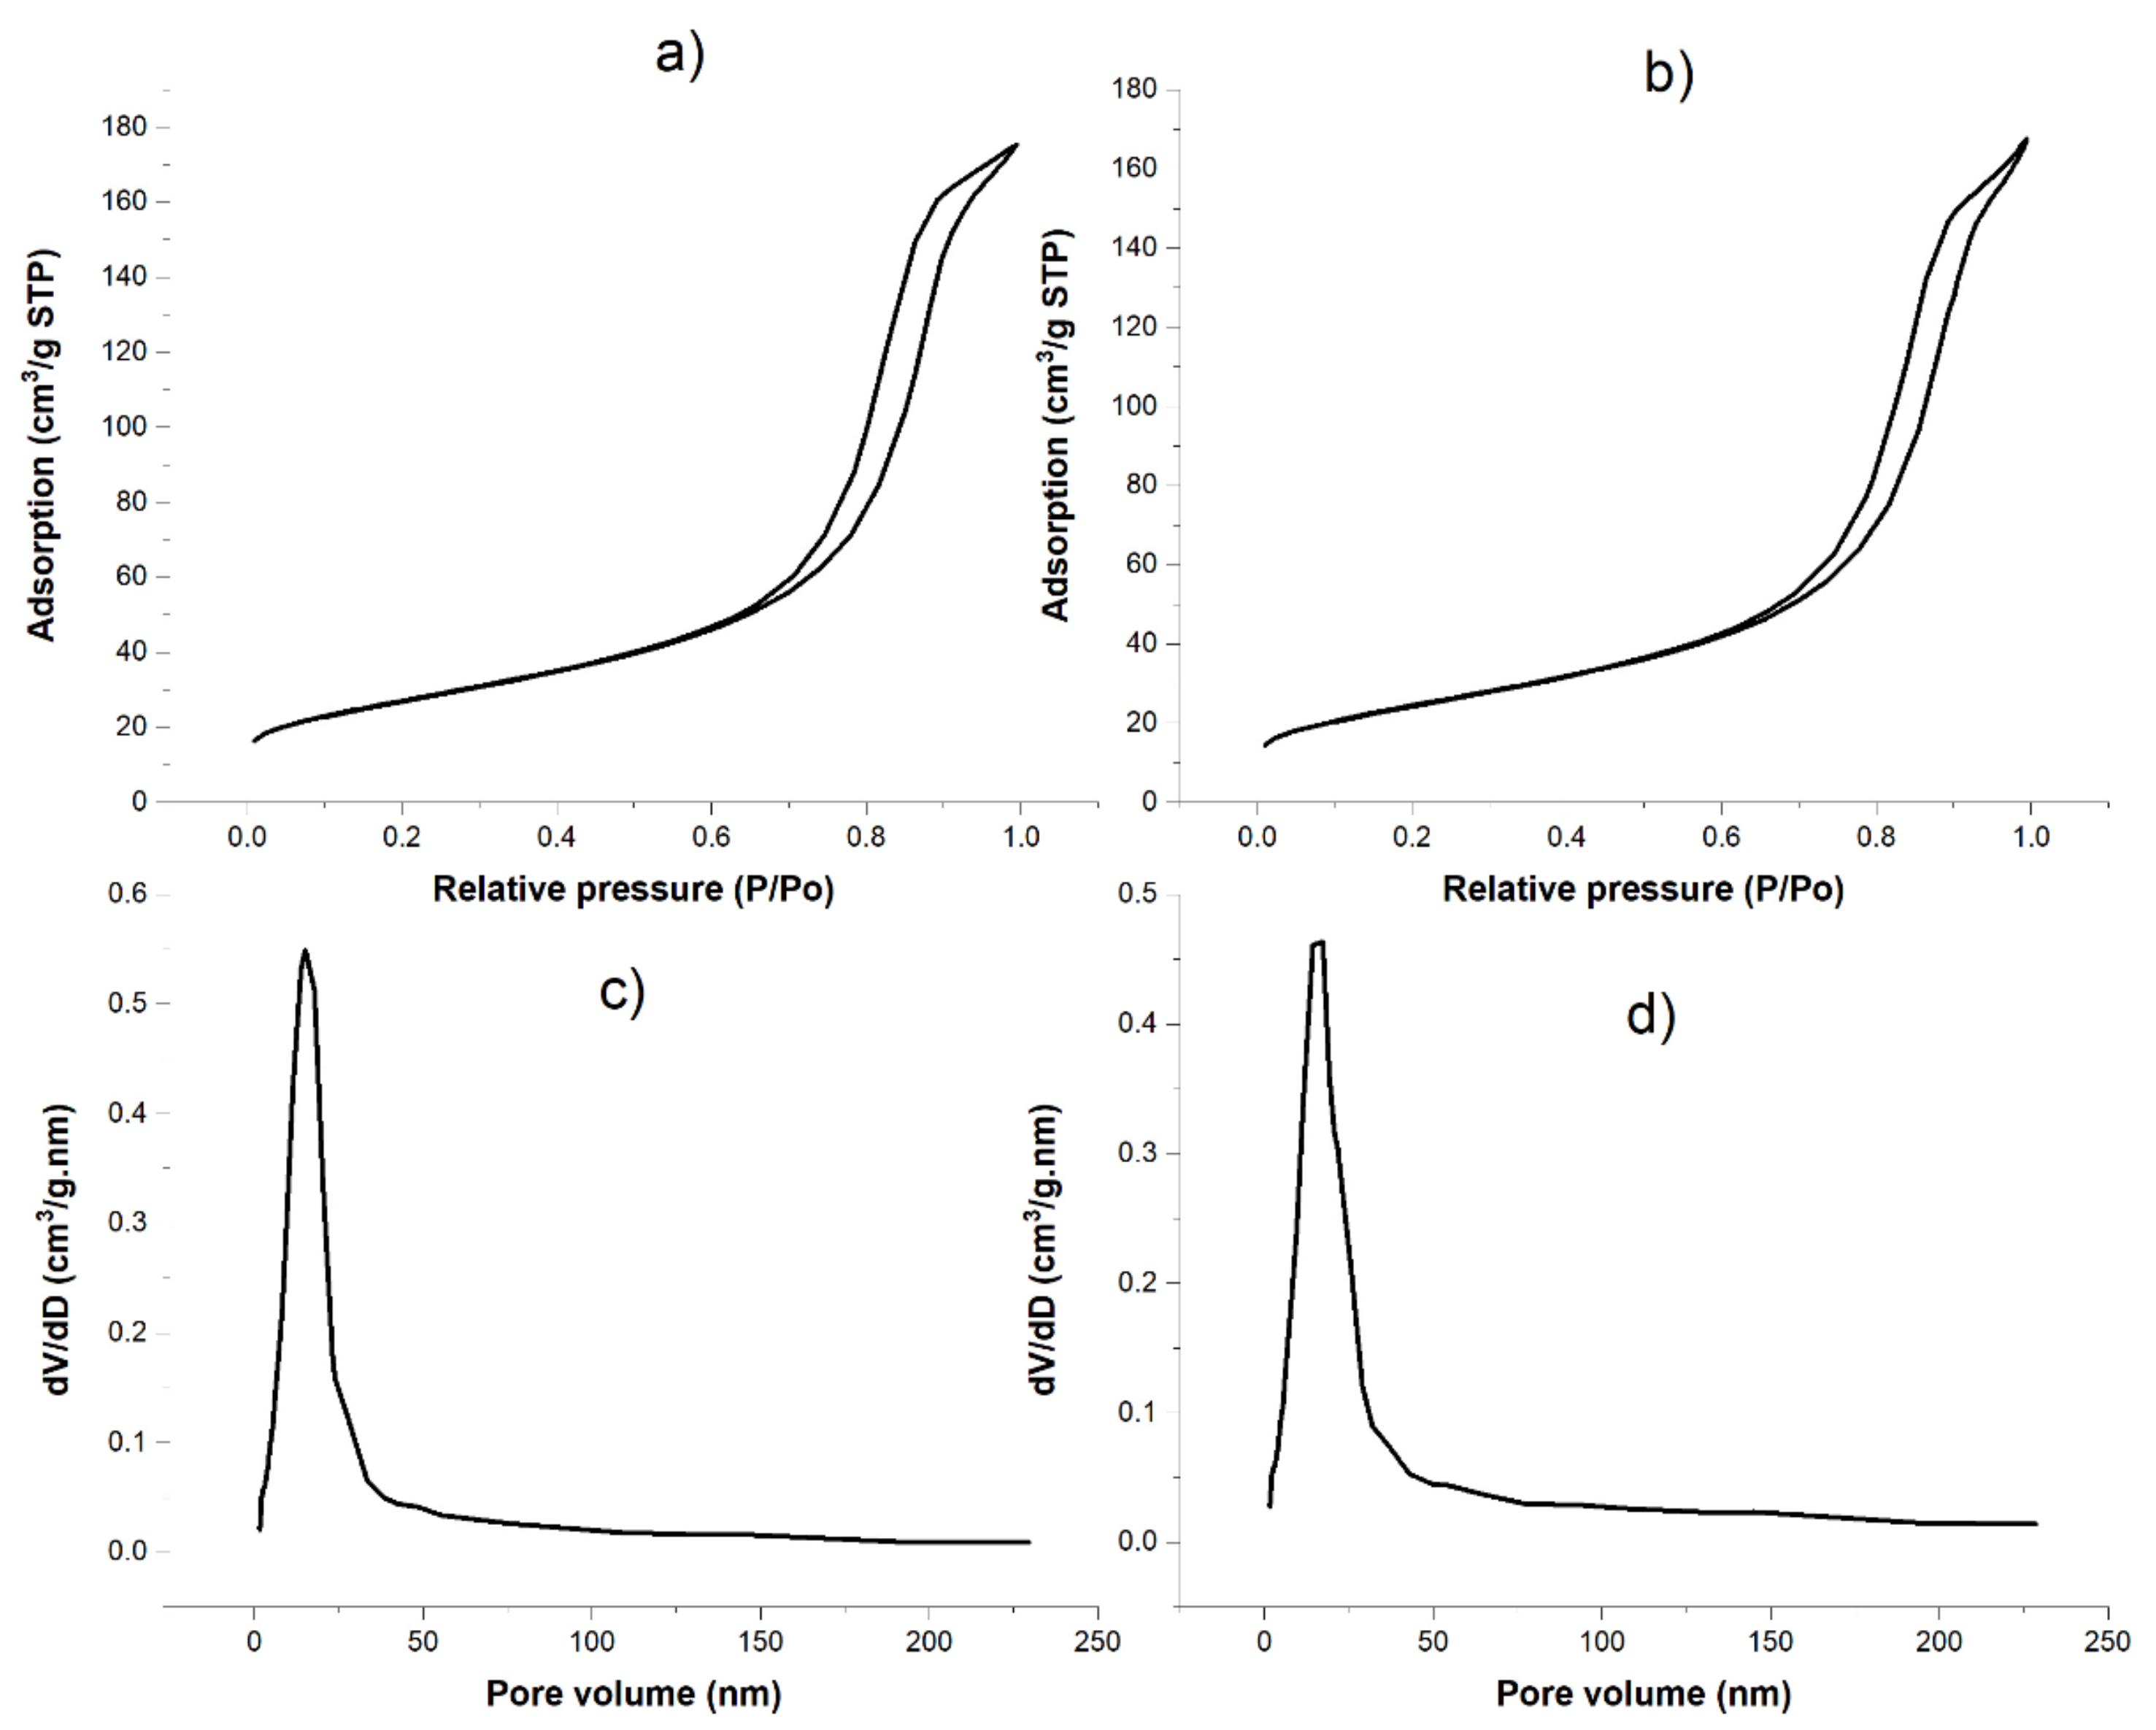
Figure 2 shows the nitrogen adsorption/desorption profiles and the pore volume distribution of the support before and after silver deposition. The obtained adsorption isotherms (Figure 2a,b) were type IV corresponding to mesoporous solids. It can also be seen that after silver deposition, the textural properties of the support were preserved.
Table 1 shows the specific surface area values, the pore diameter, and the pore volume determined by the BJH method for the support before and after silver loading. Upon silver loading, the specific surface area decreased slightly from 97 m2/g to 86 m2/g. On the other hand, pore size and pore volume did not show significant change, meaning that silver was well dispersed on the surface of the support and did not cause blockage of the pores.
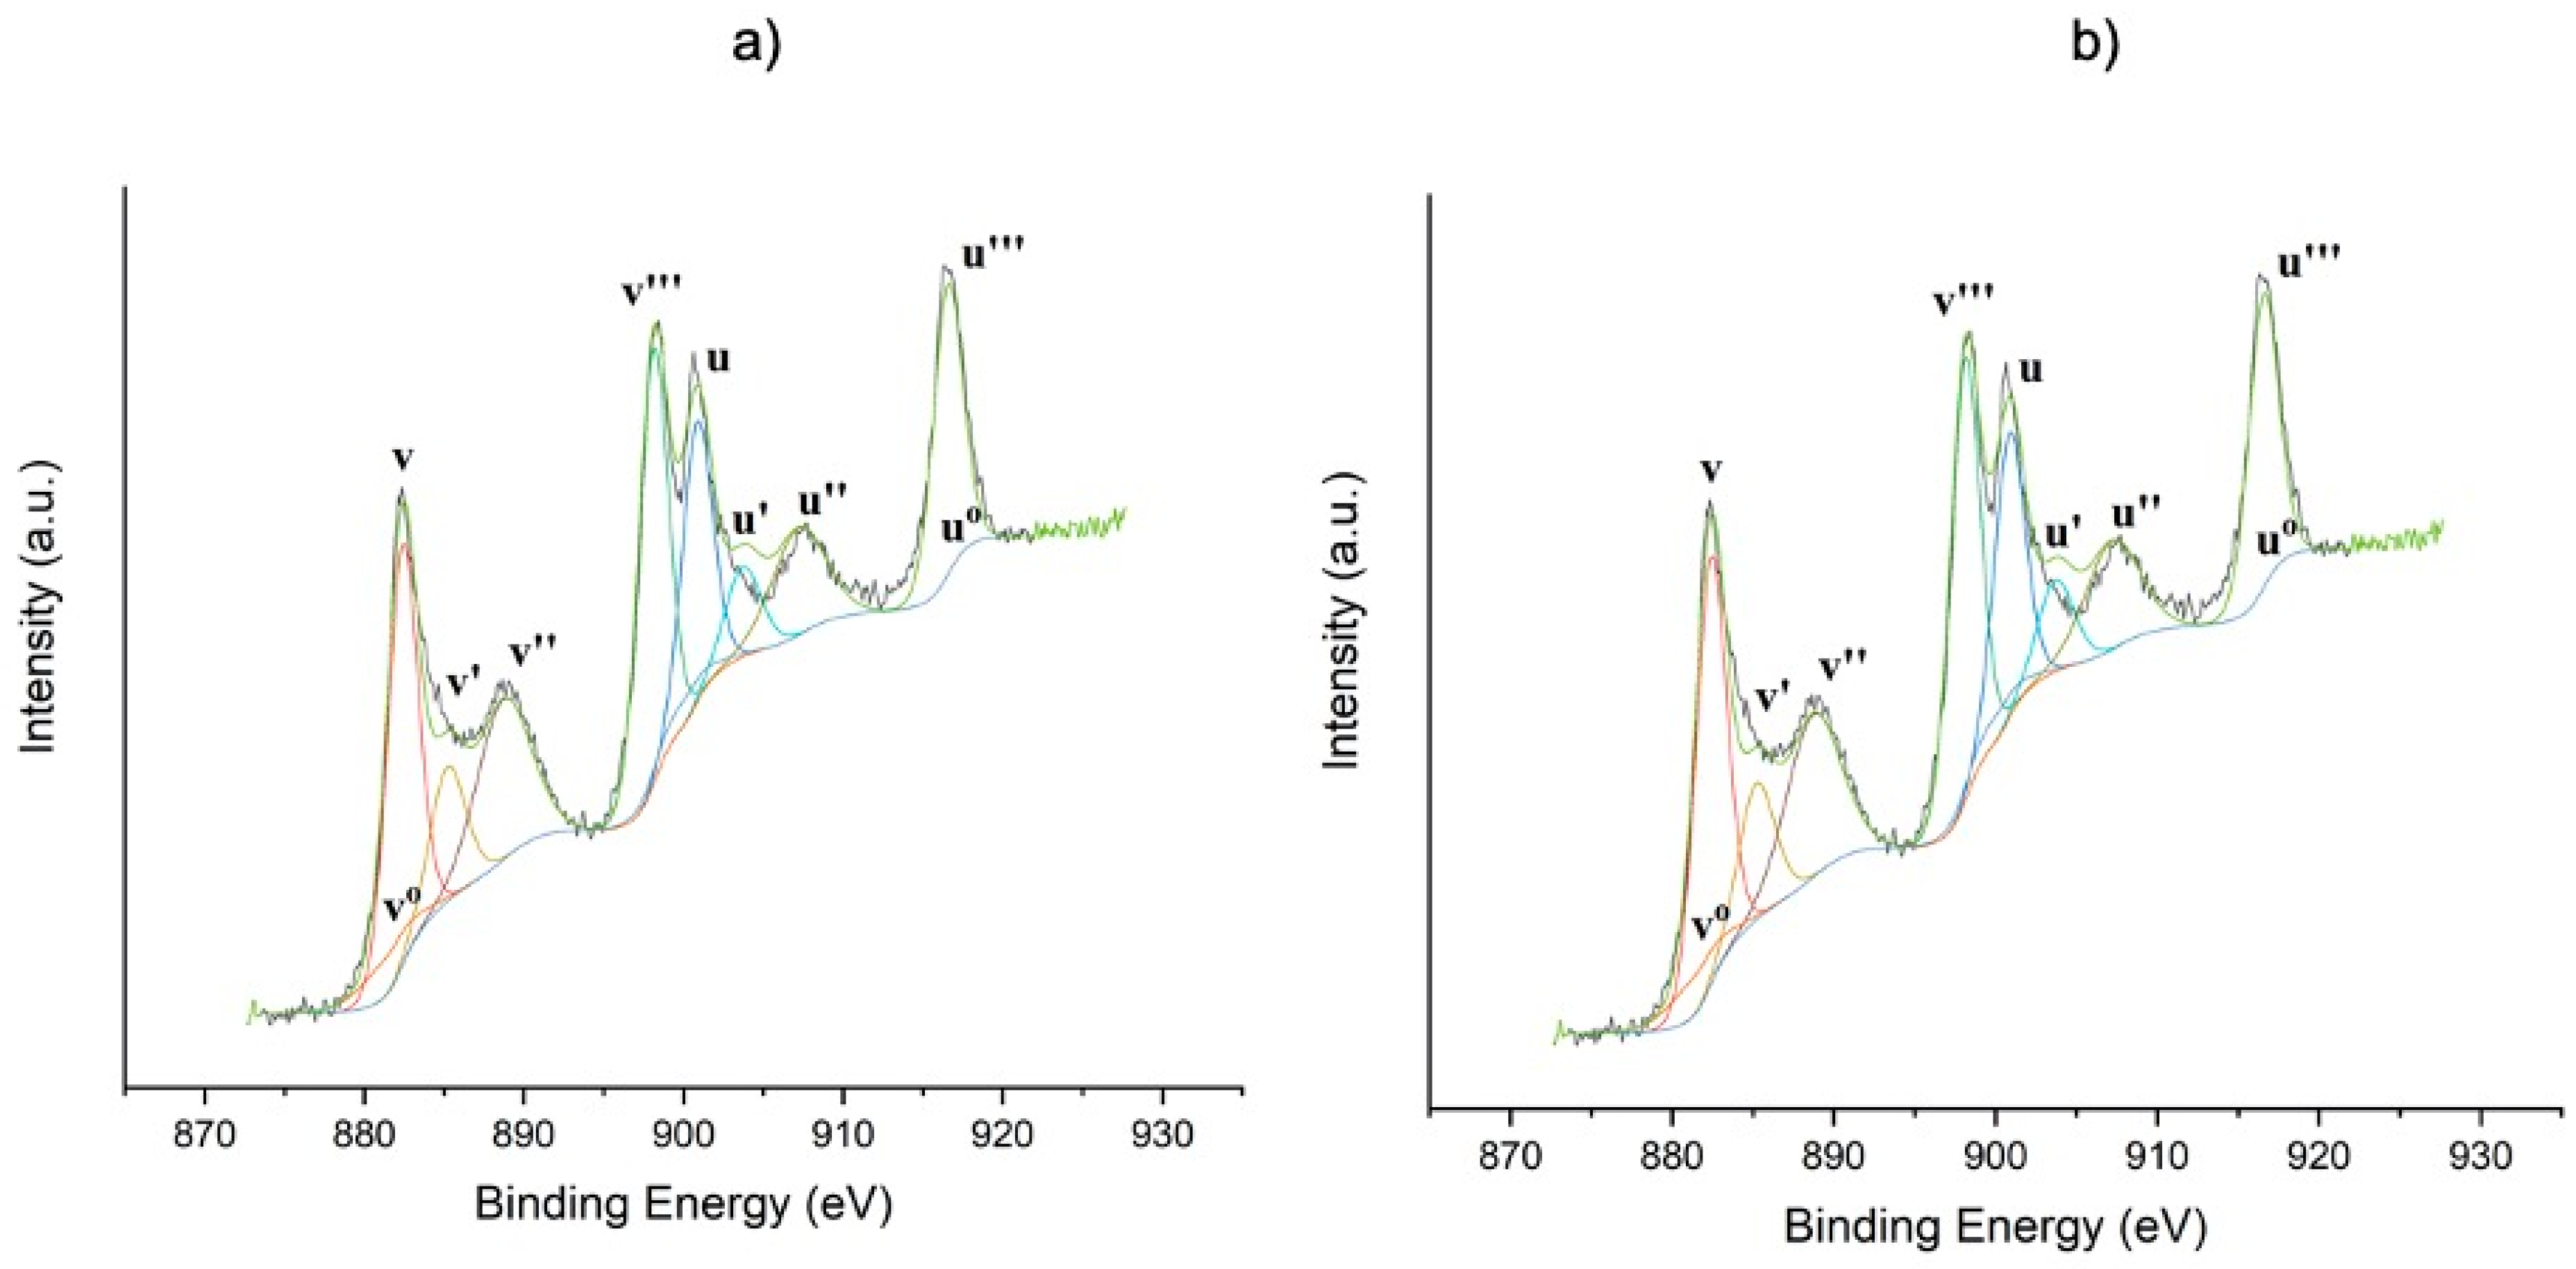
The XPS spectra for cerium (Ce 3d) are shown in Figure 3. The obtained peaks were decomposed in eight peaks corresponding to the spin–orbit doublets: 3d 5/2 and 3d 3/2 (Figure 3). The peaks v′, u′, v0, and u0 correspond to Ce3+ species, while the peaks v, u, v‴, u‴, v″, and u″ correspond to Ce4+ species. Likewise, the proportion of Ce3+ and Ce4+ with respect to total cerium was calculated (Table 2), finding that for the Ce0.75Zr0.25O2 support there was 83.2% of Ce4+, and for 5%Ag/Ce0.75Zr0.25O there was 82%. This may suggest oxygen vacancies or O atoms relaxations resulting from silver deposition [25,26].
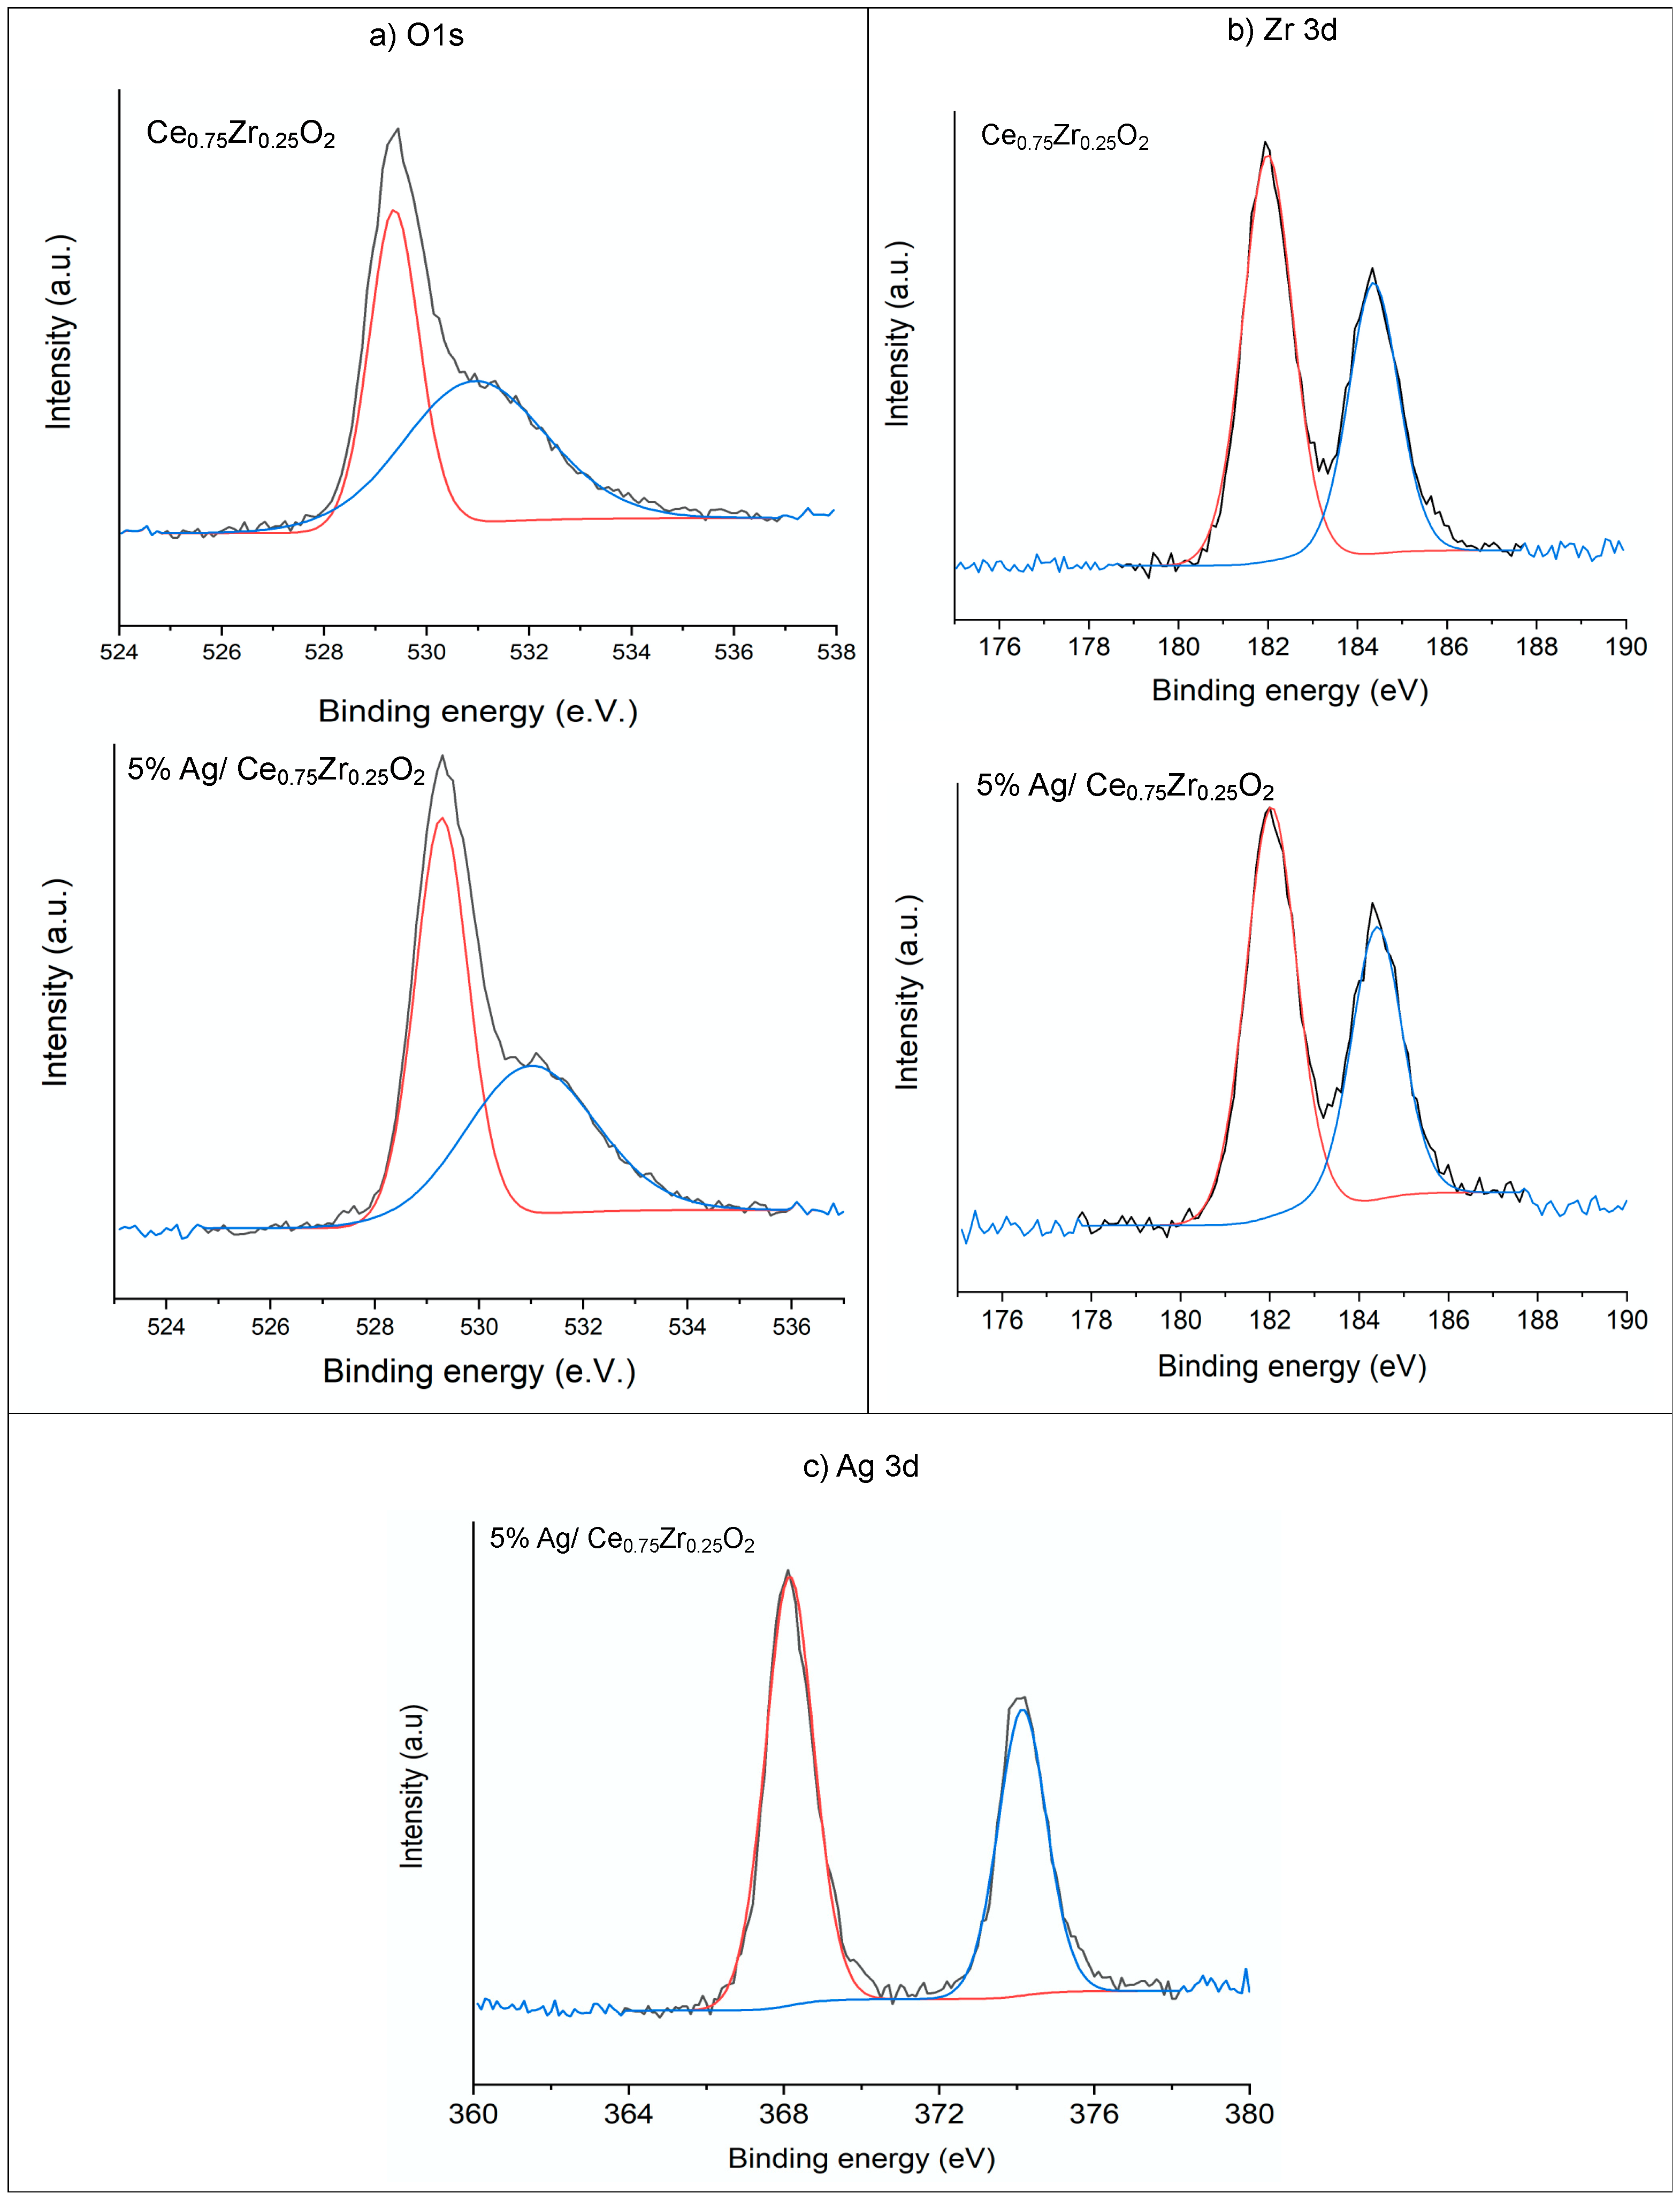
Figure 4 shows the XPS spectra of Ce0.75Zr0.25O2 support and 5%Ag/Ce0.75Zr0.25O2 catalyst for O1s, Zr 3d, and Ag 3d peaks. The obtained peak positions were similar to those reported in the literature. For silver (Ag 3d), the peaks were located at binding energies (BEs) equal to 368.1 eV (Ag 3d 5/2) and 374.1 eV (Ag 3d 3/2), which corresponded to metallic silver [13]. For zirconium (Zr 3d), the peaks were at Bes = 182 and 184.4 eV, corresponding to ZrO2. No significant changes were observed on the zirconium peaks before and after silver deposition.
For the O1s region, no significant changes were found in the shape of the peaks upon silver deposition. Two peaks were evidenced at BE = 529 and 531 eV, which were characteristic of lattice and lattice-defective oxygen vacancies, respectively [27]. Regarding the atomic concentration of oxygen (Table 2), a slight decrease after silver deposition was observed, which supported the hypothesis of formation of oxygen vacancies.
Table 2 shows the atomic concentration (%) determined by XPS surface analysis, before and after silver deposition. The XPS analysis evidenced that the surface silver loading (wt.%) was a little bit lower (4.64 wt.%) than the theoretical one of 5 wt.%.

2.2. Experimental Tests and Optimization

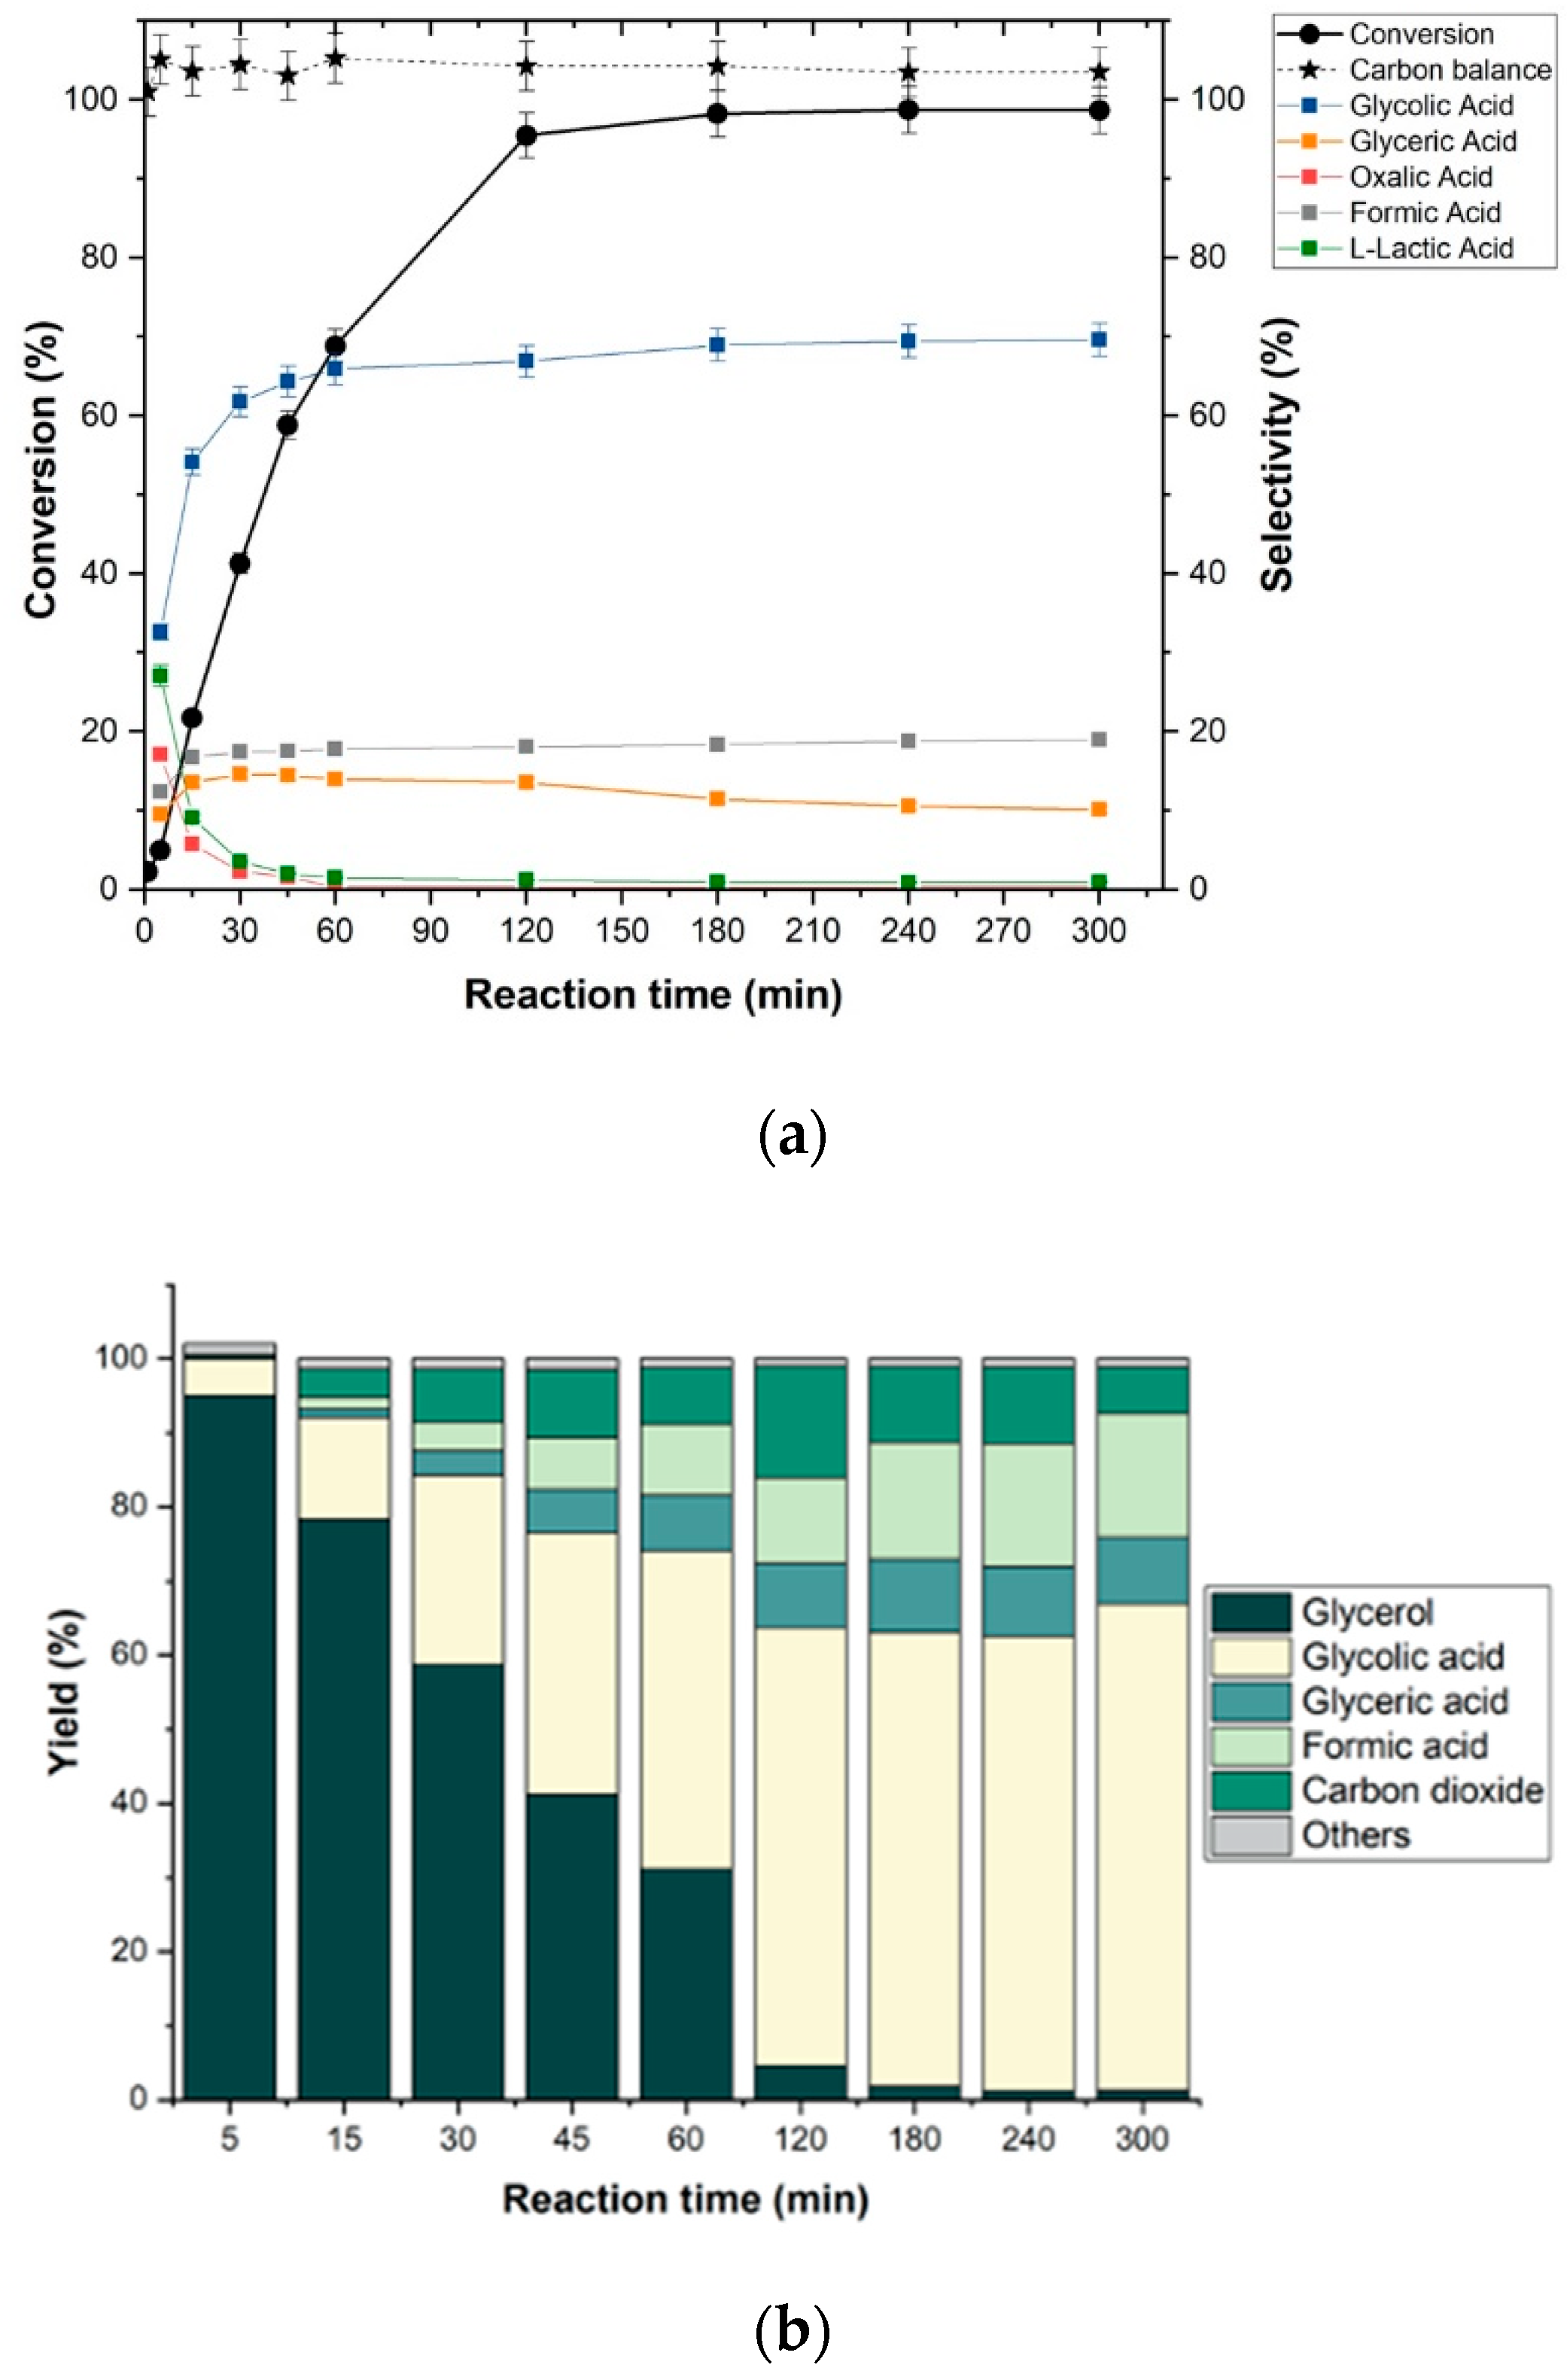
A preliminary benchmark test was carried out with the initial conditions that corresponded to those evaluated in previous investigations carried out in our laboratory [5]. These conditions corresponded to a 0.3 M glycerol solution, a reaction temperature of 60 °C, 5 bar of oxygen, 0.5 g of catalyst, and a NaOH/glycerol molar ratio of 4. These tests were performed in triplicate to prove reproducibility of the system. The results obtained at these initial operating conditions are shown in Figure 5. The carbon balance was around 100%. After two hours of reaction, we observed almost full conversion (>98%) with a high selectivity to GLYA (69%). The GLYA yield (i.e., 68%) obtained with the 5%Ag/Ce0.75Zr0.25O2 catalyst was the highest one reported in the literature so far, to the best of our knowledge. [3,13].
The other products formed in lower selectivity were GA (10%), which is also a high-added-value product [16,28], and formic acid (FA, 20%), which resulted from C–C bond cleavage during the GLYA production. A yield of 63.7% of GLYA was thus obtained under these conditions (bottom of Figure 5).
Experimental tests to optimize the glycolic acid were carried out in two stages. In the first stage, we determined the most sensitive experimental parameters. For this, a second-degree central composite design (CCD) was developed, which was elaborated using XLSTAT [29].
In the first CCD, named CCD 1, the studied parameters (variables) were glycerol concentration, NaOH/glycerol molar ratio, reaction temperature, and glycerol/catalyst ratio. The response variable was the yield of GLYA. In this experimental design, twenty-five observations were proposed. The levels of each variable are shown in Table 3. Such levels were defined according to previous results obtained by our laboratory and according to bibliographical data.
The experimental test results were analyzed by an ANOVA analysis, in which the most influential variables and their interactions were found.
In order to obtain the maximum yield of GLYA by increasing the glycerol concentration and minimizing the amount of NaOH, the experimental tests of the CCD 1 design were carried out for 300 min. It was found for all the tests that once the maximum conversion was reached, the production of glycolic acid remained stable until the end of the 300 min test, like it was observed in the preliminary benchmark test (Figure 5). Table 4 presents the operating conditions of each test, as well as the obtained yield of glycolic acid.
Upon calculation of the test statistics, the p-value was obtained, which is defined as the probability of observing the given value of the test statistic, being a measure of evidence against the null hypothesis [30,31]. The value to reject the null hypothesis was 0.05, which means that no significant difference existed. Table 5 shows the results of the statistical analysis of variance (ANOVA) for GLYA with four variables and their interactions. In this case, two effects had p-values less than 0.05, indicating that they were significantly different from zero at the 95.0% confidence level.
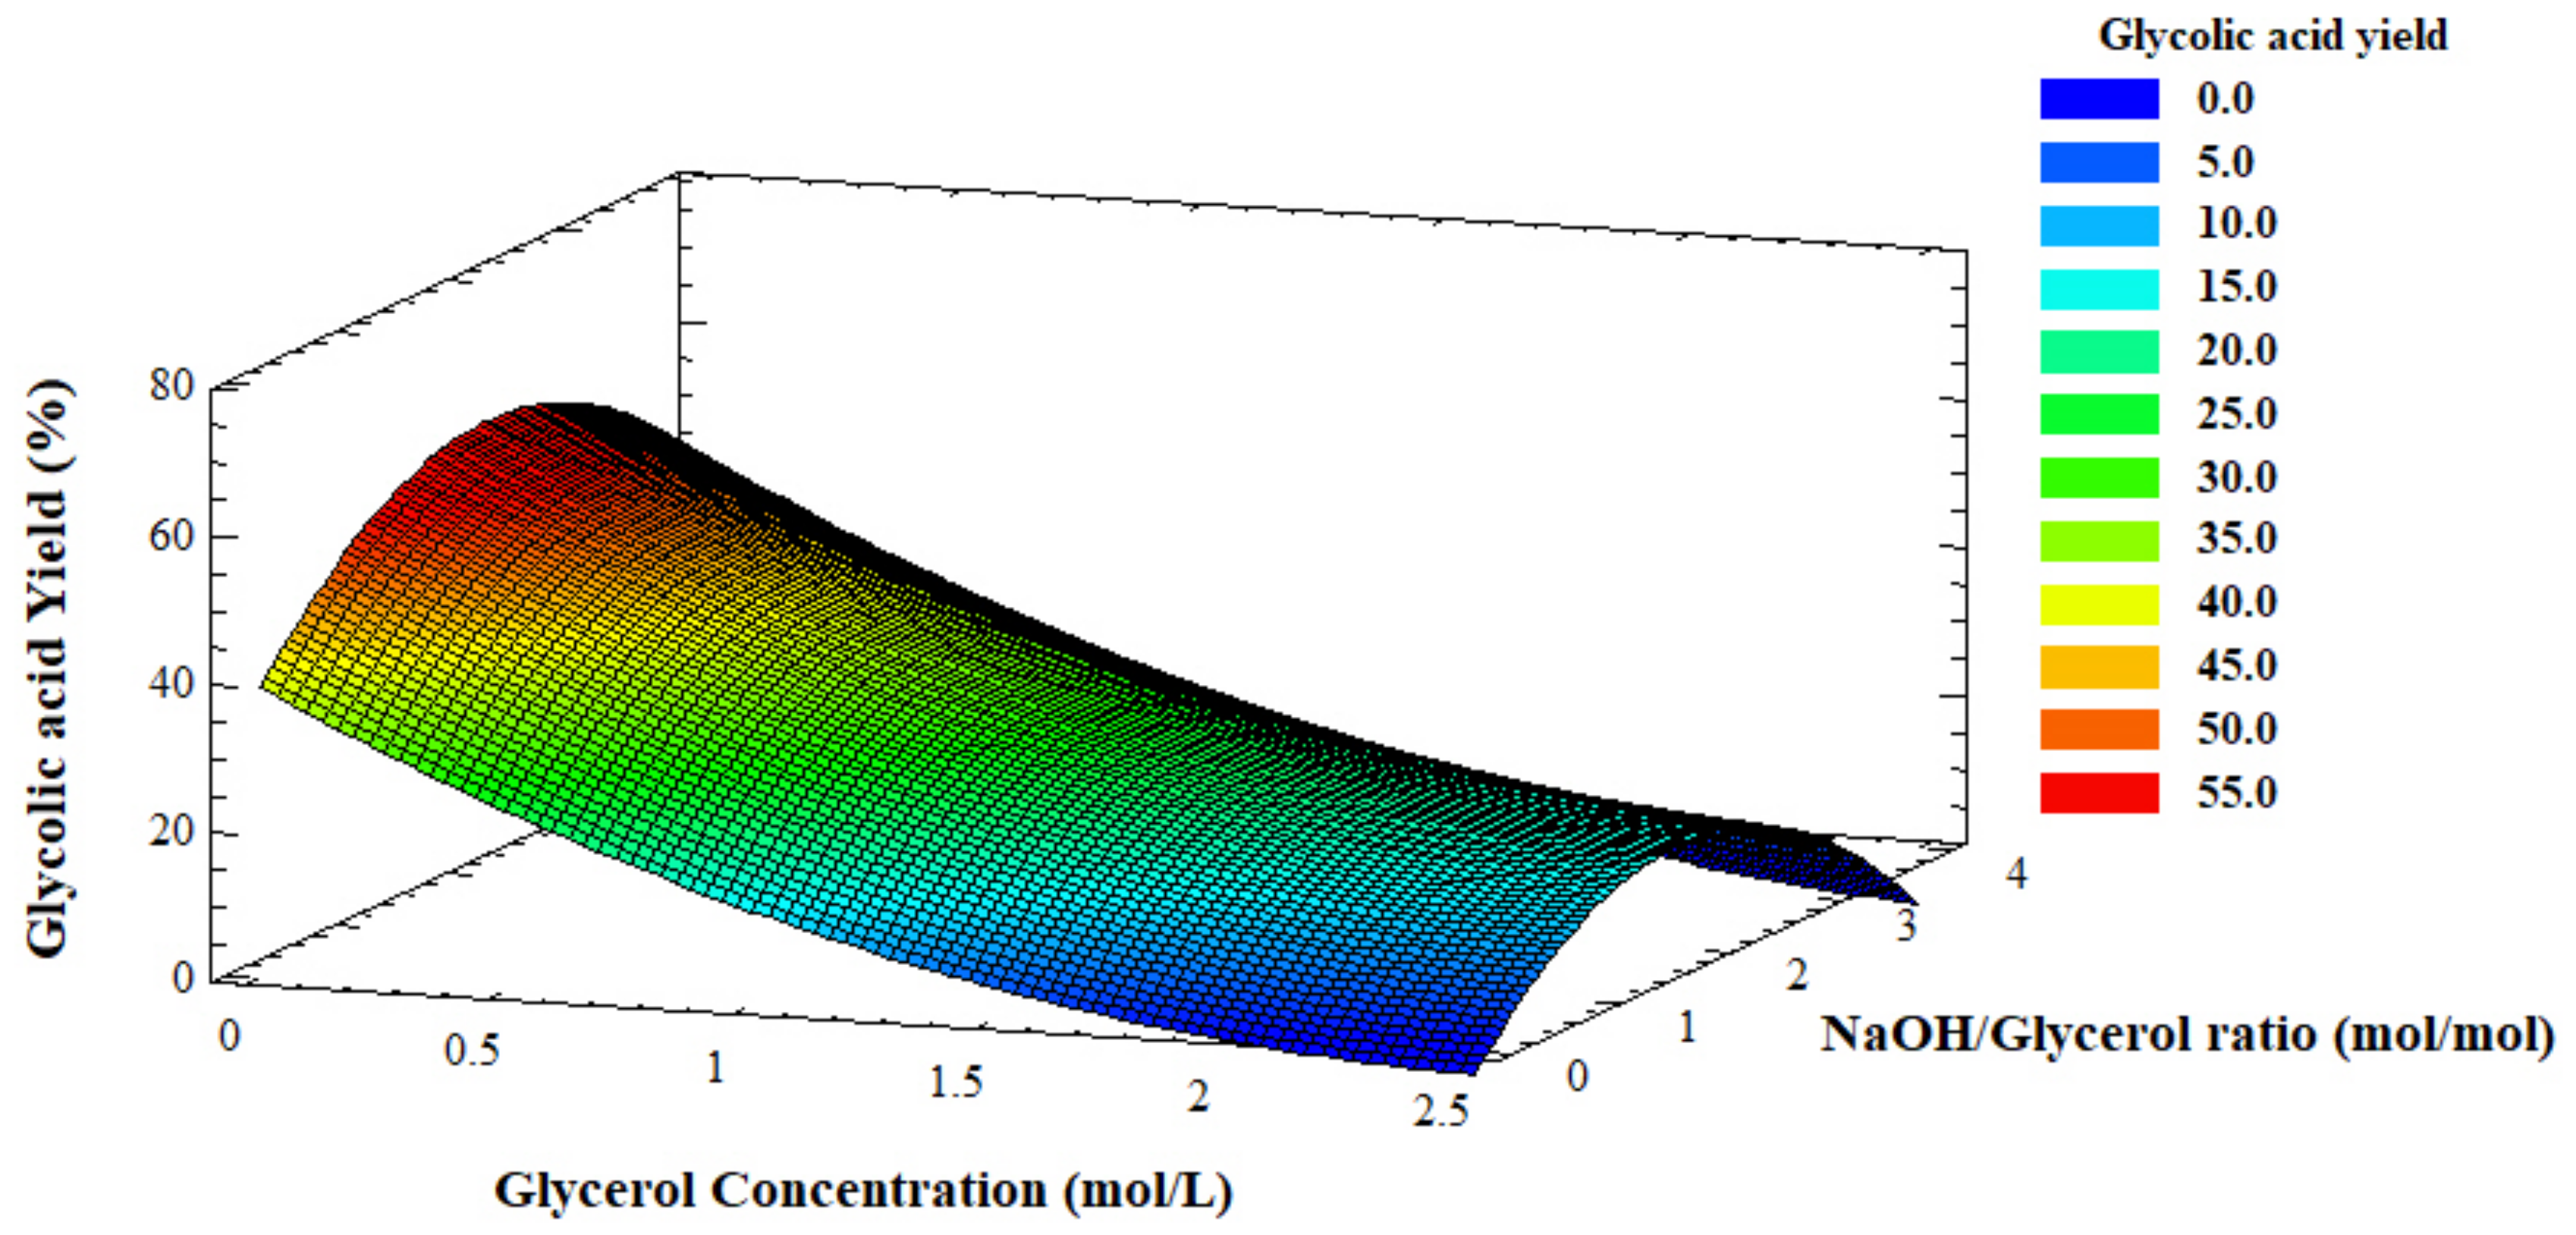
The R-squared statistic indicated that the model as fitted explains ca. 82% of the variability in GLYA yield. Since the p-value was larger than 5.0%, there was no indication of serial autocorrelation in the residuals at the 5.0% significance level. Those variables with a p-value less than 0.05 indicated a significant correlation, being the variables with the largest influence on the yield of GLYA. The most influential variables were glycerol concentration and the interaction (NaOH/Glycerol)2, with p-values of 0.0003 and 0.0421, respectively.
Figure 6 shows the combination of factor levels, which maximize the desirable function (GLYA yield) over the indicated region. It also shows the combination of the factors’ values at which that optimum was achieved. With these results, we could find the optimal influential variables and the corresponding GLYA yield. The optimal as-determined values were 0.51 M for glycerol concentration, 61.4 °C for the temperature, a NaOH/glycerol ratio equal to 2.22, and 0.73 g of catalyst. With these results, compared to the benchmark, we could then decrease the NaOH/glycerol ratio from 4 to 2 and increase the glycerol concentration from 0.3 M to 0.5 M, which corresponded to an overall increase of glycolic acid recovery from 0.27 mol/L g to 0.44 mol/L in the same reaction volume (200 mL).
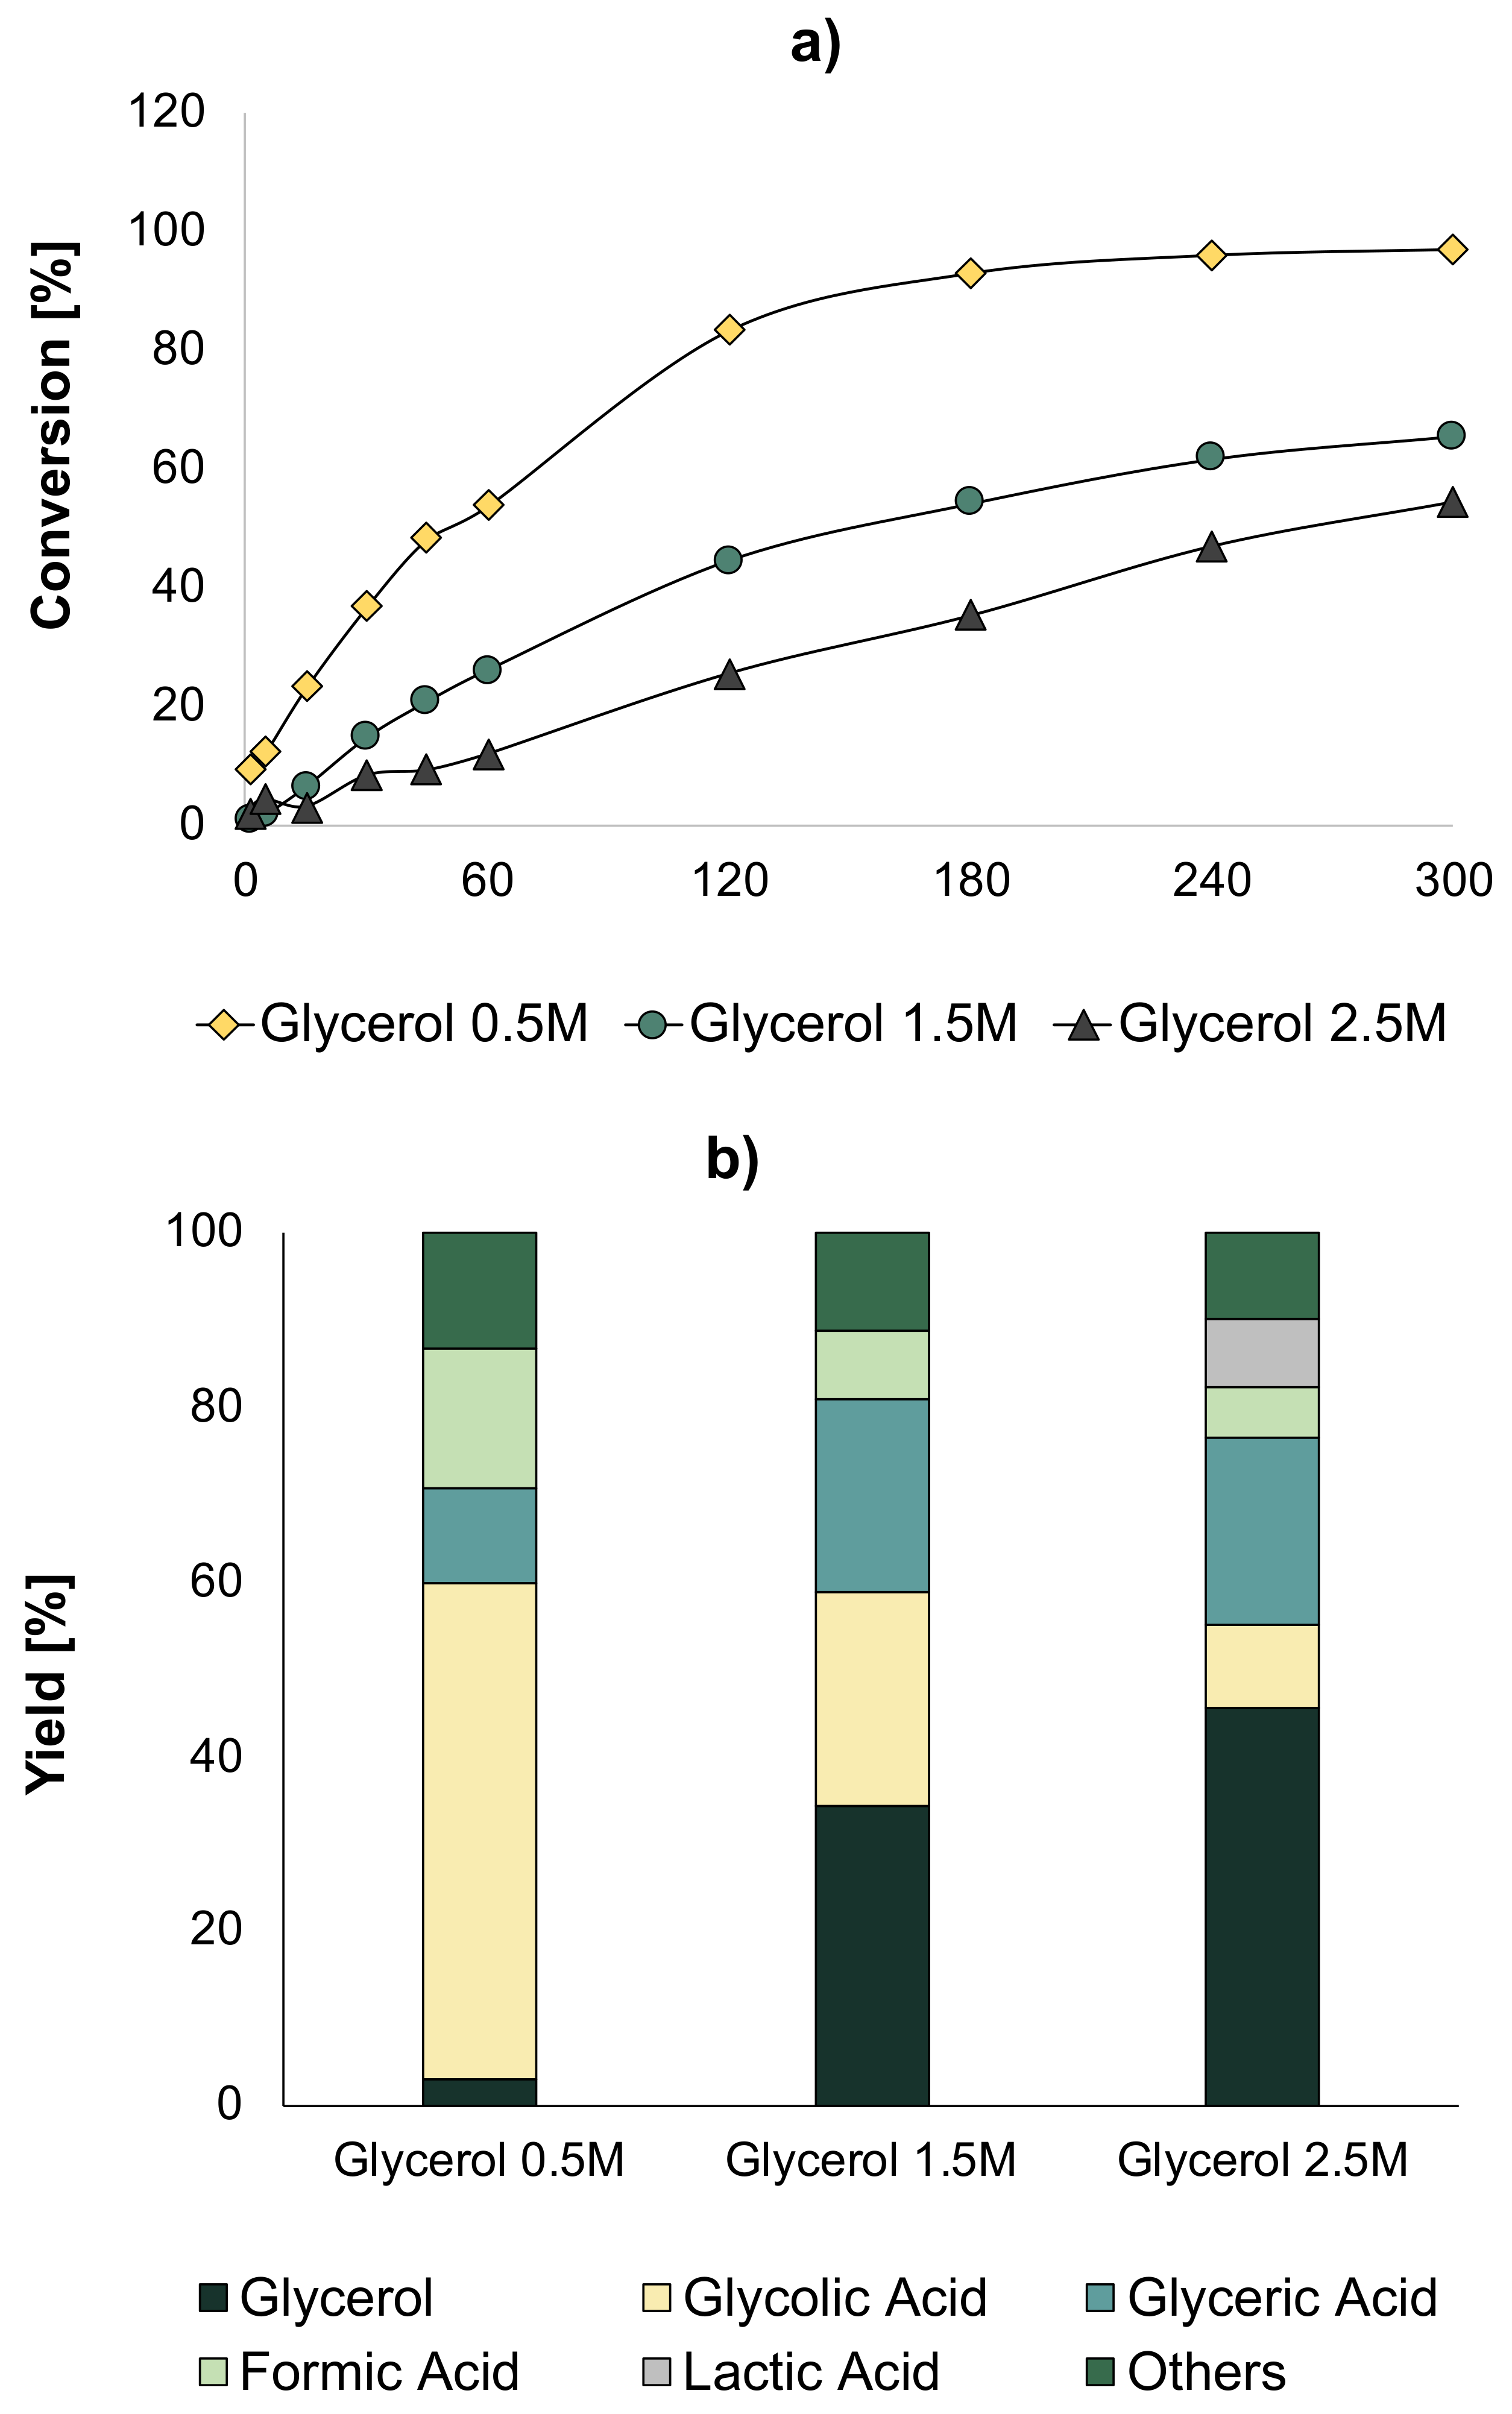
Once the optimal conditions were obtained, we carried out tests increasing the glycerol concentration to 1.5 M and 2.5 M at the optimal conditions obtained in the previous study—temperature (60 °C) and NaOH/Glycerol ratio (2), O2 pressure of 5 bar, and a quantity of catalyst equal to 0.7 g. The obtained results are shown in Figure 7. It was found that when the concentration of glycerol was increased, the conversion decreased considerably, leading to a lower GLYA yield. In addition, it could be found that at higher glycerol concentrations, lactic acid (LA) was detected, which was produced due to an oxygen deficiency in the medium (Figure 8). The optimal conditions obtained in the previous optimization could not be directly transposed to higher glycerol concentrations.
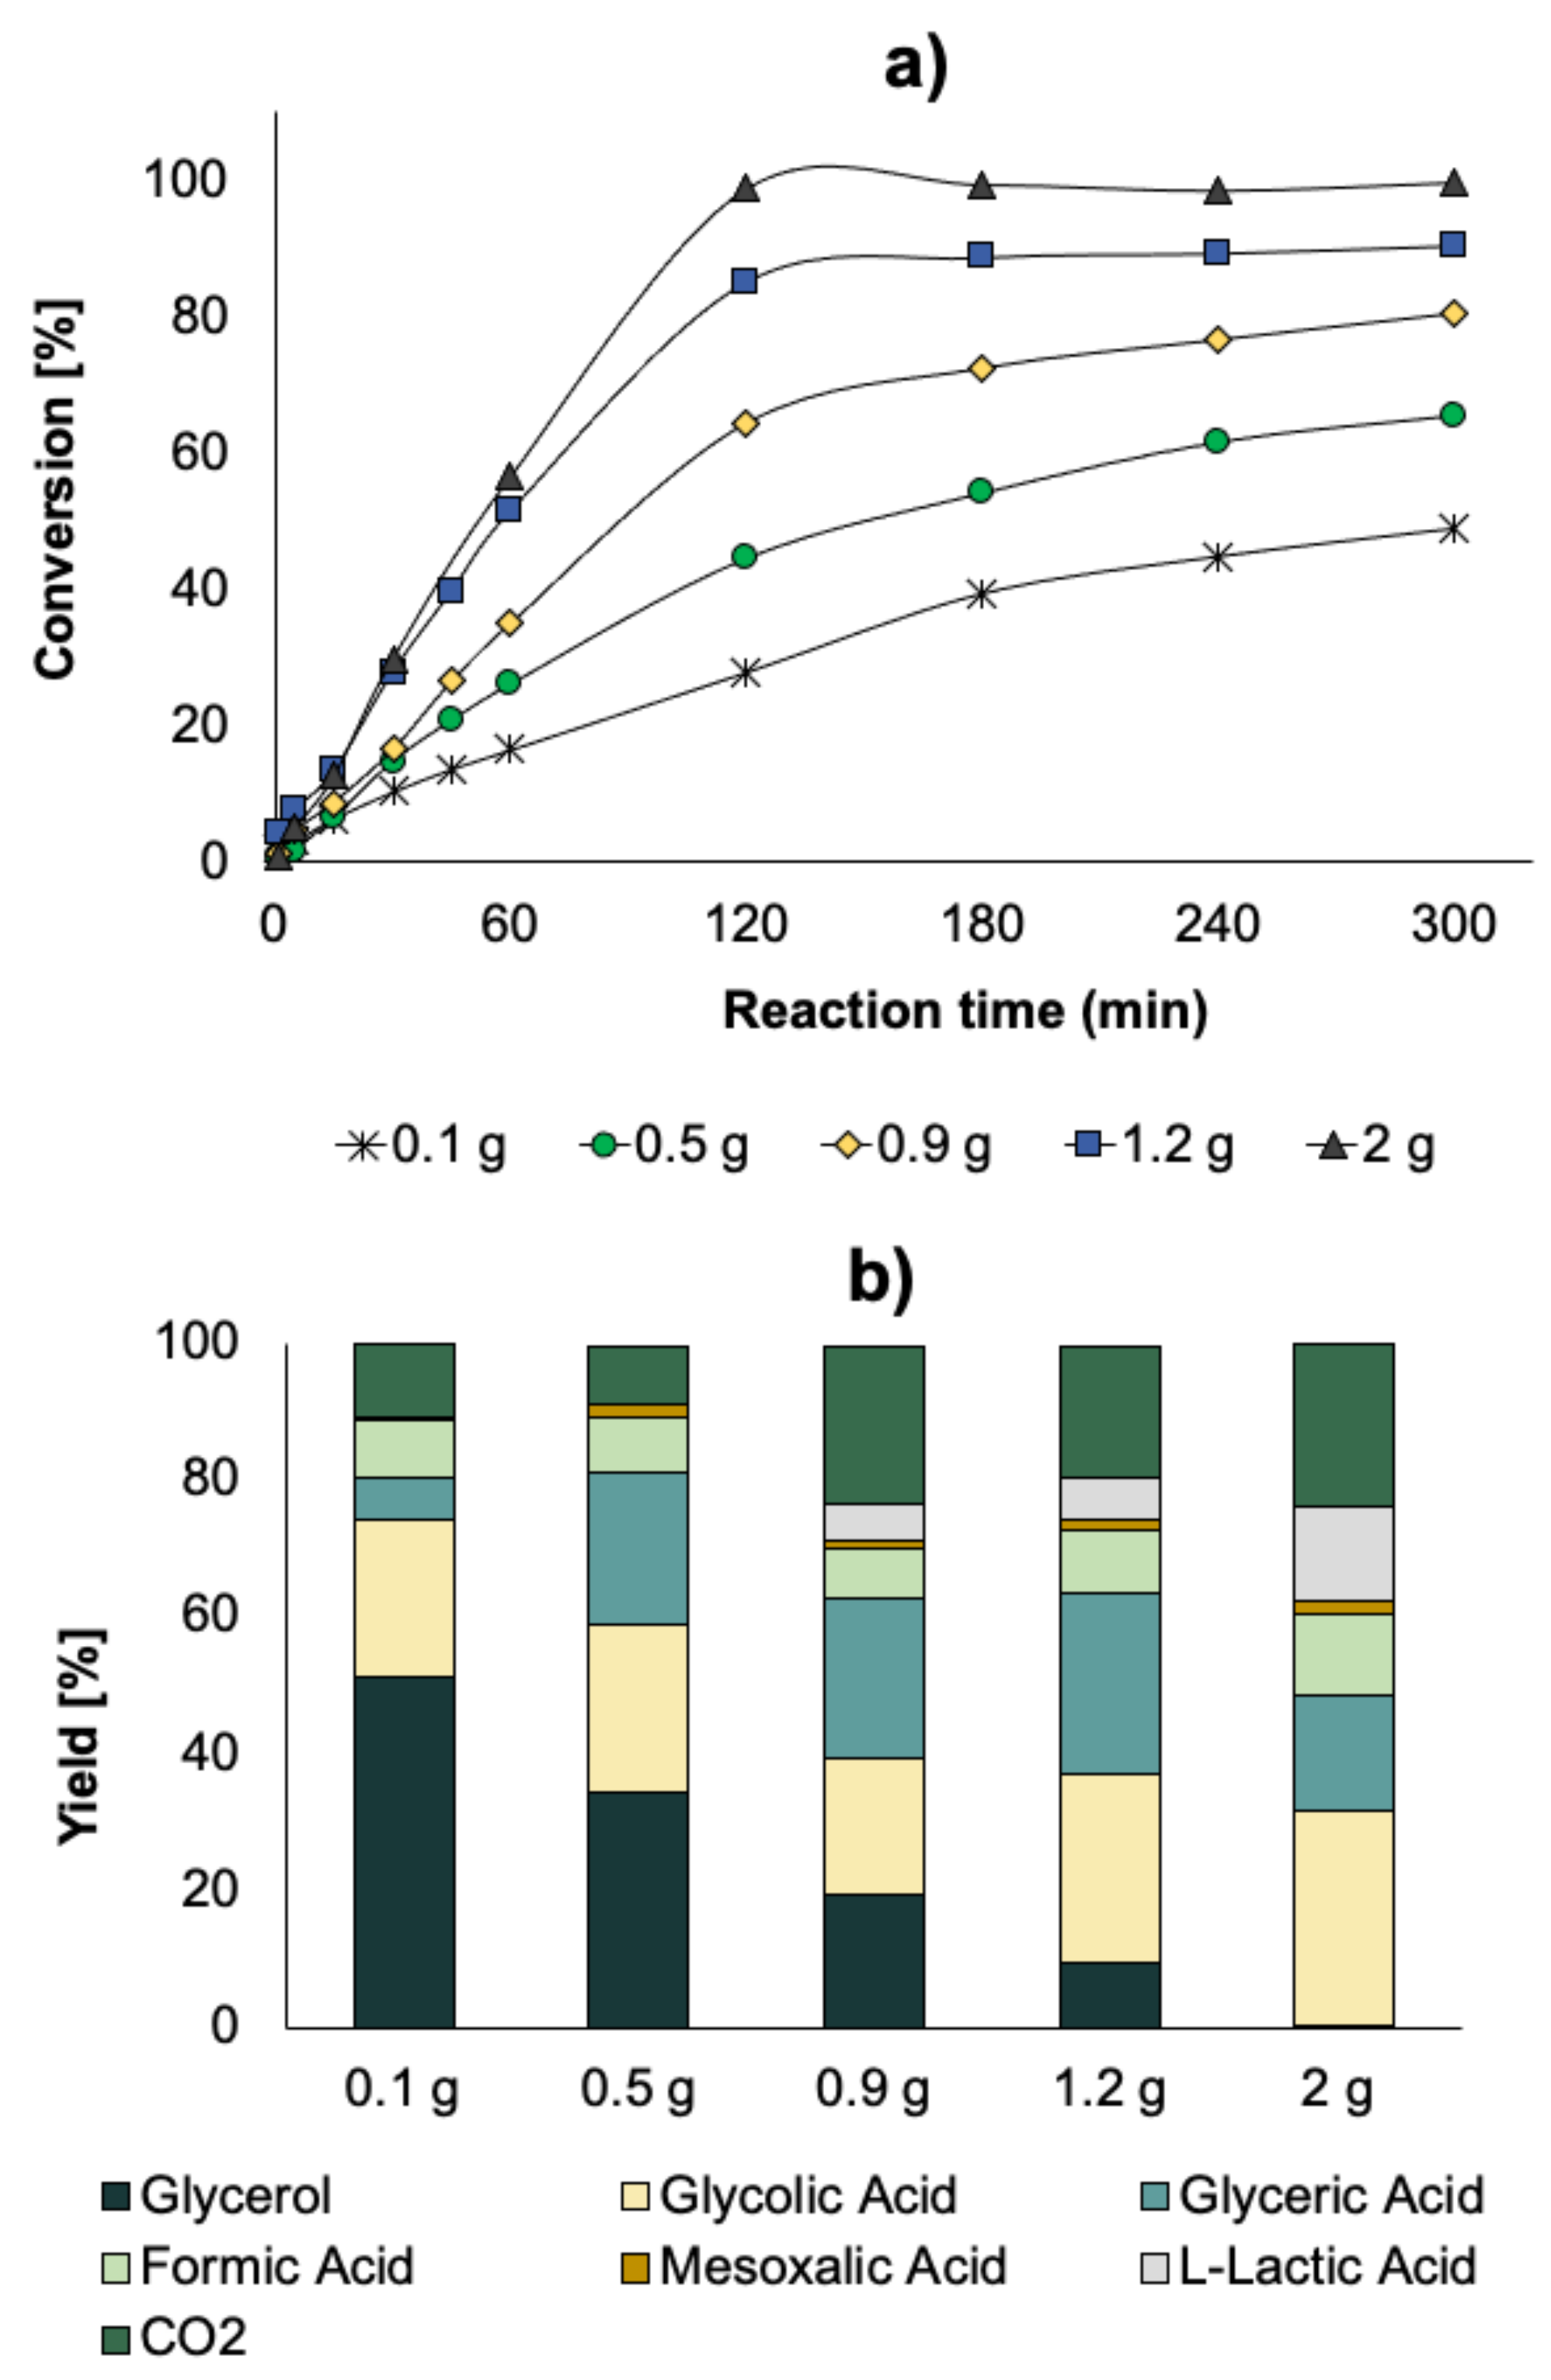
In order to increase the conversion, tests were performed with 1.5 M glycerol, while increasing the amount of catalyst. Catalyst amounts were chosen from 0.1 to 2 g. Increasing the catalyst amount led to a drastic increase in glycerol conversion, with a value of almost 100% when using 2 g of catalyst. This full conversion was linked with a change in terms of selectivity, as depicted in Figure 9b. With the lowest quantity of catalyst, the main products were FA, GLYA, and GA, while when the quantity of catalyst was larger than 0.9 g, new products appeared, such as mesoxalic acid (MA) and LA, while the quantity of CO2 (total oxidation) drastically increased (Figure 8).
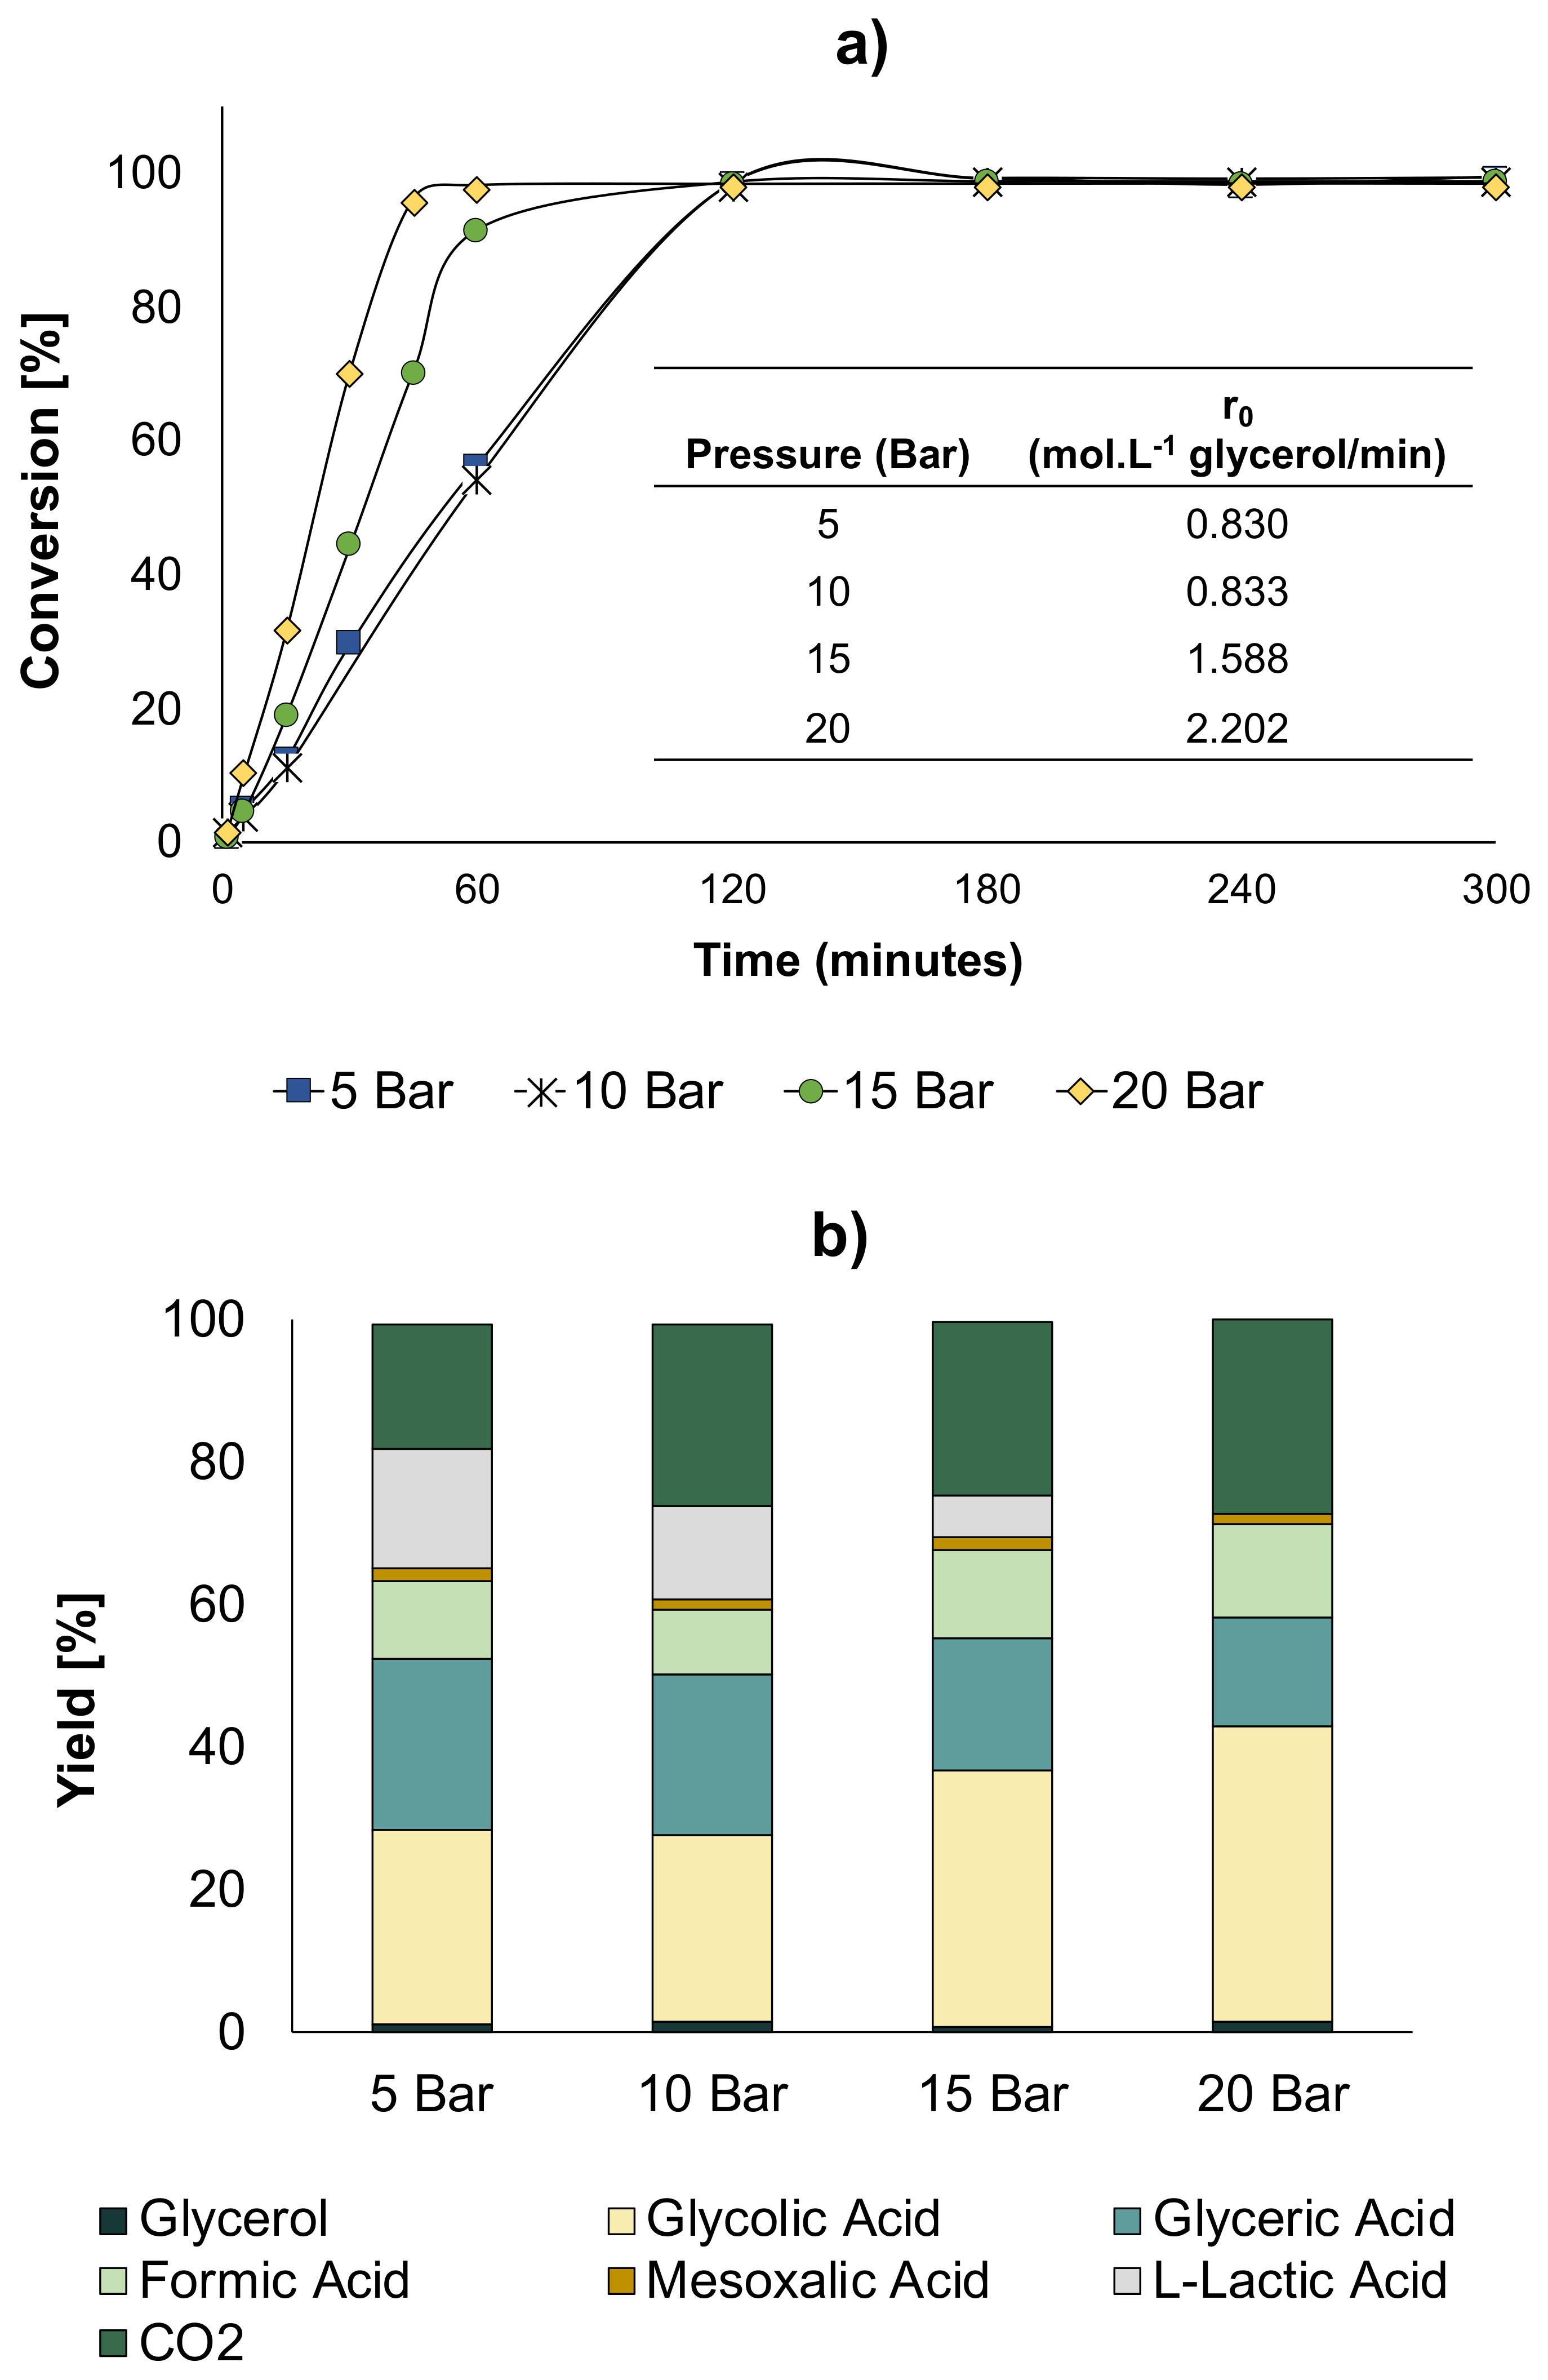
Taking into account that LA was not targeted in this reaction and also because it is quite difficult to separate it from GLYA, reducing the amount of formed LA is important. For doing this, a series of subsequent catalytic tests were performed by increasing the O2 partial pressure (higher amount of available oxygen in the liquid phase). The reaction parameters were 60 °C, NaOH/Glycerol ratio = 2, and 2 g of catalyst. Figure 10 shows the results of these tests.
The results showed that while an increase in O2 pressure to 10 bar did not yield any significant change in conversion and yields, at 15 bar, a higher reaction rate was actually observed together with an increase in GLYA and a decrease in LA selectivities (Figure 10a,b). When the pressure was further increased to 20 bar, the reaction rate was even higher than that observed at 15 bar. Further, at this pressure, the GLYA yield increased, while LA was not produced anymore. Furthermore, it was evidenced that as the pressure of O2 increased, the initial reaction rate proportionally increased. Thus, at a pressure of 20 bar, in addition to favoring the production of GLYA, complete conversion was obtained at a shorter reaction time.
As the availability of oxygen and the amount of catalyst was identified as an important feature, we decided to carry out the evaluation on the catalytic performances of two more variables: the O2/glycerol ratio and the catalyst/glycerol mass ratio. The O2/glycerol ratio is indicative of the oxygen availability, and was measured in terms of pressure in the sky of the reactor. We thus carried out CCD 2. In this design, ten observations were proposed. The levels of each variable are shown in Table 6. These levels were defined according to previous experiences in our laboratory, conditions and technical limitations of the set-up, and according to bibliography. For the O2 pressure/glycerol ratio, ratios from 0.01 to 0.47 were evaluated, corresponding to pressures from 1 to 40 bar. For the catalyst/glycerol ratio (g/g), ratios from 0.03 to 0.13 were evaluated, which corresponded to catalyst quantities from 0.9 g to 3.6 g. These tests were performed with a glycerol solution of 1.5 M and at NaOH/glycerol molar ratio of 2 (optimal condition found in the first stage). The experimental tests results were analyzed by an ANOVA analysis, in which the most influential variables and their interaction were found.
The results obtained with each operating condition with CCD 2 can be seen in Table 7. The statistical analysis showed the influence of the two variables and the interaction between them.
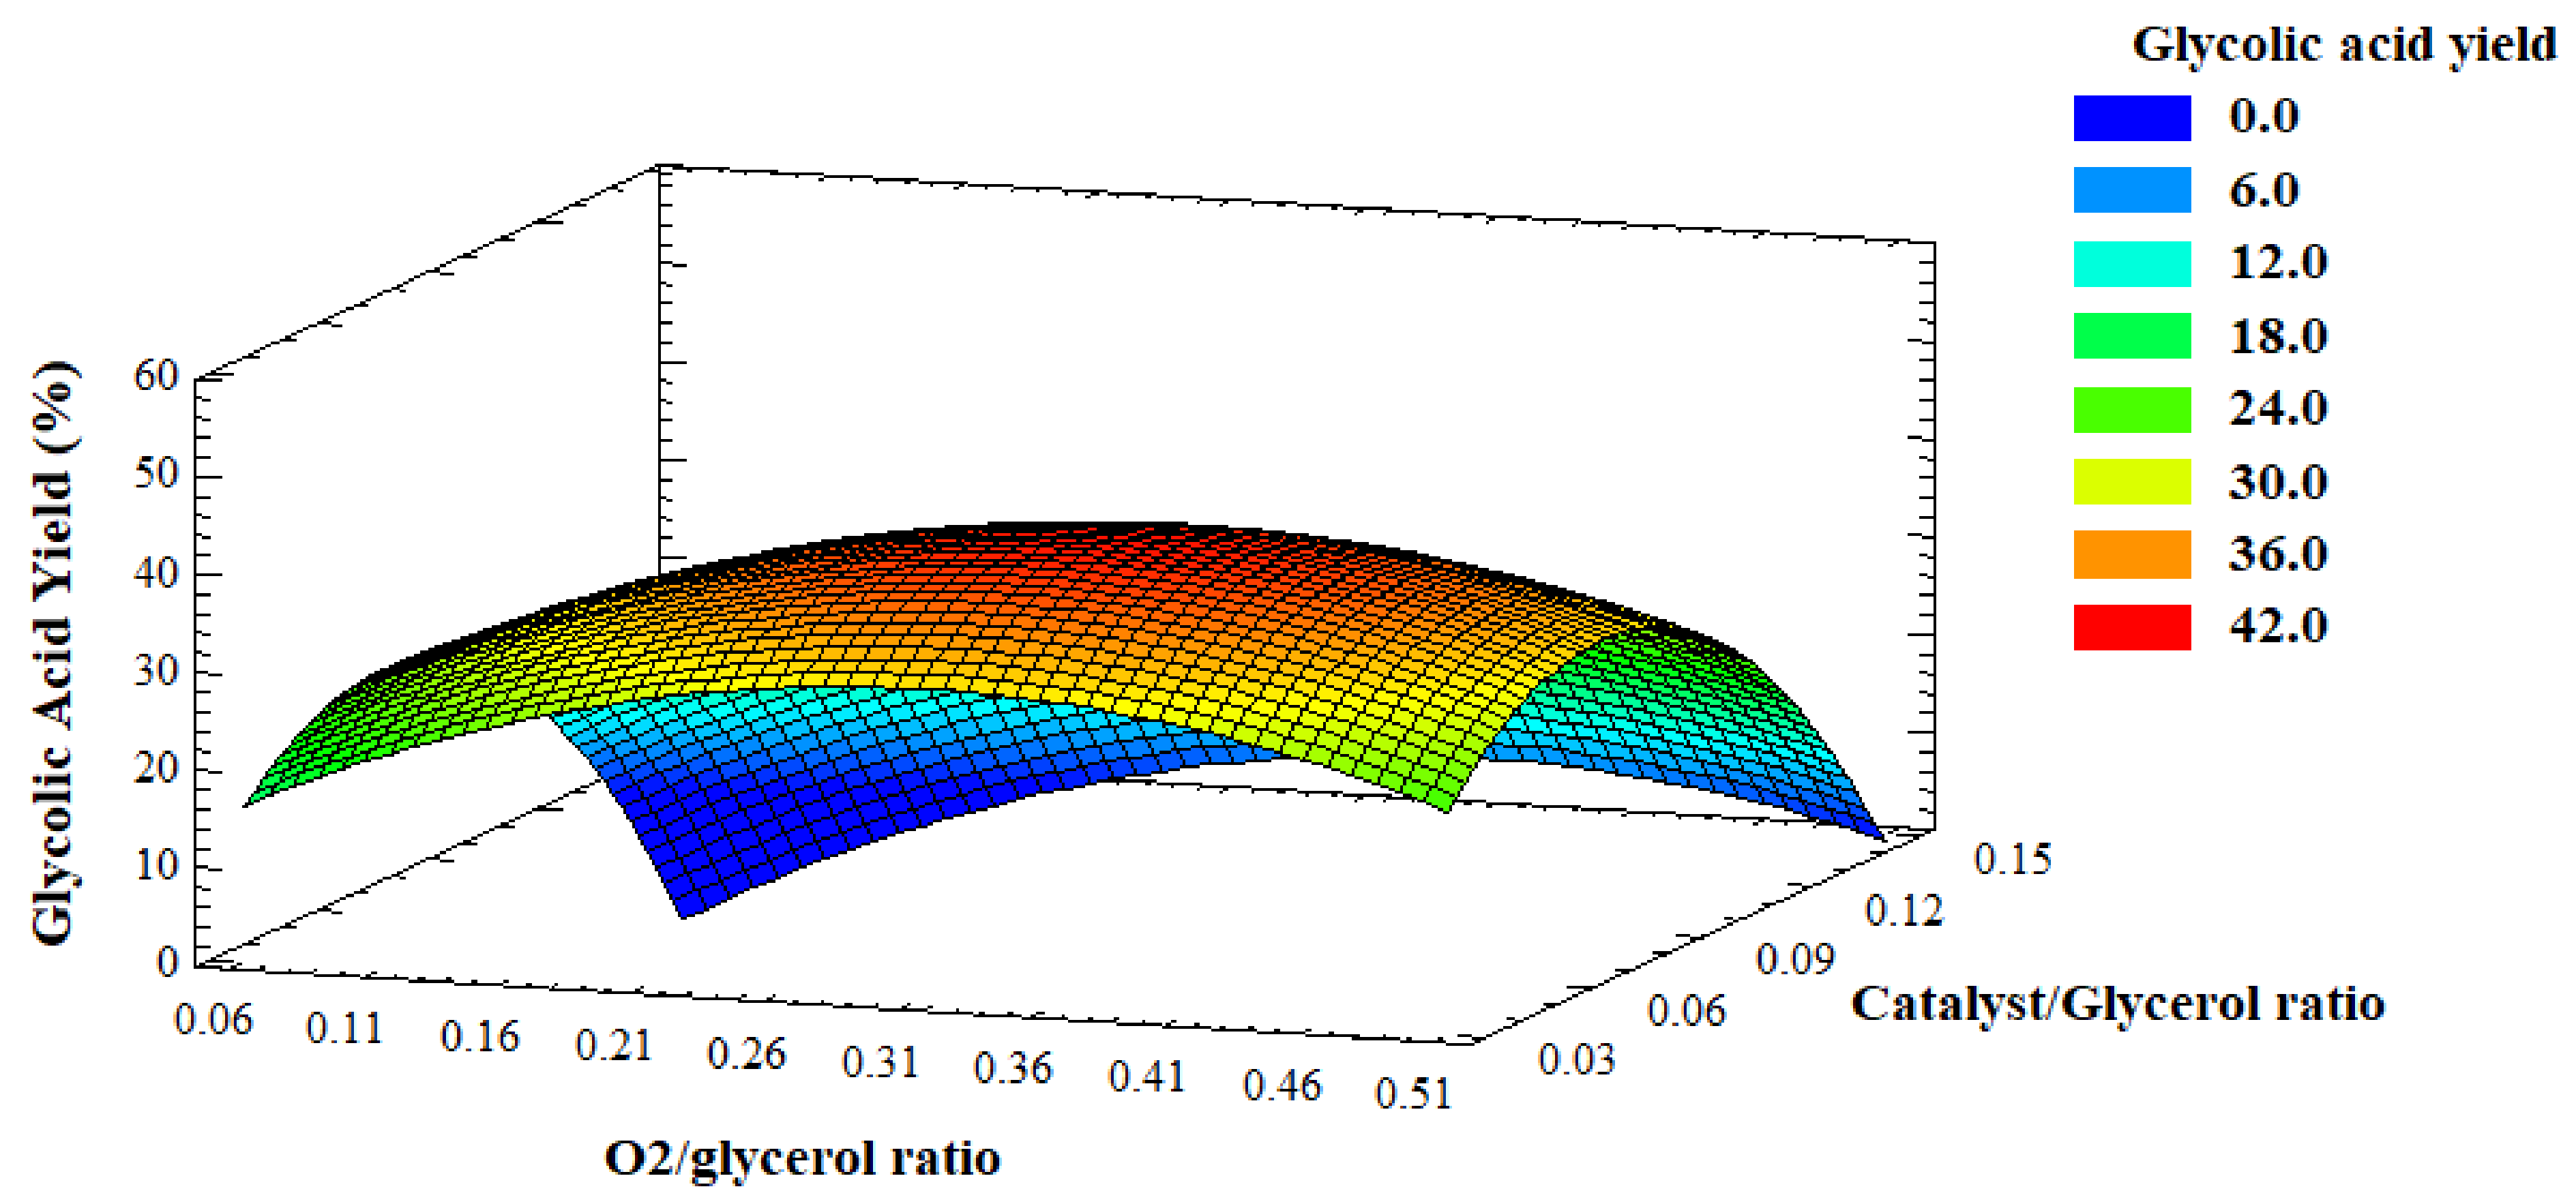
Figure 11 shows the surface response for the GLYA yield evaluated against O2/glycerol molar ratio and catalyst/glycerol mass ratio. For low catalyst/glycerol and oxygen/glycerol ratios, the GLYA yield was low. This was mainly due to the fact that with less oxygen availability, the selectivity of the reaction turned to other products, such as LA. On the other hand, the maximum GLYA yield was found at intermediate values of catalyst/glycerol (0.07) and also oxygen/glycerol (0.23) ratios. This was due to the fact that when the amount of catalyst is increased, it is necessary to increase in parallel the O2 pressure to have sufficient oxygen. However, due to technical limitations, the maximum O2/glycerol ratio studied herein did not allow using sufficient oxygen pressure for the maximum amount of catalyst, and it was not possible to increase the pressure even further. Due to this relative deficiency of oxygen at high catalyst amounts, undesirable products were obtained that affected the GLYA yield.
The optimal values we found were O2/glycerol ratio of 0.23 and catalyst/glycerol ratio of 0.07.
Once the optimal conditions of temperature (60 °C), NaOH/glycerol (2), O2/glycerol ratio (0.23), and catalyst/glycerol ratio (0.07) were determined, the glycerol concentration was increased, and we varied it from 1.5 to 3 M.
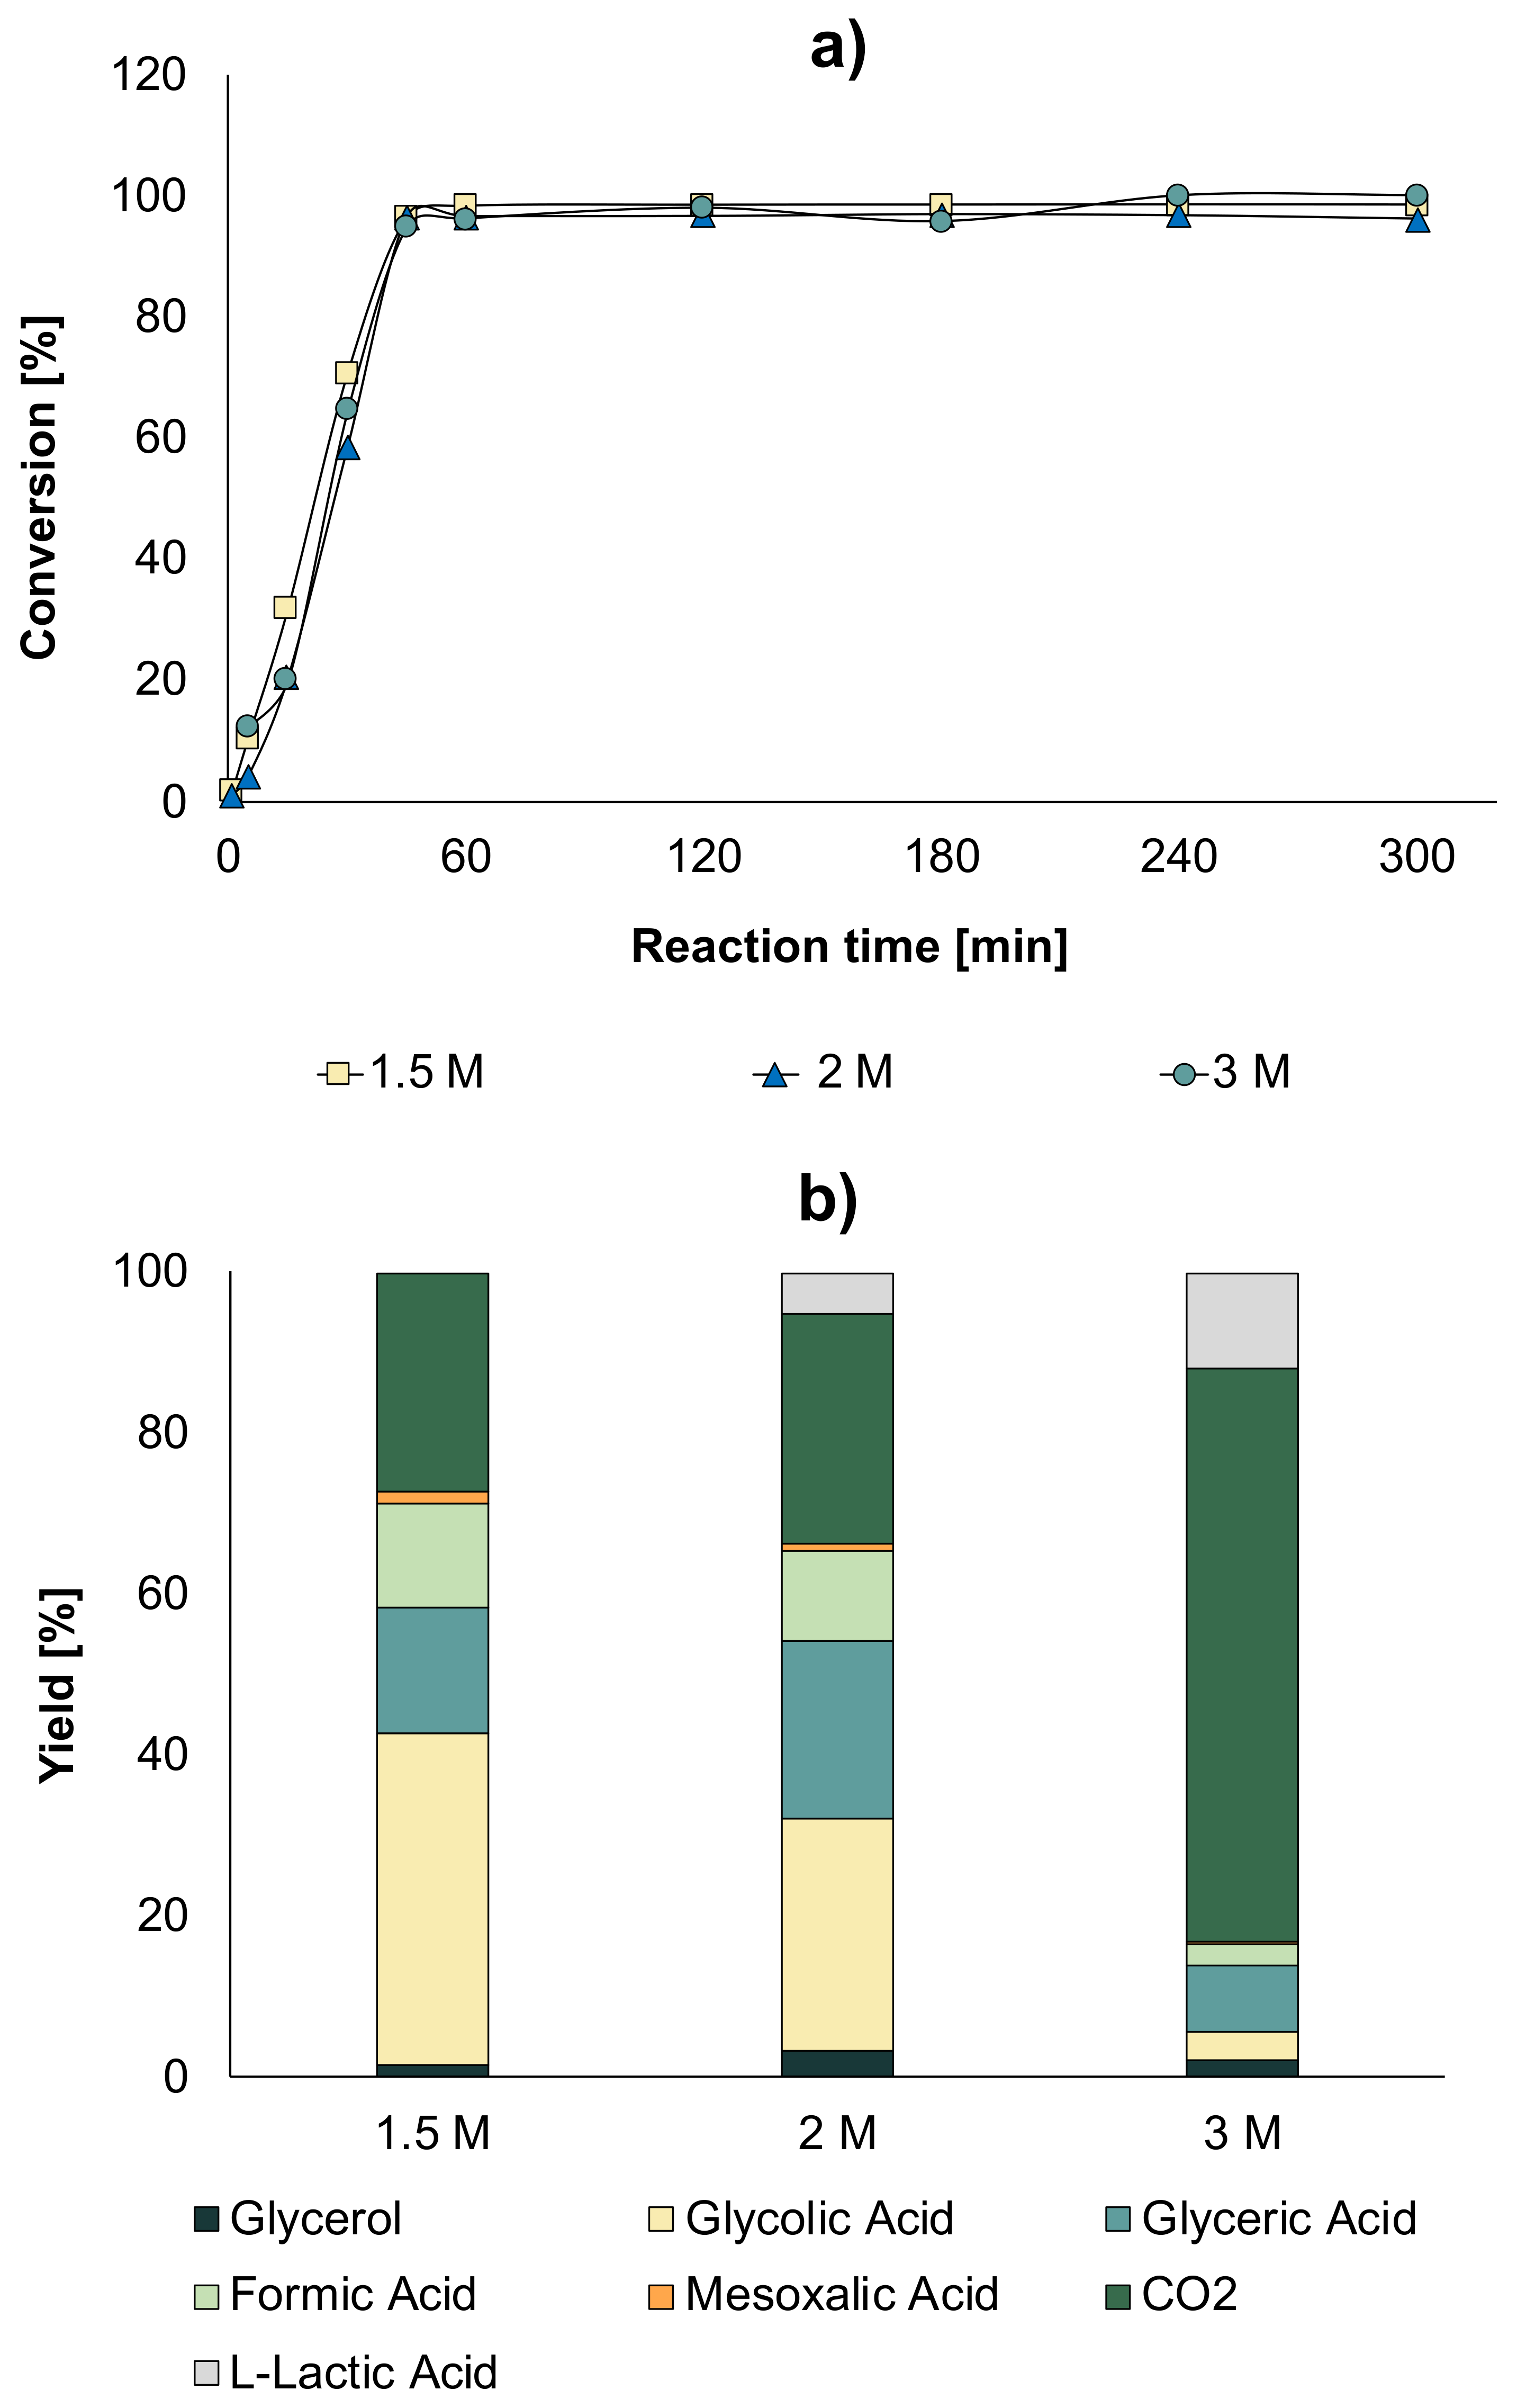
The results showed a significant improvement in the conversion. If we compare the effects of the conditions, for a glycerol concentration of 1.5 M without optimal conditions, a conversion of 60% was obtained at 300 min (Figure 7a), while with the optimal conditions, a conversion of almost 100% after 45 min was obtained (Figure 12a). Comparing the concentration of glycolic acid obtained with an initial solution of 0.3 M glycerol (0.27 mol/L), it was observed that by increasing the initial concentration of glycerol under optimal conditions, a higher concentration of glycolic acid was obtained—0.93 mol/L when a 1.5 M solution was used and 0.88 mol/L when using a 2 M solution.
The distribution of products in the liquid at maximum conversion is given in Figure 12b. As the glycerol concentration increased, MA appeared as a product that was not observed when a glycerol concentration of 0.3 M (Figure 5b) and 0.5 M were used (Figure 7b). In addition, it was found that, as the concentration of glycerol increased, LA appeared in a higher concentration, which was an undesired product in our study.
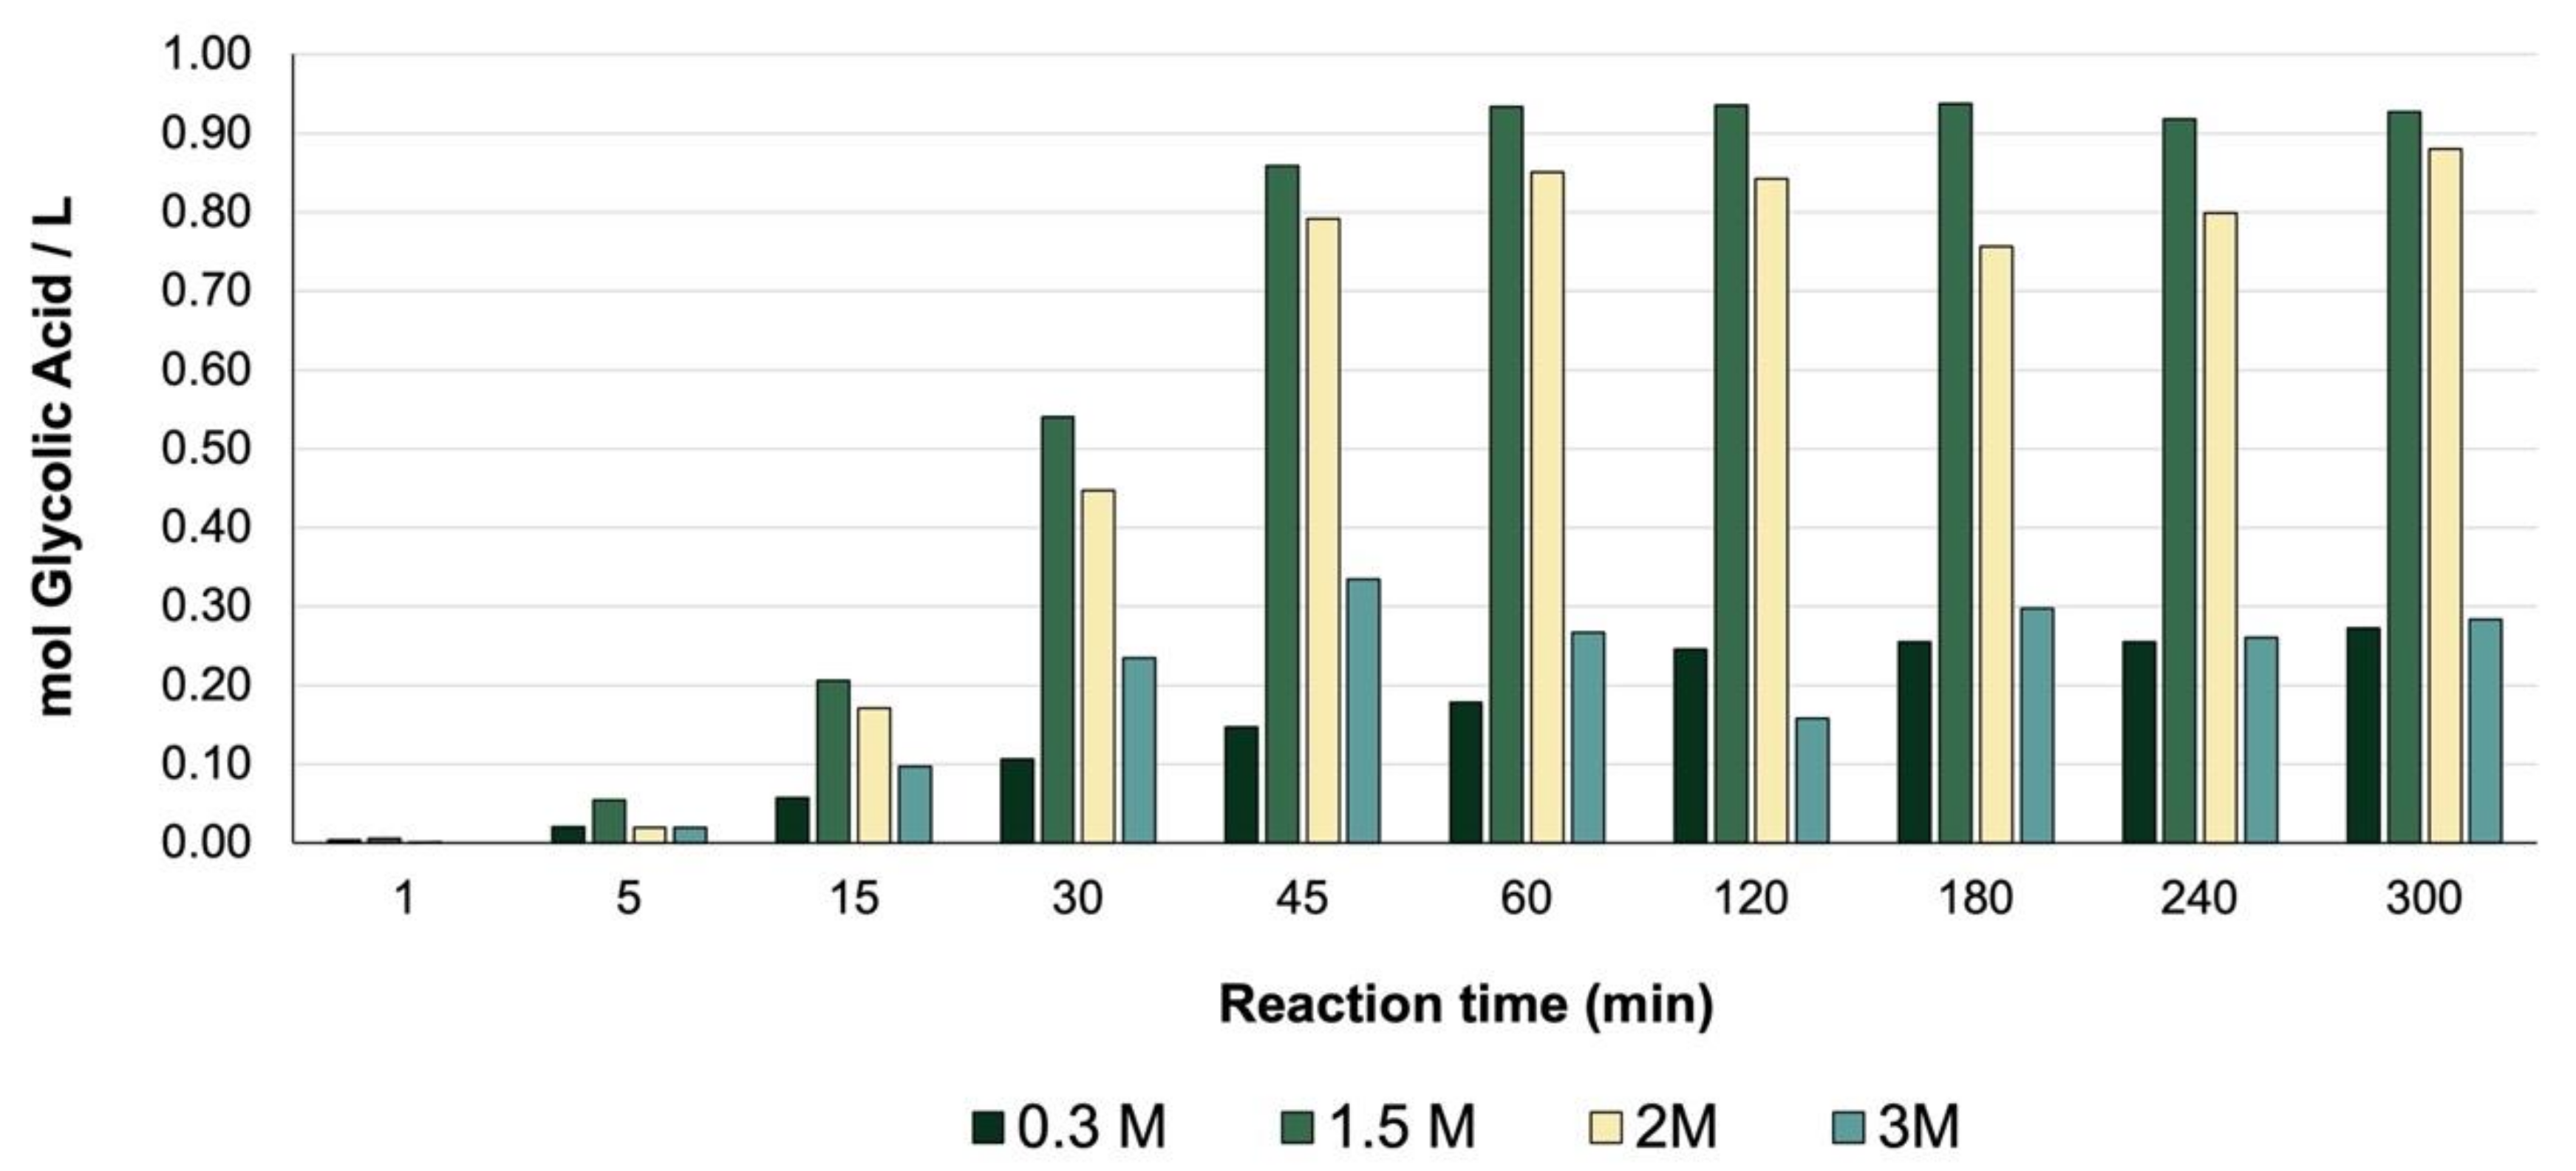
The quantity (mol) of GLYA produced per liter of solution was evaluated at different concentrations of glycerol under optimal conditions and compared with the initial conditions (Figure 13). A significant increase in the concentration of GLYA was observed when using a 1.5 M and 2 M solution, leading to the possibility of increasing the glycerol concentration and obtaining a solution rich in the product of interest.

3. Materials and Methods

3.1. Catalyst Synthesis and Characterization

The catalyst used in the experimental tests was a silver catalyst supported on a mixed cerium-zirconium oxide with the Ce0.75Zr0.25O2 composition.
As a first step, the Ce0.75Zr0.25O2 support was synthesized by a sol-gel method reported by Rossignol et al. [34]. Cerium nitrate Ce(NO3)·6H2O (Sigma Aldrich, 99%) was used as the cerium precursor, and a solution of zirconium n-peroxide Zr(OC3H7)4 in 1-propanol (Sigma Aldrich) was used as the zirconium precursor. The necessary amounts of each precursor were calculated to maintain a Ce-Zr ratio of 3:1.
Cerium nitrate was dissolved in water at room temperature and under stirring, while the zirconium n-peroxide solution was diluted in isopropanol. The aqueous cerium nitrate solution was added to the n-peroxide zirconium solution under stirring, with consequence of immediately obtaining the pseudo-gel.
Subsequently, the gel was dried at 60 °C for one hour, and then at 110 °C overnight. Finally, the powder obtained was calcined under dynamic air atmosphere at 550 °C for 4 h (5 °C/min).
Once the support was obtained, we proceeded to silver deposition, using the deposition–precipitation method [21,35]. Methanol (Sigma Aldrich, 99%) was added to the support placed in a round-bottom flask. This solution was then placed under reflux at the temperature of 65 °C for one hour. Silver nitrate AgNO3 (Sigma Aldrich, 99%) was used as the silver precursor. The amount of silver nitrate necessary to obtain a silver loading of 5 wt.% was diluted in methanol and added dropwise to the support solution. Then, a commercial 36% formaldehyde solution in H2O (Sigma Aldrich, 36%) was added so as to obtain a formaldehyde/silver molar ratio of 10. Once the formaldehyde was added, the solution turned dark brown. This solution was left under reflux at the same temperature (65 °C) under stirring for one more hour. The pH of the solution was then adjusted to 8 by adding a 0.3 M solution of sodium hydroxide NaOH (Sigma Aldrich, 98%); reflux and stirring were then kept for an additional hour. Finally, the solution was cooled to room temperature and filtered. The recovered product was washed with ultrapure water and dried at 110 °C for 24 h, thus obtaining the catalyst with 5 wt.% of Ag on Ce0.75Zr0.25O2 support (5%Ag/Ce0.75Zr0.25O2).
The synthesized catalyst was characterized by various techniques. Its textural properties were evaluated through nitrogen physisorption (−196 °C) using the BJH method with a Micromeritics TriStar II 3020.
X-ray diffraction was used to check the sample crystallinity. The analysis was performed on a Bruker AXS D8 advanced diffractometer with CuKα source (λ = 0.154 nm), in a 2θ range from 20° to 90° with a step of 0.02° and scan time of 0.5 s per step. The diffractogram was analyzed using the DifracEva software and its database, comparing it with the files corresponding to the metallic silver and the CeZrO support. The average crystallite size of the synthesized support was determined using the Sherrer equation [24].
Likewise, to check the oxidation state of silver and the catalyst surface composition, X-ray photoelectron spectroscopy (XPS) was performed, using an AXIS Ultra DLD Kratos spectrometer equipped with a monochromatic aluminum source (AlKα = 1486.6 eV). All the binding energies were calibrated with C1s being fixed at 285.0 eV. The results were analyzed and treated using the CasaXPS software.

3.2. Catalytic Tests

The catalytic tests were performed in the test rig shown in Figure 14. This setup consisted of a batch reactor, a mechanical stirrer, and an oxygen pressure tank, as well as temperature and pressure controls. The oxygen from the cylinder was fed into the reservoir, in which oxygen was stored and thermoregulated at 40 °C. The batch reactor was made of stainless steel and had a volume of 300 mL. The reactor temperature was controlled by a temperature control system. In addition, the reactor had an inlet for oxygen connected to the reservoir and two outlets—one for sampling and the other for depressurizing the system once the reaction is complete.
For the oxidation reaction of glycerol in the liquid phase, 200 mL of a glycerol-water solution was loaded in the reactor. The concentration of this solution was adjusted according to the desired experimental conditions. To this solution, sodium hydroxide was added with the desired NaOH/glycerol molar ratio. The reactor was closed and heated at the required reaction temperature. Once this temperature was reached, the catalyst was added with the desired glycerol/catalyst mass ratio. At this stage, the agitation started, and the system was pressurized with O2; this time corresponds to the t0 of the reaction.
Through the sampling valve, samples were taken at different times, during three hours of reaction. The samples were then acidified with a 2.4 M sulfuric acid solution, and subsequently analyzed on an Agilent 1260 HPLC equipped with a RID detector. For this analysis, a Rezex ROA-Organic Acid H+ column (Phenomenex, 8%, 300 × 7.8 mm) was used at a temperature of 35 °C. A 2.5 mM solution of sulfuric acid in ultrapure water was used as the mobile phase applying a flow of 0.5 mL/min.
To identify the retention times, high purity standards of the possible reaction products were injected. For quantification, a calibration curve was performed with each product. For this, high purity standards were used, and solutions were prepared at different concentrations. The response factors were calculated for each product from the calibration curves.

4. Conclusions

To study the behavior of the catalyst and compare it with those studied in other investigations, a preliminary benchmark test was carried out under the same initial conditions evaluated in these investigations. After two hours of reaction, we observed almost full conversion (>98%) with a high selectivity to GLYA (69%). The conversion obtained in this study was higher than those obtained in other studies under the same conditions and different catalysts, concluding that the catalyst 5% Ag/Ce0.75Zr0.25O2, in addition to presenting a complete conversion, presents a high selectivity towards GLYA [3,13], leading to GLYA yield of almost 68%.
It was then found that catalytic production of glycolic acid (GLYA) from glycerol oxidation using silver deposited on cerium zirconium oxide as a catalyst appeared to be a promising route of valorization of glycerol. In order to take this process to an industrial scale, the optimization of operating conditions was carried out. For this, some variables were studied, the most influential being the glycolic acid yield, and the optimal conditions of each of these variables were found.
It could be concluded that the production of GLYA depends mainly on glycerol concentration, NaOH/glycerol ratio, catalyst/glycerol ratio, and O2/glycerol ratio. The optimal conditions we found with our setup and its limitations were: temperature 60 °C, NaOH/glycerol molar ratio of 2, O2/glycerol molar ratio of 0.23, and catalyst/glycerol mass ratio of 0.07. The GLY concentration was increased, varying from 0.3 M to 3 M. It could be concluded that at the optimal conditions found, the glycerol concentration can be increased from 0.3 M to 2 M with a conversion of 100%. It was found that at optimal conditions, if the glycerol concentration is increased, the production of CO2 increases proportionally. However, when reviewing the concentration of GLYA in the liquid product obtained, a significant increase in GLYA concentration was found when the glycerol concentration was increased to 1.5 M (0.93 mol GLY/L) and 2.0 M (0.88 mol GLY/L), obtaining a liquid fraction rich in GLYA.

Author Contributions

Writing—original draft preparation, C.P.T.R.; writing—review and editing, C.P.T.R., F.D., M.C.; supervision, F.D., M.C.; project administration, M.C.; funding acquisition, M.C. All authors have read and agreed to the published version of the manuscript.

Funding

This research was funded by I Site U Lille.

Institutional Review Board Statement

Not applicable.

Informed Consent Statement

Not applicable.

Acknowledgments

Authors acknowledge the support from Chevreul Institute (FR 2638), Ministère de l’Enseignement Supérieur, de la Recherche, et de l’Innovation, Région Hauts-de-France and FEDER. Authors want to thank O. Gardoll, P. Simon and M. Trentesaux for the technical supports. We also want to thank to Department of Investigations of Universidad de Investigación y Desarrollo.

Conflicts of Interest

The authors declare no conflict of interest.

References

  1. Da Silva, G.P.; Mack, M.; Contiero, J. Glycerol: A promising and abundant carbon source for industrial microbiology. Biotechnol. Adv. 2009, 27, 30–39. [Google Scholar] [CrossRef] [PubMed]
  2. Katryniok, B.; Dumeignil, F. Recent Developments in the Field of Catalytic Dehydration of Glycerol to Acrolein. ACS Catal. 2013, 3, 1819–1834. [Google Scholar] [CrossRef]
  3. Zaid, S.; Skrzyńska, E.; Addad, A.; Nandi, S.; Jalowiecki-Duhamel, L.; Girardon, J.-S.; Capron, M.; Dumeignil, F. Development of Silver Based Catalysts Promoted by Noble Metal M (M = Au, Pd or Pt) for Glycerol Oxidation in Liquid Phase. Top. Catal. 2017, 60, 539–1081. [Google Scholar] [CrossRef]
  4. Sproge, E.; Chornaja, S.; Dubencovs, K.; Kampars, V.; Kulikova, L.; Serga, V.; Karashanova, D. Production of glycolic acid from glycerol using novel fine-disperse platinum catalysts. IOP Conf. Ser. Mater. Sci. Eng. 2015, 77, 012026. [Google Scholar] [CrossRef] [Green Version]
  5. Checa, M.; Nogales-Delgado, S.; Montes, V.; Encinar, J.M. Recent Advances in Glycerol Catalytic Valorization: A Review. Catalysts 2020, 10, 1279. [Google Scholar] [CrossRef]
  6. Adhikari, S.; Fernando, S.D.; Haryanto, A. Hydrogen production from glycerol: An update. Energy Convers. Manag. 2009, 50, 2600–2604. [Google Scholar] [CrossRef]
  7. Pagliaro, M.; Ciriminna, R.; Kimura, H.; Rossi, M.; della Pina, C. From Glycerol to Value-Added Products. Angew. Chem. Int. Ed. 2007, 46, 4434–4440. [Google Scholar] [CrossRef]
  8. Ciriminna, R.; Katryniok, B.; Paul, S.; Dumeignil, F.; Pagliaro, M. Glycerol-Derived Renewable Polyglycerols: A Class of Versatile Chemicals of Wide Potential Application. Org. Process. Res. Dev. 2014, 19, 748–754. [Google Scholar] [CrossRef]
  9. Pagliaro, M. Glycerol: The Renewable Platform Chemical; Elsevier: Amsterdam, The Netherlands, 2017. [Google Scholar]
  10. Len, C.; Delbecq, F.; Corpas, C.C.; Ramos, E.R. Continuous Flow Conversion of Glycerol into Chemicals: An Overview. Synthesis 2017, 50, 723–741. [Google Scholar] [CrossRef]
  11. Varma, R.S.; Len, C. Glycerol valorization under continuous flow conditions-recent advances. Curr. Opin. Green Sustain. Chem. 2019, 15, 83–90. [Google Scholar] [CrossRef]
  12. Ren, S.; Ye, X.P. Catalytic conversion of glycerol to value-added chemicals in alcohol. Fuel Process. Technol. 2015, 140, 148–155. [Google Scholar] [CrossRef]
  13. Skrzynska, E.; Zaid, S.; Addad, A.; Girardon, J.; Capron, M.; Dumeignil, F. Performance of Ag/Al2O3 catalysts in the liquid phase oxidation of glycerol—Effect of preparation method and reaction conditions. Catal. Sci. Technol. 2016, 6, 3182–3196. [Google Scholar] [CrossRef]
  14. Jin, X.; Zhao, M.; Zeng, C.; Yan, W.; Song, Z.; Thapa, P.S.; Subramaniam, B.; Chaudhari, R.V. Oxidation of Glycerol to Dicarboxylic Acids Using Cobalt Catalysts. ACS Catal. 2016, 6, 4576–4583. [Google Scholar] [CrossRef]
  15. Dubencovs, K.; Chornaja, S.; Sproge, E.; Kampars, V.; Markova, D.; Kulikova, L.; Serga, V.; Cvetkovs, A. Novel fine-disperse bimetallic Pt-Pd/Al2O3 catalysts for glycerol oxidation with molecular oxygen. IOP Conf. Ser. Mater. Sci. Eng. 2013, 49, 012002. [Google Scholar] [CrossRef]
  16. Carrettin, S.; McMorn, P.; Johnston, P.; Griffin, K.; Hutchings, G.J. Selective oxidation of glycerol to glyceric acid using a gold catalyst in aqueous sodium hydroxide. Chem. Commun. 2002, 7, 696–697. [Google Scholar] [CrossRef] [PubMed]
  17. Carrettin, S.; McMorn, P.; Johnston, P.; Griffin, K.; Kiely, C.J.; Hutchings, G.J. Oxidation of glycerol using supported Pt, Pd and Au catalysts. Phys. Chem. Chem. Phys. 2003, 5, 1329–1336. [Google Scholar] [CrossRef]
  18. Liang, D.; Gao, J.; Wang, J.; Chen, P.; Wei, Y.; Hou, Z. Bimetallic Pt―Cu catalysts for glycerol oxidation with oxygen in a base-free aqueous solution. Catal. Commun. 2011, 12, 1059–1062. [Google Scholar] [CrossRef]
  19. Dodekatos, G.; Abis, L.; Freakley, S.J.; Tüysüz, H.; Hutchings, G.J. Glycerol Oxidation Using MgO- and Al2O3-supported Gold and Gold-Palladium Nanoparticles Prepared in the Absence of Polymer Stabilizers. ChemCatChem 2018, 10, 1351–1359. [Google Scholar] [CrossRef]
  20. Villa, A.; Dimitratos, N.; Chan-Thaw, C.E.; Hammond, C.; Prati, L.; Hutchings, G.J. Glycerol Oxidation Using Gold-Containing Catalysts. Acc. Chem. Res. 2015, 48, 1403–1412. [Google Scholar] [CrossRef] [PubMed]
  21. Skrzyńska, E.; Zaid, S.; Girardon, J.-S.; Capron, M.; Dumeignil, F. Catalytic behaviour of four different supported noble metals in the crude glycerol oxidation. Appl. Catal. A Gen. 2015, 499, 89–100. [Google Scholar] [CrossRef]
  22. Sigma-Aldrich Commercial prices of glycolic acid. Available online: https://www.sigmaaldrich.com/catalog/product/sial/aldrich/124737?lang=fr&region-FR&cm_sp=Insite-_-caSrpResults_srpRecs_srpModel_glycolic%20acid-_-srpRecs3-1 (accessed on 18 January 2021).
  23. Tung, R.; Rubin, M.G. Procedures in Cosmetic Dermatology Series: Chemical Peels; Elsevier Health Sciences: Amsterdam, The Netherlands, 2010; ISBN 9781437736151. [Google Scholar]
  24. Salehabadi, A.; Ahmad, M.I.; Morad, N.; Salavati-Niasari, M.; Enhessari, M. Electrochemical hydrogen storage properties of Ce0.75Zr0.25O2 nanopowders synthesized by sol-gel method. J. Alloys Compd. 2019, 790, 884–890. [Google Scholar] [CrossRef]
  25. Hou, T.; Yu, B.; Zhang, S.; Zhang, J.; Wang, D.; Xu, T.; Cui, L.; Cai, W. Hydrogen production from propane steam reforming over Ir/Ce0.75Zr0.25O2 catalyst. Appl. Catal. B Environ. 2015, 168, 524–530. [Google Scholar] [CrossRef]
  26. Pintos, D.G.; Juan, A.; Irigoyen, B. Oxygen vacancy formation on the Ni/Ce0.75Zr0.25O2 (111) surface. A DFT+U study. Int. J. Hydrog. Energy 2012, 37, 14937–14944. [Google Scholar] [CrossRef]
  27. Shah, P.M.; Burnett, J.W.H.; Morgan, D.J.; Davies, T.E.; Taylor, S.H. Ceria–Zirconia Mixed Metal Oxides Prepared via Mechanochemical Grinding of Carbonates for the Total Oxidation of Propane and Naphthalene. Catalysts 2019, 9, 475. [Google Scholar] [CrossRef] [Green Version]
  28. Crotti, C.; Farnetti, E. Selective oxidation of glycerol catalyzed by iron complexes. J. Mol. Catal. A Chem. 2015, 396, 353–359. [Google Scholar] [CrossRef]
  29. Khuri, A.I.; Mukhopadhyay, S. Response surface methodology. Wiley Interdiscip. Rev. Comput. Stat. 2010, 2, 128–149. [Google Scholar] [CrossRef]
  30. Ferreira, J.C.; Patino, C.M. What does the p value really mean? J. Bras. Pneumol. 2015, 41, 485. [Google Scholar] [CrossRef]
  31. Hung, H.M.J.; O’Neill, R.T.; Bauer, P.; Kohne, K. The Behavior of the P-Value When the Alternative Hypothesis is True. Biometrics 1997, 53, 11. [Google Scholar] [CrossRef] [Green Version]
  32. Checa-Gómez, M.; Auneau, F.; Hidalgo-Carrillo, J.; Marinas, A.; Marinas, J.M.; Pinel, C.; Urbano, F.J. Catalytic transformation of glycerol on several metal systems supported on ZnO. Catal. Today 2012, 196, 91–100. [Google Scholar] [CrossRef]
  33. Ntho, T.A.; Gqogqa, P.; Aluha, J.L. Oxidation of Glycerol to Lactic Acid by Gold on Acidified Alumina: A Kinetic and DFT Case Study. Adv. Chem. Kinet. 2018, 7, 113. [Google Scholar] [CrossRef] [Green Version]
  34. Rossignol, S.; Madier, Y.; Duprez, D. Preparation of zirconia–ceria materials by soft chemistry. Catal. Today 1999, 50, 261–270. [Google Scholar] [CrossRef]
  35. Skrzynska, E.; Dumeignil, F.; Capron, M. Catalyst and Method for Synthesis of Glycolic Acid. Fr. Patent FR,1,355,321, 10 June 2013. [Google Scholar]
Figure 1. XRD pattern of (a) synthetized support Ce0.75Zr0.25O2 and (b) synthetized catalysts: 5 wt% of Ag impregnated on Ce0.75Zr0.25O2 catalyst. Symbols correspond to: (∗) Main peaks of the Ce0.75Zr0.25O2 structure; and main peak of silver particles (◆).
Catalysts 11 00257 g001
Figure 2. Nitrogen adsorption/desorption profiles for (a) Ce0.75Zr0.25O2 support and (b) 5%Ag/Ce0.75Zr0.25O2 catalyst, and pore volume distribution of (c) Ce0.75Zr0.25O2 support and (d) 5%Ag/Ce0.75Zr0.25O2.
Catalysts 11 00257 g002
Figure 3. Ce 3d XPS spectra of (a) Ce0.75Zr0.25O2 support and (b) 5%Ag/Ce0.75Zr0.25O2 catalyst.
Catalysts 11 00257 g003
Figure 4. XPS spectra of Ce0.75Zr0.25O2 support and 5%Ag/Ce0.75Zr0.25O2 catalyst for (a) O 1s peaks, (b) Zr 3d peaks, and (c) Ag 3d peaks.
Catalysts 11 00257 g004
Figure 5. Experimental results obtained for benchmark test at previously determined operating conditions: 0.3 M glycerol solution, 60 °C, 5 bar, 0.5 g of catalyst, and a NaOH/glycerol molar ratio of 4 (a) glycerol conversion and products selectivity and (b) products yield.
Catalysts 11 00257 g005
Figure 6. Surface response for GLYA yield evaluating the most influential variables (i.e., glycerol concentration and NaOH/glycerol ratio).
Catalysts 11 00257 g006
Figure 7. (a) Conversion and (b) products’ yields obtained by increasing glycerol concentration at optimal conditions of temperature (60 °C), NaOH/glycerol ratio, and amount of catalyst (0.7 g).
Catalysts 11 00257 g007
Figure 8. Scheme of the reaction mechanisms from the oxidation of glycerol in a basic medium. Figure produced by the present authors based on [3,14,16,32,33].
Catalysts 11 00257 g008
Figure 9. (a) Conversion for different amounts of catalyst as a function of time, and (b) product yields obtained at maximum conversion by increasing the amount of catalyst under previously determined optimal reaction conditions.
Catalysts 11 00257 g009
Figure 10. Production of glycolic acid at different O2 pressures under optimal conditions determined in the previous experiments: (a) conversion of glycerol and initial reaction rates, and (b) product yields.
Catalysts 11 00257 g010
Figure 11. Surface response for the glycolic acid yield evaluated against the most influential variables, namely the O2/glycerol molar ratio and the catalyst/glycerol mass ratio.
Catalysts 11 00257 g011
Figure 12. (a) Conversion of glycerol as a function of time for different glycerol concentrations, (b) product yields at maximum conversion by increasing the glycerol concentration under optimal conditions of temperature (60 °C), NaOH/glycerol (2), O2/glycerol ratio (0.23), and catalyst/glycerol ratio (0.07).
Catalysts 11 00257 g012
Figure 13. Concentration in the liquid product obtained by increasing the glycerol concentration at optimal operating conditions of temperature (60 °C), NaOH/glycerol (2), O2/glycerol ratio (0.23), and catalyst/glycerol ratio (0.07).
Catalysts 11 00257 g013
Figure 14. Experimental set-up used for catalytic tests.
Catalysts 11 00257 g014
Table 1. Textural properties for the support before and after silver loading.
CatalystSpecific Surface Area (m2/g)Pore Size (nm)Pore Volume (cm3/g)
Ce0.75Zr0.25O2 support9711.20.27
5% Ag/Ce0.75Zr0.25O28611.70.25
Table 2. Composition parameters obtained from XPS analysis.
CatalystMass Conc. (wt.%)Atomic Concentration (%)
% AgCe+3Ce+4Total Ce% Zr (Zr3d)% O (O1s)% Ag (Ag3d)Atomic Ratio
Ce4+/ZrCe3+/Zr
Ce0.75Zr0.25O2 support-3.7518.7522.395.6372.03-3.330.67
5%Ag/Ce0.75Zr0.25O24.644.2218.4322.655.4768.443.603.370.77
Table 3. Variables of study in the central composite design (CCD) 1.
VariableMinimum LevelMaximum Level
Glycerol Concentration0.3 M2.5 M
NaOH/glycerol molar ratio04
Catalyst/glycerol ratio0.10.9
Reaction temperature40 °C120 °C
Table 4. Experimental results obtained at each operating conditions of the CCD 1.
TestGlycerol Concentration (mol/L)NaOH/Glycerol Molar Ratio (mol/mol)Reaction Temperature (°C)Catalyst/Glycerol RatioGlycolic Acid Yield (%)
111600.330.95
221600.314.10
313600.316.96
423600.36.32
5111000.326.23
6211000.319.70
7131000.328.41
8231000.319.32
911600.728.27
1021600.723.70
1113600.737.14
1223600.711.26
13111000.725.8
14211000.78.02
15131000.718.36
16231000.712.06
170.52800.552.93
182.52800.59.48
191.50800.50.03
201.54800.59.75
211.52400.512.45
221.521200.528.51
231.52800.123.04
241.52800.936.16
251.52800.524.48
Table 5. Analysis of variance for glycolic acid (GLYA) yield.
SourceSum of SquaresDfMean SquareF-Ratiop-Value
A: Glycerol concentration1515.2811515.2827.810.0003
B: NaOH/glycerol5.305315.30530.100.7609
C: Temperature13.3846113.38460.250.6299
D: Catalyst qty27.2302127.23020.500.4943
AA26.4785126.47850.490.5002
AB0.42162510.4216250.010.9315
AC31.1348131.13480.570.4656
AD3.9440913.944090.070.7929
BB288.0441288.0445.290.0421
BC48.7598148.75980.890.3645
BD18.0048118.00480.330.5770
CC14.9658114.96580.270.6106
CD217.5751217.5753.990.0710
DD14.4152114.41520.260.6172
Total error599.4231154.493
Total (corr.)3349.5725
R-Squared82.11
Table 6. Variables considered in CCD 2.
VariableMinimum LevelMaximum Level
O2 pressure/glycerol ratio (mol/mol)0.010.47
Catalyst/glycerol ratio (g/g)0.030.13
Table 7. Experimental results obtained at each operating condition of CCD 2.
ObservationRatio O2/GlycerolRatio Catalyst/GlycerolGlycolic Acid Yield
Obs10.060.0319.64
Obs20.40.0333.04
Obs30.060.118.49
Obs40.40.1125.35
Obs500.070
Obs60.470.0738.15
Obs70.230.01315.8
Obs80.230.1324.12
Obs90.230.0732.48
Obs100.230.0740.88
Publisher’s Note: MDPI stays neutral with regard to jurisdictional claims in published maps and institutional affiliations.

