1. Introduction
The main application of nanocrystalline iron doped with hardly reducible metal oxides (ncFe) is its usage as the most common ammonia synthesis catalyst. This catalyst served as a basic model system for research, leading to understanding of the mechanisms of ammonia synthesis and decomposition [
1,
2,
3,
4,
5,
6,
7]. It was also used to understand the steps occurring during the nitriding process [
8]. The interaction of ncFe with atmospheres containing ammonia leads to formation of nanocrystalline iron nitrides [
9,
10,
11,
12,
13,
14]. There is a view that these nanocrystalline iron nitrides formed in industrial reaction conditions are the real catalyst in the ammonia synthesis reaction by the creation of highly disordered crystal structures [
15].
Previous common opinion was that nanomaterial could not be in a state of equilibrium. Researchers sought to the lower the internal energy of nanomaterial by decreasing its surface to volume ratio in the sintering processes [
16,
17,
18,
19]. However, it has already been shown that nanomaterials can be in the equilibrium state [
20], and that industrial catalysts are the best examples of this; the ammonia synthesis iron catalyst maintains its nanocrystalline structure for even more than 15 years despite it working in aggressive atmospheres, under a pressure of 20–30 MPa and a relatively high temperature of 500 °C [
21]. In nanocrystalline iron nitriding processes, the minimal nitriding potential is expressed as
where p
NH3,pt is the partial pressure of ammonia, at which phase transformation occurs, and p
H2,pt is the partial pressure of hydrogen, at which phase transformation occurs, which is needed to complete transformation of individual nanocrystallites of iron depending on the size of crystallites [
22,
23,
24,
25]. A model was proposed and verified according to which the transformation of nanocrystallites of α-iron to γ′-iron nitride takes place in their whole volume in the specific order from the largest to the smallest. The theoretical and model calculations, performed on the basis of thermodynamic parameters, confirmed that the above mentioned order of nanocrystallite conversion appears in the process of nitriding, and in the process of reduction of the obtained nitrides as well, and that P
0 depends linearly on the ratio of the active surface area of a nanocrystallite to its volume (S
a/V = A
act) [
26,
27].
The system of nanocrystalline iron reacting with mixtures composed of ammonia and hydrogen can be also conducted in kinetic area, when the nitriding potential is far away from the equilibrium. An increasing mean size of nanocrystallites was observed with increasing conversion degree. The phase transformation of nitrogen saturated iron nanocrystallites to iron nitrides takes place in the whole volume of nanocrystallite immediately after exceeding the critical nitrogen concentration in iron. The critical nitrogen concentration in smaller nanocrystallites is gained in less time than in larger ones as a result of the greater S
a/V ratio of smaller nanocrystallites. Therefore, as the nitriding process proceeds, nanocrystallites of iron are converted to iron nitride, γ′-Fe
4N, in the order from the smallest to the largest [
28,
29,
30].
Based on the results of gravimetric investigations of the nanocrystalline iron nitriding processes in atmospheres containing ammonia and hydrogen, it can be concluded that nanomaterials do not react chaotically but in a precisely defined order of increasing energy of transformation in the thermodynamic region of reaction, or of decreasing surface to volume ratio (geometrical aspect) in the kinetic region [
31]. Based on these statements, a number of methods were developed to determine nanocrystallite size distribution, and it was stated that in the nanocrystalline iron doped with hardly reducible metals oxides the distribution was bimodal [
32,
33].
The method of chemical potential programmed reaction (CPPR) was created as an analogy to temperature-programmed (TP) methods, but here the physical and/or chemical properties of nanomaterial depend on the chemical potential of the gas phase with which it reacts [
25]. The method is implemented through the continuously changing chemical potential of the gas phase and detecting the reaction of the solid sample. In processes conducted in an equilibrium state, nanocrystallites of a certain active surface area (volume, size or surface energy) undergo a phase transition at the specific and suitable critical chemical potential of a gas phase, P
0. The dependence of the phase composition of nanomaterial on the chemical potential of the gas phase is a function of nanocrystallite size distribution (nCSD) and can be written as follows [
25]:
When conducting processes close to equilibrium using this method, thermodynamic parameters are determined; if one works in the kinetic area, kinetic parameters are determined. The CPPR method allowed, as well, one to control the solid phase composition by changing the parameters of the process (temperature) and gas phase (reaction potential) [
25].
In this paper we demonstrate how to use the knowledge about the nanomaterial to design its chemical and phase composition. For this purpose, we presented the chemical method CPPR for determining the critical nitriding potential at which the nanocrystallite fraction of concrete size undergoes a crystal transition, which is based on one analytical method, namely in situ XRD measurements.
2. Results and Discussion
The presented system containing ncFe in the NH3/H2 atmospheres with nitriding potential changed in a programmed way is the basis for leading the discussion. The system is in an equilibrium, or at least a close-to-equilibrium state. For a fixed value of nitriding potential, the chemical composition of the nanocrystallite surface is constant and it does not depend on the size of nanocrystallites. As a result of the reaction of system components, the solid phase undergoes a phase transition with formation of a new compound—one of several possible iron nitrides. In the equilibrium state, nanocrystallites undergo a phase transition in the order from the largest to the smallest.
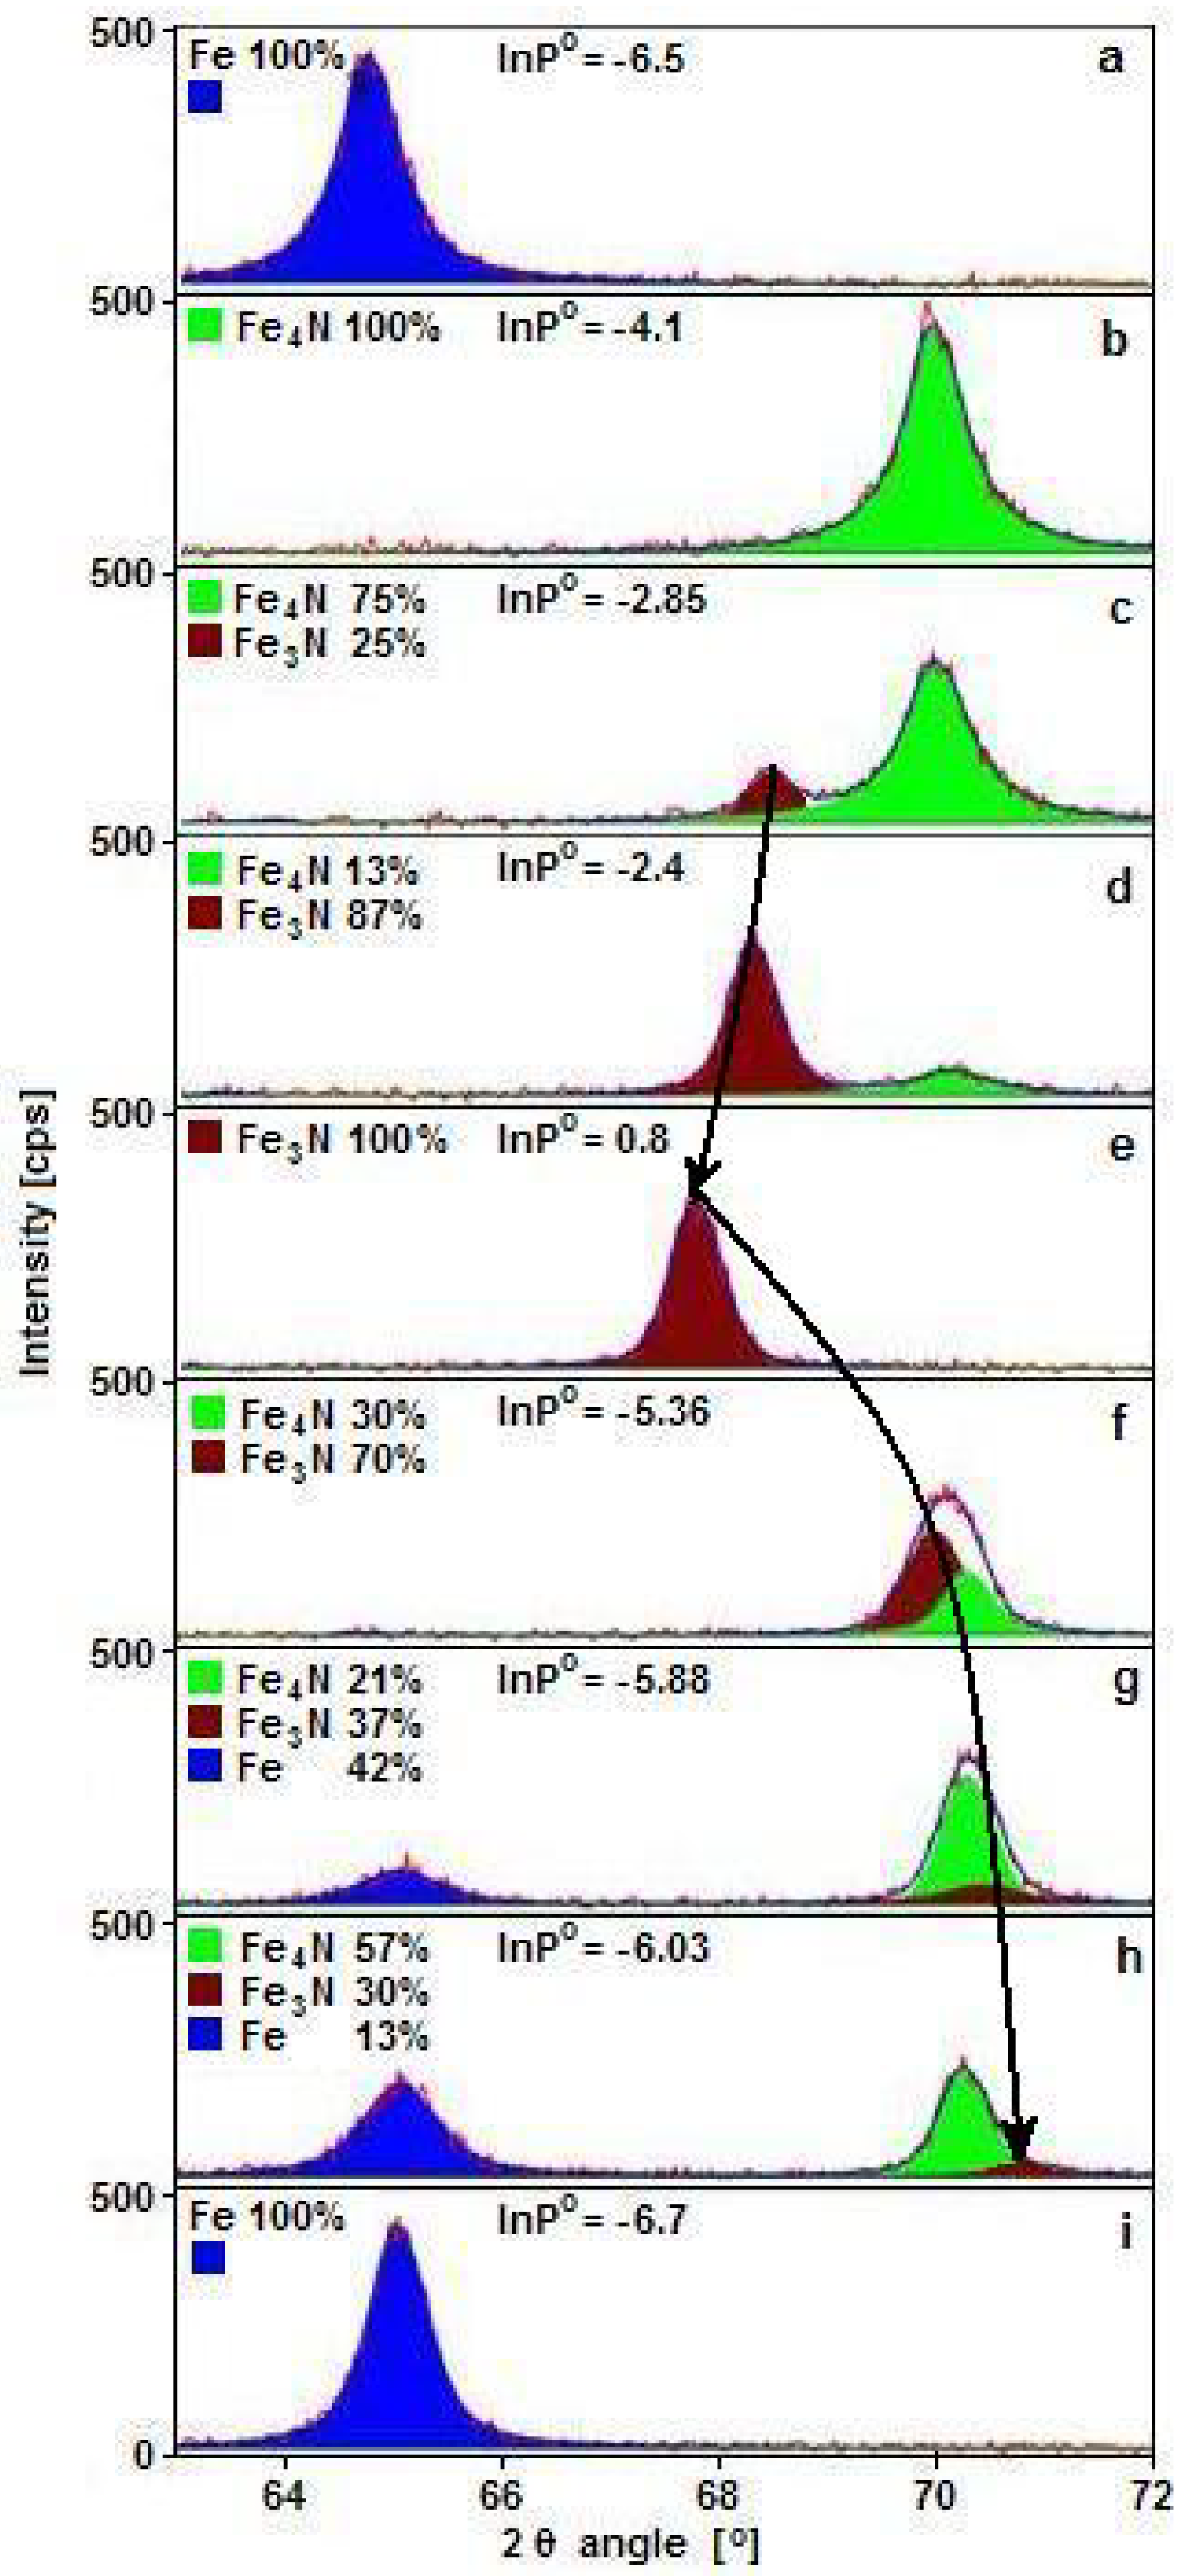
Figure 1 shows exemplary diffractograms obtained for samples during nitriding and reduction processes within the range of nitriding potential of ε iron nitride phase stability. During nitriding, a maximum of two phases in the same reaction conditions can be present, and during reduction, three can be present.
One can observe that the εFe
3-2N(300) diffraction reflex, brown in color in
Figure 1, moved 2θ in angle position from 67.76° (
Figure 1e) to 71° (
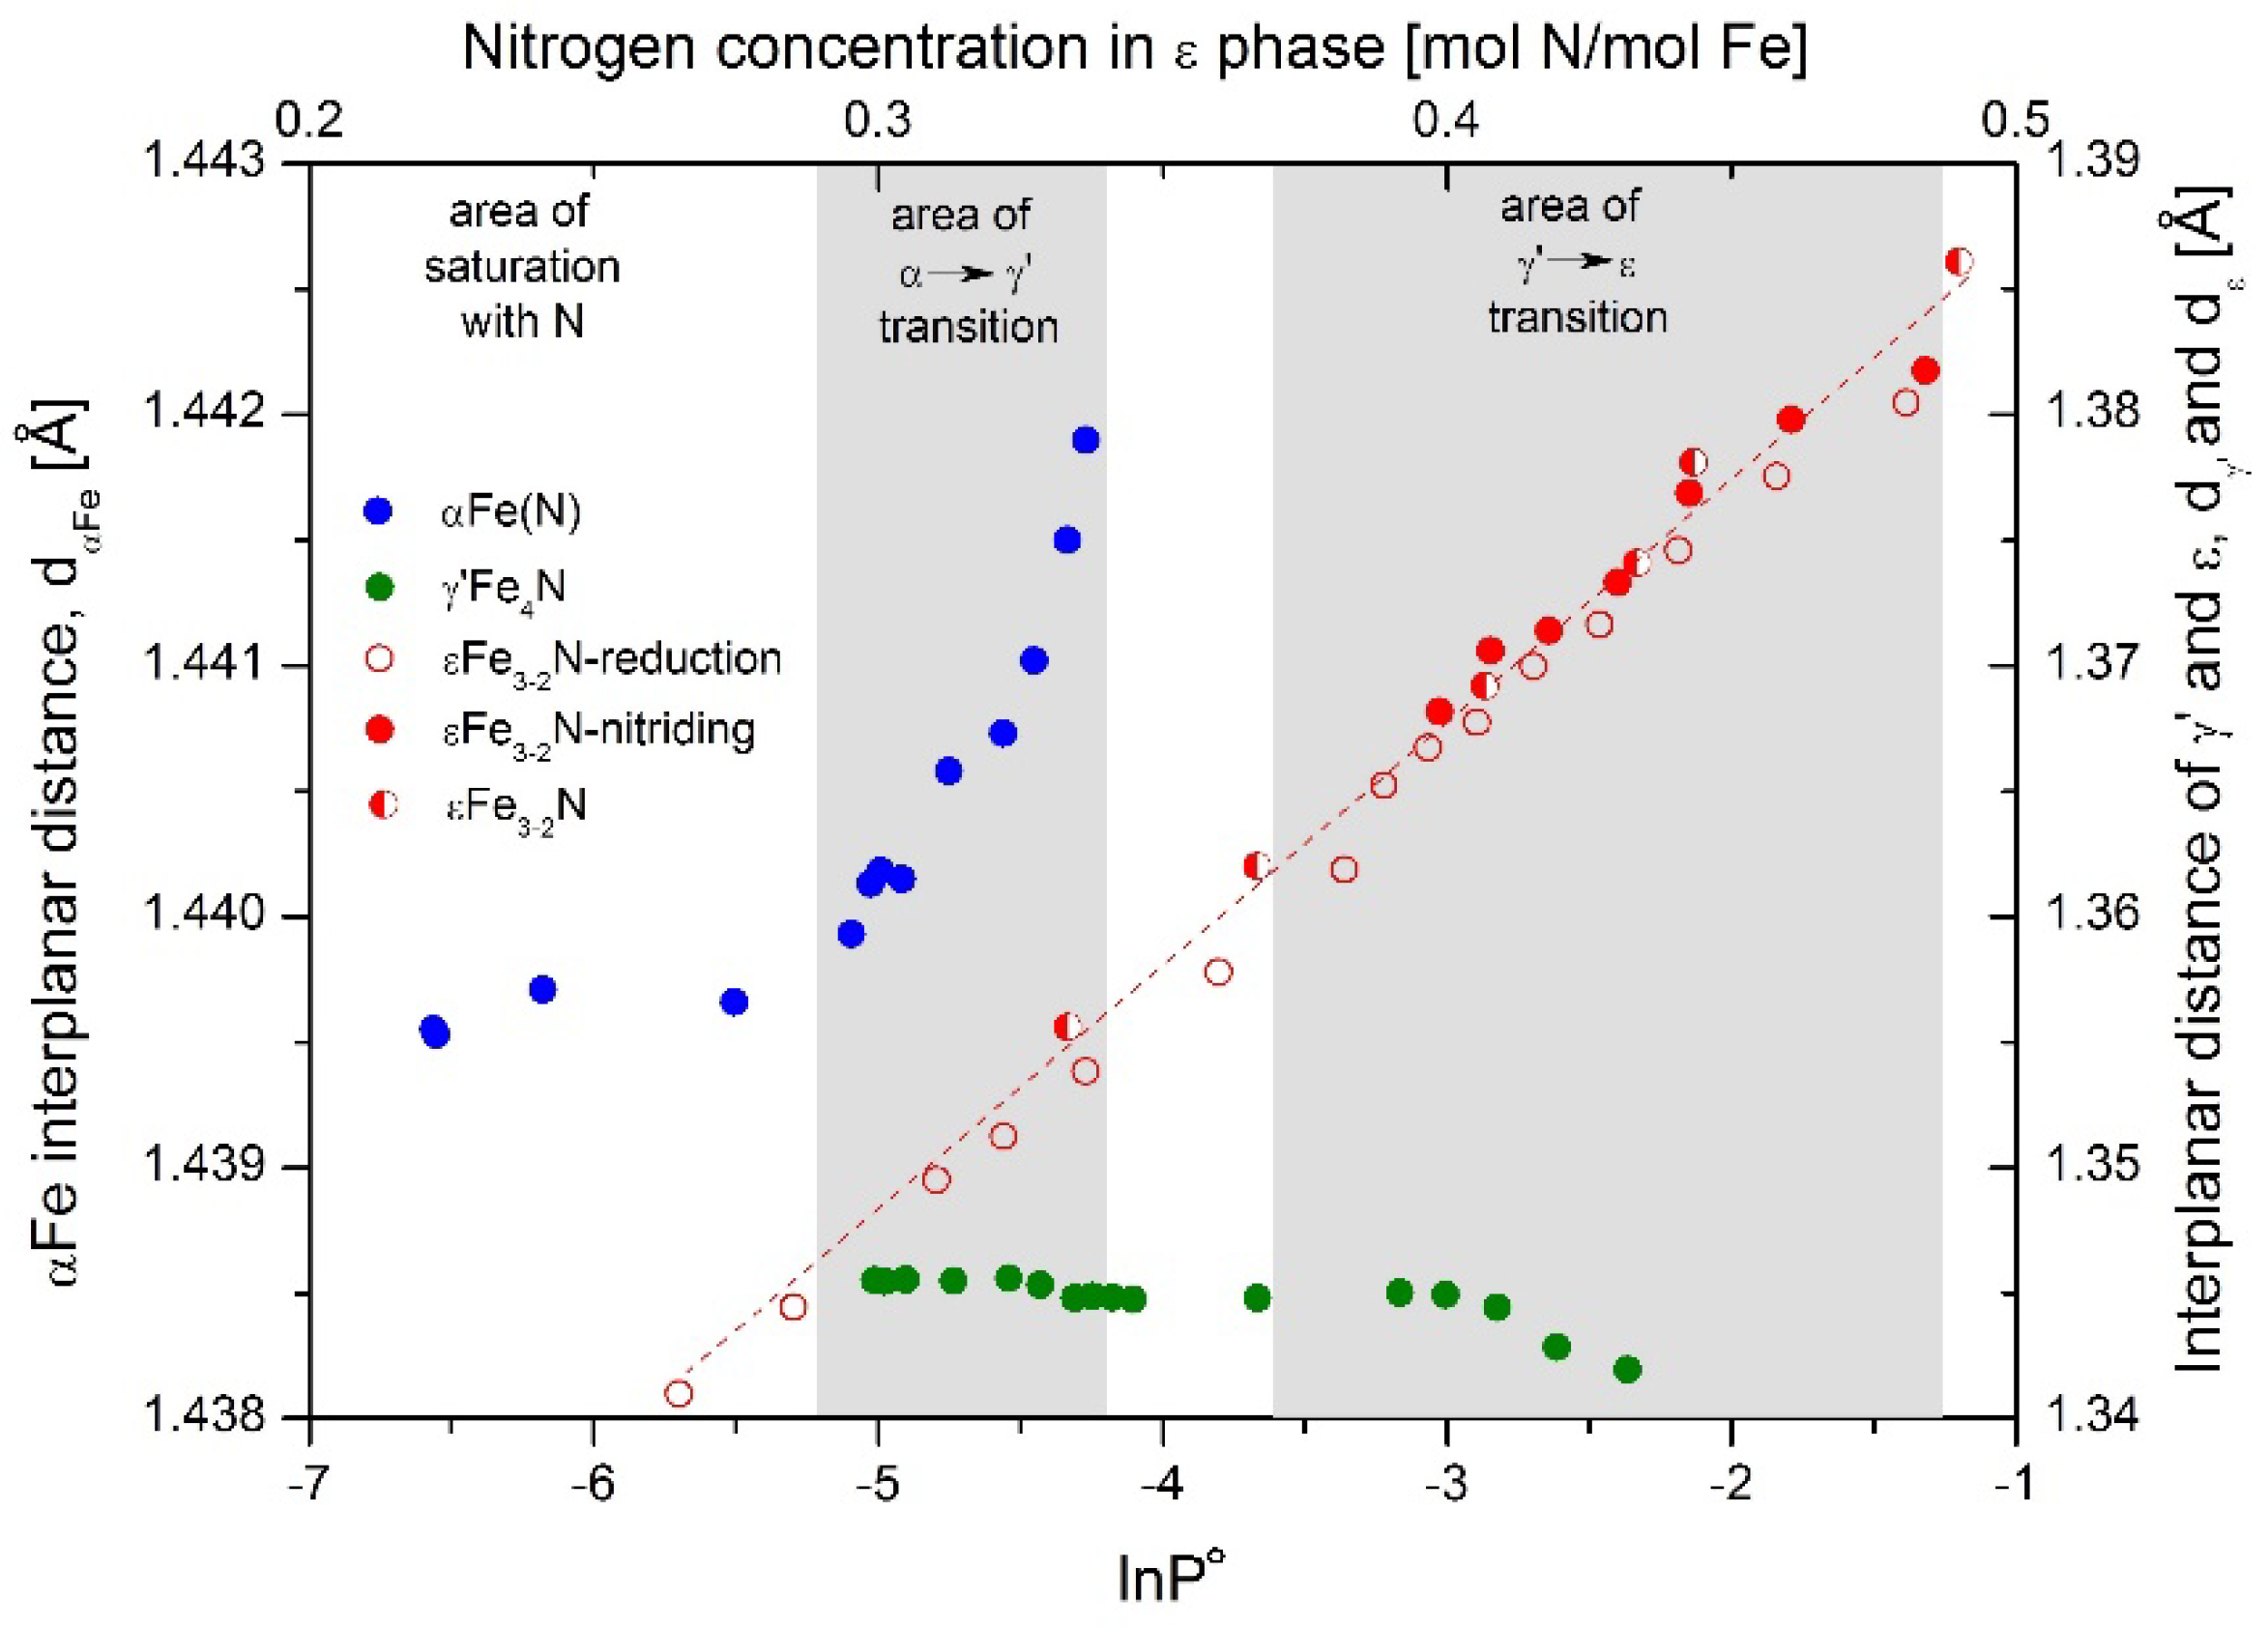
Figure 1h) in extreme cases. Based on this shift, the interplanar distance of ε phase, d
ε, was calculated and shown as the dependence on nitriding potential, red color points in
Figure 2, full markers for the nitriding process and open for reduction. Semi-full markers were dedicated to samples with known concentration of nitrogen in ε phase, used to construct the dependence of interplanar distance on nitrogen concentration. With increasing nitriding potential, ε phase detected with XRD had the same crystallographic structure; however, its interplanar distance, d
ε, increased. Elementary cell size depends on nitrogen concentration in the ε phase, which can change in a wide range between 15 and 33 atomic percent [
34,
35] and increases with increasing interplanar distance. As a result, by knowing the value of the nitriding potential, the chemical composition of ε phase can be estimated.
Interplanar distance of γ′Fe
4N, d
γ′, change slightly, in a small range, as long as the ε phase in the nitriding process is not created. After this. the γ′ interplanar distances decrease with increasing nitriding potential. The nitrogen concentration in this compound has a very narrow range [
34,
36]. This may indicate that the defected structure of the unsaturated solid solution γ′Fe
4N
1-x has a larger interplanar distance than stoichiometric γ′Fe
4N. The other possibility is that at higher values of nitriding potential nitrogen are incorporated into the iron crystal lattice at the nodal gap positions.
αFe interplanar distance, dα, on the nitriding potential is more or less stable, at dα ≈ 1.4397 Ă, in the region of αFe(N) presence. When the α→γ′ phase transition occurs, it then increases to dα ≈ 1.4419 Ă with increasing nitriding potential until the α phase is exhausted. Having in mind that nanocrystallites react in the order from the biggest to the smallest, the conclusion can be drawn that dα depends proportionally on nanocrystallite size.
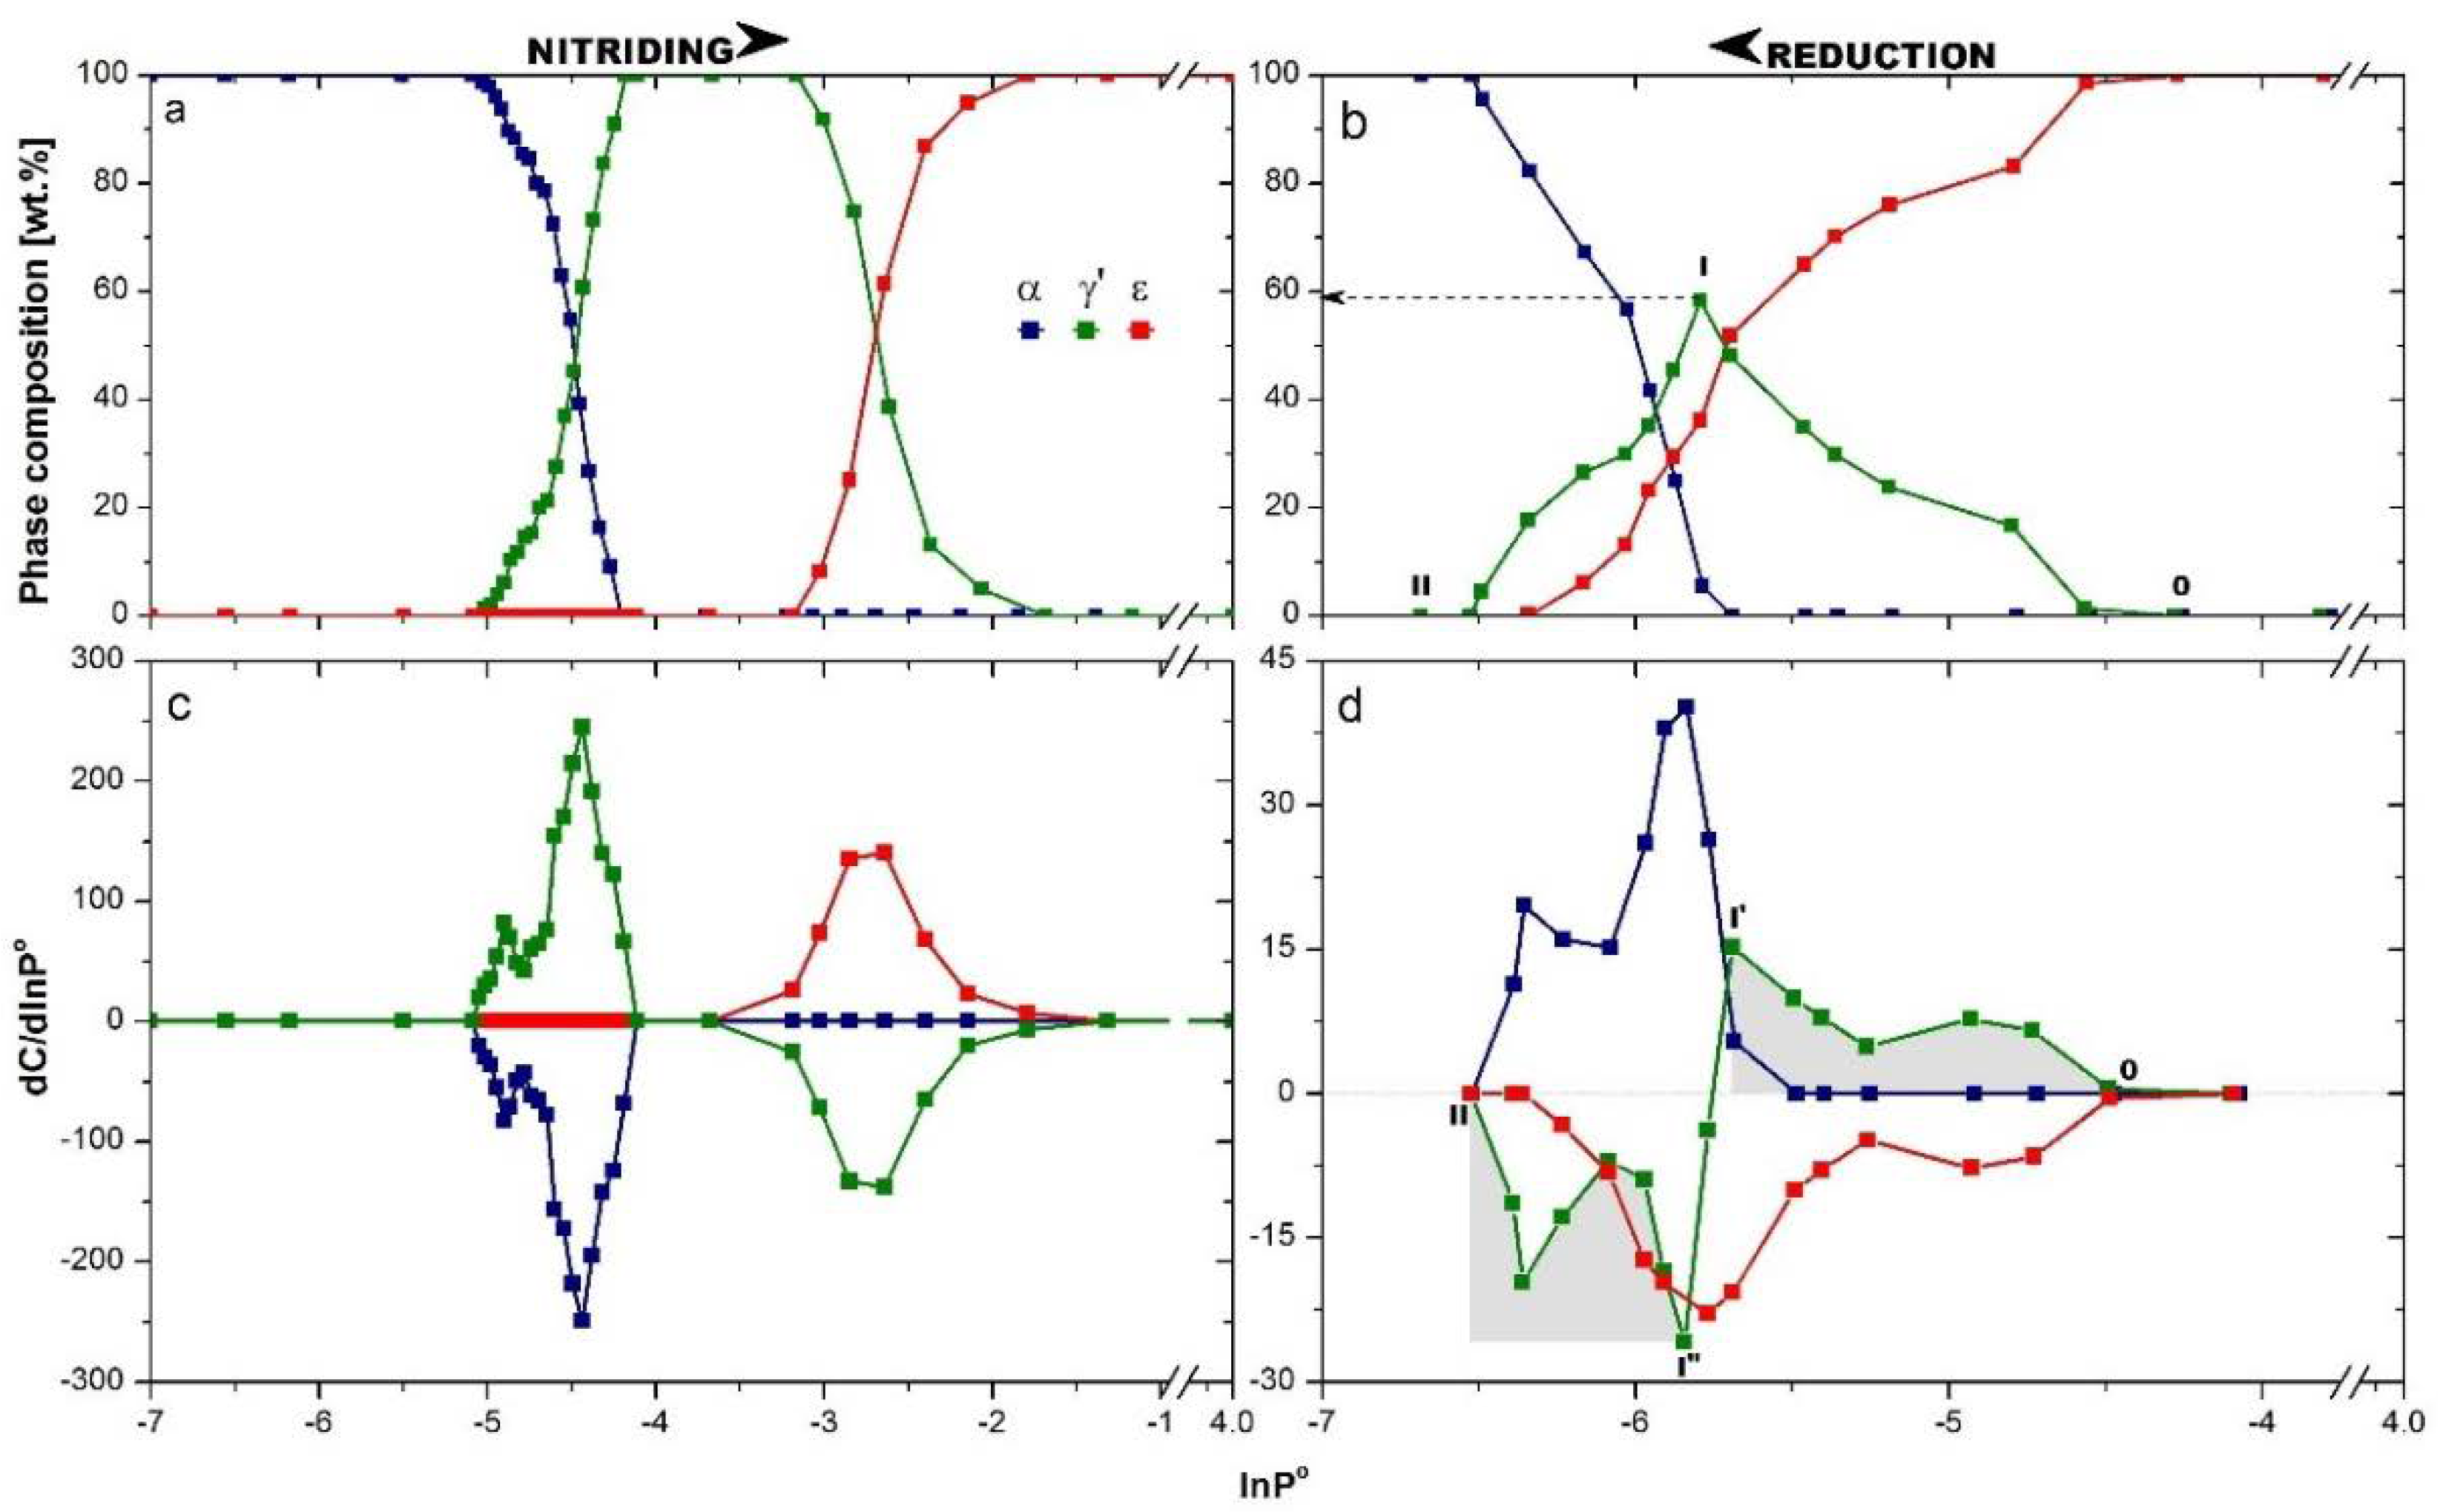
Two series of diffractograms, collected during nitriding (with increasing nitriding potential) and opposite process of reduction (with decreasing nitriding potential), were used to create the dependence of the phase composition on the nitriding potential taking into account the direction of reaction, which is shown in
Figure 3. Nitriding potential ranges, in which the given phase was present, were different for the nitriding (
Figure 3a) and reduction (
Figure 3b) processes, and this phenomenon was observed for all phases in the system of ncFe/NH
3/H
2. The curves of composition changing of phases during nitriding and reduction processes were differentiated, as seen in
Figure 3c,d, respectively. This enabled one to observe the change of phase occurring at the given nitriding potential of the gas phase in the reactor, namely dC/dlnP
o.
During nitriding, firstly the nitrogen dissolved in an αFe crystal lattice and a solid solution of αFe(N) was created. Further increasing the nitriding potential led to the crystallographic transformation αFe(N)→γ′, which started from the largest nanocrystallites of αFe(N), when lnP° ≈ −5.1. When all nanocrystallites of αFe(N) went into γ′ and first transformation was completely finished, transformation γ′→ε started at lnP° ≈ −3.2. During the reduction process (
Figure 3b), the concentration of nitrogen decreased in all the ε nanocrystalllites in terms of nitriding potential changing from lnP° = −1.5 to −4.25. In this region of nitriding potential, there was an impoverishment of the εFe
3-2N supersaturated solid solution to the stoichiometric iron nitride εFe
3N. The ε phase started to reduce to γ′ at lnP° ≈ −4.3, and the content of the ε phase was lowered consequently. The γ′ phase signal rose (pts OI), but only to lnP°= −5.75, where it reached the maximum at a value close to 60% of phase composition (pt I). Next it decreased (pts III), and the γ′ phase was reduced. At the same value of nitriding potential, lnP° = −5.75, the α phase appeared, and its content increased disproportionately with decreasing content of γ′ or ε phase, but proportionally to their sum. If so, not all the ε crystallites were changed to γ′, but part of them were converted directly to α. In the range of nitriding potential changing from lnP°= −5.75 to −6.5, the reduction of γ′→α and ε→α took place simultaneously as parallel phenomena. A three-phase system was observed to lnP° = −6.3. At this nitriding potential, the system contained an α phase (as a solid solution with nitrogen) with ca. 20% of the γ′ phase left. As a result of further decreasing of the nitriding potential, crystallites of γ′ (resulting from ε reduction) were subject to further reduction to α.
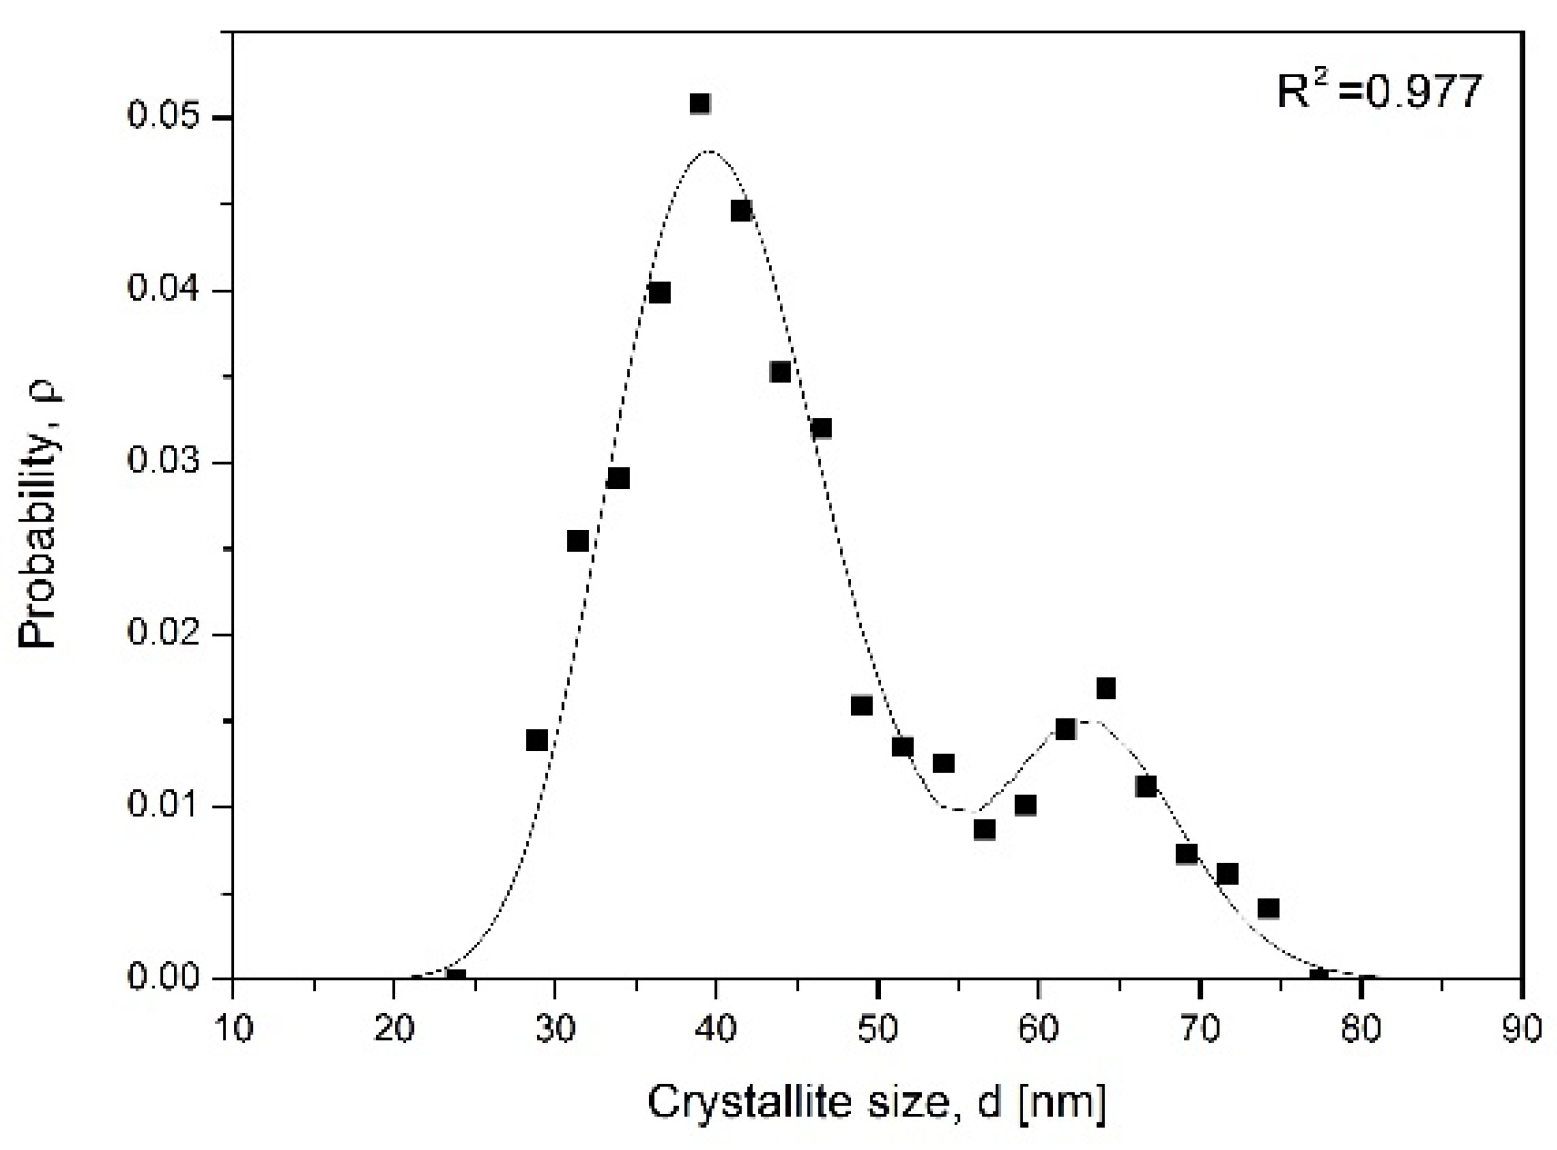
To prove the hypothesis that nanocrystallite size has a proportional effect on αFe interplanar distance, d
α = f(D), theoretical simulation was performed. Assuming that the transformation involved compounds with stoichiometric composition, nc-αFe crystallite size distribution (nCSD) according to its content in the sample (sample phase composition) was created (
Figure 4) based on data from
Figure 3c (according to the method for nCSD determination shown in [
32,
33]). After differentiating the dependence of C = f(lnP°) on the nitriding potential of the gas phase, the dC/dlnP° relationship was obtained with two local maxima and a characteristic course, corresponding to the relative size distribution of iron nanocrystallites according to their mass. It was described by the sum of two Gaussian functions. To convert the relative size distribution of nanocrystallites into absolute distribution, nCSD, according to their size, the sample characteristic parameters, such as the average nanocrystallite size D
av = 45 nm (XRD), minimum D
min = 20 nm and maximum D
max = 80 nm (TEM), and the specific surface area of the iron catalyst sample S
sp = 12 m
2/g (BET) determined by other methods were used. In addition, the assumption of the spherical shape of nanocrystallites was made. The nCSD was presented in a normalized manner, i.e., the area limited by the distribution function was equal to one. The obtained model values of D
av ≈ 49 nm and S
sp ≈ 14 m
2/g were in good correlation with the real values. The obtained nCSD was comparable with results of former studies on nitriding process in a system of ncFe/NH
3/H
2 performed at 350 °C in the region of α→γ′ transformation [
25]. nCSDs obtained with the CPPR method coupled with two different measurement techniques, TG and XRD, were compared [
33]. The differences observed in curves courses were an effect of differences between the chemical composition of the sample and its phase composition under the conditions of the crystallographic change. Moreover, every sample was a system of many nanocrystallites described with statistical distribution, which made it unique in particular, but the average materials parameters were preserved.
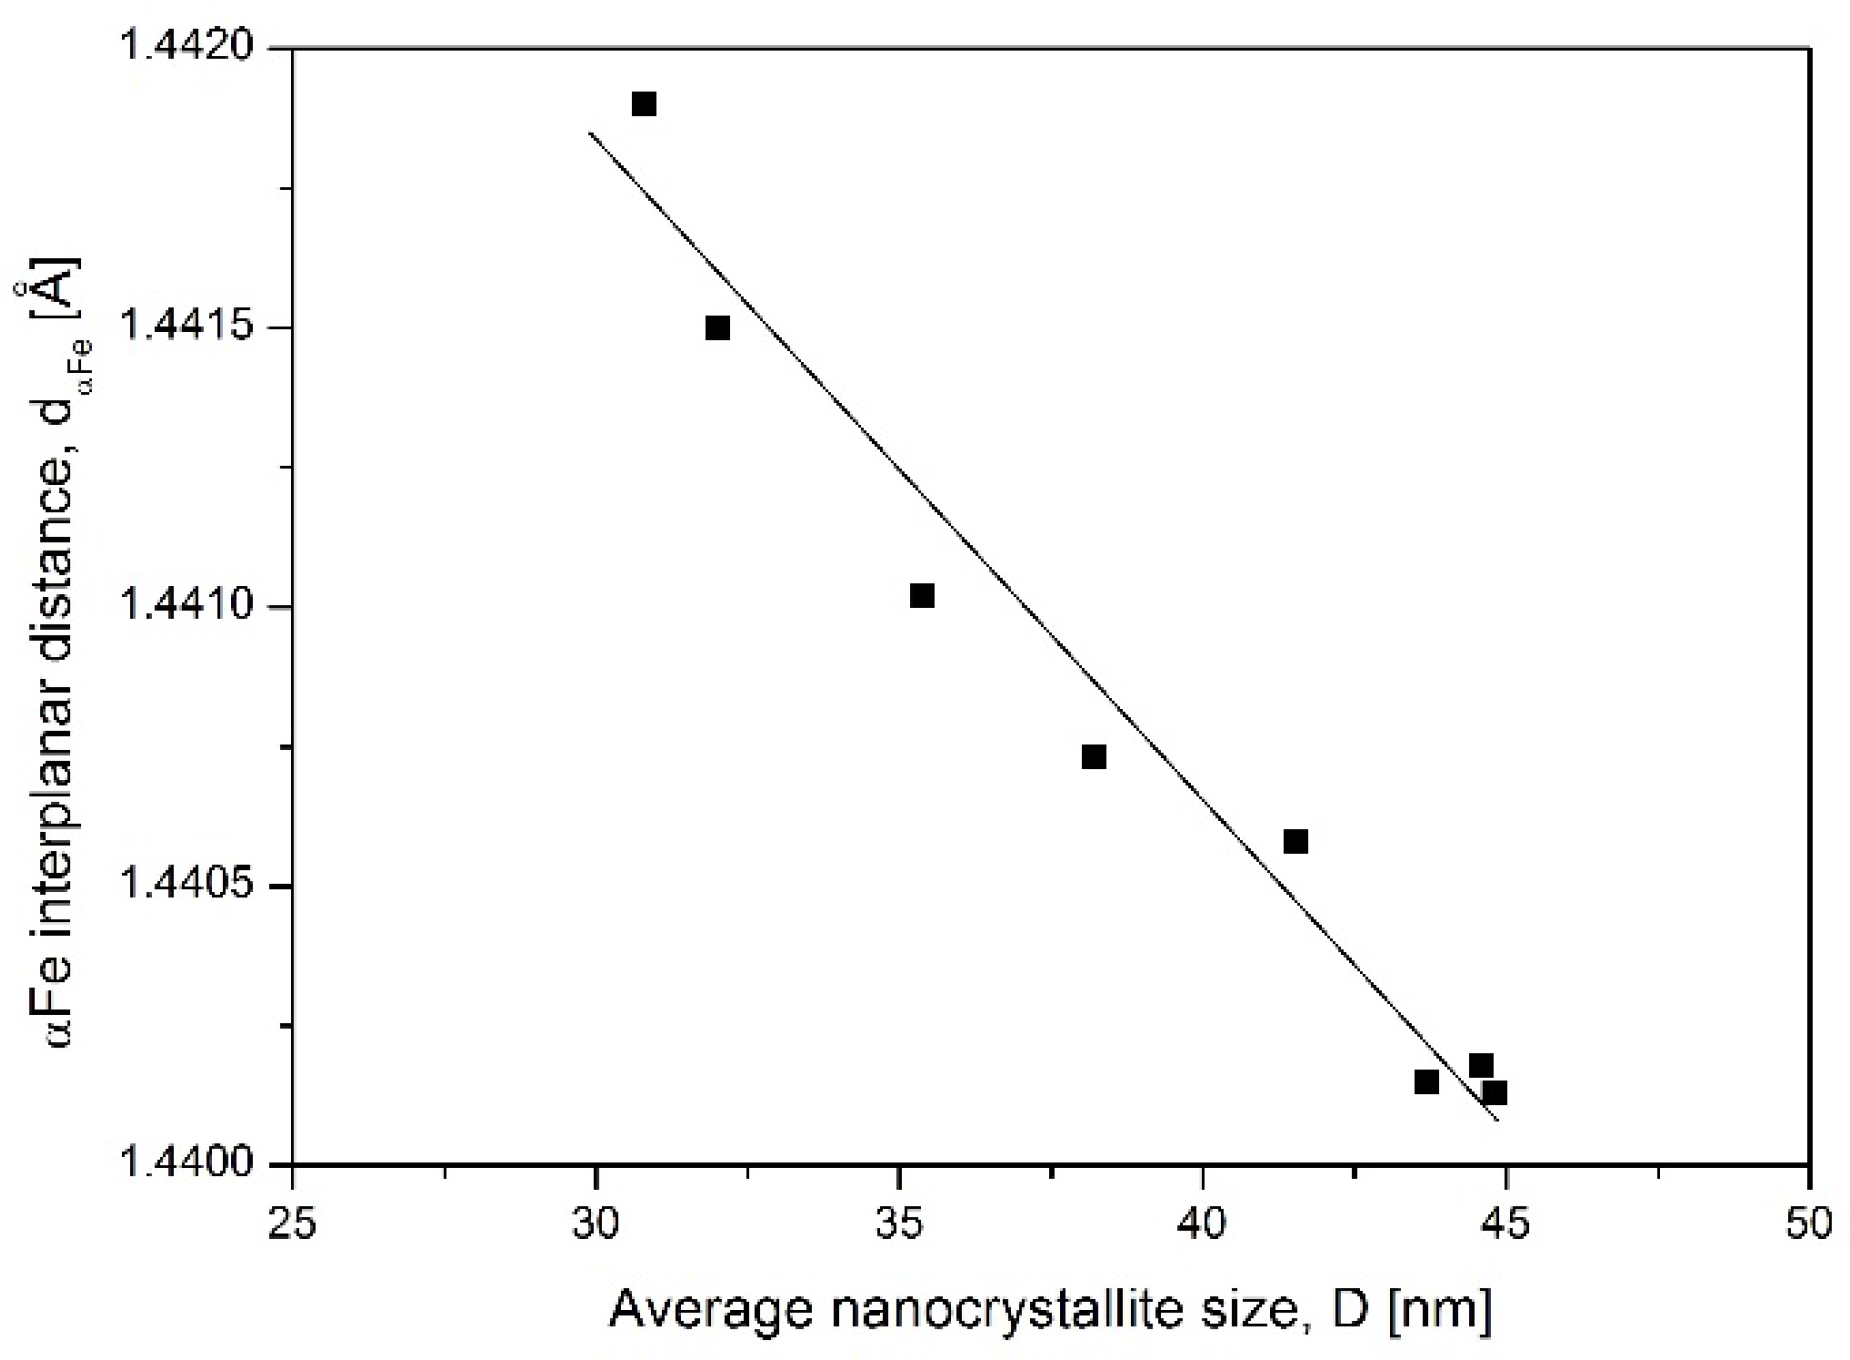
The system of nanocrystallites described with crystallite size distribution shown in
Figure 4 had an average crystallite size of 45 nm. By exclusion, out from the simulation the biggest crystallites, which already transformed to the γ′ phase, the average crystallite size was recalculated and next correlated with experimentally obtained αFe interplanar distances. A summary of this data is shown in
Figure 5 as αFe interplanar distance dependence on the average crystallite size. The graph proves that small crystallites have larger interplanar distance.
Having in mind that α phase crystallites transform to γ′ in the order from the largest to the smallest one, then the d
α increase visible in
Figure 2 is the direct effect of nanocrystallites size.
The curve of ε phase change during reduction in
Figure 3d was used to perform distribution of crystallite sizes by their volume, as shown in
Figure 6a. For this purpose, the procedure for nCSD determination was implemented one more time [
32,
33], but this time, the sizes of nanocrystallites were expressed as volume, which were 4000 and 270,000 nm
3 for crystallites with diameters 20 and 80 nm, respectively. The originally determined quantity was the mass of crystallites, after taking into account the material density and volume, which was the closest derivative of the measured quantity and somehow related to the ratio of surface to volume, which is crucial parameter for nanomaterials. Crystallite size, D, is the value calculated assuming the shape (and S/V in the same moment too) of the crystallites. Therefore, certain assumptions must be made that may generate additional errors. However, to compare the model data (obtained from nCSDs) with the values obtained from XRD measurements (mean crystallite size), we also presented the nCSD depending on the crystallite size. The amounts of individual fractions were chosen so that at given range of crystallites sizes, the area under the curve nCSD = f(V) was equal to unity. Subsequently, the probability of a particular fraction of crystallites in the sample and their size distribution were determined. The nCSD of the ε phase undergoing transformation during the reduction process was described by the sum of two normal distributions with the following Gaussian distribution parameters: expected value (mean volume of nanocrystallites) with standard deviation
.
Figure 6a shows the correlation of ε phase nanocrystallite size with nitriding potential at which the particular fraction undergoes the crystallographic transformation.
γ′ nanocrystallites appeared in the system in the order from the largest to the smallest, reflecting the nCSD of ε phase nanocrystallites in the range of nitriding potential from lnP° = −4.25 to −5.75, shown as the grey area under pts OI′ in
Figure 3d. At this point, the question is, which phase, ε or γ′, begins to reduce first when at lnP° = −5.75 the system contains 5% of α phase. The answer is found by the comparison of curve courses of γ′ phase in the positive and negative regions of the dependence dC/dlnP° on nitriding potential, shown as the grey areas under pts OI’ vs. I”II in
Figure 3d. The course of the line defining the emerging γ′ phase is the same as the course of the line characterizing the decreasing of this phase in the system. Thus, nanocrystallites of the γ′ phase started to decrease at a lower value of nitriding potential than what the α phase had begun to be seen and had to be created from the ε phase indirectly (
Figure 3d). This is in line with previous results performed at 350 °C, where the direct comparison of γ′ vs. ε phase reduction was made. The γ′ nanocrystallites started to reduce at the same point of nitriding potential, regardless of whether the primary γ′ phase or the resulting (from ε) γ′ phase was reduced [
16].
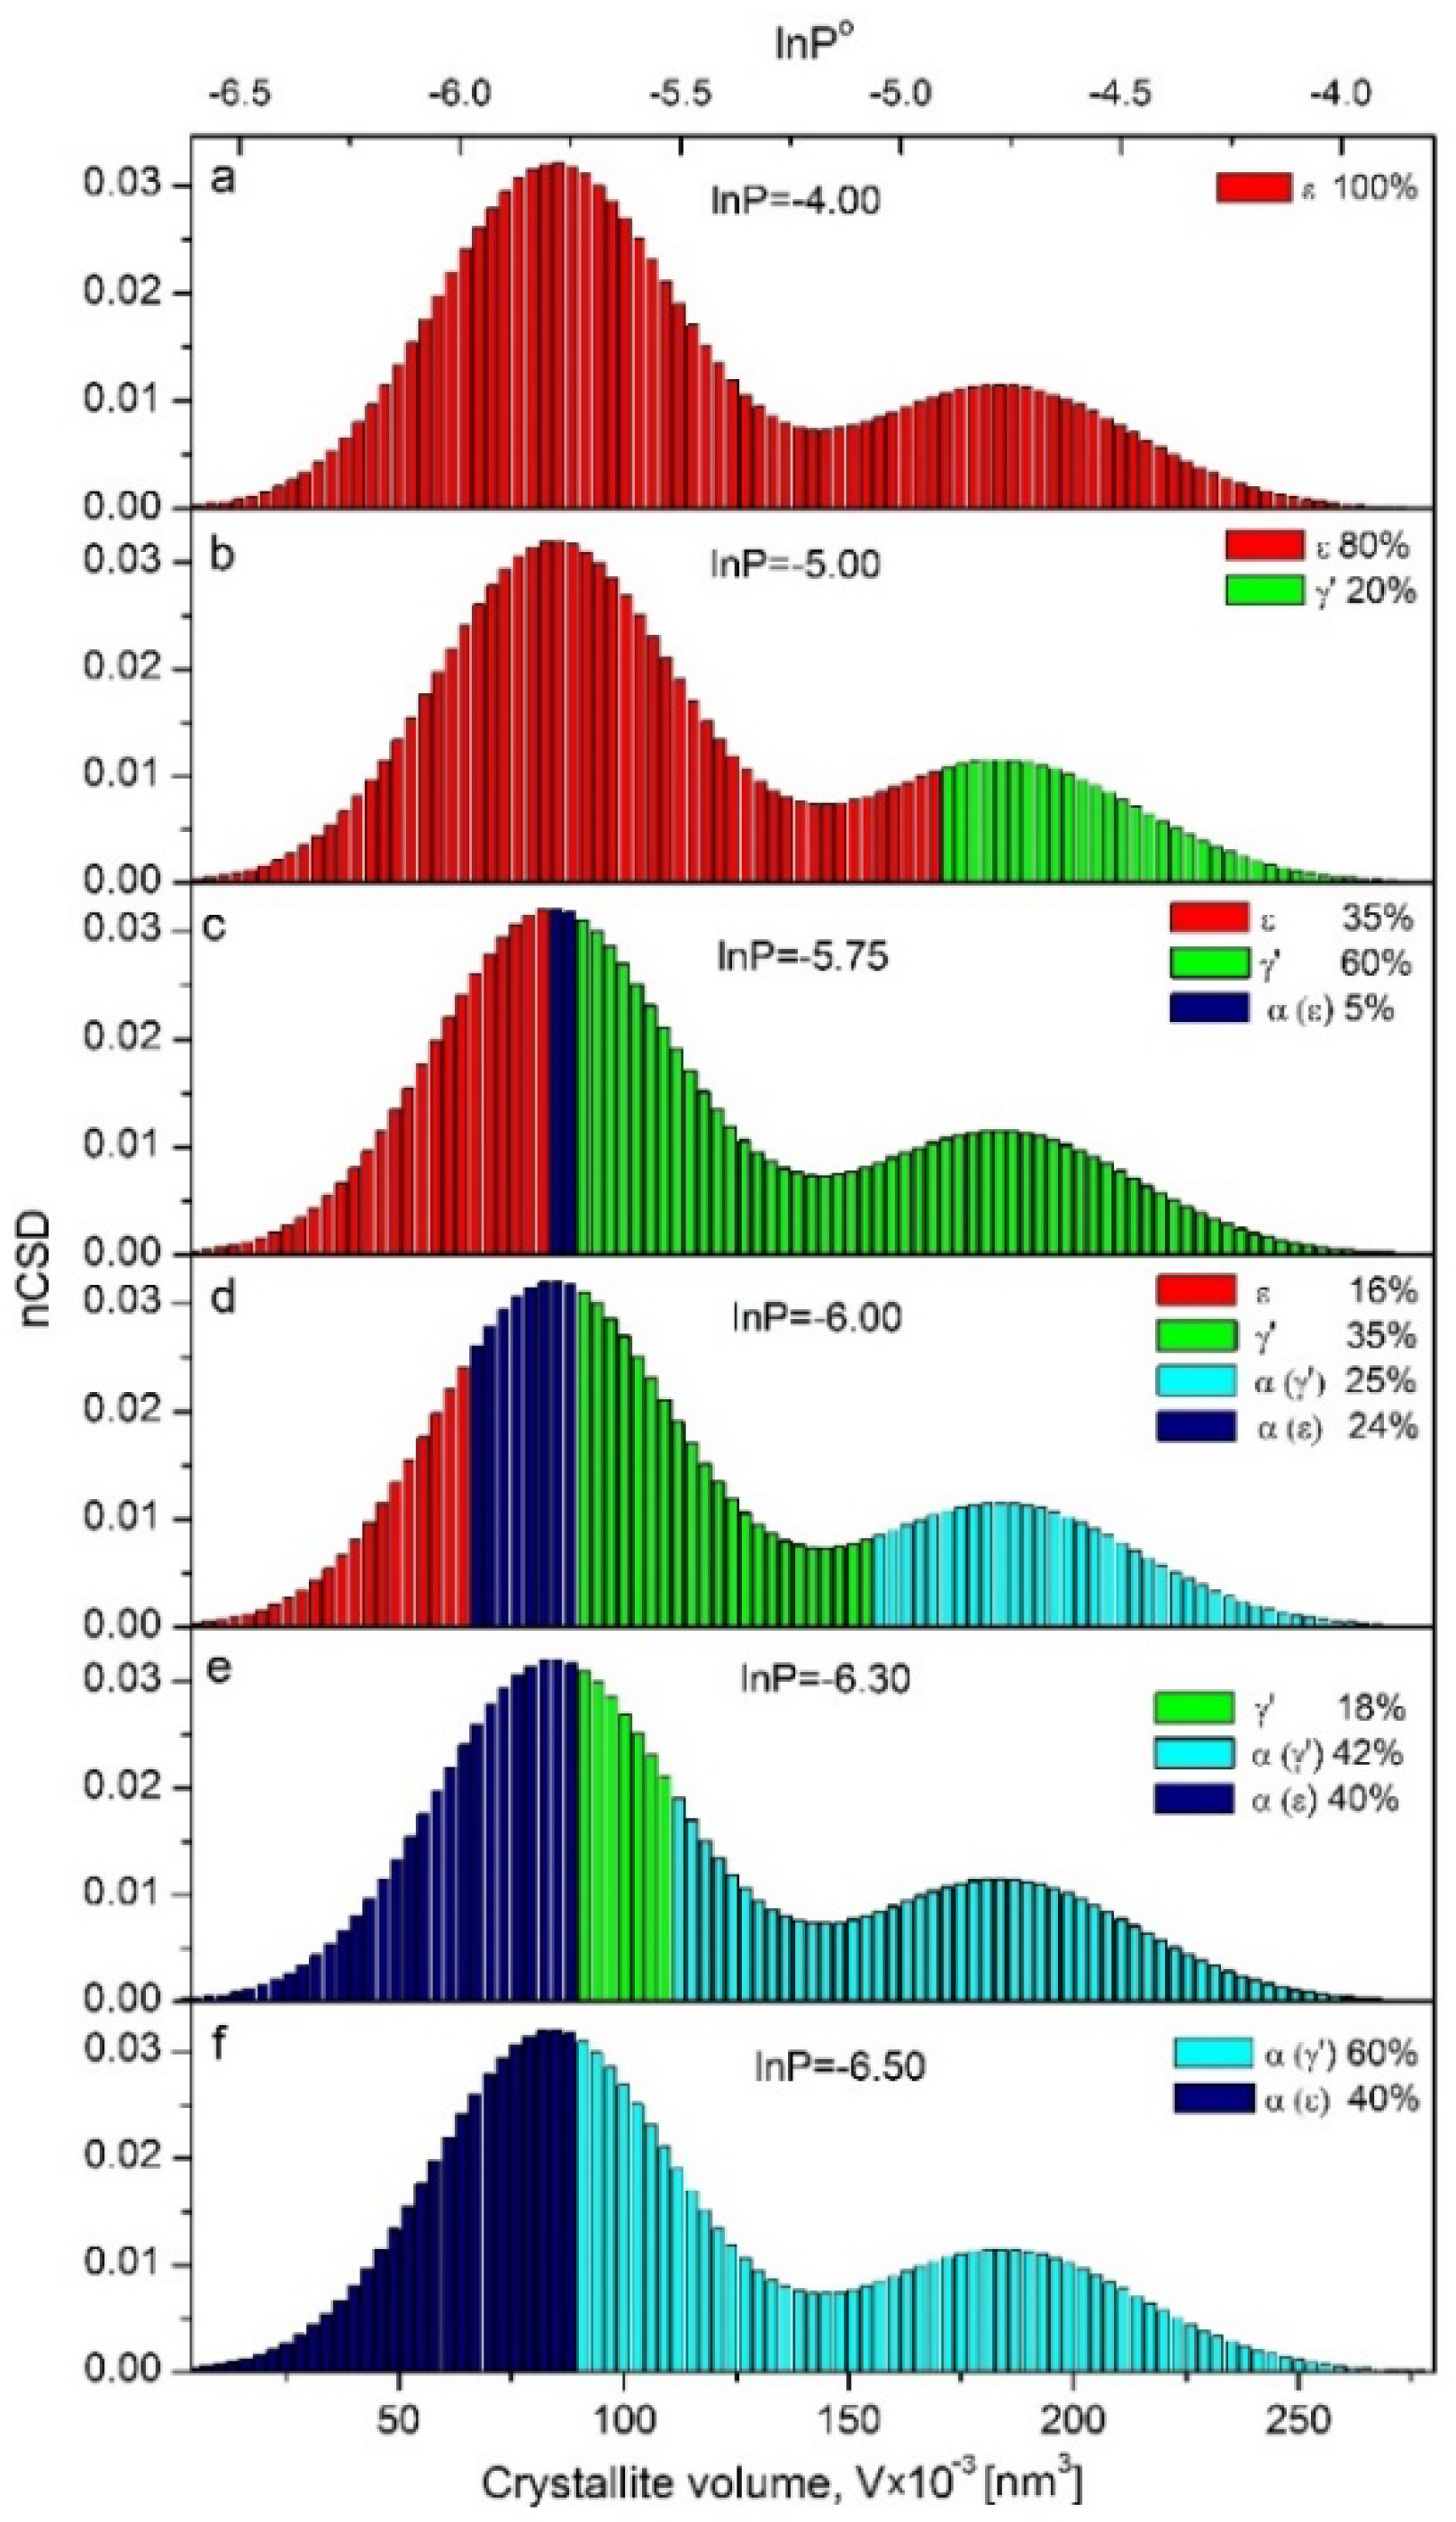
Qualitative changes of nCSD at selected stages of the reduction process are shown in
Figure 6a–f. With decreasing nitriding potential, the front of the crystallographic transformation shifted in the direction from the largest to the smallest crystallites. In nitriding potential lnP° = −5.00 (
Figure 6b), the system consisted of 80% of the phase ε with nanocrystallite volume ranging from 4000 to 172,000 nm
3 and 20%-γ′, where nanocrystallite volume size ranged from 172,000 to 277,000 nm
3. In nitriding potential lnP° = −5.75 (
Figure 6c), the system consisted of ε, γ′ and α phase in an amount of 35, 60 and 5%, respectively. Nanocrystallites with volume sizes below 85,000 nm
3 stayed still in the ε phase, those equal and larger than 90,000 nm
3 entered the γ′ phase, and nanocrystallites with sizes between 85,000 and 90,000 nm
3 underwent ε→α transformation already. Further decreases of nitriding potential caused the nanocrystallites from the remaining ε phase to reduce to α, but the largest nanocrystallites of γ′ started to reduce to α as well. As a result of these processes, at lnP° = −6 (
Figure 6d), the system took the form of a nanocomposite consisting of α nanocrystallites with sizes V > 154,000 nm
3 (coming from indirect reduction ε→γ′→α) and 66,000 < V < 89,000 nm
3 (coming from direct reduction ε→α), γ′ nanocrystallites with volumes 89,000 < V < 154,000 nm
3 and the rest ε nanocrystallites with volumes V < 66,000 nm
3. In the last but single stage of reduction process at lnP° = −6.3, the system contained 18 wt.% of γ′ phase (
Figure 3b) with a fraction of nanocrystallites left, 66,000 < V < 84,000 nm
3 (
Figure 6e).
Summarizing, one can designate the limit volume of nanocrystallites as V < 90,000 nm3, which undergo the direct transformation ε→αFe(N) and V > 90,000 nm3, which transform to αFe(N) with the intermediate step of γ′ formation as a result of ε→γ′→α transformations.
The tested samples were a statistical set of nanocrystallites described by their size distribution. The nCSD was obtained for a sample composed of one phase (either substrate or product). Specifying nCSDs for mixed phase samples may lead to incorrect results. The research showed that this distribution was bimodal [
30,
32,
33,
37]. According to the models of the reaction of a nanocrystalline substance with the gas phase, depending on whether the reaction is carried out in the kinetic region or in states close to equilibrium, nanocrystallites undergo a phase change in their entire volume in order of their mass/volume/size (nanocrystallites do not change all at once or in some random order), stated beyond reasonable doubt. In the first model, the smallest nanocrystallites changed at the beginning, and finally, the largest ones, i.e., the ratio of the nanocrystallite surface, S, to its volume, V (the higher the S/V, the earlier the nanocrystallite will undergo a phase change) [
28,
29]. This means that the mean nanocrystallite size of the product will be the smallest at the start of the reaction and will increase as the reaction progresses. This does not mean, however, that the nanocrystallite size distribution of the entire sample changes. The recorded mean sizes of the product nanocrystallites were assigned only to those fractions of nanocrystallites of the sample which underwent the substrate–product phase change under given conditions. In the second model, the order in which nanocrystallites change is reversed, because in states close to equilibrium, the order of nanocrystallites is determined by energy considerations (the largest nanocrystallites undergo a phase change at the lowest potentials of the gas phase, i.e., at the lowest energies supplied to the reaction) [
27,
31]. This means that the average size of the product nanocrystallites at the beginning of the transformation will be the largest. To sum up, nanocrystallites undergo phase changes in fractions according to their size, and the average size of nanocrystallites of individual phases (substrate/product) after the phase change of individual fractions may change with the progress of the reaction, but the total size distribution (for a sample consisting of 100% of one phase) is practically unchanged (nitriding–reduction reaction cycles: the average size of nanocrystallites is constant) [
20,
38].
Learning the order of the processes occurring in the system during reduction process permitted us to state that only the curve of the ε phase can be used for drawing nCSDs. The courses of γ′ and α phase changing shown in
Figure 3d cannot be considered as shapes potentially used for creation of nCSDs. Signals related with α phase come from two sources as a result of reducing two phases of different nanocrystallite sizes, which is why in the final stage of the reduction, the dC/dlnP° coming from α phase decreased very sharply, when it was not the smallest nanocrystallites, ca. 20–25 nm, from the system that underwent the transformation, but those with the sizes of 50–60 nm. This phenomenon is also seen in
Figure 2, where the interplanar distance, d
α, increases in the region of lnP° = −4.27—−5.03. Nanocrystallites with sizes of 50–60 nm have smaller d
α than those with ca. 20–25 nm fractions, according to
Figure 5.
The comparison of data on size distribution of crystallites relative to their volume (
Figure 6) with their stability during the reduction process (
Figure 1) allows us to correlate the specific crystallite size of a given phase with the nitriding potential at which they react with the gas phase. Using this, for the concrete value of nitriding potential, one can specify the phase composition of Fe/N nanocomposite and, using
Figure 2, the concentration of nitrogen in the ε phase.
3. Materials and Methods
The study was performed using nanocrystalline iron containing hardly reducible oxides of aluminum (3.3 wt%), calcium (2.8) and potassium (0.65), determined with the ICP-OES method (Optima, Perkin Elmer, Waltham, MA, USA), which was obtained using the alloy method [
5,
39]. It was produced by fusing of magnetite ore with some additives (compounds of aluminum, calcium and potassium) followed by reduction of the obtained oxidized alloy. Finally, metallic nanocrystalline iron promoted with hardly reducible oxides was formed. Specific surface area determined with the BET method (AutoChem II 2920, Micromeritrics, Norcross, GA, USA) was 12 m
2/g. The preparation and characteristic were described in detail elsewhere [
37]. The average crystallite size determined with the Rietveld method via XRD measurements was 45 nm.
The process of nanocrystalline iron nitriding and reduction of the obtained nanocrystalline iron nitrides were studied by the chemical potential programmed reaction (CPPR) method at 375 °C. These processes were carried out in a reaction chamber of ca. 1 dm3 in volume (XRK900, Anton Paar, Graz, Austria), in which the powder sample in a quantity of ca. 0.6 g was pressed into a ring holder. The chamber, being a part of the X-ray diffractometer apparatus (Philips X’Pert Cu anode and X’Pert High Score Plus program, Amsterdam, Netherlands), allowed the in situ measurements of phase composition (ICDD PDF-4 identification database) during the reactions. The time of collecting the diffractogram was ca. 8 min, in the angle range 2θ = 63–72°, with steps of 2θ = 0.02°, where the reflexes from all three phases were observed, namely αFe(200), γ′Fe4N(220) and εFe3-2N(300). The diffractograms were collected continuously during the processes of nitriding and reduction. In order to observe the phase transformations as accurately as possible, it was important that the diffractograms were recorded as quickly as possible. The selection of the angular range of the diffractograms took into account, on the one hand, the possibility of identifying the reflections for all phases present in the process (not coinciding with the pure phases) and their proximity to each other. Raw data were then processed using software dedicated for this manner, namely HighScore Plus 3.0, PANalytical (Malvern, UK). The simplified method of Rietveld was implemented, based on the Pseudo Voight function, with 20 iterations, to determine the crystal lattice parameters. Interplanar distances were calculated using Bragg’s equation based on Kα1 length and theta angle position for the chosen reflex of the phase of interest, determined via Rietveld method matching. In earlier studies (based on the reflex from αFe(200)) we determined the standard deviation for measurements at the level of 2.5%.
The reactor was supplied with gases hydrogen and ammonia (5.0 pure) through a system of electronic flowmeters for dosing in a strictly controlled manner, and equipped with a hydrogen analyzer. Gas mixtures of various composition were created before they reached the reactor. The inlet stream of gas was divided and fed into the chamber in five places. The performed curves of gas leaching showed that more than 95% of the reaction volume was replaced with gases in a time shorter than 10 min. The time of setting up the gas phase composition was negligibly small in comparison with the time of the experiment.
Chemical Potential Programmed Reaction Procedure
The sample before the proper process had to be activated by performing the reduction process of the passive layer, which has protective properties. For this purpose, it was heated to the temperature of 500 °C in a flow of pure hydrogen (50 cm3/min) for 3 h.
The CPPR method was implemented by applying a programmatically changed chemical potential of gas mixture introduced into the reactor based on the method description shown in [
21]. Nitriding potential values of the gas mixture at a given moment of the process were calculated from the equation
where
,
represent actual partial pressures of ammonia and hydrogen, respectively, in the gas phase (p
at is atmospheric pressure; x is mole fractions of ammonia and hydrogen, respectively).
The flow of ammonia was constant, V
NH3 = 40 cm
3/min, and the flow of hydrogen was changed in a linear manner, according to the dependence [
21] as follows:
where β
H2 is hydrogen flow acceleration (cm
3/min
2), β
H2 = −0.1 for the nitriding process, β
H2 = 0.1 for the reduction process; V
0H2 = 50 cm
3/min—the initial flow of hydrogen; and t is process time (min).
Therefore, gas phase composition changes and when expressed as a hydrogen mole fraction can be described by the following nonlinear equation [
21]:
The ammonia mole fraction is the complement to a concentration of maximum 1. At the same time, using Equations (3)–(5), the nitriding potential programmatically set over time, P(t), of the ammonia–hydrogen mixture, expressed as a ratio of ammonia and hydrogen partial pressures, was changed following Equation (6) [
21]:
In the area of α→γ′→ε transformations for nitriding and reduction processes, the stationary states are observed. Only narrowly, when the nitriding potential expressed on a logarithmic scale is higher than unity, has the equilibrium state then not been reached.
The phenomenon of ammonia decomposition was omitted in the calculations due to the low temperature of the process, and the small amount of solid state substrate in comparison with the quantity of ammonia in the reaction chamber.


