1. Introduction
Several reviews have highlighted the upcoming challenges and opportunities for combustion in micro-channels [
1,
2], as well as their potential use in niche and distributed applications [
3]. Ensuring the stability of combustion in these small-scale devices remains a significant challenge. Norton and Vlachos [
4] analyzed the stability of the homogeneous combustion of propane in submillimeter channels and observed a rather narrow range of operating conditions in which combustion can be stabilized. In contrast, catalytic combustion has a wider range of operating conditions for stability [
5] and, with its lower operating and light-off temperatures, is the most important area for research in the field of power generation at the micro-scale [
6].
Excess-enthalpy combustion in heat-recirculating micro-reactors is identified as a key strategy to extend the stability of combustion in micro-channels [
7]. Several heat-recirculating geometries have been studied, such as U-bend [
8,
9], symmetric [
10], symmetric with monolith catalyst [
11], serpentine [
12], single-spiral [
13,
14], and Swiss-roll [
15,
16,
17,
18] geometries. The stability of combustion in micro-reactors is often quantified by the critical value of the heat loss coefficient beyond which reaction is unsustainable and/or by the range of inlet operating parameters beyond which the system loses stability via extinction or blowout [
4,
5,
19].
Ever since the work of Norton and Vlachos [
4,
19] and Mantzaras and coworkers [
20,
21], it is well-known that the solid walls of micro-reactors play an important role in determining the stability of micro-combustion, for both catalytic and non-catalytic systems [
22,
23,
24]. Di Sarli [
25] considered the effect of wall thermal conductivity on the stability of a U-bend heat-recirculating micro-combustor and showed that the conductivities of inner and outer walls of the U-bend can be tailored to improve its resistance to extinction and blowout instabilities. The wall physical properties were shown to affect both the ignition and extinction behavior of the U-bend micro-combustor [
26].
The greater surface area-to-volume ratios in micro-channels, while destabilizing for homogeneous combustion, are advantageous for catalytic chemistry due to higher catalyst surface area and higher mass transfer rates [
2,
5,
6]. Di Benedetto and coworkers showed that partial catalyst coating also improves combustion behavior under steady-state [
27,
28,
29] as well as transient start-up [
30] conditions. The advantage of partially coating a LaMnO
3 catalyst on the peripheral channels of a catalytic monolith on transient start-up behavior was demonstrated in [
31]. Conversely, the concept of catalyst segmentation, i.e., axially distributing the catalyst into alternating catalytic and non-catalytic segments, has also been investigated [
32,
33,
34,
35]. Micro-reactors with segmented catalyst placement were proposed to promote homogeneous reaction in non-catalytic segments, thereby improving the combustion performance [
32,
34]. Kommu et al. [
36] analyzed the effect of catalyst segmentation on the transient start-up in catalytic micro-burners and showed that a significant reduction in the amount of catalyst can be achieved with only a minor increase in the ignition temperature. Even in the case of purely catalytic reactions, enhanced mass transfer is observed at the boundaries of the catalytic segments, which can be exploited to reduce the amount of catalyst without a significant reduction in the net reaction rate [
37,
38].
The above discussion points towards a growing body of work directed towards selective catalyst placement, either for reducing the amount of catalyst or selectively enhancing or suppressing homogeneous reactions. This work follows up on the work by Di Sarli [
25], who showed that the inner and outer walls of the U-bend heat-recirculating micro-reactor play different roles in determining the resistance of the device towards extinction and blowout. Specifically, two-dimensional computational fluid dynamics (CFD) simulations will be used in this work to determine how the selective catalyst coating of inner and outer walls affects the micro-combustor stability. An analysis of the various phenomena that influence the observations, as well as practical implications for the operation of the U-bend micro-combustor, will be discussed. Although heat recirculation has been widely investigated, the literature on selective catalyst placement in heat-recirculating micro-combustors is relatively sparse and limited to serpentine geometry [
10,
39]. Federici et al. [
10] showed, through CFD simulations, that the optimal catalyst placement is in the central channel, though an analysis of catalyst placement was not presented in their work. More recently, Chen et al. [
39] drew the same conclusion using CFD coupled to detailed hetero-/homogeneous chemistry. Since the extinction in U-bend micro-combustors is mainly ruled by the thermal conductivity of the inner wall, whereas blowout is determined by the thermal conductivity of the outer wall [
25], it remains to be seen how selective catalyst placement and the solid wall properties can both be used as levers to influence the U-bend stability.
The rest of this manuscript is organized as follows. In
Section 2, after presenting the micro-reactor geometry, the key observations and inferences are discussed, focusing on the base case with low wall conductivity (
Subsection 2.1), followed by the effect of higher thermal conductivity walls (
Subsection 2.2). The relative roles of catalytic reactions on the inner and outer walls, as well as homogeneous chemistry, are analyzed for the entire range of operating parameters, and the main practical implications of this work are discussed based on such analysis (
Subsection 2.3). In
Section 3, the CFD model is described. Finally, the conclusions are presented in
Section 4.
2. Results and Discussion
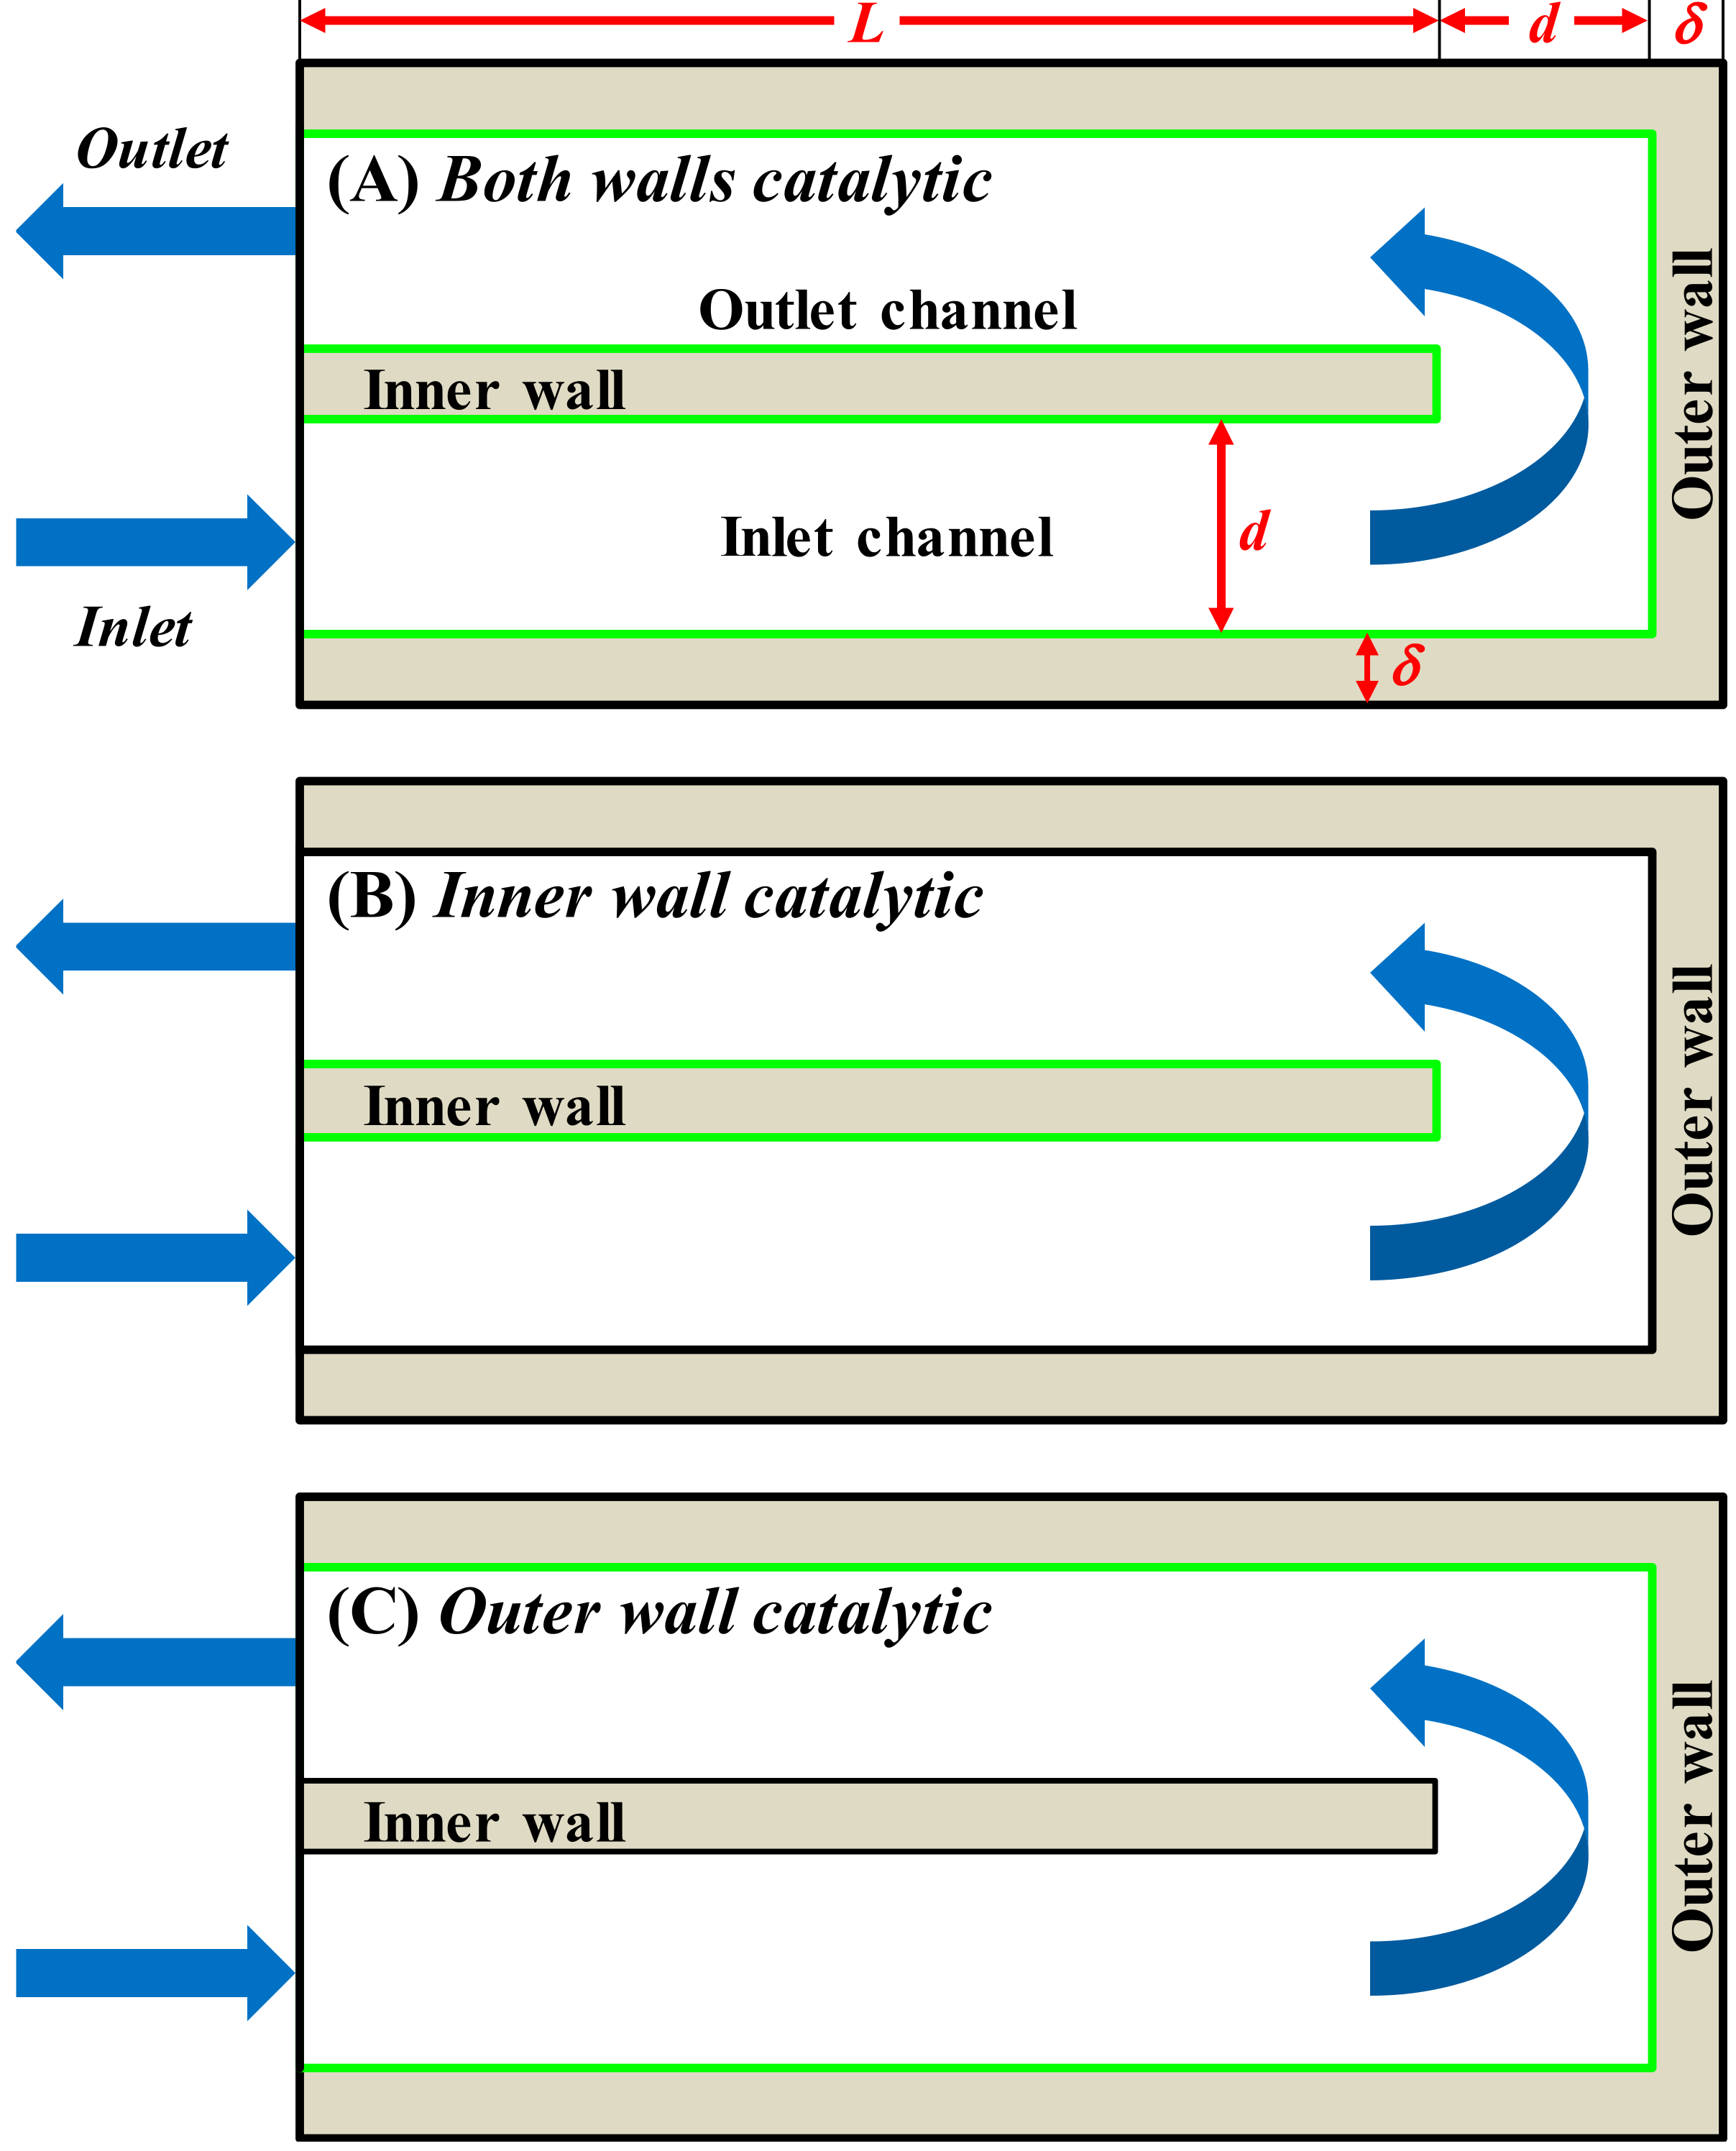
The combined effect of catalyst placement and solid thermal conductivity on the stability of a U-bend catalytic heat-recirculating micro-combustor is assessed in terms of critical inlet gas velocities. The commercial CFD code ANSYS Fluent (release 2020 R1) was used for two-dimensional steady-state simulations of lean premixed propane/air combustion in the three reactor configurations shown in
Figure 1. The green lines denote the catalytic surfaces where the catalytic reaction occurs: (A)
Both walls catalytic, where both the inner and outer walls are catalyst coated; (B)
Inner wall catalytic, where only the inner wall is catalyst coated; and (C)
Outer wall catalytic, where only the outer wall is catalyst coated. We will refer to these as configurations (A), (B), and (C), respectively. Homogeneous combustion takes place in the entire fluid domain.
The solid thermal conductivity was assumed to be constant. For each configuration of
Figure 1, simulations by varying the inlet gas velocity, V
in, were run at two values of solid thermal conductivity, 3 W/(m K) (low thermal conductivity) and 30 W/(m K) (high thermal conductivity). As is better detailed in
Section 3, in all computations, the feed was at 300 K, whereas all the outer surfaces exposed to the surroundings were assumed to lose heat via convection (the convective heat transfer coefficient, h
∞, was set to 10 W/(m
2 K), and the ambient temperature to 300 K).
2.1. Low Thermal Conductivity
The base-case simulations with low thermal conductivity wall material (such as cordierite) are considered first in this subsection. The results obtained for the three configurations of
Figure 1—(A)
Both walls catalytic, (B)
Inner wall catalytic, and (C)
Outer wall catalytic—at a thermal conductivity of 3 W/(m K) are presented and discussed.
2.1.1. Base Cases
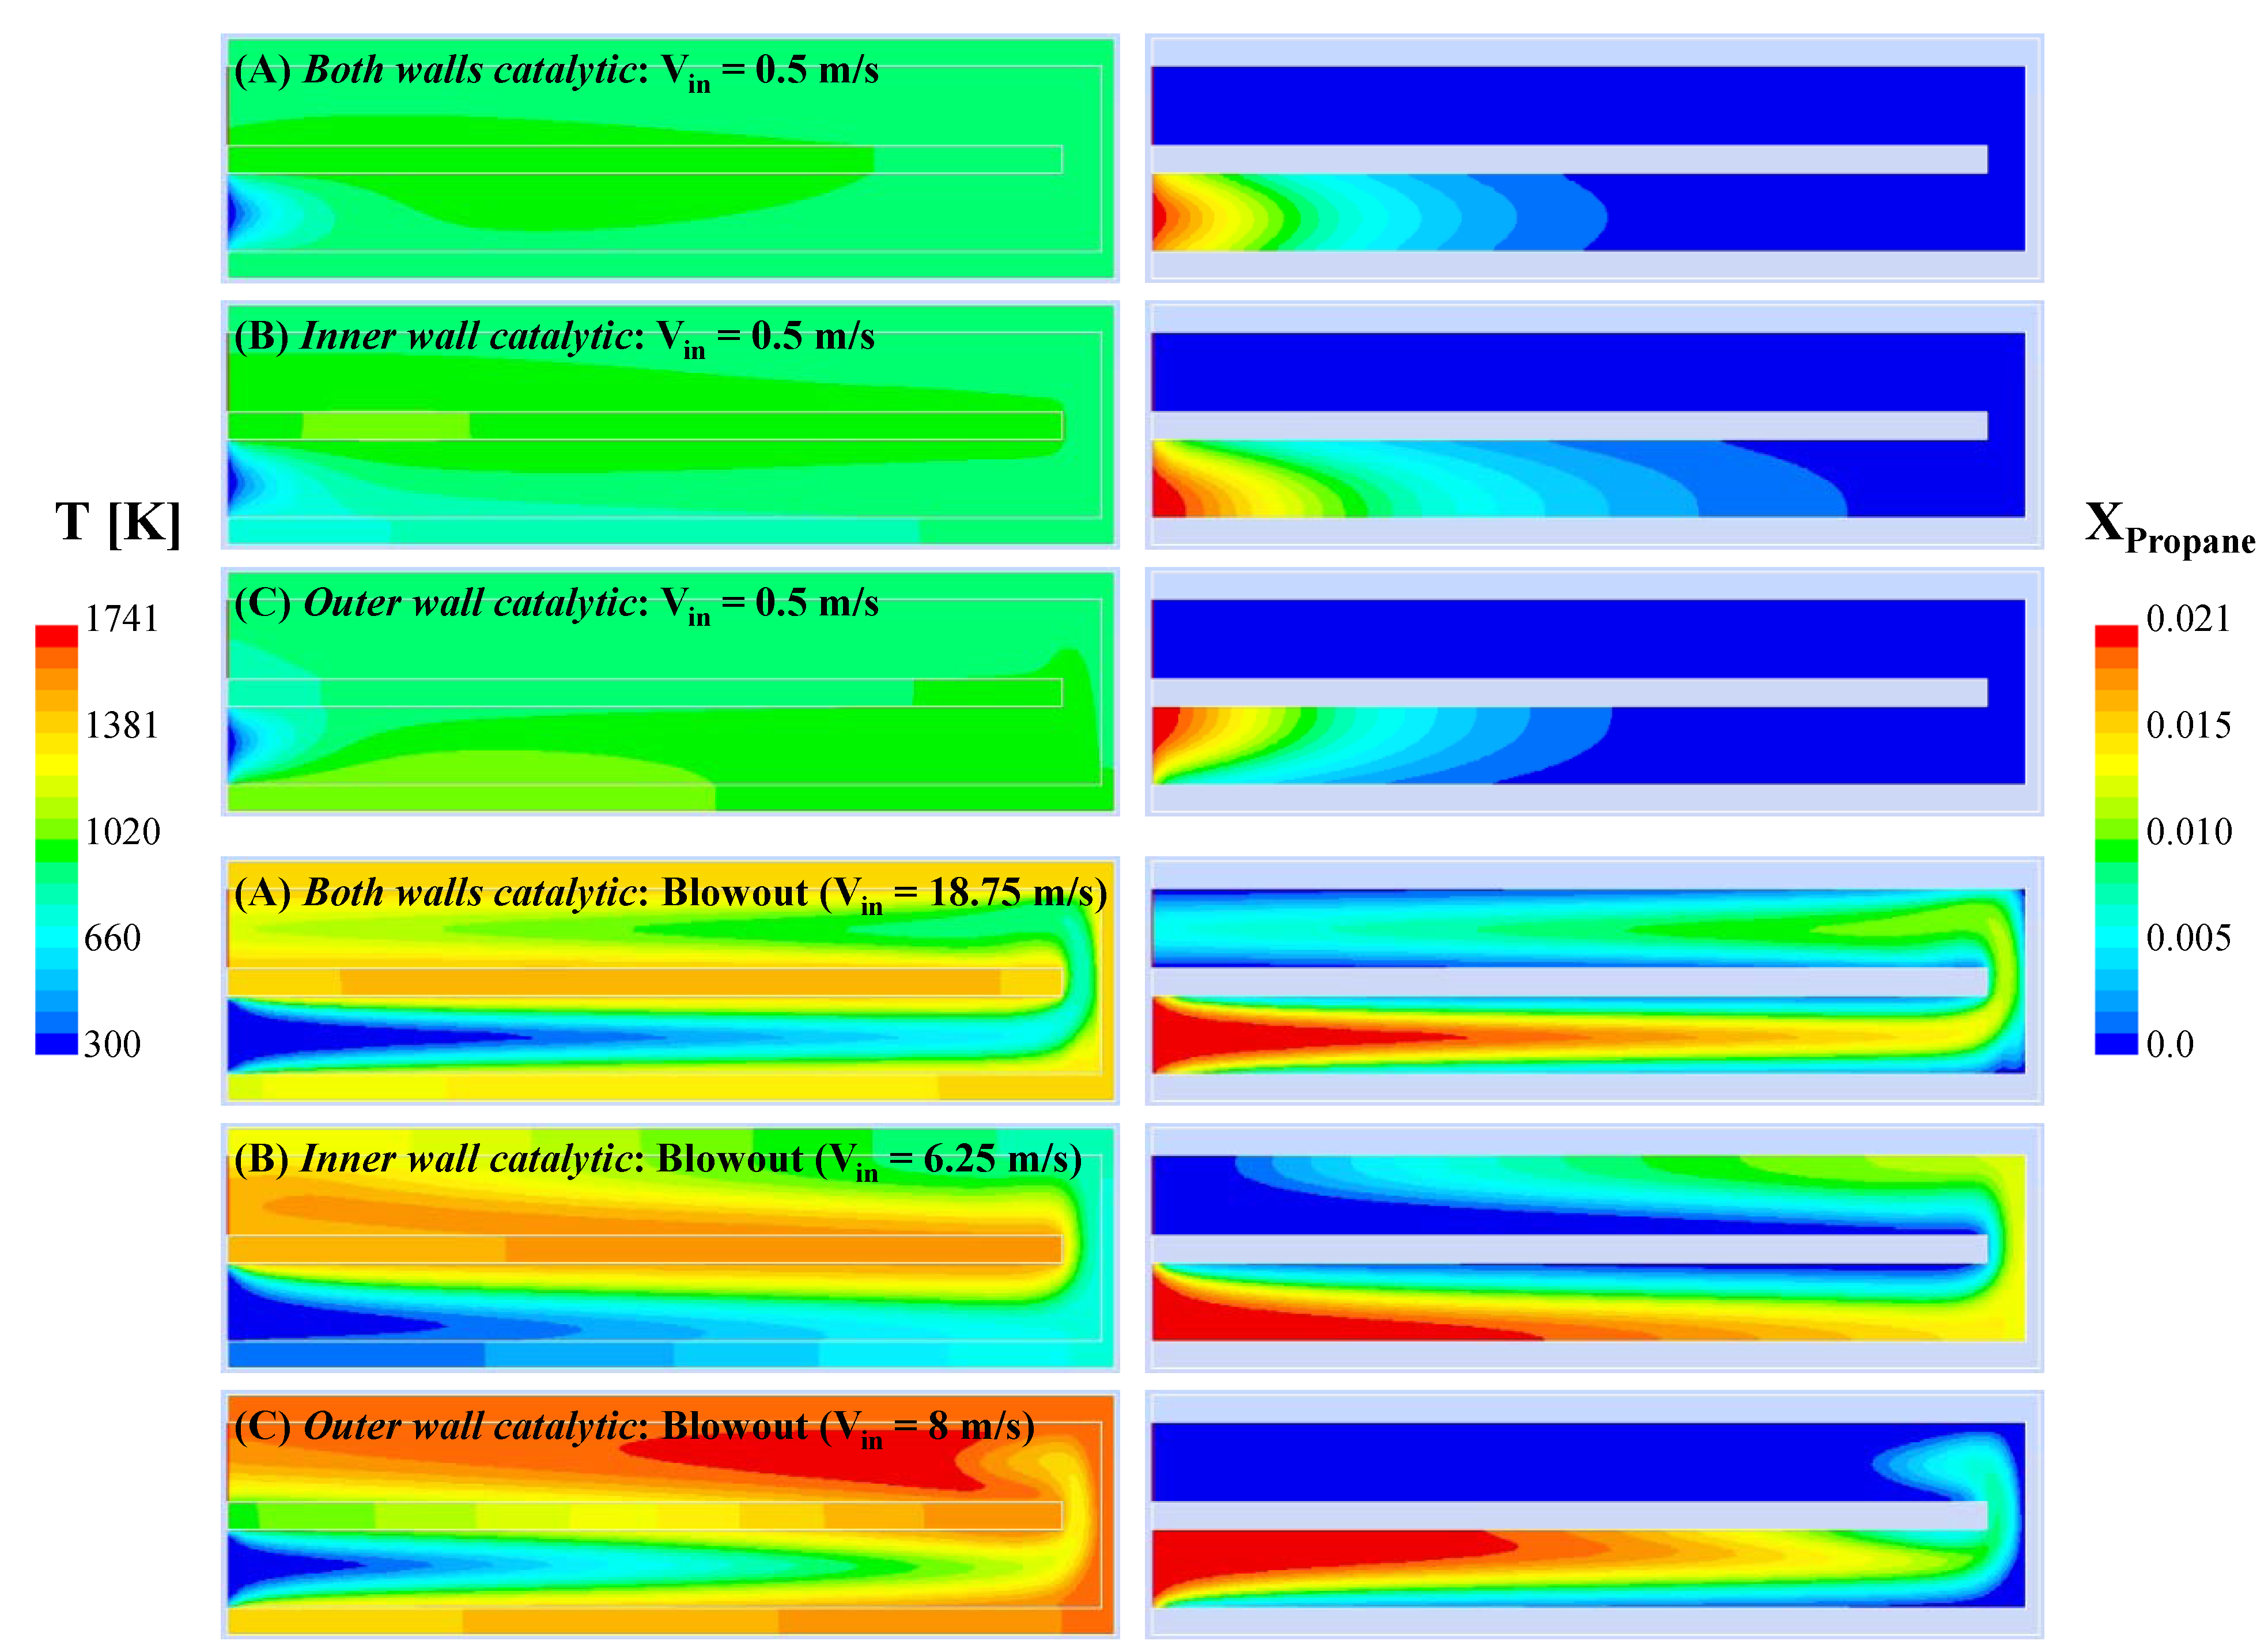
Figure 2 shows the contours of temperature and propane mole fraction at nominal operating condition of V
in = 0.5 m/s.
At the base-case inlet velocity, complete conversion of propane is observed, with the reaction occurring in the inlet channel itself in all three configurations. When looking at the inlet channel, it can be noticed that there is an asymmetry with respect to the central axis, due to heat losses from the outer wall and heat recirculation between the two channels across the dividing inner wall. The overall profiles of the two configurations (A) Both walls catalytic and (B) Inner wall catalytic are rather similar, whereas those of configuration (C) Outer wall catalytic are completely different. Specifically, higher values of local temperature are observed in configuration (C) and the overall profiles are qualitatively different as well, with the reaction zone anchored to the outer wall of the inlet channel in this configuration.
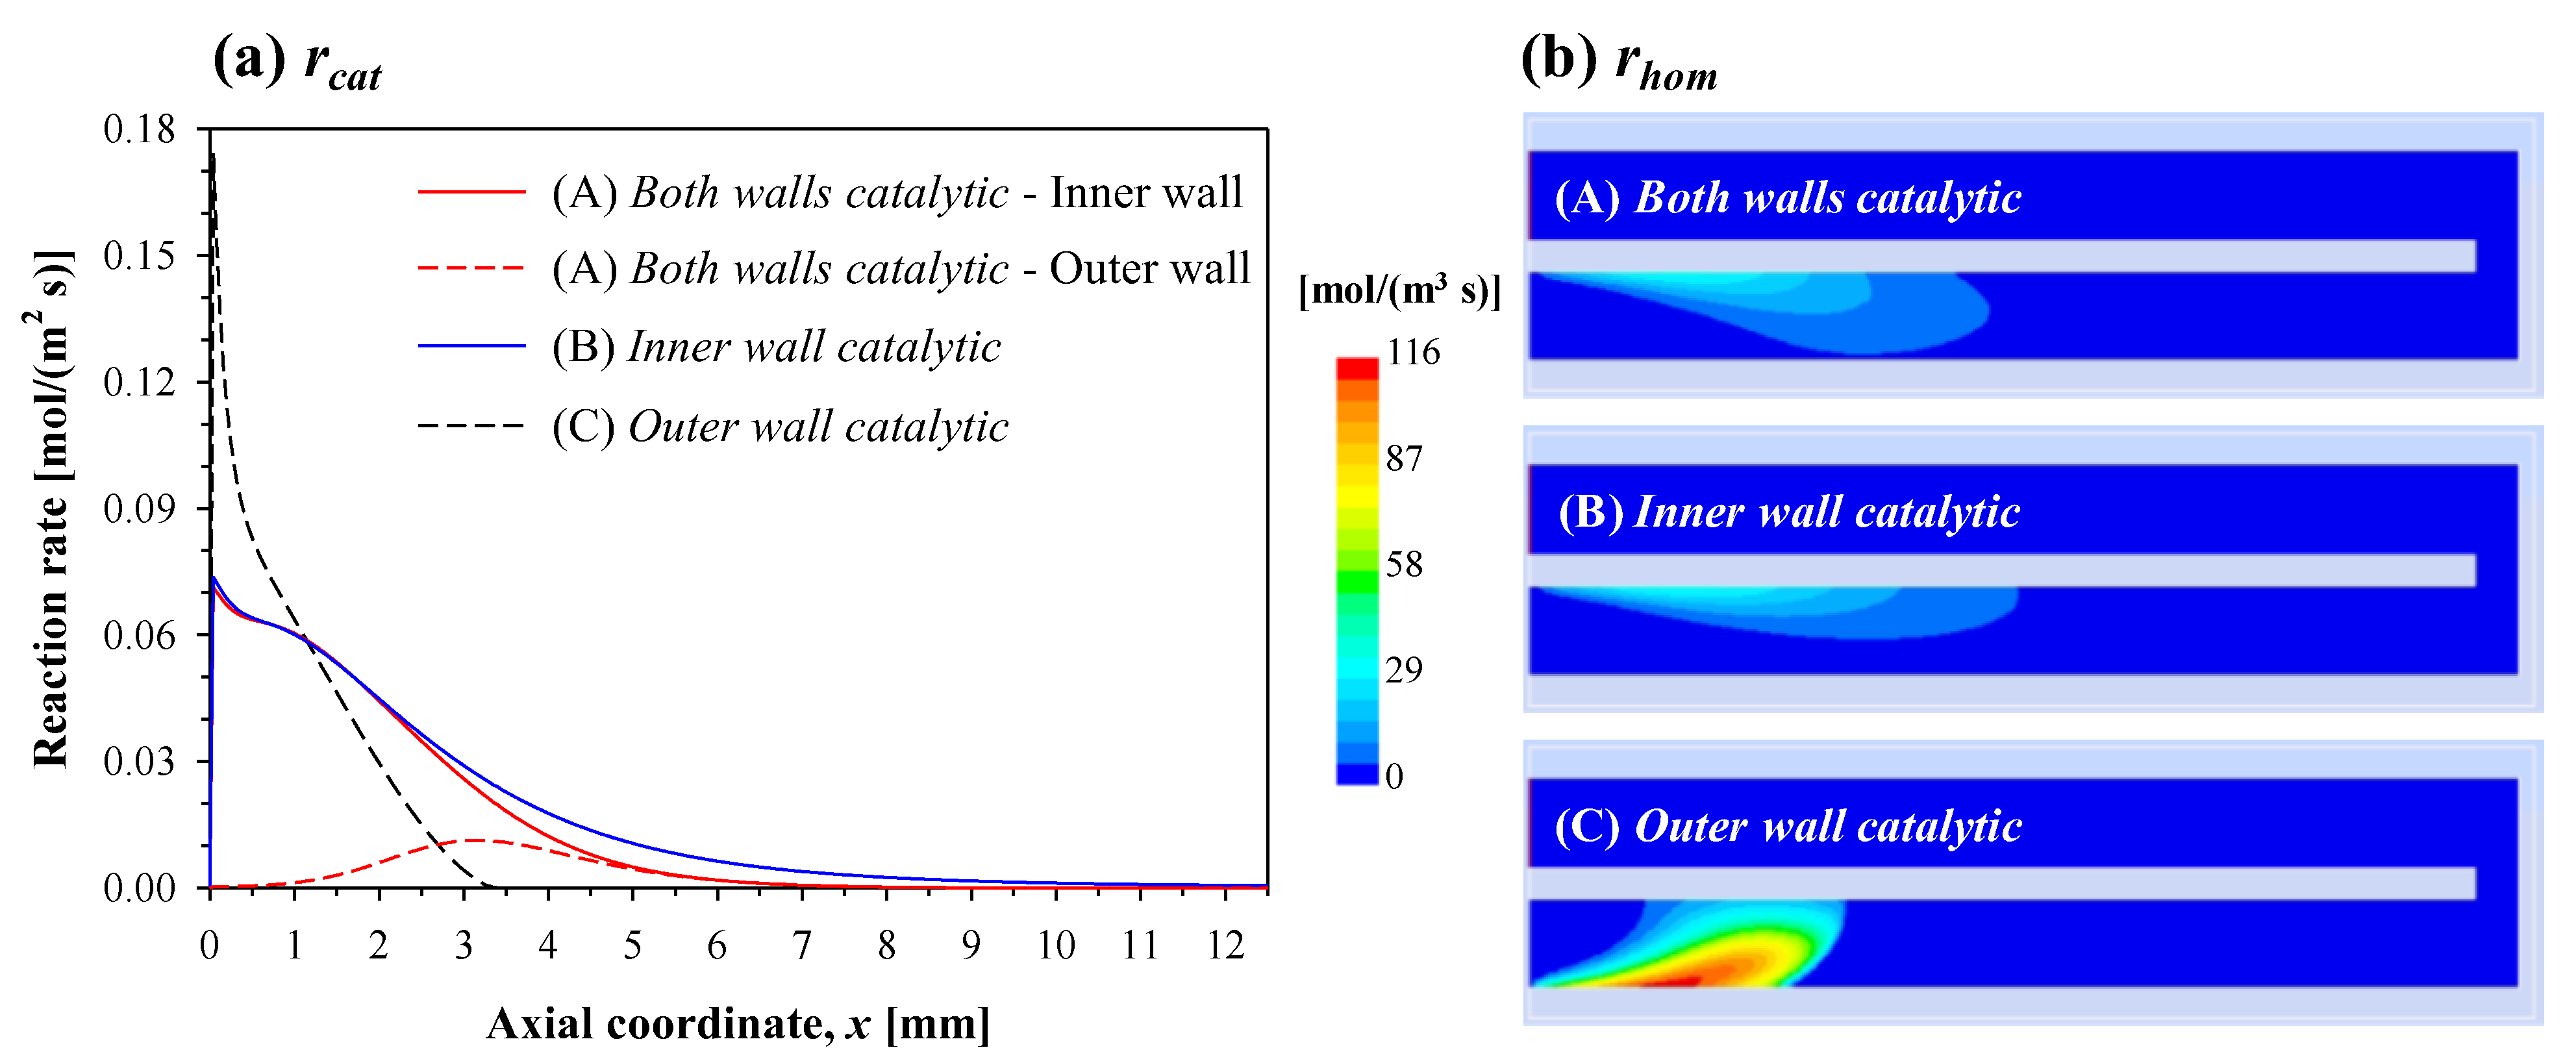
Figure 3a shows the axial profiles of catalytic reaction rate along the walls of the inlet channel, and
Figure 3b shows the contours of homogeneous reaction rate. Since the complete conversion of propane takes place in the inlet channel for these conditions, the reaction rate is only seen in the inlet channel. Regardless of the reactor configuration, reaction starts very close to the inlet. The two curves of configuration (A) represent the reaction rates on the inner (solid red line) and outer (dashed red line) walls. In this configuration, propane is catalytically converted mainly over the surface of the inner wall, as indicated by significantly higher reaction rates in
Figure 3a. It is also interesting to note that, along the inner wall, the profiles of catalytic reaction rate for configurations (A) and (B) almost overlap each other—this is especially true for
x < 2 mm. Conversely, along the outer wall, the profiles of catalytic reaction rate for configurations (A) and (C) are completely different in terms of both the peak value (much higher in configuration (C)) and the position (pushed further downstream in configuration (A)). Indeed, the maximum catalytic reaction rate in configuration (C) is more than twice that of configurations (A) and (B). Similar analogies and differences between the three configurations can be inferred for the homogeneous reaction rate (
Figure 3b) as well. Following catalytic reaction, a violent activation of homogeneous reaction takes place only in the case of configuration (C).
For further analysis of the reactions occurring in the three different configurations, the contribution of the homogeneous reaction to the overall conversion of propane is computed as below:
where the net homogeneous reaction rate is integrated over the entire reactor volume:
whereas the net catalytic reaction rate is integrated over the entire catalytic surface:
Table 1 quantifies the homogeneous contribution to the conversion of propane for all three configurations. As can be expected from the prior discussion, the homogeneous contribution is substantially similar for configurations (A) and (B). This contribution is rather low in these two cases, whereas it is much higher in the case of configuration (C).
Not only is the homogeneous contribution higher for configuration (C), but the homogeneous reaction zone is also anchored to the outer wall (see
Figure 3b), in spite of the outer wall being susceptible to heat loss to the surroundings. This region is also associated with high temperatures due to intense heat release (see
Figure 2). When the reaction is anchored to the dividing inner wall (configurations (A) and (B)), the direction of heat transfer close to the inlet is from the inner wall to bulk gas. In contrast, in configuration (C), the direction of heat transfer is from bulk gas to the inner wall, indicating that perhaps the mechanism of heat recirculation is rather less efficient in this case.
In summary, at the base-case conditions of thermal conductivity (3 W/(m K)) and inlet velocity (0.5 m/s), configurations (A) and (B) show similar behavior, whereas configuration (C) shows a different behavior, with higher temperature, higher contribution of the homogeneous reaction and the reaction zone localized near the outer wall.
2.1.2. Effect of Inlet Gas Velocity
The effect of inlet gas velocity (i.e., input power) will now be analyzed.
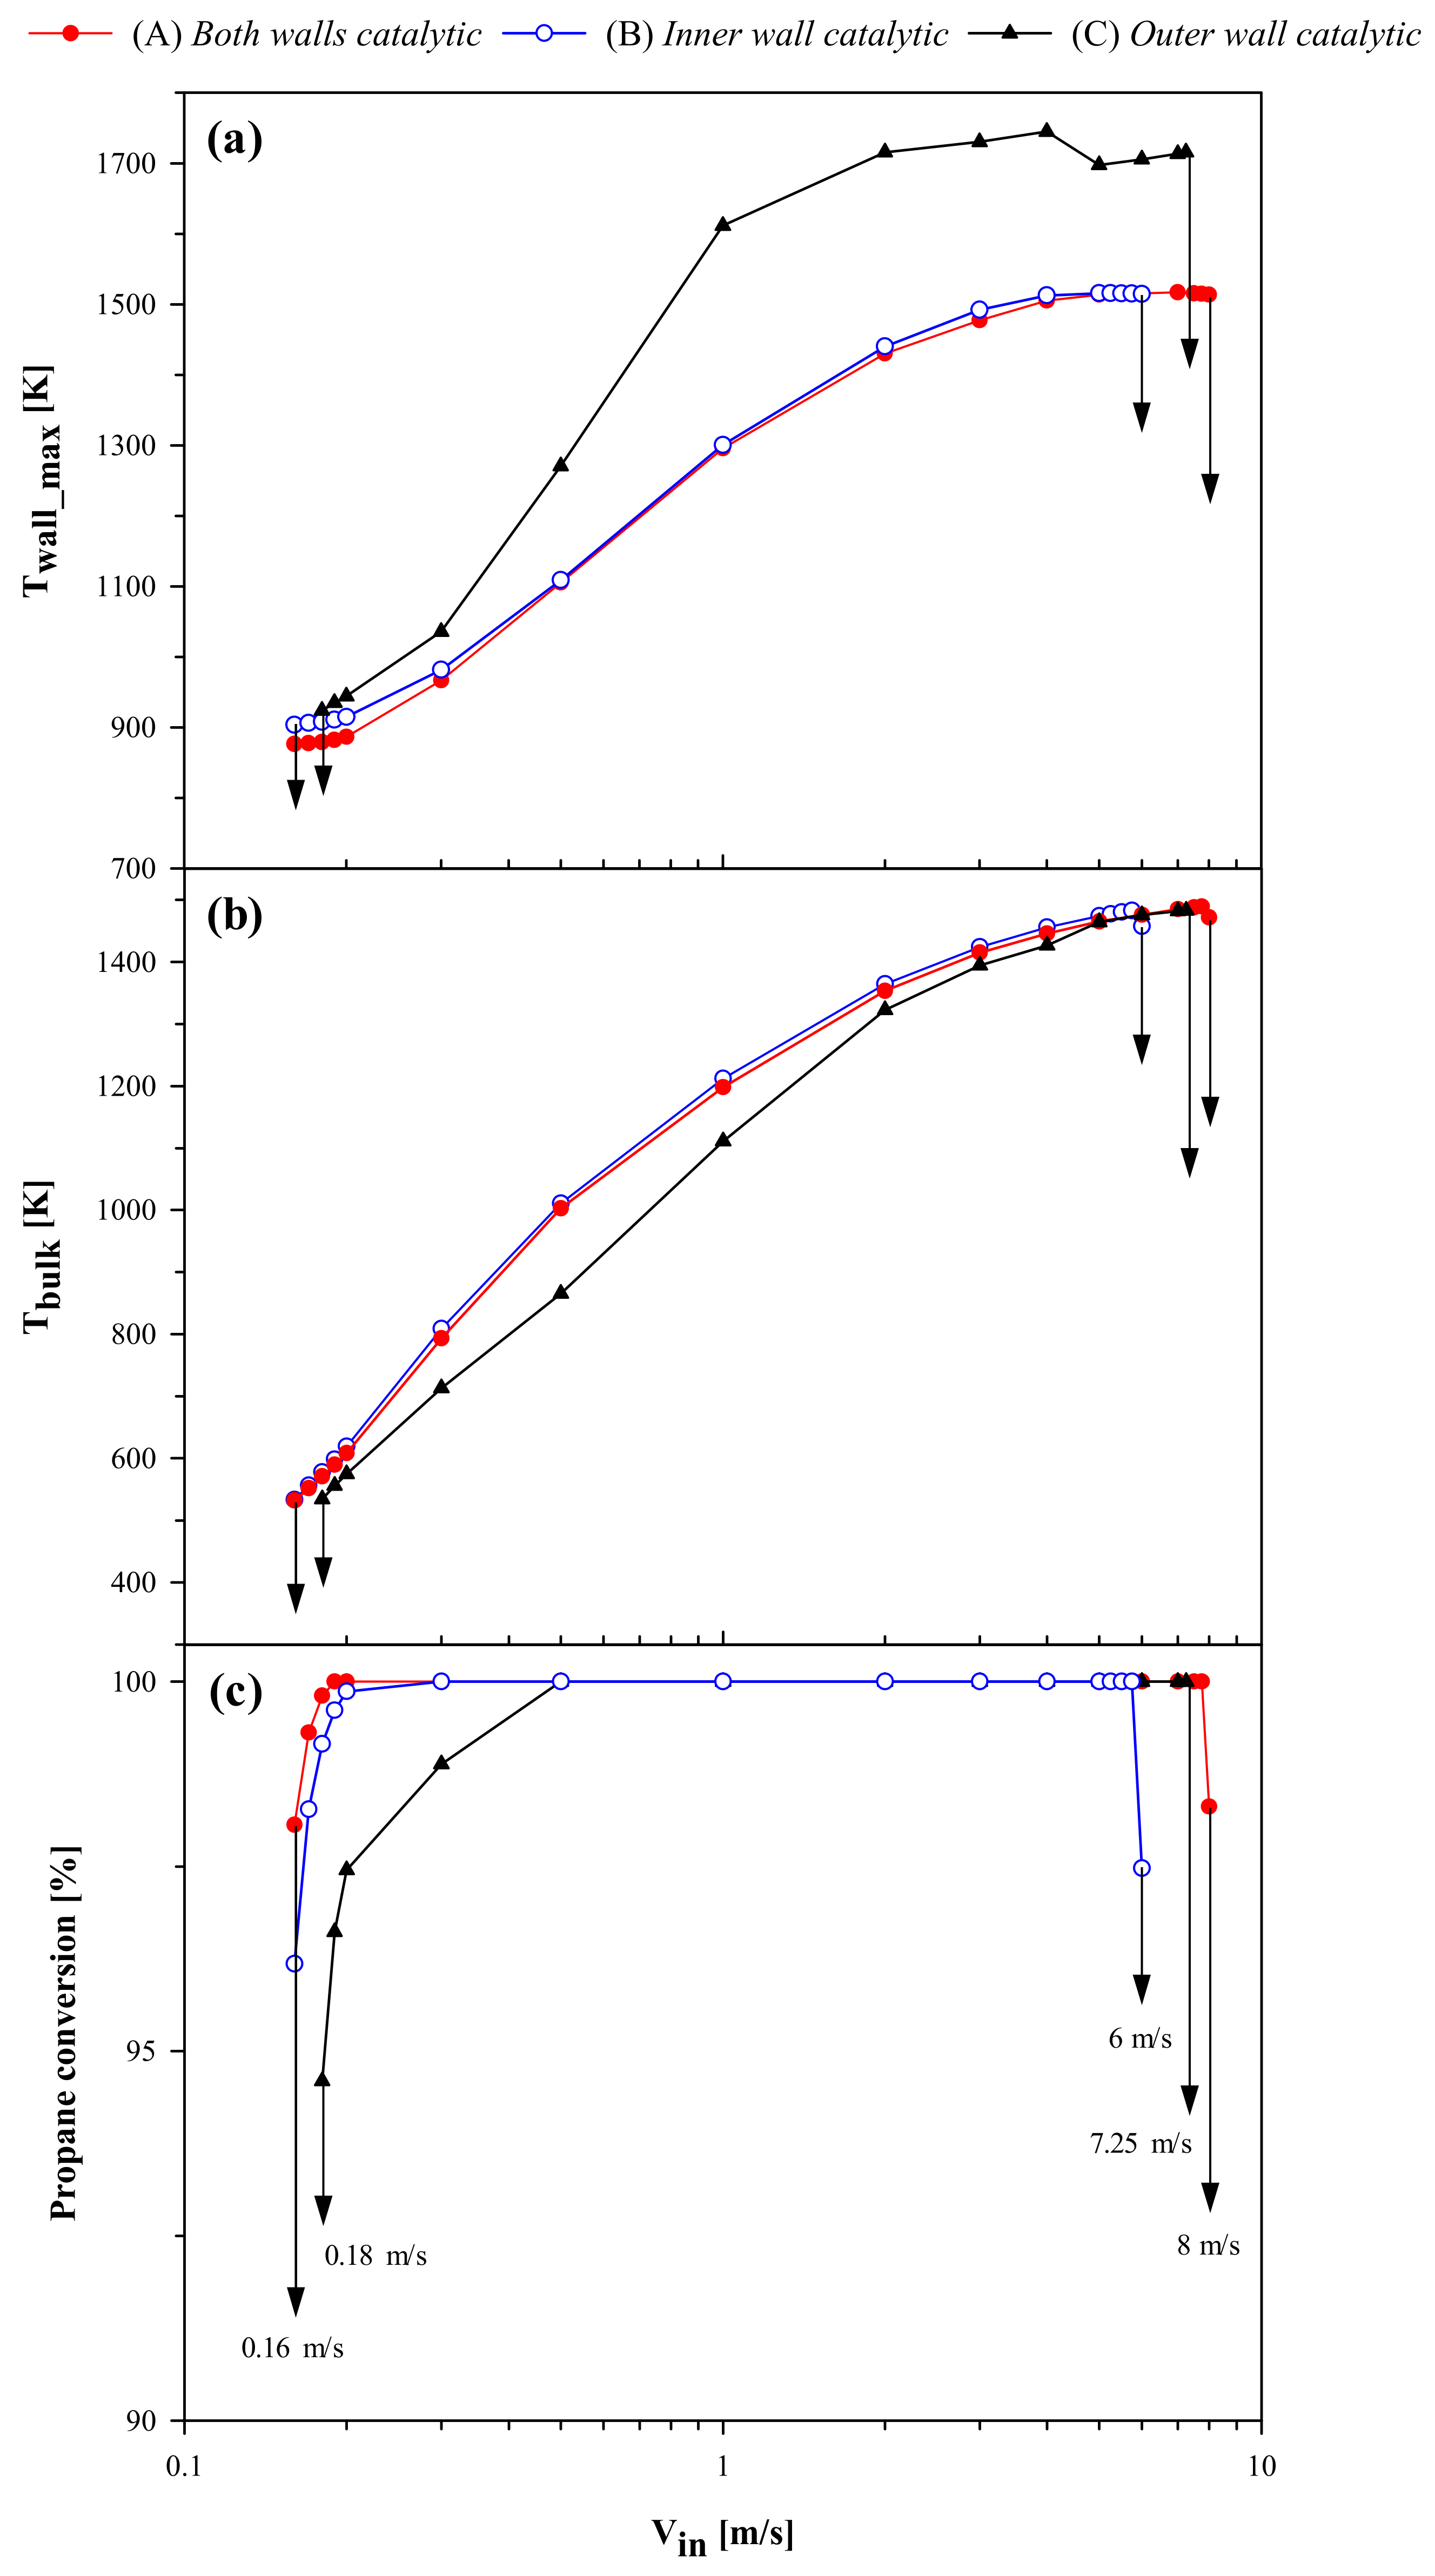
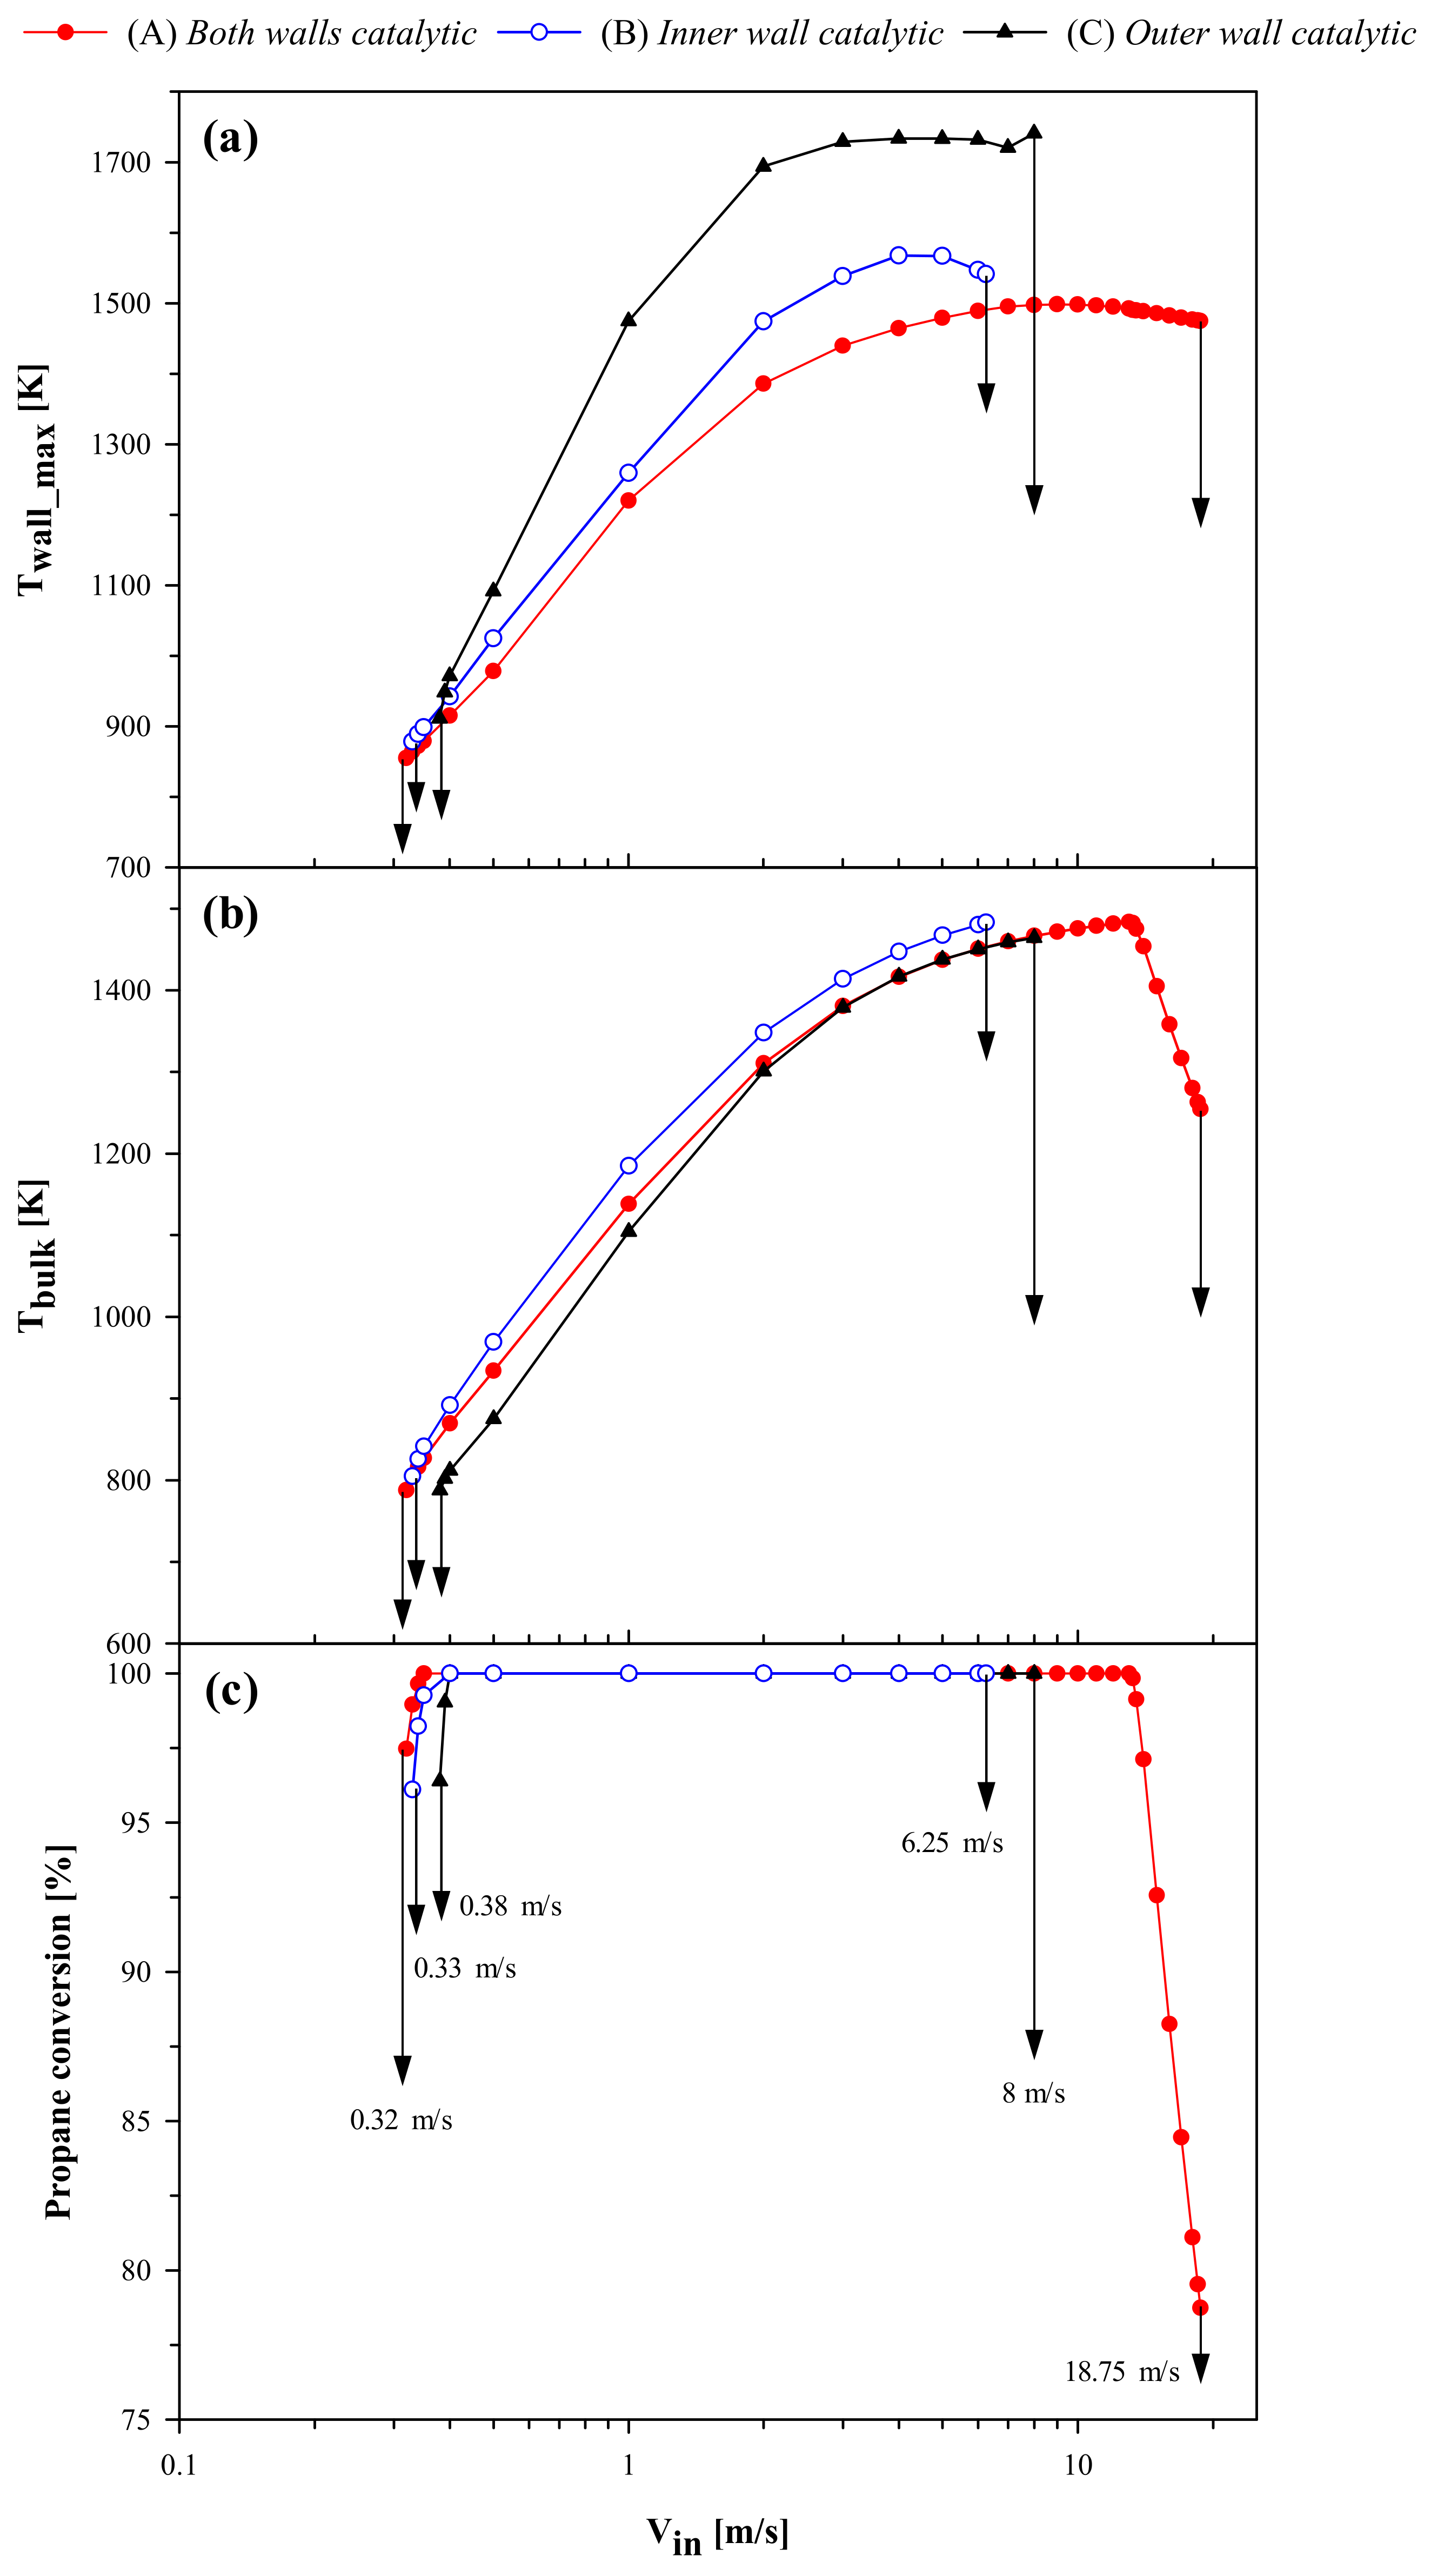
Figure 4 shows the plots of the maximum wall temperature, T
wall_max, the bulk gas temperature at the reactor outlet, T
bulk, and propane conversion at the outlet versus V
in. For each reactor configuration, the critical inlet velocities for extinction (V
in,extinction) and blowout (V
in,blowout) are marked by downward arrows. As expected, the most stable case is configuration (A), as indicated by a broader range of inlet velocities for self-sustained combustion. The maximum wall temperature, and outlet bulk temperature and conversion show similar values for configurations (A) and (B) over a wide range of inlet velocities. This can be attributed to the fact that the reaction zone is located near the dividing inner wall in both these cases (see
Figure 3).
In spite of the lower amount of catalyst, configuration (B) exhibits the same resistance to extinction as configuration (A), with V
in,extinction observed to be 0.16 m/s. These configurations provide higher resistance to extinction than configuration (C), which shows V
in,extinction = 0.18 m/s. This suggests that the catalytic inner wall controls extinction. This behavior can be further understood from
Figure 5, which shows the contours of temperature at extinction for the three cases. In the cases of configurations (A) and (B), the maximum temperature is observed at the inner wall. This is also the region where the reaction rates are maximum. In contrast, the region of maximum temperature in the case of configuration (C) is at the outer wall of the inlet channel and, thus, the stabilizing action of heat transfer across the dividing inner wall is lost. It is remarkable to observe that while the profiles of temperature (
Figure 5) and reaction rate (figures skipped for brevity) are quantitatively different for configurations (A) and (B), they show similar qualitative behavior.
Figure 4 also shows a difference in terms of resistance to blowout between the three configurations, with configuration (A) (V
in,blowout = 8 m/s) exhibiting higher stability to blowout than configurations (B) (V
in,blowout = 6 m/s) and (C) (V
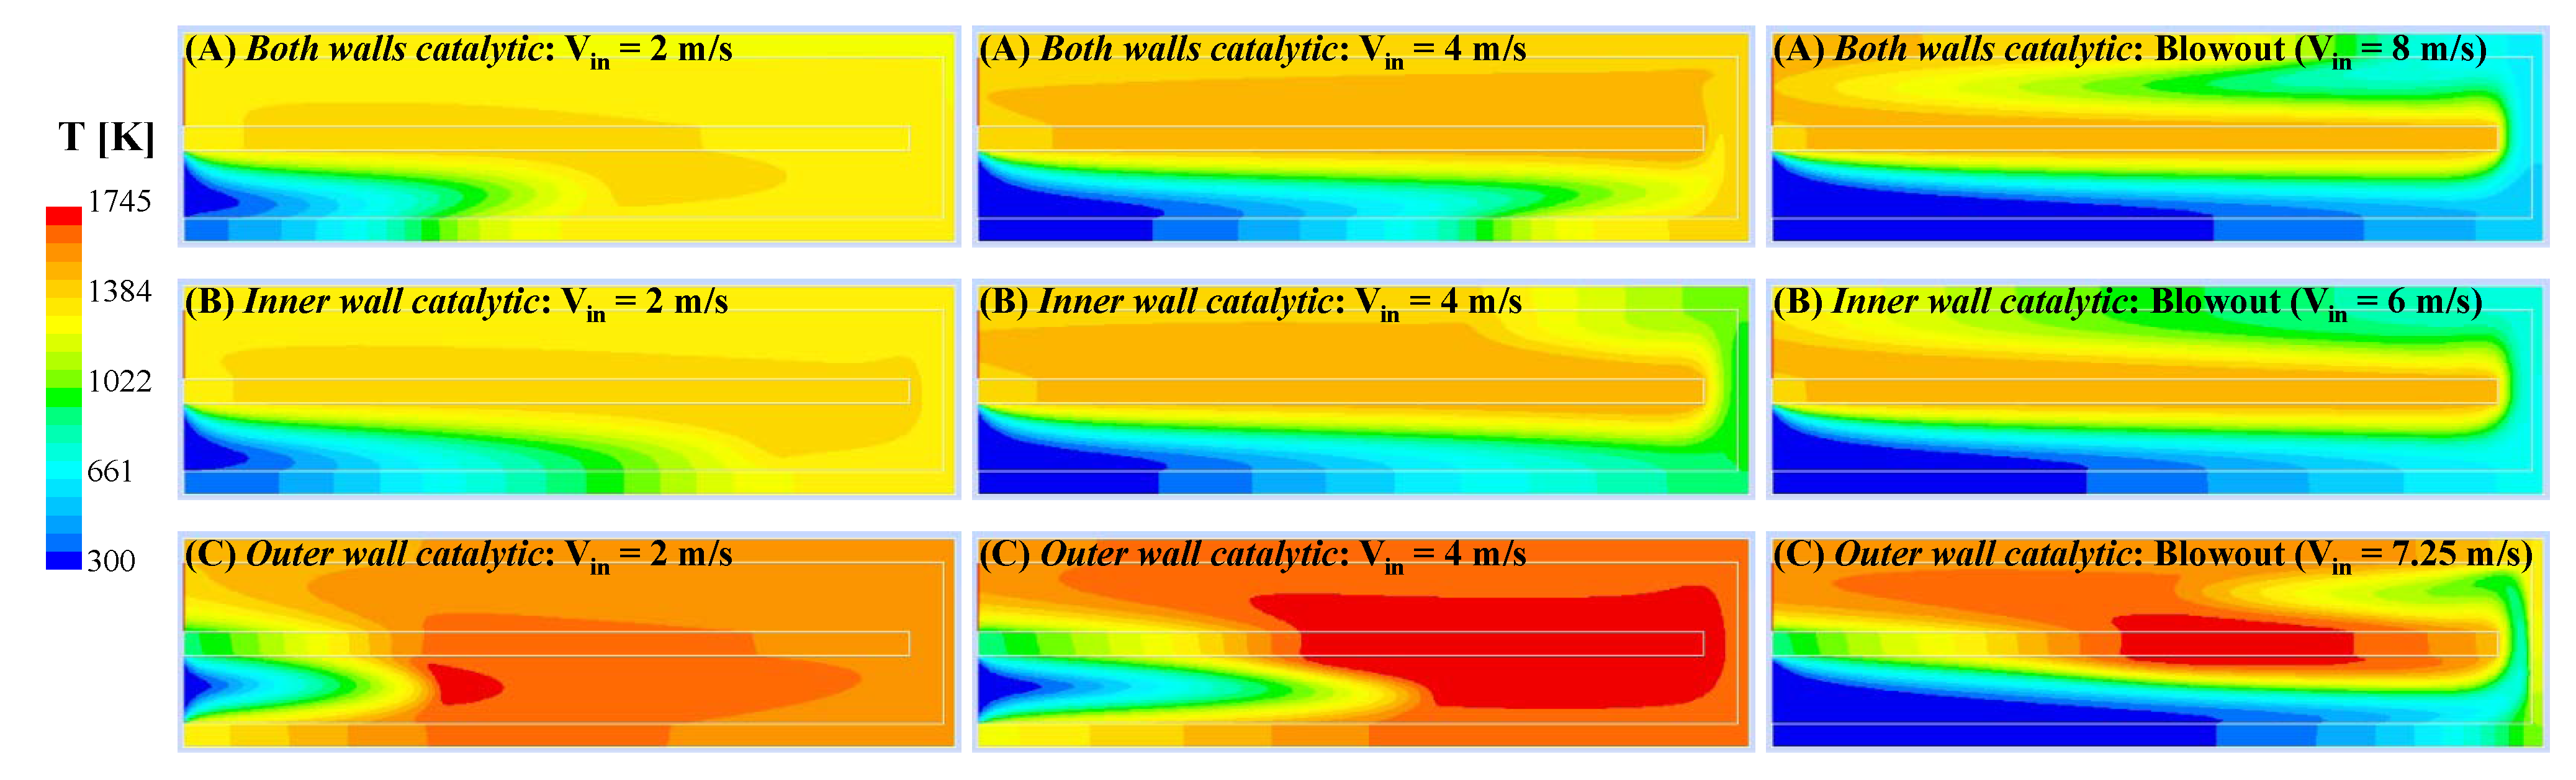
in,blowout = 7.25 m/s). For further analysis of the effect of inlet velocity,
Figure 6 shows the contours of temperature for all three configurations at blowout (right panels) and two intermediate values of V
in. In all three configurations, as the inlet gas velocity is increased, the reaction front is shifted downstream until blowout occurs. At V
in = 2 m/s, the reaction zone is still within the inlet channel for all three configurations. In configurations (A) and (B), the reaction zone is still located at the inner wall, whereas in configuration (C), the homogeneous reaction zone moves within the fluid domain and away from the walls, even though the outer wall is catalytic. It is interesting to notice that, at a higher value of V
in = 4 m/s, only in configuration (C), the reaction front is still inside the inlet channel. For this case, the reaction zone has now shifted towards the inner wall, which is non-catalytic. Upon further increasing the inlet velocity close to the respective blowout conditions, the reaction zone had extended into the outlet channel for all three cases. The higher temperatures attained in the case of configuration (C) suggest that the activation of the homogeneous reaction pathway plays a role in determining the blowout behavior of this configuration.
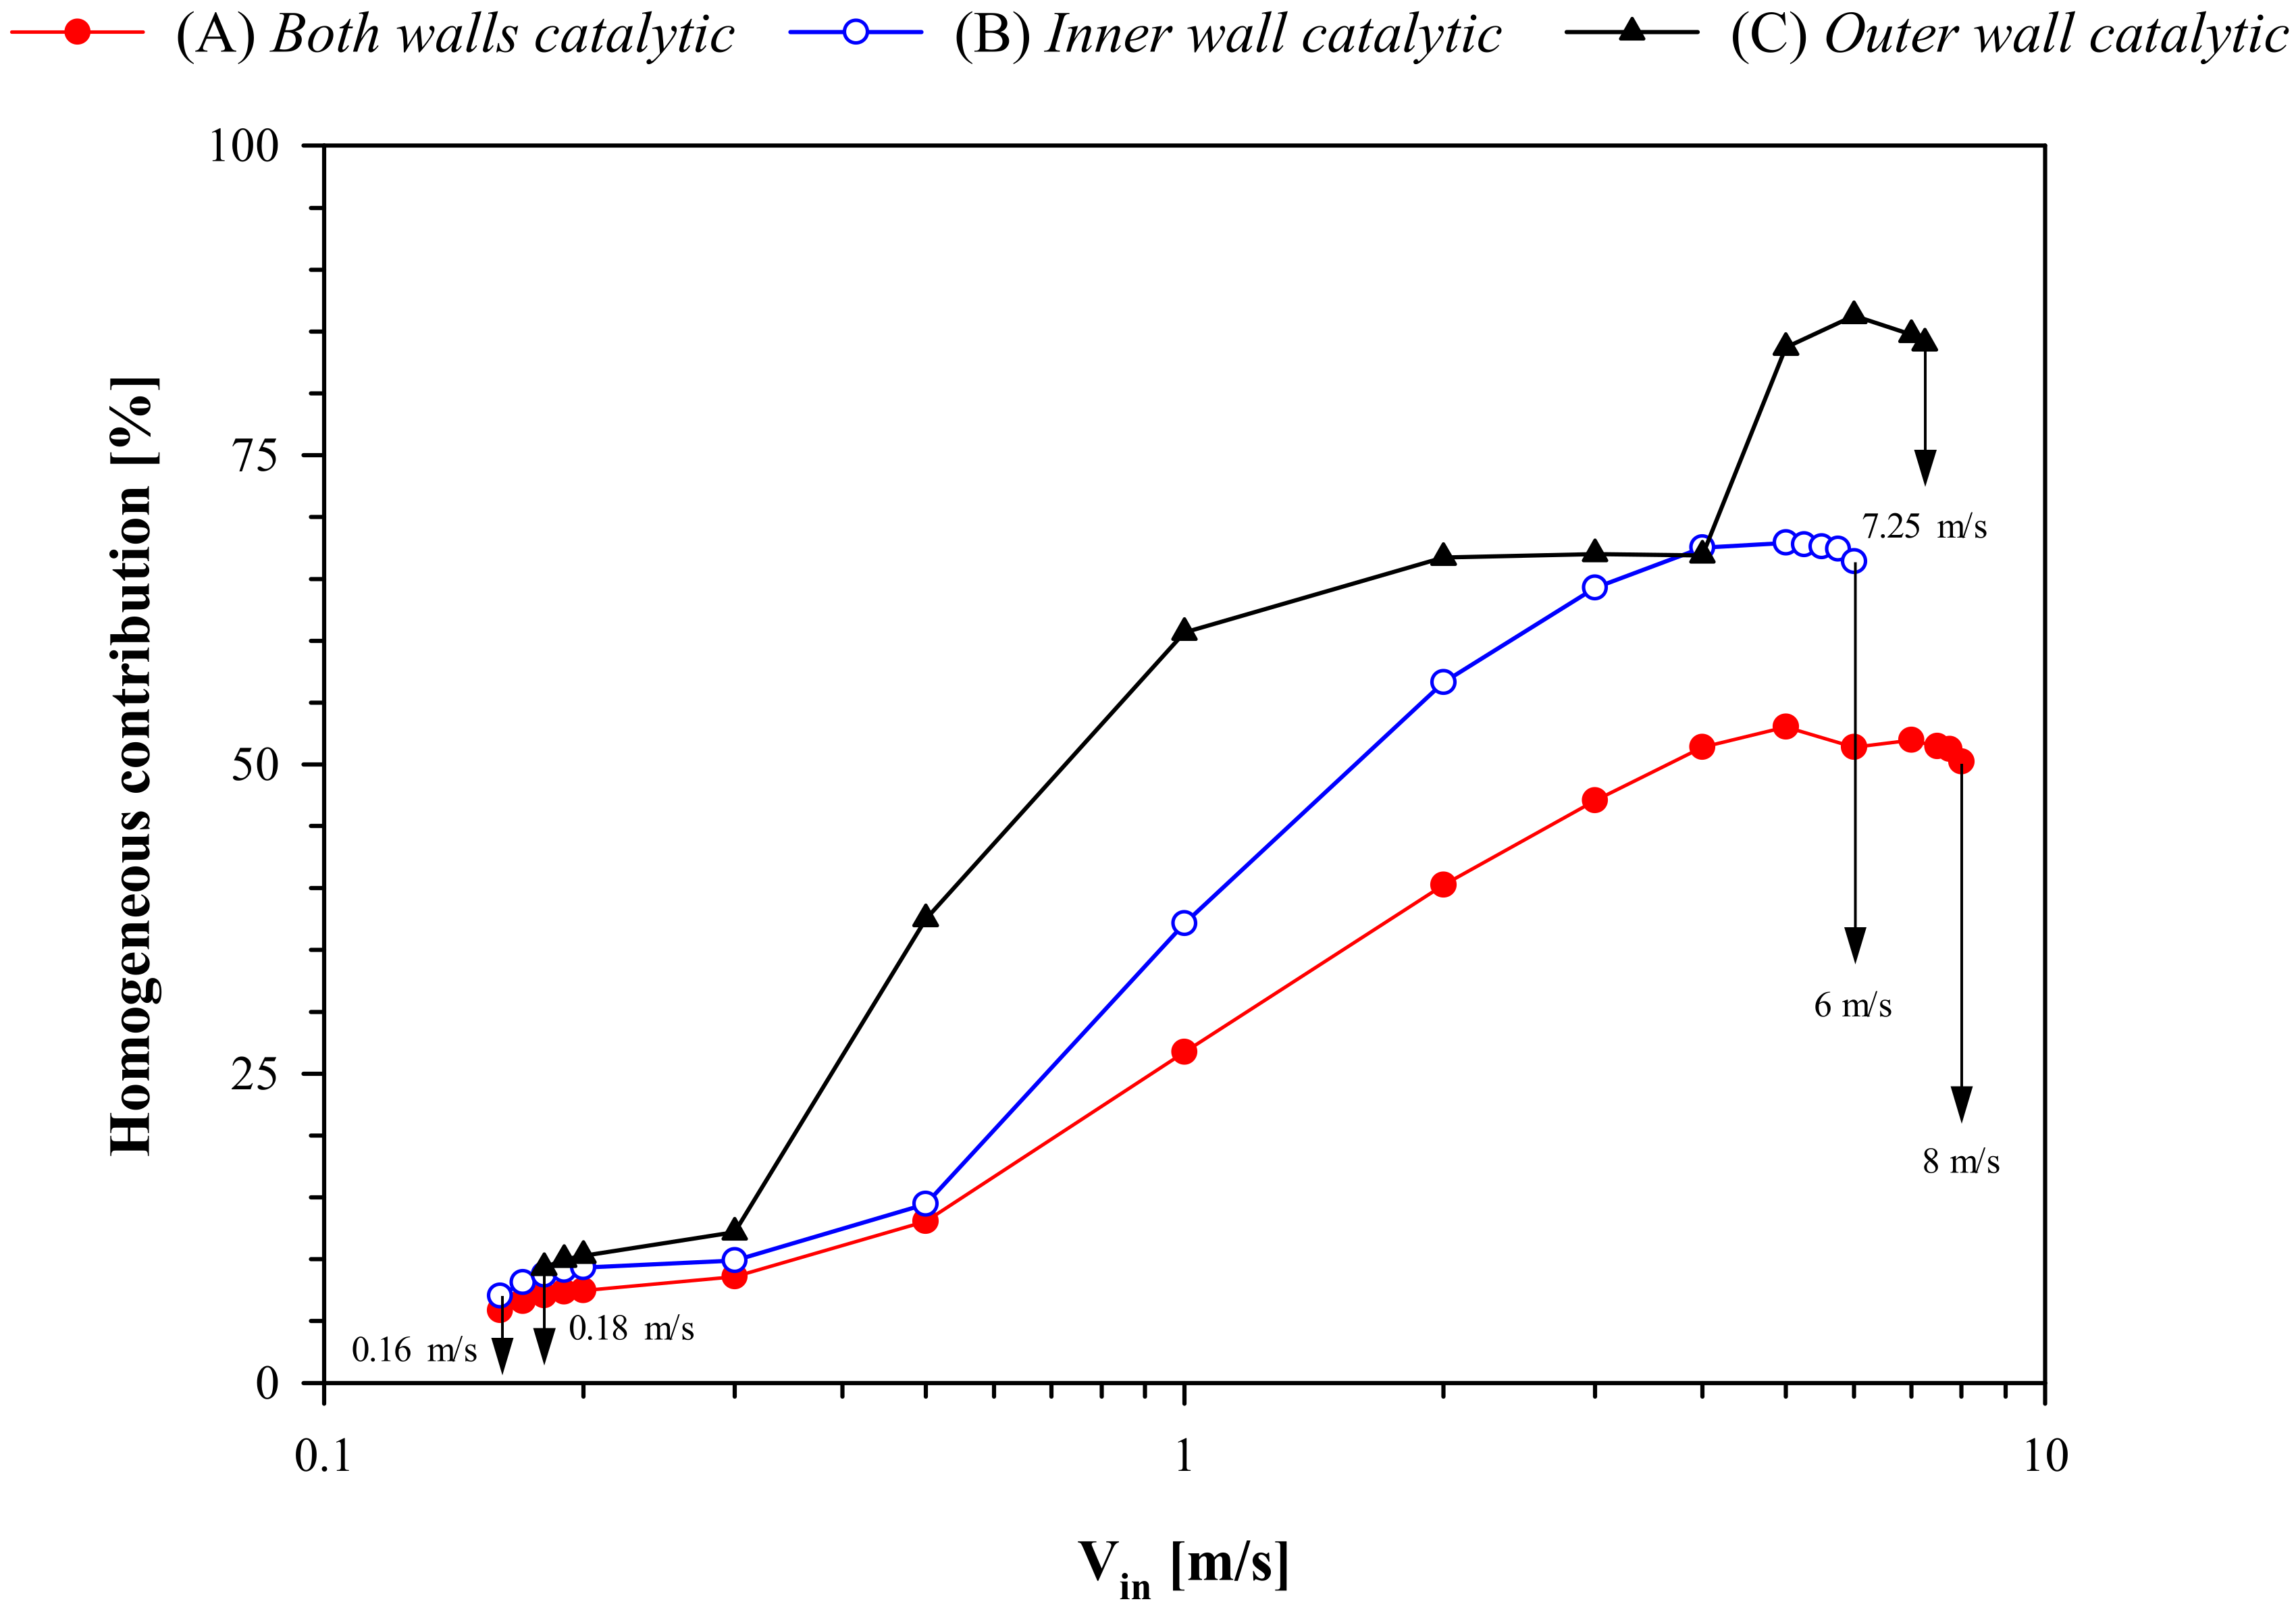
In
Figure 7, the homogeneous contribution to the overall conversion of propane (Equation (1)) is plotted as a function of V
in for the three different reactor configurations. In all cases, at low values of inlet gas velocity (V
in ≤ 0.3 m/s), the homogeneous contribution is rather modest and, thus, extinction is mainly ruled by catalytic reaction. As V
in is increased, the reactor temperature increases (
Figure 4a), resulting in an increase in the homogeneous contribution. This is especially true for configuration (C), whose blowout resistance is mainly controlled by homogeneous reaction. Since the amount of catalyst is greater for configuration (A), the homogeneous contribution is lowest and the catalytic contribution is the highest, when compared with the other two configurations. The homogeneous contribution is highest and catalytic contribution lowest for configuration (C) because heat losses from the catalytic outer wall result in a lower catalytic reaction rate. It is interesting to see a significant increase in homogeneous contribution in the case of configuration (C) beyond 4 m/s until blowout. As was explained earlier, at higher velocities, the high-temperature zone in this case moves away from the catalytic outer wall and into the fluid closer to the inner wall (which is non-catalytic in this case).
In summary, the results at low wall conductivity indicate that configurations (A) and (B) show similar behavior at low and moderate flowrates, with the high-temperature region anchored near the inner wall. When velocity is increased, the reaction zone moves downstream and loss of stability due to blowout is first observed in the case of configuration (B). Configuration (C) has slightly higher stability to blowout and shows higher temperature and higher homogeneous contribution, due to the high-temperature zone moving away from the catalytic outer wall. Configuration (A) has a wider region of stable operation than the other two configurations.
2.2. High Thermal Conductivity
Thermal conductivity of the solid walls plays an important role in determining micro-combustor stability. In a previous work, Di Sarli [
25] analyzed the role of conductivity of the inner and outer walls of the U-bend heat-recirculating micro-combustor with both walls catalyst coated. This subsection analyzes the results obtained at high thermal conductivity (30 W/(m K)) for the three different configurations of
Figure 1. As before, the maximum wall temperature (T
wall_max), and bulk gas temperature (T
bulk) and propane conversion at the reactor outlet are plotted versus V
in in
Figure 8.
Once again, the most stable case is configuration (A), as shown by a much wider operating window in terms of inlet velocities. However, differently from what is found at low thermal conductivity (
Figure 4), the maximum wall temperature and outlet bulk temperature and conversion show similar values for configurations (A) and (B) only close to extinction. This suggests a different location of the reaction zone in these two cases far from extinction.
The resistance to extinction is almost the same for configurations (A) (Vin,extinction = 0.32 m/s) and (B) (Vin,extinction = 0.33 m/s), whereas configuration (C) (Vin,extinction = 0.38 m/s) exhibits lower stability. This seems to confirm the key role of the catalytic inner wall in driving the extinction behavior even at high thermal conductivity.
Figure 8 also shows that the three configurations differ in terms of resistance to blowout. Specifically, the stability to blowout is much higher in the case of configuration (A) (V
in,blowout = 18.75 m/s) than configurations (B) (V
in,blowout = 6.25 m/s) or (C) (V
in,blowout = 8 m/s).
To further illustrate the effect of inlet velocity,
Figure 9 shows the contours of temperature and propane mole fraction for all three configurations at V
in = 0.5 m/s and blowout.
At Vin = 0.5 m/s, the high thermal conductivity makes the thermal profiles rather uniform for all three cases, though substantial axial gradients exist near blowout since the reaction zone is spread along the length of the reactors. It is also interesting to note that, regardless of the inlet velocity, the reaction zone is anchored to both the inner and outer walls in the case of configuration (A), to the inner wall in the case of configuration (B), and to the outer wall in the case of configuration (C). Near blowout, the reaction zone extends to the outlet channel for all three configurations. In configuration (A), both the (catalytic) inner and outer walls seem to work effectively along their entire length until blowout occurs (in other words, all of the catalyst seems to be exploited), whereas the same cannot be said for the catalytic walls of configurations (B) and (C). It is further interesting to note that, although the reaction zone is spread nearly to the entire length of the outlet channel in configurations (A) and (B), the reaction extends to only a small length of the outlet channel in configuration (C).
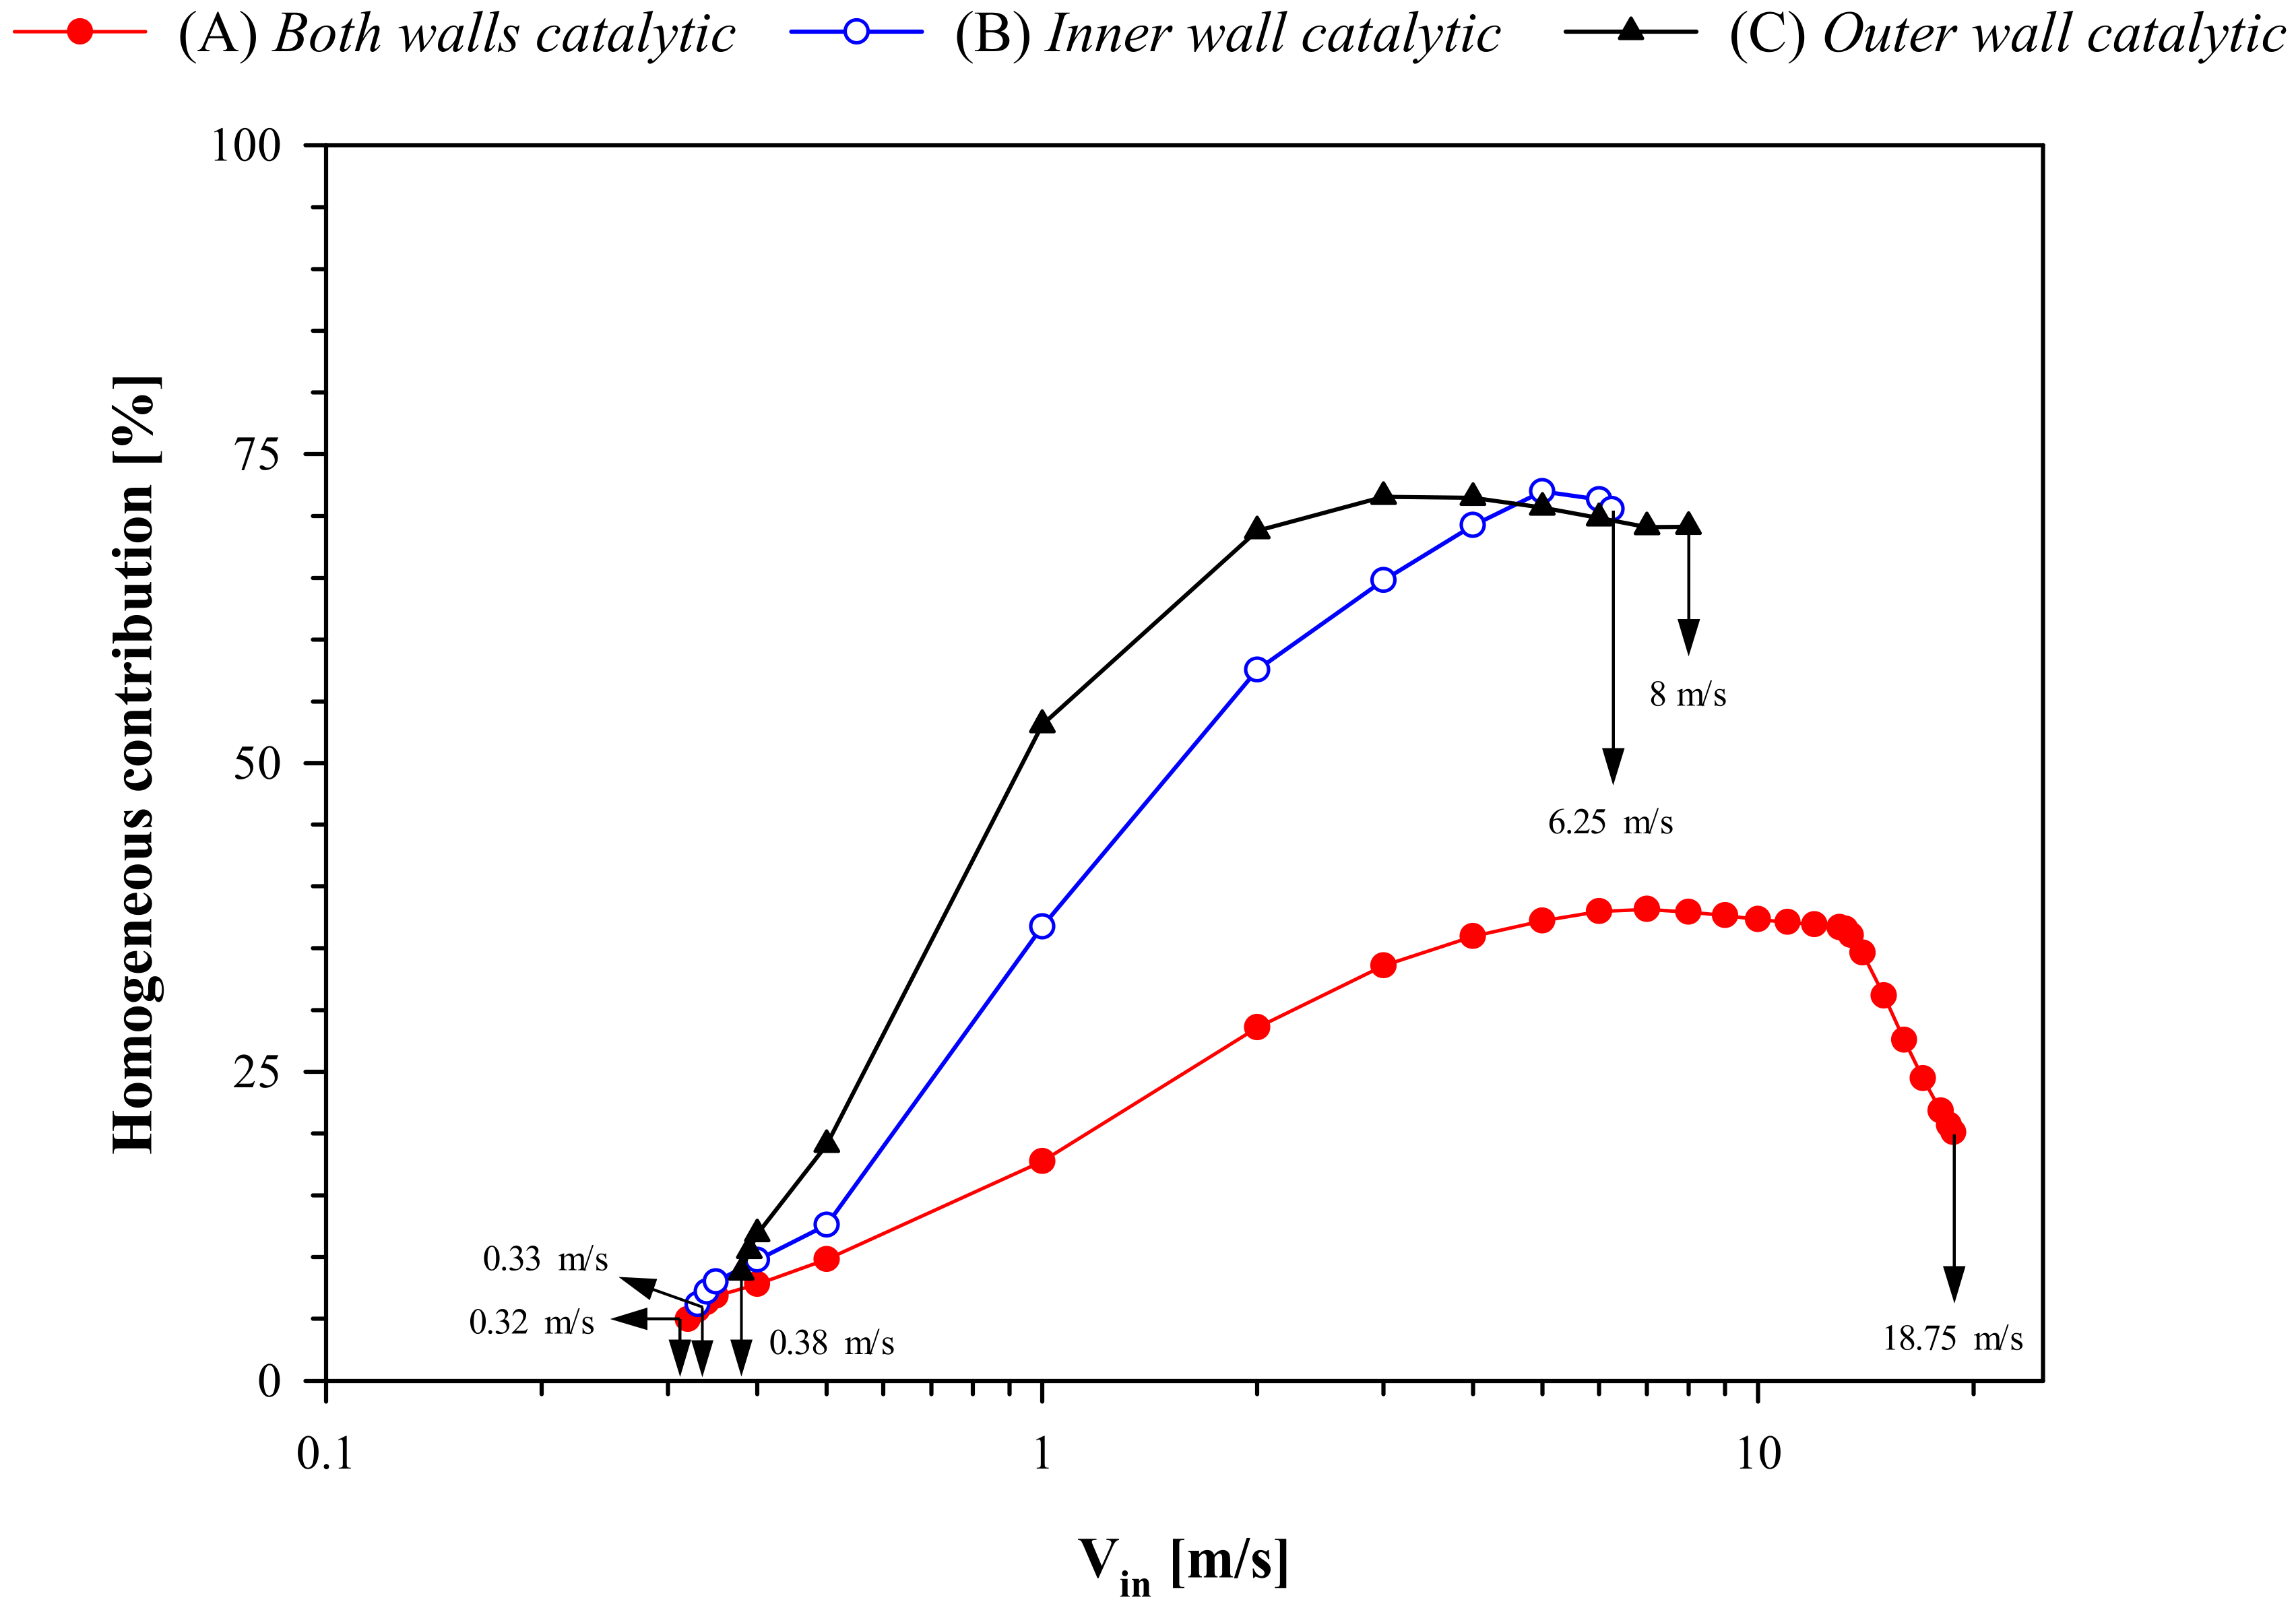
Figure 10 shows the homogeneous contribution to the overall conversion of propane (Equation (1)) as a function of V
in for the three configurations.
As already observed at low thermal conductivity (
Figure 7), in all three cases, the homogeneous contribution at low velocity is rather limited and, thus, the extinction behavior is dominated by catalytic reaction. The homogeneous contribution increases with increasing V
in—this is especially true for configurations (B) and (C), whose resistance to blowout is mainly dictated by the homogeneous reaction, as also expected on the basis of the higher values of reactor temperature (
Figure 8a). Contrasting with
Figure 7, the homogeneous contribution is only slightly lower for higher wall conductivity, which can be attributed to lower maximum temperature in the reactor at higher conductivity. Except for velocities exceeding 10 m/s (configuration (A) only), the qualitative behavior of homogeneous contribution curves is similar at both values of wall conductivity. For configuration (A), the homogeneous contribution is lower than the other two configurations and, as blowout is approached, it decreases with increasing V
in. In this case, catalytic reaction also controls the high-velocity behavior, determining higher resistance to blowout. Global assessment of
Figure 10, thus, clearly demonstrates that the homogeneous/catalytic contribution is a good indicator of stability: the lower/higher the homogeneous/catalytic contribution, the higher the stability.
2.3. Low versus High Thermal Conductivity: Roles of Catalytic Inner and Outer Walls
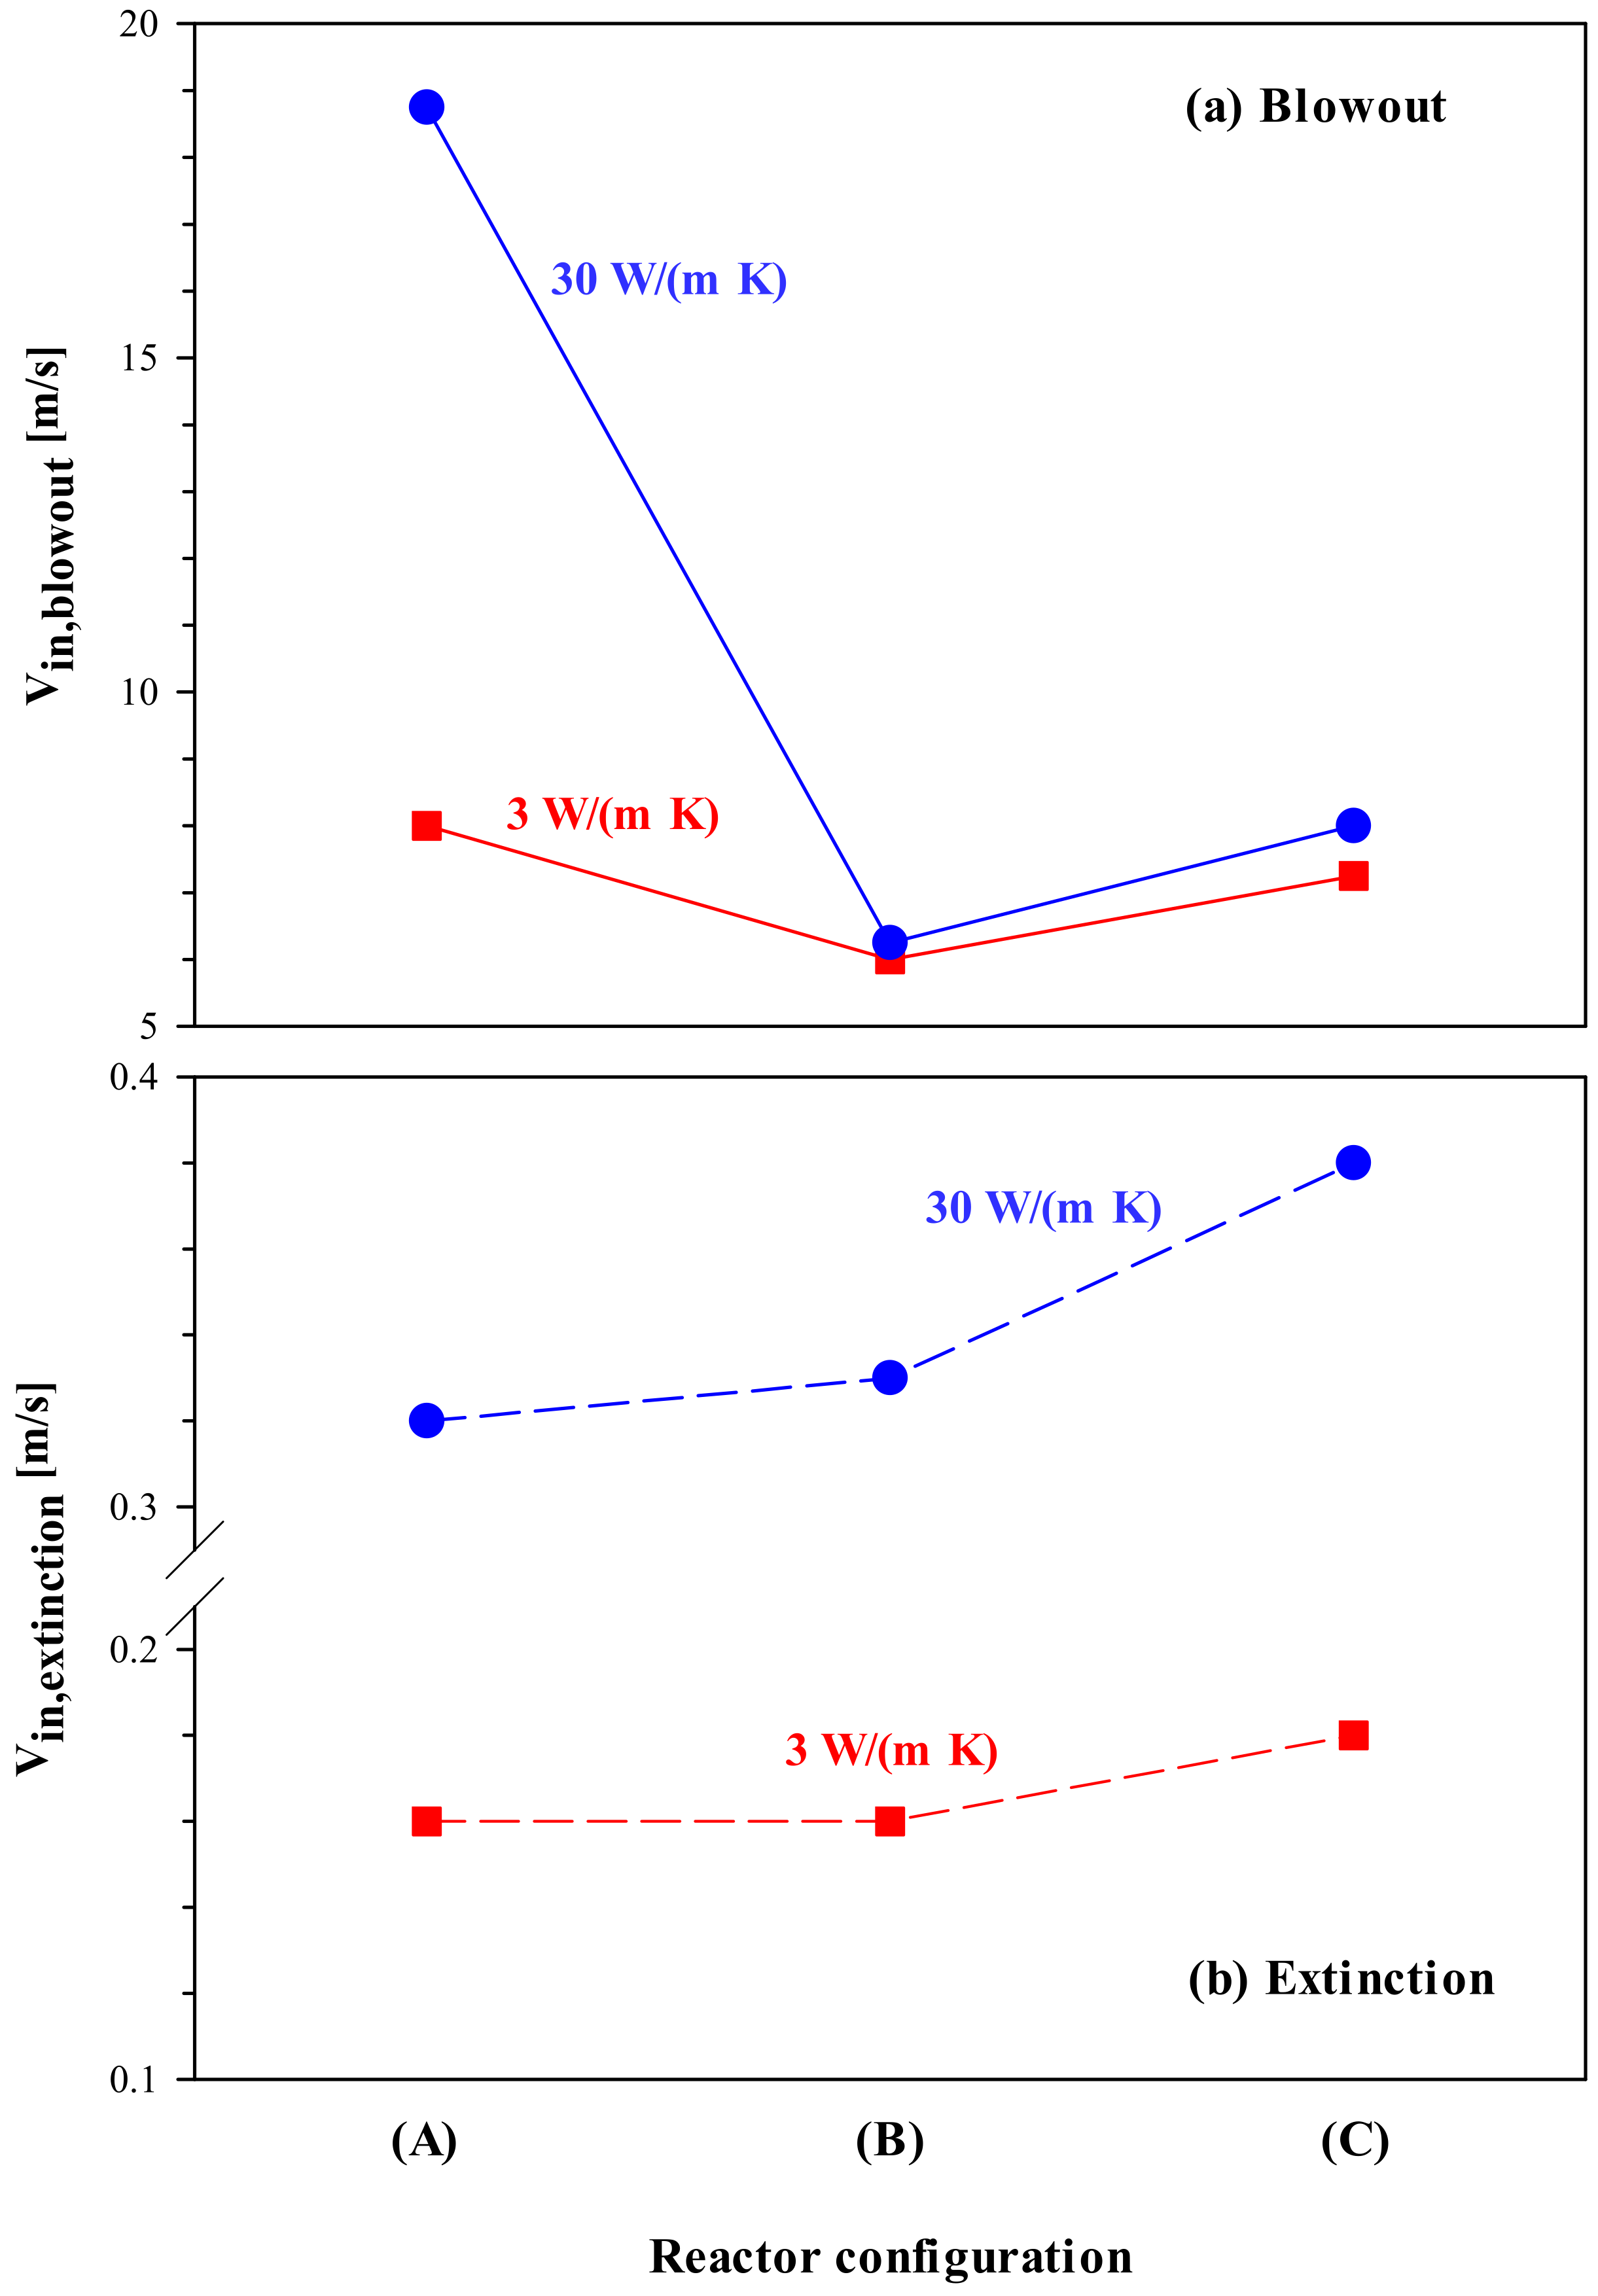
The wall thermal conductivity is an important design parameter affecting the stability of micro-combustors, and an analysis of stability and the role of two walls is discussed presently. With increasing wall thermal conductivity, the resistance to extinction decreases due to increasing heat loss to the surroundings, whereas the resistance to blowout increases due to more efficient preheating of the cold feed (see, for example, Ref. [
19]). Both these trends are shown in
Figure 11, where the values of inlet velocity at extinction (V
in,extinction) and blowout (V
in,blowout) are plotted for all three configurations of
Figure 1 at low (3 W/(m K), red squares) and high (30 W/(m K), blue circles) thermal conductivity. Recall that the dashed and solid lines represent the minimum and maximum limits of velocity (i.e., extinction and blowout, respectively), beyond which stable combustion is not sustainable.
There are two interesting features shown in this figure, with immediate practical implications. At low thermal conductivity, configuration (B) exhibits the same resistance to extinction as configuration (A), whereas at high thermal conductivity, its resistance is marginally lower (see
Figure 11b). For all three configurations, lower conductivity walls provide significantly higher resistance to extinction compared to more conducting walls. This implies that, for low-power systems, which are particularly prone to extinction and thus require low-conductive (i.e., insulating) materials (see, for example, [
23]), configuration (B) is an “optimal” configuration as it guarantees high stability and, at the same time, catalyst saving.
Configuration (A) exhibits the highest resistance to blowout, and this resistance significantly increases with increasing thermal conductivity (see
Figure 11a). This implies that, for high-power systems, which are especially susceptible to blowout and thus require highly conductive materials [
23], a full catalyst coating of both the inner and outer walls is needed to guarantee high stability. However,
Figure 11a also reveals that, for configurations (B) or (C), where only the inner or outer wall is catalyst coated, respectively, the wall conductivity has a relatively minor effect on the resistance to blowout.
The existence of an optimal reactor configuration for low-power systems is directly linked to the fact that, as discussed in the previous subsections, the extinction behavior is controlled by catalytic reaction, with only a minor contribution from homogeneous combustion near extinction (see
Figure 7 and
Figure 10). To understand the roles played by the (catalytic) inner and outer walls in determining stability,
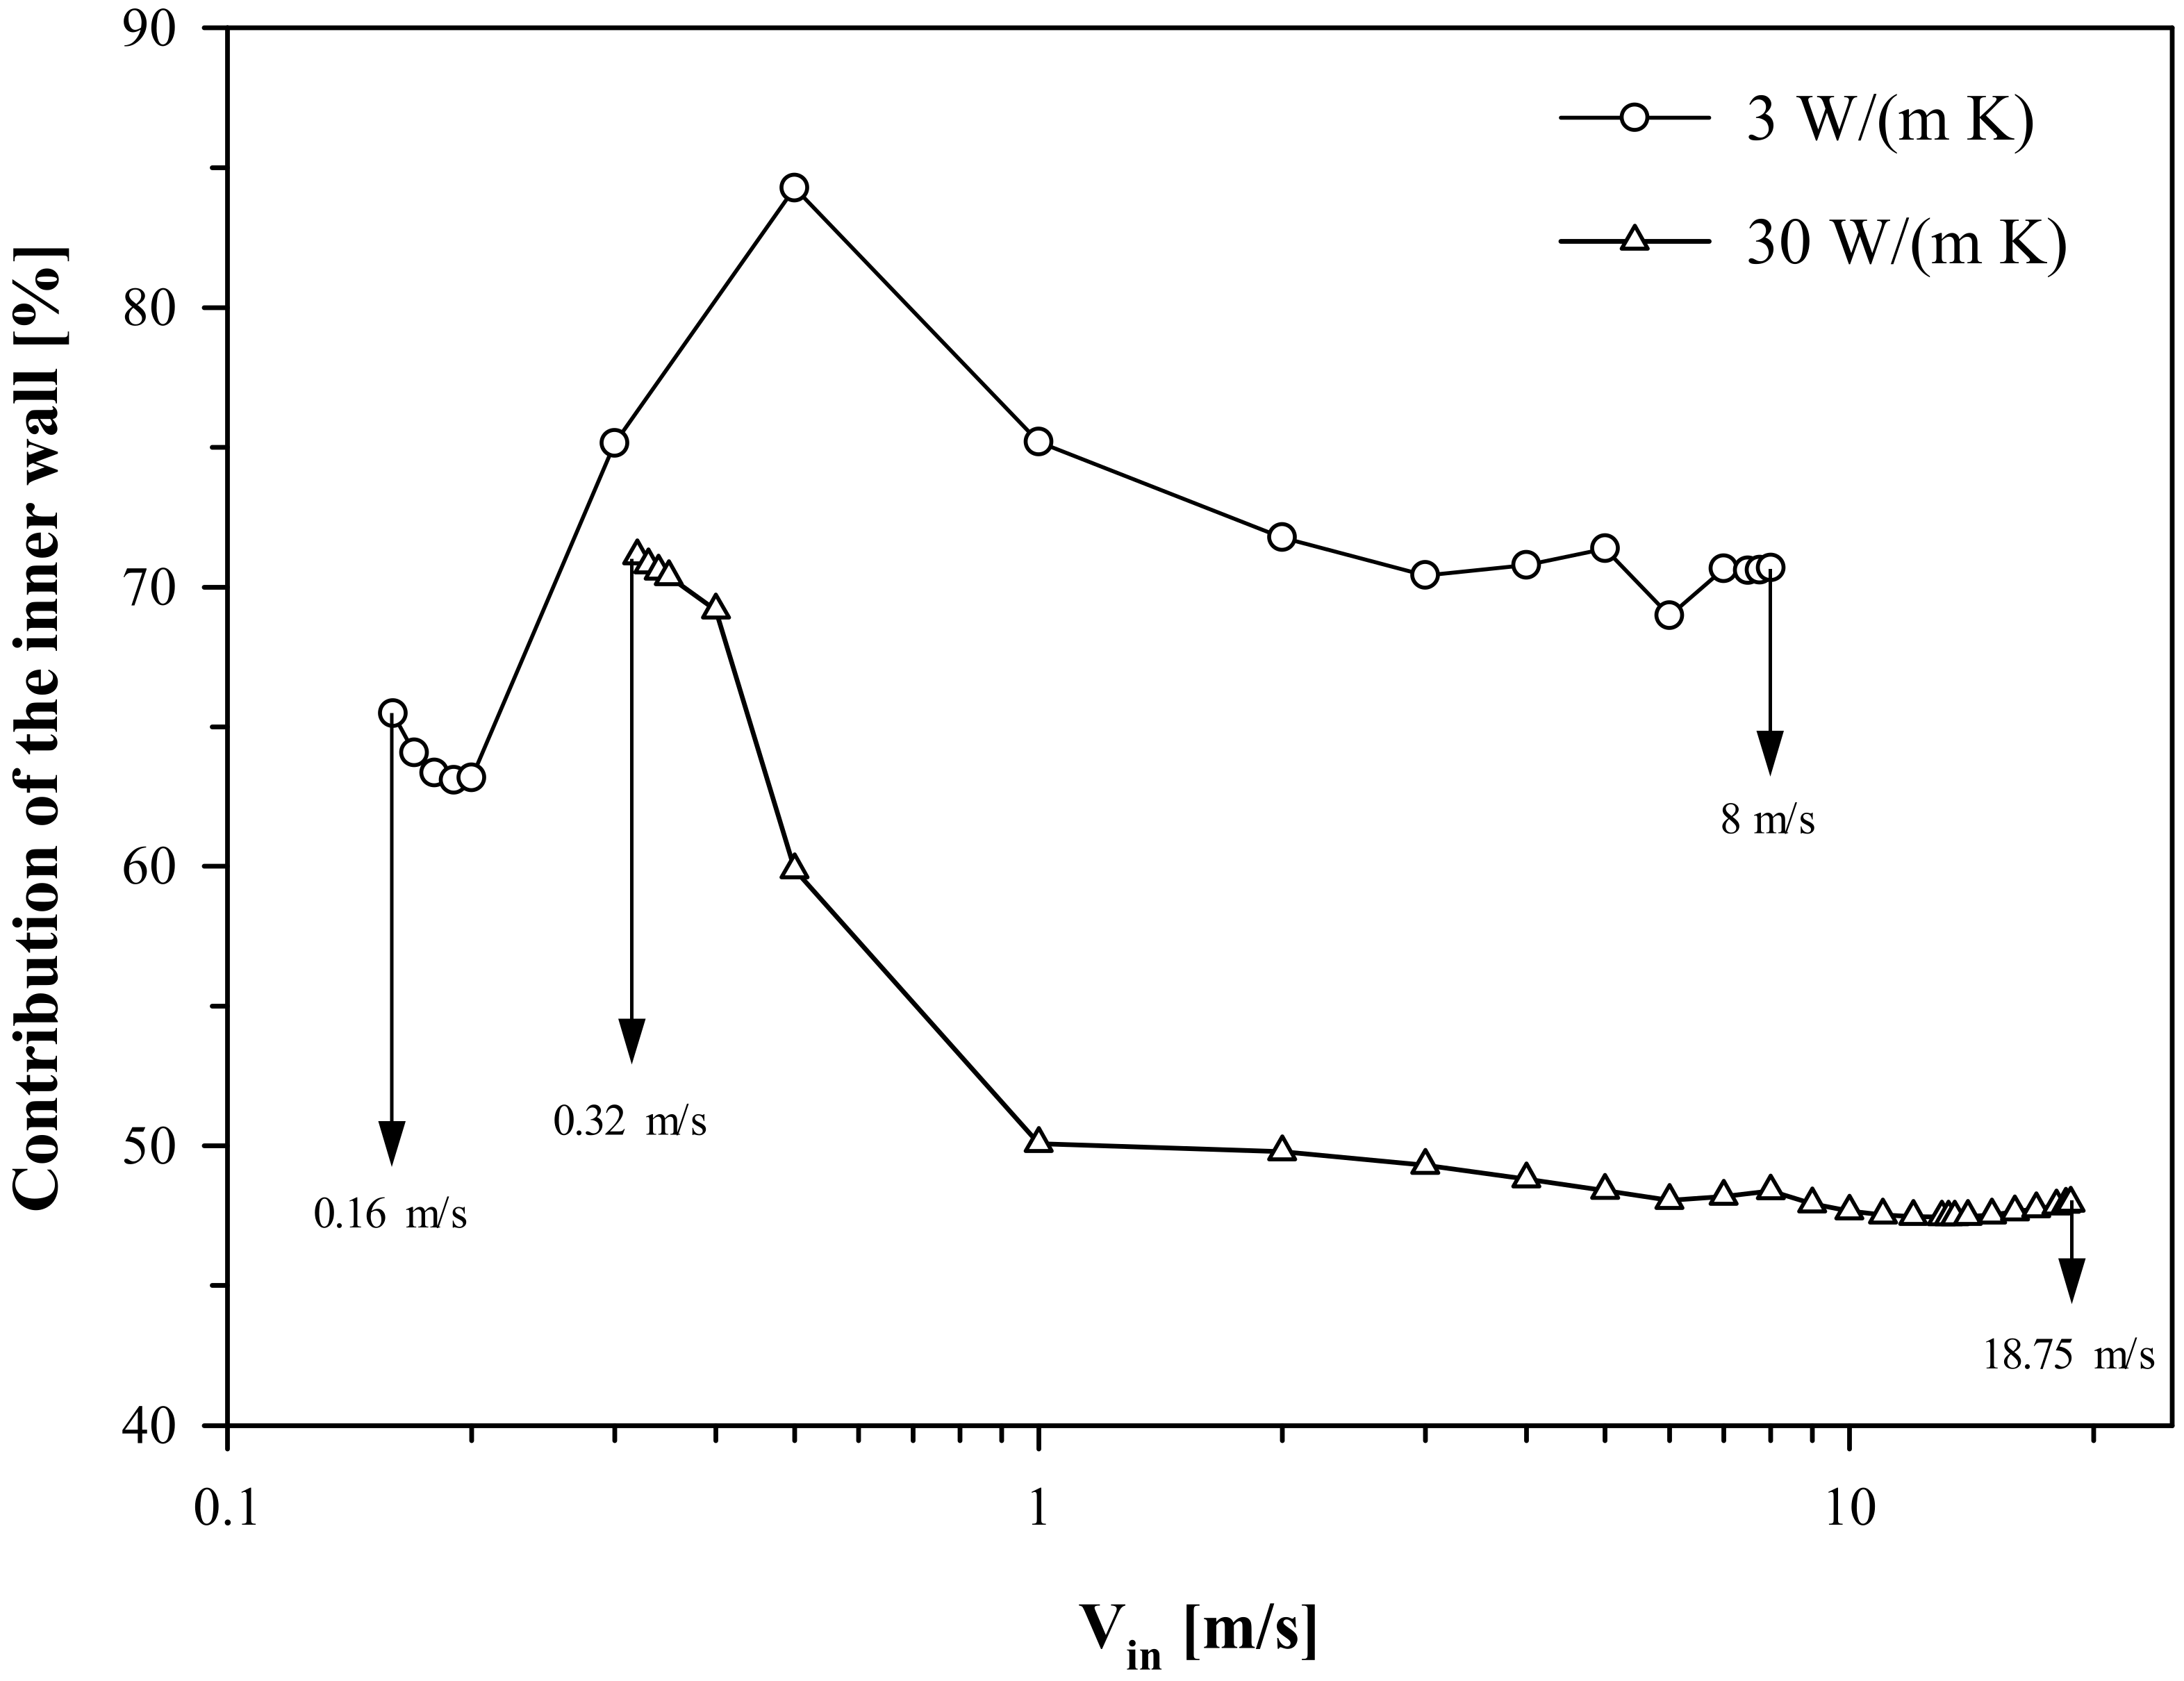
Figure 12 shows, for configuration (A), the contribution of the inner wall to the catalytic conversion of propane as a function of V
in at both low and high thermal conductivity. Irrespective of the wall conductivity, the contribution of the inner wall exceeds ~65% at low velocities close to extinction. This corroborates the earlier observation that the resistance to extinction is controlled by catalytic reactions on the inner wall. On the other hand, for configuration (A), the key role of the inner wall in ruling the extinction behavior has also been pointed out through simulations run differentiating the thermal conductivity between the inner and outer walls [
25].
Quantification of the contribution of the two walls to the catalytic conversion of propane also helps in understanding the high sensitivity of the blowout stability of configuration (A) to the variation in thermal conductivity. At low thermal conductivity, the wall most contributing to the catalytic conversion of propane is the inner wall for the entire range of inlet velocities. In contrast, at high thermal conductivity, the inner wall most contributes only close to extinction; moving towards higher velocity values, the contribution of the inner wall decreases and settles down to a value of about 50% maintained until blowout occurs. Specifically, the inner and outer walls contribute equally for V
in ≥ 1 m/s. This means that both walls rule the high-velocity behavior. It may be recalled from
Figure 10 that, at high thermal conductivity, homogeneous contribution decreases steadily beyond 10 m/s and the catalytic reaction determines blowout. Hence, the fact that the two catalytic walls work in tandem imparts a much higher resistance to blowout.
In this work, micro-reactor stability was used as the primary criterion to determine the design choice of catalyst placement as a function of the wall thermal conductivity. There can indeed be other criteria one could choose for determining an ideal configuration. Two possible criteria other than stability could be maximum device temperature kept below a threshold and complete fuel conversion. The overall design scenario and analyses at the low-velocity (extinction) limit do not change. This is because lower velocities (and higher residence times) ensure low reactor temperatures and high propane conversion. As velocity increases, the desired operating region shrinks for either temperature or propane conversion criteria. When comparing the different design parameters, configuration (A) shows a lower maximum temperature and higher conversion than the other two configurations (see
Figure 4 and
Figure 8).
3. Mathematical Model
The CFD model used in this work considers conduction and convection in the gas phase, conduction within the solid walls, external convective heat losses, and chemical reactions both in the gas phase (homogeneous) and at the gas–solid interface (catalytic). The model equations are the conservation equations for mass, momentum, energy, and chemical species in the fluid as well as the conservation equation for energy in the solid walls.
The kinetics for homogeneous combustion was implemented from the one-step propane combustion rate by Westbrook and Dryer [
40]:
with the activation energy expressed in J/kmol and the species concentrations in kmol/m
3.
A one-step reaction rate was also assumed for catalytic propane combustion [
41]:
with the activation energy expressed in J/kmol and the concentration of propane in kmol/m
2.
At the inlet, uniform profiles for axial velocity, temperature and species mole fractions were specified.
Table 2 details the inlet conditions. The inlet Reynolds number defined based on the inlet gas velocity, gas kinematic viscosity at ambient conditions, and channel gap size, is also reported in
Table 2. Since its highest value is equal to around 760, the flow was assumed to be laminar.
At the outlet, a condition of fixed static pressure was assigned. No slip was applied on the gas–solid interface. All the outer surfaces exposed to the surroundings were assumed to lose heat via convection. The convective heat transfer coefficient, h∞, was set to 10 W/(m2 K), and the ambient temperature to 300 K.
The ideal gas law was used to compute the fluid density. The fluid viscosity and thermal conductivity were assumed to vary with temperature according to the laws reported (for nitrogen) in Canu [
42]. The specific heat capacity for each species was computed as a piecewise fifth-power polynomial function of temperature, whereas the mixture-averaged specific heat capacity was calculated as a mass-fraction average of the pure species heat capacities.
Computations were performed on a uniform grid with ~ 1.5 × 10
4 square cells of 0.04 mm size. This resolution allowed obtaining grid-independent solutions [
25]. The conservation equations were solved semi-implicitly with a segregated solver. The pressure–velocity coupling was treated using the SIMPLE (Semi-Implicit Method for Pressure-Linked Equations) algorithm. Second-order schemes were adopted for the spatial discretization of all terms. Convergence was confirmed by: (1) the residual of each equation going below 1 × 10
−12; (2) the satisfaction of the global mass and energy balances; and (3) the invariance of temperature and propane mole fraction monitored at various locations for at least 1 × 10
4 iterations.
4. Conclusions
The combined effect of catalyst placement and solid thermal conductivity on the stability of a U-bend catalytic heat-recirculating micro-combustor was investigated for lean premixed propane/air combustion using CFD. The combustion behavior and device stability on varying the inlet gas velocity (i.e., the input power) were analyzed at both low (3 W/(m K)) and high (30 W/(m K)) wall thermal conductivity, and three configurations based on catalyst placement were compared. These included configurations in which—(A) both inner and outer walls, (B) only the inner wall, and (C) only the outer wall—are catalyst coated.
At low thermal conductivity, configuration (B) exhibits the same resistance to extinction as configuration (A). In contrast, at high thermal conductivity, configuration (A) with both walls catalytic shows much higher resistance to blowout than either configuration (B) or (C). The practical implication of these results is that, for low-power systems, which typically lose stability via extinction and thus require low-conductive materials, an optimal catalyst placement can be identified in a partially coated configuration, i.e., configuration (B). Conversely, for high-power systems, which are prone to blowout and, as such, require highly conductive materials, a full coating of both the inner and outer walls is needed to guarantee higher stability.
The relative homogeneous contribution to the conversion of propane for all configurations, and the roles of catalytic reactions on inner and outer walls of configuration (A) were analyzed to elucidate these findings. Catalytic reaction controls the resistance to extinction of all cases and, at high thermal conductivity, it also controls the resistance to blowout of configuration (A). Especially at low thermal conductivity, the catalytic inner wall plays a key role in determining the low-velocity behavior, whereas at high thermal conductivity, both catalytic inner and outer walls rule the high-velocity behavior working in tandem. Consequently, high-conductivity walls show lower resistance to extinction for all three configurations, with configuration (C) (outer wall catalytic) at 30 W/(m K) showing the least resistance to extinction among all cases considered. Finally, a significant increase in resistance to blowout was observed in configuration (A) when switching from low to higher conductivity walls. Although obtained on one specific geometry, these results constitute a starting point for an optimal design of catalytic heat-recirculating micro-combustors based on a catalyst placement properly chosen as a function of the wall thermal conductivity.


