Review

Modified Catalysts and Their Fractal Properties

1
Surface Chemistry and Catalysis Laboratory, “Ilie Murgulescu” Institute of Physical-Chemistry of the Romanian Academy, 202 Spl. Independentei, 060021 Bucharest, Romania
2
Faculty of Applied Chemistry and Materials Science, University Politehnica of Bucharest, 1-7 Gheorghe Polizu St., 011061 Bucharest, Romania
*
Authors to whom correspondence should be addressed.
Catalysts 2021, 11(12), 1518; https://doi.org/10.3390/catal11121518
Submission received: 10 November 2021 / Revised: 3 December 2021 / Accepted: 11 December 2021 / Published: 14 December 2021
(This article belongs to the Special Issue Effect of the Modification of Catalysts on the Catalytic Performance)

Abstract

:
Obtaining high-area catalysts is in demand in heterogeneous catalysis as it influences the ratio between the number of active surface sites and the number of total surface sites of the catalysts. From this point of view, fractal theory seems to be a suitable instrument to characterize catalysts’ surfaces. Moreover, catalysts with higher fractal dimensions will perform better in catalytic reactions. Modifying catalysts to increase their fractal dimension is a constant concern in heterogeneous catalysis. In this paper, scientific results related to oxide catalysts, such as lanthanum cobaltites and ferrites with perovskite structure, and nanoparticle catalysts (such as Pt, Rh, Pt-Cu, etc.) will be reviewed, emphasizing their fractal properties and the influence of their modification on both fractal and catalytic properties. Some of the methods used to compute the fractal dimension of the catalysts (micrograph fractal analysis and the adsorption isotherm method) and the computed fractal dimensions will be presented and discussed.

Graphical Abstract

1. Introduction

The power of self-similarity as a fractal property was first emphasized in 1975 by B.B Mandelbort [1,2]. Following this finding, many processes and phenomena were analyzed as fractal behavior: light scattering on rough surfaces [3], fractal antennae [4], diffusion-limited aggregation [5], fractures [6], reaction kinetics [7], tumor diagnosis and cancer therapy [8,9] and, recently, mechanical responses of cell membranes [10].
In 1984, David Avnir, Dina Farin and Peter Pfeifer [11] reported that, at the molecular scale, the surfaces of most materials are fractal. This property leads to scaling laws of great interest in the description of various processes specific to heterogeneous chemistry: physical adsorption, chemisorption, and catalytic processes. Lately, a series of articles regarding the fractal analysis of surfaces of some catalysts and catalytic reactions have appeared in literature [12,13,14,15,16,17,18,19,20,21,22,23,24,25,26].
Tailoring catalysts with high activity in specific reactions is a challenging field of interest. Strategies implying the influence of particle size on catalytic properties [27] or metal-support interaction [28] or morphological controlling, metal deposition and chemical treatment [29] are largely seen in the literature. In the following, we shall focus only on the influence of fractal behavior self-similarity on catalytic properties.
Briefly, from a geometric point of view, catalytic reactions are favored by the existence of a large number of active centers arranged on the irregular surfaces of the catalysts, surfaces that have large specific surface areas (BET). Therefore, the surface of a catalyst can’t be described as a flat surface, but rather as a sum of convoluted flat surfaces. Thus, fractal geometry can describe the surface of a catalyst better than classic, Euclidean geometry. Fractal geometry deals with the description of certain properties and characteristics of catalysts as scale sizes, not as their sums for small entities, keeping the same mathematical properties at different scales.
Not every random structure is fractal [1,2]: it is necessary to verify the existence of the self-similarity property on a sufficiently large scaling area to be able to conclude that the object itself is fractal.
The characterization of a fractal object is related to the measurement of two properties: the fractal dimension and the scaling domain. The fractal dimension, which is often a fractional number between 2 and 3 for surfaces, and, respectively, between 1 and 2 for powders, measures the degree of space occupancy, irregularity and roughness, and becomes close to three for surfaces that tend to “fill” the entire volume and two for surfaces that tend towards the plane, while the domain of self-similarity is the scaling area where the fractal properties are manifested [1,2]. The greater the field of self-similarity, the closer the fractal gets to an ideal mathematical fractal.
This work’s focus is our results regarding the fractal characterization of oxide catalysts with perovskite structure (cobaltite and ferrite), as well as of some supported and unsupported metallic nanoparticles (NP) of Pd, Pt, Rh and bimetallic Pd-Cu, Pd-Ag and Pt-Cu. The fractal characteristics of these catalysts will be correlated with their catalytic properties. Fractal analysis will be performed both by SEM or TEM image analysis of micrographs and by the nitrogen adsorption isotherms method.
Therefore, based on the analyzed catalytic materials, the present paper aims to highlight the fractal character of various investigated catalysts and the means in which the fractal characteristics are tailored based on the modified catalysts. The impact on the catalytic properties will also be emphasized.

2. Results

2.1. Influences of Synthesis Parameters on the Fractal Dimension

2.1.1. Precursor Type Influences the Fractal Dimension of Perovskite

Obtaining catalysts with high fractal dimension, hoping that higher fractal dimensions will lead to higher catalytic activities, is a challenging objective.
To achieve this purpose, systematic studies must be performed to analyze the relation between synthesis parameters—in every case—and catalyst fractal dimensions. From this point of view, it is a large field of research and a vast domain.
Oxides with perovskite structure of LaCoO3 and LaFeO3 were obtained in different preparation conditions by thermal decomposition of the precursors with maleic acid, alpha-alanine, urea and sorbitol [30,31].
Analyzing the nitrogen adsorption isotherms for lanthanum cobaltites (LaCoO3) [30] and lanthanum ferrites (LaFeO3) [31] obtained from different precursors, only Dubinin–Radushkevitch isotherm can be used to fit the experimental data.
The computed fractal dimension of oxide cobaltites are presented in Table 1. Results show the fractal behavior of the analyzed samples related to the BET surface; as expected, a higher fractal dimension corresponds to a higher BET surface.
In the case of Lanthanum ferrites, the calculation of the fractal dimension by direct fitting of the isotherm and by using the Avnir–Jaroniec method leads to low and medium values for the fractal dimension (Table 2). This indicates that J(x), the pore distribution, is not very steep, so there are more and more wide pores in the microporosity regime when the fractal dimension decreases. In this case, multilayer filling of the micropores requires higher pressure values compared to samples with larger fractal dimensions. This behavior is described by type II isotherms. Ferrites obtained using alpha-alanine or sorbitol have similar values of the fractal dimension, indicating a similar microstructure [31].
Both Table 1 and Table 2 show good concordance between the values of the fractal dimension obtained by the two methods (i.e., direct fitting by fractal adsorption isotherms and the Avnir–Jaroniec Method) and, also, that the fractal dimension value is strongly influenced by the preparation method. Larger fractal dimensions are obtained when alanine or sorbitol precursors are used.

2.1.2. The Dopant (Sr) Influences the Fractal Dimension. The Limits of Self-Similarity

Strontium-doped lanthanum cobaltites with concentrations of 0.1–0.3 have a strong effect on the fractal dimension. Our results indicate that the fractal dimension of the doped samples is larger than the fractal dimension of the pure sample (Table 3 and Table 4). Good agreement between the fractal dimension computed by SEM micrographs analysis and by fitting the adsorption isotherms was found (Table 3).
For a more accurate study, Wojsz and Terzyk [33] showed that the detailed isotherm can be fitted with a general Dubinin–Astakhov type isotherm [16], computing the limits of the micropore range as the minimum and the upper limit of the pores size at which fractal behavior is emphasized.
The same conclusions were taken from the analysis of the La1−xSrxCoO3 (x = 0–0.3) samples obtained by the thermal decomposition of alpha-alanine precursors. The results were presented in detail [34] and summarized in Table 4.
Extending the research on other oxide catalysts with perovskite structure such as LaMnO3, both pure and doped with Sr, a different behavior was emphasized. Adding Sr into the Mn perovskite structure seems to have an inverse influence—it decreases the fractal dimension. Although the effect is not very strong, it is an unexpected observation (Table 5).
It can be observed that regardless of the type of catalyst (LaCoO3 or LaMnO3), the introduction of Sr as a dopant will reduce the self-similarity limits of the samples. This means that irrespective of whether the fractal dimension increases or decreases, the fractal properties of the catalyst manifest themselves on a smaller scaling width. The destruction of the fractal character of perovskite materials with the addition of Sr as a dopant seems to be more accentuated in the case of the LaMnO3 sample than in the case of LaCoO3 sample.
Our results show that there are differences between the values of the fractal dimensions obtained by the analysis of SEM micrographs and those obtained from direct fitting of the adsorption isotherms. This behavior can be explained by the fact that TEM micrographs “expose” the surface as seen by the microscope, while the adsorption isotherm “describes” the surface as “seen” by adsorbed nitrogen molecules. In other words, there will be various hidden areas in the case of TEM images not “seen” by nitrogen molecules in the case of adsorption isotherms and, thus, not counted.
To compare the results regarding the catalytic activity of perovskites, the use of the fractal dimensions calculated from the fit of the adsorption isotherms or by the Avnir–Jaroniec method is indicated. These are methods that give a more accurate description of the specific surface, which is responsible for the existence of active centers.

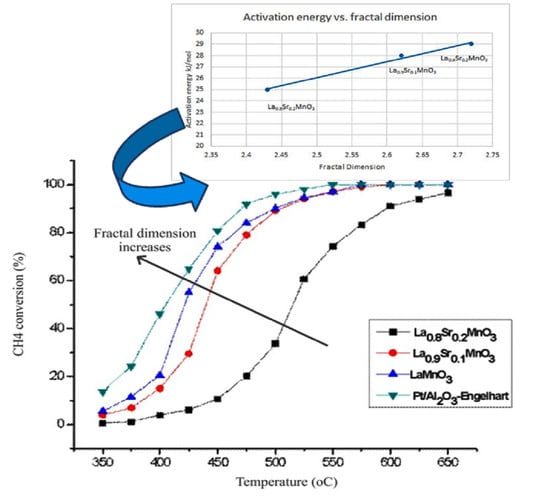
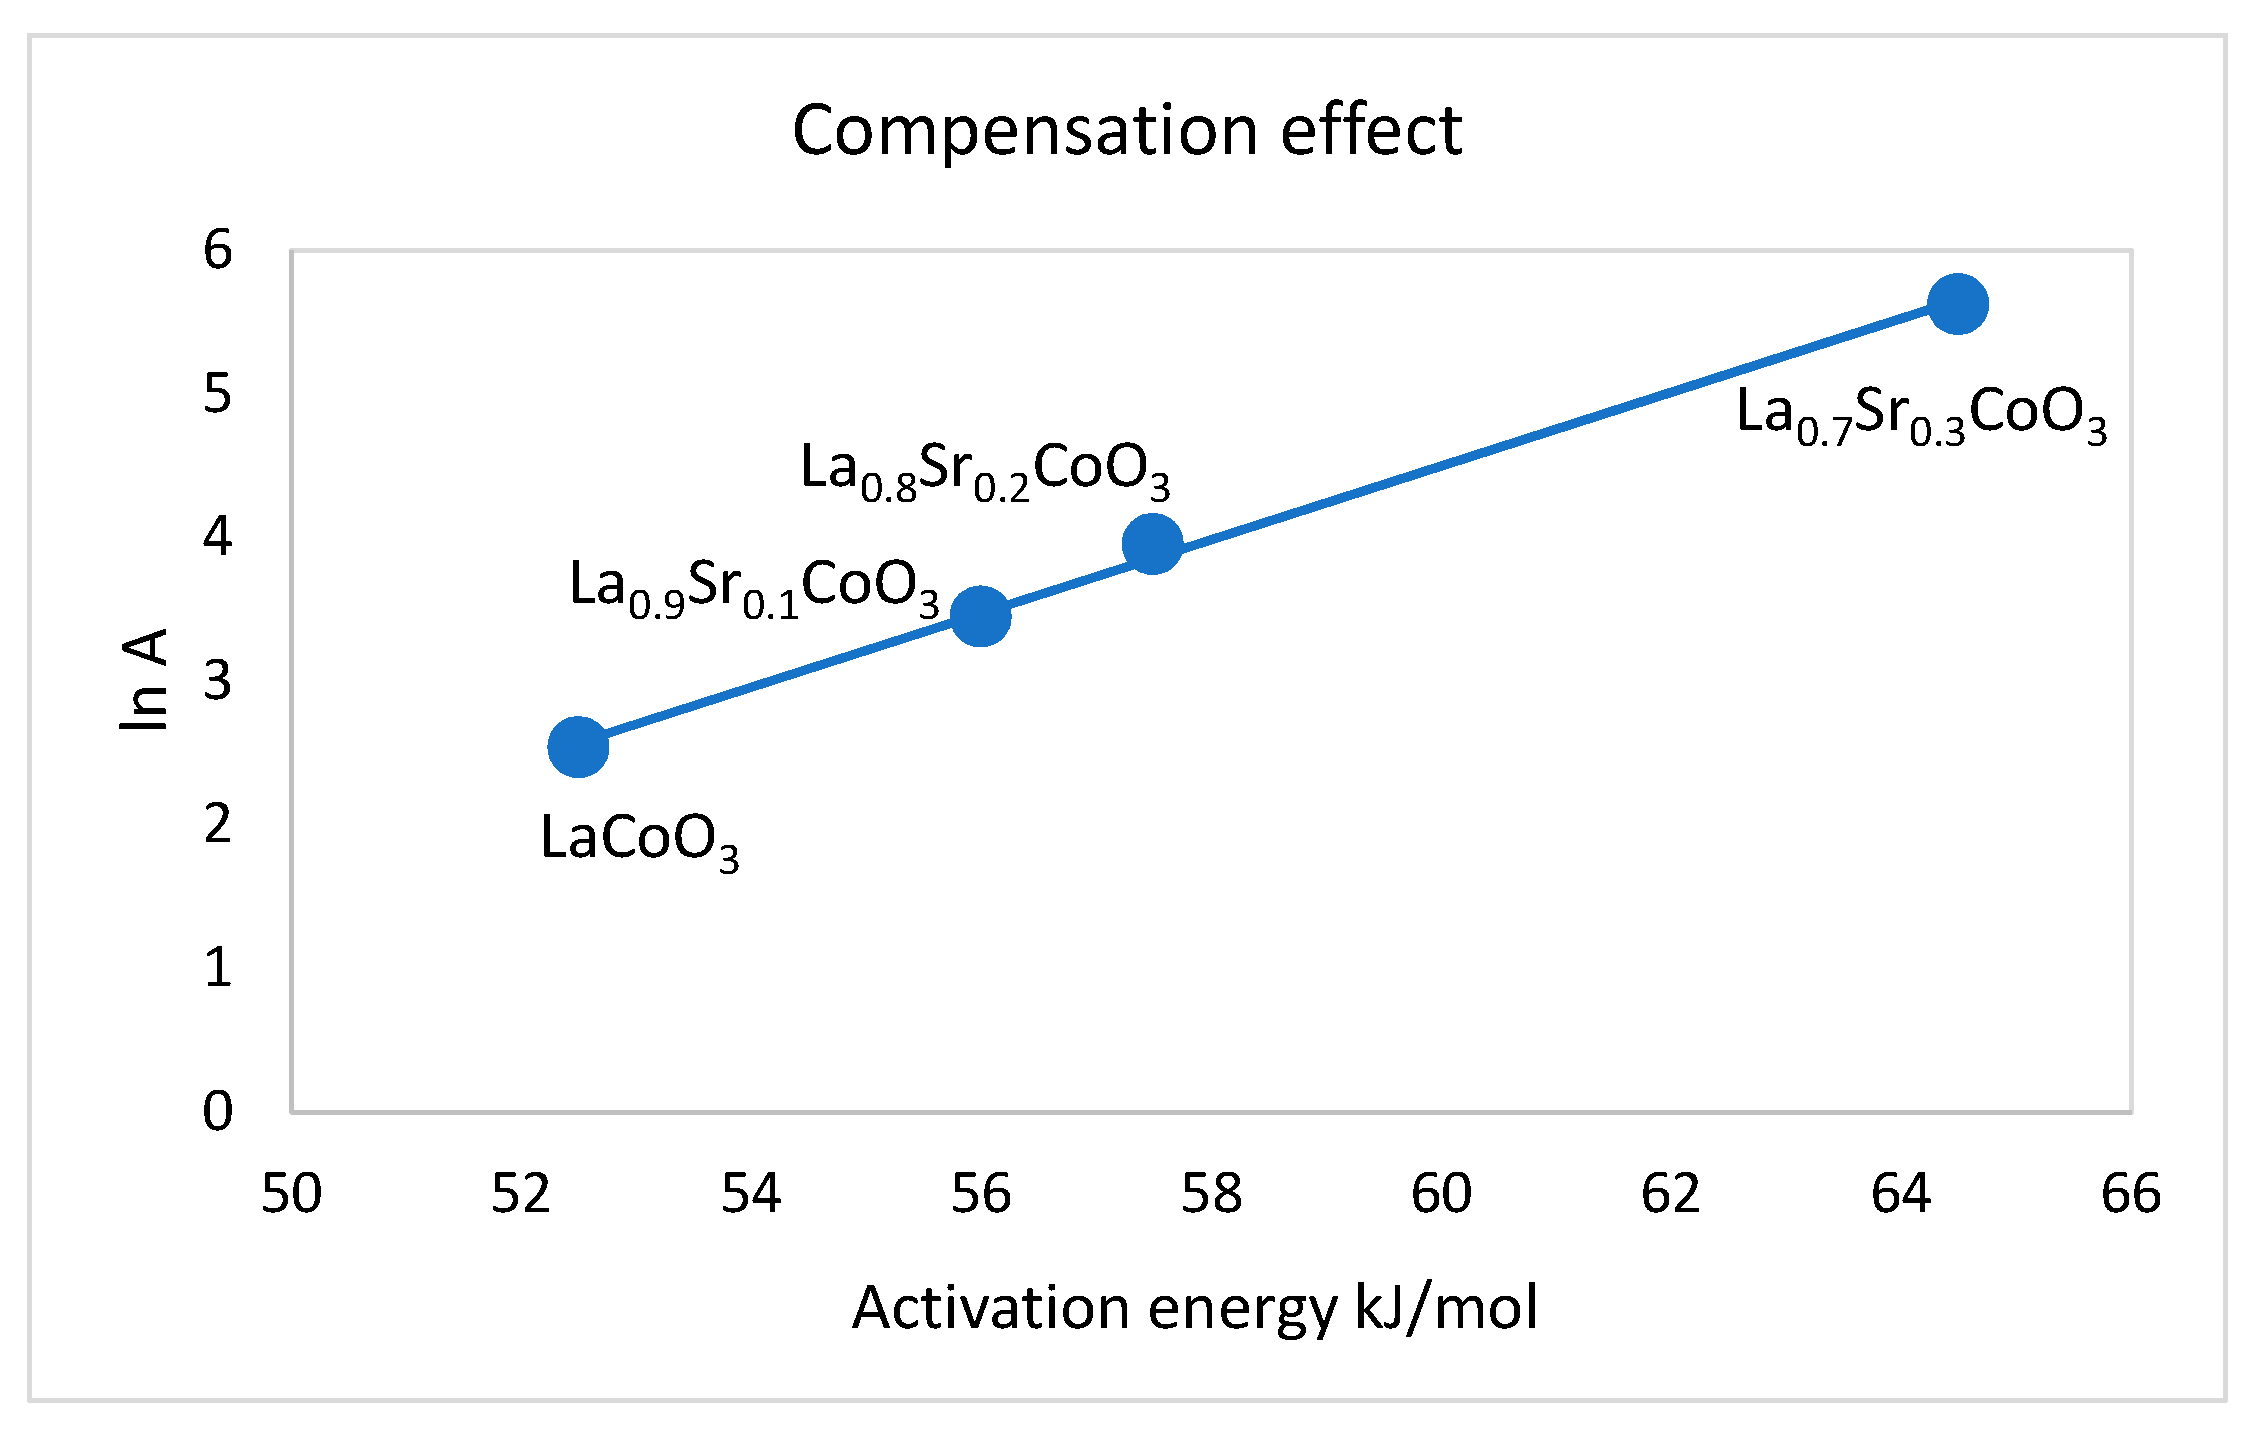
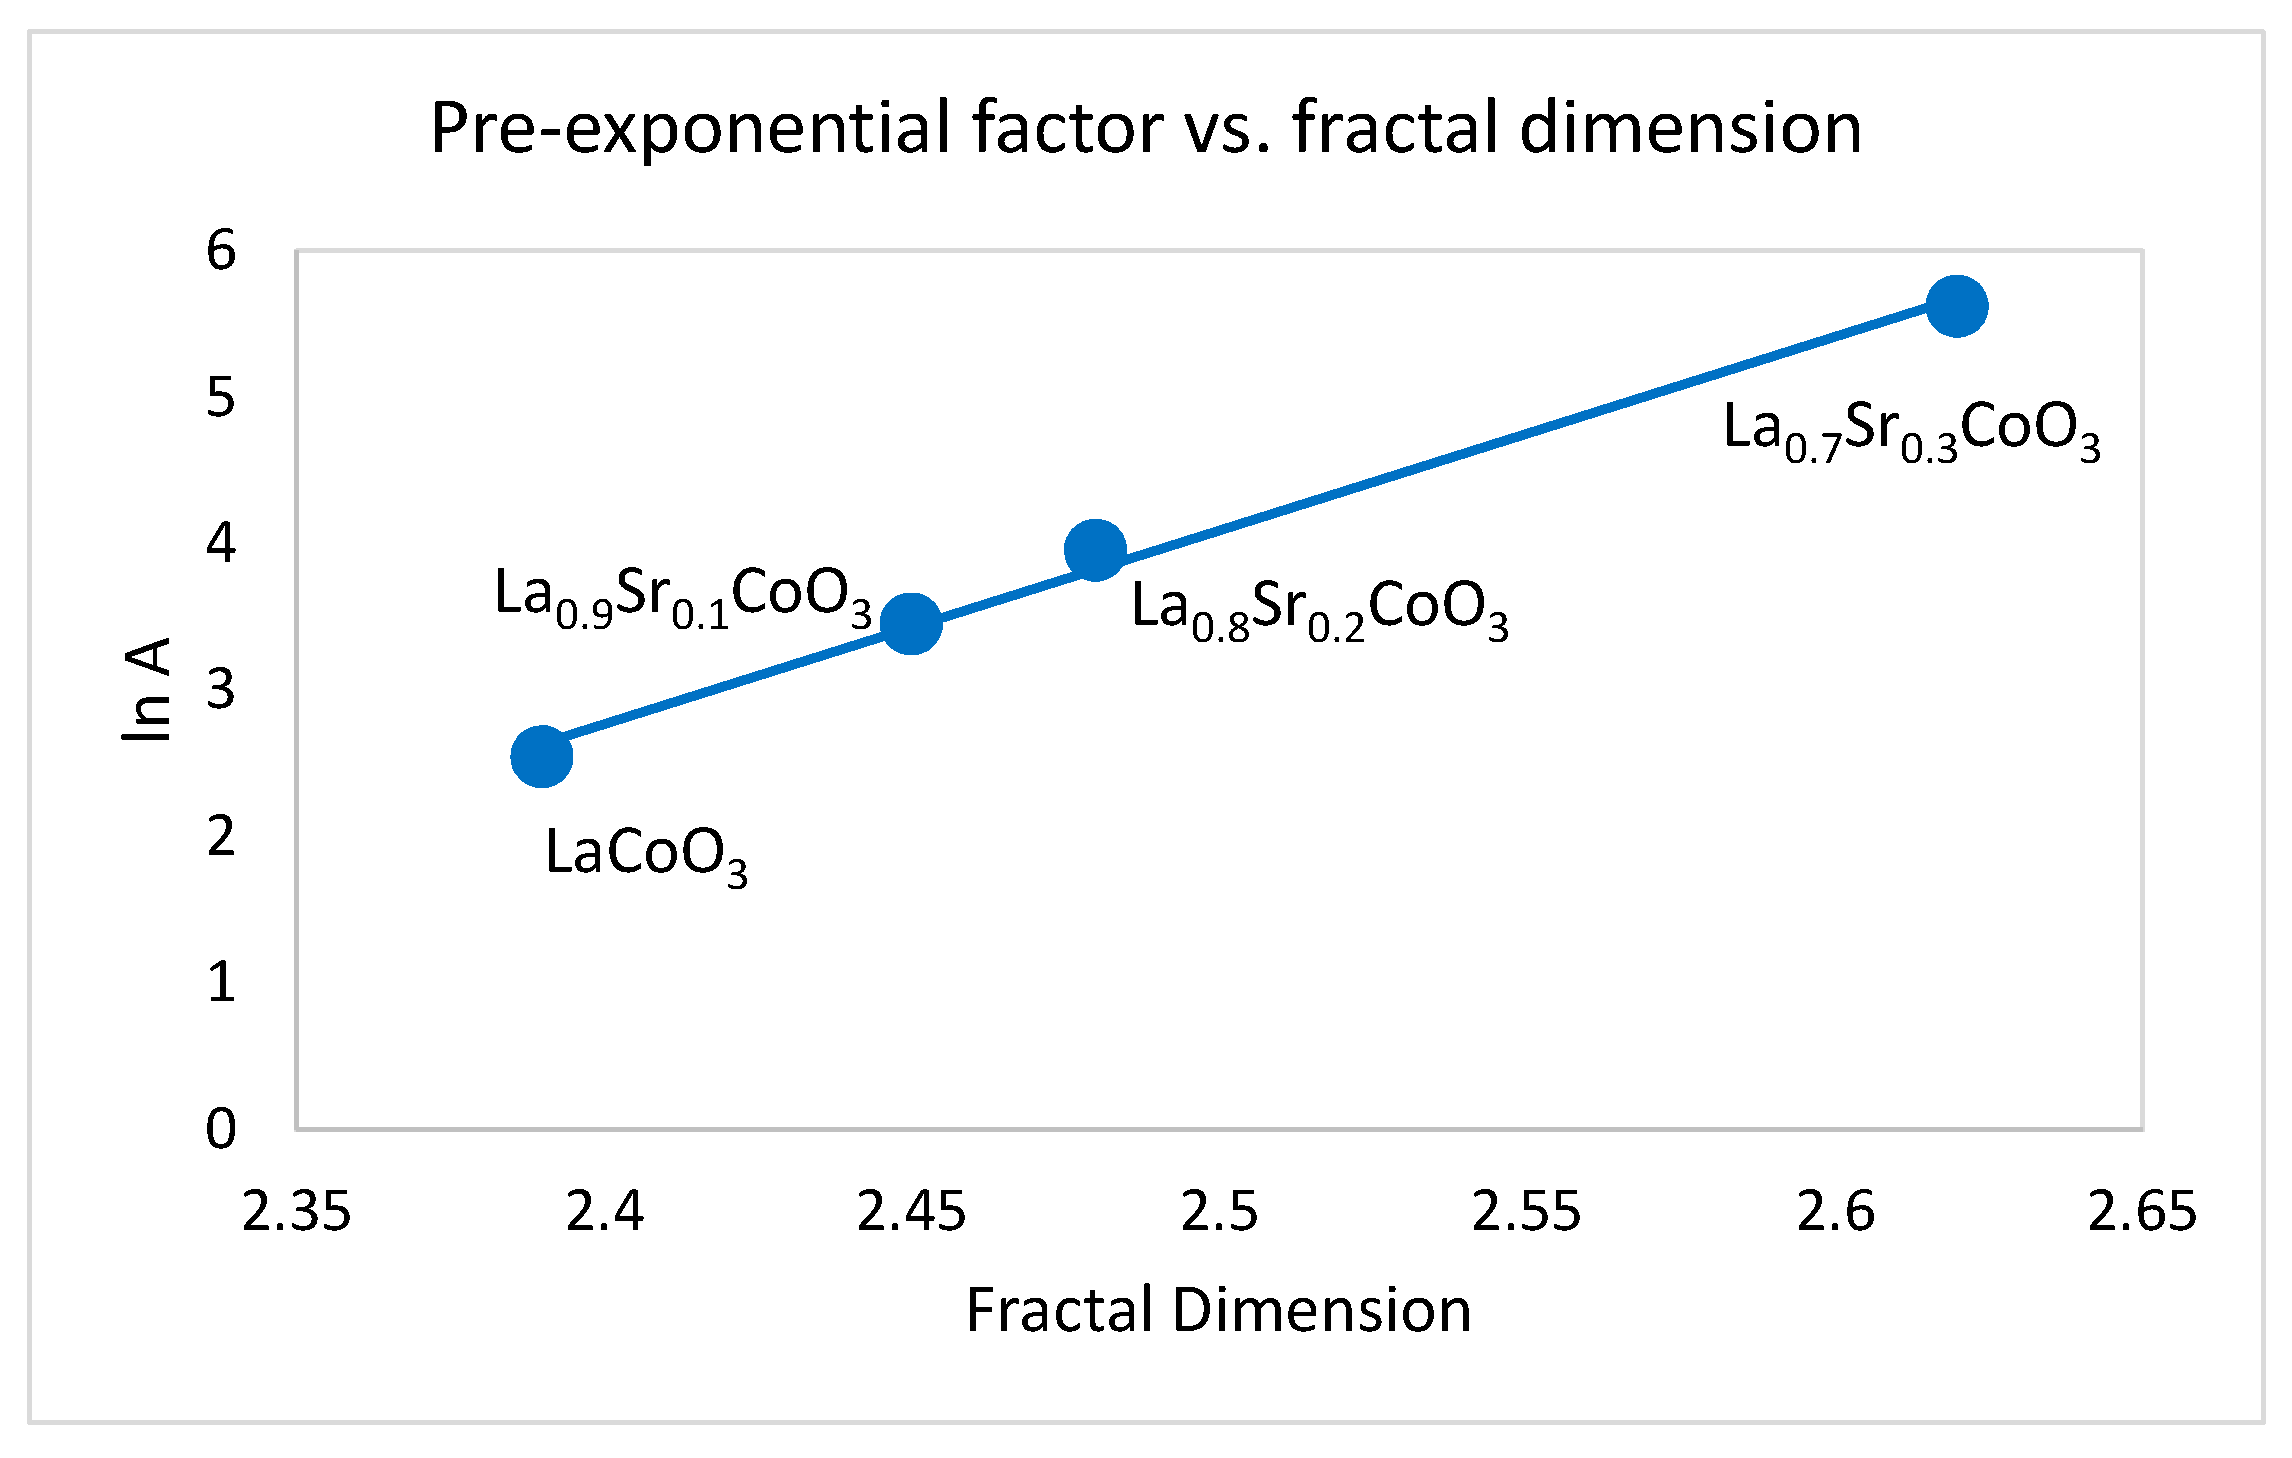
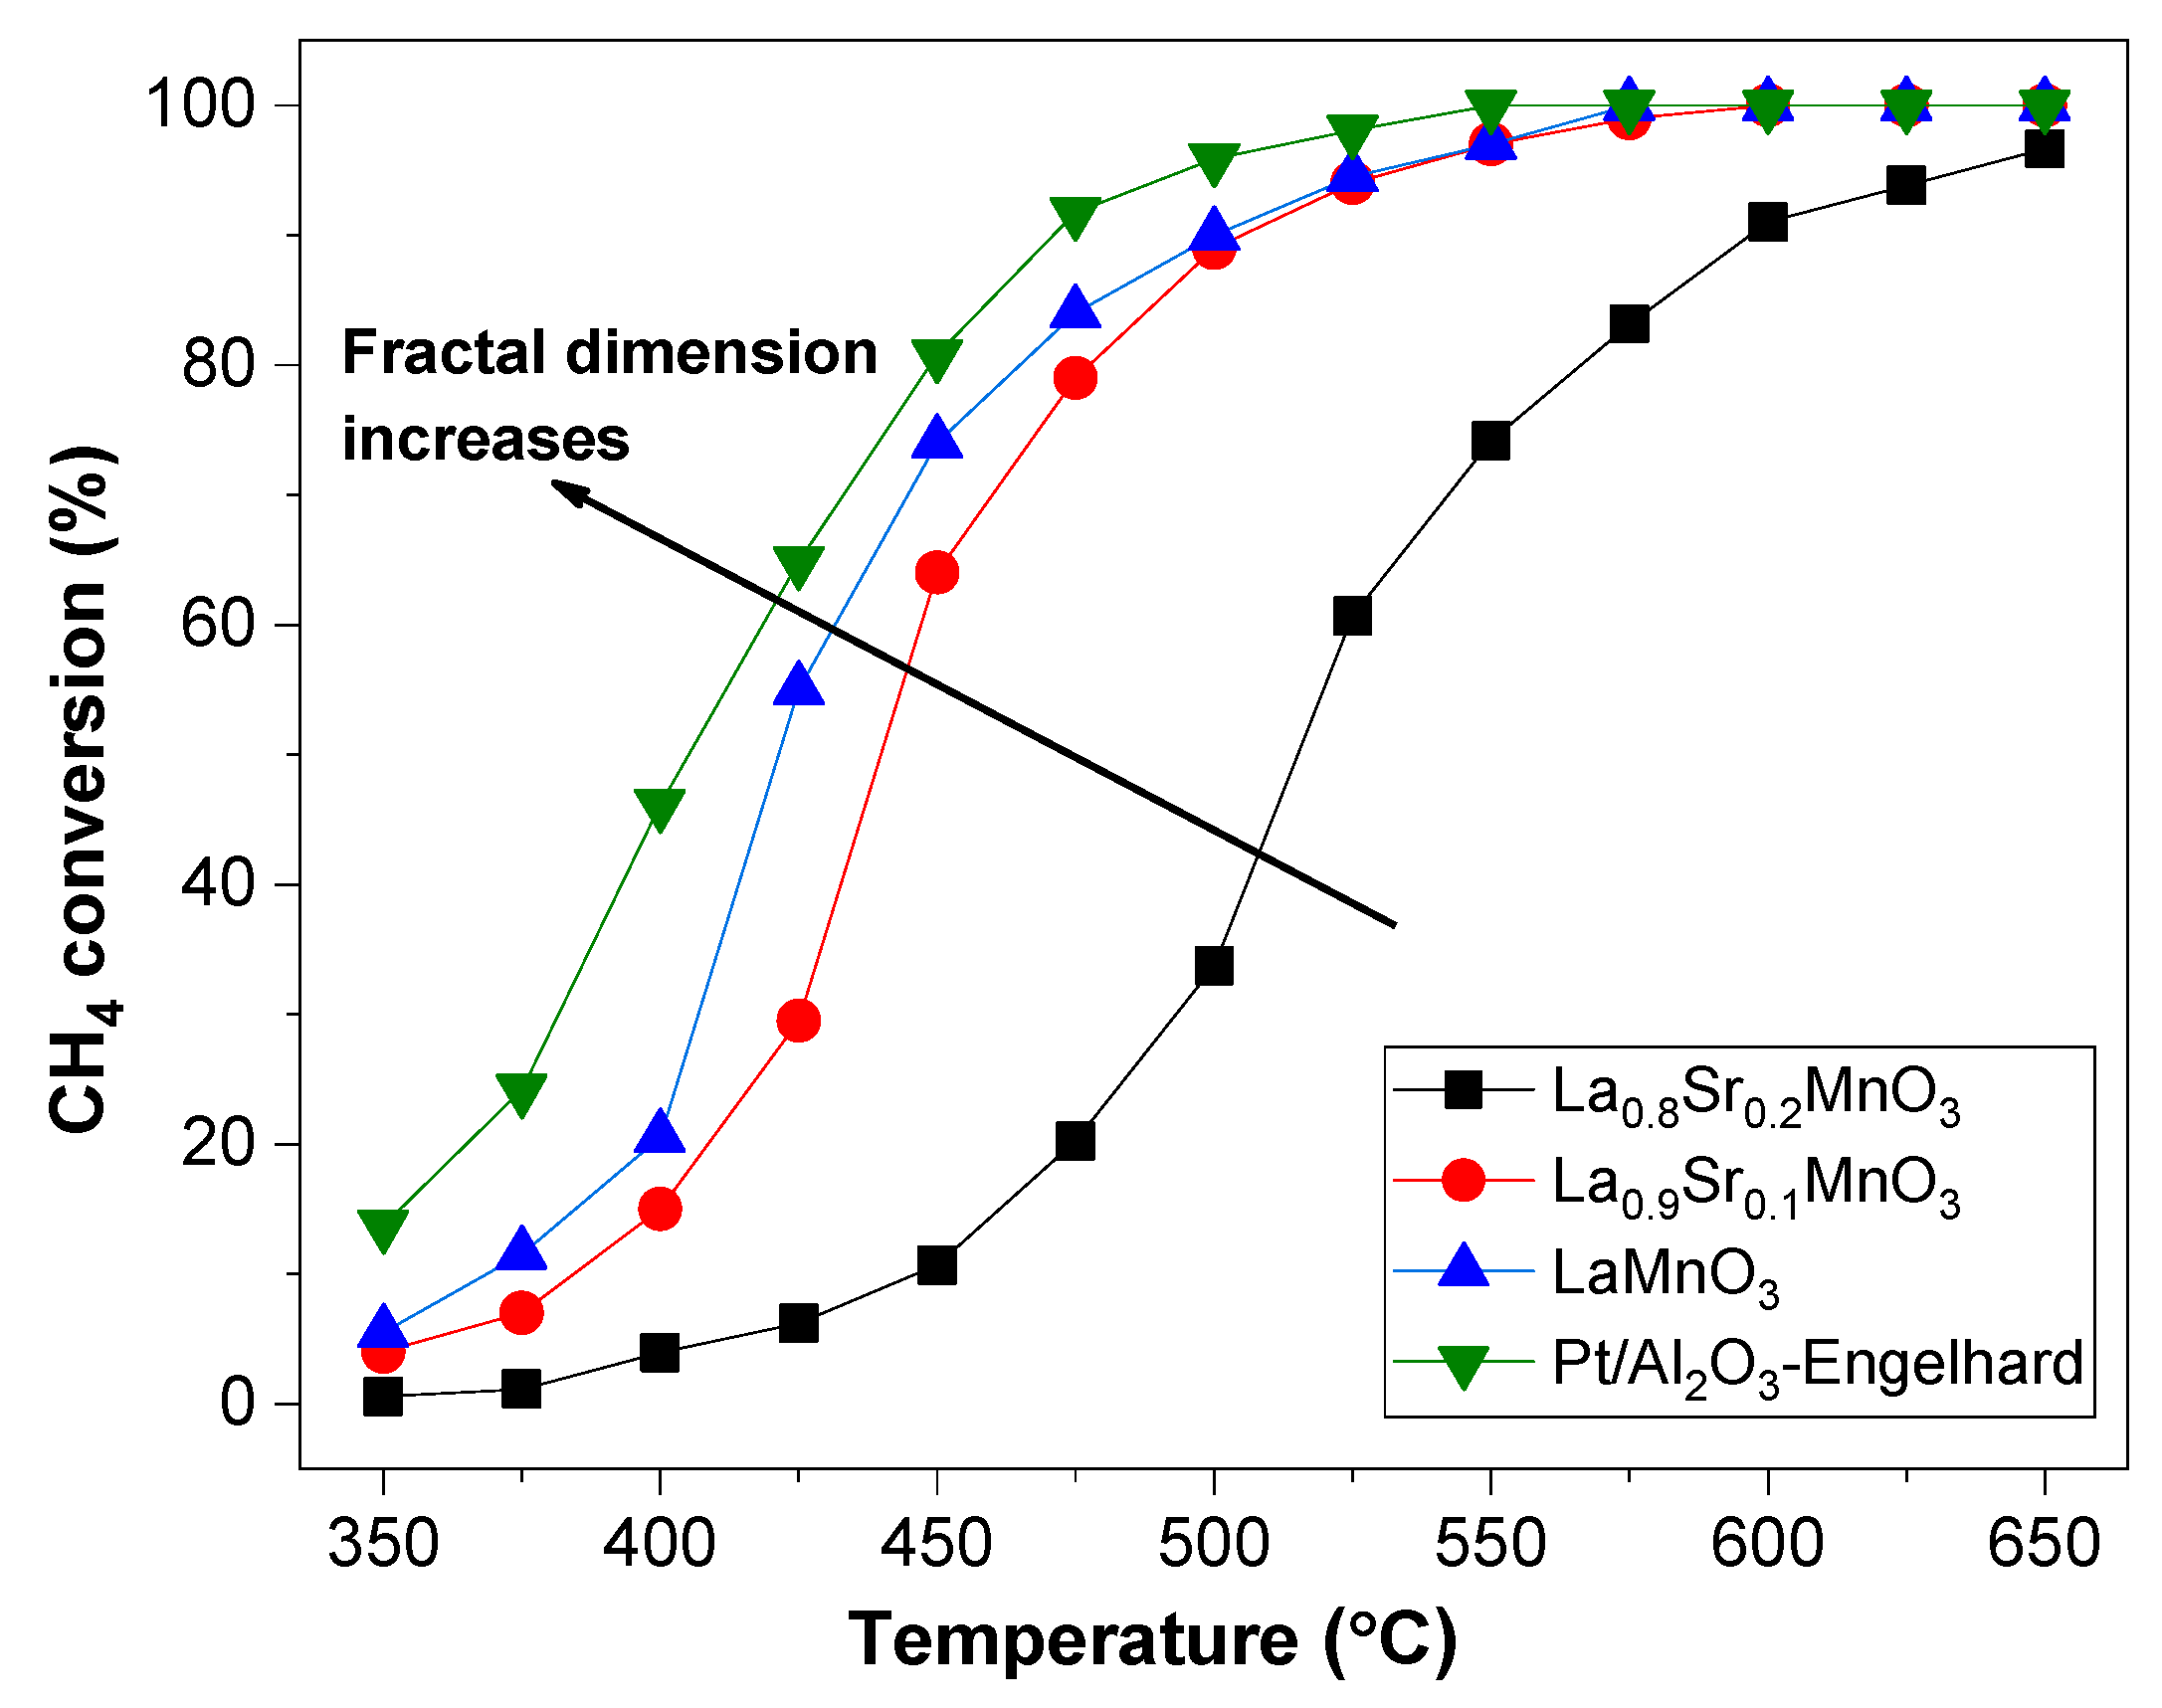
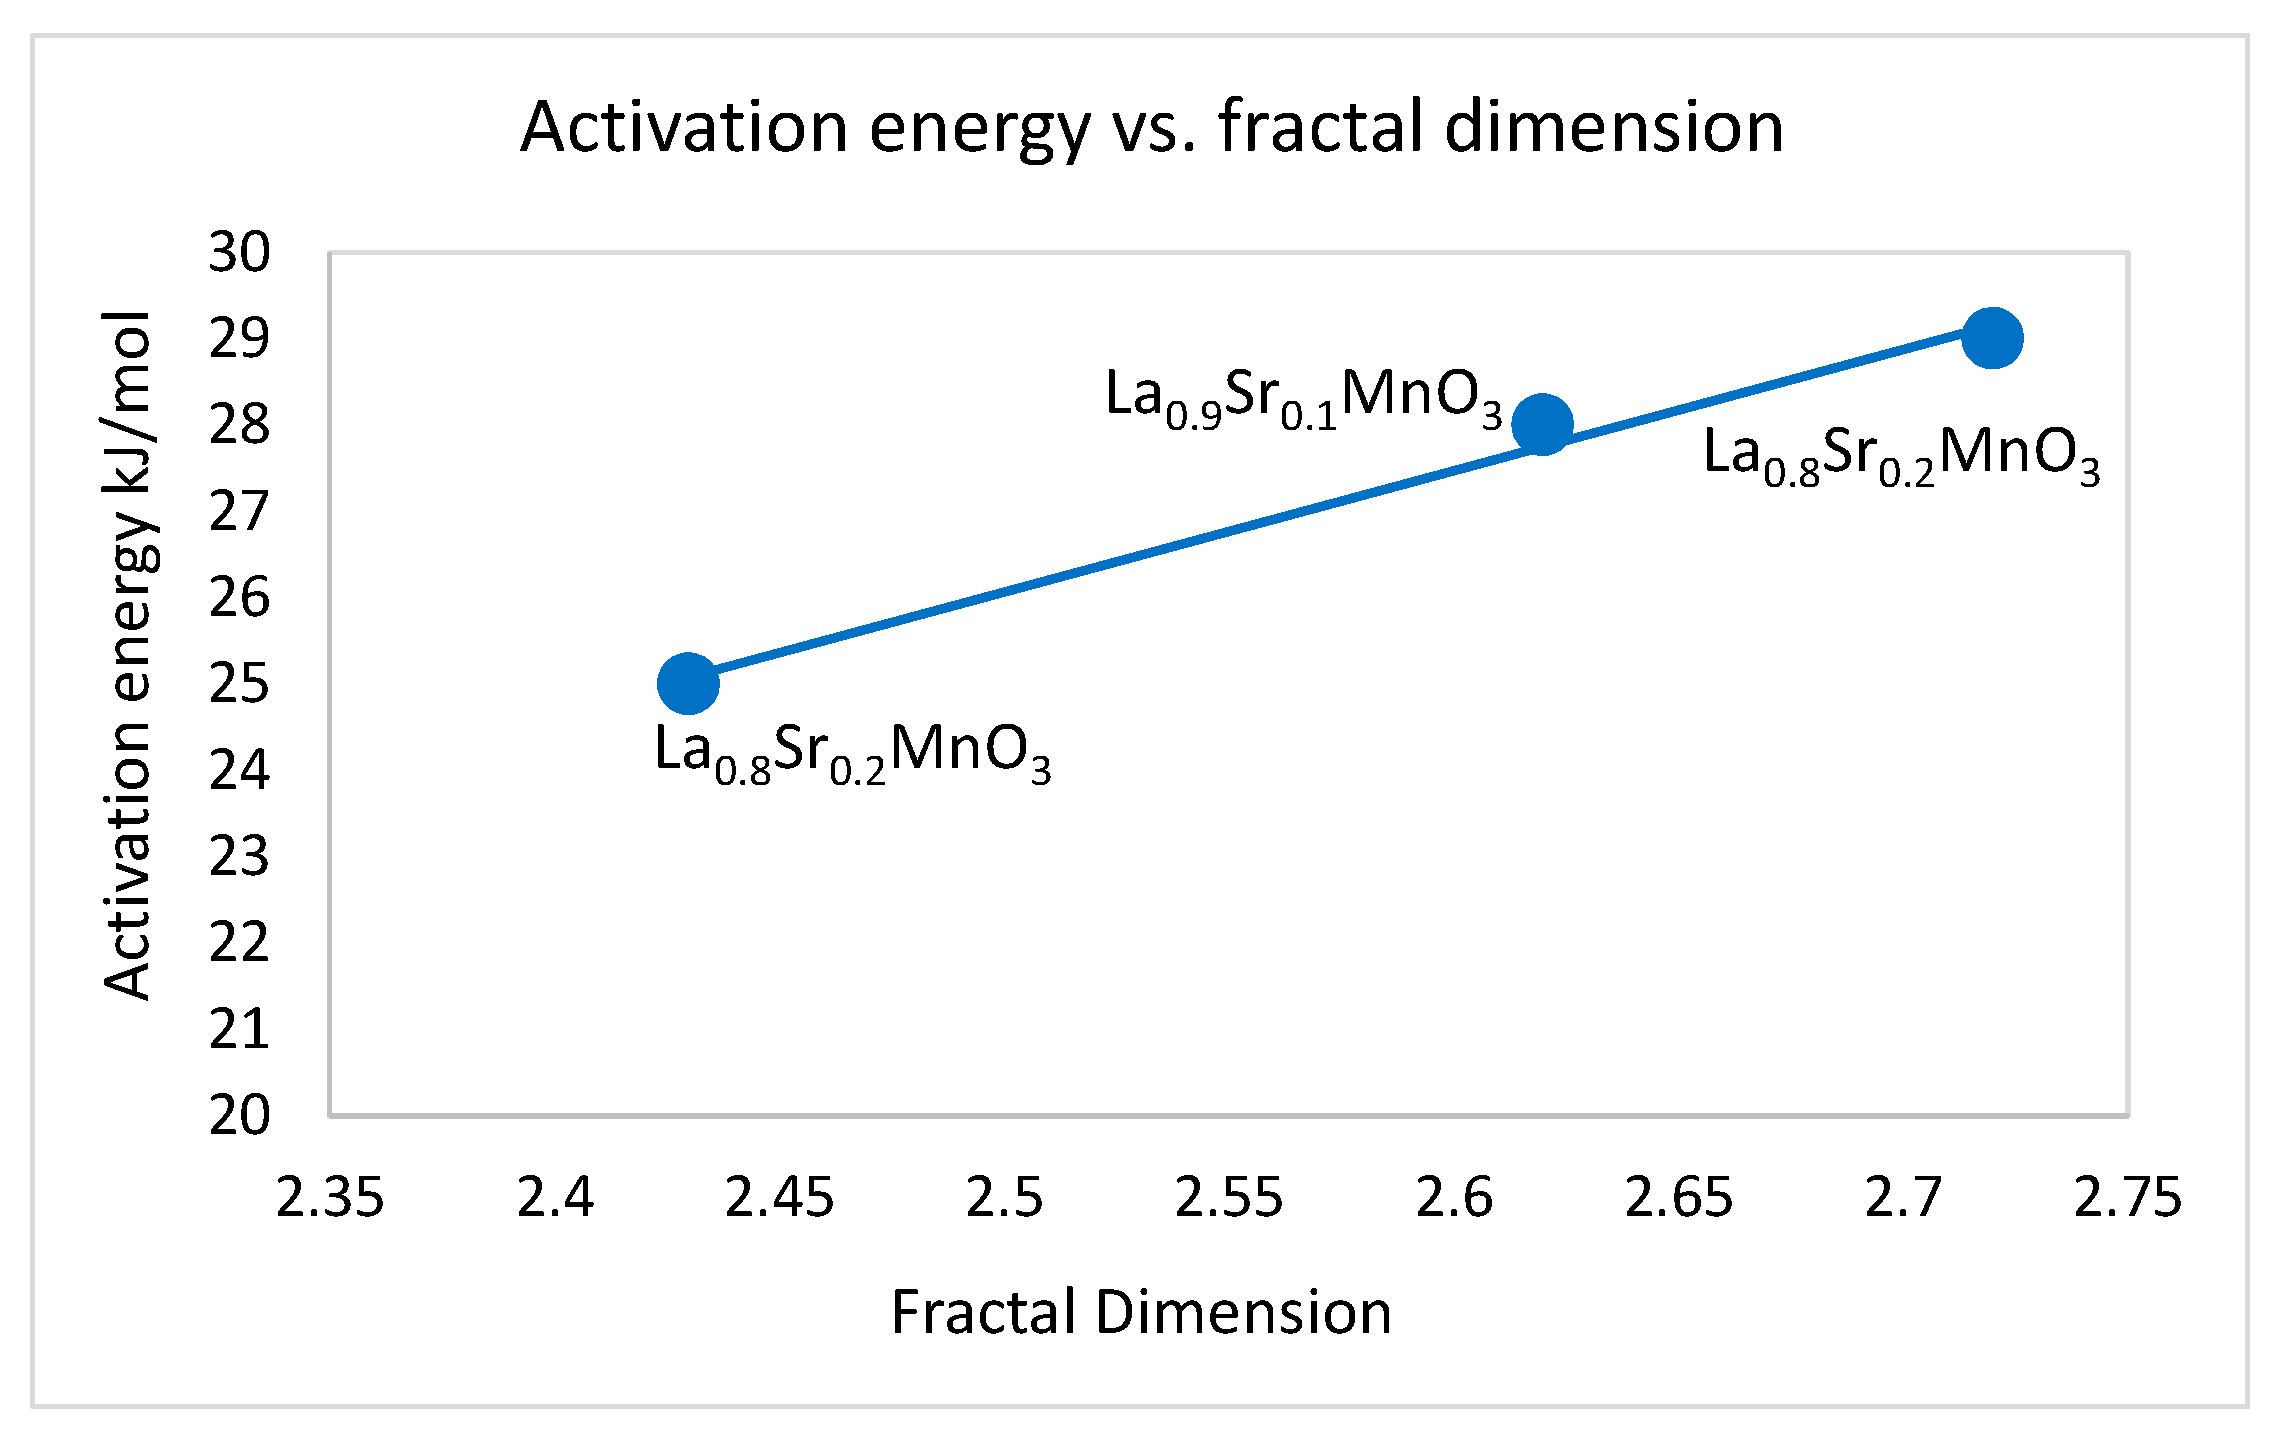
2.2. The Dependence of the Fractal Dimension on Catalytic Activity

Our previous results indicate that both pure and doped LaCoO3 samples [34] exhibit catalytic activity in the hydrogen peroxide decomposition reaction following the sequence LaCoO3 < La0.9Sr0.1CoO3 < La0.8Sr0.2CoO3 < La0.7Sr0.3CoO3. Therefore, as the fractal dimension increases, the catalytic activity also increases (Table 4). This correlation can be explained by the increase in catalytic activity due to the number of vacancies generated by partial substitution of La by the Sr ions. [35,36].
At the same time, there is a linear dependence of the logarithm of the pre-exponential factor lnA and the apparent activation energy for the hydrogen peroxide decomposition reaction, indicating a compensation effect (Figure 1). This effect can be explained by the existence of a non-uniform energetic surface and/or by the dependence of the active centers number on the presence of the Sr ions on the catalyst surface.
Trypolskyi and al. [37] showed that the activation energy in catalytic processes depends on the fractal surface dimension. Our results emphasize the same behavior as the reported paper (Figure 2 and Figure 3).
Sr-doped LaMnO3 catalyst with various concentrations (x = 0–0.2) were also investigated in the methane combustion reaction (Figure 4).
It is observed that the conversion of methane vs. temperature in the total oxidation of methane depends on the used catalyst. Better results were obtained for the pure catalyst compared to those doped with strontium cation. For comparison, the results obtained using Pt/Al2O3 1 wt.% commercial catalyst (Engelhard) are also presented. The reactivity of the three samples decreases following the sequence La0.8Sr0.2MnO3 < La0.9Sr0.1MnO3 < LaMnO3. This is in good agreement with the decrease of the computed fractal dimension according to the same sequence. Moreover, the activation energy of the methane oxidation reaction decreases with the decreases of fractal dimension (Figure 5).

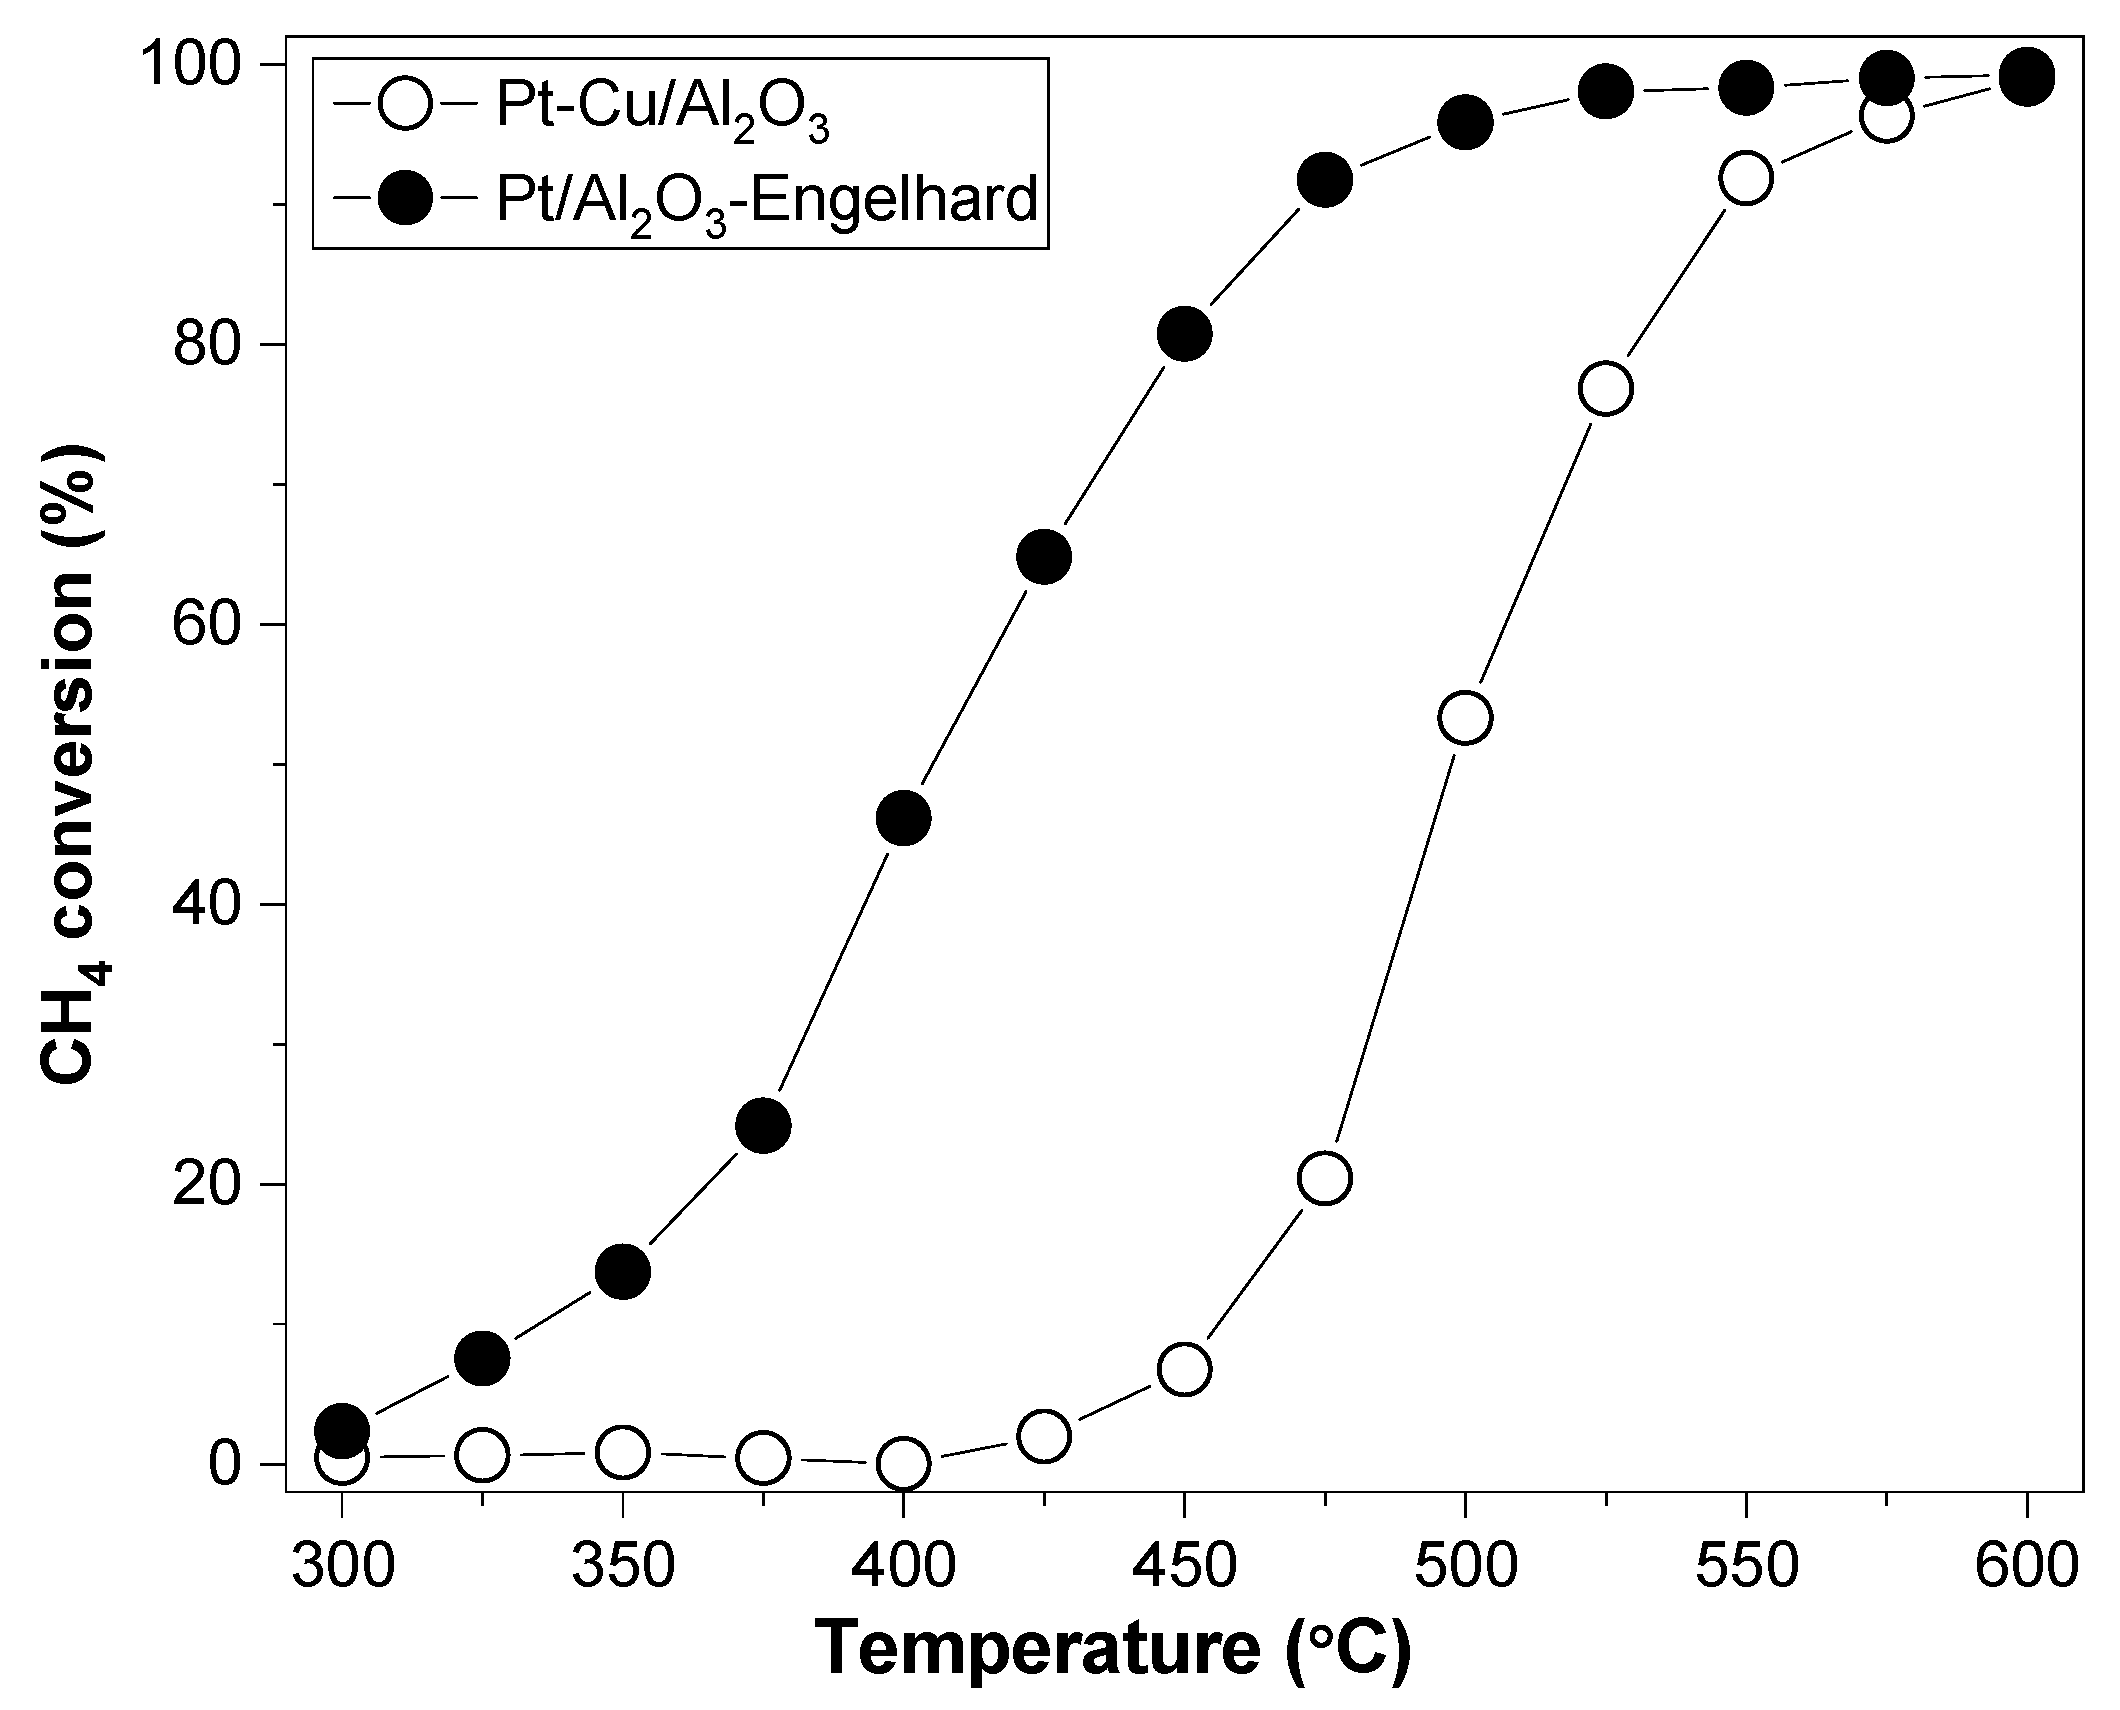
2.3. The Fractal Structure of Mono- and Bi-Metallic Nanoparticles

Mono- and bi-metallic nanoparticles of Pd, Pd-Cu and Pd-Ag were obtained under different conditions, as is described in detail in [38]. Fractal behavior was investigated by TEM micrographs analysis. The D0 fractal dimensions and the lacunarities [20] of the nanoparticles were computed using the “box counting” method and the modified black and white TEM images, considering nanoparticles as 2D black disks (Table 6 and Table 7).
The results presented in (Table 6 and Table 7) indicate self-similarity and fractal properties for all the studied catalysts. It should be noted that the grey-level fractal analysis of TEM images leads to the identification of the structure of nanoparticles (alloy or core-shell type), obtaining the fractal dimension both for the core and for the shell [38].
Another bimetallic nanoparticle system characterized by fractal properties is Pt-Cu prepared in two synthesis variants: with low molar ratio of PVP/Pt4+ = 5 (Pt-Cu)L, and high molar ratio (Pt-Cu)s, PVP/Pt4+ = 10, respectively, as described in the literature [39]. Fractal properties are summarized in (Table 8).
As was described in detail in article [39], the PVP/Pt4+ low molar ratio leads to the formation of larger nanoparticles (between 2 nm and 5 nm), while a PVP/Pt4+ high molar ratio leads to nanoparticles of diameters between 1 nm and 2 nm. This observation can be seen in Table 8 from the analysis of self-similarity limits. The fractal behavior of (Pt-Cu)L nanoparticles indicates a mixture of small particles 1.4 nm–2.5 nm and, respectively, large 2.5 nm–5 nm ones, between which there are long-distance correlations characterized by a fractal size of 2.68. On the other hand, (Pt-Cu)s sample has an homogeneous structure composed of particles of 1.4 nm–2.2 nm, with medium and long-correlated fractal dimensions of 2.73 and 2.88, respectively.
One of the conclusions of the cited article is that unsupported (Pt-Cu)s nanoparticles have a much better catalytic performance than (Pt-Cu)L nanoparticles in terms of the catalytic reduction of NO3 ions. Beyond the explanations provided in detail by the cited article, it is observed that catalytic performance can be correlated with long-distance fractal dimension: the larger fractal dimension (Pt-Cu)s nanoparticles, D = 2.88, will favor catalytic activity compared to the lower fractal dimension (Pt-Cu)L nanoparticles, D = 2.68.
The catalytic applications of bimetallic nanoparticles are diverse: oxidative conversion of methane [40], oxidation of CO [41], reduction of nitrates [42], oxidation of methanol [43], etc. In most cases, bimetallic nanoparticles have shown better catalytic activity than their constituent metals.
We will further refer to alumina supported Pt-Cu nanoparticles studied in the context of total oxidation of methane. The catalytic behavior of the above mentioned nanoparticles was compared with an available catalyst Pt/Al2O3 1 wt.% (Engelhard) with the same metal loading level (1wt. %) (Figure 6) [44].
Fractal analysis of TEM images (images for which the background was removed in order to improve image quality) shows a bimodal fractal behavior characterized by two fractal dimensions: one for low scales and another for large scales. The inflection point (contact between the two self-similarity domains) is located at 1.2 nm and it is an indication of the average radius of Pt-Cu particles. For wide scaling domains (greater than 4.5 nm) the structure does not show fractal behavior (Table 9).
Although, the fractal size of the Pt-Cu/Al2O3 bimetallic system is quite large on a wide scale (2.81) compared to a commercial Pt/Al2O3 catalyst, from the obtained experimental results we observed that there is a decrease in the catalytic activity; an explanation lies in the nanoparticles’ surface chemical composition due to copper enrichment.

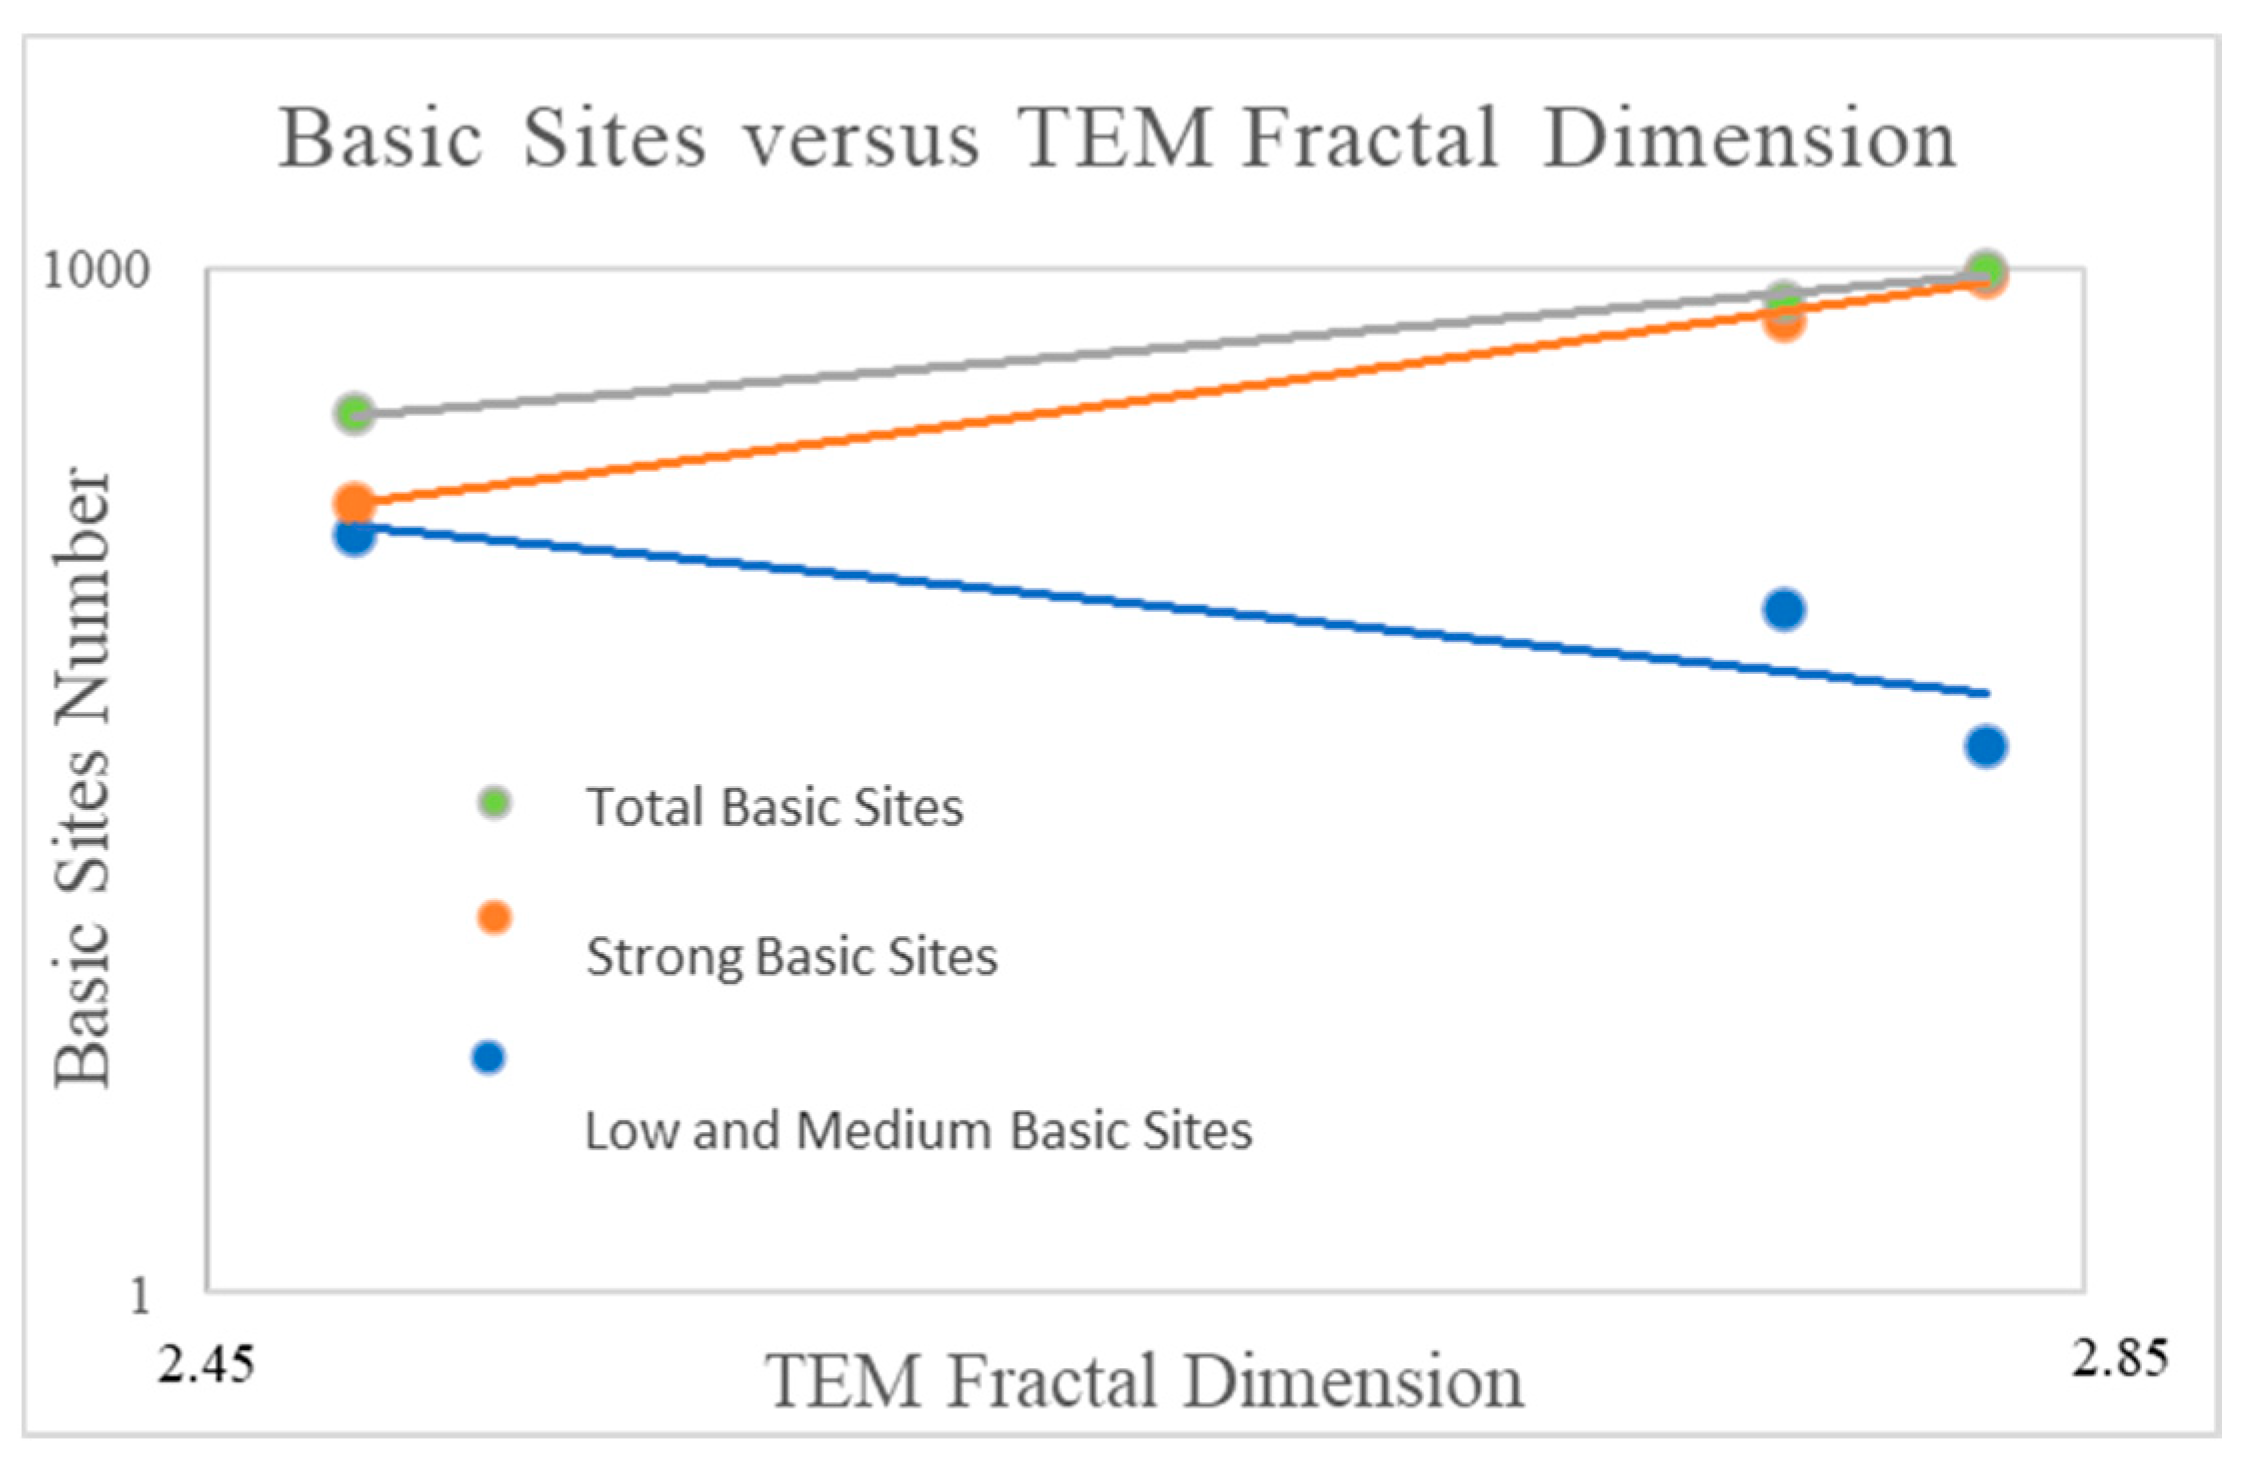
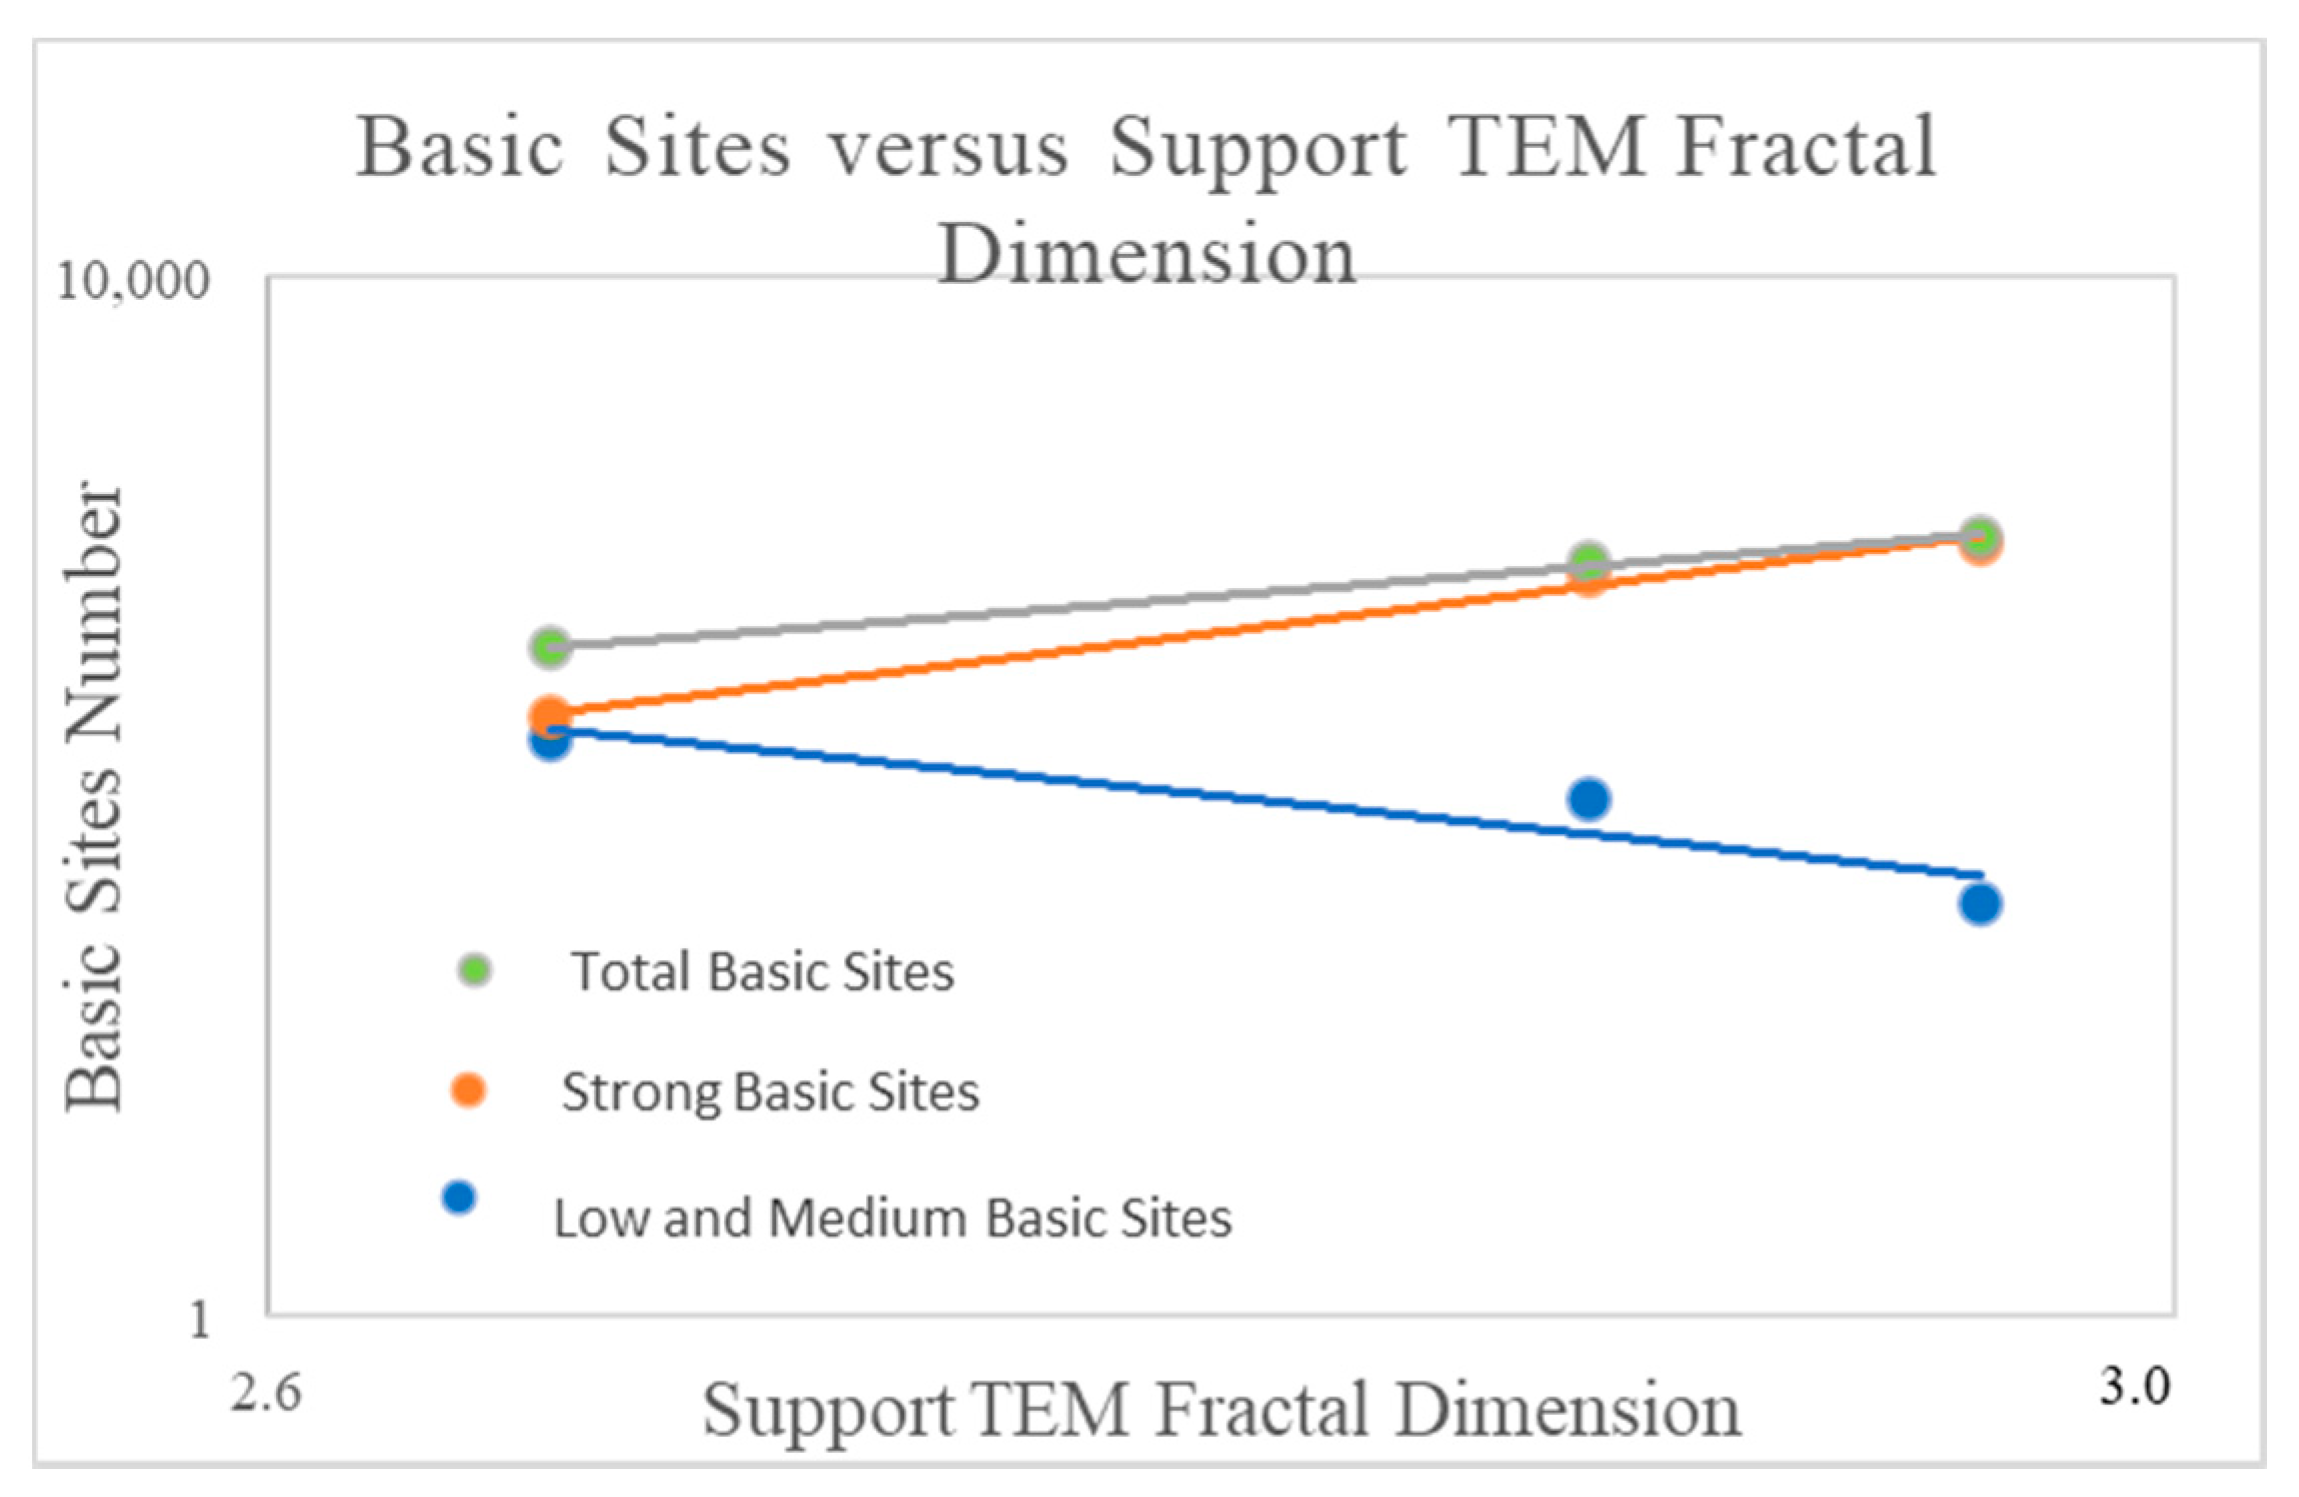
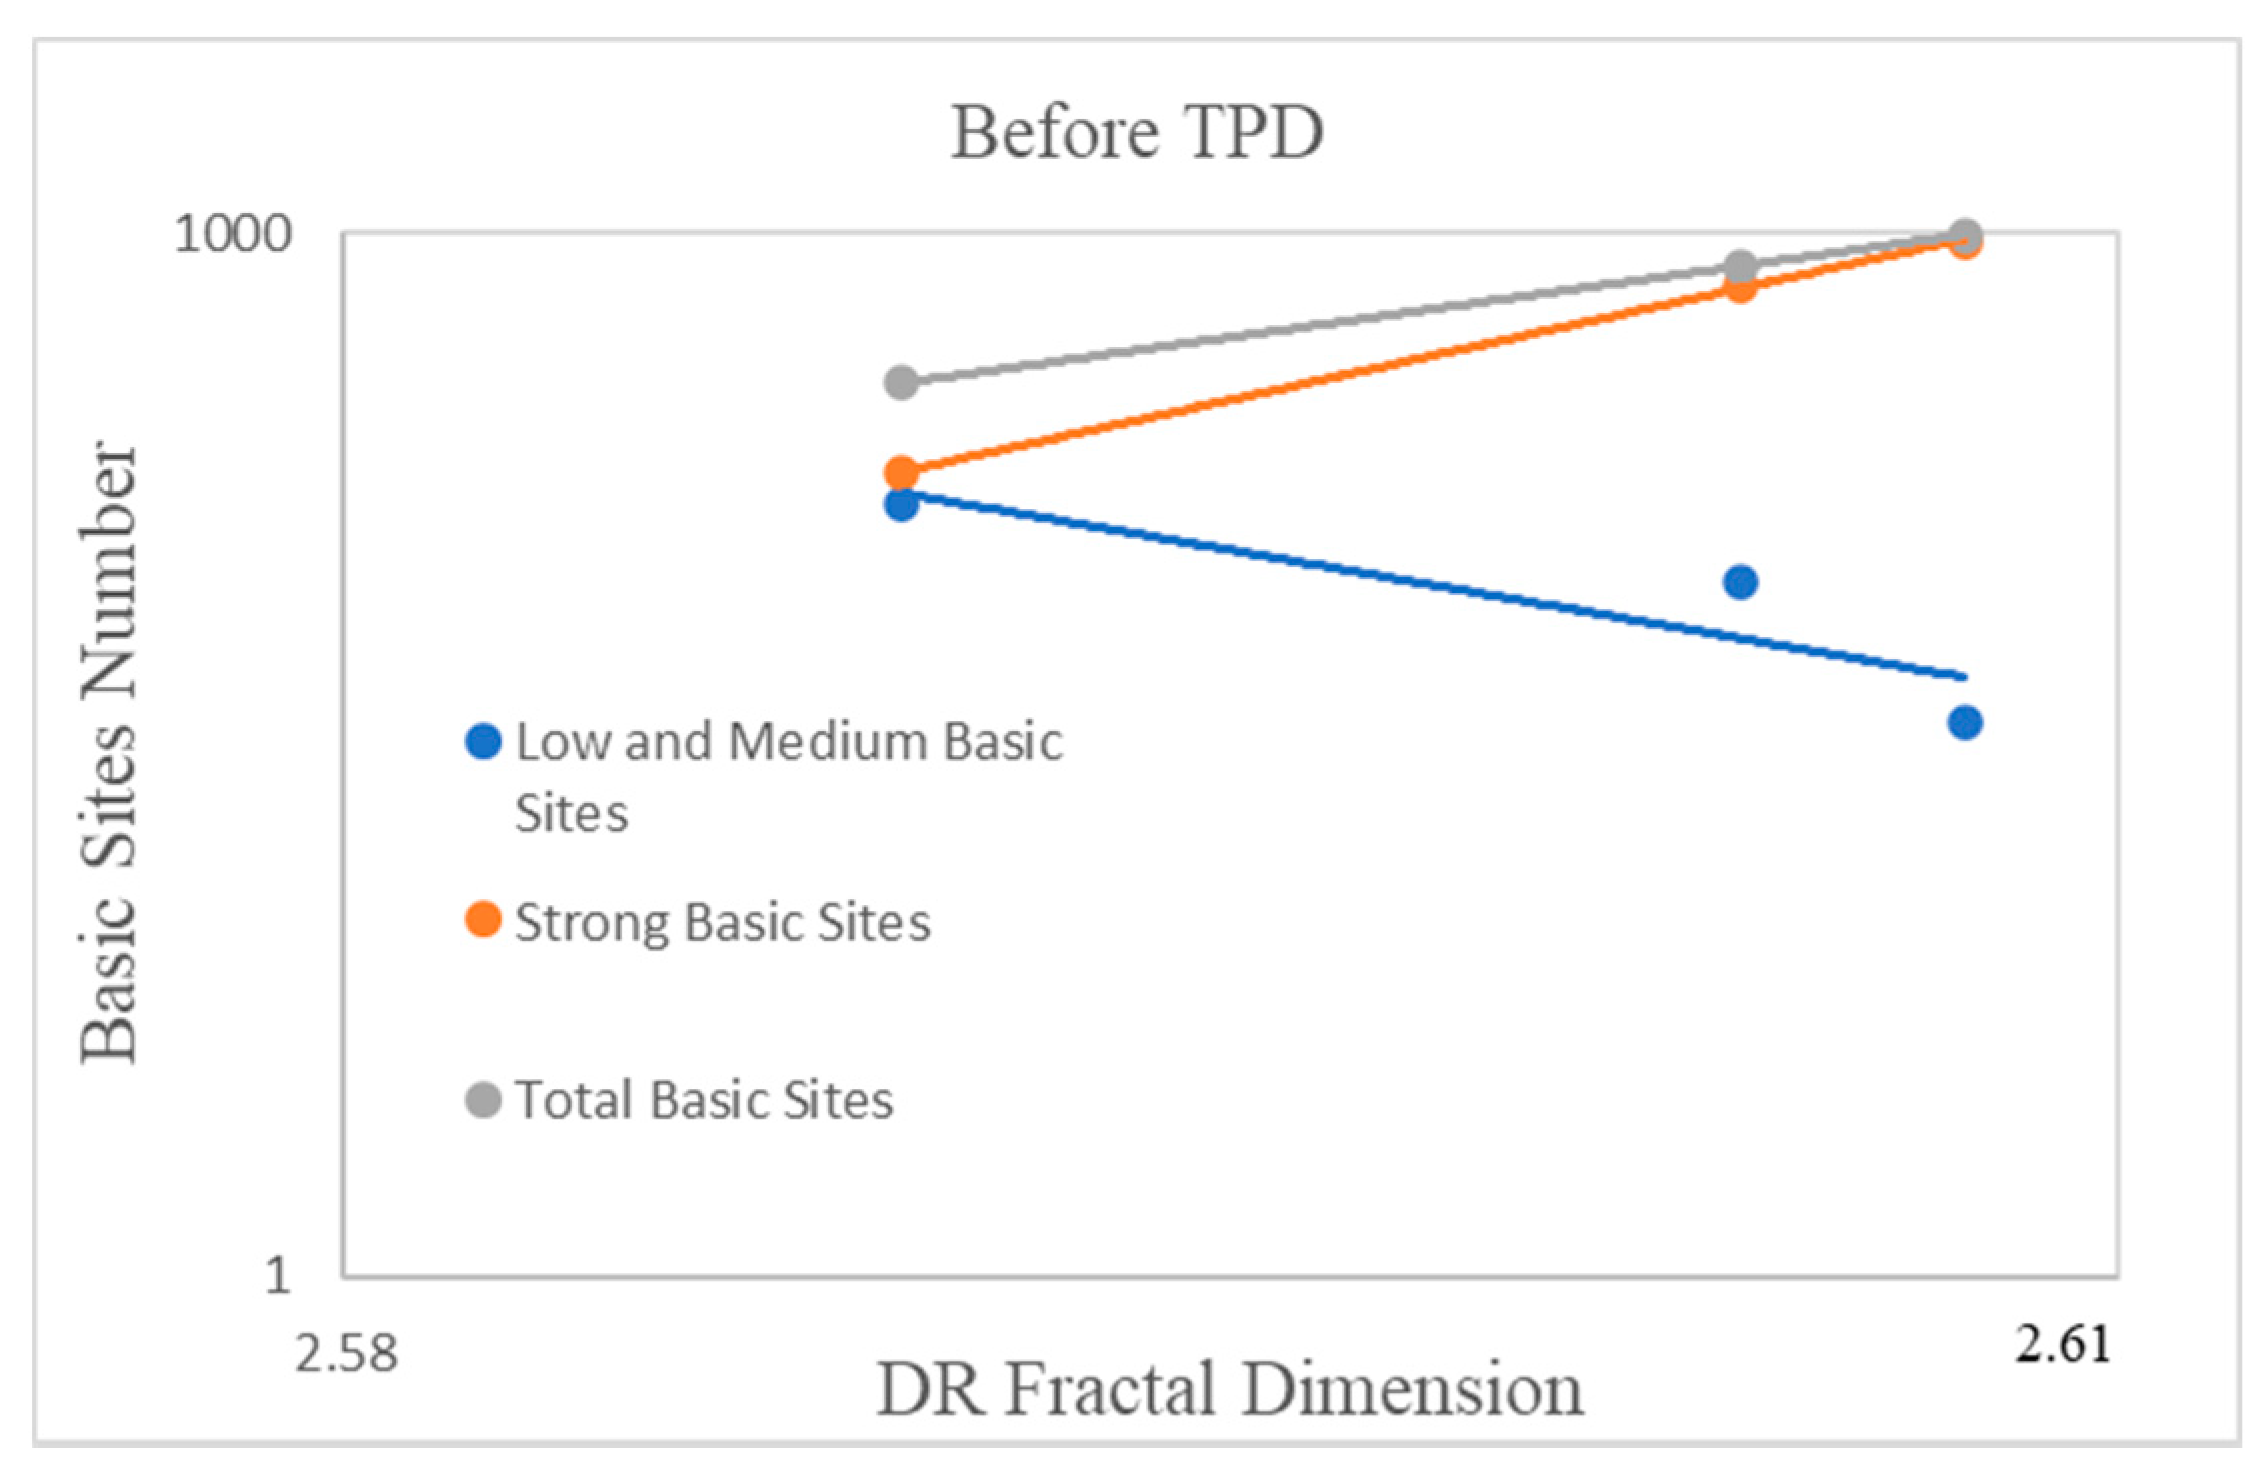
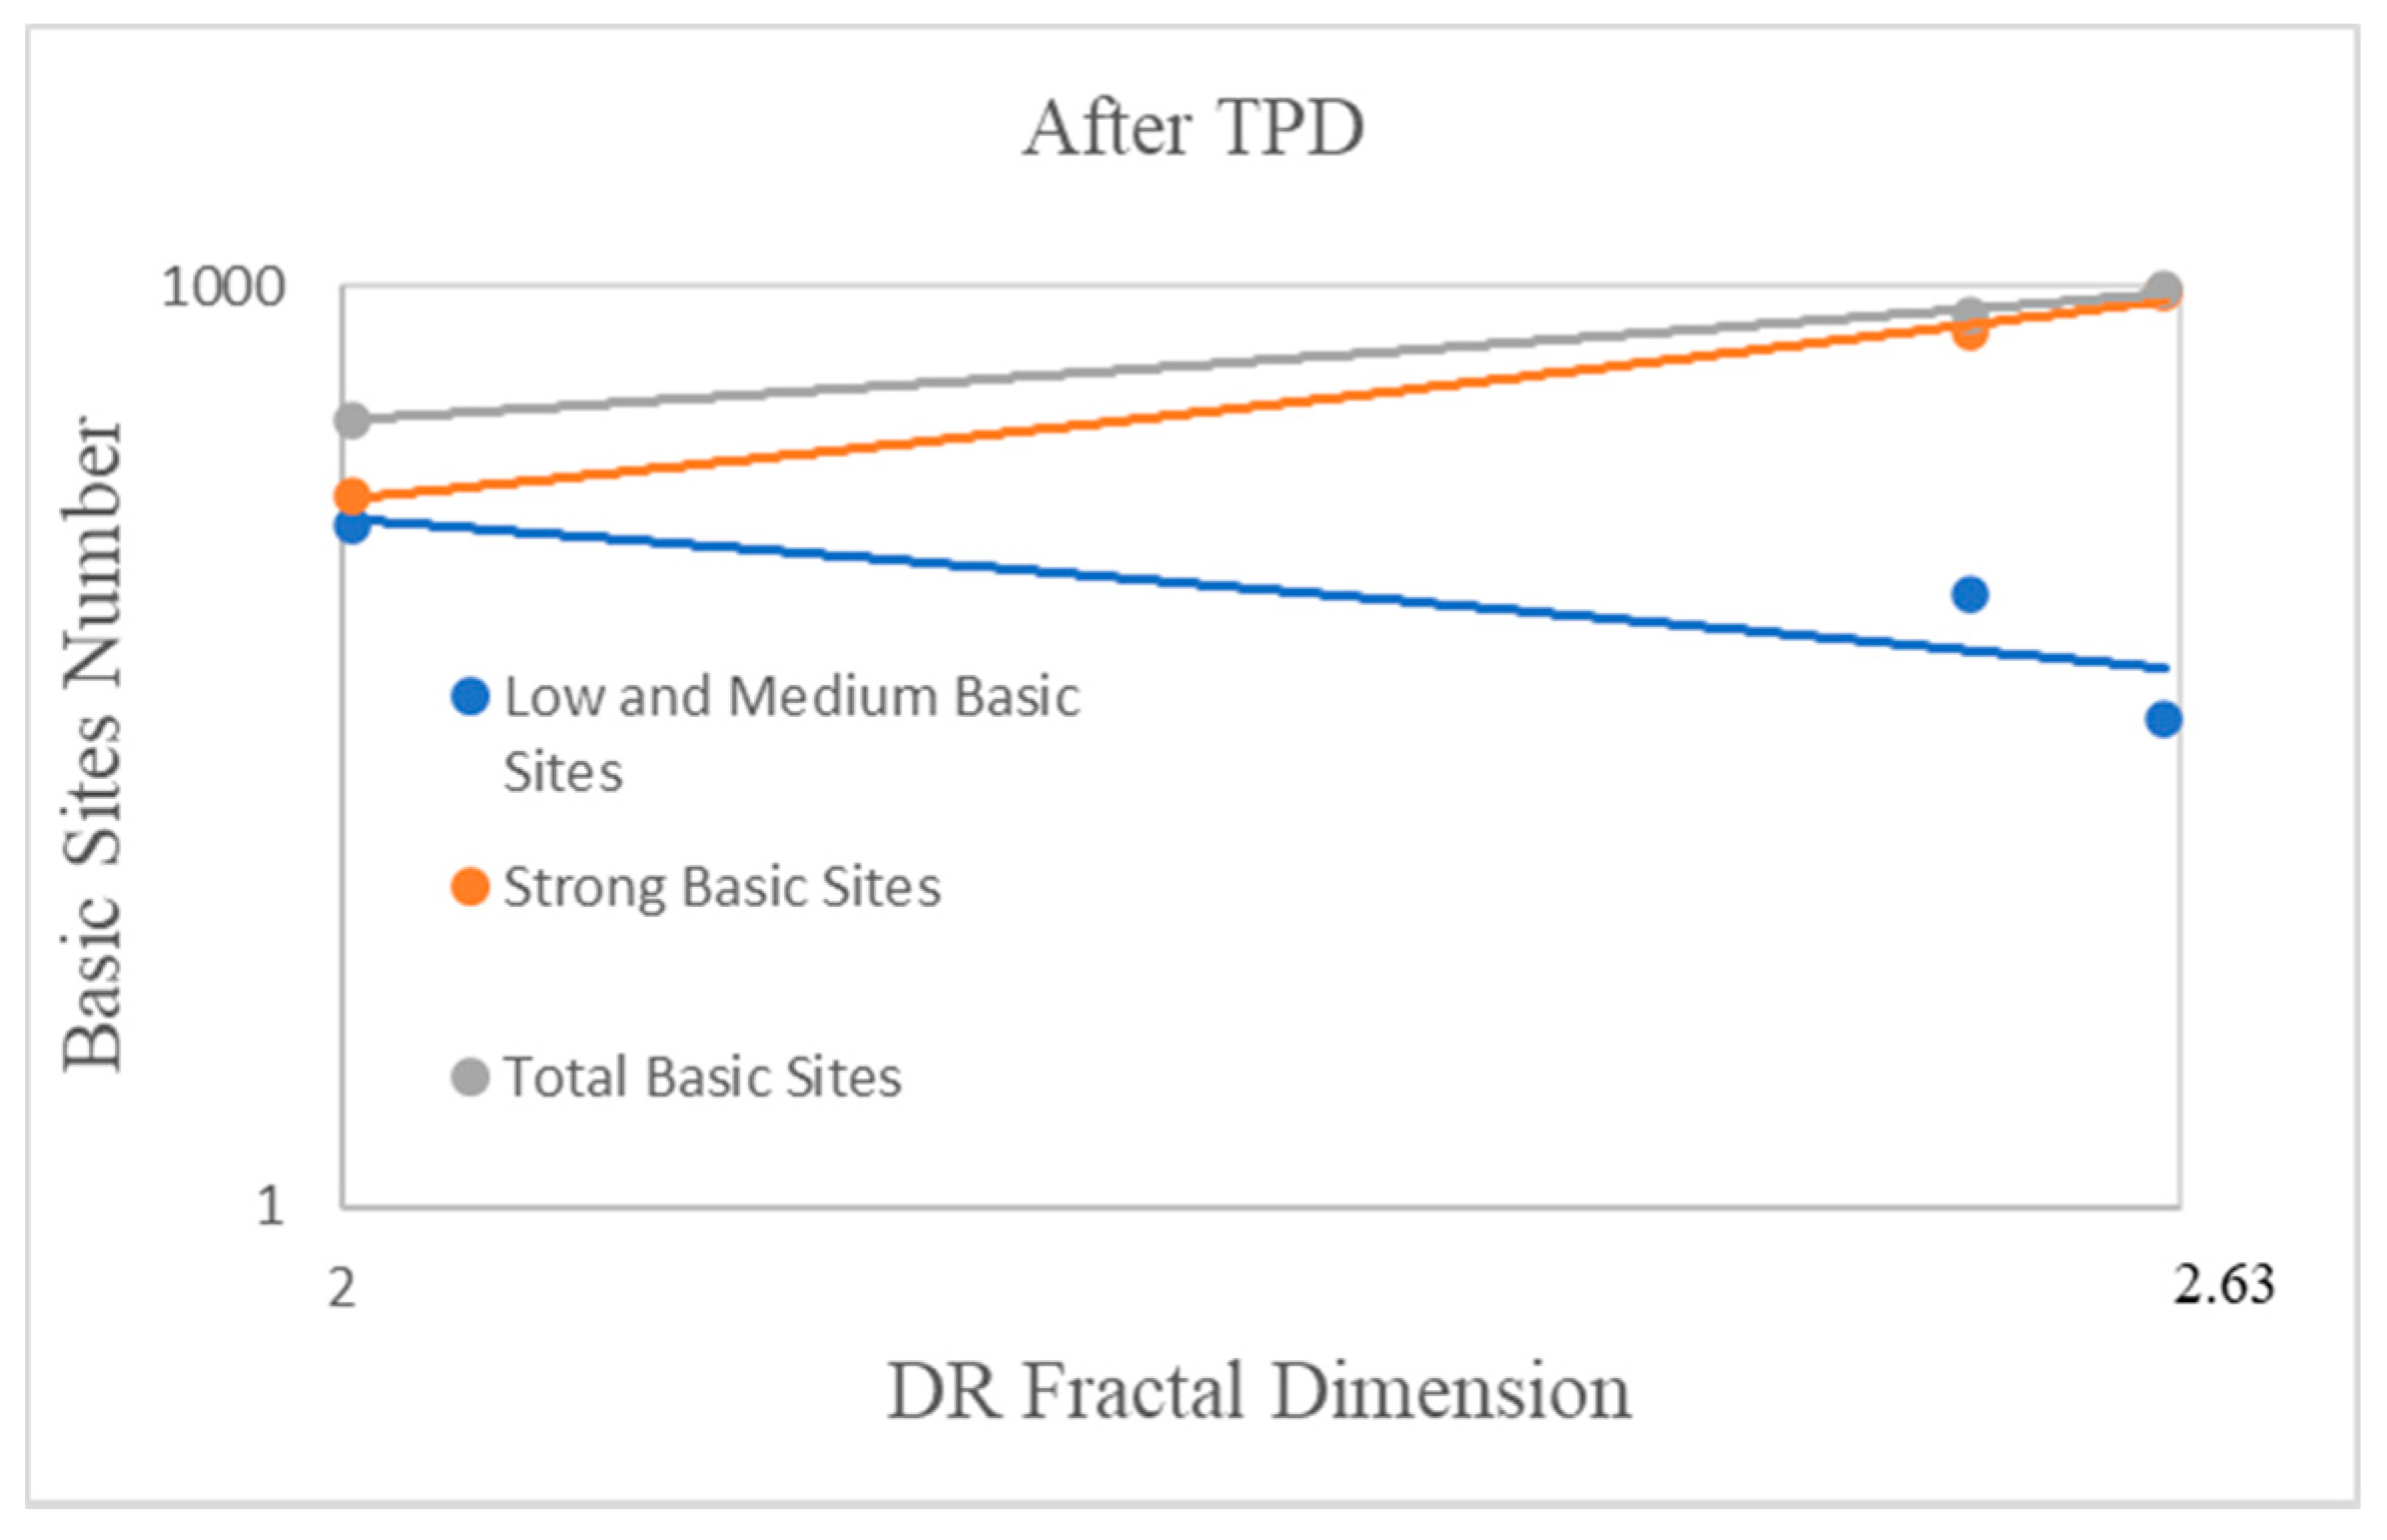
2.4. The Influence of the Fractal Dimension of Supported Nanoparticles on Surface Basicity

In order to deepen how fractal character influences the physico-chemical properties of the catalysts, we further analyze a series of Rh nanoparticles on various supports: Al2O3, TiO2 and WO3 [45].
The studied based-nanoparticle catalysts Rh/Al2O3, Rh/TiO2, Rh/WO3 showed fractal behavior (Table 10 and Table 11), both before and after CO2-TPD experiments, on a wide self-similarity domain. There is a strong correlation between the fractal dimension and the basicity of the studied catalysts.
Results showed (Table 10 and Table 11) that adding Rh nanoparticles on the corresponding supports leads to a decrease in the fractal dimension of the Rh/support system, compared to the fractal dimension of the support itself. This decrease in fractal dimension can be explained by blocking the surface pores on the support and/or by encapsulating Rh via strong metal support-interaction (SMSI) [28]. The bimodal character of the WO3 substrate is preserved even when Rh nanoparticles are added. The fractal dimensions obtained by fitting the adsorption isotherms with the DR isotherms (in the capillary condensation regime) are smaller than the fractal dimensions obtained by the image analysis of the TEM micrographs for Rh/Al2O3 and Rh/TiO2 samples. This behavior can be explained by the fact that fractal dimension obtained from the analysis of the adsorption isotherm is an expression of the pore filling capacity on the surface of the adsorbate, while the fractal dimension obtained from the TEM image analysis measures correlations and similarities of all points (visible in TEM) on the studied surface. The last sample (Rh/WO3) has the same bimodal characteristic, both in terms of the DR fractal dimension and in terms of the TEM fractal dimension.
Figure 7, Figure 8, Figure 9 and Figure 10 present the number of basic centers dependence on the fractal dimension of the system/support.
It is observed that the number of low and medium basic centers decreases slightly with the TEM fractal dimension of the supported nanoparticles, but also with the TEM fractal dimension of the support. On the other hand, the total number of strong basic centers increases with the same fractal dimensions. The same behavior is observed in the case of the fractal dimension obtained by analyzing the adsorption isotherm, both before and after CO2-TPD. This behavior leads to the idea that large fractal dimensions favor strong basic centers, while small fractal dimensions favor weak basic centers.
A system with a large fractal dimension will favor the strong metal support-interaction (SMSI) leading to the formation of monodentate carbonate (Rh/Al2O3 and Rh/TiO2) and implicitly of the strong basic centers. Weak and medium centers, usually attributed to the HO group, forming bicarbonate species with CO2 or bidentate carbonate, are favored by surfaces with fewer defects, pores, fewer irregularities and lower fractal dimension.
In order to improve the DRM (Dry Reforming of Methane), catalytic activity of Rh/Al2O3, Rh/TiO2 and Rh/WO3 and a large number of active centers are needed [46,47]. One way to achieve this is to use supports with a large fractal dimension; supports that will lead to NP systems/supports with a large fractal dimension and, therefore, to a large number of basic centers.

3. Discussion Regarding the Fractal Properties of Catalysts

The novelty element of this study is its correlation of the fractal behavior (fractal dimension) of catalysts with their catalytic activity as well as their specific chemical properties. We started from the general observation that a “perfect” catalyst should have an “ideal” fractal structure [12]. This idea involves structures of catalysts with very large specific surfaces and therefore many active centers capable of favoring chemical reactions. In reality, catalysts cannot be ideal mathematical fractals. No real structure can be described as an ideal mathematical fractal. It would require that it could be characterized by an infinite field of self-similarity and a deterministic self-similar structure. In the real world, systems are characterized by fractal properties only on restricted domains of self-similarity, which is always of necessary mention in the characterization of systems. Obviously, if we study a phenomenon on the order of nanometers, we are interested in self-similarity properties at this scale and not at scale lengths on the order of meters.
Self-similarity domains, especially the intersection areas of the domains with different fractal dimensions, give information regarding particle size, bi-modality of the sample, etc.
One of the methods used in determining fractal size is the direct fitting of the adsorption data with DR adsorption isotherms. The usual way to construct DR fractal isotherms is to consider the object as a fractal pore system. However, are real catalysts actually real fractal pore systems? In addition, if they are not, can we talk about their fractal dimension? Alternatively, can fractal adsorption isotherms, which are based on the idea of a pore fractal system [16], be used to determine the fractal dimension?
There are studies [48] showing that an optimal catalyst cannot be described as a fractal pore system realistically, though the fractal dimension could be an indication of the roughness of the analyzed samples.
Rudzinschi and. al. [49] show that fractal adsorption isotherms can be deduced without assuming the existence of a fractal pore system. The actual nature of the partially correlated solid surfaces is sufficient to deduce the fractal isotherms used. Surface energy heterogeneities in relation to fractal geometric non-uniformities lead to the deduction of the Dubinin–Radushkevitch isotherm without resorting to the questionable fractal distribution of pores [49]. In conclusion, the fractal dimension calculated by direct fitting of the adsorption isotherms with the DR equation reflects a real characteristic of self-similarity of the catalysts and is not a mathematical artefact.

4. Materials and Methods

4.1. Synthesis of Materials

Mixed perovskite-type oxides (cobaltite and ferrite) were prepared by calcination in air of isolated complex precursors (urea-base precursor, alpha-alanine-base precursor, sorbitol-base precursor, acid maleic-base precursor). Details on catalyst synthesis are presented in extenso in [30,31,32,34,50,51].
Bimetallic nanoparticle samples were prepared using the alkaline polyol method, an easy and versatile synthesis method described in detail in the literature [38,39,44,45,52].

4.2. Methods

4.2.1. Fractal Dimension Determination Using Image Analysis

The mathematical determination of the fractal dimension has its basis in the fundamental fractal property of self-similarity [2]. Self-similarity is the property of an object to appear the same when seen from near or far. The mathematical description of this property is given by the following formula:
N ( r R )   ~   ( r R ) D
where D is the fractal dimension, N(r/R) is the number of r size boxes that can cover an object of size R.
Starting from this definition and from its mathematical expression, various methods for determining both the fractal dimension and the scaling domain can be imagined, i.e., the values for r for which Equation (1) is valid.
SEM, TEM and AFM micrographs can be analyzed using various methods, such as the Fourier transform method [53], the box-counting method [2], the mass-radius dependence method [54], the correlation function method [53,55] and the variable scaling method [56].

4.2.2. Fractal Dimension Determination Using Adsorption Isotherms

The fractal size of the catalysts can be determined by adsorption experiments, either by direct fitting the adsorption isotherms or by the Avnir–Jaroniec method. Experimental adsorption isotherms have been shown to be efficiently fitted with the Dubinin–Radushkevitch isotherm [16]:
θ = K [ ln ( p o p ) ] D 3  
where θ is the relative adsorption, K is a characteristic constant, p0 and p are saturation and equilibrium pressures and D is the fractal dimension.
Other isotherms (such as those presented below—Equations (3) and (4)) did not lead to viable results regarding the fractal dimension.
-
the BET fractal isotherm obtained by Fripiat [57]:
θ = N N m = c 1 + ( c 1 ) x n = 1 n 2 D x n
-
the Frenkel-Halsey-Hill [58] isotherm:
N N m = ( z a ) 3 D = [ γ ( lnx ) ] ( 3 D ) 3 γ α ( kTa 3 ) ,   2 D < 3 , x P P o , z = [ α ( kTln ( P o P ) ) ] 1 3
where Nm, is the monolayer volume, a is the monolayer thickness and α is the difference of the interaction constants.
It is noteworthy that although the Frenkel–Halsey–Hill isotherm shape resembles the Dubinin–Radushkevitch fractal isotherm, the exponent is different for the two isotherms. The use of the Frenkel–Halsey–Hill isotherm can lead, in some cases, to values of fractal size of over 4, which is obviously unrealistic.

4.2.3. Avnir–Jaroniec Method

This method is described in detail in the literature [24]. It is based on the micropores volume calculation and, thus, the dependence of the fractional filling on pressure is computed, leading to the local determination of the Avnir–Jaroniec fractal dimension. The zone where the fractal dimension is constant gives the value of the fractal dimension, but also the domain of self-similarity.

5. Conclusions

The present paper depicted some catalysts that have been shown to have fractal properties, with a large domain of self-similarity.
The experimental results revealed that the synthesis method of catalysts influences the fractal dimension. Both the nature of the precursor as well as the introduction of dopants changes the fractal dimension for mixed oxide perovskite-type catalysts. Moreover, fractal analysis was used to obtain information regarding the morphology/geometry of the samples.
The fractal dimension is, as well, an indicator of the number of basic centers on the surface of the supported nanoparticles studied, basic centers that are directly related to the catalytic activity of these catalysts.
Moreover, very importantly, both catalytic activity in various reactions and the activation energy strongly depend on the fractal dimension of the catalysts. Catalytic activity is undoubtedly favored by catalysts with large fractal dimensions.

Author Contributions

Conceptualization, G.D. and F.P.; methodology, G.D.; investigation, D.B., F.P., R.S. and M.R.; data curation, I.B. and F.P.; writing—original draft preparation, G.D. and N.I.I.; writing—review and editing, G.D. and F.P.; supervision, I.B. and N.I.I.; funding acquisition, F.P. All authors have read and agreed to the published version of the manuscript.

Funding

This research was funded by Unitatea Executiva pentru Finantarea Invatamantului Superior, a Cercetarii, Dezvoltarii si Inovarii (UEFISCDI), grant number PN III—26PTE/2020 DENOX.

Conflicts of Interest

The authors declare no conflict of interest.

References

  1. Mandelbrot, B.B. Fractals: Form, Chance and Dimension; Freeman, W.H., Ed.; MANDELBROT. WH Freeman and Co.: San Francisco, CA, USA, 1977. [Google Scholar]
  2. Mandelbrot, B.B. The Fractal Geometry of Nature; Freeman, W.H., Ed.; MANDELBROT. WH Freeman and Co.: San Francisco, CA, USA, 1982. [Google Scholar]
  3. Sorensen, C.M. Light scattering by fractal aggregates: A review. Aerosol Sci. Technol. 2001, 35, 648–687. [Google Scholar] [CrossRef]
  4. Abed, A.T.; Abu-AlShaer, M.J.; Jawad, A.M. Fractal antennas for wireless communications. In Modern Printed-Circuit Antennas; Al-Rizzo, H., Ed.; IntechOpen: London, UK, 2020. [Google Scholar]
  5. Witten, T.A.; Sander, L.M. Diffusion-limited aggregation. Phys. Rev. B 1983, 27, 5686–5697. [Google Scholar] [CrossRef] [Green Version]
  6. Zhou, H.W.; Xie, H. Direct estimation of the fractal dimensions of a fracture surface of rock. Surf. Rev. Lett. 2003, 10, 751–762. [Google Scholar] [CrossRef]
  7. Kopelman, R. Fractal Reaction Kinetics. Science 1988, 241, 1620–1626. [Google Scholar] [CrossRef] [PubMed]
  8. Mattfeldt, H.W.; Gottfried, H.W.; Schmidt, V.; Kestler, H.A. Classification of spatial textures in benign and cancerous glandular tissues by stereology and stochastic geometry using artificial neural networks. J. Microsc. 1999, 198, 143–158. [Google Scholar]
  9. Socoteanu, R.; Anastasescu, M.; Dobrescu, G.; Boscencu, R.; Vasiliu, G.; Constantin, C. AFM imaging, fractal analysis and in vitro cytotoxicity evaluation of Zn (II) vs. Cu (II) porphyrins. Chaos Solit. Fractals 2015, 77, 304–309. [Google Scholar] [CrossRef]
  10. Hang, J.T.; Kang, Y.; Xu, G.-K.; Gao, H. A hierarchical cellular structural model to unravel the universal power-law rheological behavior of living cells. Nat. Commun. 2021, 12, 6067. [Google Scholar] [CrossRef] [PubMed]
  11. Avnir, D.; Farin, D.; Pfeifer, P. Surface geometric irregularity of particulate materials: The fractal approach. J. Colloid Interface Sci. 1985, 103, 112–123. [Google Scholar] [CrossRef]
  12. Rothschild, W.G. Fractals in heterogeneous catalysis. Catal. Rev. Sci. Eng. 1991, 33, 71–107. [Google Scholar] [CrossRef]
  13. Pfeifer, P.; Obert, M.; Cole, M.W. Fractal BET and FHH theories of adsorption: A comparative study. Proc. R. Soc. Lond. A 1989, 423, 169–188. [Google Scholar]
  14. Pfeifer, P.; Avnir, D.; Farin, D. Complex Surface Geometry in Nano-Structure Solids: Fractal Versus Bernal-Type Models. Large Scale Molecular Systems—Quantum and Stochastic Aspects; NATO ASI, Series B; Gans, W., Blumen, A., Amann, A., Eds.; Plenum: New York, NY, USA, 1991; pp. 215–229. [Google Scholar]
  15. Meakin, P. Fractals and Reactions on Fractals. In Reactions in Compartmentalized Liquids; Knoche, W., Schomäcker, R., Eds.; Springer: Berlin/Heidelberg, Germany, 1989; pp. 173–198. [Google Scholar]
  16. Avnir, D.; Jaroniec, M. An isotherm equation for adsorption on fractal surfaces of heterogeneous porous materials. Langmuir 1989, 5, 1431–1433. [Google Scholar] [CrossRef]
  17. Pfeifer, P.; Kenntner, J.; Cole, M.W. Detecting capillary condensation in the absence of adsorption/desorption hysteresis. In Fundamentals of Adsorption; American Institute of Chemical Engineers: New York, NY, USA, 1991; pp. 689–700. [Google Scholar]
  18. Ludlow, D.K.; Moberg, T.P. Technique for determination of surface fractal dimension using a dynamic flow adsorption instrument. Instrum. Sci. Technol. 1990, 19, 113–123. [Google Scholar] [CrossRef]
  19. Farin, D.; Avnir, D.; Pfeifer, P. Fractal dimensions of surfaces. The use of adsorption data for the quantitative evaluation of geometric irregularity. Particul. Sci. Technol. 1984, 2, 27–35. [Google Scholar] [CrossRef]
  20. Pfeifer, P.; Stella, A.L.; Toigo, F.; Cole, M.W. Scaling of the dynamic structure factor of an adsorbate on a fractal surface. Europhys. Lett. 1987, 3, 717–722. [Google Scholar] [CrossRef]
  21. Cheng, E.; Cole, M.W.; Pfeifer, P. Defractalization of films adsorbed on fractal surfaces. Phys. Rev. B 1989, 39, 12962–12965. [Google Scholar] [CrossRef]
  22. Avnir, D.; Farin, D. Fractal scaling laws in heterogeneous chemistry: Part I: Adsorptions, chemisorptions and interactions between adsorbates. N. J. Chem. 1990, 14, 197–206. [Google Scholar]
  23. Pfeifer, P.; Johnston, G.P.; Deshpande, R.; Smith, D.M.; Hurd, A.J. Structure analysis of porous solids from preadsorbed films. Langmuir 1991, 7, 2833–2843. [Google Scholar] [CrossRef]
  24. Kaneko, K.; Sato, M.; Suzuki, T.; Fujiwara, Y.; Nishikawa, K.; Jaroniec, M. Surface fractal dimension of microporous carbon fibres by nitrogen adsorption. J. Chem. Soc. Faraday Trans. 1991, 87, 179–184. [Google Scholar] [CrossRef]
  25. Gutfraind, R.; Sheintuch, M.; Avnir, D. Fractal and multifractal analysis of the sensitivity of catalytic reactions to catalyst structure. J. Chem. Phys. 1991, 95, 6100–6111. [Google Scholar] [CrossRef]
  26. Sanders, L.M.; Ghaisas, S.V. Fractals and patterns in catalysis. Phys. A 1996, 233, 629–639. [Google Scholar] [CrossRef]
  27. Che, M.; Bennett, C.O. The influence of particle size on the catalytic properties of supported metals. Adv. Catal. 1989, 36, 55–172. [Google Scholar]
  28. Matsubu, J.; Zhang, S.; DeRita, L.; Marinkovic, N.S.; Chen, J.G.; Graham, G.W.; Pan, X.; Christopher, P. Adsorbate-mediated strong metal–support interactions in oxide-supported Rh catalysts. Nat. Chem. 2017, 9, 120–127. [Google Scholar]
  29. Huang, R.; Wu, J.; Zhang, M.; Liu, B.; Zheng, Z.; Luo, D. Strategies to enhance photocatalytic activity of graphite carbon nitride-based photocatalysts. Mater. Des. 2021, 210, 110040. [Google Scholar]
  30. Dobrescu, G.; Berger, D.; Papa, F.; Fangli, I.; Rusu, M. Fractal dimensions of lanthanum cobaltites samples by adsorption isotherm method. In Interdisciplinary Applications of Fractal and Chaos Theory; Dobrescu, R., Vasilescu, C., Eds.; Editura Academiei Romane: Bucuresti, Romania, 2004; pp. 295–302. [Google Scholar]
  31. Dobrescu, G.; Berger, D.; Papa, F.; Ionescu, N.I. Fractal dimension of lanthanum ferrite samples by adsorption isotherm method. Appl. Surf. Sci. 2003, 220, 154–158. [Google Scholar] [CrossRef]
  32. Dobrescu, G.; Berger, D.; Papa, F.; Ionescu, N.I.; Rusu, M. Fractal analysis of micrographs and adsorption isotherms of La1−xSrxCoO3 samples. J. Optoelectron. Adv. 2003, 5, 1433–1437. [Google Scholar]
  33. Wojsk, R.; Terzyk, A.P. The structural parameters of microporous solid, including fractal dimension, on the basis of the potential theory of adsorption-the general solution. Comput. Chem. 1997, 21, 83–87. [Google Scholar]
  34. Papa, F.; Berger, D.; Dobrescu, G.; State, R.; Ionescu, N.I. Correlation of the Sr-dopant content in La1−xSrxCoO3 with catalytic activity for hydrogen peroxide decomposition. Rev. Roum. Chim. 2018, 63, 447–453. [Google Scholar]
  35. Aoa, M.; Pharma, G.H.; Sage, V.; Pareeka, V. Structure and activity of strontium substituted LaCoO3 perovskite catalysts forsyngas conversion. J. Mol. Catal. A Chem. 2016, 416, 96–104. [Google Scholar] [CrossRef]
  36. Prasad, D.H.; Park, S.Y.; Oh, E.O.; Ji, H.; Kim, H.R.; Yoon, K.J.; Yoon, J.; Son, J.W.; Lee, J.H. Synthesis of nano-crystalline La1−xSrxCoO3-δ perovskite oxides by EDTA-citrate complexing process and its catalytic activity for soot oxidation. Appl. Catal. A Gen. 2012, 447, 100–106. [Google Scholar] [CrossRef]
  37. Trypolskyi, A.I.; Gurnyk, T.M.; Strizhak, P.E. Fractal dimension of zirconia nanopowders and their activity in the CO oxidation. Catal. Commun. 2011, 12, 766–771. [Google Scholar] [CrossRef]
  38. Dobrescu, G.; Papa, F.; State, R.; Balint, I. Characterization of bimetallic nanoparticles by fractal analysis. Powder Technol. 2018, 338, 905–914. [Google Scholar] [CrossRef]
  39. Miyazaki, A.; Matsuda, K.; Papa, F.; Scurtu, M.; Negrila, C.; Dobrescu, G.; Balint, I. Impact of particle size and metal-support interaction on denitration behavior of wee-defined Pt-Cu nanoparticles. Catal. Sci. Technol. 2015, 5, 492–503. [Google Scholar] [CrossRef]
  40. Lanza, R.; Canu, P.; Jaras, S.G. Partial oxidation of methane over Pt-Ru bimetallic catalyst for syngas production. Appl. Catal. A Gen. 2008, 348, 221–228. [Google Scholar] [CrossRef]
  41. Liao, P.C.; Carberry, J.J.; Fleisch, T.H.; Wolf, E.E. CO oxidation activity and XPS studies of PtCuγ-Al2O3 bimetallic catalysts. J. Catal. 1982, 74, 307–316. [Google Scholar] [CrossRef]
  42. Soares, O.S.G.P.; Órfão, J.J.M.; Pereira, M.F.R. Bimetallic catalysts supported on activated carbon for the nitrate reduction in water: Optimization of catalysts composition. Appl. Catal. B Environ. 2009, 91, 441–448. [Google Scholar] [CrossRef]
  43. Baglio, V.; Stassi, A.; Di Blasi, A.; D’Urso, C.; Antonucci, V.; Arico, A.S. Investigation of bimetallic Pt-M/C as DMFC cathode catalysts. Electrochim. Acta 2007, 53, 1360. [Google Scholar] [CrossRef]
  44. Papa, F.; Negrila, C.; Dobrescu, G.; Miyazaki, A.; Balint, I. Preparation, characterization and catalytic behavior of Pt-Cu nanoparticles in methane combustion. J. Nat. Gas Chem. 2011, 20, 537–542. [Google Scholar] [CrossRef]
  45. Dobrescu, G.; Papa, F.; Atkinson, I.; Culita, D.; Balint, I. Correlation between the basicity and the fractal dimension of Rh-nanoparticles supported on Al2O3, TiO2 and WO3. IOSR-JAC 2021, 14, 11–25. [Google Scholar]
  46. Jang, W.; Shim, J.; Kim, H.; Yoo, S.; Roh, H. A review on dry reforming of methane in aspect of catalytic properties. Catal. Today 2019, 324, 15–26. [Google Scholar] [CrossRef]
  47. Wang, H.Y.; Ruckenstein, E. Carbon dioxide reforming of methane to synthesis gas over supported rhodium catalysts: The effect of support. Appl. Catal. A Gen. 2000, 204, 143–152. [Google Scholar] [CrossRef]
  48. Curtis Conner, W.; Bennett, C.O. Are the pore and surface morphologies of real fractal catalysts? J. Chem. Soc. Faraday Trans. 1993, 89, 4109–4114. [Google Scholar] [CrossRef]
  49. Rudzinski, W.; Lee, S.L.; Sanders yan, C.C.; Panczyk, T. A fractal approach to adsorption on heterogeneous solid surfaces. 1. The relationship between geometric and energetic surface heterogeneities. J. Phys. Chem. B 2001, 105, 10847–10856. [Google Scholar] [CrossRef]
  50. Berger, D.; Matei, C.; Papa, F.; Voicu, G.; Fruth, V. Pure and doped LaCoO3 obtained by combustion method. Prog. Solid State Chem. 2007, 35, 183–191. [Google Scholar] [CrossRef]
  51. Dobrescu, G.; Berger, D.; Papa, F.; Fangli, I.; Sitaru, I. Fractal analysis of micrographs and adsorption isotherms of LaCoO3 and LaFeO3 samples. Ann. West Univ. Timis. Ser. Chem. 2003, 12, 1505–1512. [Google Scholar]
  52. Papa, F.; Negrila, C.; Miyazaki, A.; Balint, I. Morphology and chemical state of PVP-protected Pt, Pt-Cu and Pt-Ag nanoparticles prepared by alkaline polyol method. J. Nanopart. Res. 2011, 13, 5057–5064. [Google Scholar] [CrossRef]
  53. Schepers, H.E.; van Beek, J.H.G.M.; Bassingthwaighte, J.B. Four methods to estimate the fractal dimension from self-affine signals (medical application). IEEE Eng. Med. Biol. 1992, 11, 57–64. [Google Scholar] [CrossRef] [Green Version]
  54. Botet, R.; Jullien, R. A theory of aggregating systems of particles: The clustering of clusters process. Ann. Phys. Fr. 1988, 13, 153–221. [Google Scholar] [CrossRef]
  55. Family, F.; Vicsek, T. Scaling of the active zone in the Eden process on percolation networks and the ballistic deposition model. J. Phys. A Math. Gen. 1985, 18, L75–L81. [Google Scholar] [CrossRef]
  56. Chauvy, P.F.; Madore, C.; Landolt, D. Variable length scale analysis of surface topography: Characterization of titanium surfaces for biomedical applications. Surf. Coat. Technol. 1998, 110, 48–56. [Google Scholar] [CrossRef]
  57. Fripiat, I.J.; Gatineau, L.; van Damme, H. Multilayer physical adsorption on fractal surfaces. Langmuir 1986, 2, 562–567. [Google Scholar] [CrossRef]
  58. Pfeifer, P.; Wu, Y.J.; Cole, M.W.; Krim, J. Multilayer adsorption on a fractally rough surface. Phys. Rev. Lett. 1989, 62, 1997–2000. [Google Scholar] [CrossRef] [PubMed]
Figure 1. Compensation effect in the H2O2 decomposition reaction. Reprinted from ref. [34], Copyright (2018), with permission from RRC.
Catalysts 11 01518 g001
Figure 2. Pre-exponential factor vs. fractal dimension. Reprinted from ref. [34], Copyright (2018), with permission from RRC.
Catalysts 11 01518 g002
Figure 3. Activation energy versus fractal dimension. Reprinted from ref. [34], Copyright (2018), with permission from RRC.
Catalysts 11 01518 g003
Figure 4. The catalytic activity for methane combustion.
Catalysts 11 01518 g004
Figure 5. The dependence of the activation energy on the fractal dimension in the methane oxidation reaction when perovskite catalysts of the La1−xSrxMnO3 type are used.
Catalysts 11 01518 g005
Figure 6. Methane conversion versus temperature using two different catalysts: Pt-Cu/Al2O3 and Pt/Al2O3. Reprinted from ref. [44], Copyright (2011), with permission from Elsevier.
Catalysts 11 01518 g006
Figure 7. Basic sites: total basic sites, strong basic sites and low and medium basic sites dependencies on TEM fractal dimension of NP/support (double-logarithmic scale).
Catalysts 11 01518 g007
Figure 8. Basic sites: total basic sites, strong basic sites and low and medium basic sites dependencies on TEM fractal dimension of the support (double-logarithmic scale).
Catalysts 11 01518 g008
Figure 9. Basic sites versus DR Fractal Dimension before CO2-TPD (double-logarithmic scale).
Catalysts 11 01518 g009
Figure 10. Basic sites vs. DR Fractal Dimension after CO2-TPD measurements (double-logarithmic scale).
Catalysts 11 01518 g010
Table 1. Fractal dimensions of perovskite oxides LaCoO3 obtained by the direct fit of the DR isotherm; fractal dimension obtained by the Avnir–Jaroniec method; BET specific surface area (m2/g).
PrecursorFractal Dimension
DR Isotherm
Fractal Dimension
AJ Method
BET Surface (m2/g)
Maleic acid2.3±0.062.34 ± 0.06
Fractional filling 0.40–0.80
20.42
Alpha-alanine2.62±0.062.62 ± 0.06
Fractional filling 0.68–0.88
32.50
Urea2.43±0.032.43 ± 0.03
Fractional filling 0.45–0.82
22.62
Table 2. Fractal dimensions of lanthanum ferrites (LaFeO3) obtained under various preparation conditions. Reprinted from ref. [31], Copyright (2003), with permission from Elsevier.
PrecursorFractal Dimension
DR Isotherm Fitting
Fractal Dimension
Avnir–Jaroniec Method
Maleic acid2.11 ± 0.042.07 ± 0.01
0.4–0.6 (fractional filling range)
Alpha-alanine2.42 ± 0.022.44 ± 0.05
0.46–0.93 (fractional filling range)
Urea2.40 ± 0.022.49 ± 0.01
0.77–0.86 (fractional filling range)
Table 3. Fractal Dimension dependence on Sr concentration x for doped lanthanum cobaltites (La1−xSrxCoO3); samples were obtained by thermal decomposition of the complex precursor molar ratio La:Sr:Co:acid maleic = 1 − x:x:1:8.6. Reprinted from ref. [32], Copyright (2003), with permission from JOAM.
xSEM AnalysisSelf-Similarity Limits (nm)
(SEM Analysis)
Fractal Dimension
(DR Adsorption Isotherm)
02.32 ± 0.01250–11102.34 ± 0.06
0.12.51 ± 0.02100–4402.58 ± 0.02
0.22.43 ± 0.0130–3302.48 ± 0.01
Table 4. Fractal dimension obtained by direct fitting of the nitrogen adsorption data with DR adsorption isotherms. Reprinted from ref. [34], Copyright (2018), with permission from RRC.
SampleFractal DimensionDetermination Coefficient
LaCoO32.39 ± 0.030.987
La0.9Sr0.1CoO32.45 ± 0.010.989
La0.8Sr0.2CoO32.48 ± 0.010.999
La0.7Sr0.3CoO32.62 ± 0.030.970
Table 5. Fractal dimensions of La1−xSrxMnO3 samples with perovskite structure. The fractal dimension was obtained by analysis of SEM micrographs and by direct fitting of the adsorption isotherms using DR fractal isotherm.
SamplesMethodFractal DimensionDetermination CoefficientSelf-Similarity Limit
(nm)
LaMnO3-alanineSEM—correlation function method2.49 ± 0.010.999100–282
2.70 ± 0.010.983282–2326
SEM—variable scale method2.53 ± 0.020.9981000–4000
2.74 ± 0.010.9924000–12,000
DR fractal isotherm2.54 ± 0.040.972-
La0.9Sr0.1MnO3SEM—correlation function method2.20 ± 0.010.99420–116
2.62 ± 0.010.984116–820
DR fractal isotherm2.19 ± 0.020.975-
La0.8Sr0.2MnO3SEM—correlation function method2.18 ± 0.010.99620–136
2.43 ± 0.010.988136–700
SEM—variable scale method---
DR fractal isotherm2.20 ± 0.020.989-
Table 6. The «box-counting » fractal dimension and the lacunarity of monometallic and alloy nanoparticles. Reprinted from ref. [38], Copyright (2018), with permission from Elsevier.
SampleFractal Dimension
D0
Lacunarity
A0
Pd1.427 ± 0.4578.39 × 104
Pd-Cu 4:1 Alloy1.912 ± 0.0148.24 × 105
Pd-Cu 1:1 Alloy1.681 ± 0.0152.57 × 105
Pd-Cu 1:4 Alloy1.799 ± 0.0352.36 × 105
Table 7. The “box-counting” fractal dimensions D0, and the fractal dimensions D (λm), D (λ1) and D (λ2) obtained by gray level analysis, where D (λ1) and D (λ2) are the fractal dimensions characteristic for the nucleation processes, the “core” fractal dimension and the “shell” fractal dimension. Meanwhile, D (λm) is the fractal dimension of the whole structure. Reprinted from ref. [38], Copyright (2018), with permission from Elsevier.
SampleD0λmD (λm)λ1D (λ1)λ2D (λ2)
Pd-Cu
Core-shell
1.841 ± 0.0091401.773 ± 0.0481701.632 ± 0.0741301.826 ± 0.037
Cu-Pd
Inverse core-shell
1.855 ± 0.0101101.796 ± 0.0261301.827 ± 0.0291001.813 ± 0.010
Pd-Ag
Core-shell
1.854 ± 0.0181301.819 ± 0.1071601.669 ± 0.0611201.863 ± 0.079
Ag-Pd
Inverse Core-shell
1.875 ± 0.0321001.836 ± 0.0231101.776 ± 0.018901.884 ± 0.021
Table 8. Results of the fractal analysis performed on Pt-Cu nanoparticles. Reprinted from ref. [39], Copyright (2015), with permission from RSC.
SampleCalculation MethodFractal DimensionCorrelation CoefficientSelf-Similarity Domain/nm
(Pt-Cu)LCorrelation function2.50 ± 0.010.9911.4–2.5
2.70 ± 0.010.9812.5–5.0
Variable length scale2.68 ± 0.010.9845.0–27.5
(Pt-Cu)SCorrelation function2.40 ± 0.010.9981.4–2.2
2.73 ± 0.010.9967.5–12.5
Variable length scale2.88 ± 0.010.99212.5–22.5
Table 9. The fractal dimension of Pt-Cu/Al2O3 obtained using the correlation function method. Reprinted from ref. [44], Copyright (2011), with permission from Elsevier.
Fractal DimensionLinear Correlation CoefficientSelf-Similarity Domain
2.39 ± 0.010.9960.18–1.24
2.81 ± 0.010.9751.24–4.50
Table 10. Fractal dimensions before CO2-TPD from the analysis of TEM micrographs, using two methods: “C” meaning the correlation function method, and “S” the variable length scale method [45].
SampleFractal DimensionCorrelation CoefficientSelf-Similarity Domain (nm)
Rh/Al2O32.872 ± 0.001 (C)0.99104.4–14.4
2.784 ± 0.051 (S)0.81867.2–11.8
Al2O32.952 ± 0.001 (C)0.93750.7–8.1
2.962 ± 0.004 (S)0.95491.4–2.8
Rh/TiO22.733 ± 0.001 (C)0.98844.9–14.4
2.832 ± 0.009 (S)0.96495.4–17.3
TiO22.831 ± 0.001 (C)0.8576.5–11
2.911 ± 0.017 (S)0.9252.4–3.00
Rh/WO32.490 ± 0.001 (C)0.99750.2–2.7
2.330 ± 0.001 (C)0.99912.7–13.8
2.469 ± 0.035 (S)0.97474.5–11
2.226 ± 0.047 (S)0.933411–29.3
WO32.660 ± 0.004 (C)0.9900.2–1.2
2.293 ± 0.002 (C)0.9861.8–5.0
2.652 ± 0.042 (S)0.9494.1–5.9
Table 11. Fractal dimensions (before and after CO2-TPD) obtained by direct fitting of adsorption data with DR adsorption isotherms [45].
SampleFractal DimensionCorrelation CoefficientSelf-Similarity Domain (p/p0)CO2-TPD
Rh/Al2O32.607 ± 0.0040.99860.033–0.850Before
2.534 ± 0.0090.99730.011–0.350After
2.623 ± 0.0020.99980.350–0.800After
Rh/TiO22.604 ± 0.0030.99890.011–0.750Before
2.292 ± 0.0110.99800.005–0.350After
2.548 ± 0.0050.99870.350–0.850After
Rh/WO32.448 ± 0.0120.99770.005–0.200Before
2.589 ± 0.0140.98890.200–0.750Before
2.595 ± 0.0080.99700.005–0.350After
2.003 ± 0.0030.99930.350–0.875After
Publisher’s Note: MDPI stays neutral with regard to jurisdictional claims in published maps and institutional affiliations.

