Article

Optimization of Facile Synthesized ZnO/CuO Nanophotocatalyst for Organic Dye Degradation by Visible Light Irradiation Using Response Surface Methodology

by
Vasi Uddin Siddiqui
1,*,
Afzal Ansari
1,
M. Taazeem Ansari
1,
Md. Khursheed Akram
2,
Weqar Ahmad Siddiqi
1,*,
Abeer M. Alosaimi
3,
Mahmoud A. Hussein
4,5 and
Mohd Rafatullah
6,*
1
Department of Applied Sciences and Humanities, Faculty of Engineering and Technology, Jamia Millia Islamia, New Delhi 110025, India
2
Applied Sciences and Humanities Section, Faculty of Engineering and Technology, University Polytechnic, Jamia Millia Islamia, New Delhi 110025, India
3
Department of Chemistry, Faculty of Science, Taif University, P.O. Box 11099, Taif 21944, Saudi Arabia
4
Chemistry Department, Faculty of Science, King Abdulaziz University, P.O. Box 80203, Jeddah 21589, Saudi Arabia
5
Chemistry Department, Faculty of Science, Assiut University, Assiut 71516, Egypt
6
Division of Environmental Technology, School of Industrial Technology, Universiti Sains Malaysia, Penang 11800, Malaysia
*
Authors to whom correspondence should be addressed.
Catalysts 2021, 11(12), 1509; https://doi.org/10.3390/catal11121509
Submission received: 16 November 2021 / Revised: 2 December 2021 / Accepted: 5 December 2021 / Published: 10 December 2021

Abstract

:
In this study, we aimed to observe how different operating parameters influenced the photocatalytic degradation of rhodamine B (RhB, cationic dye) and bromophenol Blue (BPB, anionic dye) over ZnO/CuO under visible light irradiation. This further corroborated the optimization study employing the response surface methodology (RSM) based on central composite design (CCD). The synthesis of the ZnO/CuO nanocomposite was carried out using the co-precipitation method. The synthesized samples were characterized via the XRD, FT-IR, FE-SEM, Raman, and BET techniques. The characterization revealed that the nanostructured ZnO/CuO formulation showed the highest surface area (83.13 m2·g−1). Its surface area was much higher than that of pure ZnO and CuO, thereby inheriting the highest photocatalytic activity. To substantiate this photocatalytic action, the investigative analysis was carried out at room temperature, associating first-order kinetics at a rate constant of 0.0464 min−1 for BPB and 0.07091 min−1 for RhB. We examined and assessed the binary interactions of the catalyst dosage, concentration of dye, and irradiation time. The suggested equation, with a high regression R2 value of 0.99701 for BPB and 0.9977 for RhB, accurately matched the experimental results. Through ANOVA we found that the most relevant individual parameter was the irradiation time, followed by catalyst dose and dye concentration. In a validation experiment, RSM based on CCD was found to be suitable for the optimization of the photocatalytic degradation of BPB and RhB over ZnO/CuO photocatalysts, with 98% degradation efficiency.

1. Introduction

Water pollution is one of the most important causes of environmental pollution among the various other forms of environmental degradation and it is an important climatic issue worldwide. Many scientific teams around the globe are working to reduce it by eliminating dangerous contaminants from wastewater. Eutrophication and similar challenges arise prominently from the textile, paper, leather tanning, cosmetics, pharmaceutical, and food industries, which use a large quantity of dyes and similar materials, which not only create a wastewater problem, but their refractory nature is also resistant to biodegradation [1]. According to a report, more than 10,000 different dyes and pigment materials are used for various applications in these industries [2]. The toxicity, carcinogenesis, and mutagenic and teratogenic properties of these water-soluble dyes make them harmful and a threat to the environment [3]. Before discharging, conventional treatment methods, such as coagulation, flocculation, precipitation, filtration, and disinfection, turn these complex aromatic structure dyes into secondary pollutants. Therefore, there is a need to adopt an alternative method that could lead to a decrease in secondary pollutants and degrade these dyes effectively in a way that meets discharge standards. However, a single treatment method for all types of dyes is difficult to find due to their complex molecular structure.
The mineralization of the dye converts the toxic dye into non-toxic inorganic salts, water, and carbon dioxide by means of photodegradation, akin to a green chemistry approach in which visible light acts as a source of activation because strong adsorption of the dye occurs in the visual region. Moreover, the basis for the classification of the dyes as cationic, anionic, and non-ionic dyes is their molecular structure. The dyes rhodamine B (RhB) and bromophenol blue (BPB), which are commonly used in the textile industry, were chosen for this study; their molecular structures are shown in Figure S1. The catalyst-assisted process includes the generation of free radicals. These include hydroxyl radicals (OH) and superoxide radicals ( O 2 ), as well as a redox reaction at the surface catalyst.
TiO2 and ZnO nanoparticles (NPs) are established alternative heterogeneous nanophotocatalysts that are widely used for the decolorization of organic pollutants via advanced oxidation processes (AOP), and semiconductor-assisted AOP is a promising alternative method, but it has some limitations and advantages over traditional methods. Various other photocatalysts with different photodegradation mechanisms have been reported, such as UV-vis irradiation, which was used to evaluate the photodegradation of rhodamine B (RhB) on TiO2 films. For RhB, the films showed quite different photodegradation processes. The separation of photogenerated electron holes is thought to be aided by defect sites on the surface or interface of TiO2 films [4]. Similarly, metal-organic frameworks (MOFs) are commonly used for promising applications. Hu et al. reported a simple and effective method to produce MOF-based melamine foams (MOFiths) with high loading stability and easy separation. By adopting this approach, various sizes of MOFs with controllable loading ratios could be fabricated. The reported MOFiths are used in the removal of organic pollutants and can be rapidly degraded using a series of cycles starting from 10 min [5]. However, challenges in recovery and deployment conditions make MOF-based materials difficult to sustain. Furthermore, C3N4 has been used as a photocatalyst for degradation, as previously reported in the literature; e.g., the direct solar energy-harvesting of ammonia is a promising technique used to reduce the ammonia content in water. The energy-resolved distribution of electron traps (ERDT) around the conduction band’s bottom position was used for the first time by Chuaichama et al. to identify the structure of undoped C3N4 (CBB). The ERDT/CBB pattern is used to categorize the many types of elemental doping in C3N4 that affect photocatalytic efficiency for the reduction of Cr(VI) [6]. Wang et al. introduced a new type of atomic single-layer graphitic-C3N4, which has good photocatalytic activity. In addition, the results indicated that over 80% of TAN could be removed in 6 h by means of Xe lamp irradiation. High photocatalytic activity of the solution was also exhibited by the SL g-C3N4 [7]. Under visible light irradiation, an Fe-based ionic liquid-doped g-C3N4 (Fe-CN) photocatalyst was able to successfully degrade rhodamine B (RhB). Fe-doping has the potential to greatly speed up the separation of photogenerated carriers. It has been claimed that the synergistic impact of O 2 and OH aided in the effective degradation of RhB [8]. Graphene-based materials are regaining popularity as innovative materials for environmental applications. The unique physicochemical features of these materials could lead to new or enhanced technologies to address the most critical environmental issues facing the world. Graphene could be employed as a component in next-generation water treatment and desalination membranes, as well as as an electrode material for contamination detection and removal [9]. Moreover, the photocatalytic degradation of trimethoprim has been demonstrated through the hydrothermal production of Cu2O nanostructures (TMP). The specific activity of 1.12 µmol·g−1·min−1 for a 0.1 mM TMP aqueous solution is comparable to prior results requiring higher energy and/or intensity UV irradiation. A hierarchical Cu2O nanostructure demonstrated the highest photodegradation activity. The hydroxymethyl radicals photogenerated over the Cu2O nanostructure induce the stepwise hydroxylation and oxidative cleavage of TMP to yield monocyclic fragments [10]. A nanohybrid of CuO/Mn3O4/ZnO was developed by Raha et al. using a simple hydrothermal technique. When irradiated with visible light, the hybrid photocatalyst caused the 97.02% degradation of rabeprazole. The photodegradation progressed in accordance with the pseudo-first-order kinetic model, with a velocity constant of 0.07773 min−1 [11]. By inhibiting the recombination of photogenerated electron-hole pairs, a combination of Zn-Ti-layered double hydroxide/montmorillonite (ZTL/MT) and iron (Fe)-doped MT could improve photocatalytic activity. Fe impurities in MT form a novel mid-gap state that promotes a Z-scheme heterojunction with ZTL, resulting in reduced charge carrier recombination in ZTL. These findings show that MT can not only operate as a support material, but also as a photocatalyst for Cr(VI) reduction [10].
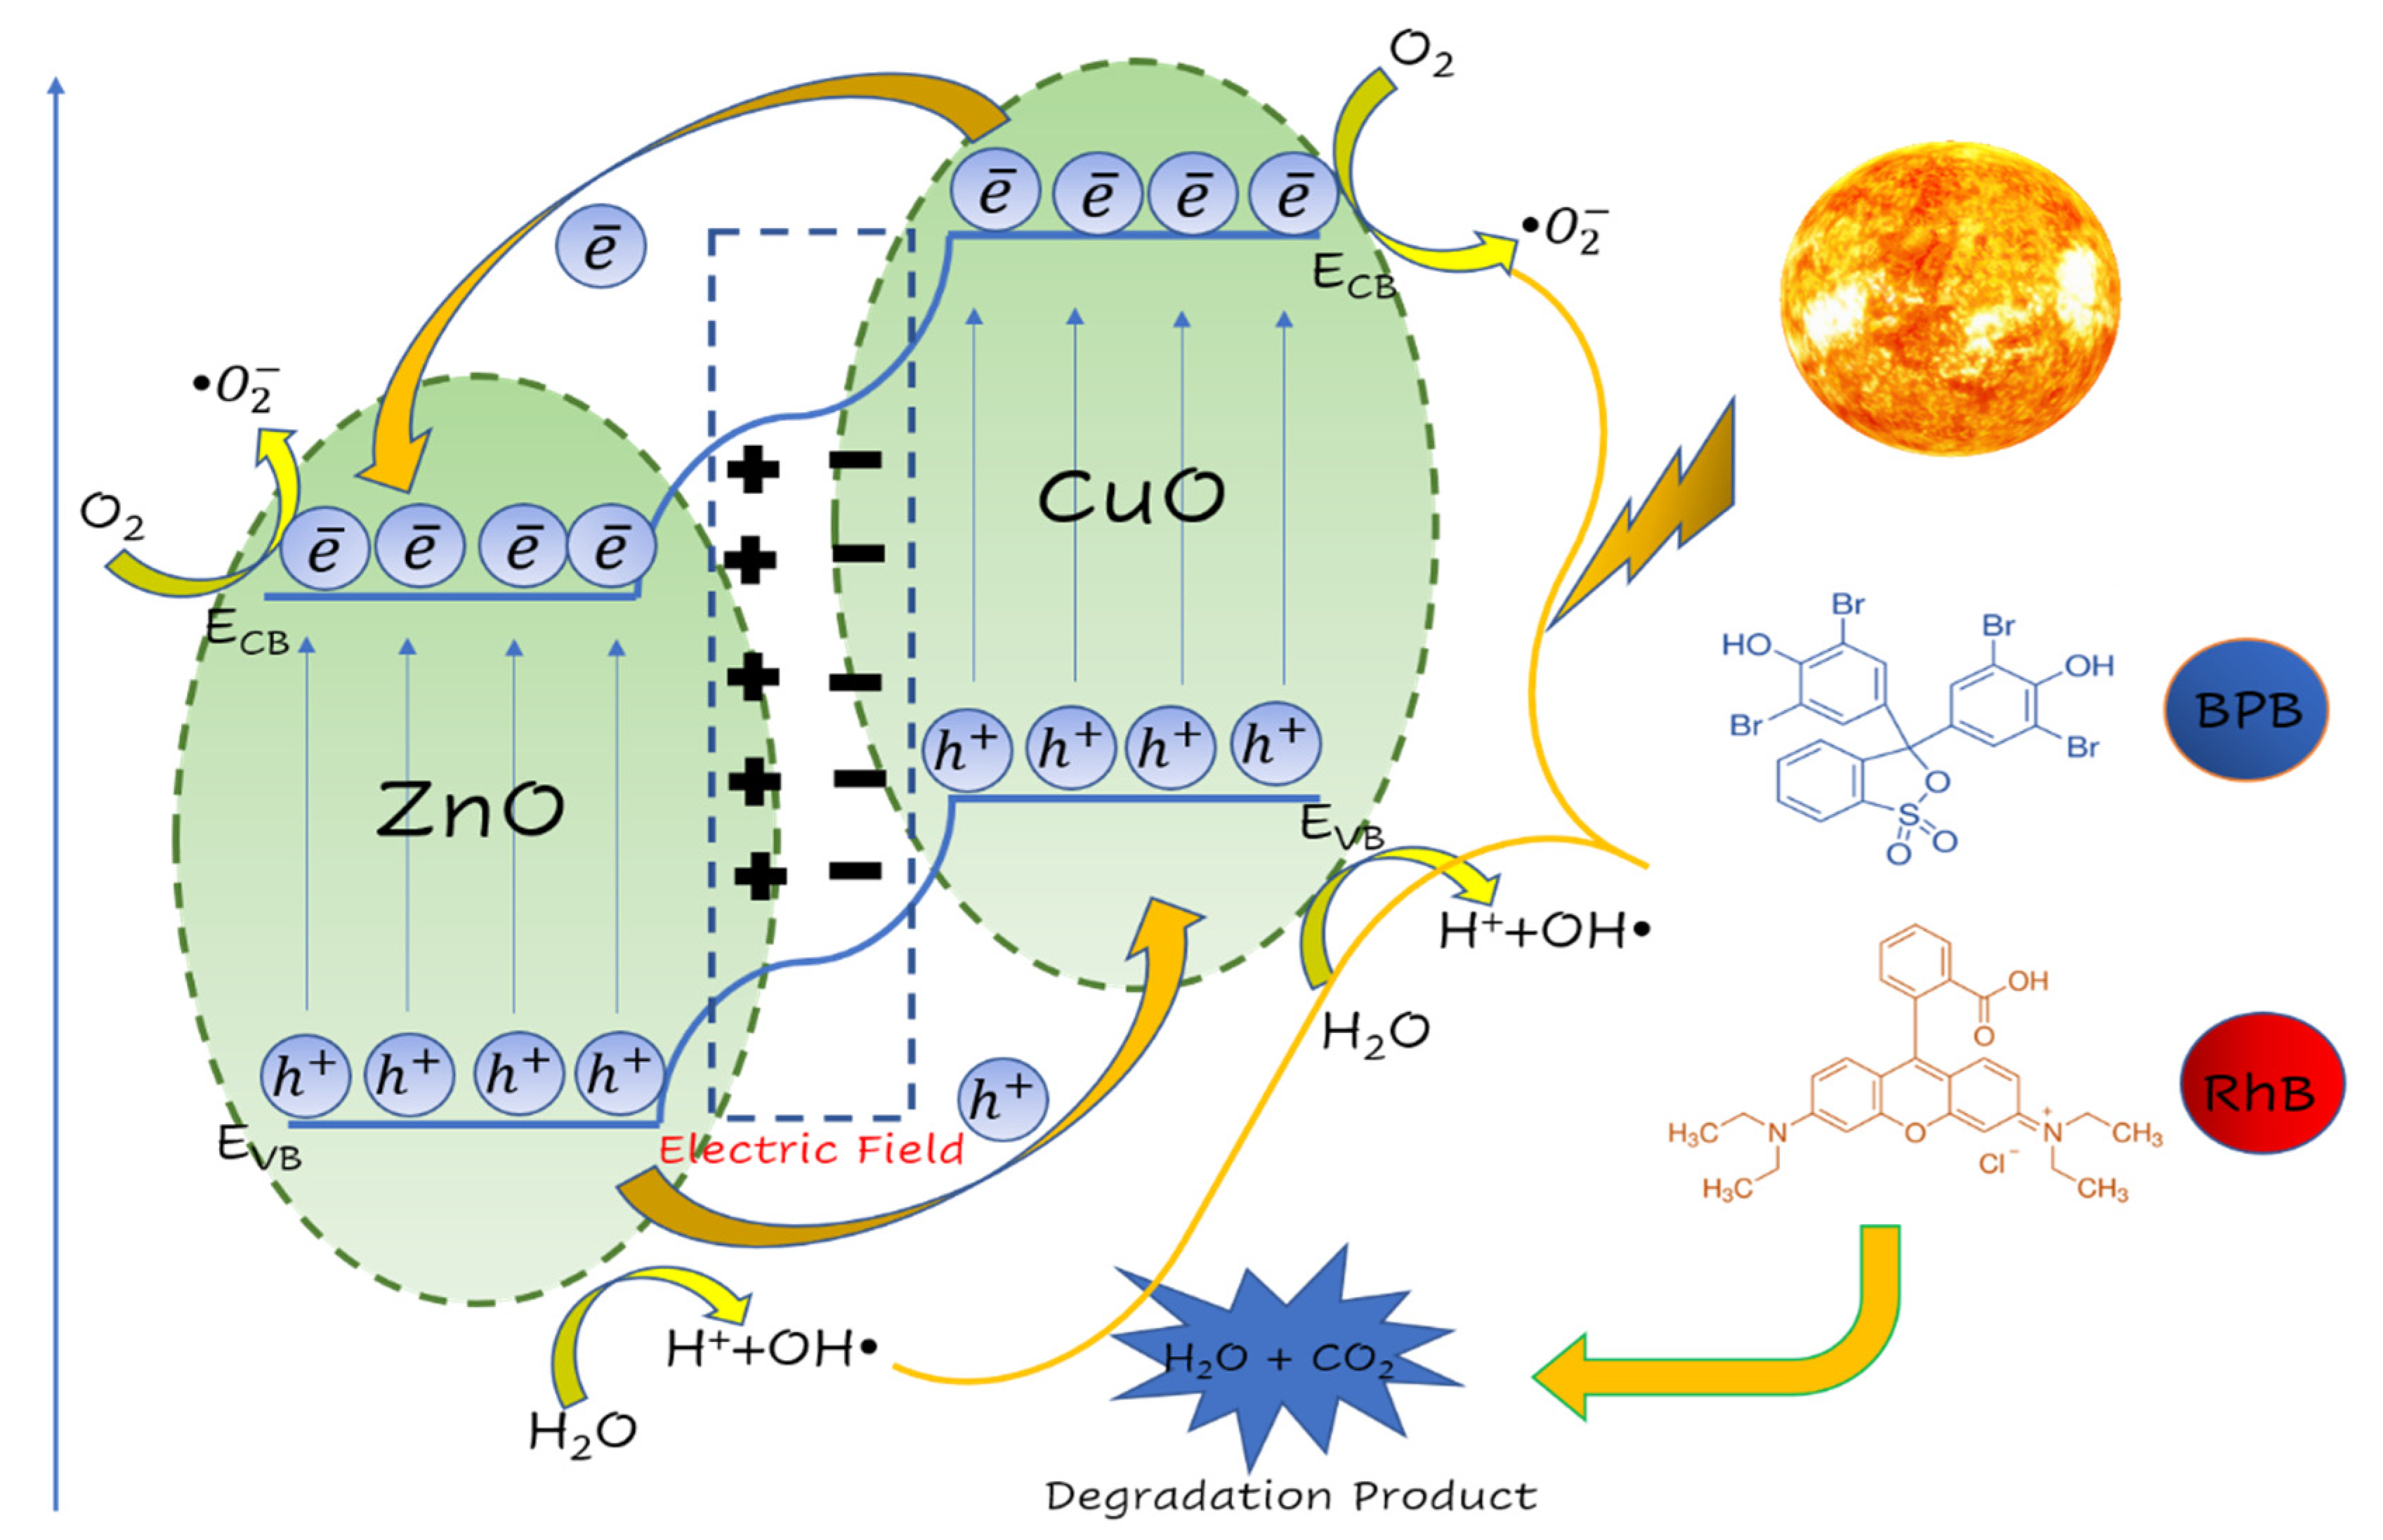
At ambient temperatures, the ZnO nanoparticle, as a semiconductor with a broad bandgap (~3.2 eV), displays a high exciton binding energy (60 meV). Furthermore, in the presence of UV photon energy, electrons become excited from the valence band (VB) to the conduction band (CB), thereby, limiting its potential application in pollutant cleanup applications. Consequently, it is important to design and tune the ZnO crystal structure and morphology and lower the electron-hole (ē/h+) pair recombination rate for viable photodegradation under visible-spectrum light by means of a suitable dopant or additive. As a result, one of the current research hotspots has been the development of highly effective and environmentally-friendly photocatalysts. A combination of two semiconductive materials is the most attractive approach for enhancing the photocatalytic responses and reducing electron-hole pair recombination. A narrow-bandgap (~1.3 eV) monoclinic CuO was suitable to enhance the photocatalytic performance of ZnO among the various narrow-bandgap metal oxide semiconductor nanomaterials studied because CuO has grown in popularity as a material for gas sensing, supercapacitors, rechargeable lithium-ion batteries, photovoltaic applications, solar hydrogen processing, and catalytic activities. In addition to being synthesized in an eco-friendly manner and readily available, the energy gaps of ZnO (3.2 eV) and CuO (1.3 eV) cover the ultraviolet and visible spectra, which proves their efficient candidacy for the catalytic degradation of dyes. Among numerous synthesis strategies, such as co-precipitation, sol-gel, hydrothermal, solid-state based synthesis, and the solution combustion method, the co-precipitation synthesis method using a simple aqueous solution approach, free from a template and surfactant, was used for the synthesis of ZnO/CuO.
The study of experimental designs based on response surface methodology (RSM) or the Box–Behnken design (BBD) is a valuable technique since it generates a mathematical model that aids in the optimization of various factors and their interactions [12,13]. Furthermore, it requires fewer tests, saves time, and thus minimizes errors and the amount of chemicals and manpower needed. Previously reported data showed correlations between the theoretically predicted and experimentally generated results [14,15]. Motivated by this fact, the prime focus of the present study was to statistically optimize the process conditions for RhB and BPB dye degradation and to evaluate the optimal conditions for dye degradation.
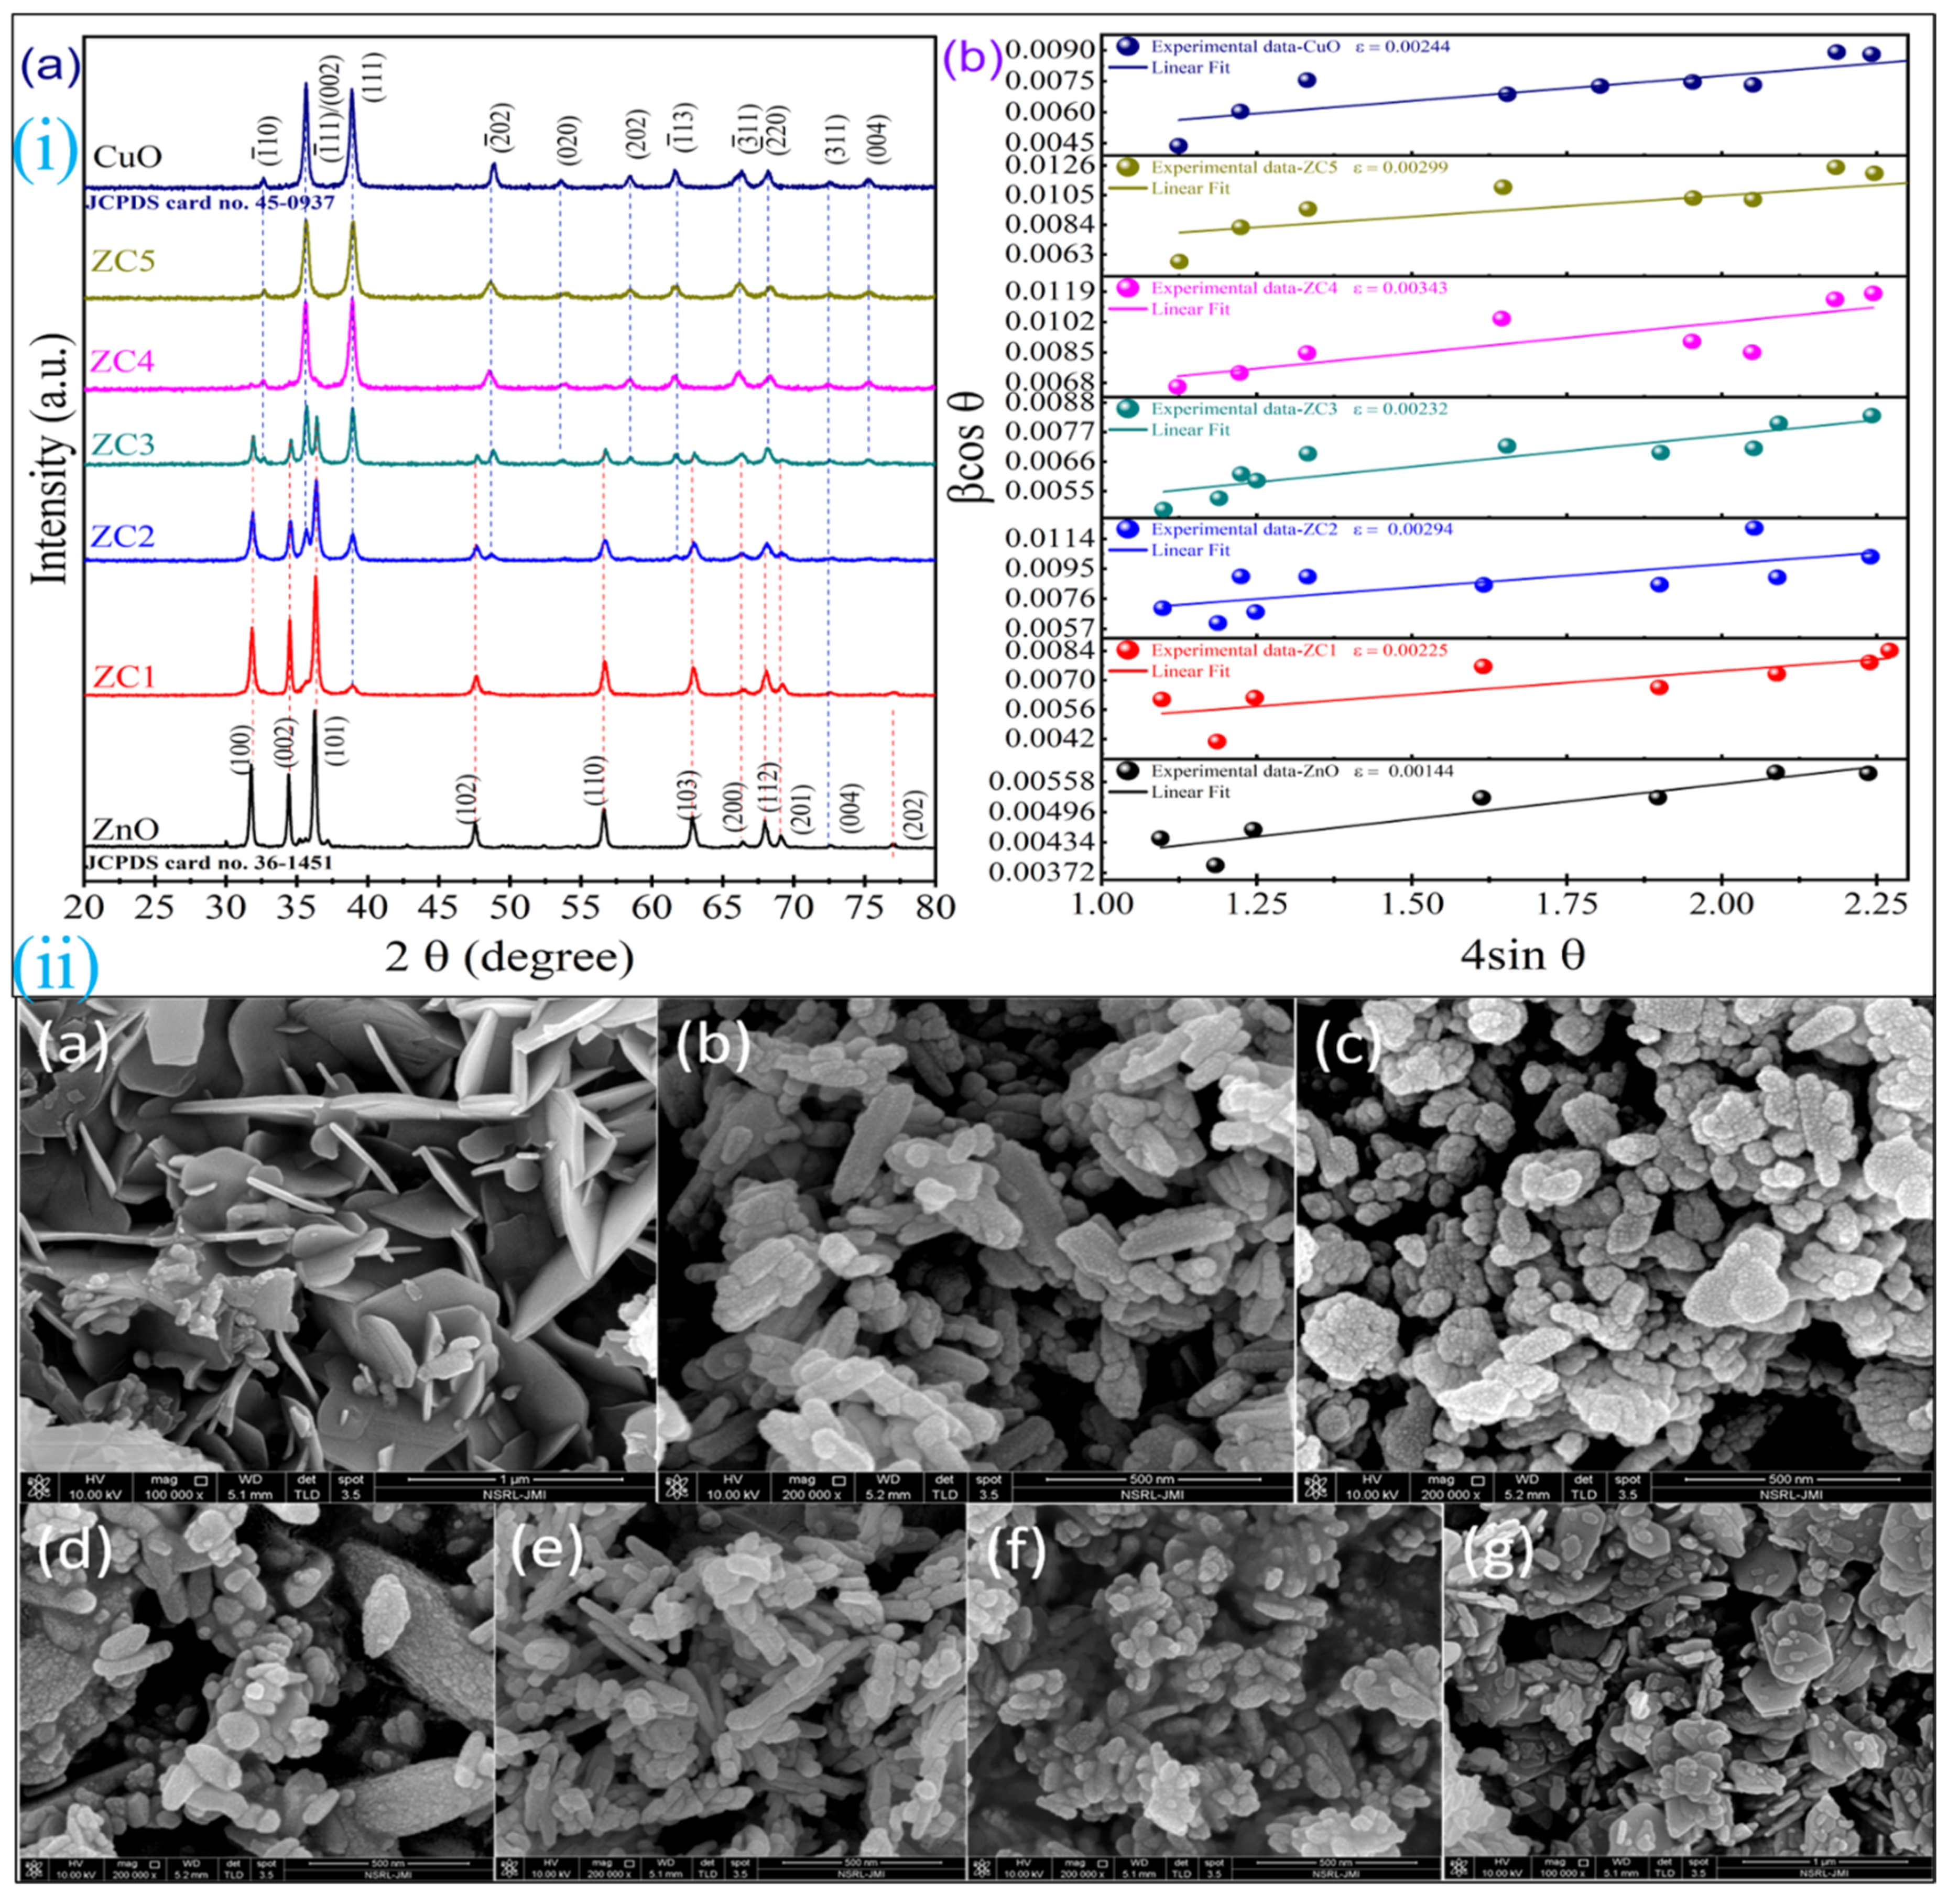
No study has yet been carried out, based on the authors’ best knowledge, in which ZnO/CuO was synthesized at these ratios and their photocatalytic output under visible light was optimized by utilizing the response surface methodology in correlation with central composite design. The prime objective of this work was to (a) easily synthesize CuO, ZnO, and their nanocomposite ZnO/CuO; (b) investigate their morphological and structural properties by employing scanning electron microscopy (SEM) and the X-ray diffraction technique (XRD); (c) compare, evaluate, and optimize their photocatalytic activity under the influence of visible light irradiation against RhB (cationic) and BPB (anionic) using RSM based on CCD.

2. Results and Discussion

2.1. Structural Morphology and Compositional Analysis

The powder X-ray diffraction (XRD) technique was used to record the structure and crystal phase of synthesized ZnO, CuO, and their nanocomposite (ZnO/CuO). The XRD pattern of the crystal structures of all synthesized samples is depicted in Figure 1(ia). Diffraction peaks at 2θ = 31.78°, 34.43°, and 36.26°, which correspond to (100), (002), and (101) planes, respectively, indicated the presence of the hexagonal wurtzite structure (space group: P63mc) of ZnO, in agreement with JCPDS card #36-1451 [16].
The well-developed XRD peaks at 2θ = 35.63° and 38.88° correspond to (−111)/(002) and (111) planes, respectively, and validate the monoclinic crystal phase (space group:C2/c) structure of CuO nanoparticles, as reported earlier (JCPDS card #45-0937) [17]. In addition, no other diffraction peaks corresponding to Cu2O, Cu(OH)2, and Zn(OH)2 or any other impurities were detected, which suggested that the samples were pure in form and showed good crystallinity. As the copper content in ZnO/CuO increased, the supported peaks emerged, and similarly, the corresponding ZnO peaks diminished in ZC1 to ZC5 when the zinc content decreased. Peak intensities are determined by the position of atoms within a unit cell. The increased relative intensity reflects the larger number of planes along the long axis, which corresponds to a change in the crystal shape [18,19]. A clear difference in the values of the relative intensity ratio of (100)/(002) and (−111)/(002) was observed in the ZnO and CuO samples, which suggested the growth of the crystal phase structure. The patterns for the intensity ratios of ( I 100 / I 002 ) and ( I 111 / I 002 ) were as follows ZC2 > ZC3 > ZnO > ZC1 > CuO > ZC4 > ZC5 and ZnO > ZC1 > ZC2 > CuO > ZC3 > ZC5 > ZC4, respectively. The slow growth is related to the higher magnitude of the intensity ratio, whereas its lower magnitude confers preferential growth along the c-axis for the ZnO crystal [20]. The computed average crystallite size (D) of all prepared samples was carried out employing the following Scherrer formula, Equation (1):
D = k λ β cos θ
where the magnitude of the shape factor (k) is 0.94; λ denotes the Cu-Kα radiation of wavelength (1.5406 Å); β is the full width at half maximum (FWHM) in radians; and θ is the diffraction angle for ZnO, ZC1, ZC2, ZC3, ZC4, ZC5, and CuO, which was 36.21°, 36.81°, 36.48°, 35.65°, 38.86°, 35.55°, and 35.74° respectively. The average crystallite sizes of all the as-synthesized materials were found to be in the ranges of 16 to 32 nm using Equation (1), as shown in Table 1.
Furthermore, the broadening of the peak in the nanocomposite (ZnO/CuO) arose due to strain caused by non-uniform lattice distortion and dislocation in the crystal phase due to the mismatch in the sizes of zinc and copper. The internal lattice strain Equation (2) and the Williamson–Hall (W-H) Equation (3) were used to calculate the crystallite size (D) and microstrain (ε) from the powder X-ray diffraction pattern, with the modified Scherrer equation:
ε = β hkl 4 tan θ  
β hkl cos θ = k λ D + 4 ε   sin θ  
The least-square fit was used in βhkl cosθ vs. 4sinθ for measuring the slope and intercept for calculating ‘D’ and ‘ε’ as delineated in Figure 1(ib). The positive slope implies the occurrence of strain in all as-synthesized materials and was higher in magnitude as size decreases, suggesting dislocation in the lattice crystal. The dislocation caused by lattice strain was evaluated by using Equation (4):
δ = 1 D 2  
where (δ) is dislocation density—the measure of the dislocation line length per meter square of the crystal. Table 1 presents the comparative results in line with Scherrer’s formula and W-H analysis analogous to the previously reported literature.
The morphology of the as-synthesized materials was studied using SEM. The structural change corresponded to the variation in the Zn2+ and Cu2+ ratio in the nanoparticles, as depicted at different magnifications in Figure 1ii. FESEM was used to analyze the morphology of as-synthesized materials. In Figure 1ii, the synthesized ZnO NPs had a more obvious flake-like shape than the CuO NPs. On the other hand, Figure 1ii illustrates that the morphology of the ZnO/CuO nanocomposite changed from nanoflakes to rod-like and spheroid shapes as the ratio of Cu2+ content increased. The particle sizes of the synthesized nanocomposites were in the nanoscale range, which was consistent with the XRD results.
The functional group present in CuO, ZnO, and their nanocomposite (ZnO/CuO) was identified by employing the vibrational spectra recorded in transmission mode using the FTIR spectrometer, as shown in Figure 2i. Inter-atomic vibrations caused the absorption bands of metal oxides to be detected primarily below 1000 cm−1. Furthermore, the peaks at 430 cm−1 and 606 cm−1 were the characteristic stretching vibration of the Cu-O bond, which corresponds to the crystal structure (monoclinic) of CuO (202) and (−202) plane, respectively [21]. Similarly, an intense peak was observed between 520 cm−1 and 430 cm−1 that confers the stretching of the Zn-O bond, ascribed to the ZnO wurtzite structure [22]. Stretching and bending hydroxyl of water at 1625 cm−1 and 3420 cm−1 revealed weak (symmetric) and broad (asymmetric) H-O-H bond peaks. The band positioned at 1109 cm−1 indicates the stretching of the C-O bond of CO2 in a symmetric way, which occurs in the air and gets absorbed on the surface. The peak observed around 2900 cm−1 is associated with the stretching of C-H. Furthermore, the peaks between 615 cm−1 and 621 cm−1 were attributed to the absence of Cu2O observed in all as-synthesized samples [2]. Similar peaks were observed in ZC1, ZC2, ZC3, ZC4, and ZC5, with a slight shift of wavenumber indicating the structural change in ZnO upon the successful inclusion of CuO. Based on the FT-IR spectrum data, the effective weights, force constants, and bond length values of ZnO and CuO were determined using Equations (S1) and (S2) to be 10.52 × 10⁻²⁵ kg, 6.86 Ncm−1, and 1.3532 Å and 2.12 × 10⁻²⁶ kg, 2.75 Ncm−1, and 1.8360 Å, respectively.

2.2. Optical Analysis

The UV-vis spectra of ZnO, CuO, and their nanocomposite (ZnO/CuO) showed characteristics wavelength peaks, as shown in Figure 2(iia). The optical bandgap (Eg) of the synthesized samples was determined using the Tauc plot, hν vs. (αhν)2, as indicated in Figure 2(iib) and correspondingly in Table S2 using the following Equation (5):
( α . h ν ) 1 n = k h ν E g
where k is a constant, hν is the photon energy, Eg the bandgap energy, and the absorption coefficient is expressed as (α). The n factor equals 1/2 or 2 for the indirect and the direct band gaps, respectively, depending on the nature of the electric transition [20]. Strong absorption between the 300 nm and 400 nm ultraviolet regions showed the presence of pure ZnO, whereas the pure CuO sample showed a broad absorption between 300 nm and 800 nm. In ZnO/CuO samples, a strong ZnO absorption band appeared in ZC1 and ZC2, due to higher content of Zn2+, whereas ZC4 and ZC5 showed a broad spectral region like that of CuO due to a higher ratio of Cu2+. However, ZC3 showed the redshift absorption bands of ZnO and CuO, respectively, confirming that the composite was composed of ZnO and CuO. This behavior could be explained by the Burstein–Moss effect [23]. Furthermore, in Cu2+-containing materials, a broad less intense shoulder-like feature was observed, ranging from 500–800 nm, correlated to the surface plasmon resonance behavior pertaining to the nanoscale phase in CuO. Furthermore, the synergistic effect causes the modification of the energy bandgap. CuO has a lower Eg (~1.59 eV) than ZnO (~2.87 eV), which explains why the energy bandgap narrows when ZnO and CuO particles are combined to form a composite. The shift in bandgap energies to a lower magnitude may be associated with the improved coupled transitions from O2 (2p) (valence band) to Zn2+(3d1 –4 s) (conduction band) and Cu2+(3d9) [24]. This decrease in the bandgap causes increased electron flow in irradiated samples, making it easier for the electron transition to occur via the valence band to the conduction band. Furthermore, CuO/ZnO also offers stronger photocatalytic capabilities than ZnO or CuO due to its lower bandgap energy [25].
Figure 3 depicts the deconvolution photoluminescence (PL) spectra (Gaussian fit) of ZnO, CuO, and ZnO/CuO (ZC1, ZC2, ZC3, ZC4, and ZC5) samples at room temperature to study the defects present in the crystal lattice at an excitation of 320 nm over a wavelength that ranges from 300–700 nm, respectively. The defect density and vacancies generated by oxygen have a significant impact on the optical properties of oxide nanostructures. The deconvoluted PL spectra revealed four emission bands, one of which comes from the UV area around 380 nm due to near-band-edge (NBE) emission and the others from the visible region due to deep-level defects (DLDs). Electron-hole pair recombination was primarily responsible for PL emission. The free excitation transition in ZnO corresponds to direct bandgaps in the violet region at 384 nm, 393 nm, and 413 nm, with the occurrence of the peak at 453 nm in a blue region, indicating strain growth. PL spectra showed a characteristic visible peak of CuO in the violet (around 420 nm) and blue regions (around 453 nm, 469 nm, and 489 nm) [26]. The emission peaks in the visible region were induced due to the presence of defect states, which could improve solar light absorption. The five forms of intrinsic defects observed in ZnO were a vacancy in the zinc lattice (VZn), oxygen sublattice (VO), interstitial zinc (Zni), and oxygen (Oi), including the antisite oxygen (OZn). Similarly, four types of defects were frequently found in the CuO crystal lattice structure: VCu (vacancy in the copper sublattice), VO (vacancy in the oxygen sublattice), CuO (antisite copper atom in the oxygen sublattice), and OCu (antisite oxygen atom in the copper sublattice) [27]. The green emission peak due to the ionized oxygen vacancy of CuO appeared from ZC3 in the composite. Moreover, peaks in blue and violet emissions in the composite also corresponded to the defect states in ZnO and CuO. ZC1 and ZC2 showed higher PL intensity, which could be attributable to low oxygen vacancies, as morphological changes do not change the qualitative picture of the spectra when the diameter of the ZnO is varied, but the intensity of the NBE is greatly enhanced and the intensity of the DLE is greatly suppressed and, as a result, the formation of vacancies occurs [28,29,30] However, more CuO in the nanocomposite could result in a decrease in peak intensity, a more profound p–n junction, and higher charge separation, resulting in ZC3 showing an optimum ratio of Zn2+ and Cu2+ [31]. The lower PL intensity normally indicates a lower rate of recombination and a faster rate of recombination with a greater PL intensity. ZC3 exhibited the lowest intensity among all the as-synthesized materials, indicating superior photocatalytic efficiency.

2.3. BET Analysis

Catalytic reactions are designed to enhance the reaction rate while retaining the high yield and selectivity of the targeted product. This can be accomplished by tuning the catalyst to have a larger surface area. Increasing the active sites onto the surface of the produced nanoparticles amounts to more adsorption and reaction sites for the catalytic process. This is due to the enhanced surface area of the nanoparticles. As a result, the significant factors employed to promote photocatalytic reaction performance are a high surface area and porosity in the photocatalytic material. Nitrogen (N2) adsorption-desorption isotherms were used to inspect the Brunauer–Emmett–Teller (BET) surface areas and pore characteristics of CuO, ZnO, and nanocomposite (ZnO/CuO) samples. The resulting outcomes related to these studies as highlighted in Figure S2, along with the derived values tabulated in Table 2. According to the BET data, the samples had typical IV isotherms, indicating that they almost had mesopore structures [32,33]. The computed specific surface areas for CuO, ZnO, and nanocomposite (ZnO/CuO) samples were 32.89, 40.29, and 83.13 m2·g−1, respectively. Furthermore, Figure S2c shows the Barrett−Joyner−Halenda (BJH) plot, which represents the calculated average pore size distribution of nanoparticles from the adsorption sites. Moreover, the BJH model, employed for computing the average pore diameter and volume of CuO, ZnO, and their nanocomposite samples, showed magnitudes of 0.3198, 0.3981, and 0.8213 cm3·g−1, respectively. Using the Dubinin−Astakhov (DA) method, with the plot presented in Figure S2b, the pore radius of CuO, ZnO, CuO, and (ZnO/CuO) was calculated to be 15.1, 14.0, and 13.6 Å, respectively. ZC3 showed a higher surface area and lower radius than pristine ZnO and CuO as increasing the molar ratio of Zn2+ and Cu2+ affects the morphology and reduces the sizes of nanoparticles, as shown in Figure 1 [34,35]. Moreover, these materials have low surface areas when separately synthesized [36]. Previous findings also suggested an association between higher pore volume and increased surface area [37,38]. Therefore, after comparing the results, ZC3 provided enhanced photocatalytic activity compared to its counterparts ZnO and CuO.

2.4. Raman Analysis

To understand the crystal defect and microstructure properties, the recording of Raman spectra was undertaken at room temperature for CuO, ZnO, and ZnO/CuO, as shown in Figure 4a–c. Typically, CuO (monoclinic, space group C 2 h 6 ) has nine phonon vibrational modes 4 A u + 5 B u + A g + 2 B g in which only three A g + 2 B g are Raman-active modes; three acoustic modes ( A u + 2 B u ); and six infra-red (IR) active modes 3 A u + 3 B g , whereas ZnO (hexagonal wurtzite, space group C 6 v 4 ) has a total of eight phonon modes 2 A 1 + 2 B + 2 E 1 + 2 E 2 , in which only 2 B is a Raman-inactive mode [23,26]. All Raman-active peaks in ZnO, shown in Figure 4a at 330.08 cm−1, 396.0 cm−1, 441.09 cm−1, 601.0 cm−1, and 964 cm−1, were in good accord with the previously reported literature [26]. The intense vibrational peak found at ~441 cm−1, attributed to E 2 high , suggested the transition of surface Zn–O groups present in the crystalline lattice of ZnO [39]. The polar modes A 1 and E 1 correspond to transverse optical (TO) and longitudinal optical (LO) vibrational modes, respectively. A 1 modes (582.50 cm−1) were attributed to zinc and oxygen atoms parallel to the c-axis. Additionally, the non-polar E 2 modes (334.17 cm−1) were caused by mutual cancellation of the displacement vector of the individual sublattices [40]. In this context, pure CuO was found to exhibit only three Raman-active vibrational modes: A g (270 cm−1), B 1 g (341 cm−1), and B 2 g (615 cm−1), all of which correlate to oxygen atom vibrations [21]. As shown in Figure 4c, the synthesized nanocomposite Raman spectra revealed peak shifts with distinct vibrational modes that exist in ZnO and CuO, when compared to respective pure metal oxides. This type of peak shift was characterized by defects such as vacancies caused by oxygen-point defects, oxygen-mislaid zinc and copper atoms from the sublattices, and lattice stress generated internally during the growth process. The ZC3 sample had shoulder peaks from 450 cm−1 and 490 cm−1, which matched CuO, and implied multiphonon scattering by the CuO phase in the nanocomposite structure. In the presence of an optical energy source, multiphonon scattering aids in the formation of several charge carriers from a single excitation, which is critical in the fabrication/development of efficient optoelectronic devices. The manifestation of multiphonon-scattering Raman peaks when exposed to visible light indicates that there are more cumulative charge carriers available for photocatalytic processes [41]. This form of scattering might potentially aid in the improvement of photocatalytic activity.

2.5. Photocatalytic Studies

In this study, the photocatalytic activity of CuO, ZnO, and ZnO/CuO nanocomposite under visible light irradiation was investigated using the degradation of cationic and anionic dyes.

2.5.1. Effect of the Nanocomposite (ZnO/CuO) on the Degradation of Dye

The effects of changes in the concentrations of Zn2+ and Cu2+ ions in as-synthesized samples were observed on the degradation efficiency using 10 mg L−1 of RhB and BBP pollutant concentrations. It was observed that ZC3 exhibits a photocatalytic activity that is higher than all that of as-synthesized pure materials (ZnO, CuO), and nanocomposite materials (ZC1, ZC2, ZC4, and ZC5), as shown in Figure 5. ZC3 showed almost 76% and 81% degradation efficiency under visible light irradiation against BPB and RhB, respectively. This could be attributed to the enhanced quantum efficiency in the absorption of visible light [12]. CuO has a higher valence band and conduction band than ZnO. This tends to facilitate the transport of excited electrons and holes thermodynamically, resulting in more efficient photocatalytic activity [42]. Therefore, pure ZnO and CuO were not included as variables for further photodegradation studies, and only ZC3 among all the ZnO/CuO nanocomposites was used to perform the remaining photodegradation experiments.

2.5.2. Modeling and Statistical Analysis

This modeling and statistical analysis was conducted to describe the effect of independent parameters on photocatalytic BPB and RhB dye degradation, utilizing the response surface methodology using CCD. The parameters included the catalyst dose, dye concentration at the initial stage, and reaction time. In this context, the input parameter levels are shown in both coded and uncoded forms in Table 8. Furthermore, as shown in Table 8, the experimental design allowed for the formulation of a second-order polynomial equation to link the independent variables to their responses. The final Equations (6) and (7) for BPB and RhB, respectively, in terms of their coded factors, are as follows:
% Degradation   BPB = 87.84 + 12.06 A 1.13 B + 26.69 C + 3.62 AB + 0.2237 AC 0.9437 BC 20.05 A 2 5.27 B 2 15.34 C 2
% Degradation   RhB = 92.84 + 11.77 A 0.8243 B + 26.91 C + 4.09 AB + 0.7487 AC 1.72 BC 20.24 A 2 5.28 B 2 15.34 C 2  
and in terms of their actual factors:
% Degradation   BPB = 133.88690 + 6.06425 Photocatalyst   dose + 1.40063 Dye   concentration + 3.36466 Reaction   time + 0.023160 Photocatalyst   dose Dye   concentration + 0.000651 Photocatalyst   dose Reaction   time 0.002745 Dye   concentration Reaction   time 0.128310 Photocatalyst   dose 2 0.033717 Dye   concentration 2 0.020290 Reaction   time 2
% Degradation   RhB = 129.90301 + 5.92500 Photocatalyst   dose + 1.49134 Dye   concentration + 3.40032 Reaction   time + 0.026200 Photocatalyst   dose Dye   concentration + 0.002178 Photocatalyst   dose Reaction   time 0.000500 Dye   concentration Reaction   time 0.129530 Photocatalyst   dose 2 0.033805 Dye   concentration 2 0.020290 Reaction   time 2
For BPB and RhB, the model’s adequacy was tested using a popular method called analysis of variance (ANOVA). Tables 4 and 5 present the outcomes, respectively. Table 3 and Table 4 additionally summarize the regression coefficients, R2 values, and lack of fit. The significance of each coefficient was determined using the F-value and the p-value. If Prob > F is less than 0.0500, the model terms are significant; if Prob > F is greater than 0.1000, the model terms are not significant [43]. According to Prob > F values, the terms in Table 3 are significant for A, B, C, AB, A², B², C² but not for AC and BC. Similarly, the terms in Table 4 are significant for A, B, C, AB, AC, BC, A², B², and C². The obtained F-values indicated the great significance of the irradiation time, followed by the catalyst dosage and dye concentration, respectively, for BPB and RhB degradation. Likewise, AB interaction was most significant followed by BC and AC. The resulting model had a ‘‘lack of fit F value” for BPB and RhB of 8.4325 and 3.0745, respectively, suggesting that the “lack of fit” was “not significant”, and the model was acceptable. In addition, values of the coefficient of determination (R2) of 0.9994 for BPB and 0.9997 for RhB demonstrated that both simplified models could account for a significant percentage of the variance in the design space. The obtained ‘‘Pred R2” values of 0.9961 for BPB and 0.9984 for RhB are in good agreement with the ‘‘Adj R2” values of 0.9986 and 0.9993 for BPB and RhB, respectively. Furthermore, ‘‘Adeq Precision”, calculated as the signal-to-noise ratio, was favorable for values larger than 4 [44]. The “Adeq Precision” values achieved for BPB and RhB were 97.11 and 142.39, respectively. High values indicate an appropriate signal and demonstrate the model’s ability to explore the design space. Figure 6(ai,bi) depict a plot of predicted versus actual response values for BPB and RhB, respectively. For BPB and RhB, the high regression values of 0.9994 and 0.9997 revealed that the predicted value was close to the actual recorded value.
The residuals, which indicate the differences among the experimentally derived values and the predicted values, were used to gather the desired information pertaining to the suitability related to the model. Moreover, the technique is also related to the finding of outliers and the investigation of the diagnostic charts, detailing the information for the residual plots and the normal probability. For the resulting residuals, if found to have a normal distribution, the point tends to follow a straight line on the normal probability plot. Figure 6(aii,bii) show that the residual was normally distributed as it resembled a straight line.

2.5.3. 3D Response Surface Plot Analysis

The interaction between the two factors in the photodegradation of BPB and RhB was demonstrated using a three-dimensional response surface plot. The application of this technique enables the alteration of two parameters within the experimental ranges, with one being constant.

Influence of Dye Concentration with Catalytic Dose

The 3D response graphs shown in Figure 7(ia,iia) indicate the dye concentration at the initial stage, with ZC3 NPs doses given at 90 min contact time. The results further revealed that the percentage degradation of BPB and RhB dye is concentration-dependent. As the dye concentration was enhanced, more BPB and RhB molecules tended to quickly saturate the binding sites available on the surface area of a fixed quantity of ZC3 NPs. As a result of the limited adsorption sites, the rate of degradation would be slowed.

Influence of Catalytic Dose with Reaction Time

Figure 7(ib,iib) show the surface plots of BPB and RhB photodegradation in 3-D, respectively. The plot is designed as a function of sample loading and the possible time taken for irradiation. The elliptical shape of the 3D plot suggested that BPB and RhB photodegradation was aided by the interactions of the sample-loading concentration and irradiation time. The results showed that increasing the sample loading up to about 22.5 mg enhanced the photodegradation of BPB and RhB during a short irradiation time (30 min). As shown, increasing the sample-loading concentration and irradiation time improved the photodegradation of MB. This might be explained by the fact that the longer the irradiation time given to the process, the more exposed the surface of the ZC3 photocatalyst is to visible light, producing more hydroxyl radicals, which photodegraded more BPB and RhB. The photocatalytic activity was slowed as the sample loading was increased. Despite using a longer irradiation duration, a similar tendency was seen. This was due to the excess ZC3 (>22.5 mg) acting as a recombination center [45].

Influence of Dye Concentration with Reaction Time

The decrement in the photodegradation performance correlates to variations in the realized dye concentration, corresponding to a contact time of 60 min with an initial pH of 6, as shown in Figure 7(ic,iic). The graphs show that the effectiveness of degradation was decreased by enhancing the concentration of dye initially from 15 to 40 mg L−1 from 90% to 40%. This could be corroborated by the presence of hydroxyl radicals that might interact with the surface-laid dye molecules. Furthermore, the degradation efficiency decreased when reducing the pathlength of photons entering the solution because of the intense color of the dye concentration. Hence, fewer photons reached the nanocomposite surface [46]. Overall, the impact of these three parameters on BPB and RhB photodegradation was ranked as follows: irradiation time > catalyst dosage > dye concentration, in declining order. The cubic contour plots in Figure 7(id,iid) depict the cumulative influence of all variable factors on the percentage degradation of dye.

2.5.4. Process Optimization

The ideal conditions for the degradation of BPB and RhB were determined using optimization based on the desired function. The location that optimizes the desirability function was found using numerical optimization tools. To create desirability indices, the application employs five options as a goal: none, maximum, minimum, target, and within-range. Table 5 shows the criteria for all variables concerning the degradation percentage. The weight, also known as significance, highlights upper or lower boundaries or target values. Because a larger degradation yield is the primary goal of these investigations, an “importance” value of five was set as the maximum target. The best circumstances for the maximal BPB and RhB degradation efficiency (93.13% and 98.26%, respectively) were found to be a photocatalyst dose of 23.86 mg, an initial dye concentration of 35.34 mg L−1, and a reaction time of 66.26 min, based on the settings and bounds indicated.

2.5.5. Validation of Model

The designing of the model and the analysis of its strength in predicting the maximum percentage degradation of BPB and RhB dye was experimentally validated using the optimum conditions. As shown in Table 6, three repeat studies yielded maximum average degradations of 92.89% and 98.34% for BPB and RhB, respectively. The computed predicted and experimental values were in good agreement, further confirming the model’s validity for accomplishing the simulation of the photocatalytic degradation of BPB and RhB dyes. Moreover, when compared to systems described in the literature (Table 7), BPB and RhB dye degradation by synthesized ZC3 NPs demonstrated a significant photodegradation capability.

2.5.6. Kinetics and Reusability Study

The data generated experimentally were utilized to create a pseudo-first-order model to explore the photocatalytic reaction kinetics of BPB and RhB degradation by the catalyst in greater depth (Equation (10)) [52].
ln C t C o = ln A t A o = kt
where C o (or A o ) is the initial BPB and RhB concentration (or absorption), C t (or A t ) is the final BPB and RhB concentration (or absorption), and k denotes the rate constant. The investigation of the time-dependent alterations of BPB and RhB and the kinetics is shown in Figure 8a,b. As illustrated in Figure 8a, the slope of the plot ln A t / A o vs. reaction time was used to calculate the rate constant. As a result, the BPB and RhB rate constants were calculated as 0.0464 min−1 and 0.07091 min−1, in the specified manner. This indicates that the process of degradation follows Langmuir–Hinshelwood and pseudo-first-order kinetics.
To ensure the stability and reusability of the ZC3 nanocomposites, the photocatalytic degradation of BPB and RhB was repeated five times using the same photocatalyst (Figure 8b). At the end of each cycle, the centrifugation of the catalyst was carried out, followed by a water and ethanol wash. This was completed before the photocatalytic degradation of BPB and RhB. The outcomes revealed a modest drop in the degradation percentage upon completion of each cycle, which could be attributed to the loss of the ZC3-based nanocomposite, particularly at the stage of confining the processes involved in separation and washing. Hence, this finding emphasizes the characteristics of the ZC3 photocatalyst, with enhanced photostability, reusability, and potential for commercial applications.

2.5.7. Photocatalytic Mechanism

Photocatalytic processes have a wide range of uses, including hydrogen synthesis by water splitting, wastewater purification, the generation of charge for dye-sensitized solar cells, killing off bacteria-including pathogens, and heavy metal recovery. The photocatalysis of wastewater purification was based on the generation of electrons and holes in the presence of UV-visible light. These electron-and-hole photogenerations cause the induction of free radicals, which are extremely reactive species capable of breaking down the dye molecules and cleaning the water through chemical processes. The dye has a strong absorption peak of deionized water, but electrons and holes will break down the dye molecules after a photocatalytic process, resulting in a quick reduction in signal strength. Therefore, a reduction in the absorbent spectrum implies both photocatalytic activity and the purification of wastewater. The position of two bands (the conduction and valence bands) at zero charges for the two semiconductors is computed, and the following Equations (11) and (12) can be used [33,53].
E vb =   X E e + 0.5 E g  
E cb = E vb E g  
where E vb represents the valence band potential and X is the semiconductor electronegativity. The geometric mean of the electronegativity of the constituent atoms is used to calculate the electronegativity. CuO and ZnO have electronegativity values of 5.81 eV and 5.79 eV, respectively, according to the results [54]. E e is the energy of the free electrons with a magnitude on the hydrogen scale (~4.5 eV). The semiconductor bandgap energy is E g . The measured bandgap of 2.87 eV ZnO prevents the sample from decolorizing when exposed to pure ZnO under the visible light spectrum. The bandgap is highlighted in the visible range by the UV-vis area of electromagnetic radiation, which corresponds to the bandgap. Earlier studies noted a similar pattern of behavior [55]. The following equation, based on previous findings, explains the possible photocatalyst mechanism [27,47,56]
ZnO e + h + / CuO e + h + visible   light ZnO e + e / CuO h + + h +  
H + + OH H 2 O
h + + OH OH  
e + O 2 O 2
H 2 O + O 2 OOH + OH
2 OOH O 2 + H 2 O 2  
OH + O 2 + h vb + + pollutants degrade   pollutants  
OH + O 2 + h vb + + degrade   pollutants CO 2 + H 2 O  
When visible light is irradiated, the movement of electrons starts from the valence band of CuO (p-type) to the valence band of ZnO (n-type). Since the CuO work function is in line with that of ZnO (5.3 eV), this is conceivable. On the other hand, holes can be moved from a ZnO valance band that is more anodic to a cathodic valence band of CuO [36]. In comparison to ZnO, the nanocomposite (ZnO/CuO) materials also highlight a redshift in the absorption wavelength range, which might also help to increase photocatalytic performance. According to the UV-absorbance measurements, the ZnO/CuO nanocomposite exhibits enhanced photocatalytic activity. A schematic representation of the photocatalytic mechanism is shown in Figure 9. Moreover, the decrement in the photocatalytic activity pertaining to the greater concentration of CuO (ZC4 and ZC5) is mainly due to the presence of CuO, which enhances the rate of charge recombination. Similar behavior was also previously reported [42]. Simultaneously, a higher percentage of CuO samples (ZC4 and ZC5) have lower absorption values than the lower percentage of CuO (ZC1 and ZC2), thus implying an enhancement in the efficiency of the photocatalytic activity of the ZnO/CuO nanocomposite in the degradation (direct/indirect) of organic dyes within the range of visible light. Furthermore, it tends to suggest that hydroxyl radicals are involved of efficient photocatalytic degradation. The variation in degradation rates between two dyes can be attributed to structural and physiochemical factors such as molecule size [42,57]. Because the molecular size of BPB (669.96 g·mol−1) is substantially larger than that of RhB (479.02 g·mol−1), considerable exposure time is required for full decolorization. Repulsion between the negatively charged surface of the catalyst and the BPB molecules during the degradation process leads to less decolorization efficiency, whereas RhB dye has a cationic surface that has shown more degradation with ZnO/CuO nanocomposites under visible light irradiation [58]. The photosensitization of dye molecules can offer additional electrons to photocatalysts, which can then generate radicals such as O 2 which further indirectly turn into highly reactive hydroxide radicals (OH). Moreover, the holes in the valence band of CuO which can react with OH− ions form highly reactive hydroxyl radicals. Hydroxide radicals react strongly with oxidants and generate either photogenerated electrons or holes that finally oxidize the RhB and BPB molecules, or hydroxide radicals oxidize directly with RhB and BPB [59]. Organic contaminants can be decomposed rapidly and non-selectively by these reactive entities. Provided that the LUMO of the dyes is more negative than the CB of the photocatalysts, these photoexcited electrons can then transfer from the dye molecules to the photocatalysts, facilitating the generation of reactive species for the commencement of photodegradation [60].

3. Experimental Methods

3.1. Materials

In this experiment, ACS-grade copper (II) acetate monohydrate (Cu(CH3COO)2·H2O) (≥99%, Merck, New Delhi, India), zinc acetate dihydrate (Zn(CH3COO)2·2H2O) (≥99%, Merck, New Delhi, India), and sodium hydroxide pellets (≥95%, Merck, New Delhi, India) were used as received. Rhodamine B (RhB, C28H31ClN2O3) and bromophenol blue (BPB, C19H10Br4O5S) dye, procured from Thermo Fisher Scientific (New Delhi, India), were used as model organic contaminants, and their chemical structures are shown in Figure S1. Furthermore, to prepare the solutions, double distilled water (DD) was used throughout the experiment.

3.2. Preparation of ZnO/CuO Nanocomposite

The calculated amounts of zinc acetate and copper acetate solutions were mixed with varying w/w ratios, whereas NaOH (8N, 40 mL) was added under stirring until pH = 10. The reaction was continued at 80 °C for 3 h with constant stirring. The resulting precipitate was then filtered and washed several times with a 2:1 ethanol/water solution. This was completed to remove the impurities from the sample, which was then dried overnight in a hot air oven with the temperature set to 80 °C. Finally, the sample was ground into powder and calcined at 500 °C for 3 h. ZC1, ZC2, ZC3, ZC4, and ZC5 were the names for samples of varying proportions of zinc and copper, at 90:10, 70:30, 50:50, 30:70, and 10:90, respectively. Pure ZnO and CuO were also prepared under analogous conditions to those mentioned above using separate solutions, for comparing the photocatalytic efficiency against BPB and RhB dye.
The set of reactions that express the overall process is as follows:
Z n CH 3 COO 2 · 2 H 2 O + 2 NaOH Zn OH 2 + 2 CH 3 COONa + 2 H 2 O
Cu CH 3 COO 2 · H 2 O + 2 NaOH Cu OH 2 + 2 CH 3 COONa + H 2 O
Zn ( OH ) 2 + Cu ( OH ) 2 ZnO / CuO + 2 H 2 O  

3.3. Characterizations

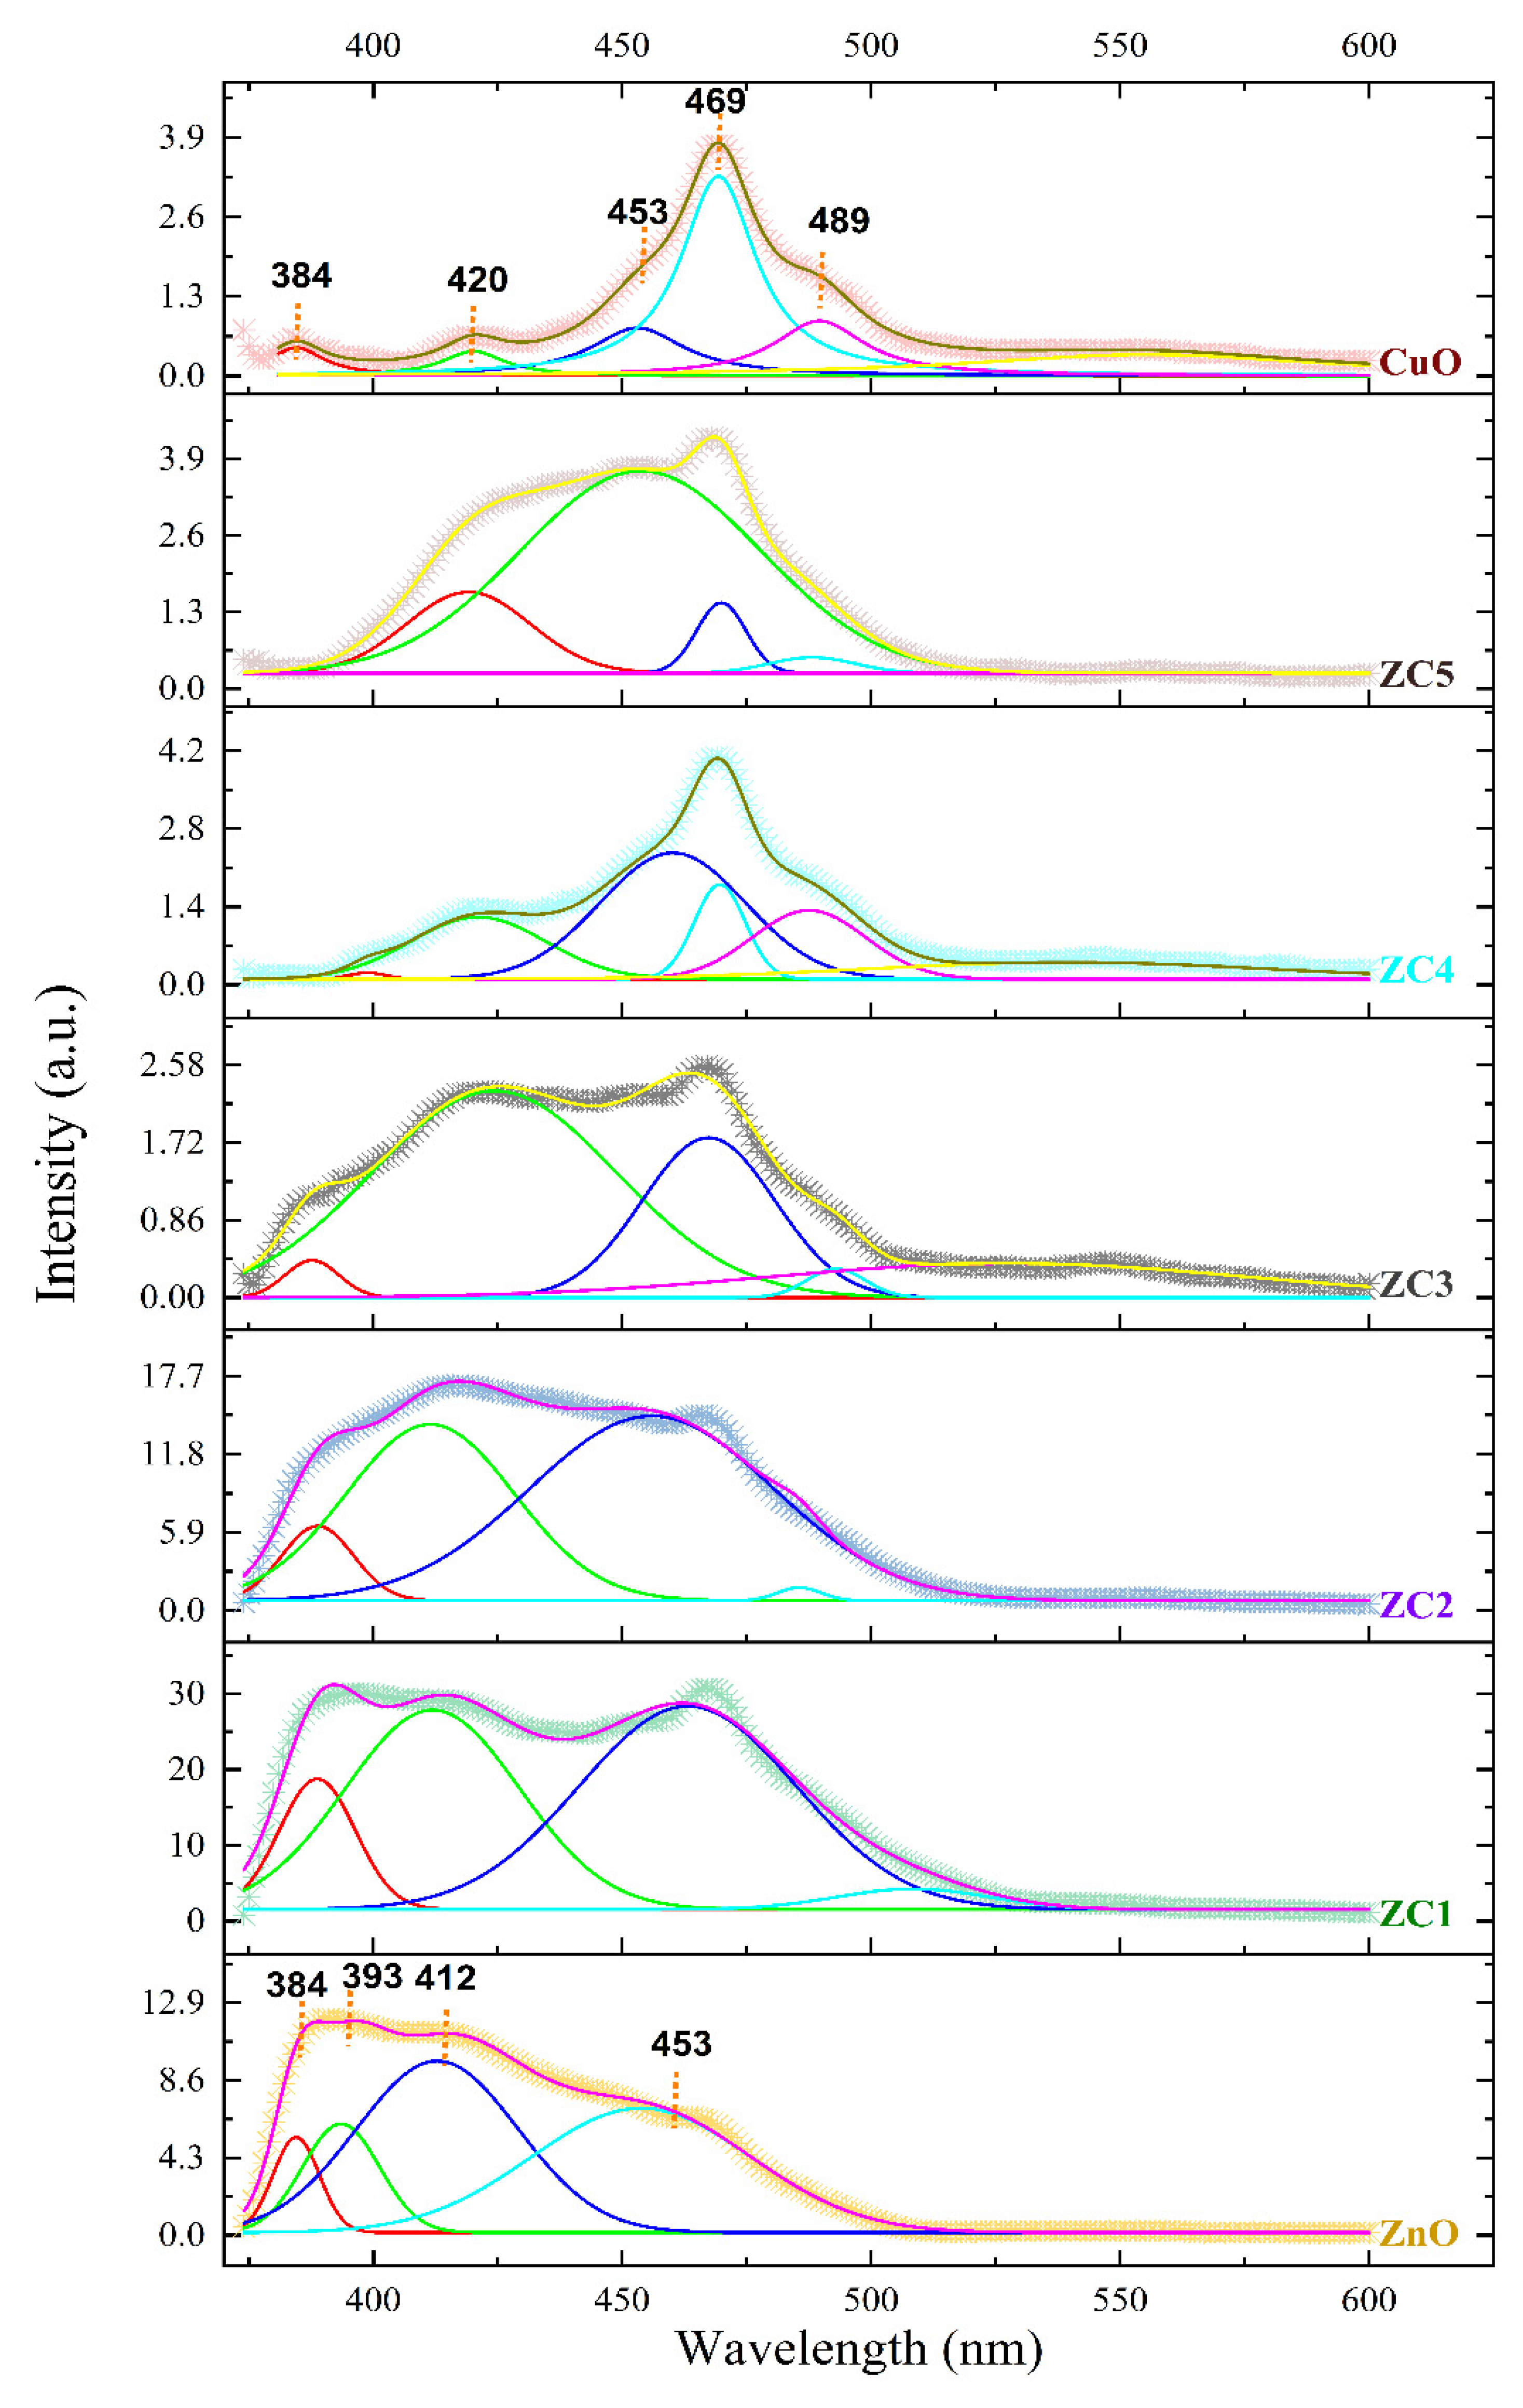
The structural properties and crystallinity of the synthesized nanomaterials were examined using an advanced powder X-ray diffractometer (XRD, Rigaku, Tokyo, Japan) under the operating conditions of 40 kV along with monochromator Cu Kα radiation (λ = 1.54 Å) and 2θ (degree) having a range from 20° to 80°. The surface morphology was analyzed using a Field emission scanning electron microscope (FE-SEM, Zeiss, Oberkochen, Germany, model number sigma 500 VP). The results for the functional group with the Fourier transform infrared (FT-IR, Perkin Elmer, Waltham, MA, USA) spectra were recorded using the sample pellets with KBr in a transmittance mode in the 400−4000 cm−1 wavenumber range. A Brunauer–Emmett-Teller (BET) surface area analyzer (Quanta Chrome Novae-2200, Boynton Beach, FL, USA), operated at 150 °C for 3 h, was used to determine the specific surface area and the pore size distribution. In relation to the optical properties, these were probed using a UV-vis spectrophotometer (double beam) from Hitachi, Tokyo, Japan, model-U3900, and a Raman spectrometer (LabRAM, HORIBA FRANCE SAS, Longjumeau, France, Model No. HR800, JY). All photocatalytic experiments were also performed using a UV-vis spectrophotometer (double beam) from Hitachi, Tokyo, Japan, model-U3900. The study of photoluminescence (PL) was carried out using a fluorescence spectrophotometer (Shimadzu, Kyoto, Japan RF-5000) at an excitation wavelength of 350 nm to determine the energy structure of nanoparticles.

3.4. Photocatalytic Experiment

Photocatalytic experiments of ZnO/CuO against RhB (cationic) and BPB (anionic) dyes were performed under visible light irradiation. A required catalytic quantity was added to a 50 mL dye solution at natural pH = 6.0 with known initial concentrations (RhB concentration of 10 mg L−1 and BPB concentration of 10 mg L−1). After the sonication of the suspension for 15 min, followed by the continuous stirring for the next 30 min in the dark, the adsorption-desorption equilibrium was established. Three-milliliter aliquots were extracted and centrifuged at predetermined time intervals of up to 90 min after exposing the sample to a visible light source (LED lamp Philips energy saver 40W, New Delhi, India) [28]. To measure the extent and progress of dye degradation, the absorbance was measured at λmax = 553 nm (RhB) and λmax = 591 nm (BPB) wavelengths of the supernatant, using a UV-vis spectrophotometer. All the experiments were performed at room temperature (27 °C ± 2 °C). The percentage of photocatalytic degradation efficiency (D) was calculated from the following Equation (21):
%   D = 1 C t C o × 100  
where C0 and Ct are the initial concentration of dye (mg L−1) and the concentration of dye (mg L−1) after time t (min), respectively [61]. Figure S1 shows the standard calibration curve for a known concentration of BPB and RhB dye, which was used for further calculations.

3.5. Experimental Design and Optimization Study

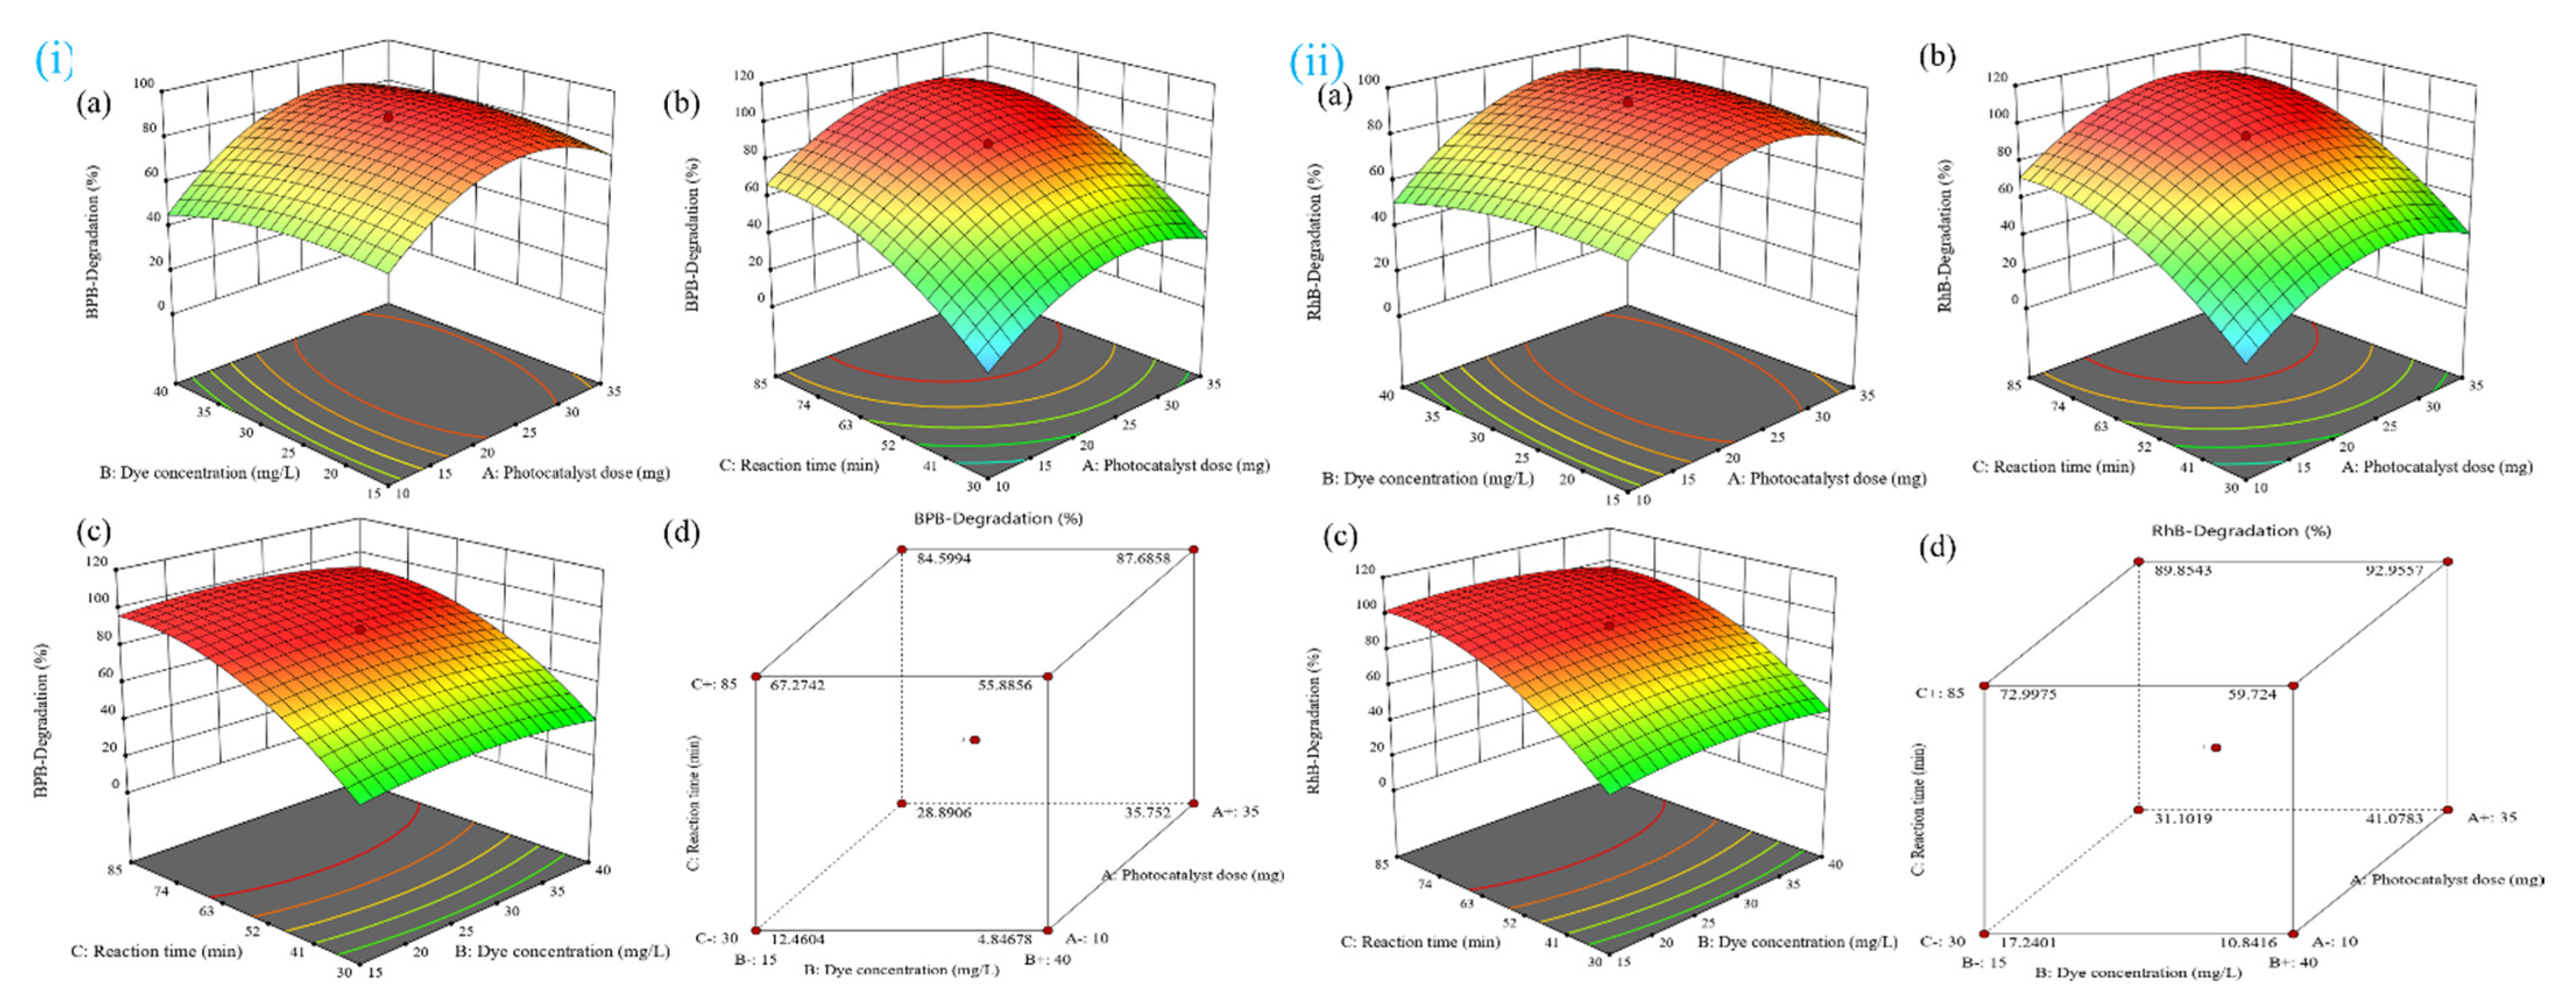
The optimization of the photodegradation process and the response surface modeling was performed utilizing the central composite experimental design (CCD) approach. Design-Expert 13.0.1.0 (State-Ease, Minneapolis, MN, USA) statistical software was used to analyze and interpret the experimental design. RSM was used to optimize three independent parameters, namely, the photocatalyst dose (A, mg), dye concentration (B, mg L−1), and reaction time (C, min) for the investigation. CCD was used for all the experiments. Table 8 lists the levels and their values, whereas Table S1 enumerates the responses confronting the 17 combinations with six components, eight factors, and three replicates at a central point. The parameters and their values were chosen based on the results of prior experiments [27,62,63]. To fit a second-order polynomial model with the experimental data, the multiple regression equation approach was adopted. The model used a second-order (quadratic) Equation (22), which is given below [3,64]:
Y = β 0 + j = 1 n β j X j + j = 1 n β jj X j 2 + j = 1 n 1 i = 1 n β ji X j X i  
where Y symbolizes the predicted response variable (Dye degradation, %); n denotes the number of analyzed factors; β 0 is the intercept; β j , β jj and β ji are the linear (main effect), quadratic and interactive model coefficients, respectively; and X j and X i pinpoint the level of the independent parameters being considered and analyzed.

3.6. Statistical Analysis

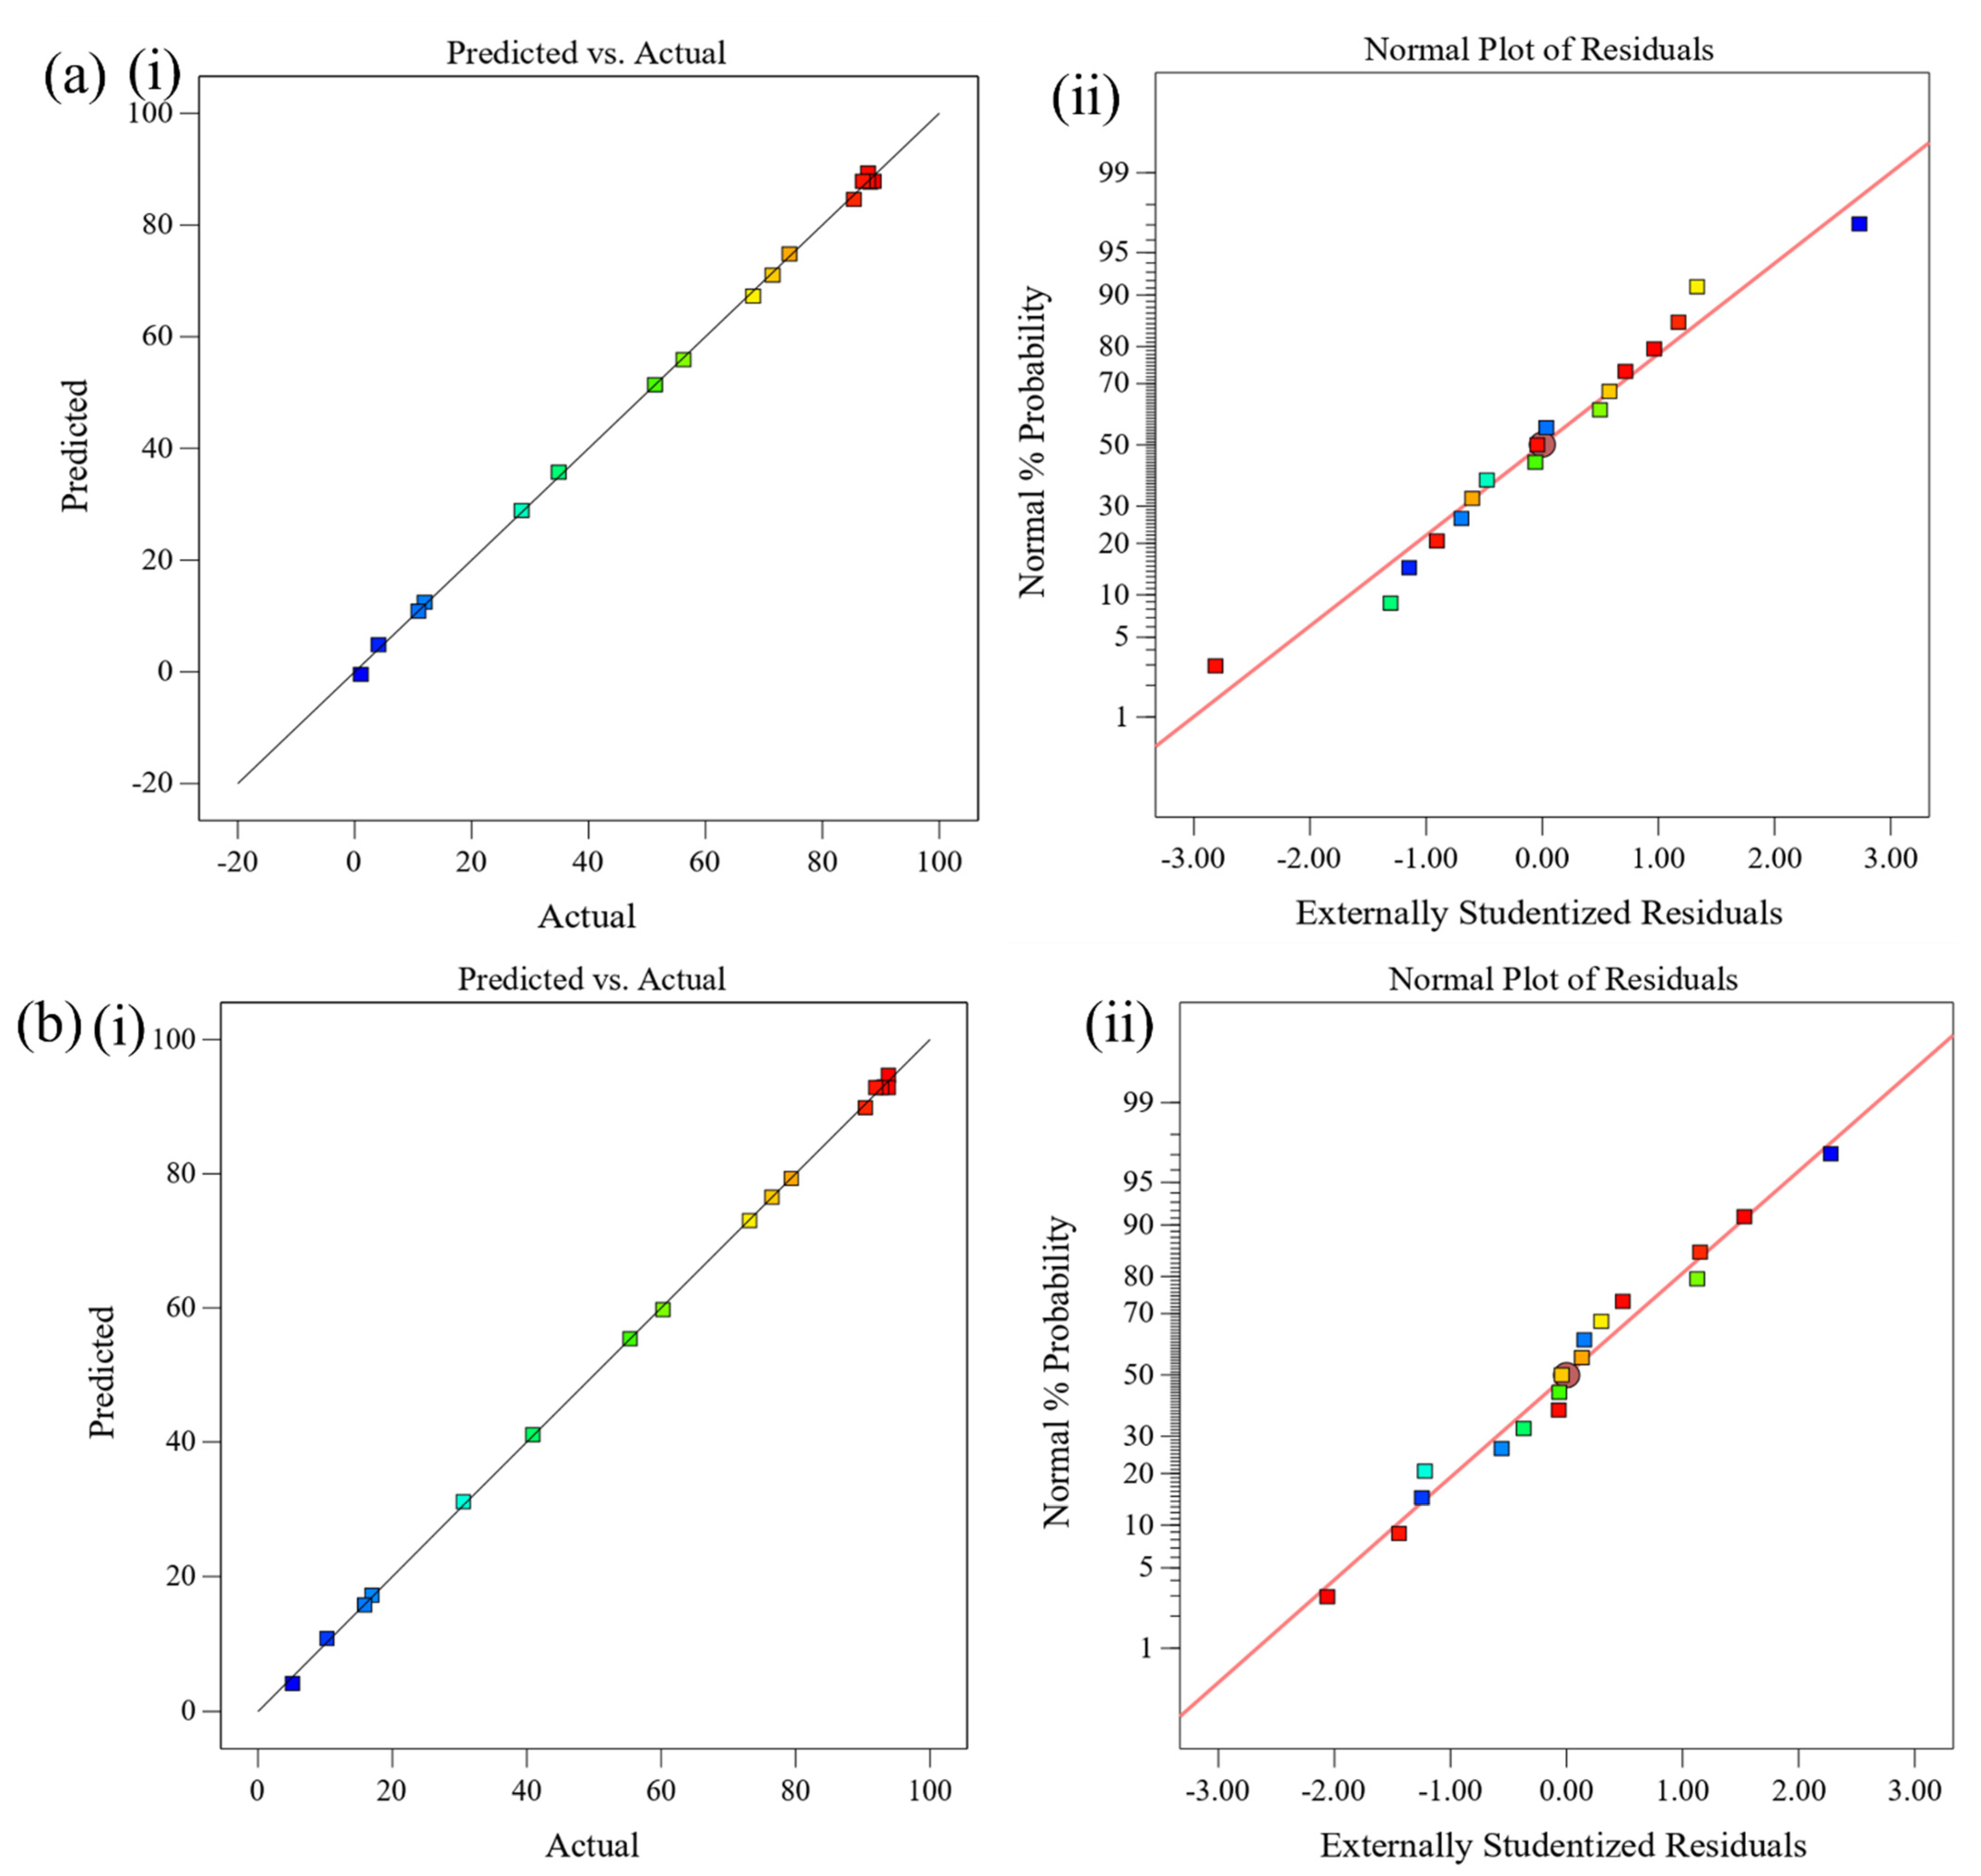
The experimental results were statistically assessed using Design-Expert Software (version 13.0.1.0, Minneapolis, MN, USA). The goodness of fit of the regression model was evaluated using the coefficients of determination (R2), the model’s F-value (Fischer variation ratio), and the probability value (prob > F), as well as analysis of variance (ANOVA). To better understand the optimal dye degradation conditions on response variables, Design Expert Software (version 13.0.1.0, Minneapolis, MN, USA) was used to construct three-dimensional response plots.

4. Conclusions

ZnO/CuO is a high-efficiency nanocomposite material that may be used to decolorize water pollutants. It aids our progress toward a greener environment. The nanocomposite (ZnO/CuO) was synthesized using a simple method, involving the co-precipitation technique. The size of all the nanoparticles in their crystalline form was determined using the Scherrer method and the W–H plot showed values of 15–31 nm and 31–54 nm, respectively. The strain obtained lies in the range 0.00144–0.00344. The FESEM investigation revealed that the ZnO/CuO nanocomposite exhibited a flake-like structure. According to the results of the obtained bandgap values in this study, Eg ranged between 1.52 and 2.87 eV. The FTIR spectrum emphasized the vibrational modes of ZnO, and CuO, whereas Raman spectroscopy was used to analyze purity, crystallinity, and local vibration. The lower recombination rate indicated by the PL intensity indicates that photogenerated electron-hole pairs undergo separation at the p–n hetero-junction. The as-prepared ZnO/CuO nanocomposite outperformed pure ZnO and CuO in photocatalytic degradation. After five cycles of application, the photocatalyst showed stable performance. A suggestion of a kinetic model of photocatalytic degradation over a heterogeneous catalyst based on a first-order reaction was corroborated with a rate constant of 0.0464 and 0.07091 min−1 for BPB and RhB, respectively. The experimental data and this model were statistically compatible. Furthermore, the present study exemplifies that the RSM based on CCD may be employed to model and optimize the degradation process of photocatalytic dyes effectively. The analysis of variance revealed excellent correlation coefficients (R2 = 0.9961 for BPB, 0.9984 for RhB, and Adj R2 = 0.9986 for BPB, 0.9993 for RhB), indicating that the regression model was adequately adjusted to the experimental data. The duration of irradiation was shown to have the most significant effect on BPB and RhB photodegradation, followed by photocatalyst loading, whereas the dye concentration tends to exhibit the least significant effect. Furthermore, the efficiency of the ZnO/CuO was observed to be 98% after irradiation lasting 60 min. The ZnO/CuO-based nanocomposite is a visible-light-driven active and stable catalyst that might be used to remediate dye contaminants in wastewater.

Supplementary Materials

The following are available online at https://www.mdpi.com/article/10.3390/catal11121509/s1, Figure S1: Structure of dye molecules and calibration curve of (a) BPB, (b) RhB. Figure S2: (a) N2 adsorption−desorption isotherm, (b) DA pore radius, and (c) BJH pore size distribution plots of the as-synthesized ZnO, CuO, and ZnO/CuO. Table S1: Central composite design (uncoded) for RhB and BPB degradation (%). Table S2: Optical bandgap of ZnO, CuO, and ZnO/CuO, FT-IR study.

Author Contributions

V.U.S.: conceptualization, methodology, formal analysis, investigation, writing—original draft preparation. A.A.: resources, writing—original draft preparation; M.T.A.: formal analysis, investigation. M.K.A.: formal analysis, investigation. W.A.S.: project administration, supervision. A.M.A.: funding acquisition, writing—review and editing. M.A.H.: funding acquisition, writing—review and editing. M.R.: funding acquisition and writing—review and editing. All authors have read and agreed to the published version of the manuscript.

Funding

This research was funded by Taif University Researchers Supporting Project number (TURSP-2020/244), Taif University, Taif, Saudi Arabia.

Institutional Review Board Statement

Not applicable.

Informed Consent Statement

Not applicable.

Acknowledgments

The authors are thankful to Taif University Researchers Supporting Project (TURSP-2020/244), Taif University, Taif, Saudi Arabia and Jamia Millia Islamia, New Delhi, for providing the sample preparation and characterization facility for carrying out the desired research work.

Conflicts of Interest

The authors declare no conflict of interest. The funders had no role in the design of the study; in the collection, analyses, or interpretation of data; in the writing of the manuscript, or in the decision to publish the results.

References

  1. Dhiman, N.; Markandeya; Singh, A.; Verma, N.K.; Ajaria, N.; Patnaik, S. Statistical optimization and artificial neural network modeling for acridine orange dye degradation using in-situ synthesized polymer capped ZnO nanoparticles. J. Colloid Interface Sci. 2017, 493, 295–306. [Google Scholar] [CrossRef] [PubMed]
  2. Chauhan, M.; Sharma, B.; Kumar, R.; Chaudhary, G.R.; Hassan, A.A.; Kumar, S. Green synthesis of CuO nanomaterials and their proficient use for organic waste removal and antimicrobial application. Environ. Res. 2019, 168, 85–95. [Google Scholar] [CrossRef] [PubMed]
  3. Dashamiri, S.; Ghaedi, M.; Asfaram, A.; Zare, F.; Wang, S. Multi-response optimization of ultrasound assisted competitive adsorption of dyes onto Cu (OH)2-nanoparticle loaded activated carbon: Central composite design. Ultrason. Sonochem. 2017, 34, 343–353. [Google Scholar] [CrossRef] [PubMed] [Green Version]
  4. Zhuang, J.; Dai, W.; Tian, Q.; Li, Z.; Xie, L.; Wang, J.; Liu, P.; Shi, X.; Wang, D. Photocatalytic Degradation of RhB over TiO2 Bilayer Films: Effect of Defects and Their Location. Langmuir 2010, 26, 9686–9694. [Google Scholar] [CrossRef]
  5. Hu, Q.; Xu, L.; Fu, K.; Zhu, F.; Yang, T.; Yang, T.; Luo, J.; Wu, M.; Yu, D. Ultrastable MOF-based foams for versatile applications. Nano Res. 2021, 6. [Google Scholar] [CrossRef]
  6. Chuaicham, C.; Karthikeyan, S.; Pawar, R.R.; Xiong, Y.; Dabo, I.; Ohtani, B.; Kim, Y.; Song, J.T.; Ishihara, T.; Sasaki, K. Energy-resolved distribution of electron traps for O/S-doped carbon nitrides by reversed double-beam photoacoustic spectroscopy and the photocatalytic reduction of Cr(vi). Chem. Commun. 2020, 56, 3793–3796. [Google Scholar] [CrossRef]
  7. Wang, H.; Su, Y.; Zhao, H.; Yu, H.; Chen, S.; Zhang, Y.; Quan, X. Photocatalytic Oxidation of Aqueous Ammonia Using Atomic Single Layer Graphitic-C 3 N 4. Environ. Sci. Technol. 2014, 48, 11984–11990. [Google Scholar] [CrossRef]
  8. Li, X.; Wang, B.; Huang, Y.; Di, J.; Xia, J.; Zhu, W.; Li, H. Boosting photocatalytic degradation of RhB via interfacial electronic effects between Fe-based ionic liquid and g-C3N4. Green Energy Environ. 2019, 4, 198–206. [Google Scholar] [CrossRef]
  9. Perreault, F.; Fonseca de Faria, A.; Elimelech, M. Environmental applications of graphene-based nanomaterials. Chem. Soc. Rev. 2015, 44, 5861–5896. [Google Scholar] [CrossRef]
  10. Sekar, K.; Chuaicham, C.; Balijapalli, U.; Li, W.; Wilson, K.; Lee, A.F.; Sasaki, K. Surfactant- and template-free hydrothermal assembly of Cu2O visible light photocatalysts for trimethoprim degradation. Appl. Catal. B Environ. 2021, 284, 119741. [Google Scholar] [CrossRef]
  11. Raha, S.; Mohanta, D.; Ahmaruzzaman, M. Novel CuO/Mn3O4/ZnO nanocomposite with superior photocatalytic activity for removal of Rabeprazole from water. Sci. Rep. 2021, 11, 15187. [Google Scholar] [CrossRef]
  12. Salehi, K.; Bahmani, A.; Shahmoradi, B.; Pordel, M.A.; Kohzadi, S.; Gong, Y.; Guo, H.; Shivaraju, H.P.; Rezaee, R.; Pawar, R.R.; et al. Response surface methodology (RSM) optimization approach for degradation of Direct Blue 71 dye using CuO–ZnO nanocomposite. Int. J. Environ. Sci. Technol. 2017, 14, 2067–2076. [Google Scholar] [CrossRef]
  13. Secula, M.S.; Suditu, G.D.; Poulios, I.; Cojocaru, C.; Cretescu, I. Response surface optimization of the photocatalytic decolorization of a simulated dyestuff effluent. Chem. Eng. J. 2008, 141, 18–26. [Google Scholar] [CrossRef]
  14. Sarrai, A.; Hanini, S.; Merzouk, N.; Tassalit, D.; Szabó, T.; Hernádi, K.; Nagy, L. Using Central Composite Experimental Design to Optimize the Degradation of Tylosin from Aqueous Solution by Photo-Fenton Reaction. Materials 2016, 9, 428. [Google Scholar] [CrossRef] [Green Version]
  15. Karimi Shamsabadi, M.; Behpour, M. Fabricated CuO–ZnO/nanozeolite X heterostructure with enhanced photocatalytic performance: Mechanism investigation and degradation pathway. Mater. Sci. Eng. B 2021, 269, 115170. [Google Scholar] [CrossRef]
  16. Chetia, T.R.; Ansari, M.S.; Qureshi, M. Ethyl Cellulose and Cetrimonium Bromide Assisted Synthesis of Mesoporous, Hexagon Shaped ZnO Nanodisks with Exposed ±{0001} Polar Facets for Enhanced Photovoltaic Performance in Quantum Dot Sensitized Solar Cells. ACS Appl. Mater. Interfaces 2015, 7, 13266–13279. [Google Scholar] [CrossRef]
  17. Siddiqui, V.U.; Ansari, A.; Khan, I.; Akram, M.K.; Siddiqi, W.A. Sol-gel synthesis of copper (II) oxide/alginate (CuO/Alg) bio-nanocomposite and effects of rapid thermal annealing on its properties and structure. Mater. Res. Express 2019, 6, 115095. [Google Scholar] [CrossRef]
  18. Mclaren, A.; Valdes-Solis, T.; Li, G.; Tsang, S.C. Shape and Size Effects of ZnO Nanocrystals on Photocatalytic Activity. J. Am. Chem. Soc. 2009, 131, 12540–12541. [Google Scholar] [CrossRef]
  19. Huang, M.; Yan, Y.; Feng, W.; Weng, S.; Zheng, Z.; Fu, X.; Liu, P. Controllable tuning various ratios of ZnO polar facets by crystal seed-assisted growth and their photocatalytic activity. Cryst. Growth Des. 2014, 14, 2179–2186. [Google Scholar] [CrossRef]
  20. Ansari, M.S.; Maragani, R.; Banik, A.; Misra, R.; Qureshi, M. Enhanced photovoltaic performance using biomass derived nano 3D ZnO hierarchical superstructures and a D−A type CS-Symmetric triphenylamine linked bisthiazole. Electrochim. Acta 2018, 259, 262–275. [Google Scholar] [CrossRef]
  21. Siddiqui, H.; Qureshi, M.S.S.; Haque, F.Z. Surfactant assisted wet chemical synthesis of copper oxide (CuO) nanostructures and their spectroscopic analysis. Optik 2016, 127, 2740–2747. [Google Scholar] [CrossRef]
  22. Sakib, A.A.M.; Masum, S.M.; Hoinkis, J.; Islam, R.; Molla, M.A.I. Synthesis of cuo/zno nanocomposites and their application in photodegradation of toxic textile dye. J. Compos. Sci. 2019, 3, 91. [Google Scholar] [CrossRef] [Green Version]
  23. Udayabhaskar, R.; Karthikeyan, B. Optical and phonon properties of ZnO:CuO mixed nanocomposite. J. Appl. Phys. 2014, 115, 154303. [Google Scholar] [CrossRef]
  24. Qamar, M.T.; Aslam, M.; Ismail, I.M.I.; Salah, N.; Hameed, A. Synthesis, Characterization, and Sunlight Mediated Photocatalytic Activity of CuO Coated ZnO for the Removal of Nitrophenols. ACS Appl. Mater. Interfaces 2015, 7, 8757–8769. [Google Scholar] [CrossRef]
  25. Li, B.; Wang, Y. Facile synthesis and photocatalytic activity of ZnO–CuO nanocomposite. Superlattices Microstruct. 2010, 47, 615–623. [Google Scholar] [CrossRef]
  26. Lavín, A.; Sivasamy, R.; Mosquera, E.; Morel, M.J. High proportion ZnO/CuO nanocomposites: Synthesis, structural and optical properties, and their photocatalytic behavior. Surf. Interfaces 2019, 17, 100367. [Google Scholar] [CrossRef]
  27. Taufique, M.F.N.; Haque, A.; Karnati, P.; Ghosh, K. ZnO–CuO Nanocomposites with Improved Photocatalytic Activity for Environmental and Energy Applications. J. Electron. Mater. 2018, 47, 6731–6745. [Google Scholar] [CrossRef]
  28. Selvaraj, S.; Mohan, M.K.; Navaneethan, M.; Ponnusamy, S.; Muthamizhchelvan, C. Synthesis and photocatalytic activity of Gd doped ZnO nanoparticles for enhanced degradation of methylene blue under visible light. Mater. Sci. Semicond. Process. 2019, 103, 104622. [Google Scholar] [CrossRef]
  29. Elemike, E.E.; Onwudiwe, D.C.; Singh, M. Eco-friendly Synthesis of Copper Oxide, Zinc Oxide and Copper Oxide–Zinc Oxide Nanocomposites, and Their Anticancer Applications. J. Inorg. Organomet. Polym. Mater. 2020, 30, 400–409. [Google Scholar] [CrossRef]
  30. Yatskiv, R.; Grym, J. Luminescence properties of hydrothermally grown ZnO nanorods. Superlattices Microstruct. 2016, 99, 214–220. [Google Scholar] [CrossRef]
  31. Vuong, N.M.; Chinh, N.D.; Huy, B.T.; Lee, Y.-I. CuO-Decorated ZnO Hierarchical Nanostructures as Efficient and Established Sensing Materials for H2S Gas Sensors. Sci. Rep. 2016, 6, 26736. [Google Scholar] [CrossRef] [PubMed] [Green Version]
  32. Siva, N.; Sakthi, D.; Ragupathy, S.; Arun, V.; Kannadasan, N. Synthesis, structural, optical and photocatalytic behavior of Sn doped ZnO nanoparticles. Mater. Sci. Eng. B 2020, 253, 114497. [Google Scholar] [CrossRef]
  33. Minh, T.T.; Tu, N.T.T.; Van Thi, T.T.; Hoa, L.T.; Long, H.T.; Phong, N.H.; Pham, T.L.M.; Khieu, D.Q. Synthesis of Porous Octahedral ZnO/CuO Composites from Zn/Cu-Based MOF-199 and Their Applications in Visible-Light-Driven Photocatalytic Degradation of Dyes. J. Nanomater. 2019, 2019, 5198045. [Google Scholar] [CrossRef] [Green Version]
  34. Muzakki, A.; Shabrany, H.; Saleh, R. Synthesis of ZnO/CuO and TiO2/CuO nanocomposites for light and ultrasound assisted degradation of a textile dye in aqueous solution. Am. Inst. Phys. 2016, 1725, 020051. [Google Scholar]
  35. Cahino, A.M.; Loureiro, R.G.; Dantas, J.; Madeira, V.S.; Ribeiro Fernandes, P.C. Characterization and evaluation of ZnO/CuO catalyst in the degradation of methylene blue using solar radiation. Ceram. Int. 2019, 45, 13628–13636. [Google Scholar] [CrossRef]
  36. Saravanan, R.; Karthikeyan, S.; Gupta, V.K.; Sekaran, G.; Narayanan, V.; Stephen, A. Enhanced photocatalytic activity of ZnO/CuO nanocomposite for the degradation of textile dye on visible light illumination. Mater. Sci. Eng. C 2013, 33, 91–98. [Google Scholar] [CrossRef]
  37. Lee, J.E.; Lim, C.K.; Park, H.J.; Song, H.; Choi, S.-Y.; Lee, D.-S. ZnO–CuO Core-Hollow Cube Nanostructures for Highly Sensitive Acetone Gas Sensors at the ppb Level. ACS Appl. Mater. Interfaces 2020, 12, 35688–35697. [Google Scholar] [CrossRef]
  38. Zhu, L.; Li, H.; Liu, Z.; Xia, P.; Xie, Y.; Xiong, D. Synthesis of the 0D/3D CuO/ZnO Heterojunction with Enhanced Photocatalytic Activity. J. Phys. Chem. C 2018, 122, 9531–9539. [Google Scholar] [CrossRef]
  39. Panda, S.K.; Jacob, C. Surface enhanced Raman scattering and photoluminescence properties of catalytic grown ZnO nanostructures. Appl. Phys. A 2009, 96, 805–811. [Google Scholar] [CrossRef]
  40. Mosquera, E.; Rojas-Michea, C.; Morel, M.; Gracia, F.; Fuenzalida, V.; Zárate, R.A. Zinc oxide nanoparticles with incorporated silver: Structural, morphological, optical and vibrational properties. Appl. Surf. Sci. 2015, 347, 561–568. [Google Scholar] [CrossRef]
  41. Kumar, B.; Gong, H.; Chow, S.Y.; Tripathy, S.; Hua, Y. Photoluminescence and multiphonon resonant Raman scattering in low-temperature grown ZnO nanostructures. Appl. Phys. Lett. 2006, 89, 071922. [Google Scholar] [CrossRef]
  42. Mageshwari, K.; Nataraj, D.; Pal, T.; Sathyamoorthy, R.; Park, J. Improved photocatalytic activity of ZnO coupled CuO nanocomposites synthesized by reflux condensation method. J. Alloys Compd. 2015, 625, 362–370. [Google Scholar] [CrossRef]
  43. Mortazavian, S.; Saber, A.; James, D.E. Optimization of Photocatalytic Degradation of Acid Blue 113 and Acid Red 88 Textile Dyes in a UV-C/TiO2 Suspension System: Application of Response Surface Methodology (RSM). Catalysts 2019, 9, 360. [Google Scholar] [CrossRef] [Green Version]
  44. Dhawane, S.H.; Kumar, T.; Halder, G. Central composite design approach towards optimization of flamboyant pods derived steam activated carbon for its use as heterogeneous catalyst in transesterification of Hevea brasiliensis oil. Energy Convers. Manag. 2015, 100, 277–287. [Google Scholar] [CrossRef]
  45. Sun, J.; Qiao, L.; Sun, S.; Wang, G. Photocatalytic degradation of Orange G on nitrogen-doped TiO2 catalysts under visible light and sunlight irradiation. J. Hazard. Mater. 2008, 155, 312–319. [Google Scholar] [CrossRef]
  46. Akpan, U.G.; Hameed, B.H. Parameters affecting the photocatalytic degradation of dyes using TiO2-based photocatalysts: A review. J. Hazard. Mater. 2009, 170, 520–529. [Google Scholar] [CrossRef]
  47. Kumaresan, N.; Sinthiya, M.M.A.; Ramamurthi, K.; Ramesh Babu, R.; Sethuraman, K. Visible light driven photocatalytic activity of ZnO/CuO nanocomposites coupled with rGO heterostructures synthesized by solid-state method for RhB dye degradation. Arab. J. Chem. 2020, 13, 3910–3928. [Google Scholar] [CrossRef]
  48. Ma, J.; Wang, K.; Li, L.; Zhang, T.; Kong, Y.; Komarneni, S. Visible-light photocatalytic decolorization of Orange II on Cu2O/ZnO nanocomposites. Ceram. Int. 2015, 41, 2050–2056. [Google Scholar] [CrossRef]
  49. Gaim, Y.T.; Tesfamariam, G.M.; Nigussie, G.Y.; Ashebir, M.E. Synthesis, Characterization and Photocatalytic Activity of N-doped Cu2O/ZnO Nanocomposite on Degradation of Methyl Red. J. Compos. Sci. 2019, 3, 93. [Google Scholar] [CrossRef] [Green Version]
  50. Wang, X.; Zhang, Y.; Wang, Q.; Dong, B.; Wang, Y.; Feng, W. Photocatalytic activity of Cu2O/ZnO nanocomposite for the decomposition of methyl orange under visible light irradiation. Sci. Eng. Compos. Mater. 2019, 26, 104–113. [Google Scholar] [CrossRef]
  51. Taufik, A.; Albert, A.; Saleh, R. Sol-gel synthesis of ternary CuO/TiO2/ZnO nanocomposites for enhanced photocatalytic performance under UV and visible light irradiation. J. Photochem. Photobiol. A Chem. 2017, 344, 149–162. [Google Scholar] [CrossRef]
  52. Koh, P.W.; Yuliati, L.; Lee, S.L. Kinetics and Optimization Studies of Photocatalytic Degradation of Methylene Blue over Cr-Doped TiO2 using Response Surface Methodology. Iran. J. Sci. Technol. Trans. A Sci. 2019, 43, 95–103. [Google Scholar] [CrossRef]
  53. Mahendiran, M.; Mathen, J.J.; Racik, K.M.; Madhavan, J.; Raj, M.V.A. Facile synthesis of n-ZnO @ p-CuO nanocomposite for water purification enhanced decolorization of methyl orange. J. Mater. Sci. Mater. Electron. 2019, 30, 16099–16109. [Google Scholar] [CrossRef]
  54. Albadarin, N.A.; Takriff, M.S.; Tan, S.T.; Shahahmadi, S.A.; Minggu, L.J.; Kadhum, A.A.H.; Yin, W.W.; Salehmin, M.N.I.; Alkhalqi, E.M.; Hamid, M.A.A.; et al. Tunable morphology and band gap alteration of CuO-ZnO nanostructures based photocathode for solar photoelectrochemical cells. Mater. Res. Express 2020, 7, 125010. [Google Scholar] [CrossRef]
  55. Sherly, E.D.; Vijaya, J.J.; Kennedy, L.J. Visible-light-induced photocatalytic performances of ZnO–CuO nanocomposites for degradation of 2,4-dichlorophenol. Chin. J. Catal. 2015, 36, 1263–1272. [Google Scholar] [CrossRef]
  56. Sathishkumar, P.; Sweena, R.; Wu, J.J.; Anandan, S. Synthesis of CuO-ZnO nanophotocatalyst for visible light assisted degradation of a textile dye in aqueous solution. Chem. Eng. J. 2011, 171, 136–140. [Google Scholar] [CrossRef]
  57. Pang, Y.L.; Abdullah, A.Z. Comparative study on the process behavior and reaction kinetics in sonocatalytic degradation of organic dyes by powder and nanotubes TiO2. Ultrason. Sonochem. 2012, 19, 642–651. [Google Scholar] [CrossRef]
  58. Nezamzadeh-Ejhieh, A.; Zabihi-Mobarakeh, H. Heterogeneous photodecolorization of mixture of methylene blue and bromophenol blue using CuO-nano-clinoptilolite. J. Ind. Eng. Chem. 2014, 20, 1421–1431. [Google Scholar] [CrossRef]
  59. Truong, T.T.; Pham, T.T.; Truong, T.T.T.; Pham, T.D. Synthesis, characterization of novel ZnO/CuO nanoparticles, and the applications in photocatalytic performance for rhodamine B dye degradation. Environ. Sci. Pollut. Res. 2021. [Google Scholar] [CrossRef]
  60. Chiu, Y.H.; Chang, T.F.M.; Chen, C.Y.; Sone, M.; Hsu, Y.J. Mechanistic insights into photodegradation of organic dyes using heterostructure photocatalysts. Catalysts 2019, 9, 430. [Google Scholar] [CrossRef] [Green Version]
  61. Merci, S.; Saljooqi, A.; Shamspur, T.; Mostafavi, A. WO3 nanoplates decorated with polyaniline and CdS nanoparticles as a new photocatalyst for degradation of imidacloprid pesticide from water. Environ. Sci. Pollut. Res. 2021, 28, 35764–35776. [Google Scholar] [CrossRef] [PubMed]
  62. Kumar, C.R.; Betageri, V.S.; Nagaraju, G.; Pujar, G.H.; Onkarappa, H.S.; Latha, M.S. One-pot green synthesis of ZnO–CuO nanocomposite and their enhanced photocatalytic and antibacterial activity. Adv. Nat. Sci. Nanosci. Nanotechnol. 2020, 11, 015009. [Google Scholar] [CrossRef]
  63. Sharma, M.; Poddar, M.; Gupta, Y.; Nigam, S.; Avasthi, D.K.; Adelung, R.; Abolhassani, R.; Fiutowski, J.; Joshi, M.; Mishra, Y.K. Solar light assisted degradation of dyes and adsorption of heavy metal ions from water by CuO–ZnO tetrapodal hybrid nanocomposite. Mater. Today Chem. 2020, 17, 100336. [Google Scholar] [CrossRef]
  64. Momina; Rafatullah, M.; Ismail, S.; Ahmad, A. Optimization Study for the Desorption of Methylene Blue Dye from Clay Based Adsorbent Coating. Water 2019, 11, 1304. [Google Scholar] [CrossRef] [Green Version]
Figure 1. (i) (a) XRD and (b) W-H plot of ZnO, CuO, and ZnO/CuO; (ii) FESEM micrograph of (a) ZnO, (b) ZC1, (c) ZC2, (d) ZC3, (e) ZC4, (f) ZC5, and (g) CuO nanoparticles.
Catalysts 11 01509 g001
Figure 2. (i) FT-IR micrograph of ZnO, ZnO/CuO, and CuO nanoparticles. (ii) (a) UV-vis spectra of absorbance vs. wavelength and (b) Tauc plot of ZnO, CuO, and ZnO/CuO.
Catalysts 11 01509 g002
Figure 3. Photoluminescence (PL) spectra of ZnO, CuO, and ZnO/CuO nanoparticles.
Catalysts 11 01509 g003
Figure 4. Raman spectra for (a) ZnO, (b) CuO, and (c) ZC3 nanoparticles.
Catalysts 11 01509 g004
Figure 5. Photocatalytic degradation of BPB and RhB over ZnO, CuO, and ZnO/CuO (dye concentration = 10 mg L−1, catalyst dose = 20 mg, irradiation time = 30 min).
Catalysts 11 01509 g005
Figure 6. (a) (i) Predicted vs. actual (ii) normal probability plot values for the photodegradation of BPB and (b) (i) predicted vs. actual (ii) normal probability plot values for the photodegradation of RhB.
Catalysts 11 01509 g006
Figure 7. (i) 3D response surface plots for BPB of the effects of (a) initial dye concentration and NP dose; (b) contact time and NP dose; (c) initial dye concentration, contact time, and coded response; (d) cumulative effect of all variable parameters. (ii) 3D response surface plots for RhB of the effects of (a) initial dye concentration and NP dose; (b) contact time and NP dose; (c) initial dye concentration, contact time, and coded response; (d) cumulative effect of all variable parameters.
Catalysts 11 01509 g007
Figure 8. (a) Kinetics and (b) recyclability plot for the photocatalytic degradation efficiency of BPB and RhB using the ZC3 nanocomposite.
Catalysts 11 01509 g008
Figure 9. Schematic representation of the photocatalytic degradation of BPB and RhB over the ZnO/CuO nanocomposite.
Catalysts 11 01509 g009
Table 1. Comparison of crystallite size, lattice strain, and dislocation density of ZnO, CuO, and ZnO/CuO nanoparticles.
SamplesAverage Crystallite Size D (nm)Dislocation Density (δ) Lines per m2 × 1015
Scherrer’s Method (D)Williamson-Hall Analysis
DMicrostrain (ε)
ZnO31.9554.440.001440.98
ZC121.1349.260.002252.24
ZC216.5237.130.002943.66
ZC321.0849.430.002322.25
ZC416.3843.620.003433.73
ZC515.0632.330.002994.41
CuO19.8750.110.002442.53
Table 2. Specific surface area and pore properties for the ZnO, CuO, and ZnO/CuO nanoparticles.
SamplesSurface Area (m2·g−1)Pore Radius (Å)Pore Volume (cm3·g−1)
ZnO32.8915.100.3198
ZC383.1313.600.8213
CuO40.2914.000.3981
Table 3. ANOVA for the photodegradation of BPB dye.
SourceSum of SquaredfMean SquareF-Valuep-ValueRemark
Model17,571.6791952.4081344.425<0.001Significant
A-Photocatalyst dose1985.51411985.5141367.221<0.001
B-Dye concentration17.49385117.4938512.046240.0104
C-Reaction time9726.28719726.2876697.504<0.0001
AB104.76281104.762872.13949<0.0001
AC0.40051310.4005130.2757920.6157
BC7.12531317.1253134.9064780.0623
4531.26914531.2693120.224<0.0001
312.88341312.8834215.4509<0.0001
2654.36212654.3621827.789<0.0001
Residual10.1655871.452226
Lack of Fit8.43251251.6865021.9462640.373296Not significant
Pure Error1.73306720.866533
Cor Total17581.8416
df degree of freedom; R2 = 0.9994; Pred R2 = 0.9961; Adj R2 = 0.9986.
Table 4. ANOVA for photodegradation of RhB dye.
SourceSum of SquaredfMean SquareF-Valuep-ValueRemark
Model17758.891973.22873.011<0.0001Significant
A-Photocatalyst dose1893.00711893.0072756.248<0.0001
B-Dye concentration9.27844119.27844113.509560.0079
C-Reaction time9888.6319888.6314398<0.0001
AB134.07031134.0703195.2085<0.0001
AC4.48501214.4850126.530250.0378
BC23.63281123.6328134.409760.0006
4617.84614617.8466723.658<0.0001
314.53011314.5301457.9609<0.0001
2654.2612654.263864.645<0.0001
Residual4.80763970.686806
Lack of Fit3.07457350.6149150.7096260.672936Not significant
Pure Error1.73306720.866533
Cor Total17763.6116
df degree of freedom; R2 = 0.9997; Pred R2 = 0.9984; Adj R2 = 0.9993.
Table 5. Optimization of the individual responses (di) to find the overall desirability response (D).
NameGoalLowerUpperLowerUpperImportance
A: Photocatalyst doseis in range1035113
B: Dye concentrationis in range1540113
C: Reaction timeis in range3085113
RhB-Degradationmaximize5.1293.81115
BPB-Degradationmaximize1.0488.79115
Table 6. Optimum values of the process parameters for constraint conditions and their experimental values.
FactorsOptimum ValueBPB Degradation (%)RhB Degradation (%)
PredictiveExperimentalPredictiveExperimental
A: Photocatalyst dose23.8693.1392.8998.2698.34
B: Dye concentration35.34
C: Reaction time66.26
Table 7. Comparison of maximum dye degradation percentages of various nanoparticles.
CatalystDyesLight SourceVariablesTime (min)Degradation (%)References
(ZnO/CuO)/rGO ternary nanocompositesRhBVisibleDose = 100 mg, Dye conc. = 5 ppm, pH = 1120 min99%[47]
Cu2O/ZnO nanocompositesOrange II (OII)VisibleDose = 200 mg L−1, Dye conc. = 50 mg L−1 pH = 6.4120 min79.26%[48]
N-doped Cu2O/ZnO nanocompositeMethyl redVisibleDose = 180 mg L−1, Dye Conc.= 60 mg L−1180 min93.50%[49]
CuO/ZnO nanocompositesMBVisibleDose = 20 mg, Dye conc. = 10 mg L−1120 min98%[22]
5% CuO loaded on ZnOMB & MOVisibleDose = 500 mg, Vol. = 500 mL, Dye conc. = 3 × 10⁻⁵ moles L−1120 min97.2% and 87.7%[36]
ZnO-CuO nanocompositeRhBVisibleDose = 30 mg, Vol. = 100 mL, Dye conc. = 5 × 10⁻⁵ M120 min~100%[25]
Cu2O/ZnOMOVisibleDose = 0.1 g, Vol. = 100 mL, Dye conc. = 100 mg L−1, pH = 3.8240 min98%[50]
CuO/TiO2/ZnO (0.5:1:1)MBUV and VisibleDose = 0.3 gL−1, Vol. = 100 mL, Dye conc. = 20 mg L−1,120 min100% and 98%[51]
ZnO-CuO (76%+24%)MBUV with Visible (sunlight)Dose = 1 mg, Vol. = 8 mL, Dye conc. = 7.5mg L−1300 min89%[27]
ZnO/CuOBPB and RhBVisible lightDose = 23 mg, Vol. = 50 mL, Dye conc. = 35 mg L−1, pH = 666 min92.89% and 98.34%This study
Table 8. Independent variables and their corresponding levels for the experimental design.
Independent VariableFactorsCoded Levels
−α−101
Photocatalyst dose (mg)A1.4810.0022.5035.0043.52
Dye concentration (mg L−1)B6.4815.0027.5040.0048.52
Reaction time (min)C11.2230.0057.5085.00103.75
Publisher’s Note: MDPI stays neutral with regard to jurisdictional claims in published maps and institutional affiliations.

