Article

Effect of Metal Sequestrants on the Decomposition of Hydroxylammonium Nitrate

by
Emil J. Broemmelsiek
1,
Joshua L. Rovey
1,* and
Steven P. Berg
2
1
Department of Aerospace Engineering, University of Illinois at Urbana-Champaign, Urbana, IL 61801, USA
2
Froberg Aerospace, LLC, Wilmington, NC 28401, USA
*
Author to whom correspondence should be addressed.
Catalysts 2021, 11(12), 1488; https://doi.org/10.3390/catal11121488
Submission received: 7 October 2021 / Revised: 19 November 2021 / Accepted: 29 November 2021 / Published: 4 December 2021

Abstract

:
Hydroxylammonium nitrate (HAN) is an energetic salt used in flight-proven green monopropellants such as ASCENT (formerly AF-M315E), flown in NASA’s 2019 Green Propellant Infusion Mission, and SHP163, flown in JAXA’s Rapid Innovative Satellite Technology Demonstration-1. The decomposition of HAN is catalyzed by metals commonly found in storage tanks, a factor limiting its use. This work investigates the ability of metal-sequestering chelating agents to inhibit the decomposition of HAN. Isothermal and dynamic thermogravimetric analysis (TGA) were used to find isothermal decomposition rates, decomposition onset temperatures, and first-order Arrhenius reaction rate parameters. In the present research, 2,2′-bipyridine (Bipy), triethanolamine (TEA), and ethylenediaminetetraacetic acid (EDTA) were studied as 0.05, 0.1, 0.5, 1, and 5% by weight additives in 90% aqueous HAN. An isothermal decomposition rate of 0.137%/h at 348 K was observed for HAN. The addition of 1% Bipy and 1% TEA reduced the isothermal decomposition rate by 20.4% to 0.109%/h, and by 3.65% to 0.132%/h, respectively, showing that Bipy can inhibit decomposition. The addition of 1% EDTA increased the isothermal decomposition rate by 12.4% to 0.154%/h. Bipy was found to increase the decomposition onset temperature from 454.8 K to 461.8 K, while the results for TEA and EDTA were inconclusive. First order reaction rates calculated by the Ozawa-Flynn-Wall method were found to be insufficient to capture the effects of the tested additives. Bipy was found to inhibit the decomposition of HAN, while TEA and EDTA produced little or negative effect, a result believed to be due to poor metal complex stability at low pH and high acidity, respectively. Spectrophotometry, used for colorimetric analysis of Bipy+iron complexes, showed that Bipy forms chelate complexes with trace iron impurities when added to HAN solutions.

1. Introduction

Hydroxylammonium nitrate (HAN) based propellants have recently been flight-tested on multiple spacecraft [1,2], and have been the subject of research for decades due to an array of useful properties, including but not limited to high density, high specific impulse, low freezing point, and low toxicity [3,4,5,6,7,8,9,10,11]. The low decomposition temperature and ready catalysis of HAN have led energetic materials researchers to study its decomposition mechanism [12,13,14,15,16]. Catalytic decomposition and compatibility studies have found that transition metals have catalytic effects on low-temperature decomposition [3,17]. This includes common elements like iron that can elute from metallic storage containers.
While catalyzing decomposition is desirable in a combustion chamber, it is not desirable in a storage tank. Tank materials can be changed; however, the current state of the art procedure for synthesizing HAN results in part-per-million concentrations of metal impurities that still have a catalytic effect [12]. Sequestering metal ions in metal complexes reduces their catalytic activity [18,19], which can inhibit the decomposition rate of propellants. Chelating agents are used for their metal-binding ability in a variety of applications including chemical manufacturing, food, medicine, cosmetics, and more [20,21,22,23,24]. Chelating agents are ligand molecules capable of forming stable, multidentate chelate complexes with metal ions, effectively sequestering the ion from reacting further [20]. One such molecule, N,N’-disalicylidene-1,2-propanediamine, is known as Metal Deactivator Additive (MDA), and has been studied for use as a stabilizing additive in aviation fuels [18,25]. MDA is not used in this study because it is soluble in nonpolar oils and solvents (e.g., hydrocarbon fuels), but not in water.
HAN is a salt with chemical formula [ NH 3 OH ][ NO 3 ] that separates into hydroxylammonium ( NH 3 OH + ) and nitrate ( NO 3 ) ions in solution according to Equation (1):
HAN NH 3 OH + + NO 3
The proton transfer between these two molecules, according to Equations (2) and (3), controls the concentration of H + in HAN solution, and thereby, the pH of the solution:
HNO 3 NO 3 + H +
NH 3 OH + NH 2 OH + H +
HAN has a low pH because HNO 3 is a strong acid and NH 2 OH is not a strong base. The proton transfer mechanism was found to be the most sensitive mechanism affecting the decomposition of HAN. Experiments done by Zhang found that adding HNO 3 until the concentration of H + was quintupled increased the overall decomposition rate by roughly 50 times, while reducing the concentration of H + by adding NH 2 OH reduced the overall rate of decomposition [6]. Excess H + available in solution allows for the accumulation of additional NH 3 OH + and NO 2 + by Equations (3) and (4), respectively, leading to the formation of decomposition products H 2 O and N 2 O as shown by Zhang’s nitration/nitrosation pathway (Equations (4)–(8)) [6]:
H + + HNO 3 NO 2 + + H 2 O
NH 3 OH + + NO 2 + HONO + HNO + 2 H +
H + + HONO NO + + H 2 O
NH 3 OH + + NO + N 2 O + H 2 O + 2 H +
HNO + HNO N 2 O + H 2 O
This decomposition pathway also gives a mechanism for HAN autocatalysis, since the number of H + produced by these reactions is higher than the number of H + required to start them. The more classical reduced kinetic model of Lee and Litzinger [5] includes Equation (9), which is analogous to Equation (4), citing it as the most dominant pathway for H N O 3 decomposition:
HNO 3 NO 2 + + OH
Chelating additives may affect the decomposition of HAN through two different mechanisms, and it is important to separate their effects. The initiation of decomposition of HAN requires available H + . While chelating additives may sequester metallic ions and slow the decomposition rate, they may also change the catalytic activity of the H + concentration. Chelating additives are molecular species that may either dissociate to add more H + to the HAN solution or combine with H + to remove it through acid dissociation and recombination. Equation (2) is an example of acid dissociation and recombination of a HNO 3 molecule. The change in H + concentration can be measured as a change in acidity (pH) of the solution. Both metal chelation and H + concentration change the decomposition rate of HAN. To isolate the effect of metal chelation on decomposition rate, the acidity of HAN solutions with chelating additives must be monitored.
Chelating additives may also decrease the decomposition rate of HAN by sequestration of metal ions. Metal ions catalyze the decomposition of HAN by assisting in oxidation of HAN through reactions such as Equation (10), a dihydroxylamine ( NH ( OH ) 2 ) formation proposed by Hansen et al. This reaction occurs especially when the metal atom is one that readily changes its oxidation state, such as iron or copper. In Equation (10), the iron ion is reduced from 3+ to 2+ oxidation state, and the hydroxylamine gains an oxygen, turning into dihydroxylamine:
NH 2 OH · HNO 3 + 2 Fe ( NO 3 ) 3 + H 2 O NH ( OH ) 2 + 3 HNO 3 + 2 Fe ( NO 3 ) 2
Surplus nitric acid is produced in Equation (10), and may further contribute to the decomposition of HAN by increasing the solution acidity, or through reactions like Equations (11) and (12). For a trace amount of iron to contribute to decomposition, the Fe 2 + ions must be oxidized back to the Fe 3 + ion by losing an electron so that they can be recycled to participate in Equation (10) again. Hansen et al. [3] propose a method of iron oxidation that uses available nitrate ions and contributes to the production of product species nitric oxide and water, as shown in Equation (11):
3 Fe 2 + + NO 3 + 4 H + 3 Fe 3 + + NO + 2 H 2 O
Hansen et al. propose another iron oxidation mechanism where the Fe 2 + reacts with HAN, reducing the hydroxylammonium ion into an ammonium ion, while oxidizing the Fe 2 + into Fe 3 + [3]. Equation (12) prepares the iron ions to participate once again in Equation (10), and contributes to the decomposition of the HAN components into product species such as water and ammonia:
NH 2 OH · HNO 3 + 2 Fe ( NO 3 ) 2 + 2 HNO 3 NH 4 NO 3 + 2 Fe ( NO 3 ) 3 + H 2 O
Equations (10)–(12) together are proposed by Hansen et al. as part of an explanation for the autocatalytic behavior of HAN [3]. In the presence of even trace quantities of metal ions, this set of reactions may recycle metal ions as a reactive species capable of breaking apart HAN at every step. In addition to the direct contribution to the decomposition of HAN by reaction with metal ions, the dihydroxylamine species produced in Equation (10) is unstable and undergoes disproportionation, as shown in equation 13 or 14:
2 NH ( OH ) 2 N 2 O + 3 H 2 O ,
where the product species nitrous oxide and water are formed, or:
2 NH ( OH ) 2 + HNO 3 NH 2 OH · HNO 3 + HNO 2 + H 2 O ,
where nitrous acid is produced that increases the solution acidity and thereby catalyzes the decomposition of HAN.
The aim of this study is to determine if chelating agent additives have an effect on the decomposition of HAN. Equations (10)–(12) illustrate part of a metal-catalyzed decomposition mechanism that may be inhibited by chelating additives, motivating the use of these additives in this work. With a systematic approach using multiple thermal analysis methods and isolating the effects of changes in pH, we show for the first time the effect of chelating agents on neat HAN with trace metal impurities and no additional user-added metals. These trace metals impurities are measured by ICP-MS, and the iron content is confirmed by colorimetric analysis. This is the first body of work to investigate the effects of chelating agent on single part-per-million order metal concentrations. Previous work has investigated user-added metals on the order of 100 parts-per-million [13,15]. Effects on decomposition are evaluated using thermogravimetric analyses (TGA) to calculate decomposition temperature, isothermal decomposition rate, and first order Arrhenius reaction rates to compare propellant samples with and without chelating agent additives. This work shows, for the first time, that Bipy inhibits the decomposition of HAN at 348 K and atmospheric pressure. Additionally, iron and other heavy metal impurities are found in trace quantities in neat, unadulterated HAN.

2. Results

2.1. Metal Impurity Concentration

Trace metals are present in the tested samples at sub-ppm levels. An estimate of the trace metal impurities in raw 45–47% w/w (weight percent) HAN-water reagent was measured with ICP-MS. ICP-MS is a semiquantitative technique with part-per-trillion detection limits for most metals. A rigorous quantitative process for measuring trace metal concentration with ICP-MS requires the use of standards with known concentration of each metal species. After measuring each standard, a calibration ratio of the measured element concentration to the actual concentration can be found for each element. Instead of pursuing a calibration for each metal, we used a single measurement for element identification, settling for speciation and an estimate of concentration approximate to an order of magnitude. The resulting metal concentration estimates with detected concentrations higher than 0.1 part-per-million are shown in Table 1.
Iron and copper are both known to catalyze the decomposition of HAN [3,12], and both were detected in the raw HAN-water sample at 0.49 ppm and 0.1 ppm, respectively, as shown in bold in Table 1. These same metal species were assumed to be present in the concentrated and crystallized HAN, and subsequently, in the 90% w/w HAN-water and additive samples. This assumption is reasonable because metals exhibit orders of magnitude lower vapor pressures compared to water, and evaporate very slowly, even under vacuum. Thus, the expected metal concentrations in the prepared 90% aqueous HAN samples were approximately twice the values measured in a 45% aqueous HAN sample. While iron and copper are thought to be the most catalytic impurities, Hansen et al. found that other metal species had a significant effect on the decomposition of their HAN-based propellant samples [3]. These metals included titanium (Ti), tin (Sn), molybdenum (Mo), and vanadium (V), all elements detected by ICP-MS in this study.

2.2. Sample Acidity

The measured pH of propellant samples is shown in Figure 1. Sample pH was measured 48 h after preparation to allow the sample to equilibrate. The error of each pH measurement, including the no-additive baseline, was the instrument measurement error of 0.2 pH. HAN was found to be highly acidic with the 90% w/w HAN sample without additives, having a pH of 2.8. This was to be expected, since nitric acid is a strong acid and hydroxylamine is not a strong base. Additives modify the pH, and the greatest effect was found for relatively high additive concentration. HAN with EDTA and TEA additives had a pH that was, on average, 3.0 and 3.1, respectively, for concentrations that are at or below 1%. HAN with the Bipy additive had pH that was, on average, 2.7 for additive concentrations at or below 1%, and of the three additive samples studied, it had pH closest to pure HAN-water. At additive concentrations at or below 1%, the pH was relatively constant for each sample, deviating by, at most, 3% from the average. At relatively high concentration (5%), the pH significantly changed for all three samples. Specifically, for EDTA, the pH decreased to 1.7; for TEA, it increased to 3.4; and for Bipy, it increased to 3.3.

2.3. Absorbance

Neat Bipy does not absorb visible light, and is colorless. When trace metals are present and Bipy forms complexes with those metals, the solution is known to absorb light in the visible spectrum [26]. Specifically, metal complexes make the solution become translucent pink or red in color. Therefore, if a solution changes color to absorb light in the visible spectrum after Bipy is added, we assume there are metal complexes with Bipy formed in the solution. We used a Varian Cary 5G spectrophotometer to measure the absorption spectrum of a 1% w/w Bipy in water, a 1% w/w Bipy in 90% HAN sample, and a 90% HAN sample without any additive. The absorption results are shown in Figure 2.
Absorbance is the logarithm of the ratio of incident light intensity to the intensity of light transmitted through a sample with analyte according to Beer’s Law. In the absorption spectra measured, a zero/baseline correction to transmission was used. Deionized water was used for the 100% transmission baseline, and a cuvette stuffed with black felt was used for the 0% transmission baseline. Polystyrene cuvettes of 1 cm square internal cross-section were used in all cases. Figure 2 shows absorbance results in the visible spectrum between 400 and 800 nm wavelength. Nitrate ( N O 3 ) ions absorb light in the UV spectrum, i.e., between 200 and 400 nm [27]. Nitrate ions were present in samples containing dissolved HAN. Therefore, the absorbance spectra of the no-additive and 1% Bipy samples sat on the shoulder of a nitrate ion absorbance peak in the UV range, while the 1% Bipy in water sample did not. Away from near ultraviolet wavelengths, between 450 and 600 nm, we observed a compound absorbance peak in the aqueous HAN sample with added Bipy, but not in the no additive or the 1% Bipy in water sample. The observed compound absorbance peak appeared to consist of two component peaks at approximately 495 and 523 nm. This peak indicated the formation of a complex with Bipy.
We further investigate the complex evidenced in Figure 2 by dissolving iron and copper powders in nitric acid in concentrations of 6 × 10⁻⁴ M, which roughly correspond to 100 ppm. Bipy was added in concentrations corresponding to 1, 2, 3, and 10 times the molar concentration of iron or copper. Next, 3 M nitric acid was diluted to achieve the desired volume and concentration of additive, which was then titrated onto the metal and Bipy until both had dissolved. The final sample pH was 2.7 ± 0.2 pH; this is the average pH measured for Bipy in HAN samples with 1% Bipy or less, as shown in Figure 1. Since the pH of Bipy and HAN solutions were the same as those with Bipy and nitric acid, differences in absorption can be attributed to constituent concentrations and not the pH-dependent stability of Bipy complexes.
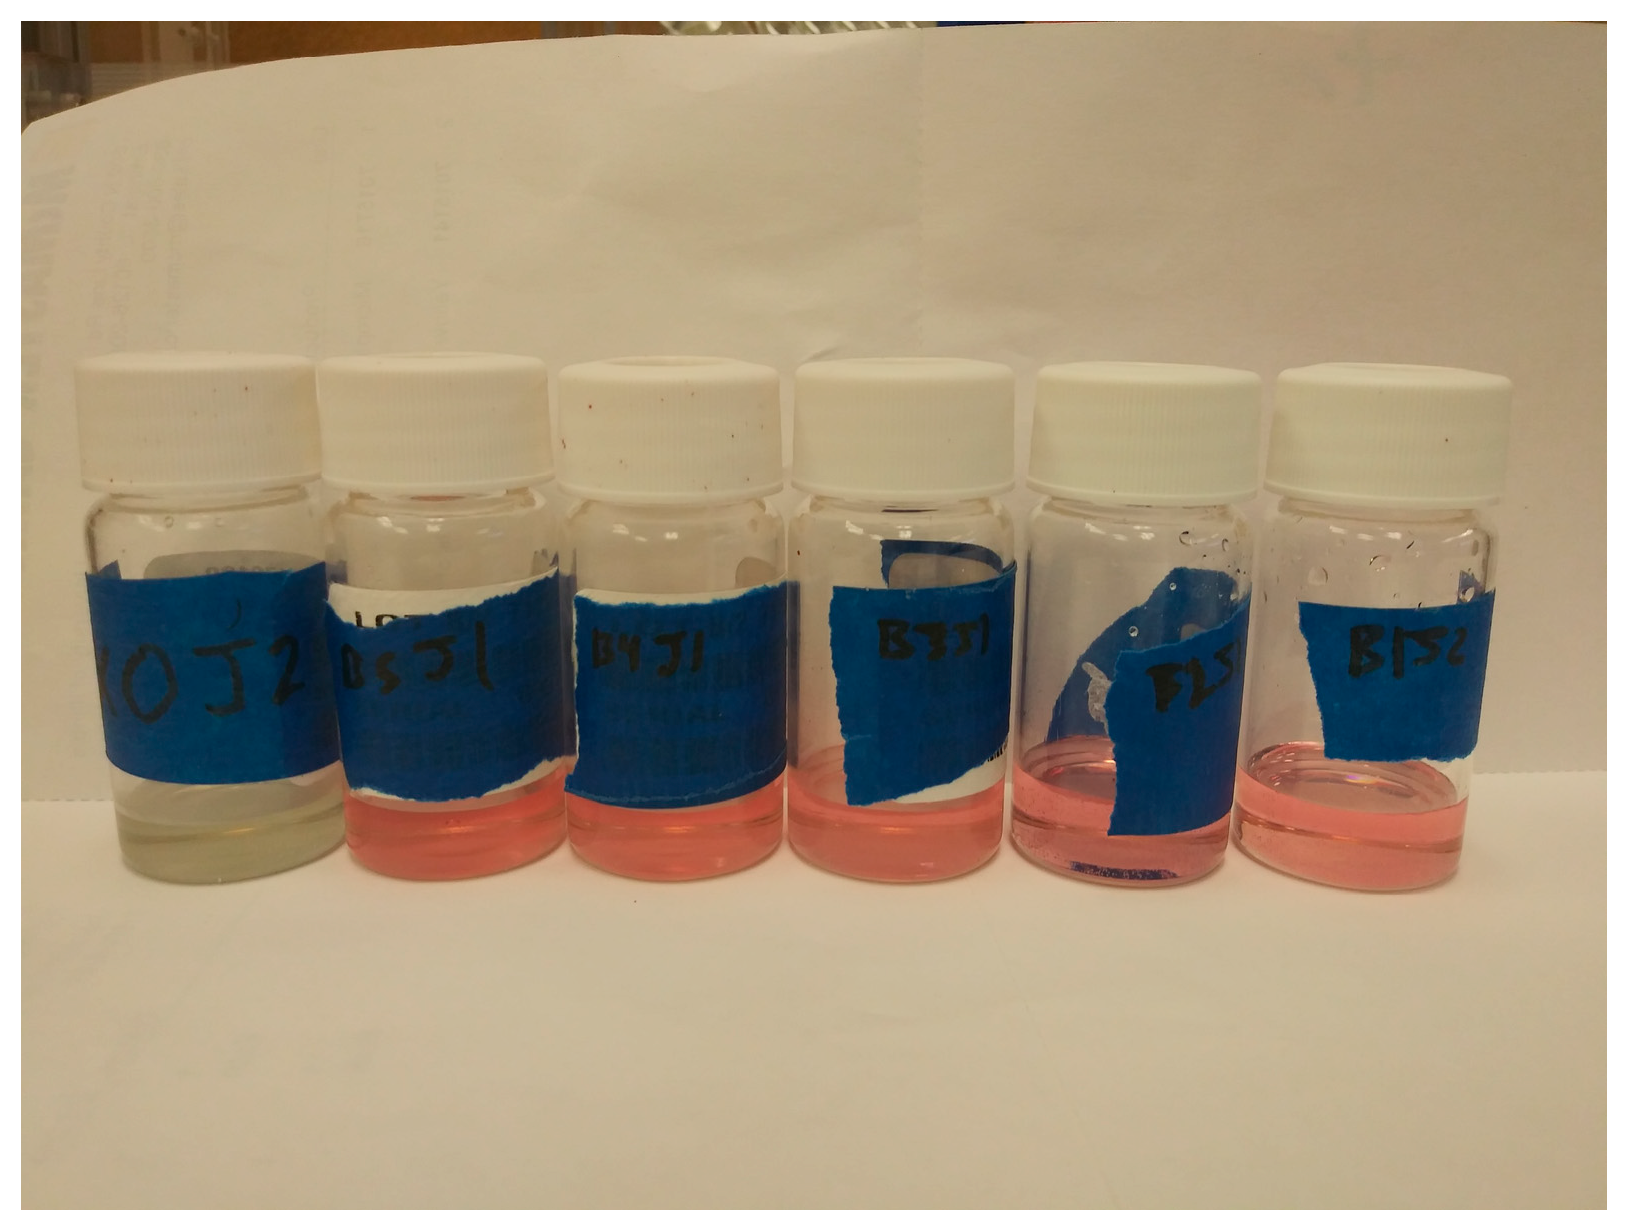
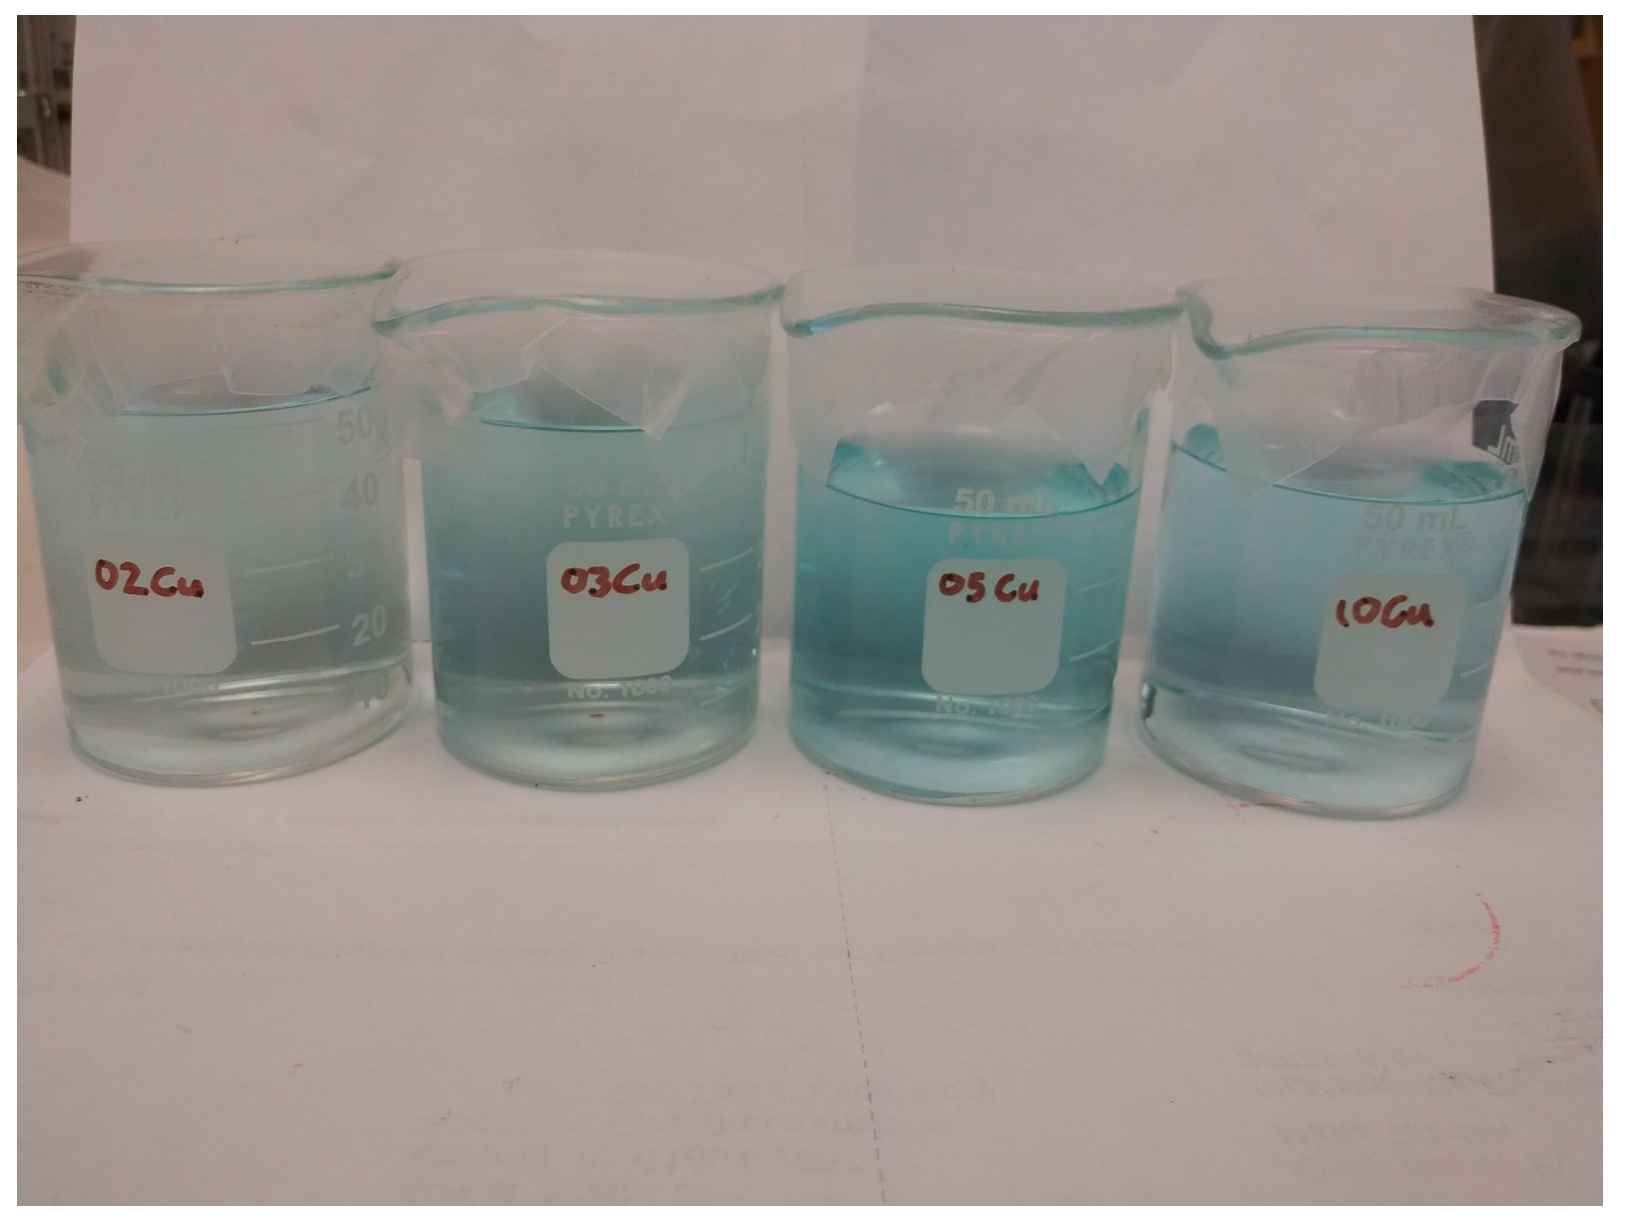
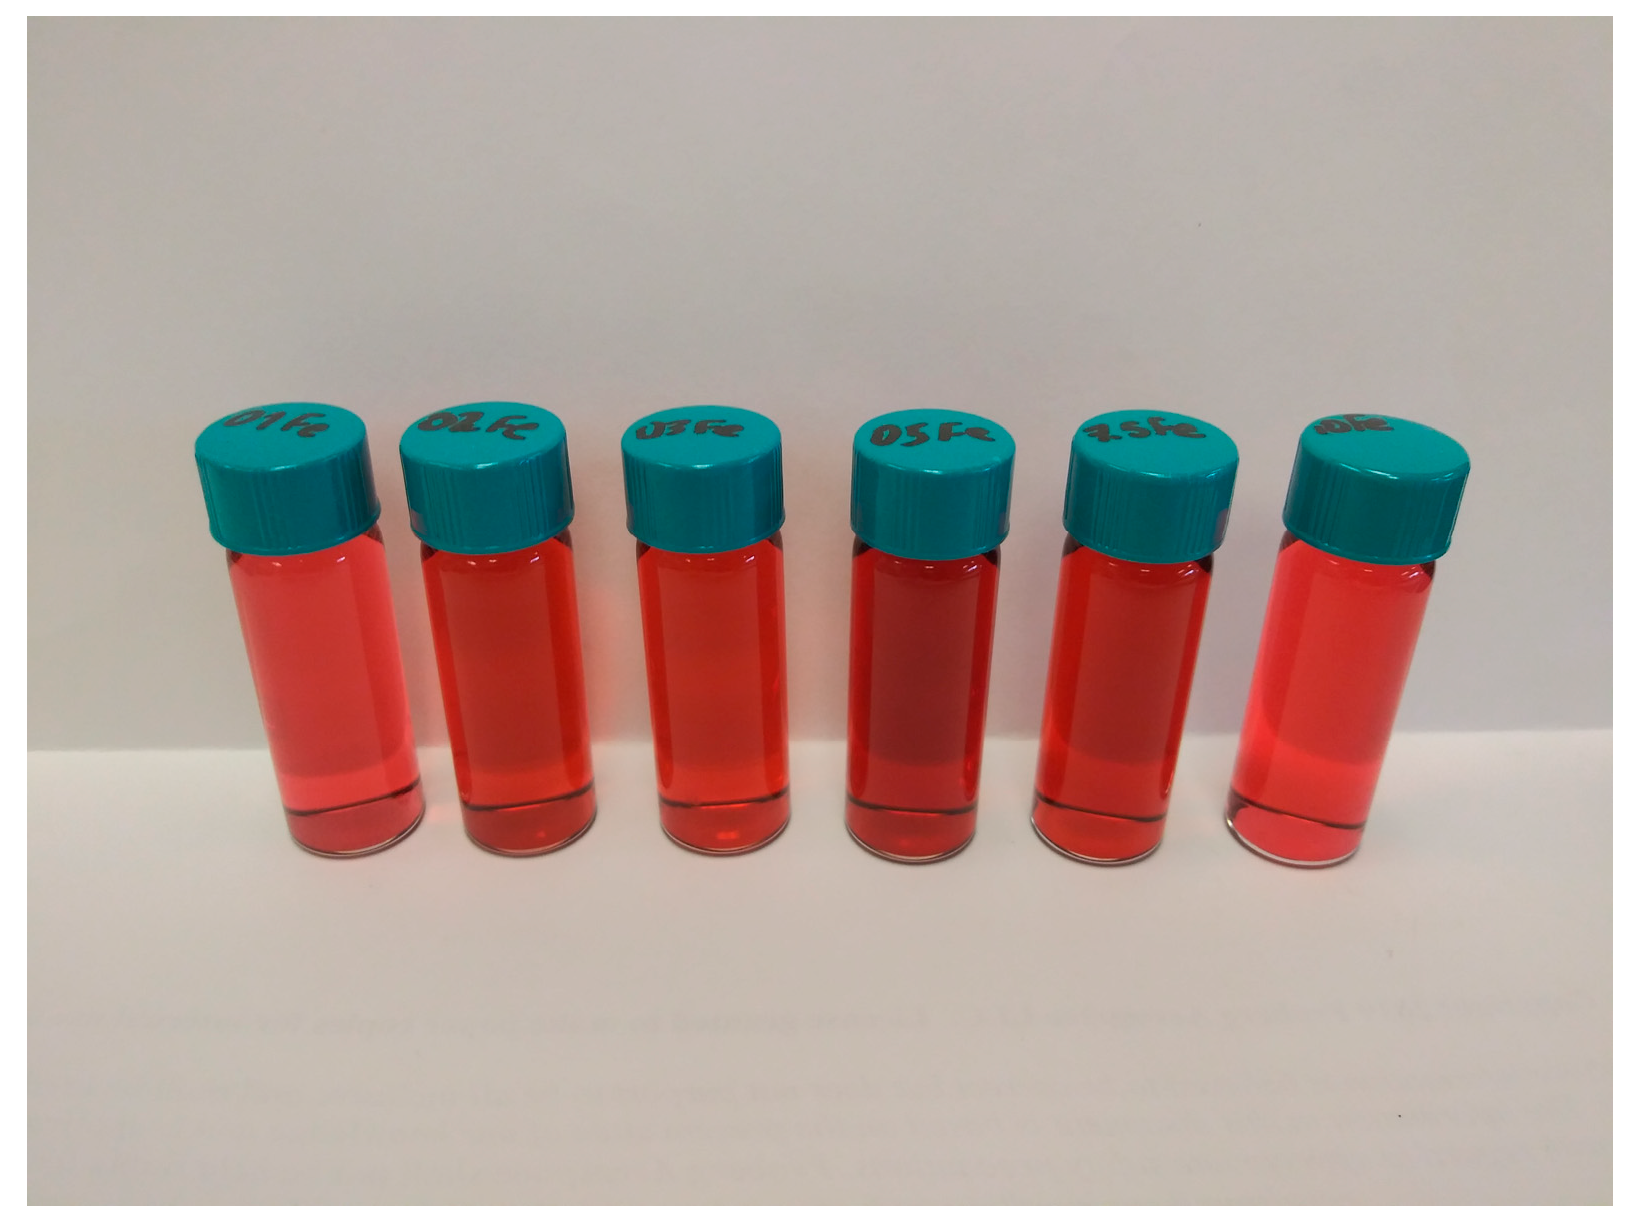
The absorption spectra of Bipy+Cu samples are shown in Figure 3a, and those of Bipy+Fe samples are shown in Figure 3b. Complexes of Bipy with copper were observed to be a very pale blue, shown in Figure A1 in Appendix A, as indicated by the relatively low absorbance values. This blue color was due to visible light being absorbed between 600 and 800 nm with a peak between 730 and 740 nm. The location of this peak absorbance appeared to fluctuate with increasing ratio of Bipy:Cu; however, this change could not be resolved well because of a theoretical error of 2 nm. Complexes of Bipy and iron were red in color, as shown in Figure A2. The color was a deeper red, approaching scarlet, compared with the paler color of Bipy in HAN, as shown in Figure A3. This was also indicated by Bipy:Fe absorbance values of 1–4, while the peak absorbance observed in HAN with 1% w/w Bipy was 0.2. Bipy and iron complexes absorbed virtually no light above 600 nm wavelength, and produced a compound peak at 523 nm and 495 nm. The sample that produced the highest peak absorbance was the 2:1 Bipy:Fe, showing that there was a nonlinear dependence of absorbance on the molar ratio of Bipy to iron. This nonlinear dependence was visible to the naked eye, as shown in Figure A2. This nonlinear absorption may be because of an intermediate complex of iron with two Bipy molecules having a higher absorptivity than a complex of iron with one or three Bipy molecules.

2.4. Isothermal TGA

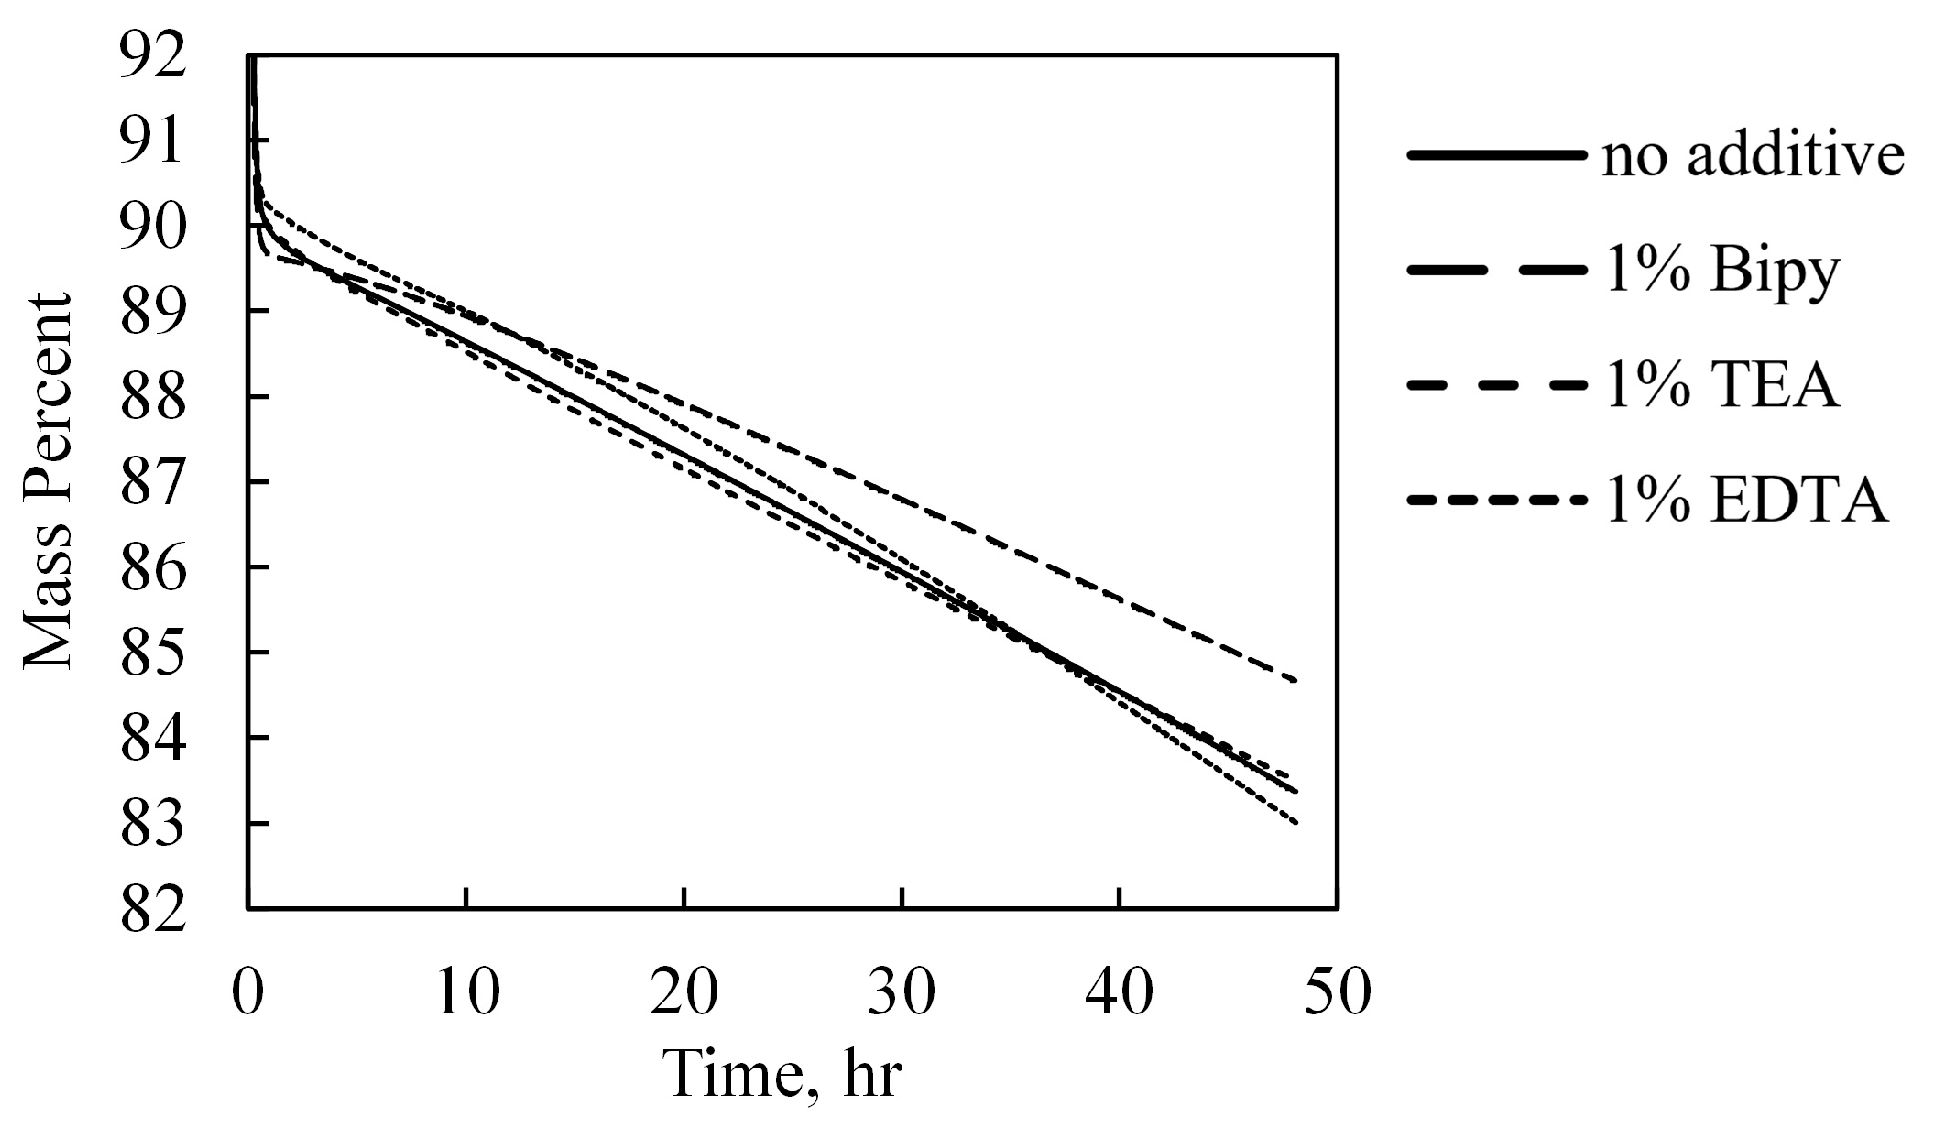
Isothermal TGA at 348 K was performed to directly measure the mass loss rate over 48 h. A sample of 30 mg was put in the TGA with the following procedure: Heat at 10 K/min to 348 K, then remain at 348 K for 48 h. This was done under nitrogen gas flow over the sample at 60 mL/min. TGA results for no additive and 1% additive samples are shown in Figure 4. These results show that first there was a relatively fast loss of 10% of the mass, corresponding to the water content in the samples. It is therefore likely that this step indicated that the water content in the propellant sample evaporated over the first 90 min of the test. Following this step, we observed a much more gradual mass loss that continued in nearly linear fashion for the remainder of the test. This corresponded to the decomposition of HAN. Starting at the 5-h mark, to exclude water evaporation and the start of HAN mass loss, the last 43 h of data were fit to a line using linear regression. The slope of this line was the linear mass loss rate. The linear mass loss rate for HAN and the coefficient of determination (R-squared value) of each linear fit were calculated, showing that each decomposition event was very close to being linear, with the R-squared value deviating by no more than 0.0029 from unity. The linear mass loss fit parameters are given in Table 2.
For a representative 30 mg sample, the error in mass measurement corresponds to 3.3 × 10⁻⁴% w/w. With a 10 s sampling rate, the error in mass loss rate was 3.8 × 10⁻⁴%/h. A 0.026%/h decrease in the mass loss rate from the sample without additive was observed with Bipy, indicating that decomposition pathways leading to gas generation had been inhibited. The sample with TEA performed only slightly better than HAN without additive, i.e., at a 0.005%/h slower rate, and the EDTA sample decomposed 0.017%/h faster. Since 48-h TGA tests are long and costly, only samples with 1% w/w of additive were evaluated; these were chosen because they had the maximum concentration of additive without the significant pH change observed in the 5% w/w samples.

2.5. Dynamic TGA

Heating above the decomposition temperature of HAN resulted in a rapid decomposition to gas that could be measured as mass loss. Dynamic TGA refers to a nonconstant temperature achieved by controlled heating of the sample. In this study, a series of constant heating ramps at 2, 5, 10, 15, and 20 K/min were performed on 90% HAN, as well as with each concentration of Bipy, TEA, and EDTA additive. The mass responses to these temperature ramps were used to calculate the decomposition onset temperature and single-step Arrhenius reaction rates.
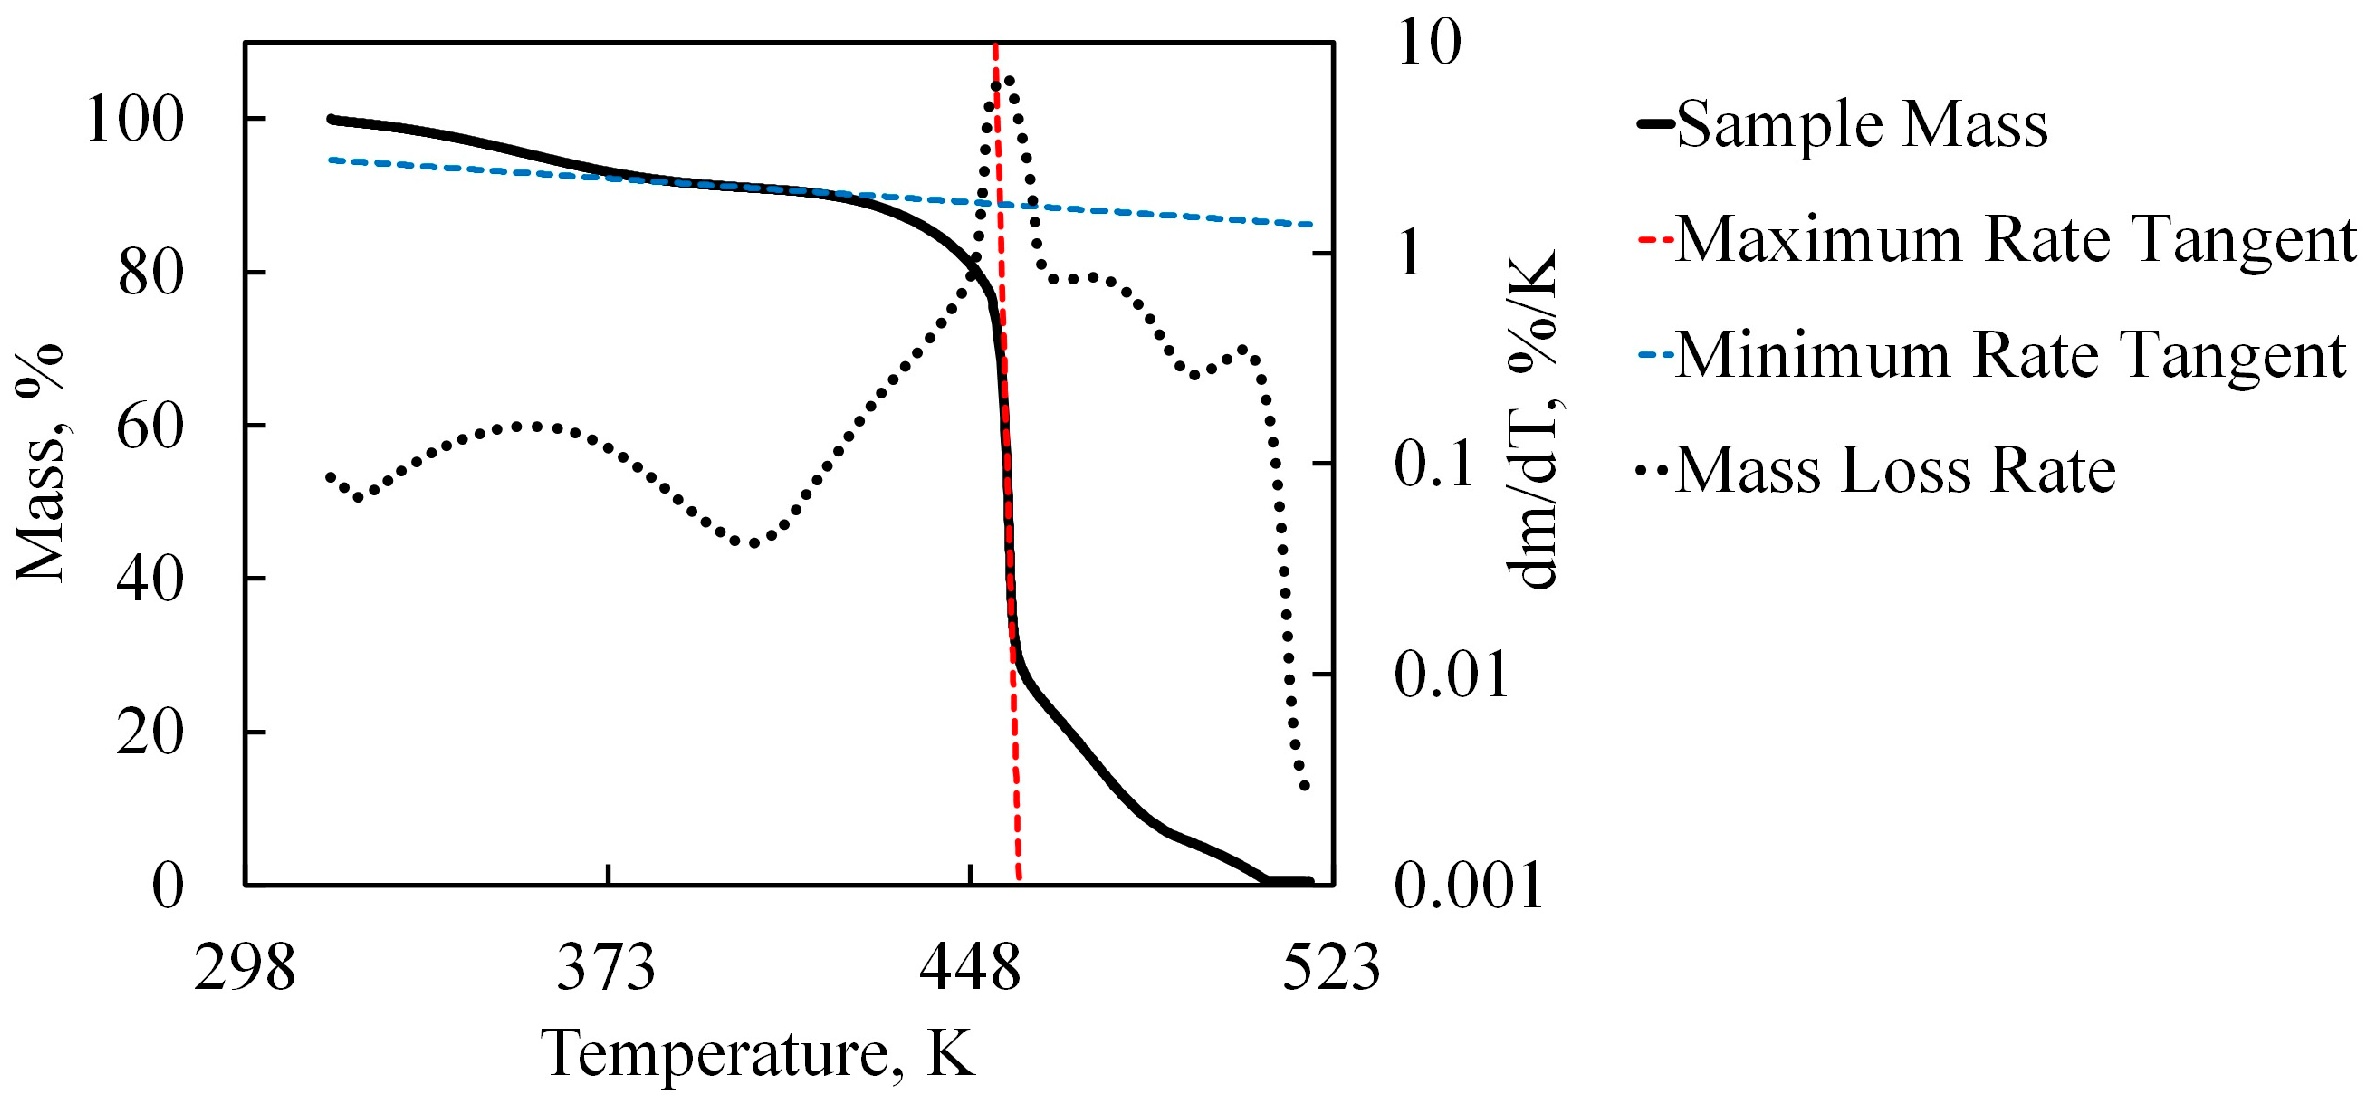
A sample dynamic ramp TGA curve of a 10 K/min heating ramp on a sample of 90% aqueous HAN without additive is shown in Figure 5. Since the heating rate was constant, there was a constant conversion between test time and temperature. Therefore, the temperature measurement could be plotted on the x-axis to produce a single-valued mass percent as a function of temperature. Due to the same linear relationship between temperature and test time, the mass loss rate could be found as the derivative of mass with respect to temperature. At temperatures under 380 K, the mass loss corresponded to water evaporation, because a mass decrease of about 10% corresponded to the known water content. HAN is known to be very hygroscopic, so it is likely that there was still some water present in the sample, preventing it from completely drying and crystallizing [4,28]. Nevertheless, the HAN samples persisted as homogeneous liquid after the evaporation of water, since its melting point is about 44 °C [28,29]. Although HAN samples persist as liquid, after most of the water evaporates, they are a molten salt. After water evaporation, there was a temperature range where the mass stabilized briefly (380–420 K), but did not completely stop decreasing before the rapid mass loss event due to the decomposition of HAN near 450 K. Following this, there was some unburned propellant residue that did not decompose faster than the heating rate, but did decompose by the time the sample had been heated to about 520 K.
The decomposition onset temperature was found by locating the intersection of the tangent lines for the minimum mass loss rate and maximum mass loss rate immediately before and during the decomposition event. While the sample was in the stable region of slow mass loss (380–420 K), the rate of mass loss was not zero. In Figure 5, the black dotted curve is the derivative of the mass percent with respect to temperature, equal to the mass loss rate. The blue and red dashed lines are the tangent lines at the minimum and maximum mass loss rates during the HAN decomposition event, respectively. In Figure 5, the minimum mass loss rate is 0.0416%/K, and the maximum mass loss rate is 22.30%/K. This maximum rate is a calculated instantaneous value between two measurements; the mass loss rate shown in Figure 5 is smoothed. On the thermogram shown in Figure 5, the minimum mass loss rate occurred at 402.3 K, and the maximum at 455.9 K. The intersection of these tangent lines in Figure 5 is located at 452.9 K; and this was the decomposition onset temperature for the 10 K/min thermogram shown in Figure 5.
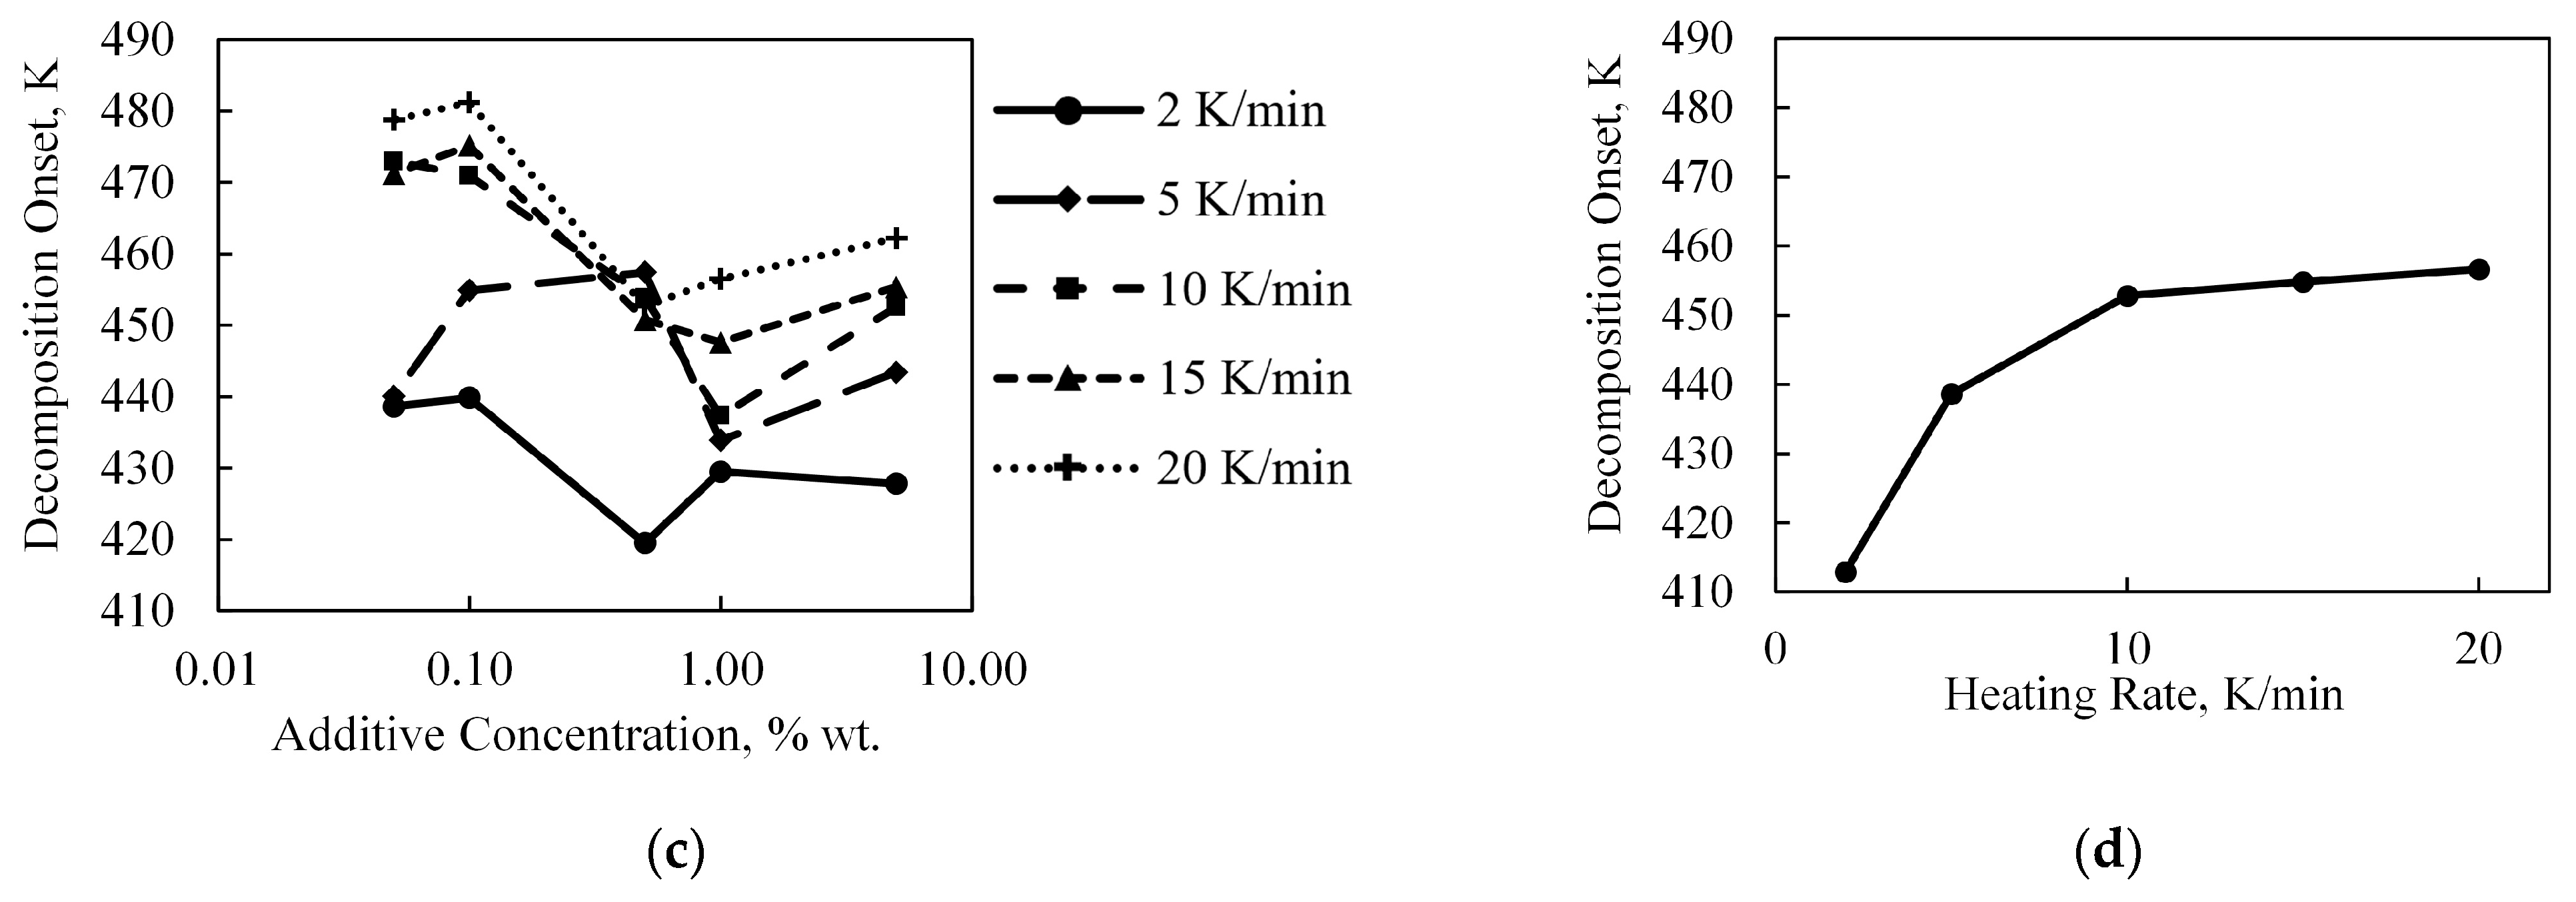
The decomposition of each HAN and additive sample was measured by TGA at 2, 5, 10, 15, 20 K/min constant heating rates, and the decomposition onset temperature was calculated. The results are shown in Figure 6. The no additive data are shown in Figure 6d as decomposition onset temperature versus heating rate. As shown in Figure 6d, above a 10 K/min heating rate, the decomposition onset temperature of HAN with no additive began to plateau at about 454.8 K. For onset temperatures, the plateau region found with the HAN without additive could be compared with the same high heating rate tests using HAN with additives, since the heating rate was no longer dominating the decomposition onset measurement. The average decomposition onset temperature of the 10, 15, and 20 K/min heating rate points for Bipy, TEA, and EDTA were 461.8, 453.9, and 461.3 K, respectively.
As shown in Figure 6, the decomposition temperatures did not show simple proportionality with the range of additive concentrations measured, i.e., more additive did not necessarily mean that the decomposition temperature increased. The experimental variation was high, while the measurement error on temperature was very low, at 0.1 K. This means that there was an experimental or calculation error causing fluctuation of the measured decomposition onset temperature that was not related to the quantity of additive. The range between the lowest and highest decomposition onset temperature of each heating rate series was used as a measure of variation or consistency within each series. The fluctuations observed in onset temperature are discussed in greater detail in Section 4.2. Considering only heating rates above 10 K/min, the average onset temperature range for each additive was 5.2, 23.1, and 30.6 K for Bipy, TEA, and EDTA respectively. This means that the decomposition onset temperatures observed for samples with Bipy were within a smaller range of temperatures than those for TEA and EDTA.

3. Discussion

3.1. Comparing Isothermal Results with pH

The results for isothermal decomposition at 348 K of 1% additive samples compared with those of the no additive sample showed that while Bipy can inhibit the decomposition of HAN, TEA has a significantly lesser inhibitive effect, and EDTA can even catalyze decomposition. These results showed that a mechanism based on H + alone does not adequately explain the inhibitive effect of Bipy on the decomposition of HAN. After 48 h, the sample with 1% Bipy had 1.3% more mass remaining than the HAN sample with no additive. Although this was a small difference, it was significant, since the TGA measurement error was sensitive to 0.00033% of the 30 mg sample. The TEA sample had just 0.13% more mass remaining than the sample with no additive, and the EDTA sample ended the 48-h test with 0.36% less mass than the sample with no additive. These results showed that Bipy and TEA inhibited the decomposition of HAN at 348 K.
Additionally, 1% Bipy provided five times the inhibition to isothermal mass loss rate of HAN compared to 1% TEA, suggesting that changing the pH is not the only mechanism by which Bipy and TEA affect the decomposition of HAN.
The acid dissociation constants of the protonated form of the chosen additives are given in Table 3 for the dissociation of each chelating agent into H + and its conjugate base. EDTA can be written as H4EDTA to note the hydrogens in the acetic acid groups that would be the first to dissociate. These notations refer to the same molecule.
The acid dissociation constants (pKa) of protonated Bipy and TEA are both higher than the 2.8 equilibrium pH of 90% aqueous HAN, so these species were not expected to release additional H + ions when dissolved in solution. Instead, they were able to bond with free H + ions, recombining into their protonated form. Protonated EDTA has two acid dissociations with a pKa less than the pH of the HAN solution; therefore, EDTA was expected to release two H + per molecule. Releasing additional H + catalyzes the decomposition of HAN, overshadowing any metal sequestration properties. The effect of acid dissociation was observed in the pH measurements of HAN solutions with 5% w/w additive concentrations, as shown in Figure 1. Figure 1 shows that acid dissociation of higher concentrations of each additive changed the sample to a lower pH for EDTA and a higher pH for Bipy and TEA.
The pH of the samples were measured and compared with data at 298 K and 1 atm. This was the relevant regime for the formation of chelate complexes in HAN solutions before use, but pH and pKa properties of samples may have changed based on the elevated temperatures and decreased water content during TGA testing. For example, with less water in the mixture and at elevated temperature, the pH was expected to decrease. In theory, this could change whether the additives dissociate or recombine with free H + ions. However, the isothermal decomposition rates reflected the comparison of pH and pKa values at room temperature, so while the actual values may have changed, their comparison remains valid. The same logic applies to the stability of each chelate complex, and in particular, Bipy. If the stability of Bipy complexes were compromised by the elevated temperature and decreased pH, then no decomposition inhibition should have been observed past that expected by its acid recombination.
If H + -based mechanisms were the only way that these additives affected the decomposition of HAN, then TEA should have had the best inhibition properties, because it has the highest pKa. Therefore, pH does not adequately explain why Bipy had five times the inhibitive effect on HAN isothermal mass loss rate. Spectrophotometry results indicated that sequestration of iron by Bipy was a possible explanation for its relative effectiveness.

3.2. Decomposition Onset Temperatures

Like the results for isothermal mass loss rate, the results for decomposition onset temperatures showed that Bipy, TEA, and EDTA affected the decomposition of HAN differently. Bipy samples showed a 7.0 K increase in the decomposition onset temperature compared with no additive, while TEA and EDTA did not yield a clear change. Additionally, none of the samples showed a significant dependence of decomposition onset temperature on the additive concentration in the range investigated. The method of calculating decomposition onset temperature was heavily dependent on the maximum mass loss rate, and was potentially influenced by procedural error, obscuring meaningful results from the TEA and EDTA data.
The maximum mass loss rate was sensitive to small changes in the shape of the mass loss curve. If an error occurred that affected this small section of the TGA curve, the decomposition onset temperature calculated from the TGA curve changed significantly. When the sample reacted endothermically, the TGA thermogram sometimes doubled back on itself as the measurement thermocouple briefly measured a lower temperature. This sometimes rapidly flipped the sign of the derivative, making the determination of the maximum mass loss rate less clear. These were consequences of HAN decomposing quickly, losing the bulk of its liquid mass in seconds, and thereby amplifying random errors due to large variations in decomposition onset temperature.
The decomposition onset temperatures for HAN started to plateau at and above 10 K/min. This was because the heating rate became faster than the thermal diffusion and bulk heating of the sample, such that the decomposition started at its maximum rate and temperature each time. To minimize the influence of the heating rate, decomposition onset temperatures acquired at or above 10 K/min heating rate were compared, as shown in Figure 7. According to the decomposition onset temperature data, Bipy samples produced a consistently higher decomposition temperature than HAN without any additive. Figure 7 shows visually the average and range of onset temperatures measured with and without additives for the data above 10 K/min heating rate. Above 10 K/min, the average onset temperature for Bipy was 461.8 K, while that for HAN without any additive was 454.8 K. The 7.0 K difference between these decomposition onset temperature averages was larger than the range for both Bipy-added and HAN onset temperatures, making it a significant difference.
Ranges of 23.1 and 30.6 K for TEA and EDTA respectively eclipsed the observed differences between the average onset temperature with and without each additive while the 5.2 K range observed for Bipy samples did not. Therefore, the only conclusion that can be made from the TEA and EDTA series is that the decomposition onset temperature was more unstable for samples containing these additives compared those containing Bipy or no additive. Despite any error, samples containing Bipy or no additive exhibited a smaller range of decomposition onset temperatures, leading to the conclusion that Bipy inhibited the decomposition of HAN.

3.3. Reaction Rate Parameters and Kinetic Compensation

Reaction rate parameters are calculated as an additional method for examining the influence of additives on the reaction rate. These rate parameters follow a proportional trend established in the literature, thought to be due to the kinetic compensation effect (KCE) [33,34]. Since the rate parameters agree with those in the literature, it shows that the reaction phenomena—i.e., the decomposition of HAN—observed by the TGA methodology applied in this study were the same as those reported in literature [35].
Reaction rate parameters are theoretically independent of heating rate, and make it possible to estimate the rate of the reaction itself, according to a couple of assumptions. In this work, the first order Arrhenius reaction rate parameters were fit from experimental TGA data using the Ozawa/Flynn/Wall (OFW) method [36,37,38]. The first order reaction rate formulation is:
k = A e x p ( E a R T )
where for any reaction of rate k , A is the pre-exponential frequency factor, T is the temperature, R is the universal gas constant, and E a is the activation energy in the same units as R T . A and k have units of s−1, while the E a / R T is a unitless fraction of molecules with threshold energy E a available.
The reactions observed by TGA were analyzed by a nondimensional fraction of sample reacted ( α ), equivalent to the mass percent. The OFW method uses Doyle’s approximation for the temperature integral [36,37,38,39,40]. In this work, f ( α ) = 1 α is used as recommended by the ASTM E1641-16 standard and TGA system manufacturer TA Instruments [38,39]. The choice of a linear conversion function f ( α ) assumes that the reaction is a single-step, global reaction, providing accurate results for complex decompositions when there is a single rate-limiting mechanism [40].
Conversion points and heating rates from TGA thermograms at rates of 2, 5, 10, 15, and 20 K/min of 90% aqueous HAN without additive were used to produce a sample Arrhenius plot of log heating rate vs. inverse temperature, as shown in Figure 8. The linear fit shown on the plot is for a no additive sample and has slope −9344.9 K2/min and y-intercept 23.816 K/min. This fit generated a coefficient of determination (R-squared) of 0.987, showing that although imperfect, the linear fit appears acceptable for the onset region of HAN decomposition where α is low. The error in activation energy was calculated from the uncertainty in the slope, as determined by linear regression with the fit shown in Figure 8 as recommended by the ASTM E1641-16 standard [39]. For the data in Figure 8, the activation energy and pre-exponential factor were found to be 171.5 ± 11.4 kJ/mol and 40.2 ± 1.2 s−1.
For each HAN sample, the calculated first-order activation energy and frequency factor for each propellant sample are plotted in Figure 9. In Figure 9, the horizontal line represents the HAN sample without additive. The samples with additive had a higher activation energy. Higher activation energy indicates, in theory, that the decomposition for those samples is inhibited; however, this may not be true, due to kinetic compensation. Specifically, since the chosen conversion point (the value of α ) was 0.05, this reaction rate was the rate for the first 5% of the sample to decompose. The vertical bars represent the linear regression error associated with the fit of the reaction rate parameters. As predicted by the KCE, the trends in the activation energy results appeared to be very similar to the results for frequency factor.
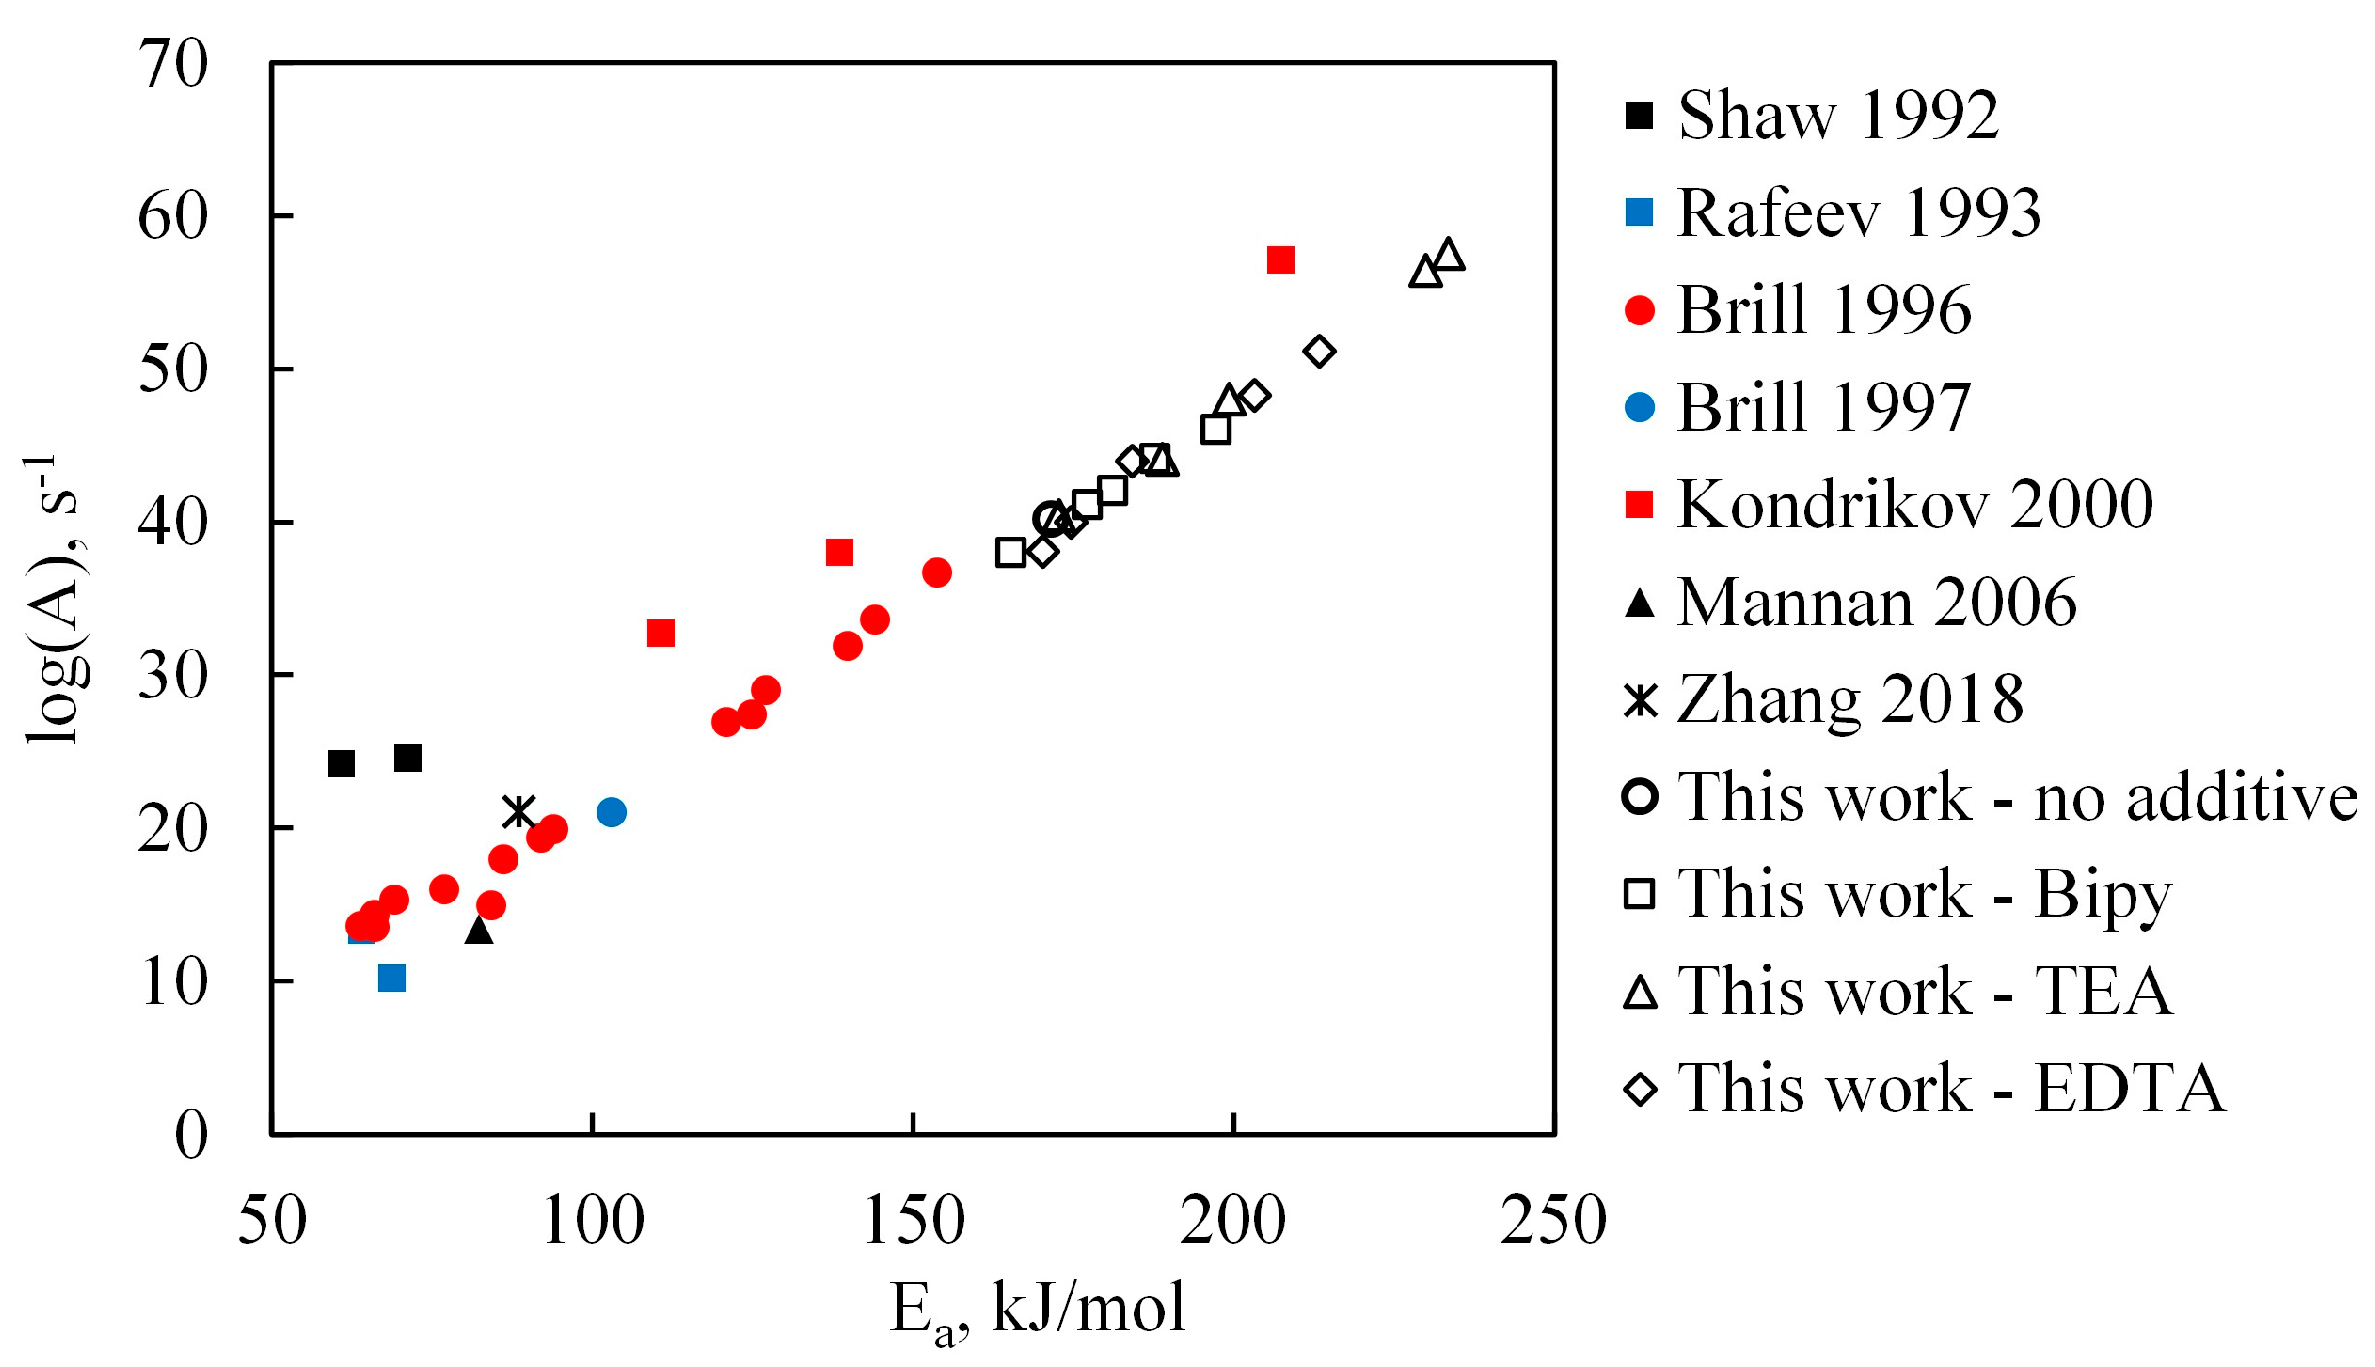
Computational and experimental work elucidated the mechanisms of the decomposition of HAN, and allowed us to calculate the rate constants of each [6]. Some of the rate constant parameters for HAN from the literature are shown in Figure 10, where they are compared with those calculated in this work. A positive, linear correlation between frequency factor and activation energy is clear. This is an observation of the KCE, which states that the frequency factor is a result of the Arrhenius rate equation formalism [33,34]. When a procedural change is made that changes the activation energy, a frequency factor is calculated that abides by the linear compensation law,
log ( A ) = E a R θ + λ
where θ and λ are linear fit coefficients. This linear relationship is an implicit assumption in numerically fitting experimental data to the Arrhenius rate equation. Activation energy and the frequency factor are fundamentally coupled for complex reaction phenomena that include many steps and intermediate species, such that the physical description of ‘frequency factor’ is dubious at best. The linear fit parameters λ and θ in Equation (10) for the data collected by Zhang were −3.497 s−1 and 446.3 K, respectively [6]. For the data from this work, λ and θ were −9.887 s−1 and 418.2 K.
The parameters from this work neatly created a linear kinetic compensation trend and exhibited consistency with rate parameters measured elsewhere. The parameters calculated in this work were each at a higher activation energy and frequency factor, except for the outlier from Kondkrikov’s work. This was expected, as the final value of the rate parameters are highly dependent on sample and experimental conditions, as discussed by Brill et al. The differing range of reaction rate parameters may also have been dependent on the conversion point used for calculating the parameters, or the method itself. Using a conversion point of α = 0.05 effectively ignores the decomposition of the last 95% of the mass. This works around the issue in decomposition onset temperature calculation, i.e., depending on the maximum mass loss rate; however, the calculation of reaction rate parameters presents its own inaccuracies.
Due to the similar magnitudes and frequency factor versus activation energy trend, there was considerable overlap of the reaction phenomena being observed. It should be no surprise that a complex physical phenomenon such as the decomposition of HAN is inadequately described by an equation with two varying parameters. Nevertheless, fitting Arrhenius reaction rate parameters with a repeatable degree of kinetic compensation, as shown by the agreement between many studies (see Figure 10), indicates that the same reaction phenomena were being observed [35].

3.4. Reaction Rate Inhibition

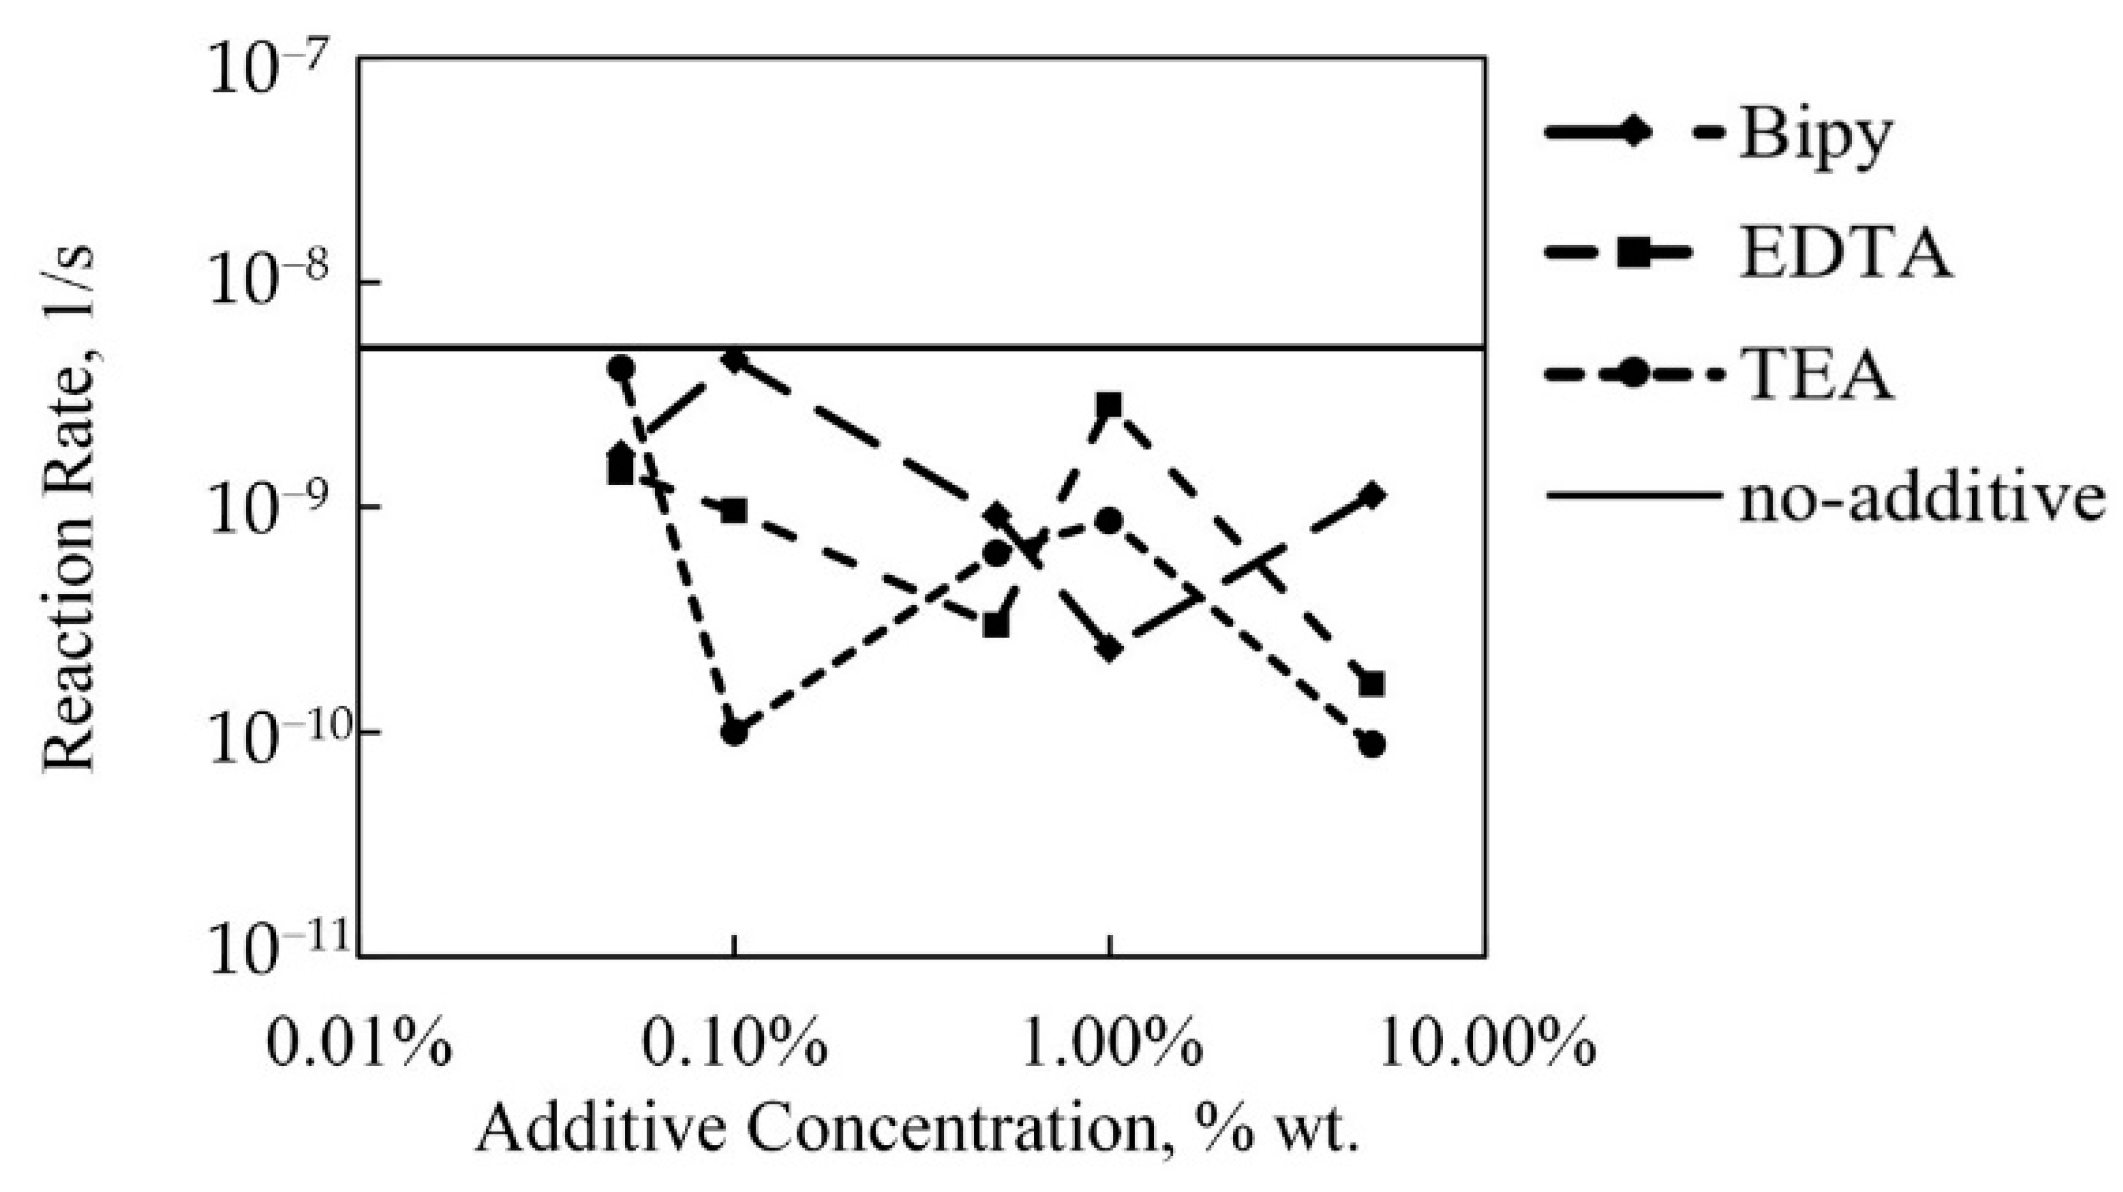
Even though the frequency factor and activation energy parameters were coupled, the reaction rate calculated at 348 K appeared to be inhibited. However, the series for each additive showed similar variation and a similar trend. Due to the similarity of the reaction rate results for each additive, the inhibitive or catalytic effects of the additives tested were found to be too small to be captured by the OFW method of determining reaction rate parameters. This indicates that although Bipy, TEA, and EDTA were observed to affect the decomposition of HAN according to results from isothermal TGA and onset temperature calculations, they did not significantly change its rate-limiting mechanism. The differences calculated in reaction rate must therefore have been artefacts of the measurement and postprocessing procedure.
In Figure 11, the data from Figure 9 are used to calculate reaction rates using a temperature of 348 K, i.e., the same temperature used in isothermal tests. The reaction rate parameters, as shown in Figure 9, were clearly coupled to each other due to the KCE. Despite this coupling, the kinetic reaction rate exhibited a decreasing trend with increasing additive concentration to a lower reaction rate than measured for no additive samples. However, the series for each additive produced similar decreasing trends, each with similar variance. This was in contrast with the isothermal decomposition and onset temperature data where Bipy showed an inhibitive effect, while TEA and EDTA showed a catalytic or no significant effect. Therefore, the decreasing kinetic rate calculated at 348 K was attributed to errors from inaccurate assumptions regarding the application of the OFW method.
Independent of the reported error from linear regression on the Arrhenius plot, there were inaccuracies arising from the assumptions of a first order reaction rate, Doyle’s integral approximation, and the use of a linear conversion function. Approximating the decomposition of HAN as a single-step, first-order reaction should be reasonable for HAN, since its autocatalysis has been found to be mainly dependent on proton transfer to hydroxylamine [6]. The proposed mechanism, by which chelating additives are proposed to inhibit the decomposition of HAN, is not the primary acid catalyzed mechanism. This was confirmed by the lack of serious change in the reaction rates that should correspond to the isothermal TGA results.
Alternative methods for solving the Arrhenius equation and fitting reaction rates using alternate temperature integral solution methods or conversion functions are discussed by Vyazovkin et al. The method used in this work was chosen for its simplicity, but other methods of approximating kinetic models might better capture the secondary nature of the effect of chelating agents compared to the primary proton transfer mechanism. Notably, methods that use longer time scales such as combining multiple isothermal measurements to calculate rate parameters might produce better results. Hansen observed that some chelating agent additives extended the lifetime of HAN samples observed over multiple weeks [3]. It stands to reason that the secondary effect of chelating agents becomes more pronounced at lower temperature and pressure conditions, and on longer time scales where the secondary metal-catalyzed mechanism has time to compete with the primary acid-catalyzed decomposition mechanism.

3.5. Bipy Complex Absorbance and Speciation

The absorption peaks found in the results from visible spectrum spectrophotometry confirmed that the aqueous HAN contained metal ions in trace quantities, and that Bipy formed chelate complexes with them.
The absorbance peak located at 527 nm in Figure 2 corresponded with the expected peak absorbance for [Fe(bipy)3]2+ at 522 nm, allowing for a slight redshift [26]. The peak absorbance for [Fe(bipy)3]3+ was at 610 nm, i.e., outside the measured absorbance signal due to iron; therefore, all measured complexes were assumed to be [Fe(bipy)3]2+ [26]. The relative intensity of this peak could be used to estimate the iron concentration. According to the Beer-Lambert law, the fractional intensity of light that is absorbed by a molecule in solution is proportional to the concentration of that molecule in the solution. For the first order, the Beer-Lambert law is
A b s = log 10 ( I 100 % I 0 % I I 0 % ) = ϵ l c
where A b s is the absorbance of a particular wavelength of light, measured by the decadic logarithm of the ratio of light transmitted through the reference to the intensity of light transmitted through the sample. In the absorption spectrum of the 1% Bipy sample in Figure 2, there was a concentration of Bipy four orders of magnitude greater than the expected concentration of iron; therefore, only saturated Bipy:Fe complexes with three Bipy molecules were expected to be present. Schilt gives the molar absorptivity for [Fe(bipy)3]2+ and [Fe(bipy)3]3+ as 8650 and 330 M–1 cm–1, respectively [26]. Using the absorptivity of [Fe(bipy)3]2+ along with the measured peak absorbance at 527 nm, a concentration of 1.2 ppm Fe was found. This corresponded well with the 0.9 ppm measured with ICP-MS (Table 1), and further confirmed the existence of trace metal impurities, including iron. It also indicated that iron ions had been sequestered by Bipy at the equilibrium pH of HAN.
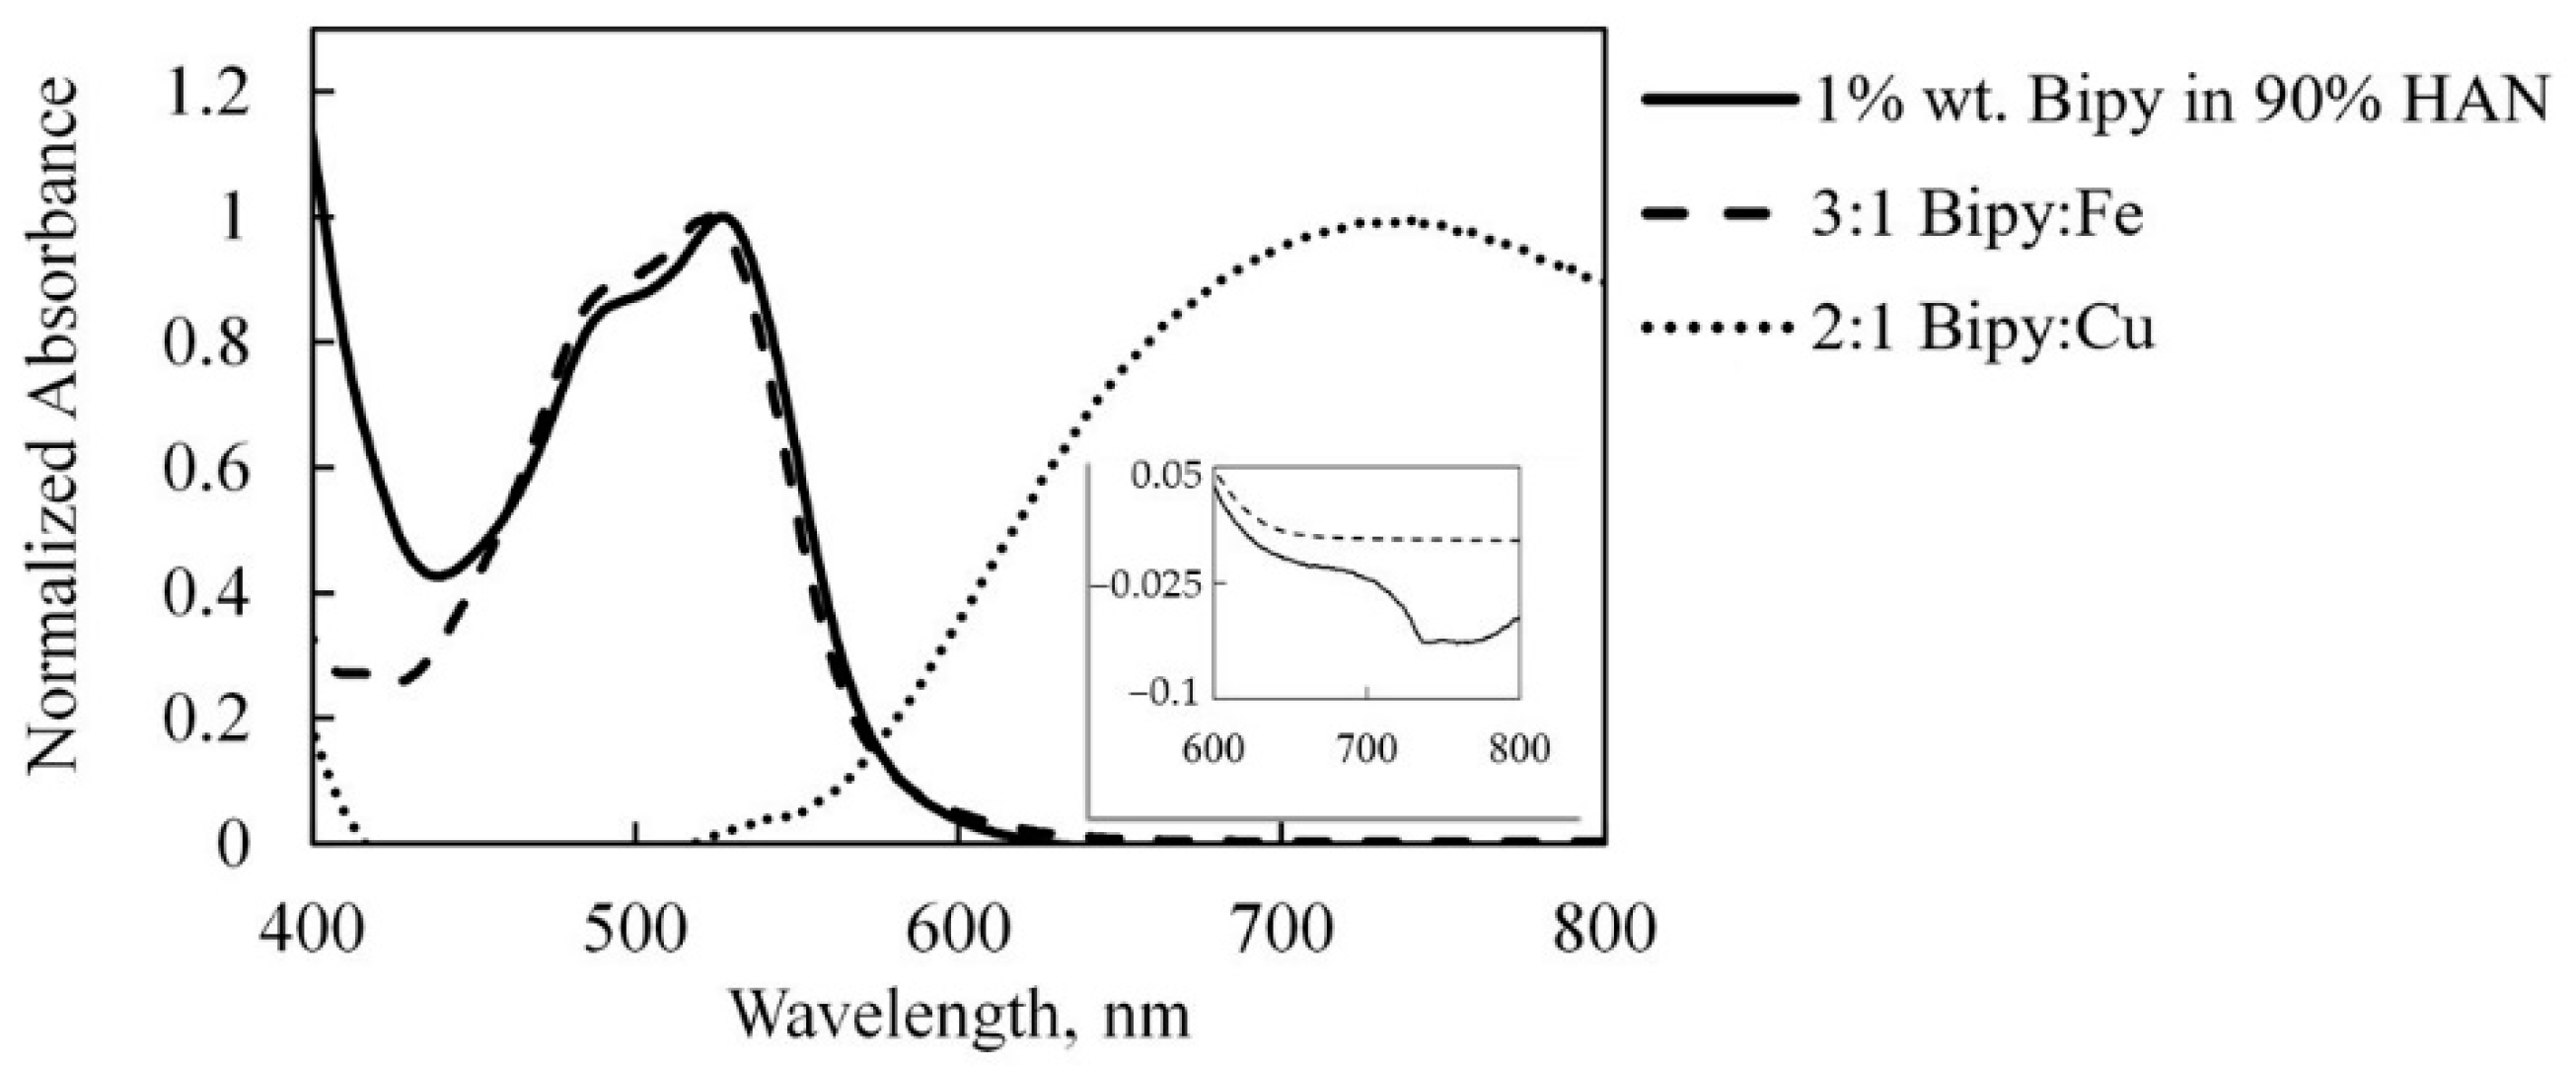
The wavelength of light absorbed corresponds to the physical properties of the complex that absorbs the light. This means that complexes of different metal ions with different sizes absorb different wavelengths of light, and that each individual absorbance peak corresponds with either a complex of a different metal species or a complex with different numbers of Bipy. For example, a different wavelength may be observed for complexes with ratios of 2:1 Bipy:Fe, 3:1 Bipy:Fe, and 2:1 Bipy:Cu. The absorbance peaks measured for HAN were compared with those for Fe+Bipy and Cu+Bipy solutions, all of which were normalized to the peak absorbance shown in Figure 12. The 3:1 Bipy:Fe ratio and 2:1 Bipy:Cu ratio spectra are presented, because iron commonly has a coordination number of six, while copper commonly has a coordination number of four. It was therefore expected that the 3:1 and 2:1 Bipy:Fe and Bipy:Cu, respectively, would be the most stable complexes in a solution with excess Bipy, with all the metal ions’ coordination sites filled.
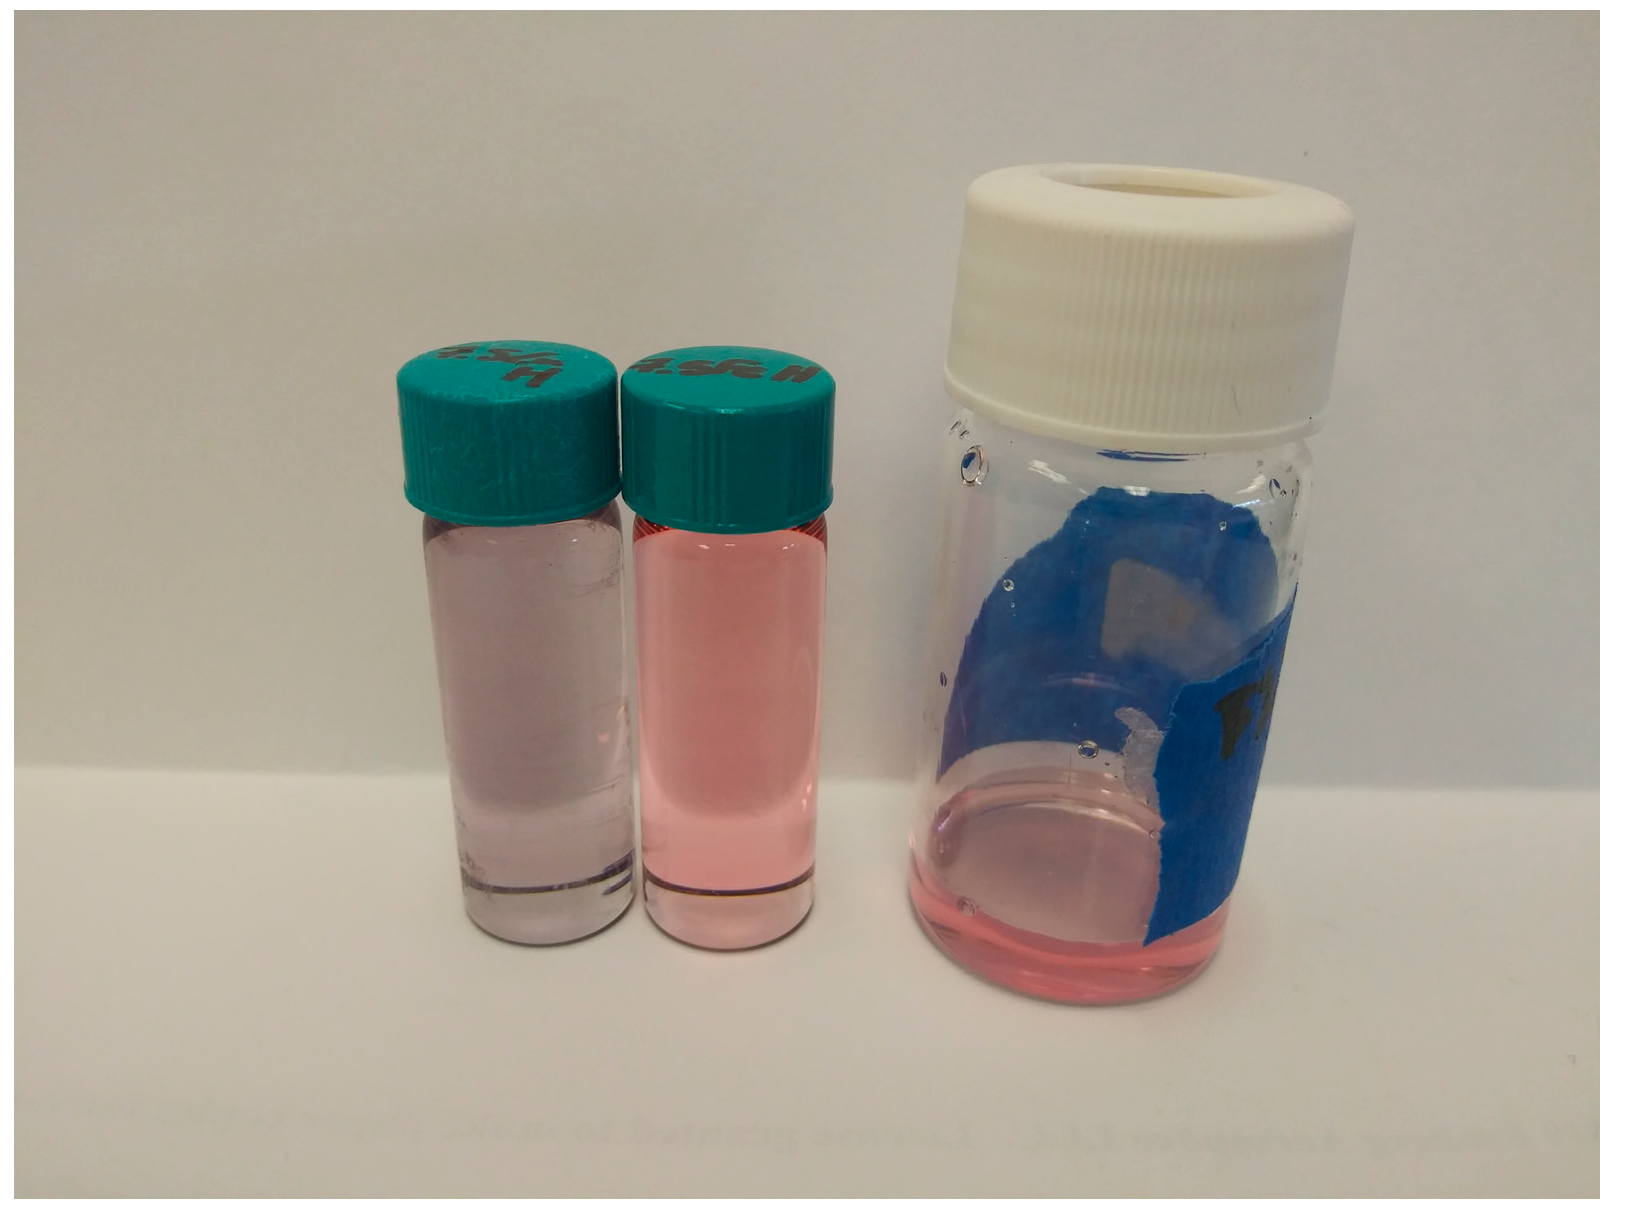
The wavelength of peak absorbance for copper is 742 nm, while those of Fe+Bipy and 1% Bipy-HAN are both 523 nm. Furthermore, the Fe+Bipy and Bipy-HAN samples showed the same secondary peak at 495 nm. The zoomed-in inset shows that there was no significant absorbance at 742 nm in the 1% Bipy in HAN sample. The fluctuations observed in the inset were most likely the amplification of noise by the zero/baseline correction. These results suggest that adding Bipy to a HAN solution with trace iron content causes Fe+Bipy complexes to form with no noticeable copper complexes. This implies that the effect on decomposition rate and activation energy observed due to Bipy were due to chelation and the sequestration of iron. The presence of iron and lack of significant copper complexes in 90% HAN is visually confirmed in Figure A4, where adding Bipy and copper results in a purple solution instead of the expected red-pink color indicative of iron complexes or blue color indicative of copper complexes. In the case of a purple color, both complexes are present.

4. Materials and Methods

4.1. Chemicals

HAN was acquired from Digital Solid State Propulsion in Reno (NV), USA, as a 45–47% by weight aqueous solution. It was concentrated using a rotary evaporator with a water bath set no higher than 323 K. Then, isopropanol was added, forming an azeotrope to assist in the evaporation of water from hygroscopic HAN. The HAN was then crystallized under low vacuum before adding a known quantity of deionized water to produce aqueous samples of 90% w/w HAN. For a detailed description of the drying and crystallizing procedure, see Rasmont’s thesis [41]. The 90% HAN produced for this study was measured to have a mass density of 1.599 g/mL, with a standard deviation of 0.033 g/mL. Care was taken to use glass and polymer containers, pipettes, and probes to reduce contact with metals and prevent further metal contamination of the samples. Using a Sartorius QUINTIX1250-1S scale accurate to 10 μg, a chelating agent additive was added to 90% HAN solution in 0.05, 0.1, 0.5, 1, and 5% by weight quantities.
Ethylenediaminetetraacetic acid (EDTA), triethanolamine (TEA), and 2,2′ bipyridine (Bipy) were chosen to be tested as propellant additives to HAN solutions. EDTA (99.4–100.6%), TEA (≥99%), and Bipy (>99.7%) were purchased from Sigma-Aldrich (now Millipore Sigma). EDTA was chosen for its high complex formation stability constants with many species of metals [20,42], while the latter two were chosen for their ability to form coordinate complexes with iron [19,20,26]. Iron was expected to be one of the most common impurities and among the most effective catalysts for the decomposition of HAN [4,12,13]. Iron (99.9%) and copper (98%) powders with grain sizes of less than 25 μm were purchased from Sigma-Aldrich.

4.2. Instrumentation

Metal impurities in unadulterated HAN were analyzed by inductively coupled plasma mass spectrometry (ICP-MS). Raw HAN as received in 45–47% solution was analyzed for trace metal contents using the PerkinElmer NexION 350D ICP-MS system at the UIUC School of Chemical Sciences Microanalysis Lab. Complexes of Bipy with some transition metals absorb light between 300 and 800 nm wavelengths [26,43]. Light absorbance in the visible spectrum was measured using a Varian Cary 5G spectrophotometer at 1 nm detection intervals. A Hanna Instruments HI98100 pH checker with accuracy of ±0.2 pH was used to measure the pH of the propellant samples.
Thermogravimetric analysis (TGA) is the methodology and equipment for measuring the mass of a sample continuously under a controlled temperature and atmosphere. Isothermal TGA is a constant temperature hold process wherein the mass of the sample is measured as a function of time. Dynamic TGA is a controlled heating process wherein the temperature of the environment and sample is increased at a prescribed rate and the mass of the sample is measured as a function of time. TGA data were acquired using the TA Instruments Q50 machine at the Frederick Seitz Materials Research Laboratory (MRL) at the University of Illinois. The Q50 has a mass sensitivity of 0.1 μg and isothermal temperature accuracy of ±1 °C. A 10 μL volumetric pipette was used to dispense samples to keep the sample weight at 15 ± 2 mg. Isothermal data were acquired at 348 K, and dynamic TGA was performed using 2, 5, 10, 15, and 20 K/min constant heating rates. Each TGA acquisition was done under a nitrogen atmosphere flowing across the sample at 60 mL/min. For a 15 mg sample representative of the constant heating ramp data, the error in mass percent was 0.0006% w/w. For a 30 mg sample representative of the isothermal data, the error in mass percent was 0.0003% w/w.

5. Conclusions

HAN samples using 90% w/w aqueous HAN as solvent were made with and without chelating agent additive. Using data obtainable by the same TGA machine, multiple methods of analysis were performed on these samples, including isothermal TGA and dynamic TGA using multiple constant heating rates, which allowed for the calculation of the isothermal decomposition rate, the decomposition onset temperature, and first order Arrhenius reaction rate parameters. In the present research, 2,2′-bipyridine (Bipy), triethanolamine (TEA), and ethylenediaminetetraacetic acid (EDTA) were studied as 0.05, 0.1, 0.5, 1, and 5% by weight additives in 90% aqueous HAN by weight.
An isothermal decomposition rate of 0.137%/h at 348 K was observed for HAN at 348 K. The addition of 1% Bipy and 1% TEA reduced the isothermal decomposition rates by 20.4% to 0.109%/h and by 3.65% to 0.132%/h, respectively. The addition of 1% EDTA increased the isothermal decomposition rate by 12.4% to 0.154%/h. The isothermal results imply that there are other relevant mechanisms at play, like pH-dependent complex stability and acid dissociation, indicating that chelating ability alone is not a good qualifier for an additive to HAN-based propellant.
Bipy was found to increase the decomposition onset temperature from 454.8 K to 461.8 K, while TEA and EDTA made the this value more unstable without significantly changing it. The first order reaction rates calculated by the Ozawa-Flynn-Wall (OFW) method were found to be insufficient for capturing the effects of the tested additives. The reaction rates did, however, neatly fit into the positive trend of pre-exponential vs. activation energy parameters, due to the kinetic compensation effect. This showed that the decomposition mechanism studied in this work was the same as those in other studies in the literature.
Spectrophotometric results showed that Bipy formed complexes with both copper and iron in solutions at the same equilibrium pH as 90% HAN. Comparing these results with 1% Bipy added to 90% HAN showed that there were trace iron impurities on the order of 1 part per million, and that these formed chelate complexes with the added Bipy. The results of ICP-MS indicated that there may have been other trace metal impurities in the HAN that catalyzed it through a secondary decomposition mechanism.
Bipy, a chelating agent that forms complexes with trace quantities of iron, was found to reduce the decomposition rate of HAN, but only in the low-temperature limit, observed in this study at 348 K. Chelating agents that form stable metal complexes at low pH such as Bipy were shown to increase the storage stability by decreasing the rate of decomposition in the low temperature and long timescale limit. To effectively inhibit the decomposition of HAN, the additive must also have a pKa higher than 2.8, such that no acid dissociation occurs. This effect was observed even at part per million concentrations of metal impurities. In the fast, high-temperature decomposition of HAN, pH plays a much greater role than the effect of complexing metal impurities. Future work should directly investigate the effect of pH-neutralizing additives on the decomposition of HAN to find whether targeting the primary decomposition mechanism can have a greater inhibitive effect in storage conditions.
Supplementary Materials

The following are available online at https://www.mdpi.com/article/10.3390/catal11121488/s1.

Author Contributions

Conceptualization, E.J.B. and J.L.R.; Data curation, E.J.B.; Formal analysis, E.J.B.; Funding acquisition, J.L.R. and S.P.B.; Investigation, E.J.B.; Methodology, E.J.B., J.L.R. and S.P.B.; Project administration, J.L.R.; Resources, J.L.R. and S.P.B.; Supervision, J.L.R. and S.P.B.; Validation, E.J.B.; Visualization, E.J.B.; Writing—original draft, E.J.B.; Writing—review & editing, E.J.B., J.L.R. and S.P.B. All authors have read and agreed to the published version of the manuscript.

Funding

This research was partially funded by the National Aeronautics and Space Administration, grant number 80NSSC18C0074.

Data Availability Statement

Isothermal and dynamic TGA data presented in this study are contained within the article or supplementary material.

Acknowledgments

This work was carried out in part in the Materials Research Laboratory Central Research Facilities, University of Illinois with special thanks to Roddel Remy for instructive and helpful discussion regarding the use of the TGA instrument. The authors would also like to thank the crew of the UIUC Aerospace Engineering Machine Shop for their support in developing our experiment. Additional thanks are due to undergraduate research assistant Anna Hylbert who was a great help in sample preparation and collection of spectrophotometry data.

Conflicts of Interest

The authors declare no conflict of interest. The funders had no role in the design of the study; in the collection, analyses, or interpretation of data; in the writing of the manuscript, or in the decision to publish the results.

Appendix A. Photos of Bipy Complexes

Samples were made with approximately 100 ppm of copper in nitric acid, with Bipy added in varying mole ratios to the copper. As confirmed by the presented spectrophotometry results, Bipy complexing with copper appears a pale blue, shown in Figure A1.
Figure A1. Photograph of samples with 100 ppm Cu with 2, 3, 5, and 10 times as many moles of Bipy added respectively, from left to right in HNO3 solution.
Catalysts 11 01488 g0a1
Using the same procedure with 100 ppm iron and varying the mole ratio of Bipy added, samples are a deep red instead, shown in Figure A2. Chelate complexes with different metals absorb different wavelengths of light and appear different colors in solution. In the case of Bipy, copper complexes appear a pale blue and iron complexes appear red.
Figure A2. Photograph of samples with 100 ppm Fe with 1, 2, 3, 5, 7.5, and 10 times as many moles of Bipy added respectively, from left to right in HNO3 solution.
Catalysts 11 01488 g0a2
The above samples in nitric acid are compared with HAN samples without any user-added metals. In Figure A3, a 90% aqueous HAN sample is compared with other 90% HAN samples with 0.05%, 0.1%, 0.5%, 1%, and 5% Bipy added. The pale red color indicates the presence of trace quantities of iron available to form complexes with the added Bipy. HAN with TEA or EDTA added does not change color and remains the same clear color as the 90% HAN sample in Figure A3. TEA and EDTA complexes with metals are not expected to change color in the visible spectrum.
Figure A3. Photograph of 90% w/w HAN + water samples no additive, 0.05%, 0.1%, 0.5%, 1%, and 5% Bipy respectively, from left to right.
Catalysts 11 01488 g0a3
Following the same procedure as the added metal and Bipy to a nitric acid solution, copper and iron was added to a HAN solution. Figure A4 shows two of these samples compared with the same 1% Bipy sample as in Figure A3. Shown by the sample in the middle, when additional iron is added to HAN with Bipy added, the color of the solution is practically indistinguishable as reflected by the spectrophotometry results. When additional copper is added instead of iron, it forms complexes that appear pale blue which compete with the pale red of the iron complex to present as a pale purple solution. This visually confirms the presence of iron impurities and that they are complexed by Bipy added to HAN solutions.
Figure A4. Photograph of samples with 7.5 mole ratio of Bipy:Cu and Bipy:Fe compared with 1% Bipy all in 90% HAN solution.
Catalysts 11 01488 g0a4

References

  1. Masse, R.K.; Spores, R.A.; Allen, M. AF-M315E Advanced Green Propulsion—GPIM and Beyond. In Proceedings of the AIAA Propulsion and Energy 2020 Forum, Virtual Event, 24–28 August 2020. [Google Scholar]
  2. Hori, K.; Katsumi, T.; Sawai, S.; Azuma, N.; Hatai, K.; Nakatsuka, J. HAN-based Green Propellant, SHP163—Its R&D and Test in Space. Propellants Explos. Pyrotech. 2019, 44, 1–5. [Google Scholar]
  3. Hansen, R.; Backof, E.; de Greiff, H.J. Process for Assessing the Stability of HAN-Based Liquid Propellants; European Research Office of the U.S. Army: London, UK, 1989. [Google Scholar]
  4. Harlow, D.G.; Felt, R.E.; Agnew, S.; Barney, G.S.; McKibben, J.M.; Garber, R.; Lewis, M. Technical Report on Hydroxylamine Nitrate; U.S. Department of Energy: Washington, DC, USA, 1998.
  5. Lee, H.; Litzinger, T.A. Chemical Kinetic Study of HAN Decomposition. Combust. Flame 2003, 135, 151–169. [Google Scholar] [CrossRef]
  6. Zhang, K.; Thynell, S.T. Thermal Decomposition Mechanism of Aqueous Hydroxylammonium Nitrate (HAN): Molecular Simulation and Kinetic Modeling. J. Phys. Chem. 2018, 122, 8086–8100. [Google Scholar] [CrossRef] [PubMed]
  7. Agnihotri, R.; Oommen, C. Cerium Oxide Based Active Catalyst for Hydroxylammonium Nitrate (HAN) Fueled Monopropellant Thrusters. RSC Adv. 2018, 8, 22293–22302. [Google Scholar] [CrossRef] [Green Version]
  8. Wainwright, M.J.; Rovey, J.L.; Miller, S.W.; Prince, B.D.; Berg, S.P. Hydroxylammonium Nitrate Species in a Monopropellant Electrospray Plume. J. Propuls. Power 2019, 35, 922–929. [Google Scholar] [CrossRef]
  9. Glascock, M.S.; Drew, P.D.; Rovey, J.L. Thermodynamic and Transport Properties of Hydroxylammonium Nitrate-Based Electric Solid Propellant Vapor. In Proceedings of the AIAA SciTech Forum, San Diego, CA, USA, 7–11 January 2019. [Google Scholar]
  10. Rasmont, N.; Broemmelsiek, E.J.; Rovey, J.L. Linear Burn Rate of Green Ionic Liquid Multimode Monopropellant. Combust. Flame 2020, 219, 212–224. [Google Scholar] [CrossRef]
  11. Katsumi, T.; Hori, K. Successful Development of HAN Based Green Propellant. Energetic Mater. Front. 2021, 2, 228–237. [Google Scholar] [CrossRef]
  12. Schmidt, E.W. Hydroxylammonium Nitrate Compatibility Tests with Various Materials; U.S. Army Ballistic Research Laboratory: Aberdeen, MD, USA, 1990. [Google Scholar]
  13. Amrousse, R.; Kagawa, H.; Hatai, K.; Ikeda, H.; Hori, K. The Effect of Iron Metal Ions and Chelating Agents of Iron on the Thermal Decomposition of HAN-Based Liquid Monopropellant. In Proceedings of the AIAA Joint Propulsion Conference, Orlando, FL, USA, 27–29 July 2015. [Google Scholar]
  14. Zhang, C. Thermal Decomposition Study of Hydroxylamine Nitrate during Storage and Handling; Texas A&M University: College Station, TX, USA, 2006. [Google Scholar]
  15. Hoyani, S.; Patel, R.; Oommen, C.; Rajeev, R. Thermal Stability of Hydroxylammonium Nitrate (HAN). J. Therm. Anal. Calorim. 2017, 129, 1083–1093. [Google Scholar] [CrossRef]
  16. Ferguson, R.E.; Esparza, A.; Shafirovich, E. Combustion of Aqueous HAN/Methanol Propellants at High Pressures. Proc. Combust. Inst. 2021, 38, 3295–3302. [Google Scholar] [CrossRef]
  17. Berg, S.P.; Rovey, J.L. Decomposition of Monopropellant Blends of Hydroxylammonium Nitrate and Imidazole-Based Ionic Liquid Fuels. J. Propuls. Power 2013, 29, 125–135. [Google Scholar] [CrossRef]
  18. Heneghan, S.P.; Zabarnick, S.; Ballal, D.R.; Harrison, W.E., III. JP-8+100: The Development of High-Thermal-Stability Jet Fuel. Trans. ASME 1996, 118, 170–179. [Google Scholar]
  19. Da Costa Ferreira, A.M.; De Oliveira Duarte, L.L. The Effect of Triethanolamine on the Iron(III)-Catalysed Decomposition of Hydrogen Peroxide. J. Coord. Chem. 1991, 24, 339–350. [Google Scholar] [CrossRef]
  20. Bell, C.F. Principles and Applications of Metal Chelation; Oxford University Press: Oxford, UK, 1977. [Google Scholar]
  21. Goyer, R.A.; Clarkson, T.W. Toxic Effects of Metals, in Casarett & Doull's Toxicology: The Basic Science of Poisons; McGraw-Hill: New York, NY, USA, 2001; pp. 811–867. [Google Scholar]
  22. Siegert, W. Boosting the Antimicrobial Efficiency of Multifunctional Additives by Chelating Agents. Int. J. Appl. Sci. 2014, 140, 1–6. [Google Scholar]
  23. Hart, J.R. EDTA-Type Chelating Agents in Everyday Consumer Products: Some Food, Cleaning and Photographic Applications. J. Chem. Educ. 1985, 62, 75–76. [Google Scholar] [CrossRef]
  24. Asemave, K. Greener Chelators for Recovery of Metals and Other Applications. Org. Med. Chem. 2018, 6, 555694. [Google Scholar] [CrossRef]
  25. Striebich, R.C.; Grinstead, B.; Zabarnick, S. Quantitation of a Metal Deactivator Additive by Derivatization and Gas Chromatography-Mass Spectrometry. J. Chromatogr. Sci. 2000, 38, 393–398. [Google Scholar] [CrossRef] [Green Version]
  26. Schilt, A.A. Analytical Applications of 1,10-Phenanthroline and Related Compounds; Pergamon Press: Oxford, UK, 1969. [Google Scholar]
  27. Aluker, N.L.; Herrmann, M.E.; Suzdaltseva, I.M. A Spectroscopic Study of Nitrate and Nitrite Salts and Their Aqueous Solutions. Opt. Spectrosc. 2019, 127, 906–911. [Google Scholar] [CrossRef]
  28. Rafeev, V.A.; Rubtsov, Y.I. Kinetics and mechanism of thermal decomposition of hydroxylammonium nitrate. Russ. Chem. Bull. 1993, 42, 1811–1815. [Google Scholar] [CrossRef]
  29. Artman, J.I.; Ott, J.B. Solid + liquid phase equilibria in the hydroxylammonium nitrate + water system. J. Energetic Mater. 1989, 7, 115–132. [Google Scholar] [CrossRef]
  30. Krishnan, C.V.; Creutz, C.; Schwarz, H.A.; Sutin, N. Reduction Potentials for 2,2′-Bipyridine and 1,10-Phenanthroline Couples in Aqueous Solutions. J. Am. Chem. Soc. 1983, 105, 5617–5623. [Google Scholar] [CrossRef]
  31. Simond, M.R.; Ballerat-Busserolles, K.; Coulier, Y.; Rodier, L.; Coxam, J.-Y. Dissociation Constants of Protonated Amines in Water at Temperatures from 293.15 K to 343.15 K. J. Solut. Chem. 2011, 41, 130–142. [Google Scholar] [CrossRef]
  32. Raaflaub, J. Applications of Metal Buffers and Metal Indicators in Biochemistry. In Methods of Biochemical Analysis; Interscience Publishers, Inc.: Hoboken, NJ, USA, 1956; Volume 3, pp. 301–325. [Google Scholar]
  33. Garn, P.D. An Examination of the Kinetic Compensation Effect. J. Therm. Anal. 1975, 7, 475–478. [Google Scholar] [CrossRef]
  34. Zsakó, J. The Kinetic Compensation Effect. J. Therm. Anal. 1976, 9, 101–108. [Google Scholar] [CrossRef]
  35. Brill, T.B.; Gongwer, P.E.; Williams, G.K. Thermal Decomposition of Energetic Materials. 66. Kinetic Composition Effects in HMX, RDX, and NTO. J. Phys. Chem. 1994, 98, 12242–12247. [Google Scholar] [CrossRef]
  36. Ozawa, T. A New Method of Analyzing Thermogravimetric Data. Bull. Chem. Soc. Jpn. 1965, 38, 1881–1886. [Google Scholar] [CrossRef] [Green Version]
  37. Flynn, J.H.; Wall, L.A. A Quick, Direct Method for the Determination of Activation Energy from Thermogravimetric Data. J. Polym. Sci. 1966, 4, 323–328. [Google Scholar] [CrossRef]
  38. Sauerbrunn, S.; Gill, P. Decomposition Kinetics Using TGA; TA Instruments: New Castle, DE, USA, 1992. [Google Scholar]
  39. ASTM International. Standard Test Method for Decomposition Kinetics by Thermogravimetry Using the Ozawa/Flynn/Wall Method; ASTM Committee on Thermal Measurements: West Conshohocken, PA, USA, 2016. [Google Scholar]
  40. Vyazovkin, S.; Burnham, A.K.; Criado, M.J.; Pérez-Maqueda, L.A.; Popescu, C.; Sbirrazzuoli, N. ICTAC Kinetics Committee Recommendations for Performing Kinetic Computations on Thermal Analysis Data. Thermochim. Acta 2011, 520, 1–19. [Google Scholar] [CrossRef]
  41. Rasmont, N. Linear Burn Rate of Green Ionic Liquid Multimode Monopropellant; University of Illinois at Urbana-Champaign: Urbana, IL, USA, 2019. [Google Scholar]
  42. Popov, K.; Rönkkömäki, H.; Lajunen, L.H.J. Critical Evalutation of Stability Constants of Phosphonic Acids. Pure Appl. Chem. 2001, 73, 1641–1677. [Google Scholar] [CrossRef]
  43. Constable, E.C.; Housecroft, C.E. The Early Years of 2,2′-Bipyridine—A Ligand in Its Own Lifetime. Molecules 2019, 24, 3951. [Google Scholar] [CrossRef] [Green Version]
Figure 1. pH of HAN samples with chelating additives measured at room temperature.
Catalysts 11 01488 g001
Figure 2. Absorption spectrum of 1% w/w Bipy in 90% w/w aqueous HAN compared to no additive.
Catalysts 11 01488 g002
Figure 3. Absorption spectra of (a) Bipy:Cu and (b) Bipy:Fe samples of different mole ratios in nitric acid.
Catalysts 11 01488 g003aCatalysts 11 01488 g003b
Figure 4. Isothermal TGA data for 90% aqueous HAN with and without additives in 1% concentrations.
Catalysts 11 01488 g004
Figure 5. A dynamic TGA thermogram of a 10 K/min constant heating ramp applied to 90% aqueous HAN with tangent lines at maximum and minimum mass loss rate for the HAN decomposition event showing the location of the decomposition onset temperature at 452.9 K.
Catalysts 11 01488 g005
Figure 6. Decomposition onset temperatures of 90% HAN with and without additives: (a) Bipy; (b) TEA; (c) EDTA; (d) 90% aqueous HAN without additive.
Catalysts 11 01488 g006aCatalysts 11 01488 g006b
Figure 7. Bar graph comparing decomposition onset temperature averages and ranges for data above 10 K/min heating rate.
Catalysts 11 01488 g007
Figure 8. Arrhenius plot of log heating rate vs. inverse temperature for of 90% aqueous HAN sample with linear fit shown.
Catalysts 11 01488 g008
Figure 9. Parameters for the Arrhenius reaction rate calculated from dynamic TGA using Ozawa/Flynn/Wall method. (a) Activation energy in kJ/mol with error; (b) Natural logarithm of Frequency factor/pre-exponential in s−1 parameter with error.
Catalysts 11 01488 g009
Figure 10. Literature review by Zhang [6] comparing the Arrhenius parameters of various HAN samples with their analytical prediction. No additive (90% aqueous) HAN, Bipy, TEA, and EDTA additive data from this work were compared.
Catalysts 11 01488 g010
Figure 11. Arrhenius reaction rates calculated using the data in Figure 9 and a temperature of 348 K.
Catalysts 11 01488 g011
Figure 12. Comparison of absorbance spectra of 1% w/w Bipy in 90% HAN to samples of Bipy+Fe and Bipy+Cu in nitric acid solution, normalized to the peak absorbance for comparison of peak wavelength values.
Catalysts 11 01488 g012
Table 1. Elemental concentration detected by ICP-MS of 45–47% w/w HAN solution, ppm.
ElementRaw HAN
Cu0.10
Zn0.26
Ca5.07
Fe0.49
Na5.88
Mg0.18
Ti0.39
Al2.01
Ba0.21
Mo0.73
Se0.75
Mn0.54
V0.23
Ni0.37
Sn1.91
Si5.35
As0.28
Table 2. 348 K Isothermal TGA test parameters and linear fit results for 1% additive samples.
SampleInitial Mass, mgMass Loss Rate, %/hChange in Mass Loss Rate, %R-Squared
no additive33.280.1370%0.9997
1% Bipy30.100.111−20.4%0.9988
1% TEA31.270.132−3.65%0.9998
1% EDTA29.180.15412.4%0.9971
Table 3. Acid dissociation constants of selected ligand species at 298 K [30,31,32].
Additive SpeciespKa
Bipy(H+)4.4
TEA(H+)7.74
H4EDTA2
H3EDTA2.7
Publisher’s Note: MDPI stays neutral with regard to jurisdictional claims in published maps and institutional affiliations.