
Stabilization of Pt in SiO2–Al2O3 Microspheres at High Mechanical Resistance, Promoted with W Oxides for the Combustion of CO


Abstract
:1. Introduction
2. Results and Discussion
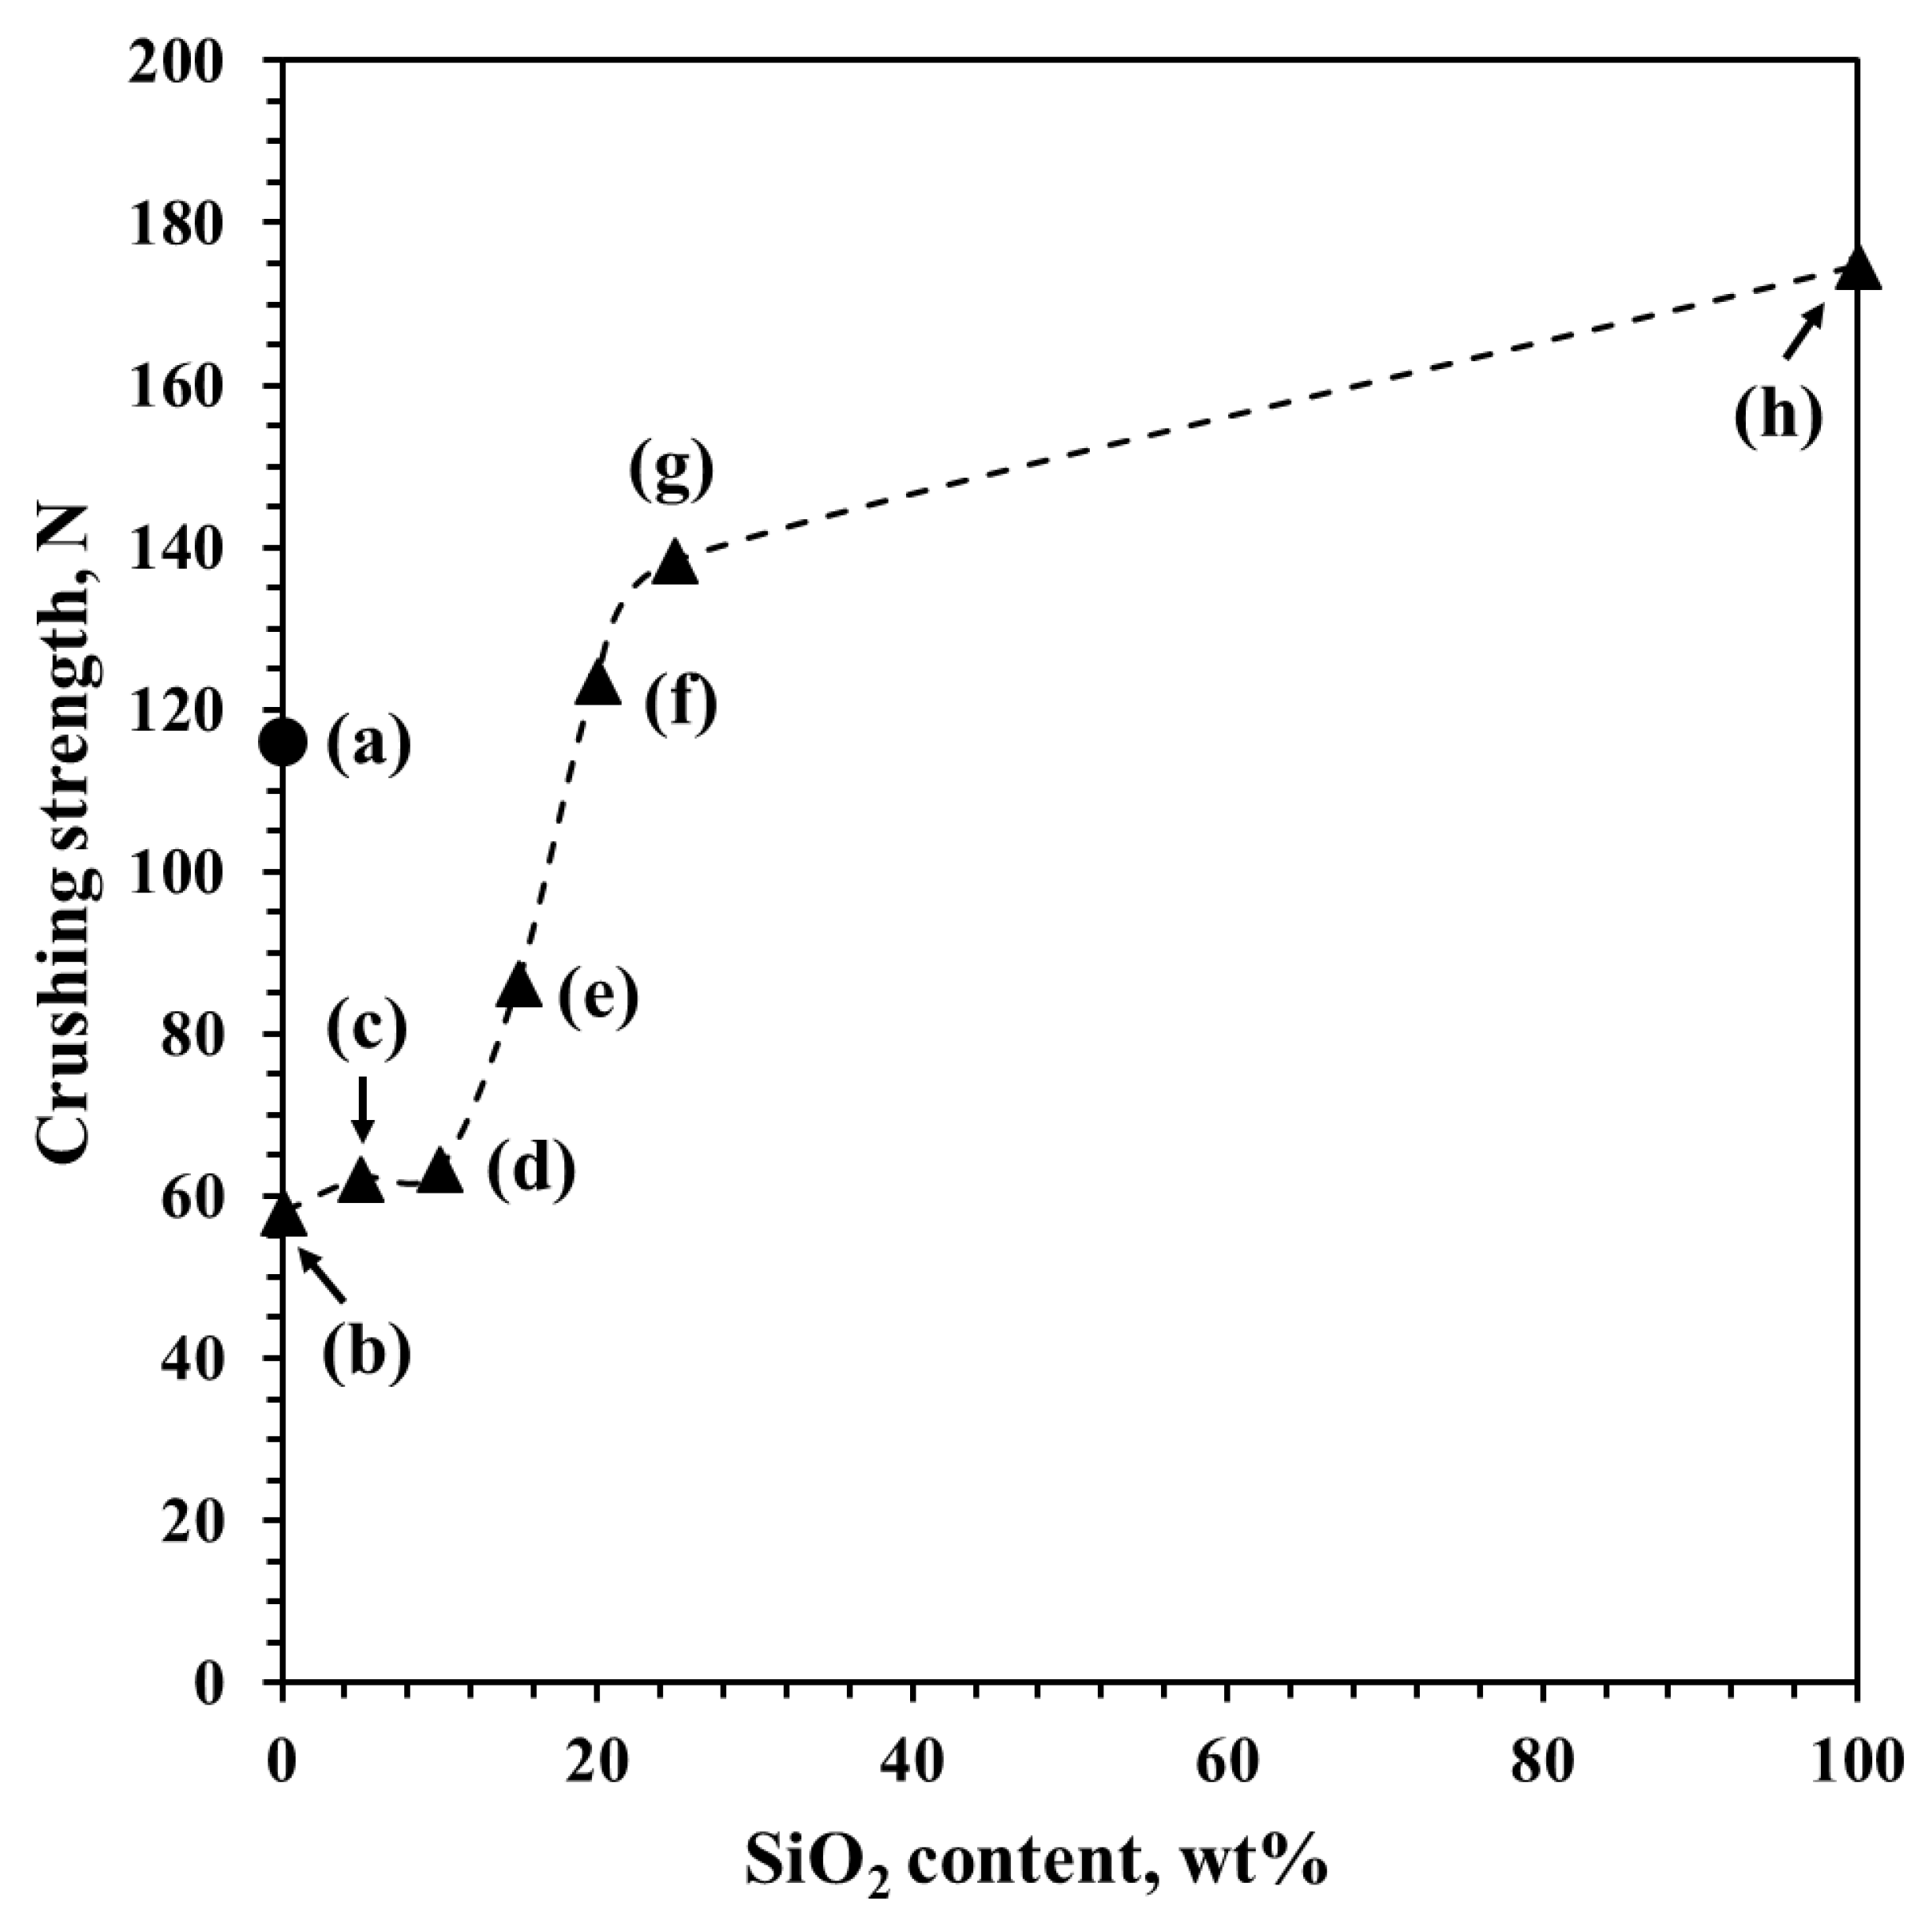
2.1. Crushing Strength of the SiO2–Al2O3 Macrospheres
2.2. Jet-Cup Attrition Tests of the SiO2–Al2O3 Microspheres
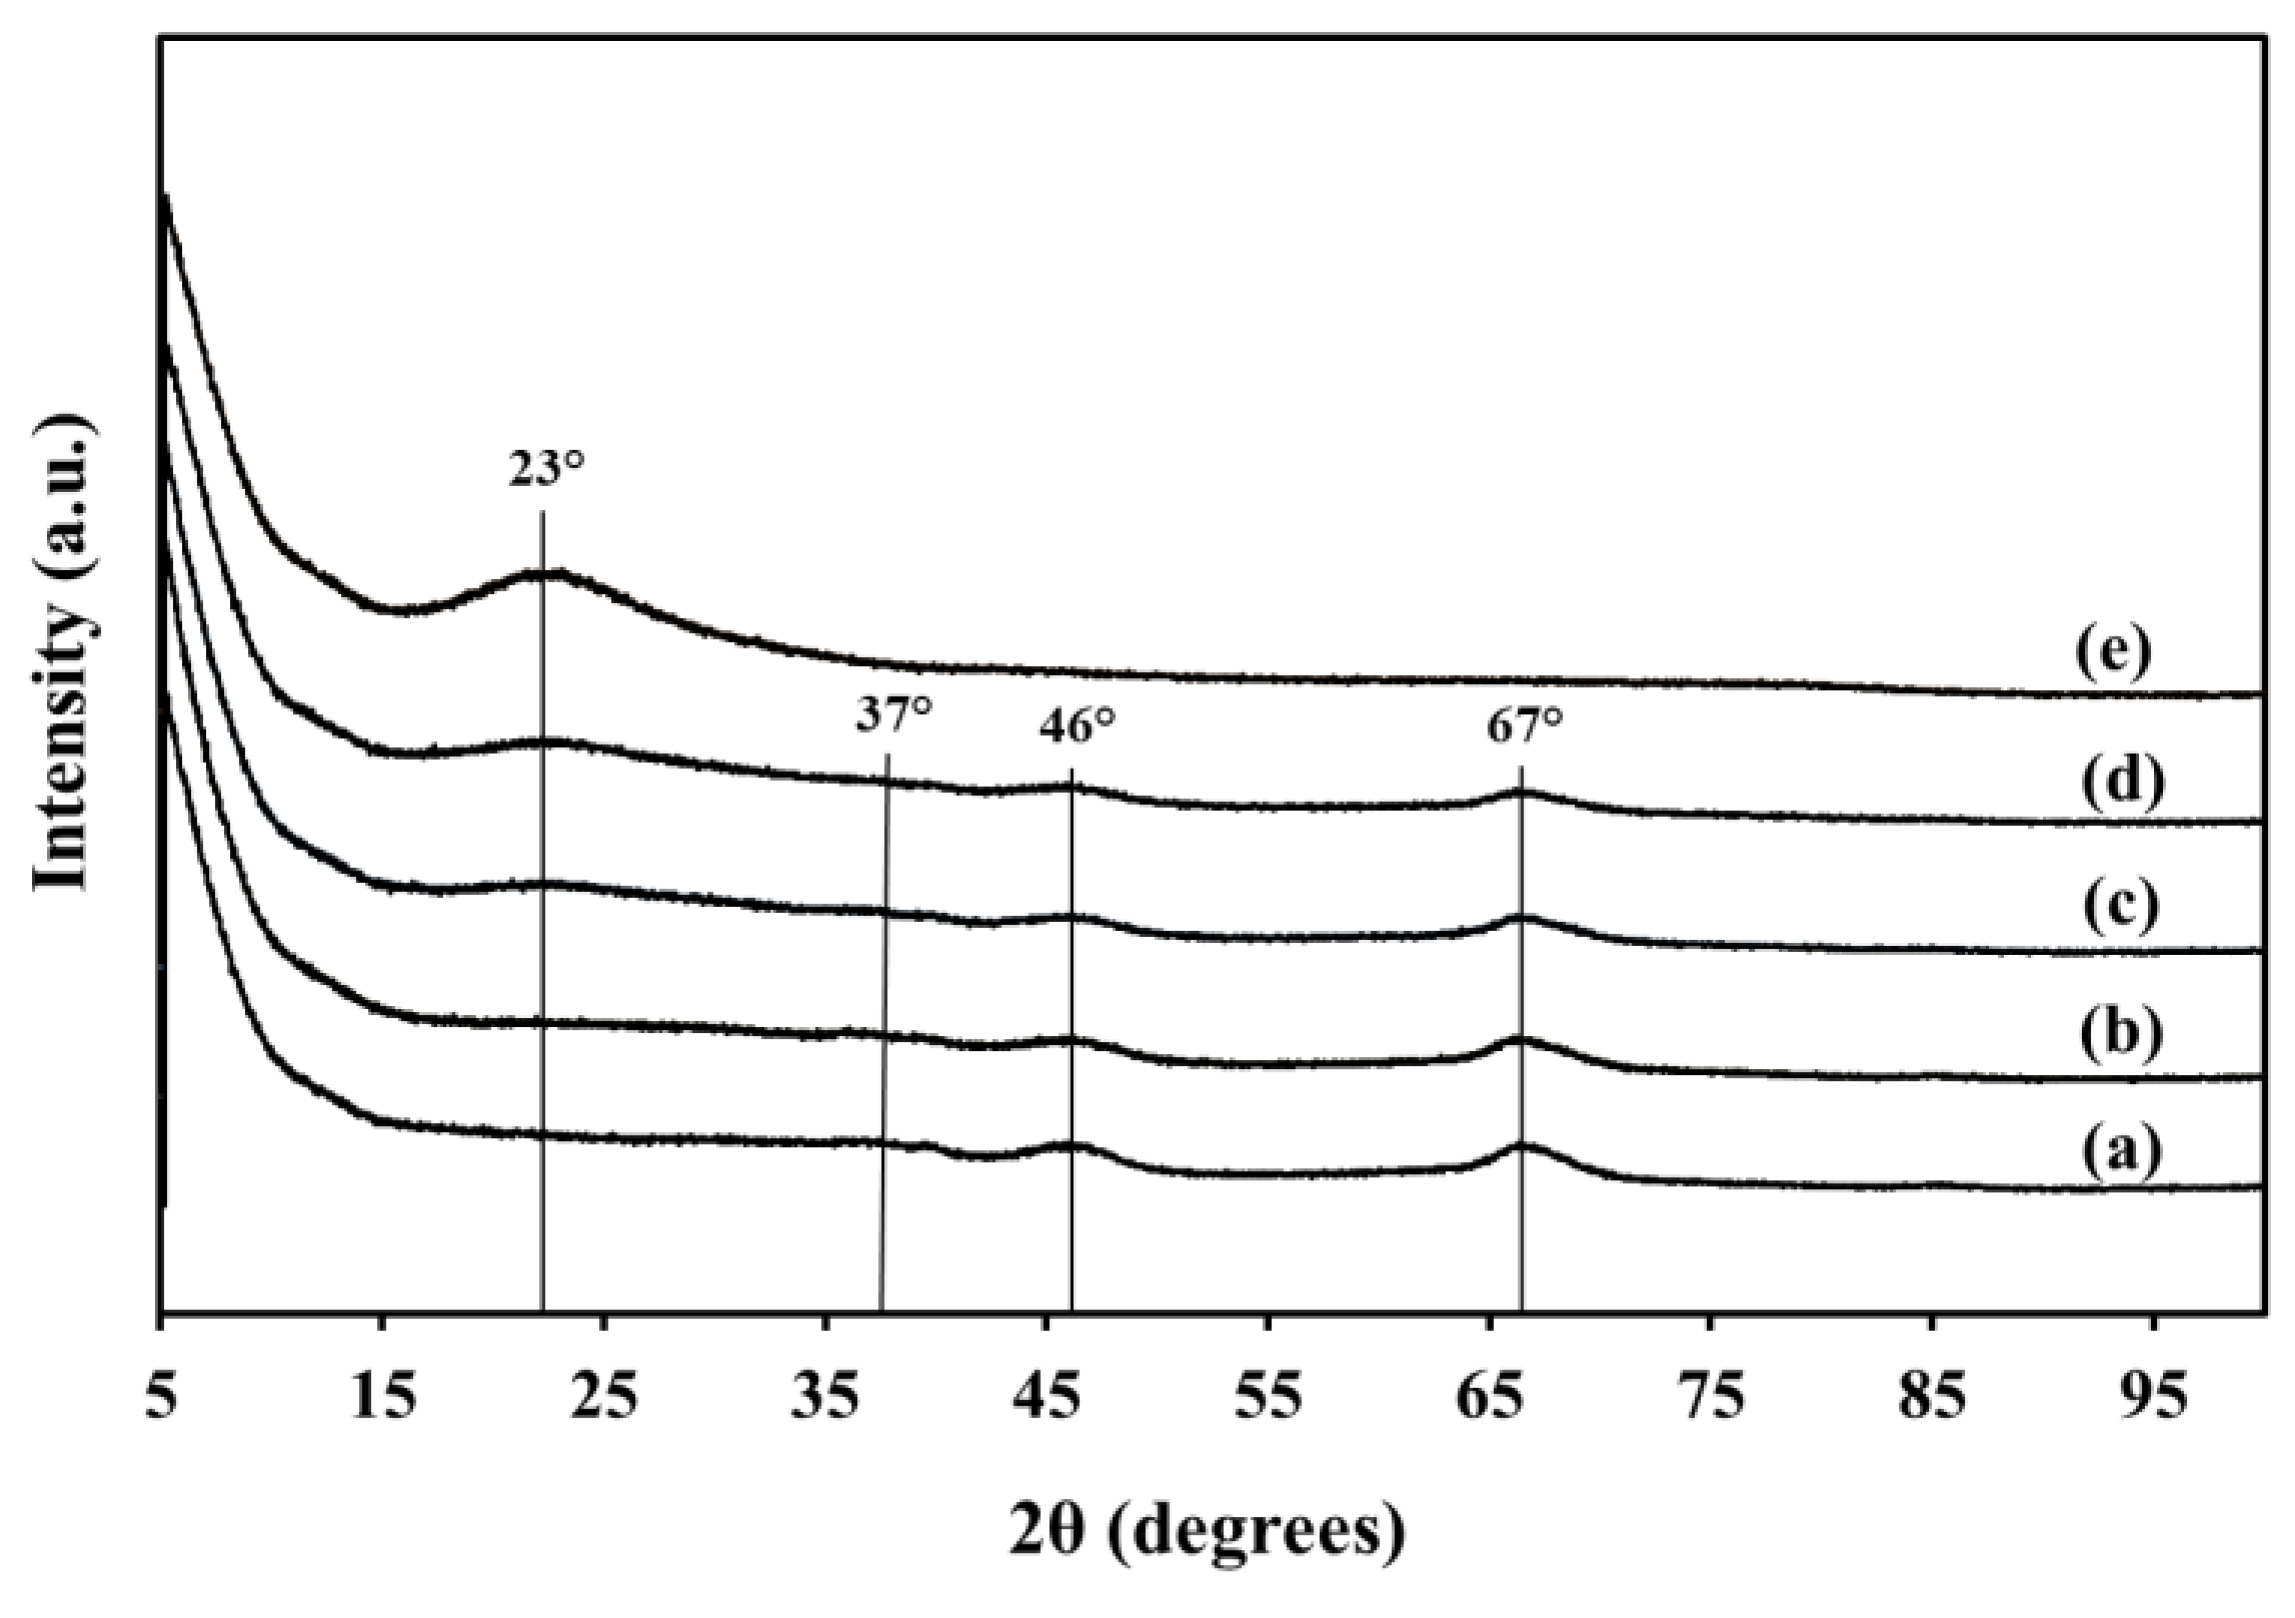
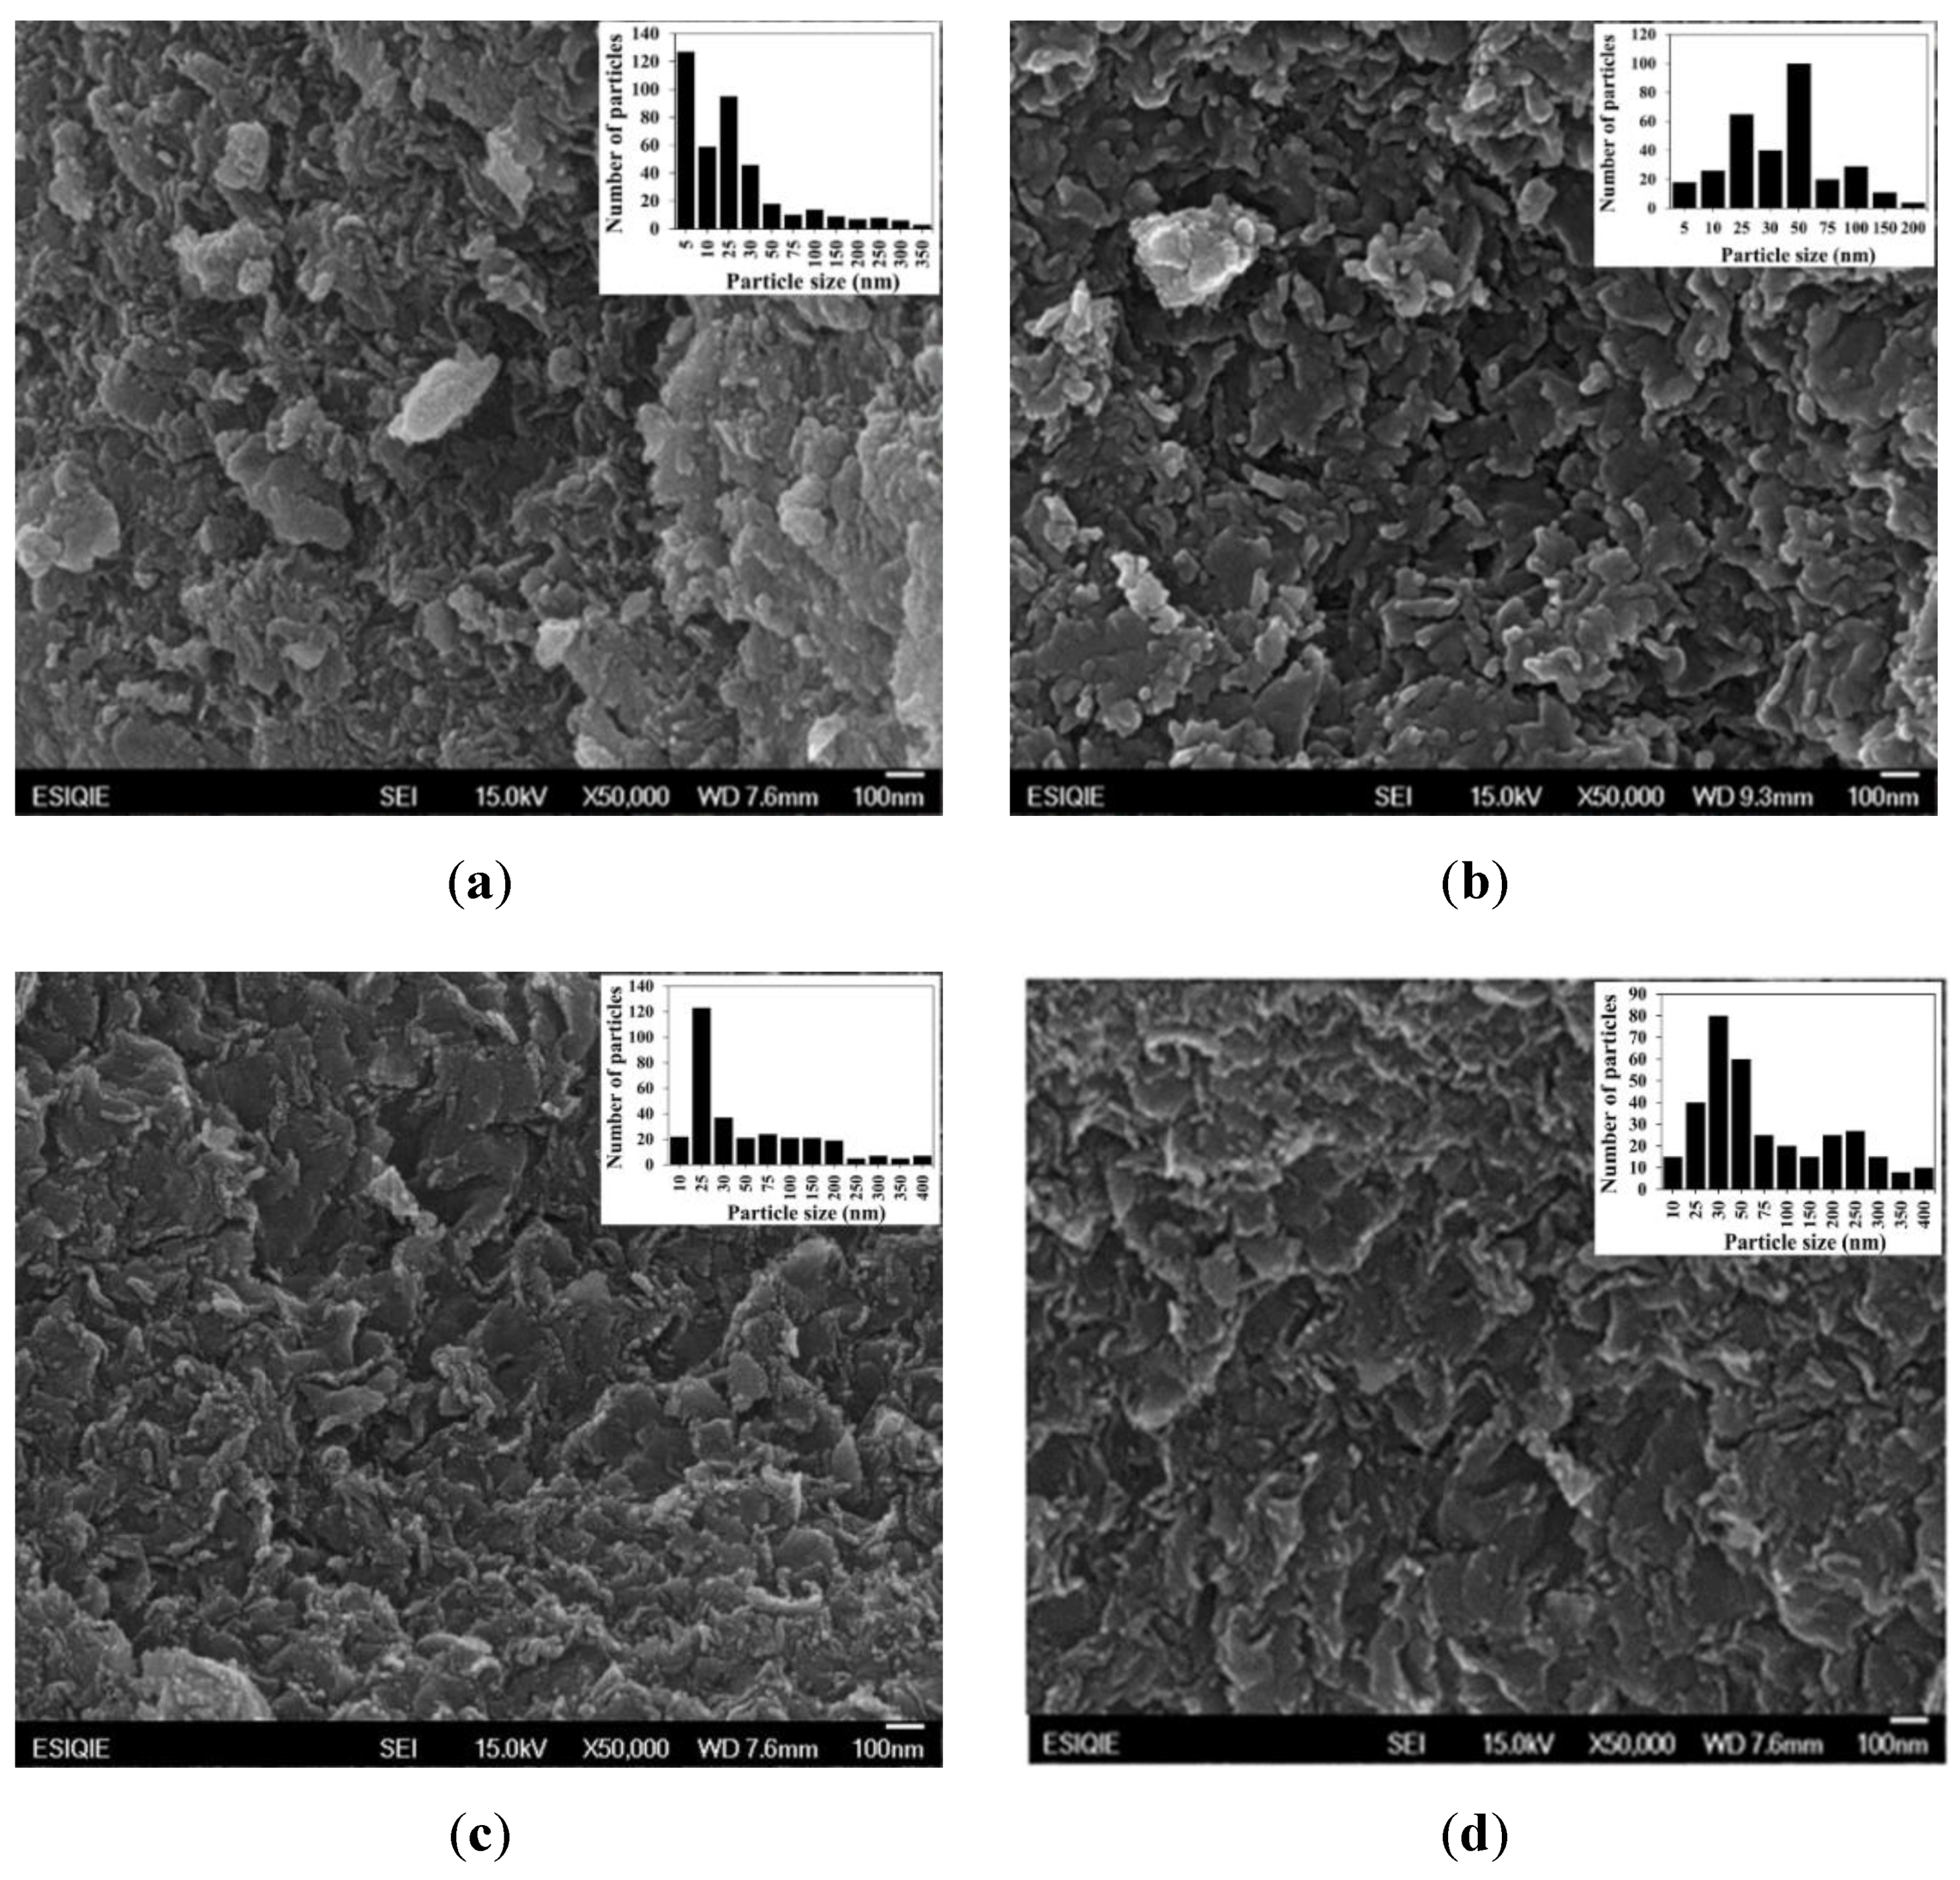
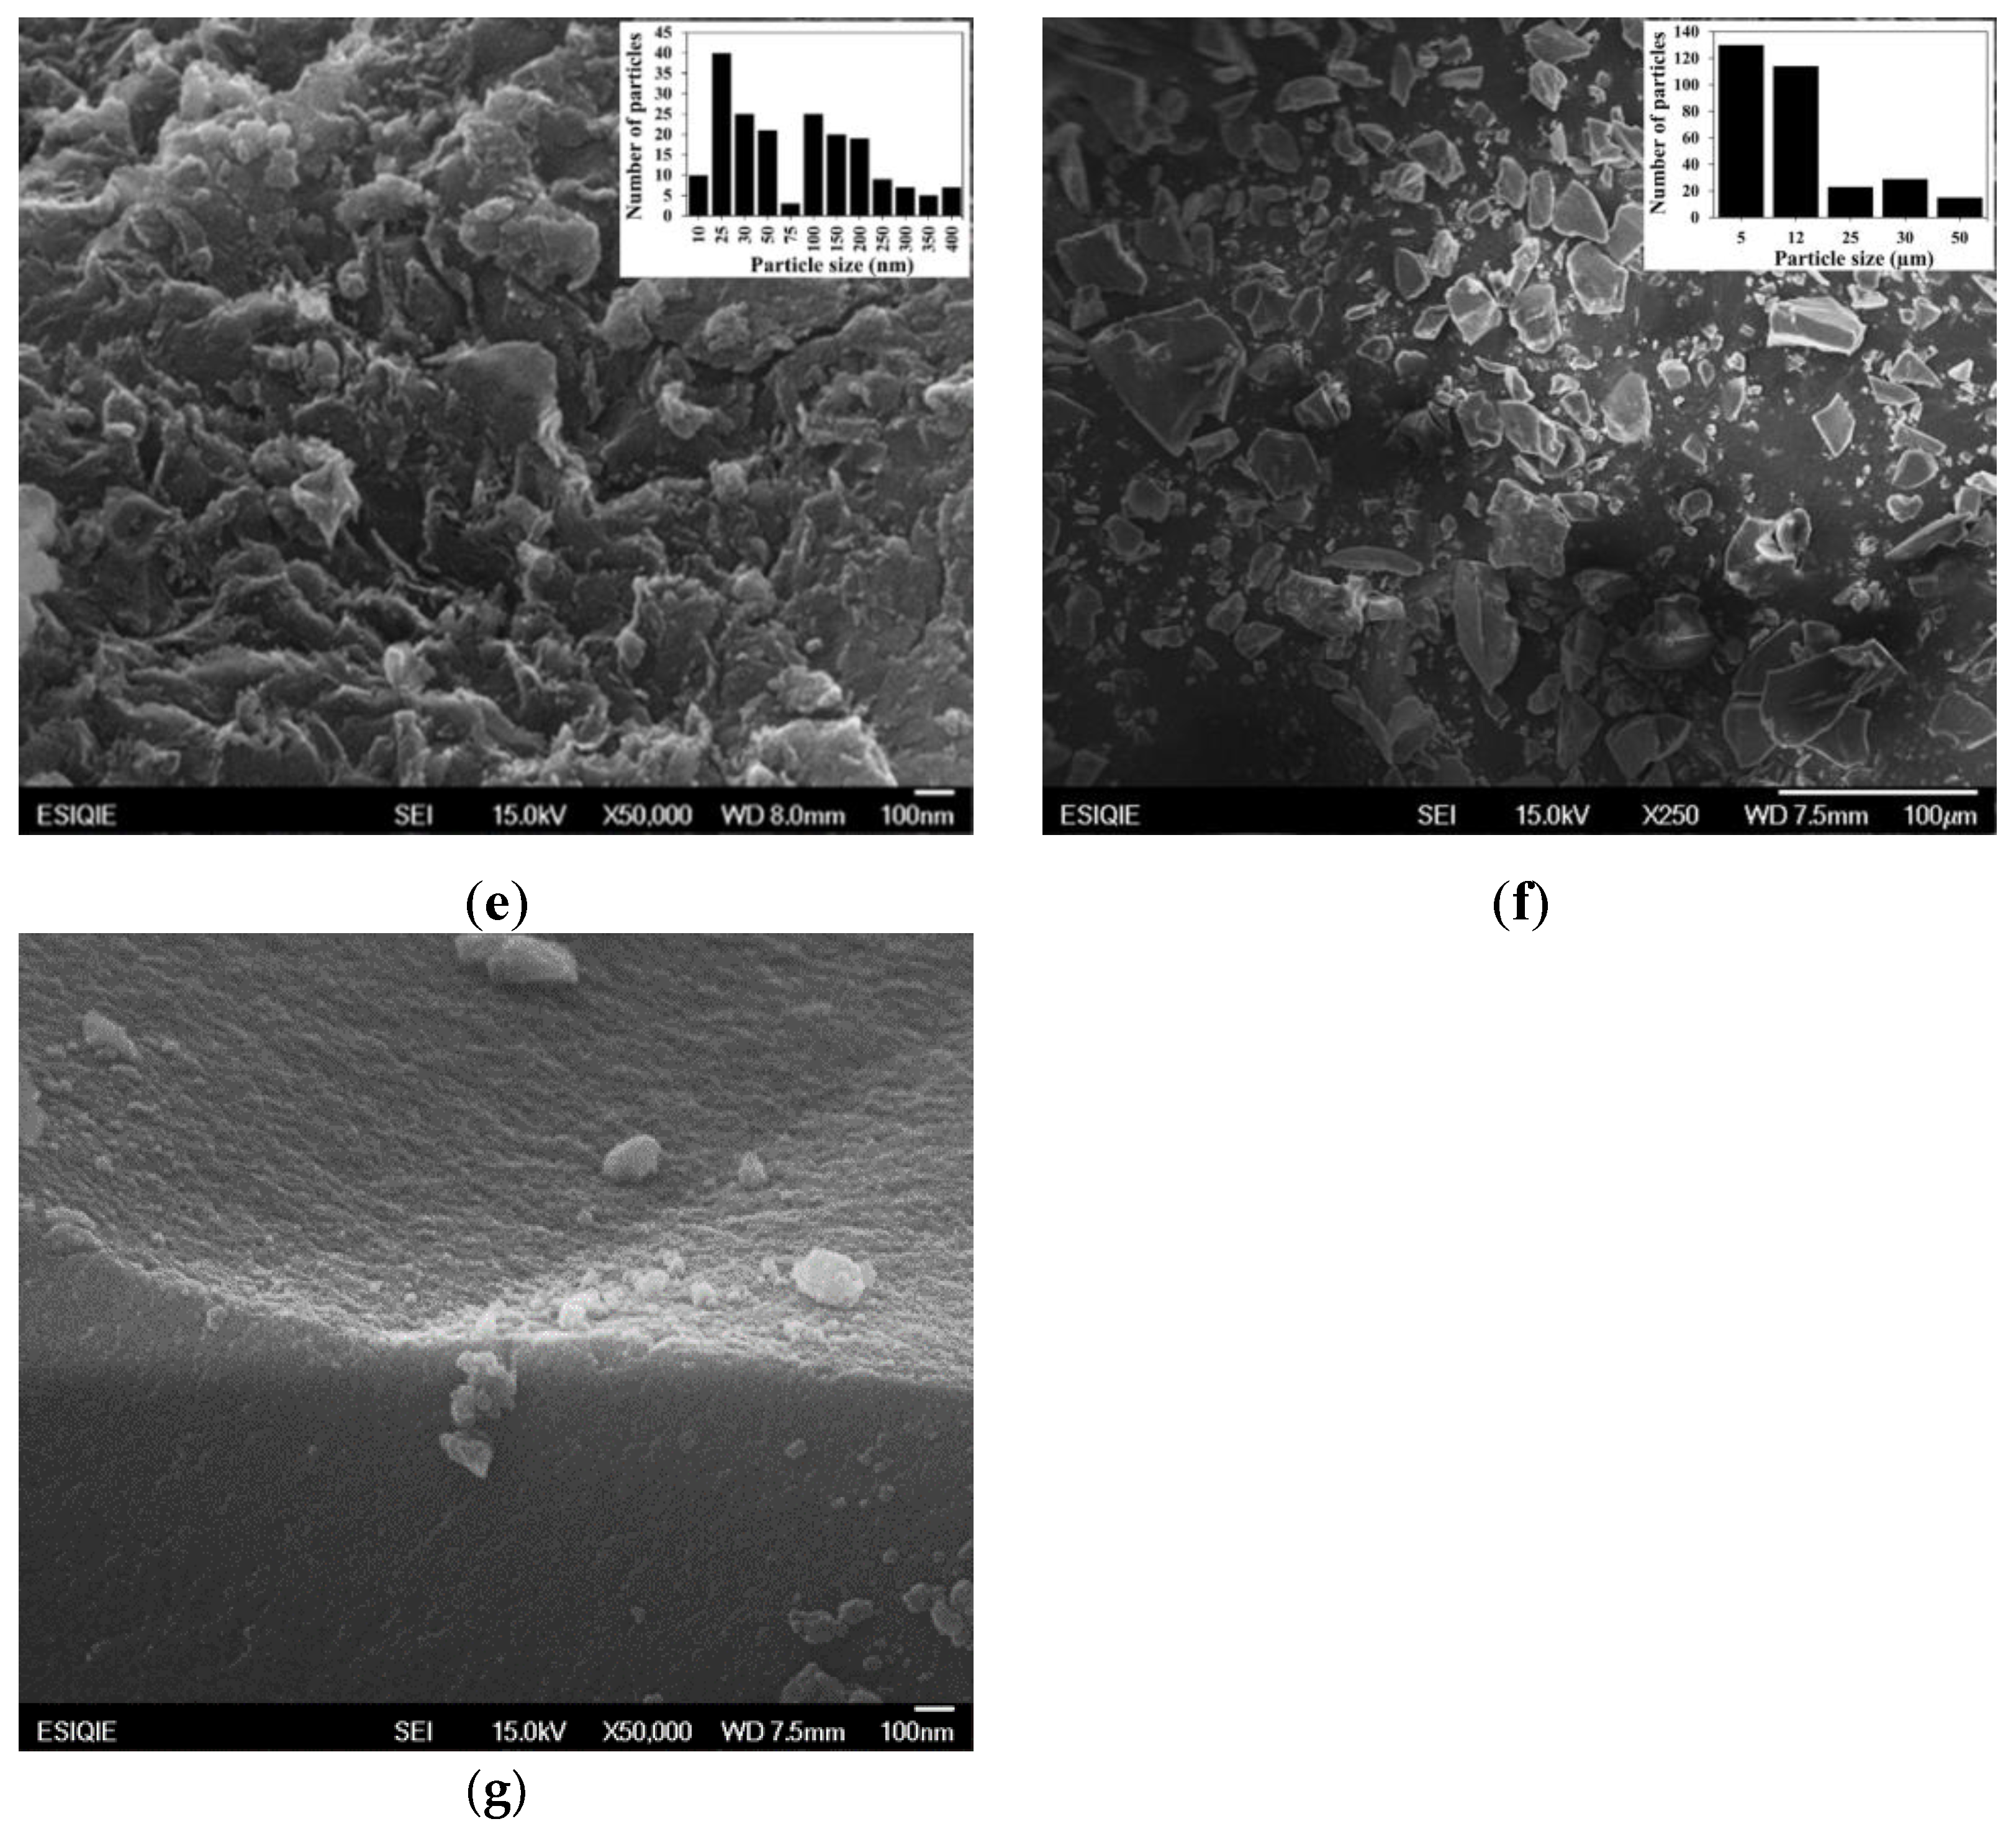
2.3. Characterization of Oxides SiO2–Al2O3
2.4. Effect of theW Content on the BET Area of the 25SA–WOx Microspheres
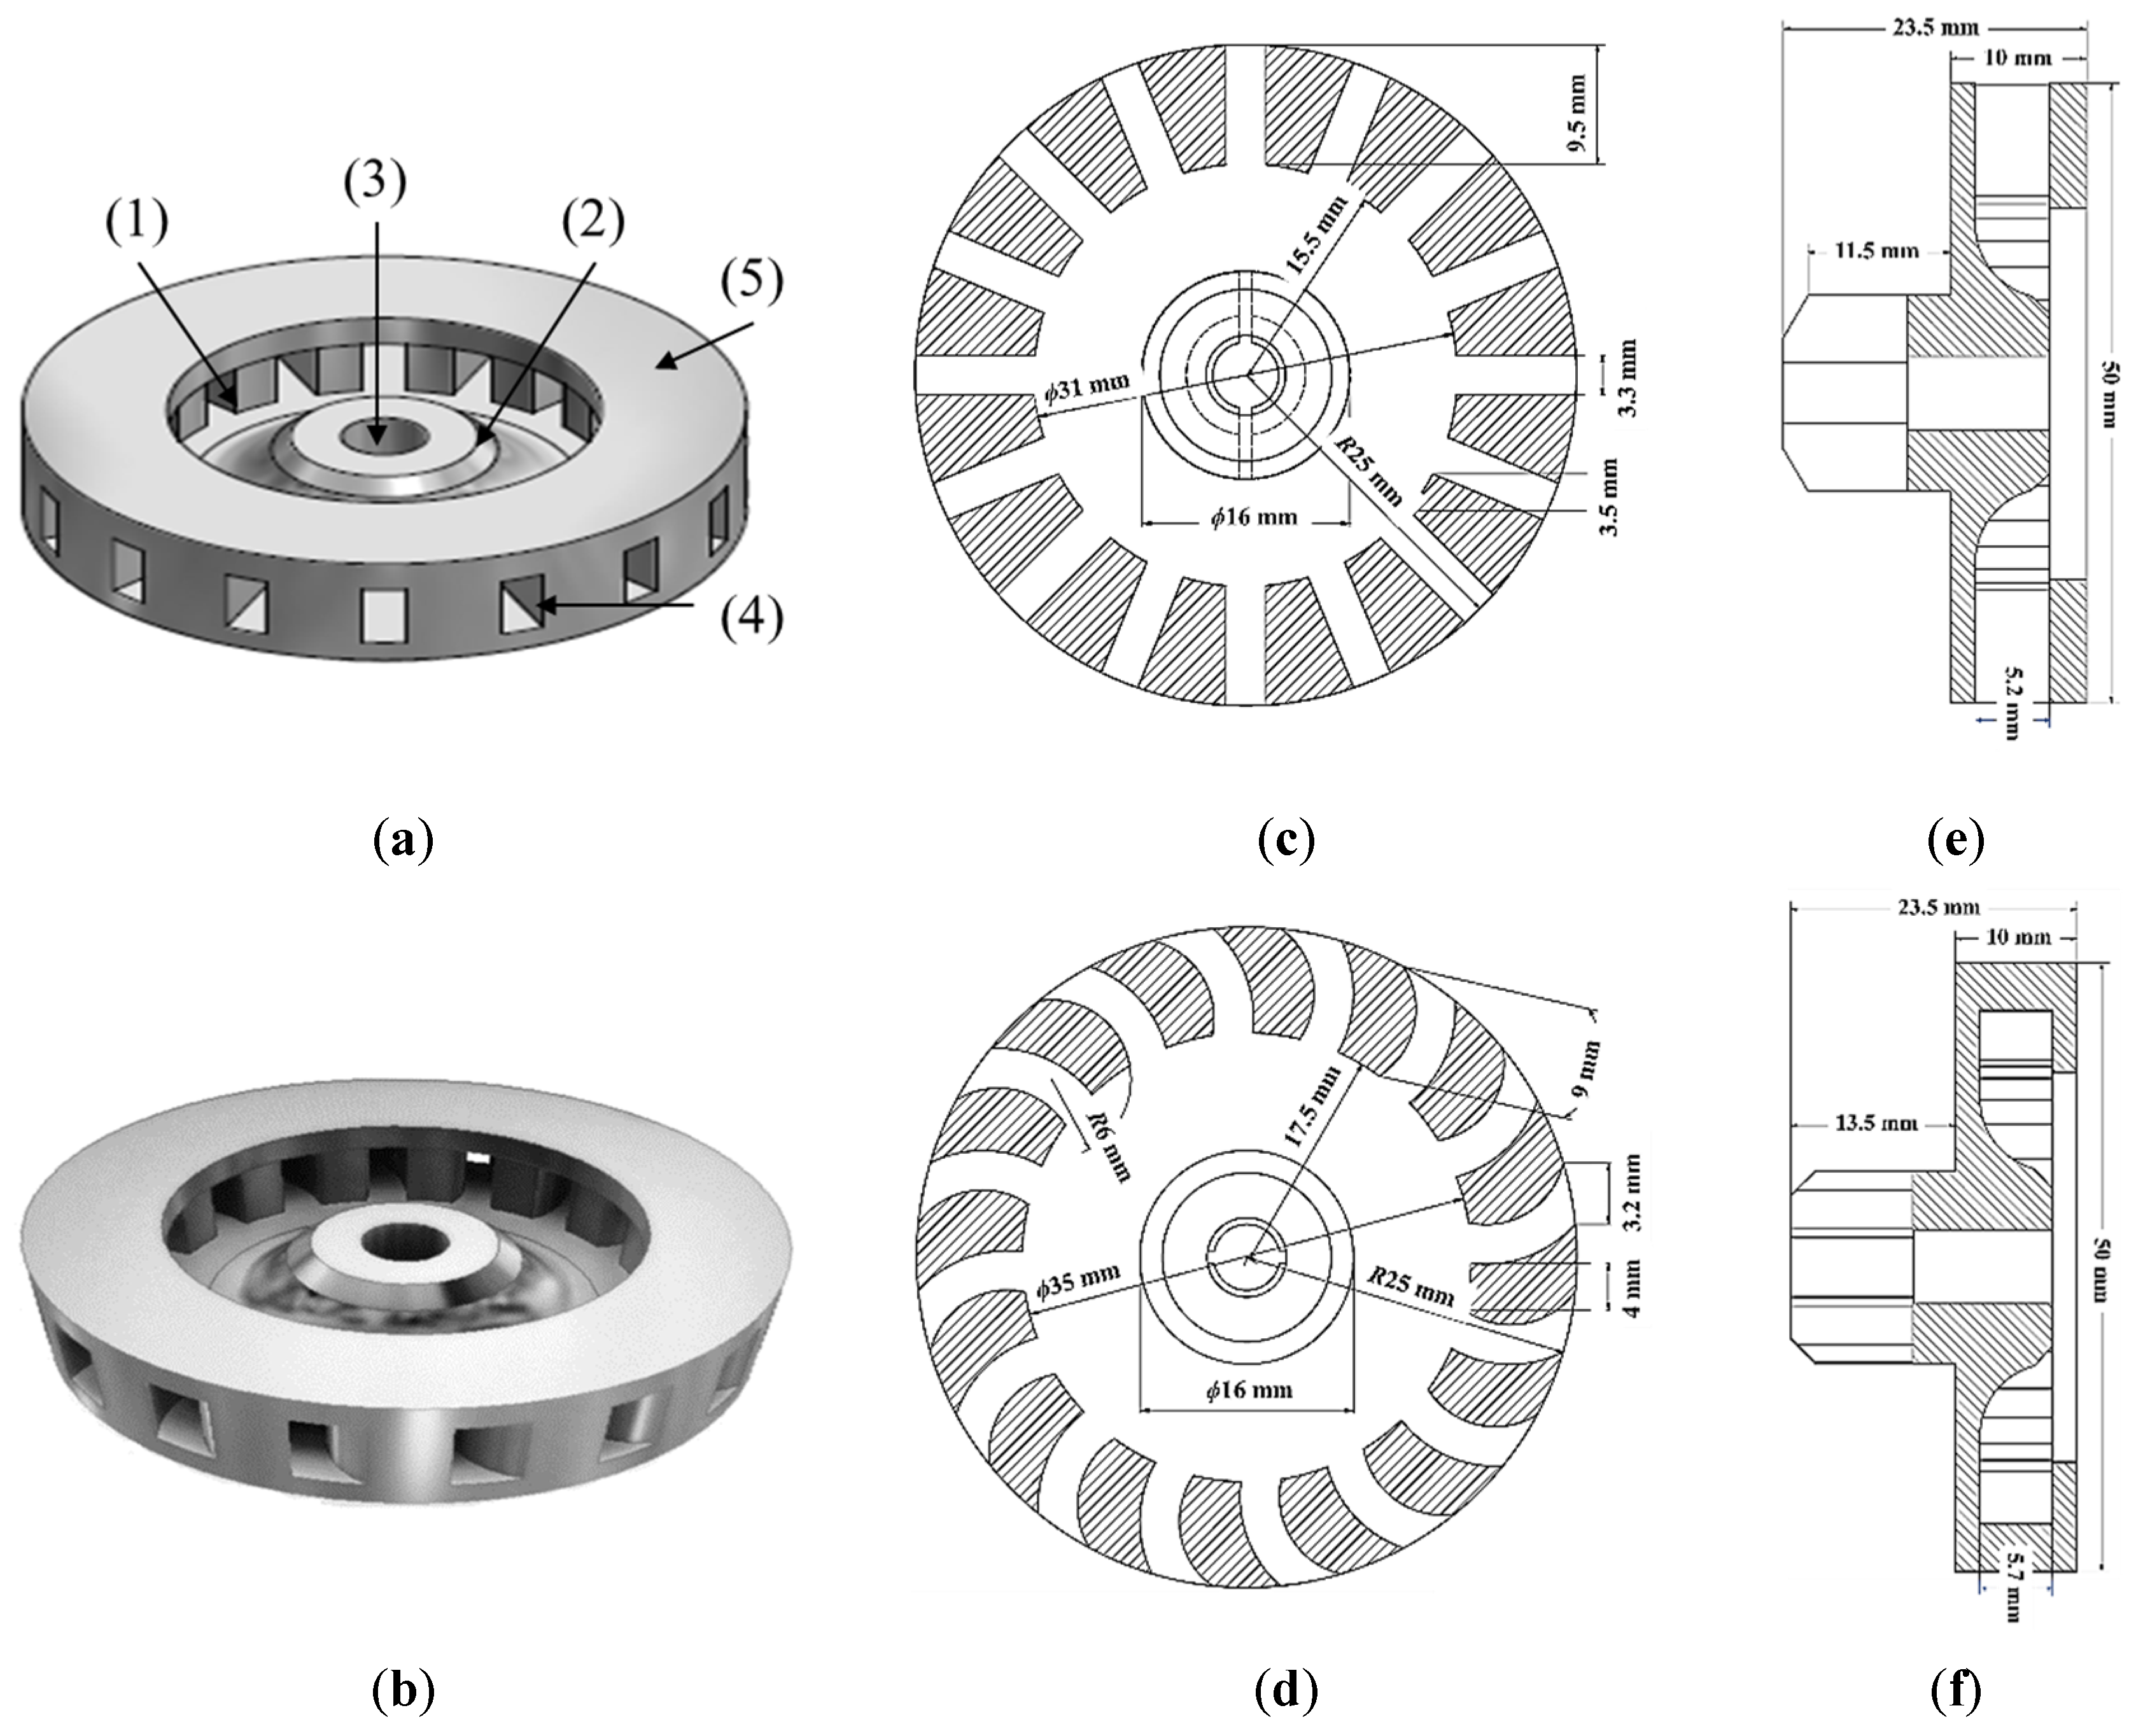
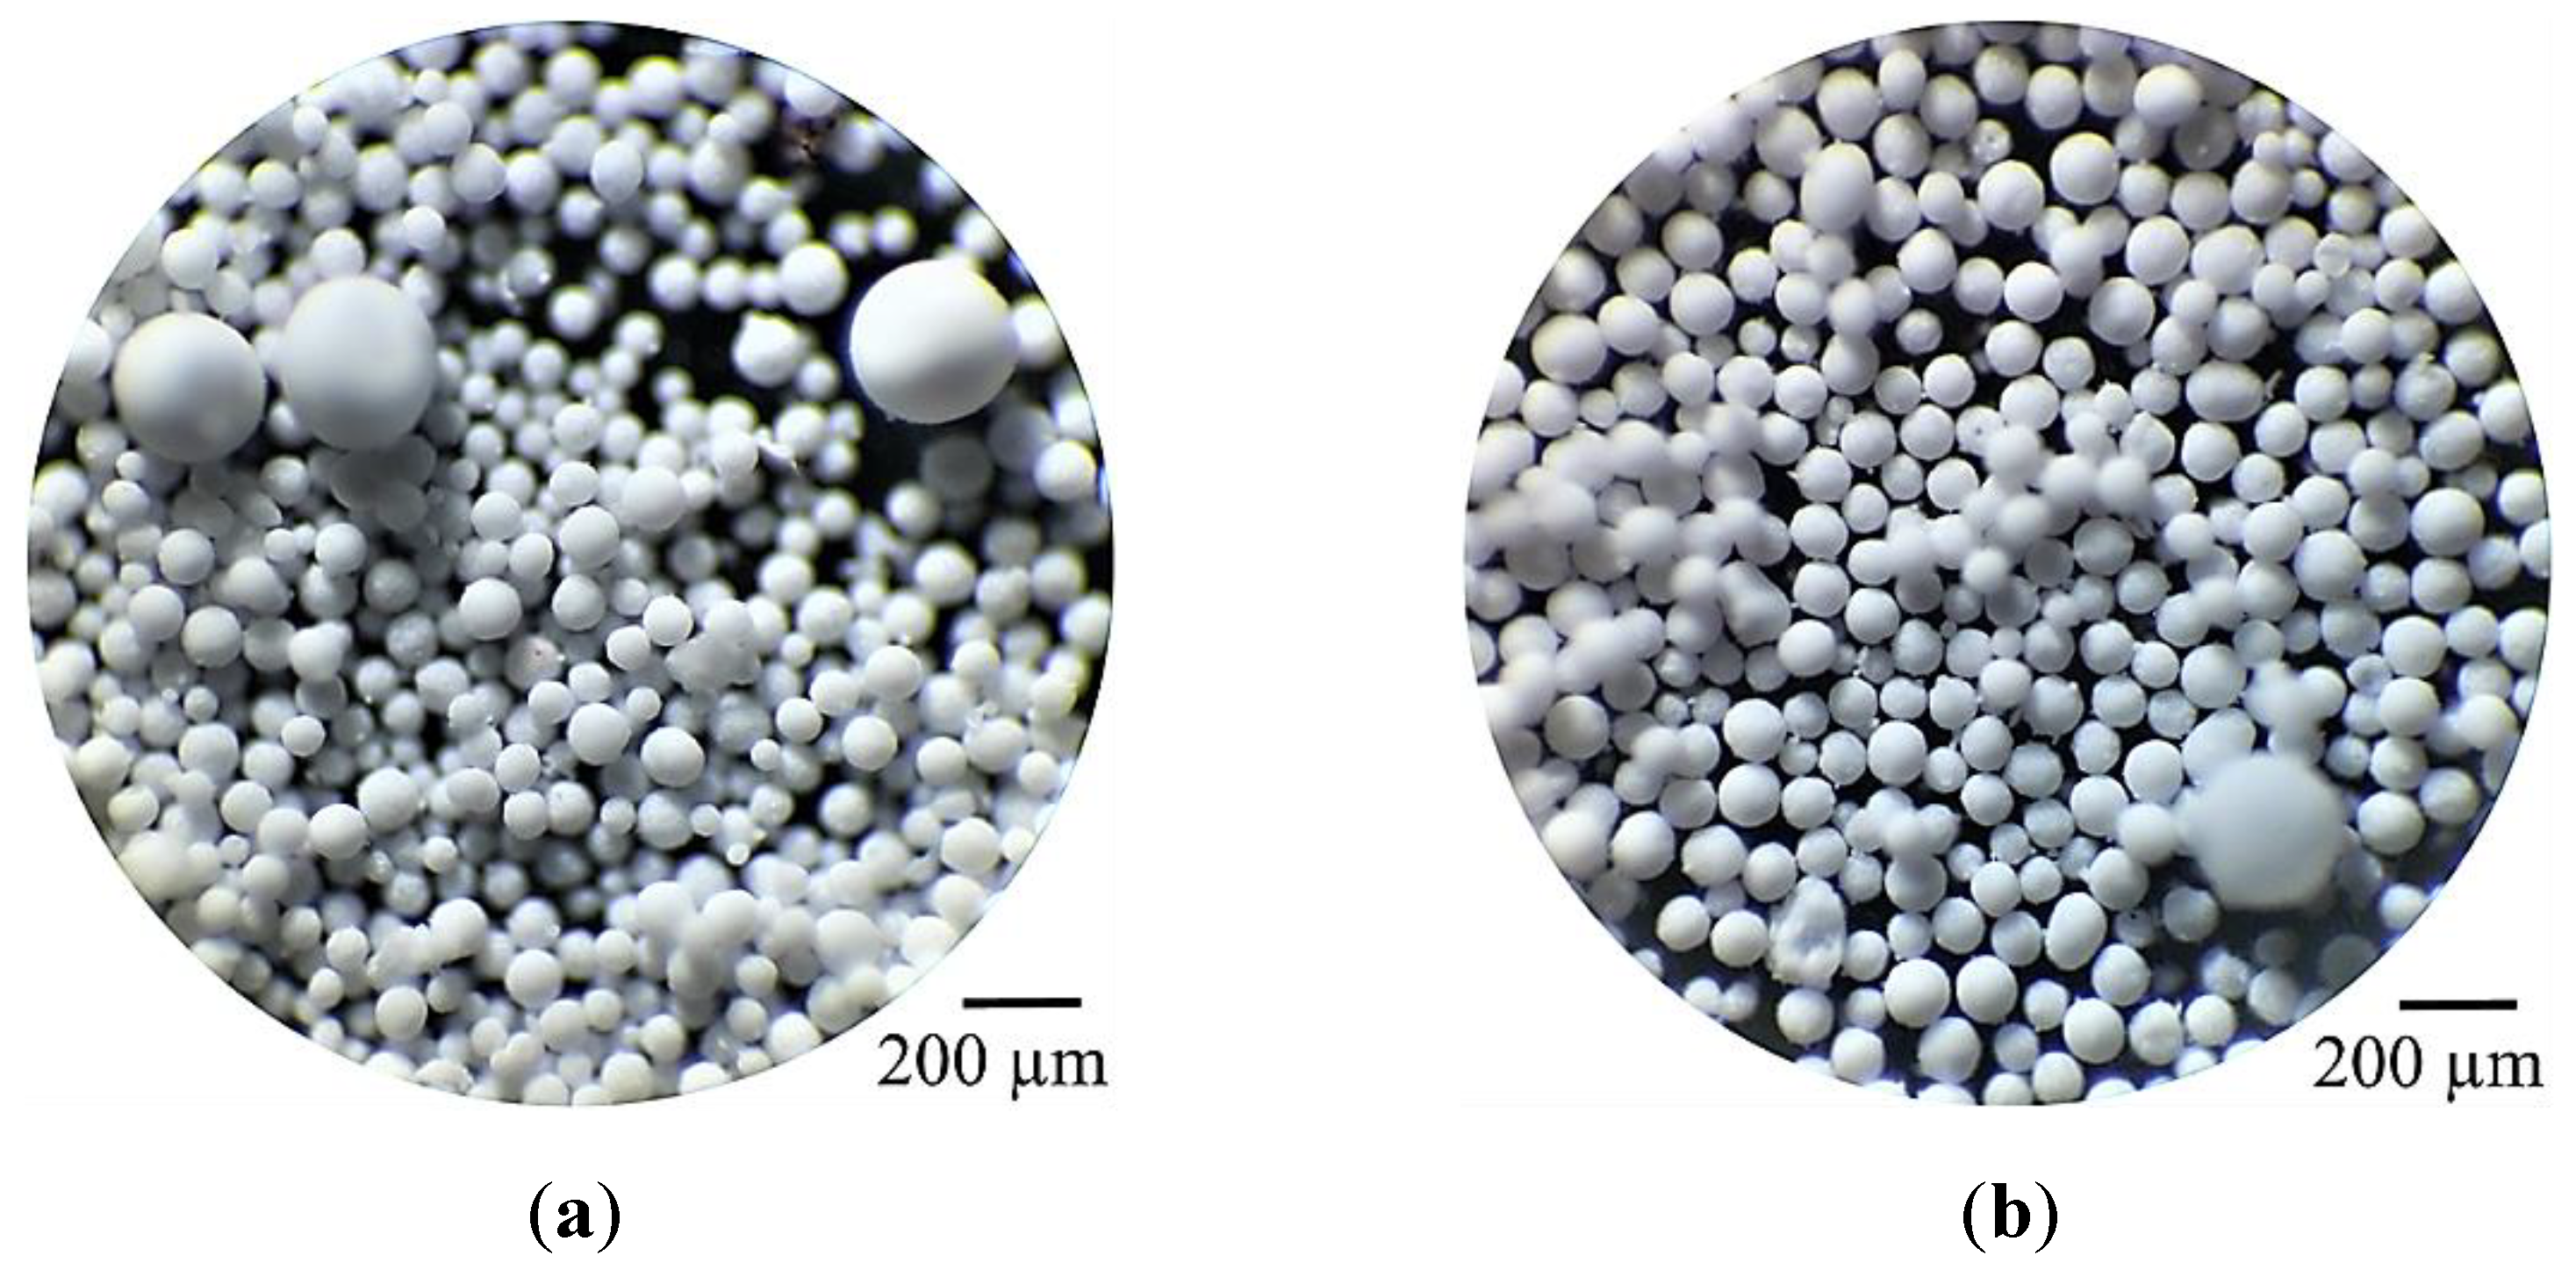
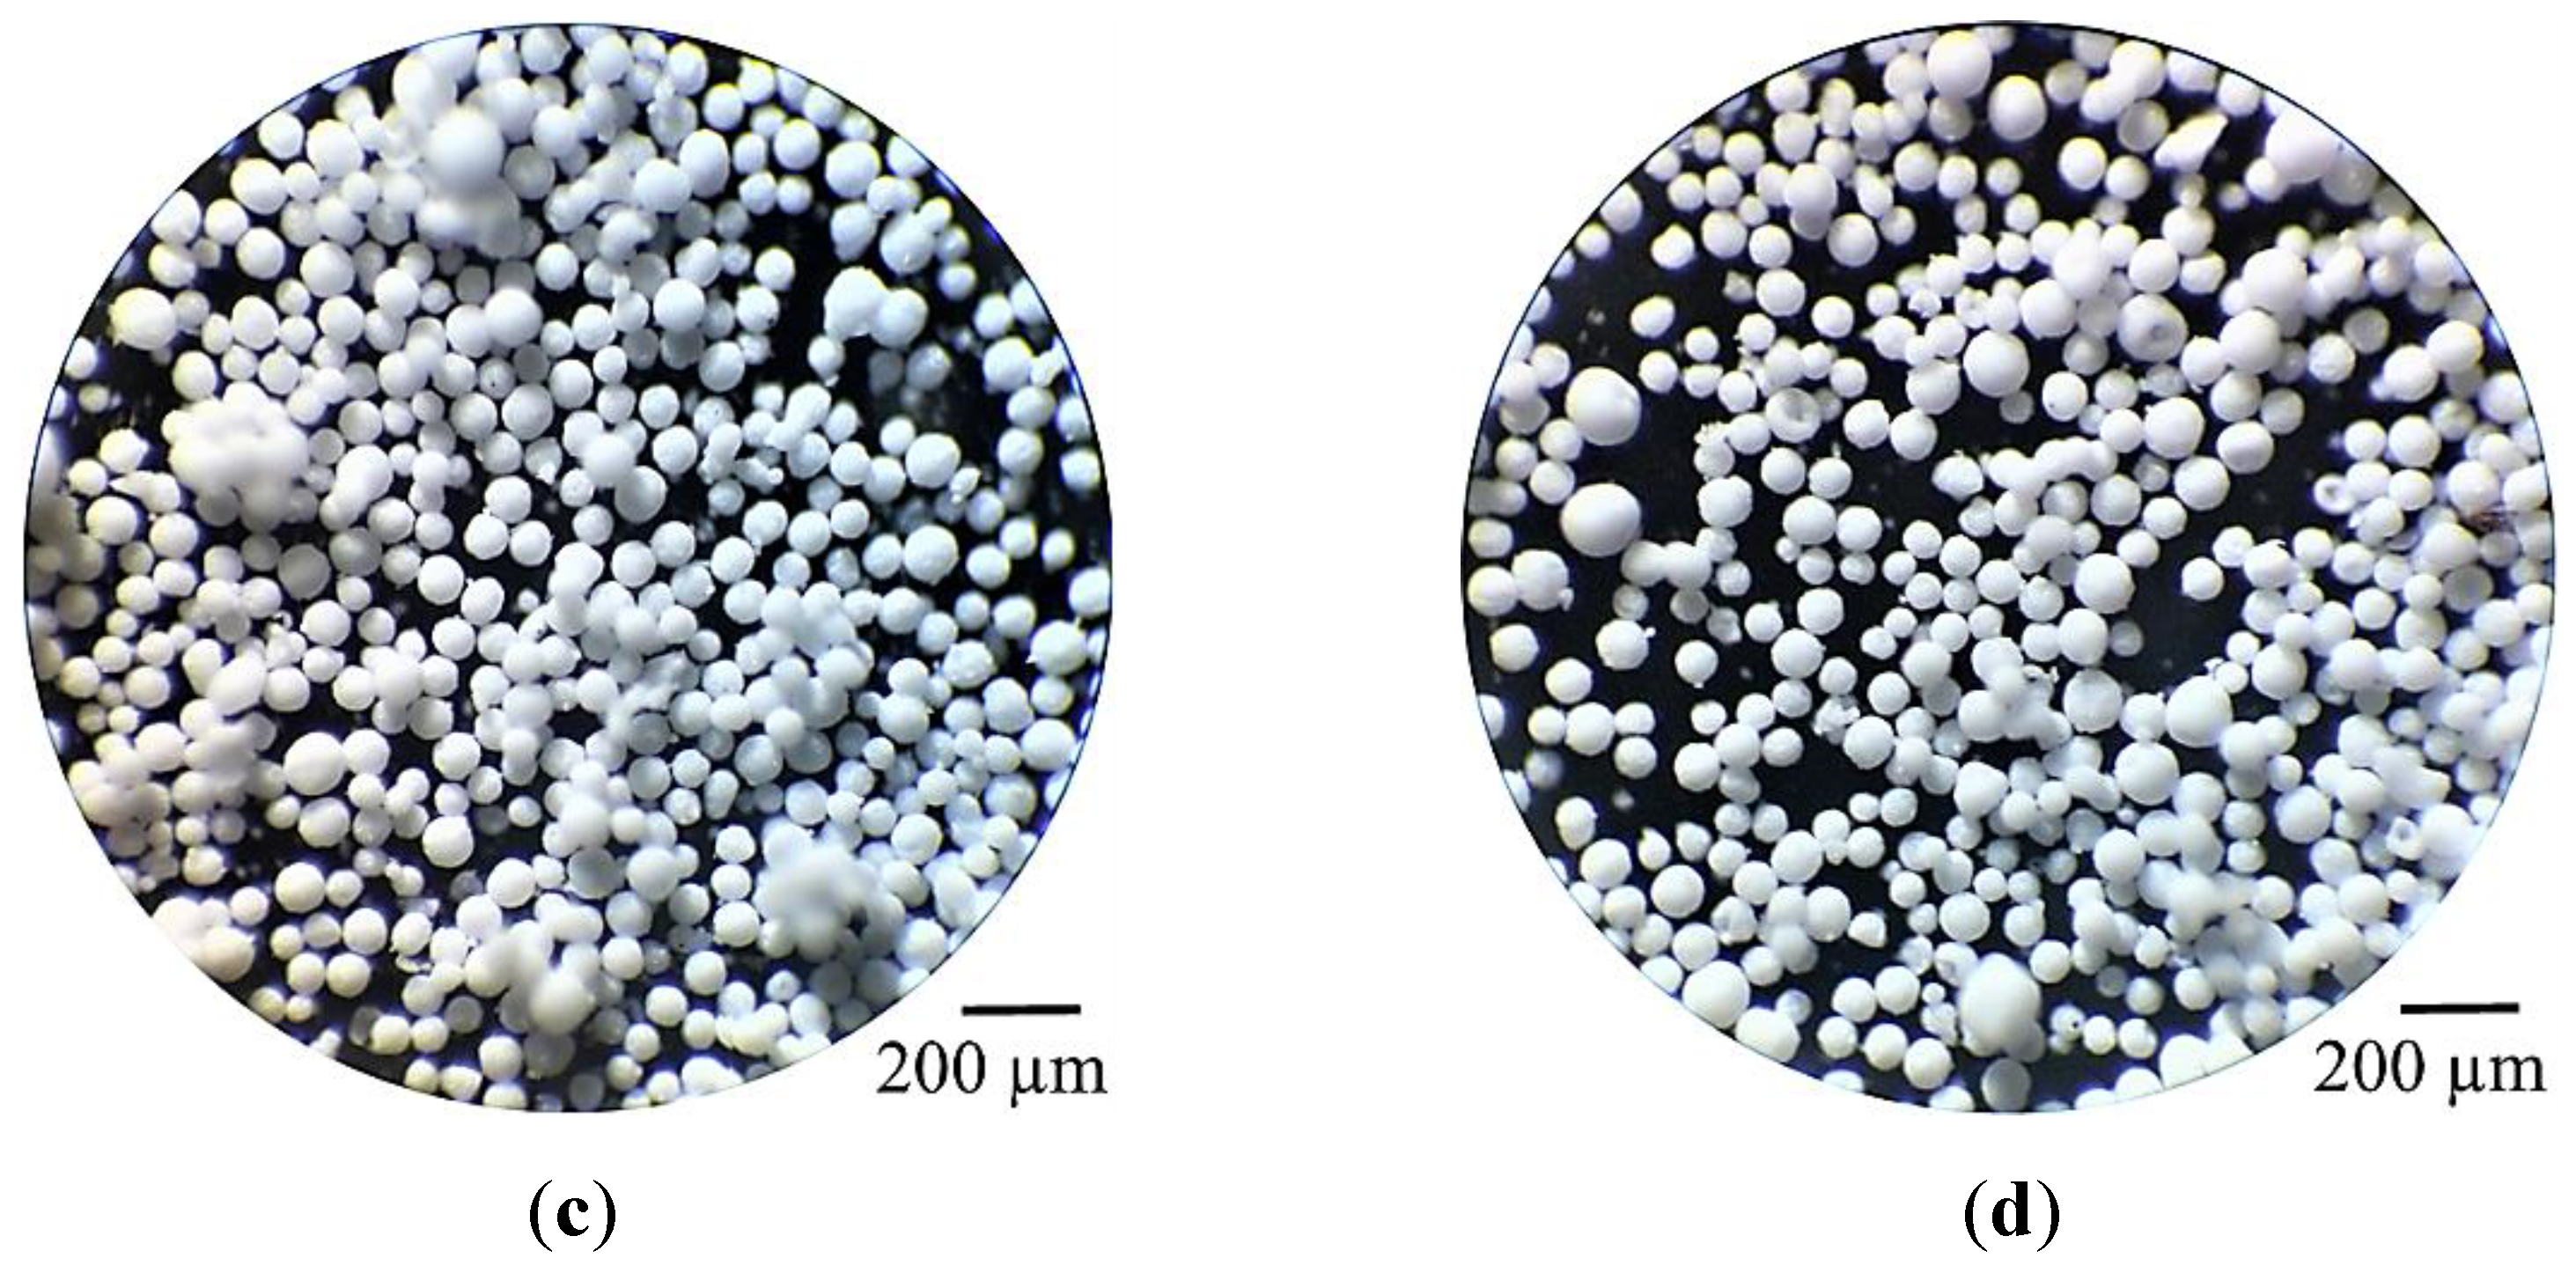
2.5. Spray-Dried 25SA Microspheres Obtained with the Straight Rectangular Vanes Disk
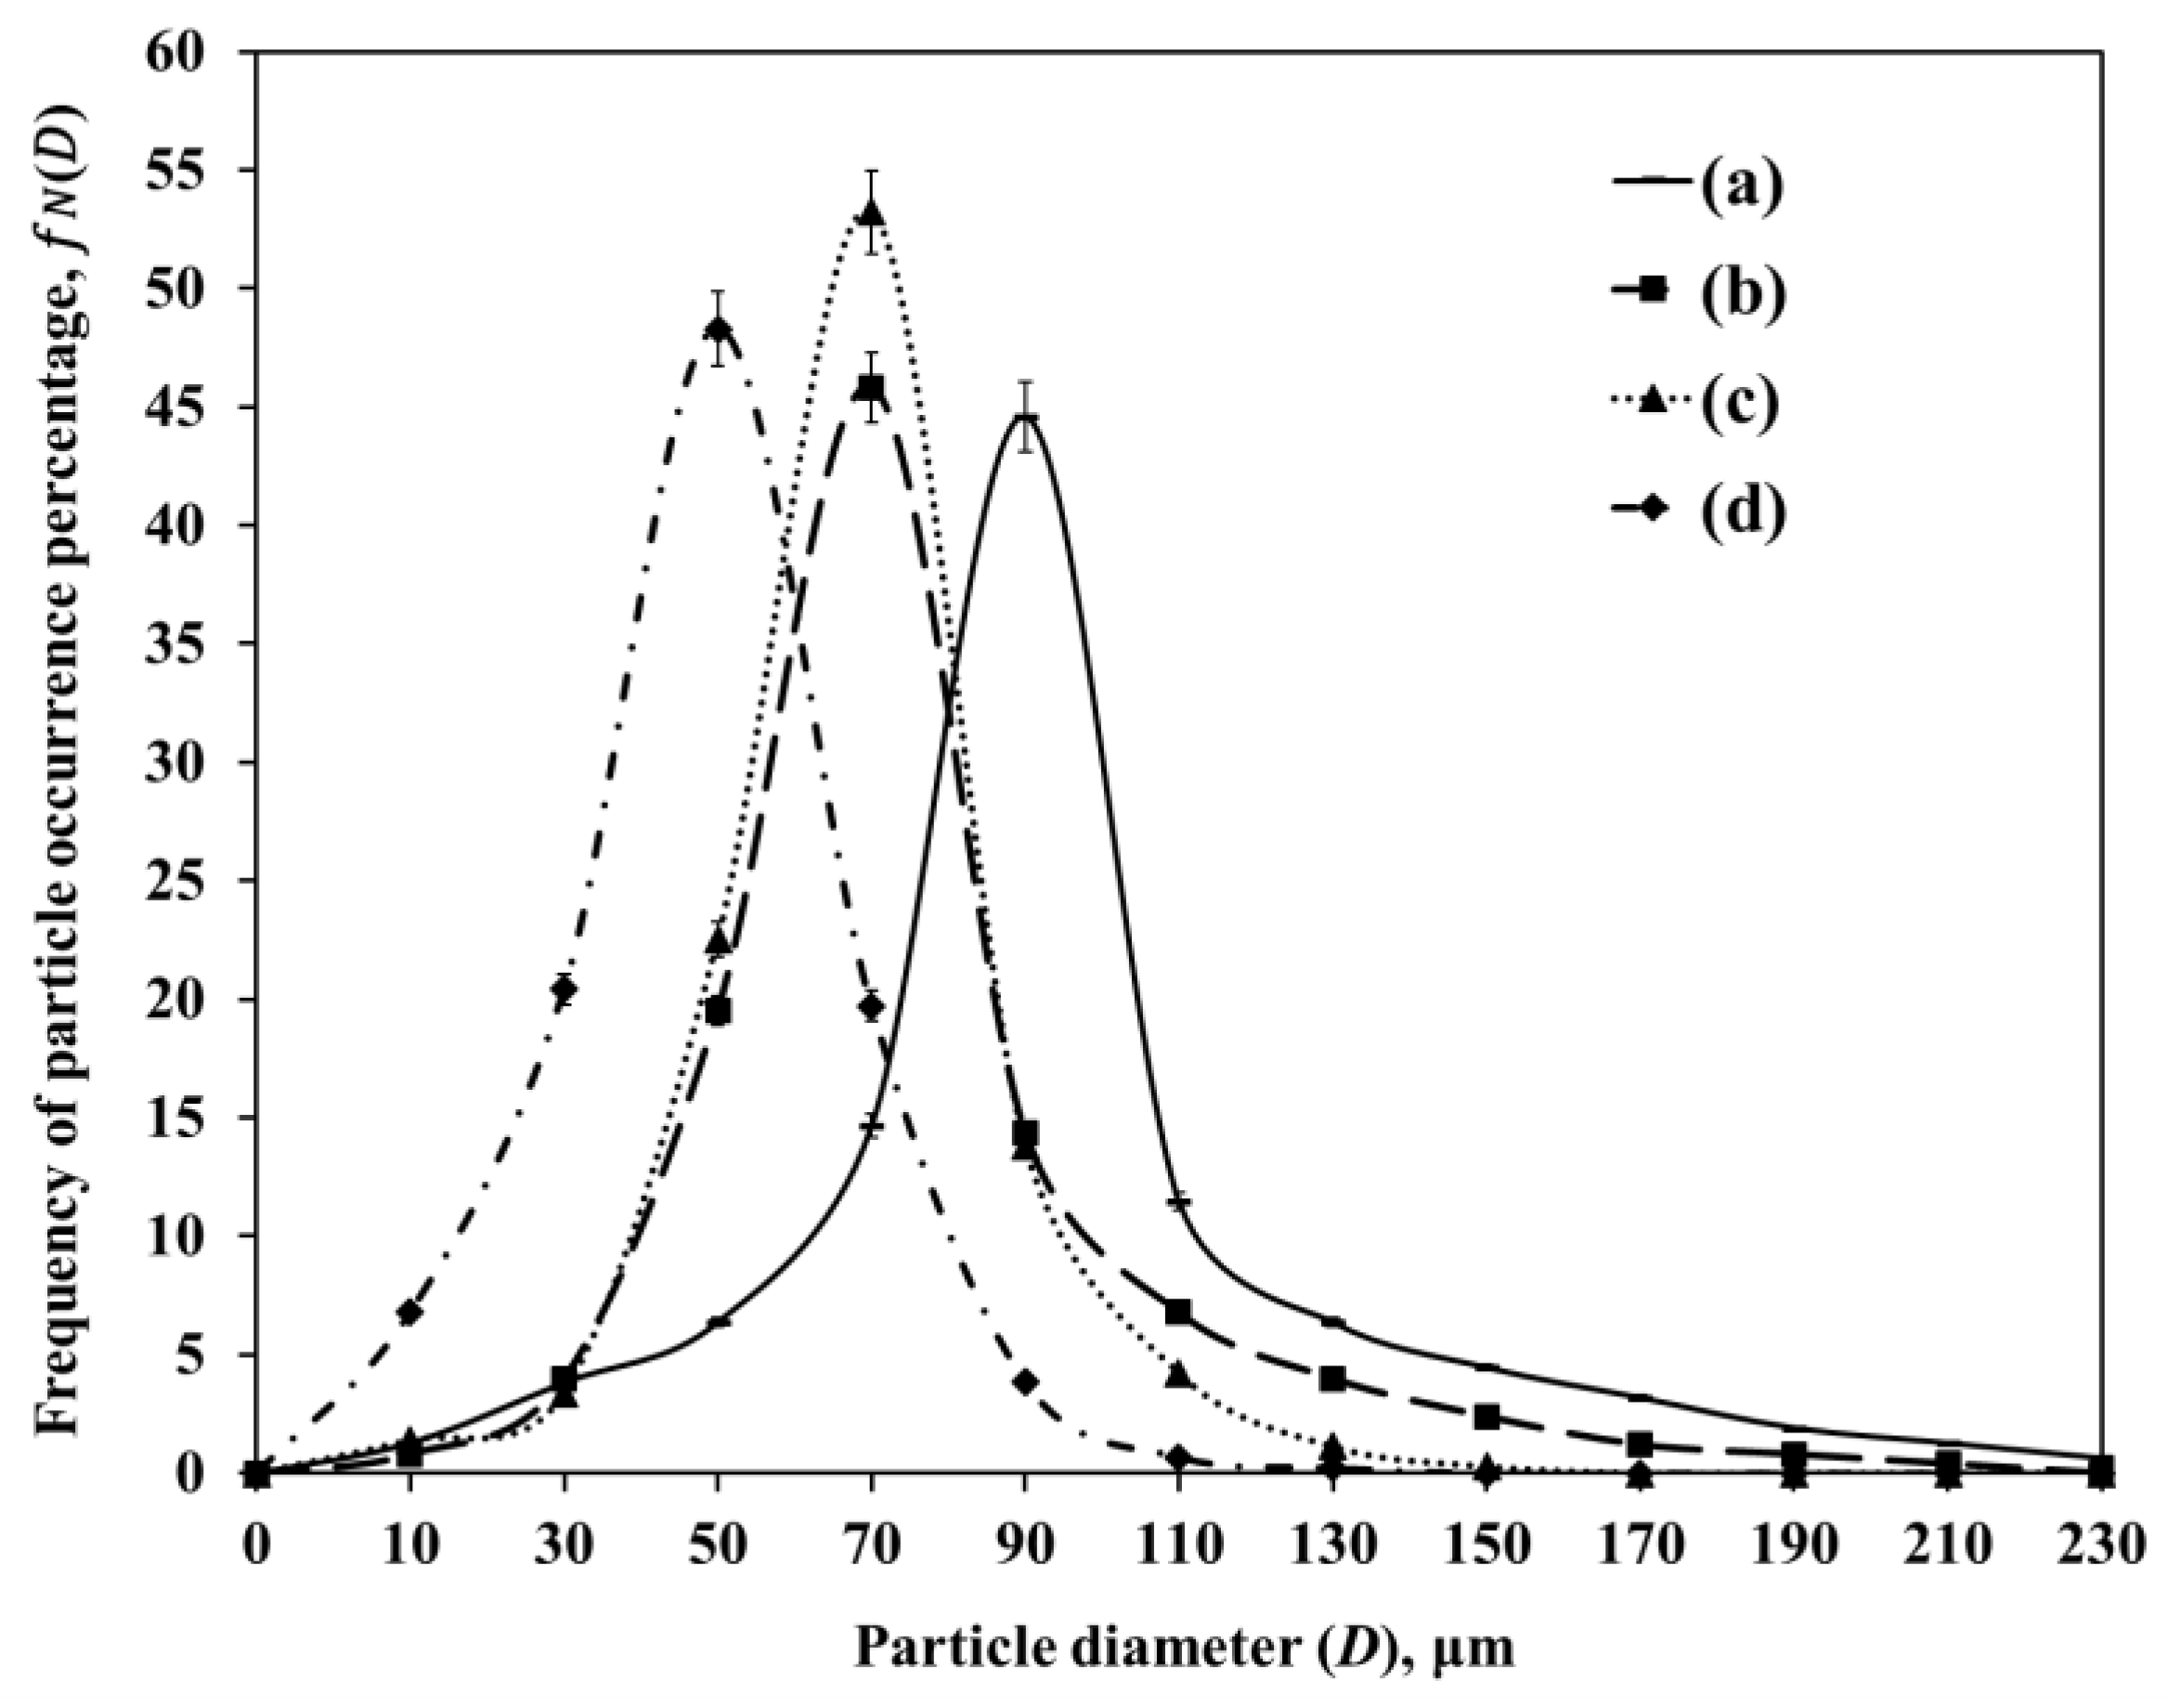
2.5.1. Effect of the DAR-Disk Rotation Speeds on the Particle-Size Distributions (PSD) and the Sauter Mean Diameter (SMD)
2.5.2. Spray-Dried Microspheres of 100A and 25SA with Different W Concentration
2.6. Textural Properties of 25SA Microspheres
2.6.1. BET Specific Area
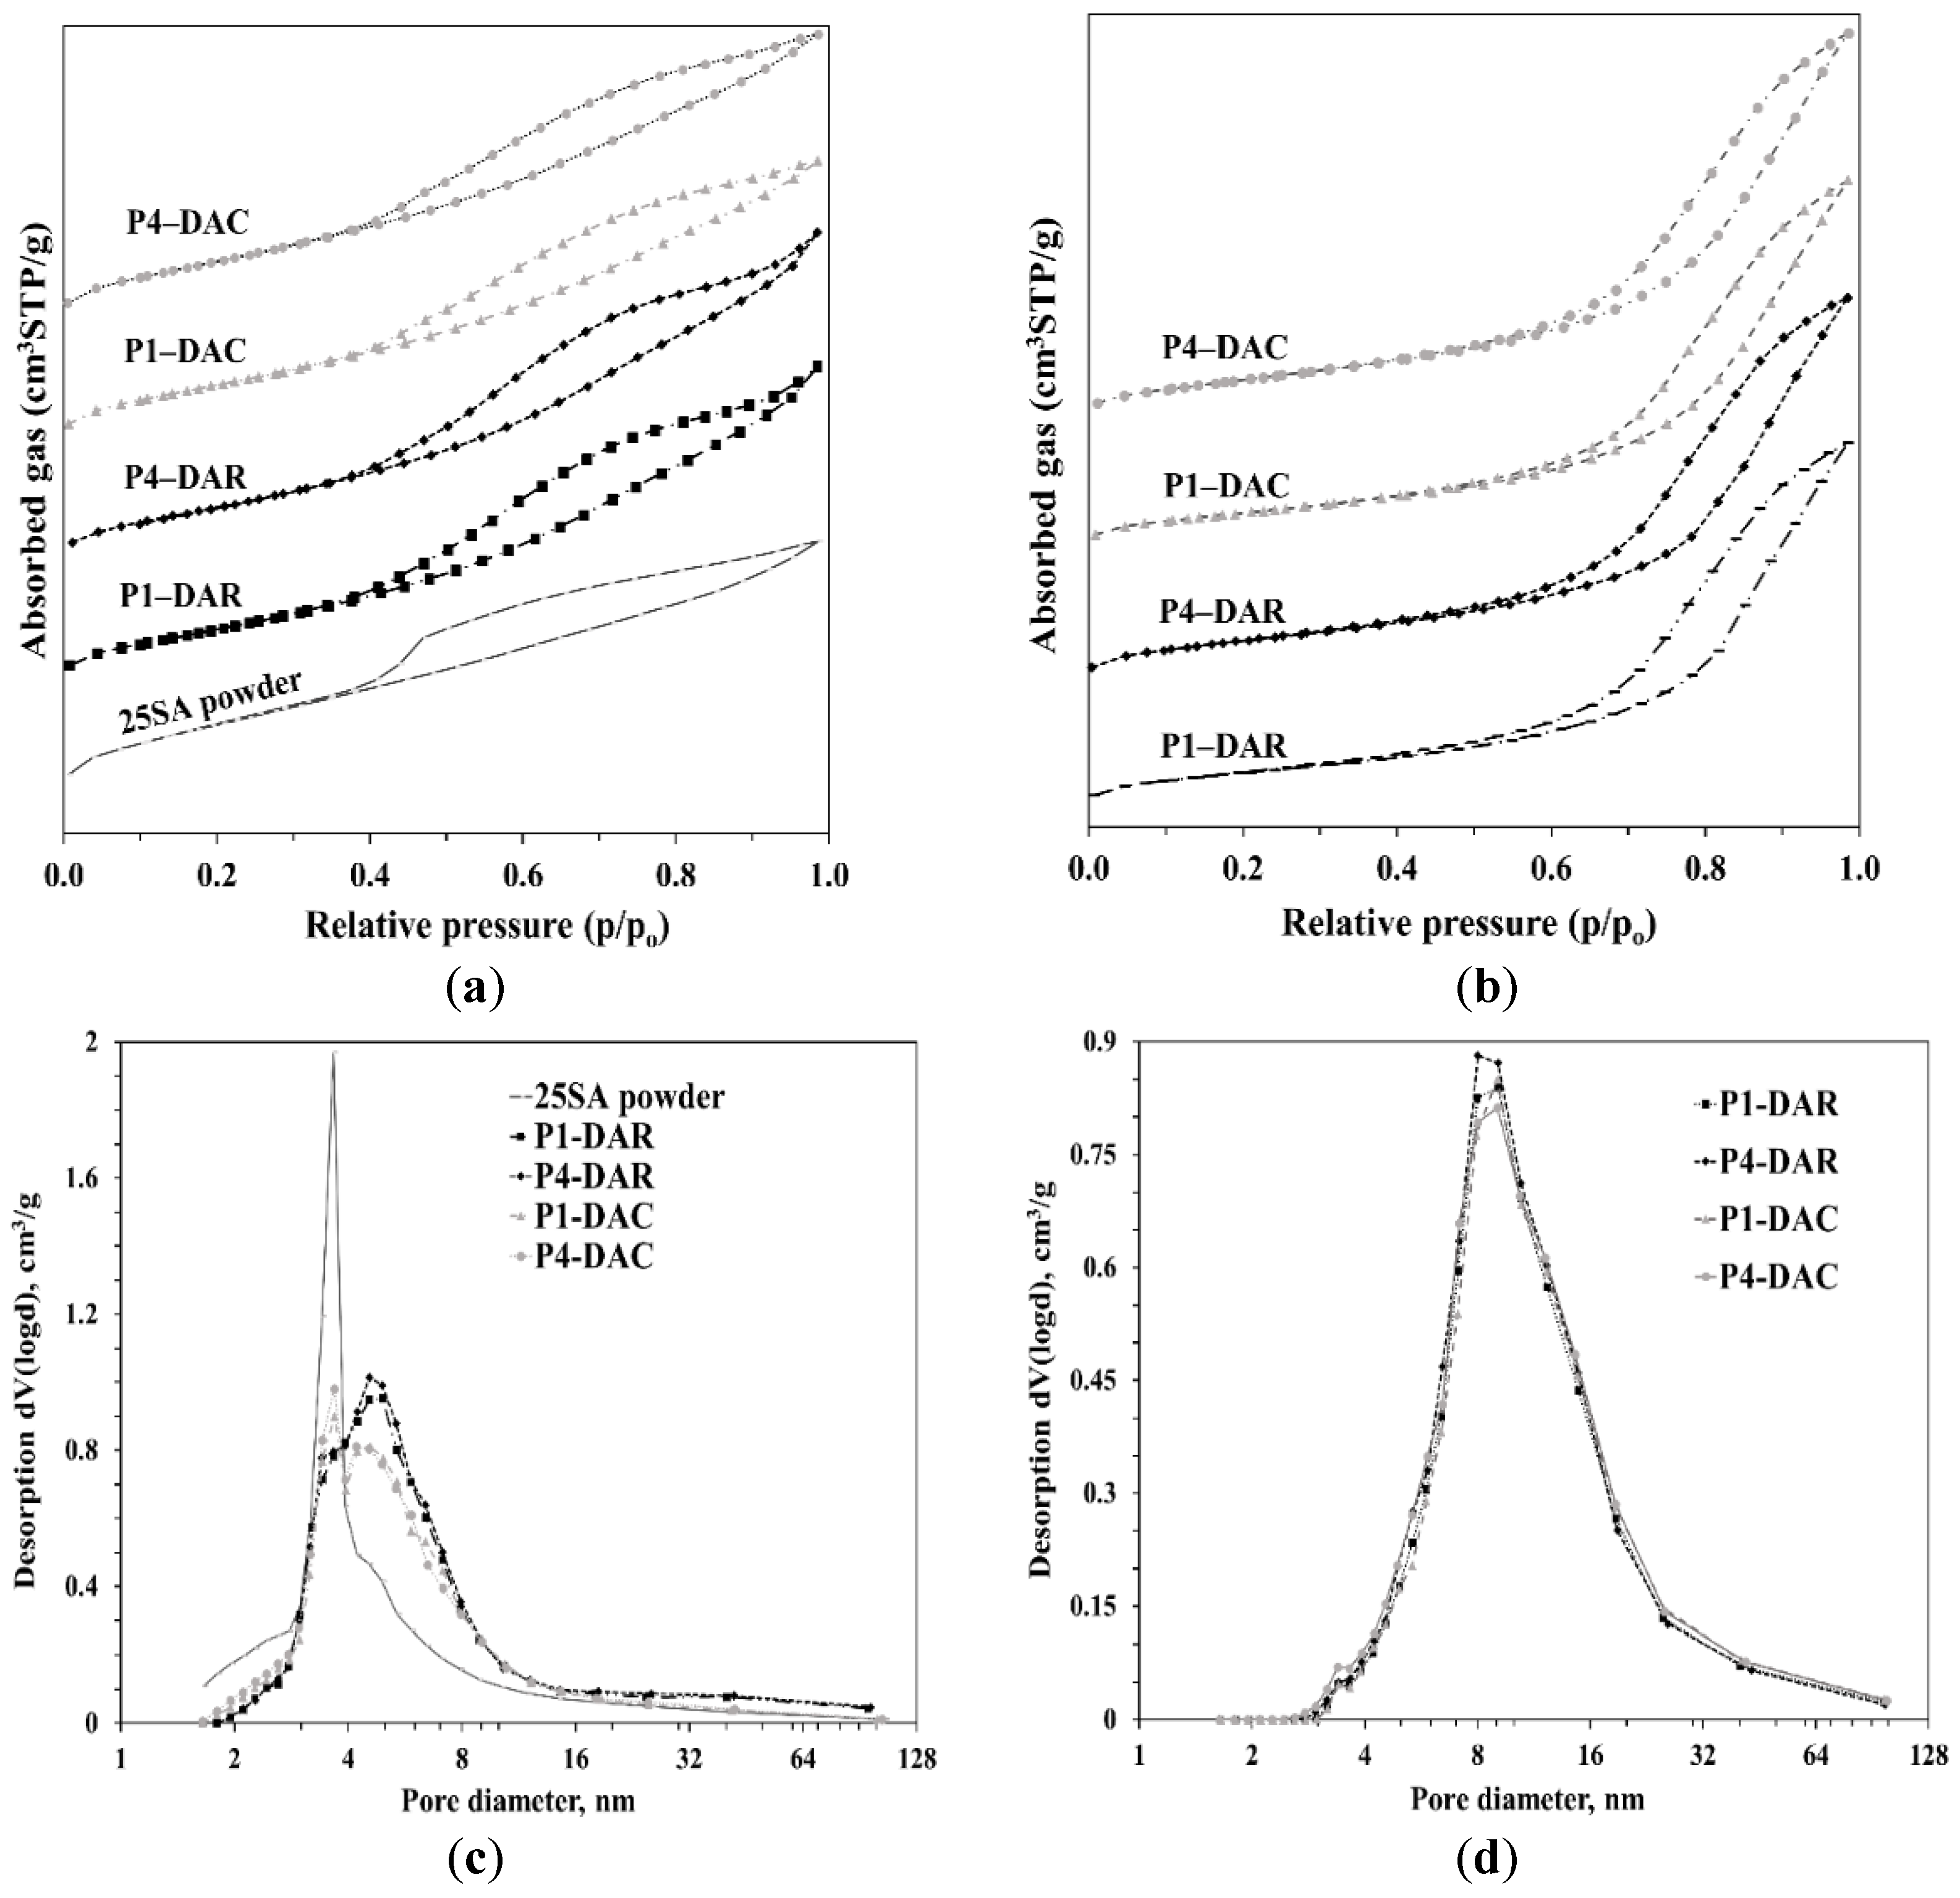
2.6.2. N2 Adsorption–Desorption Isotherms
2.7. SEM and EDS of Pt/SiO2–Al2O3–WOx
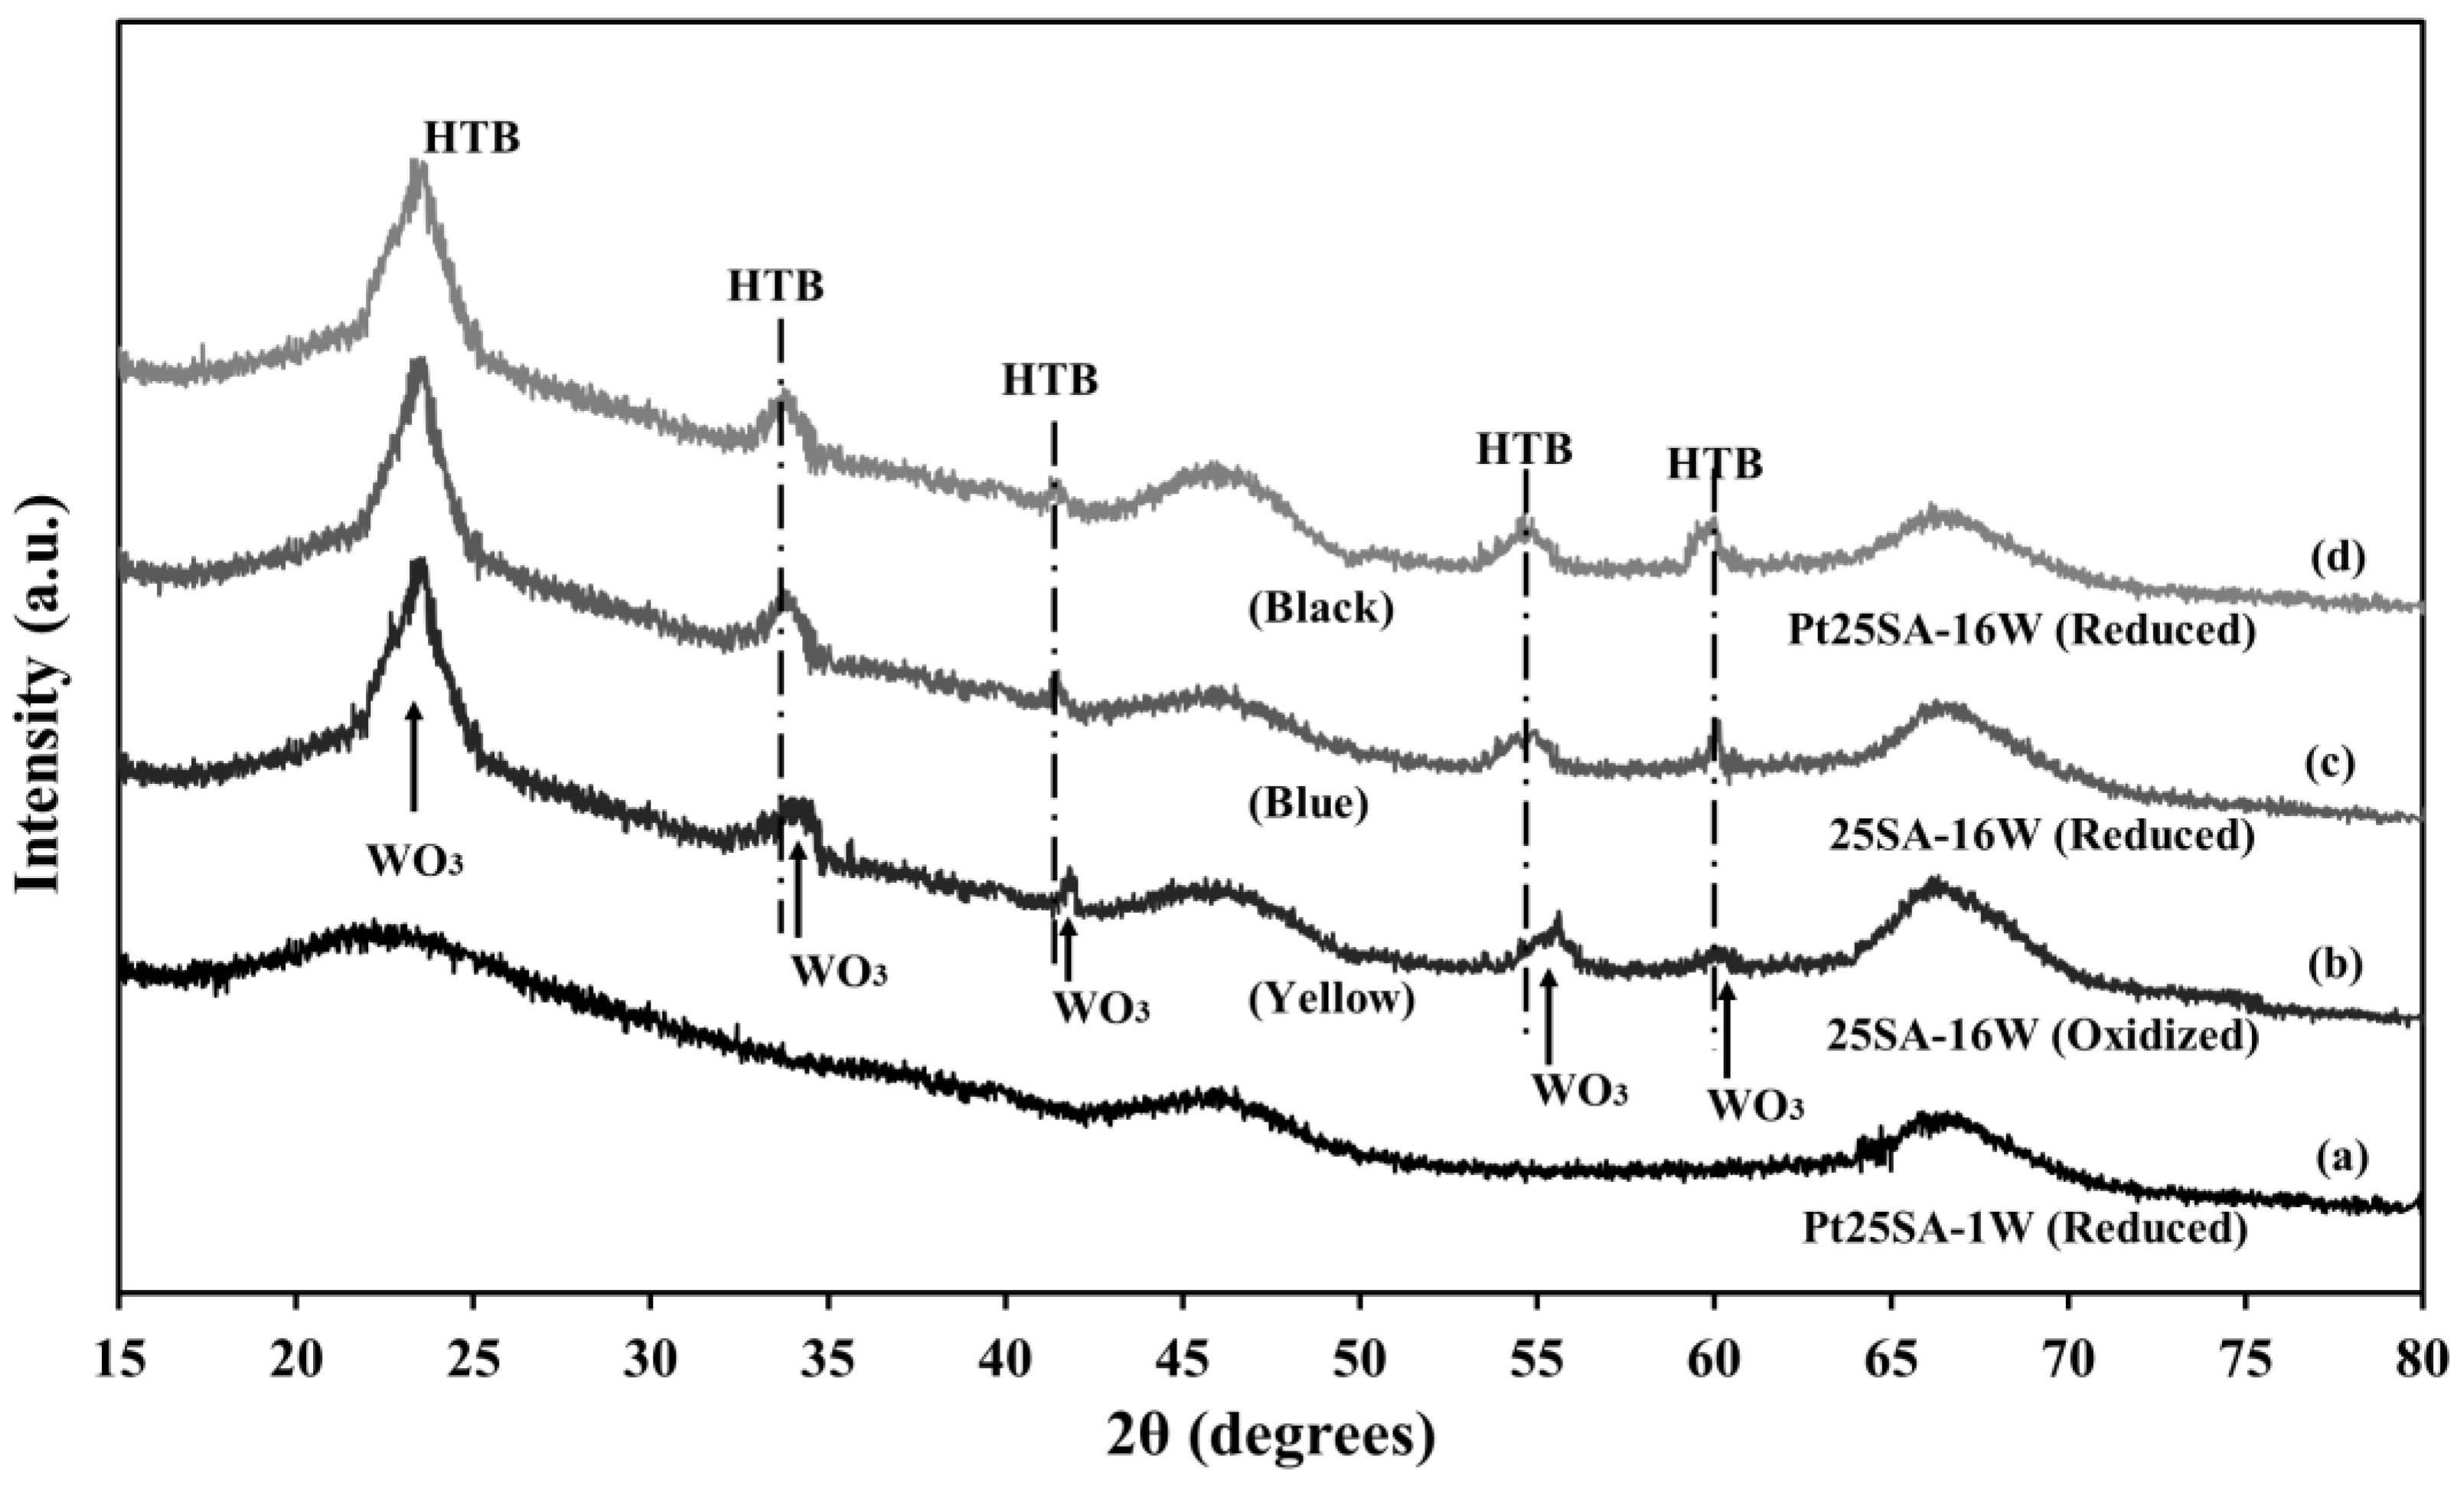
2.8. XRD of the Pt/SiO2–Al2O3–WOx Catalysts
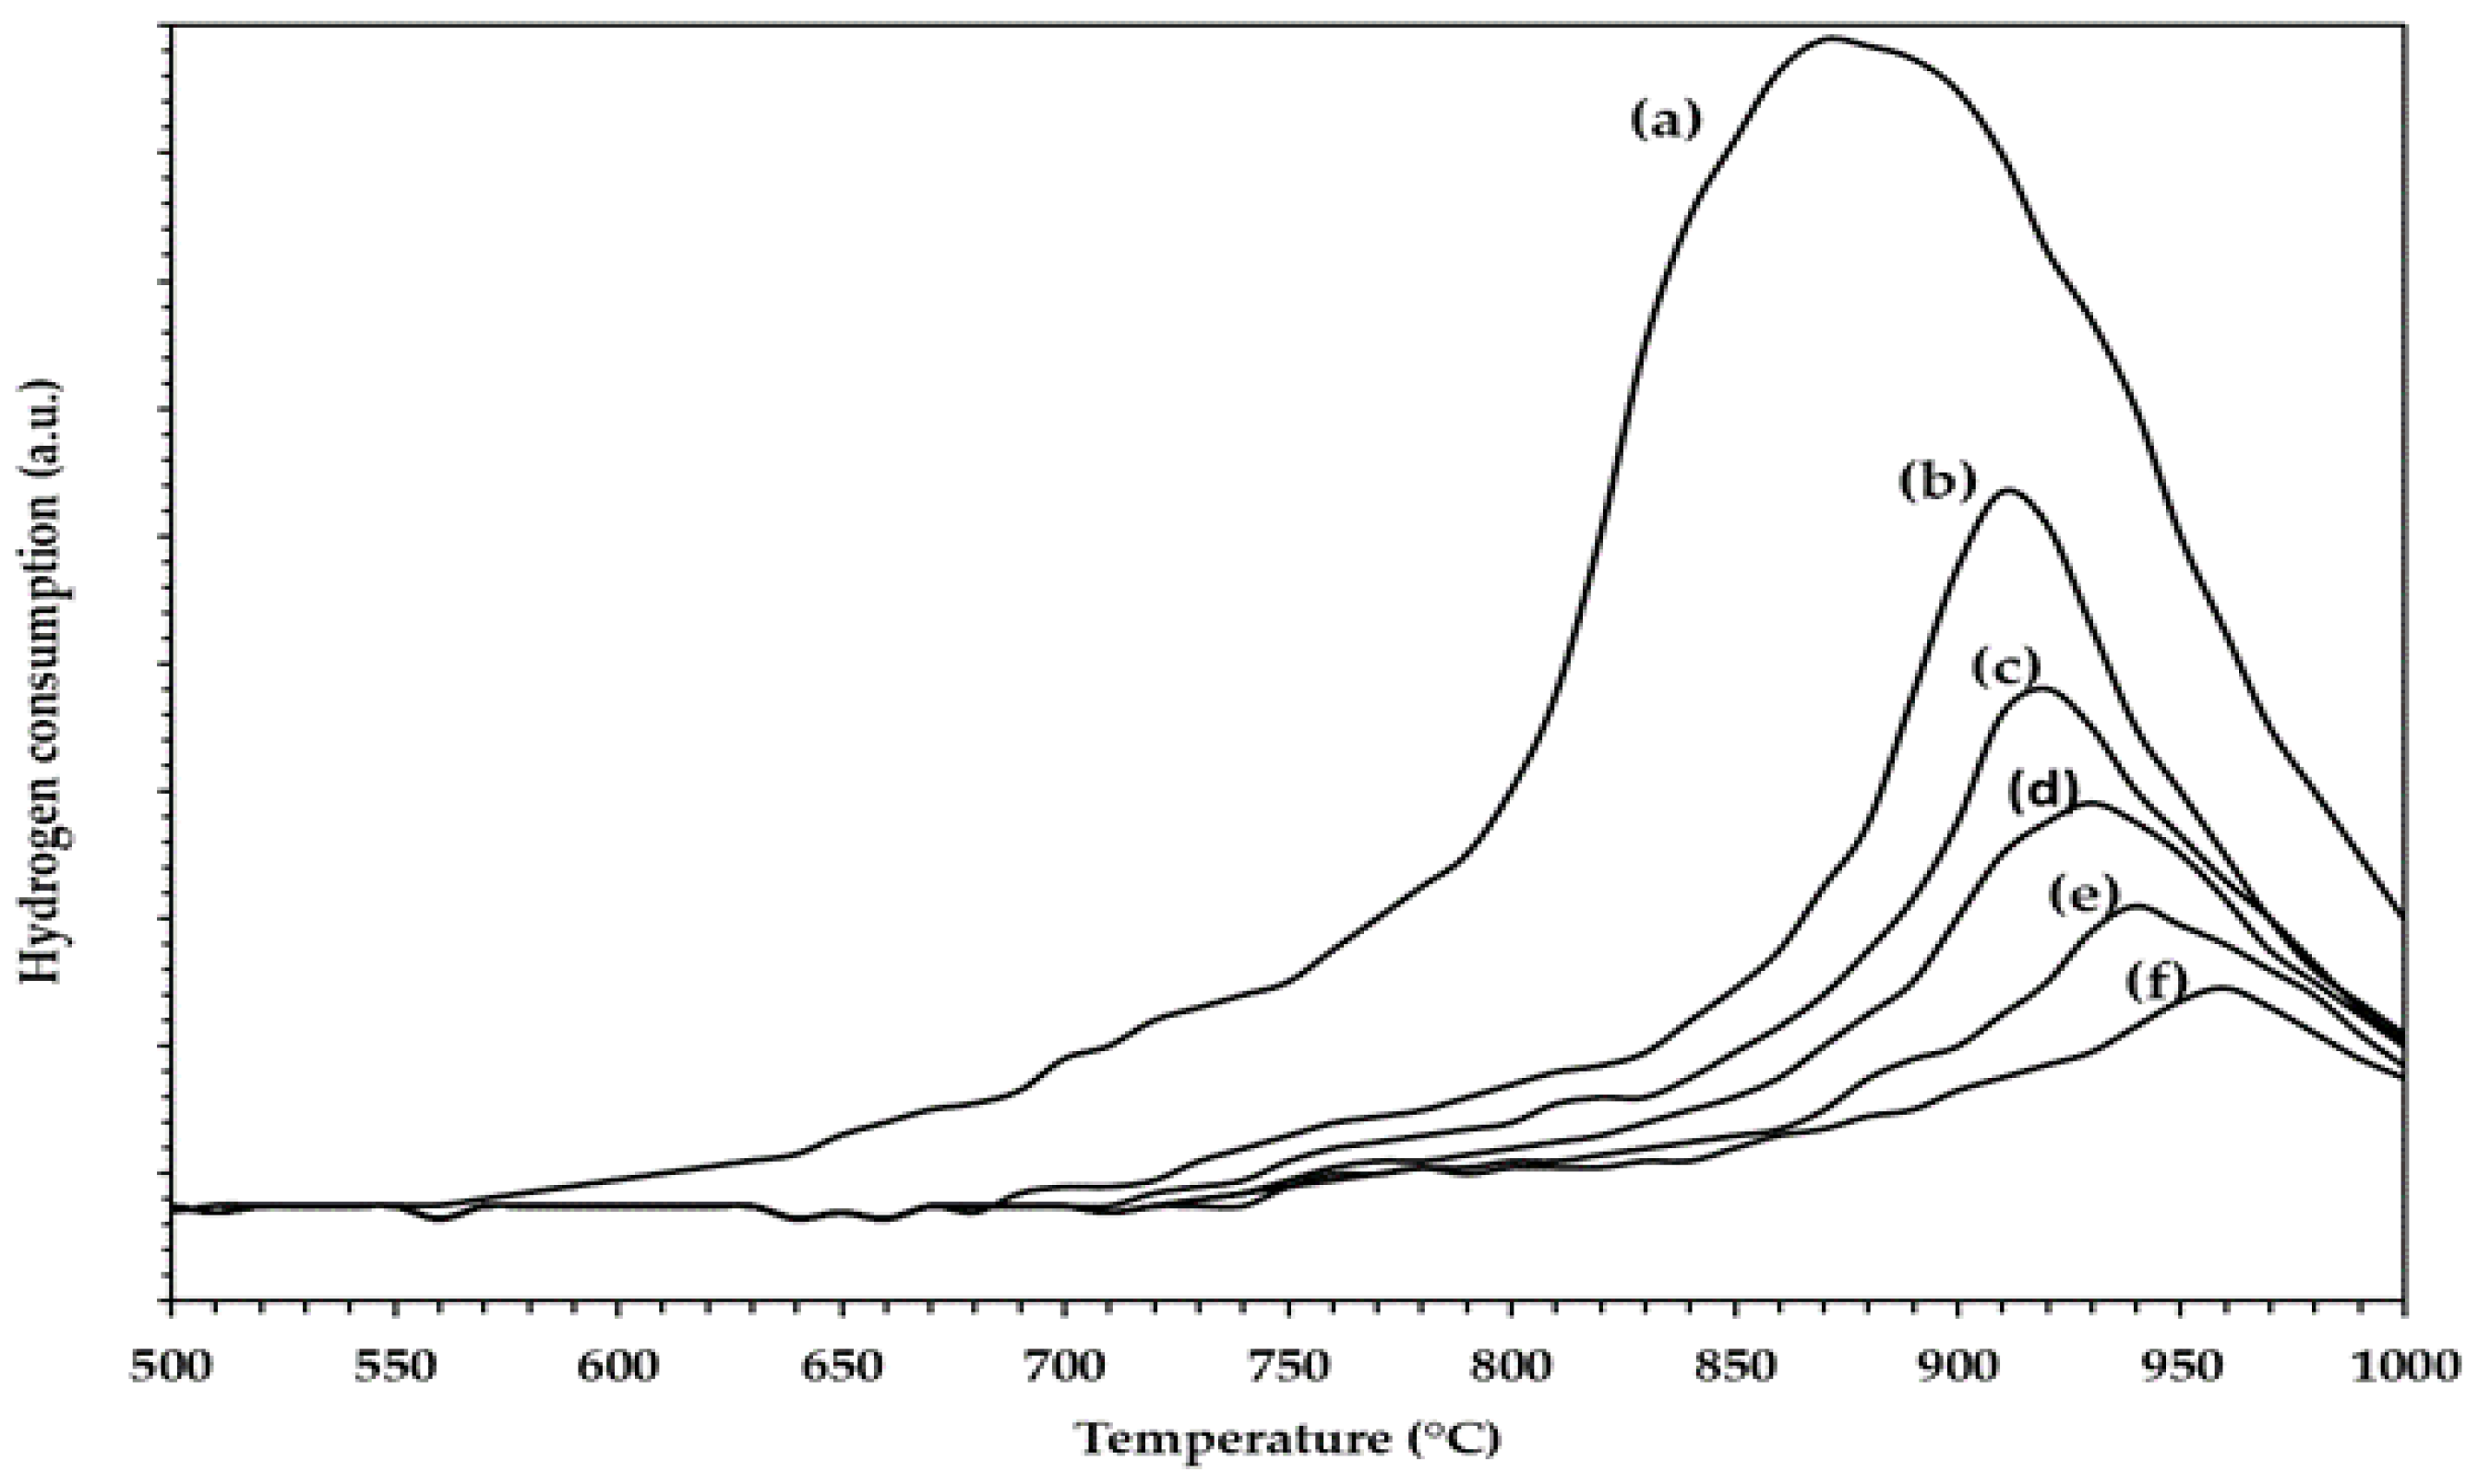
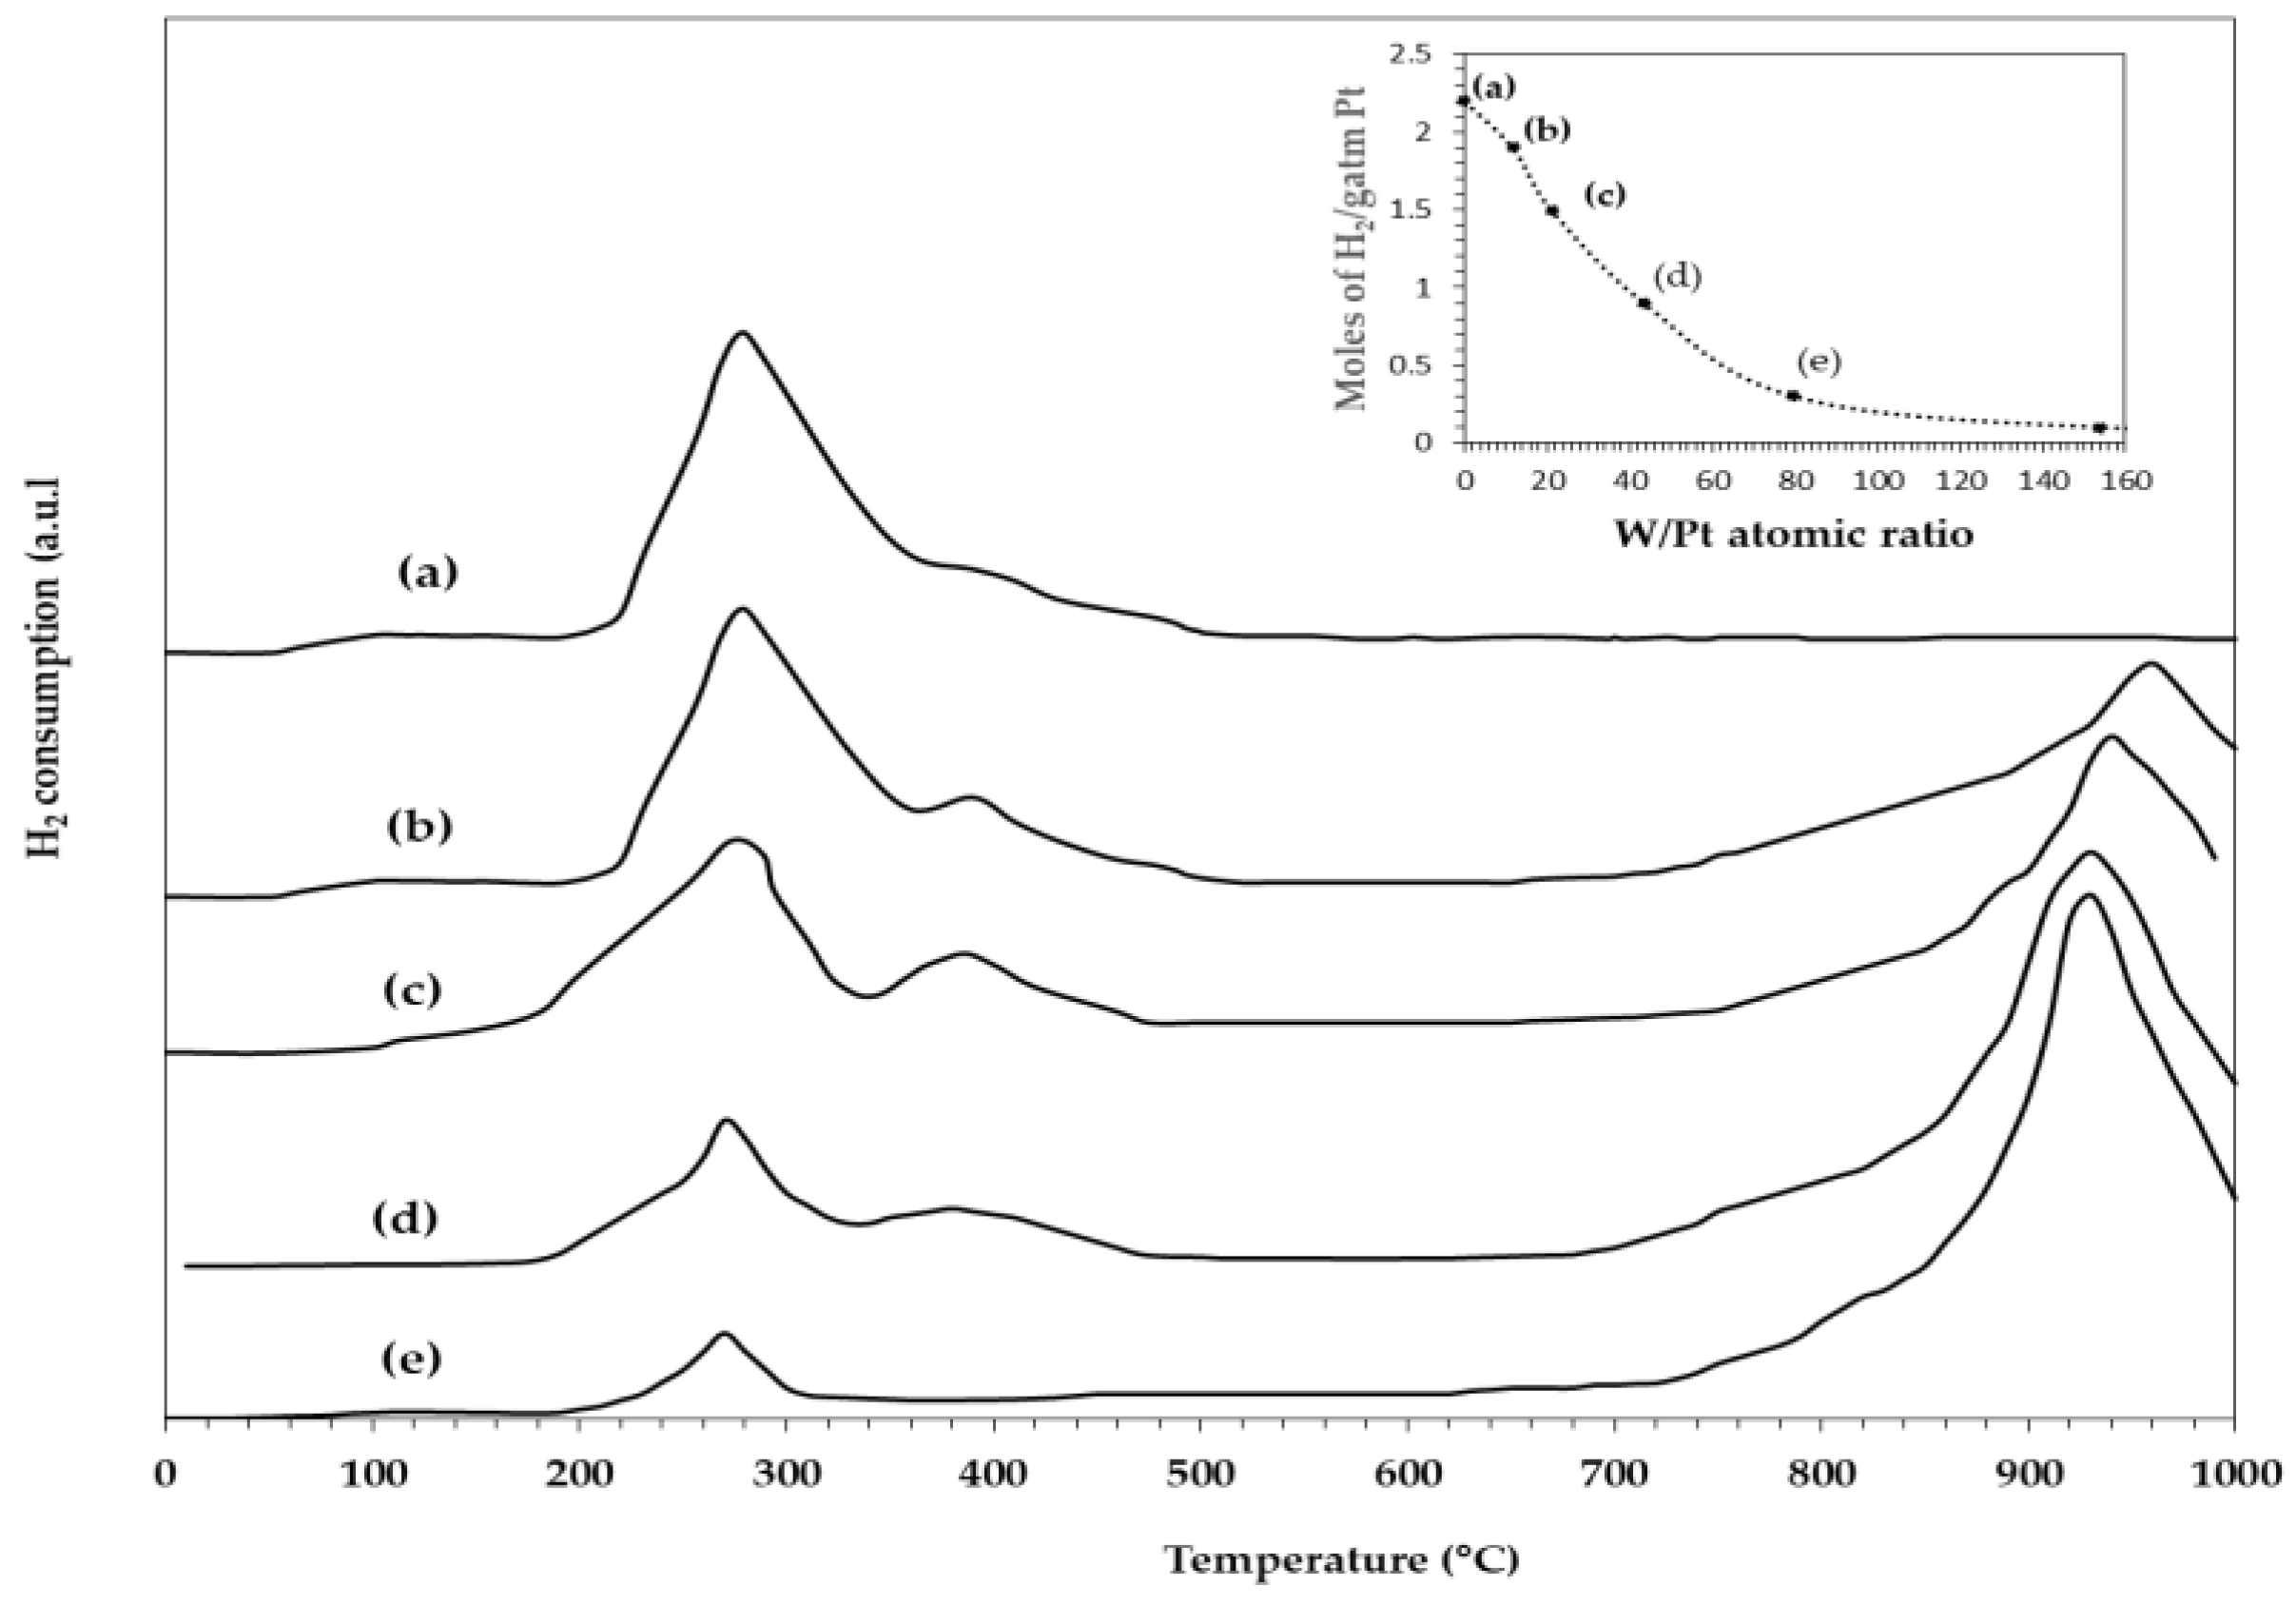
2.9. TPR of WOx on SiO2–Al2O3 Microspheres
TPR of the Pt/SiO2–Al2O3–WOx Catalysts
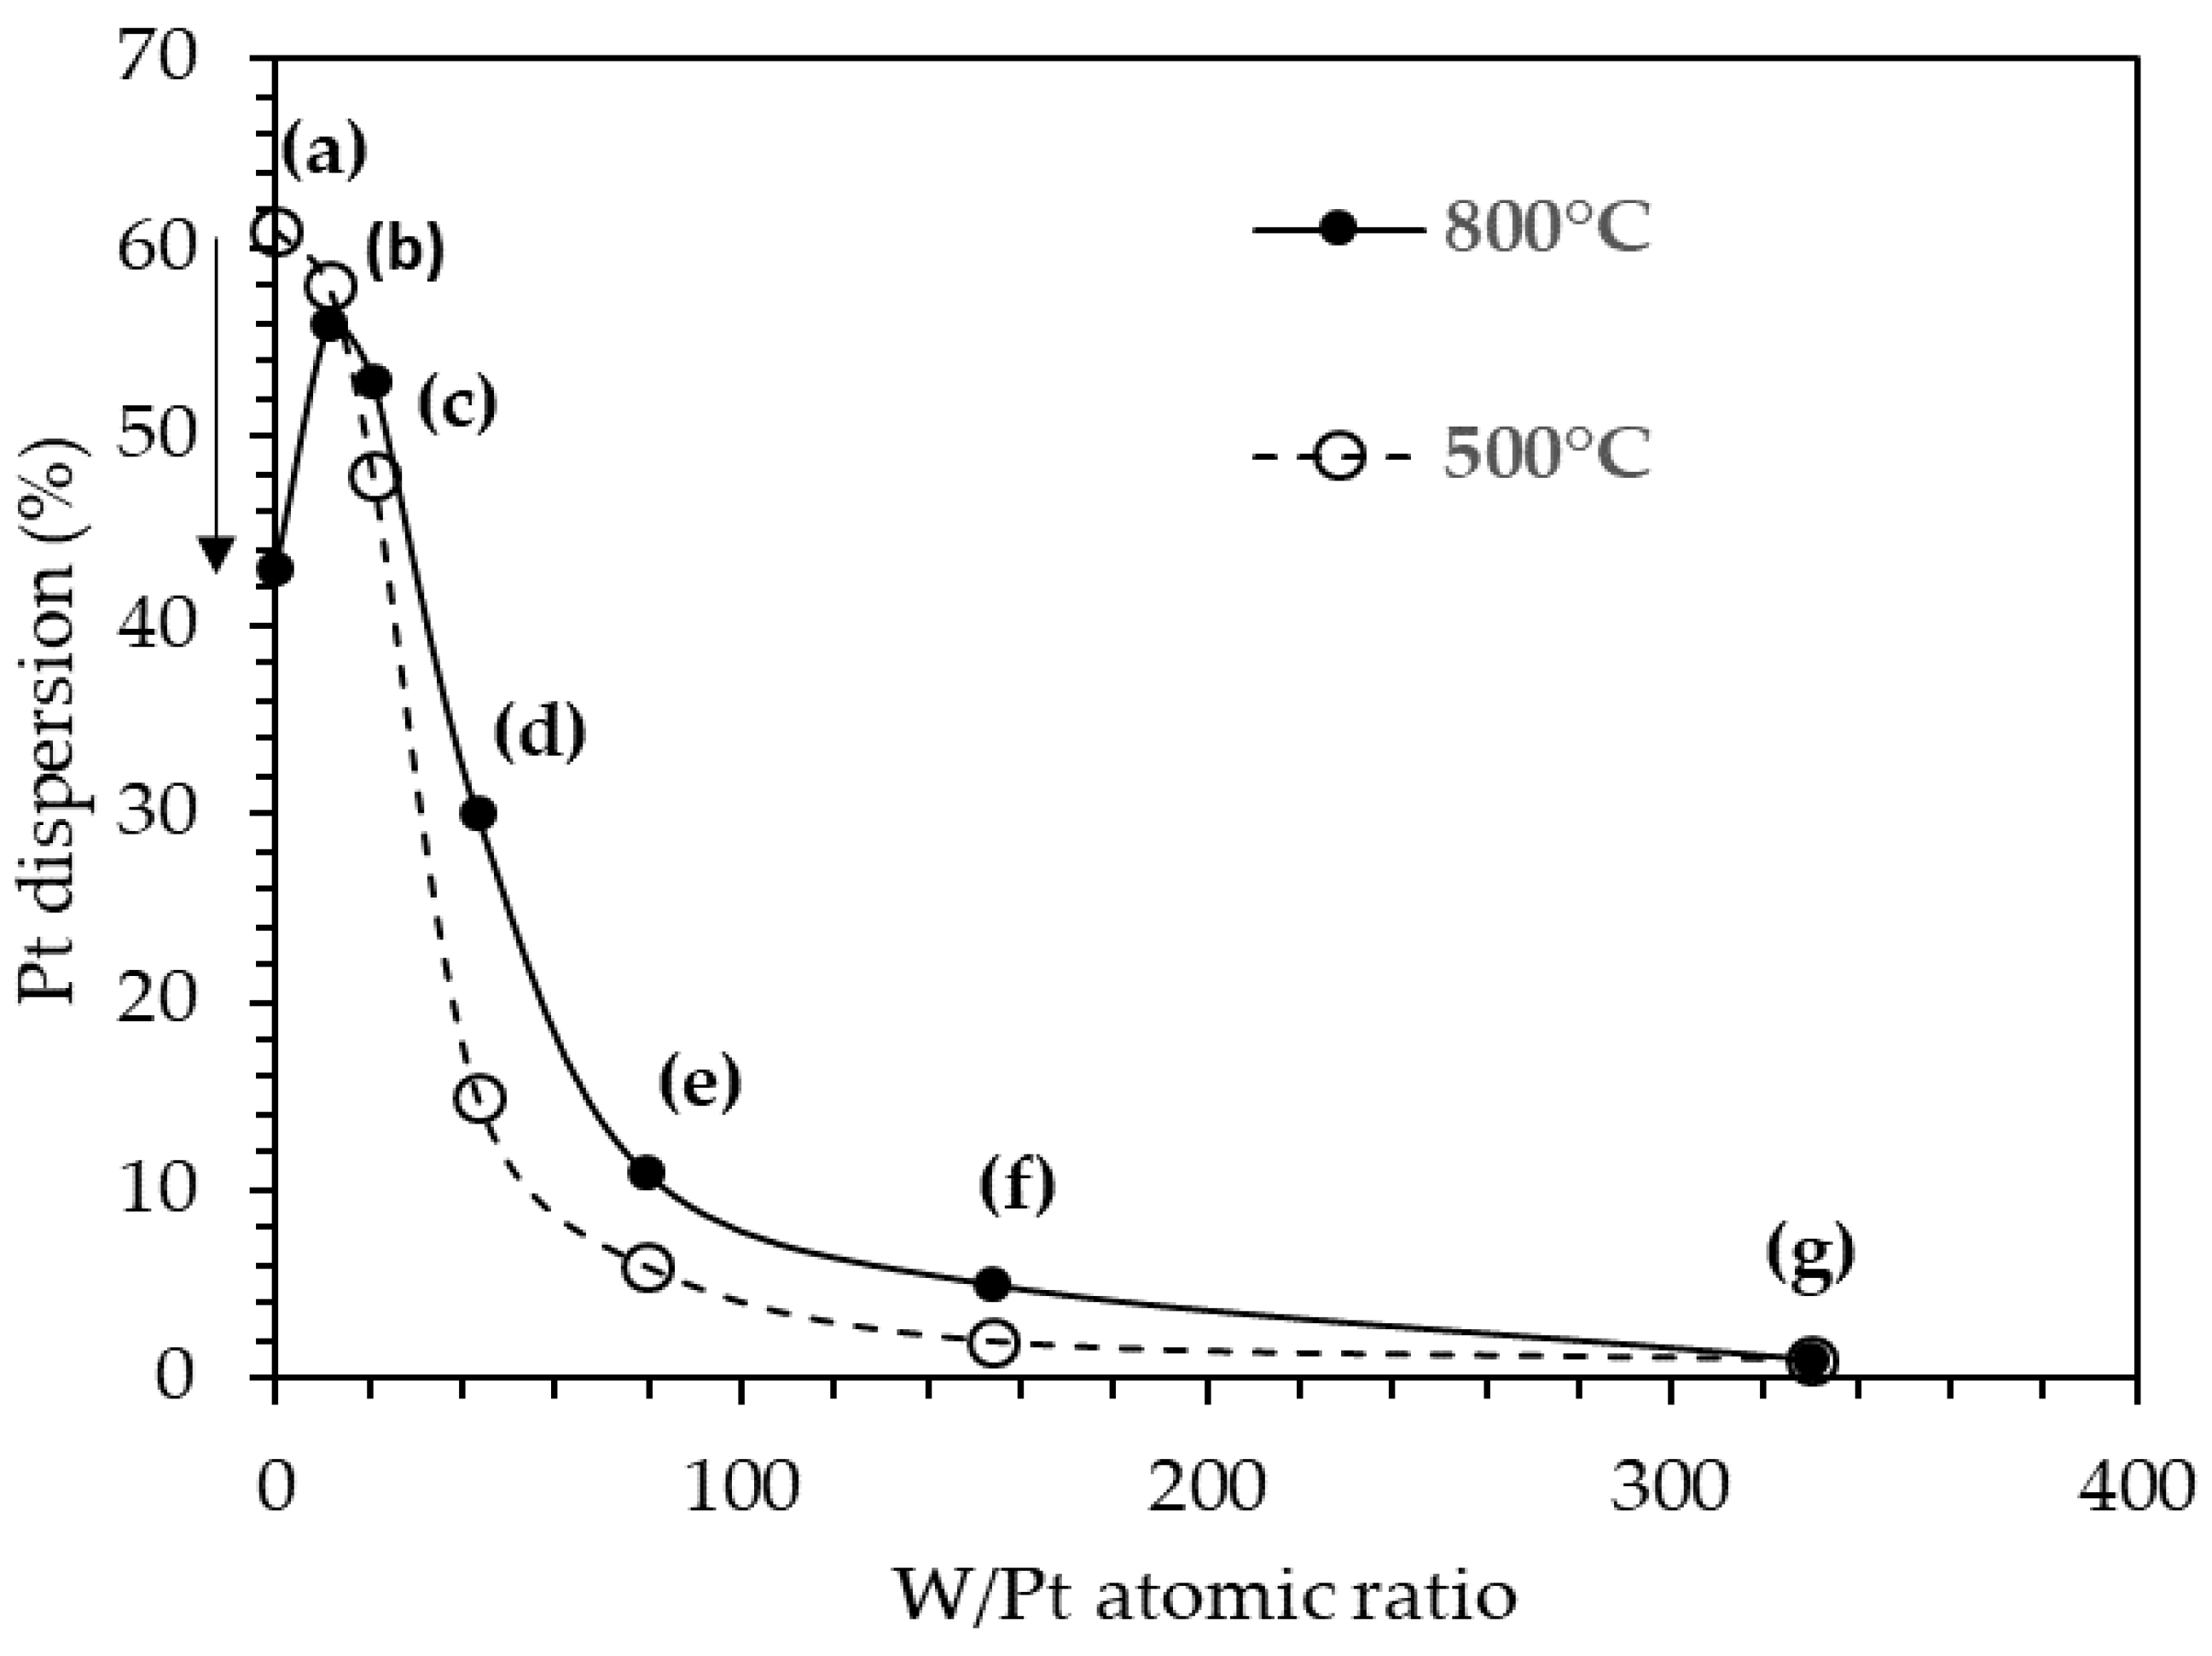
2.10. Dispersion of the Pt on the Pt/25SA–WOx Catalysts
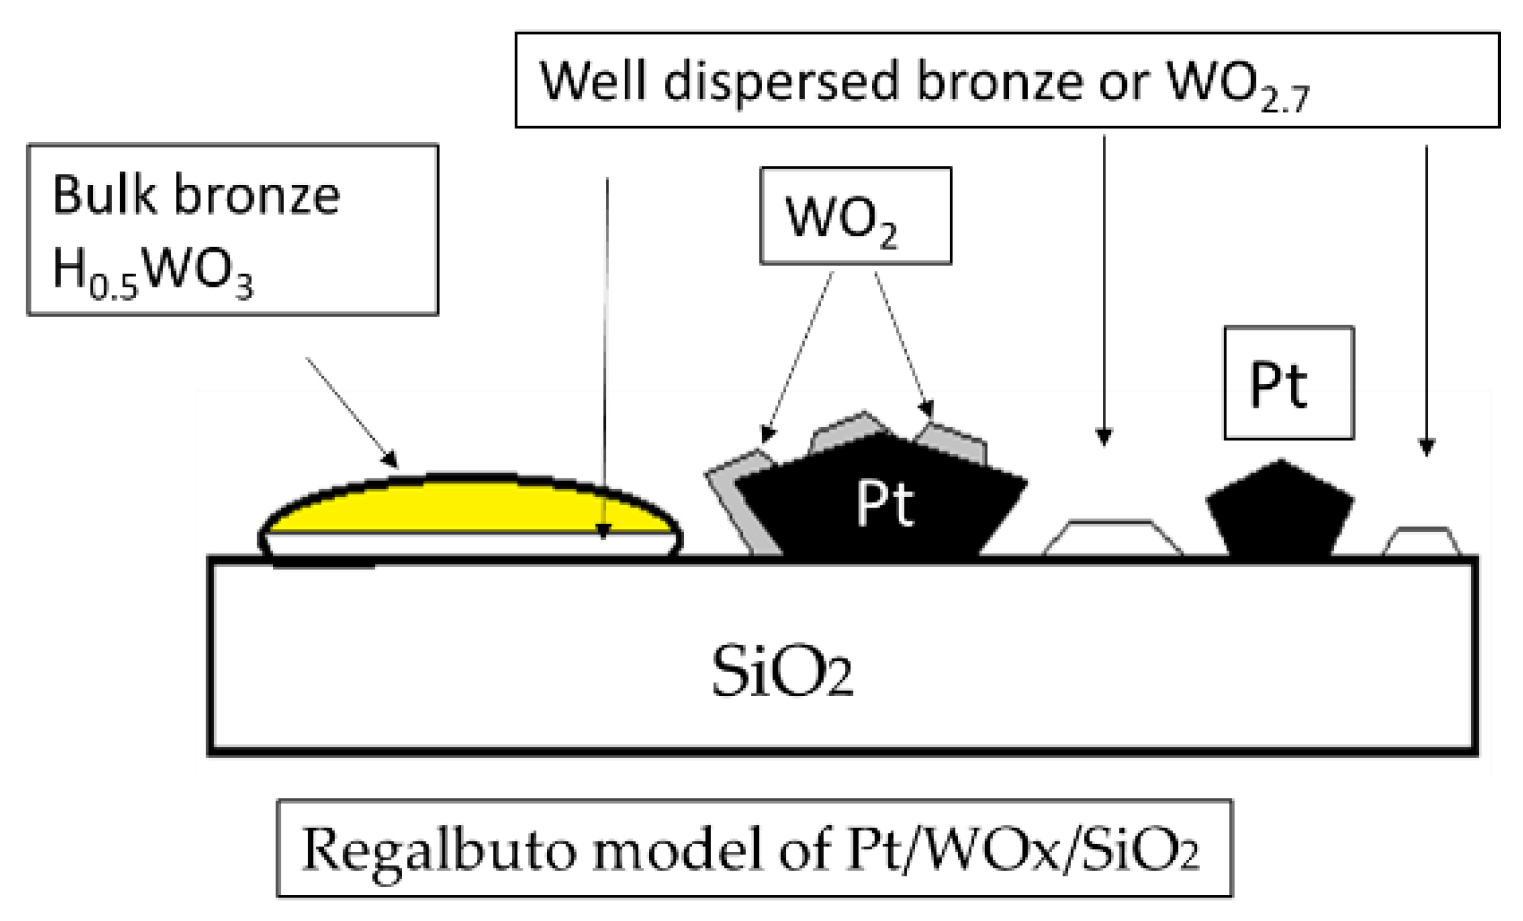
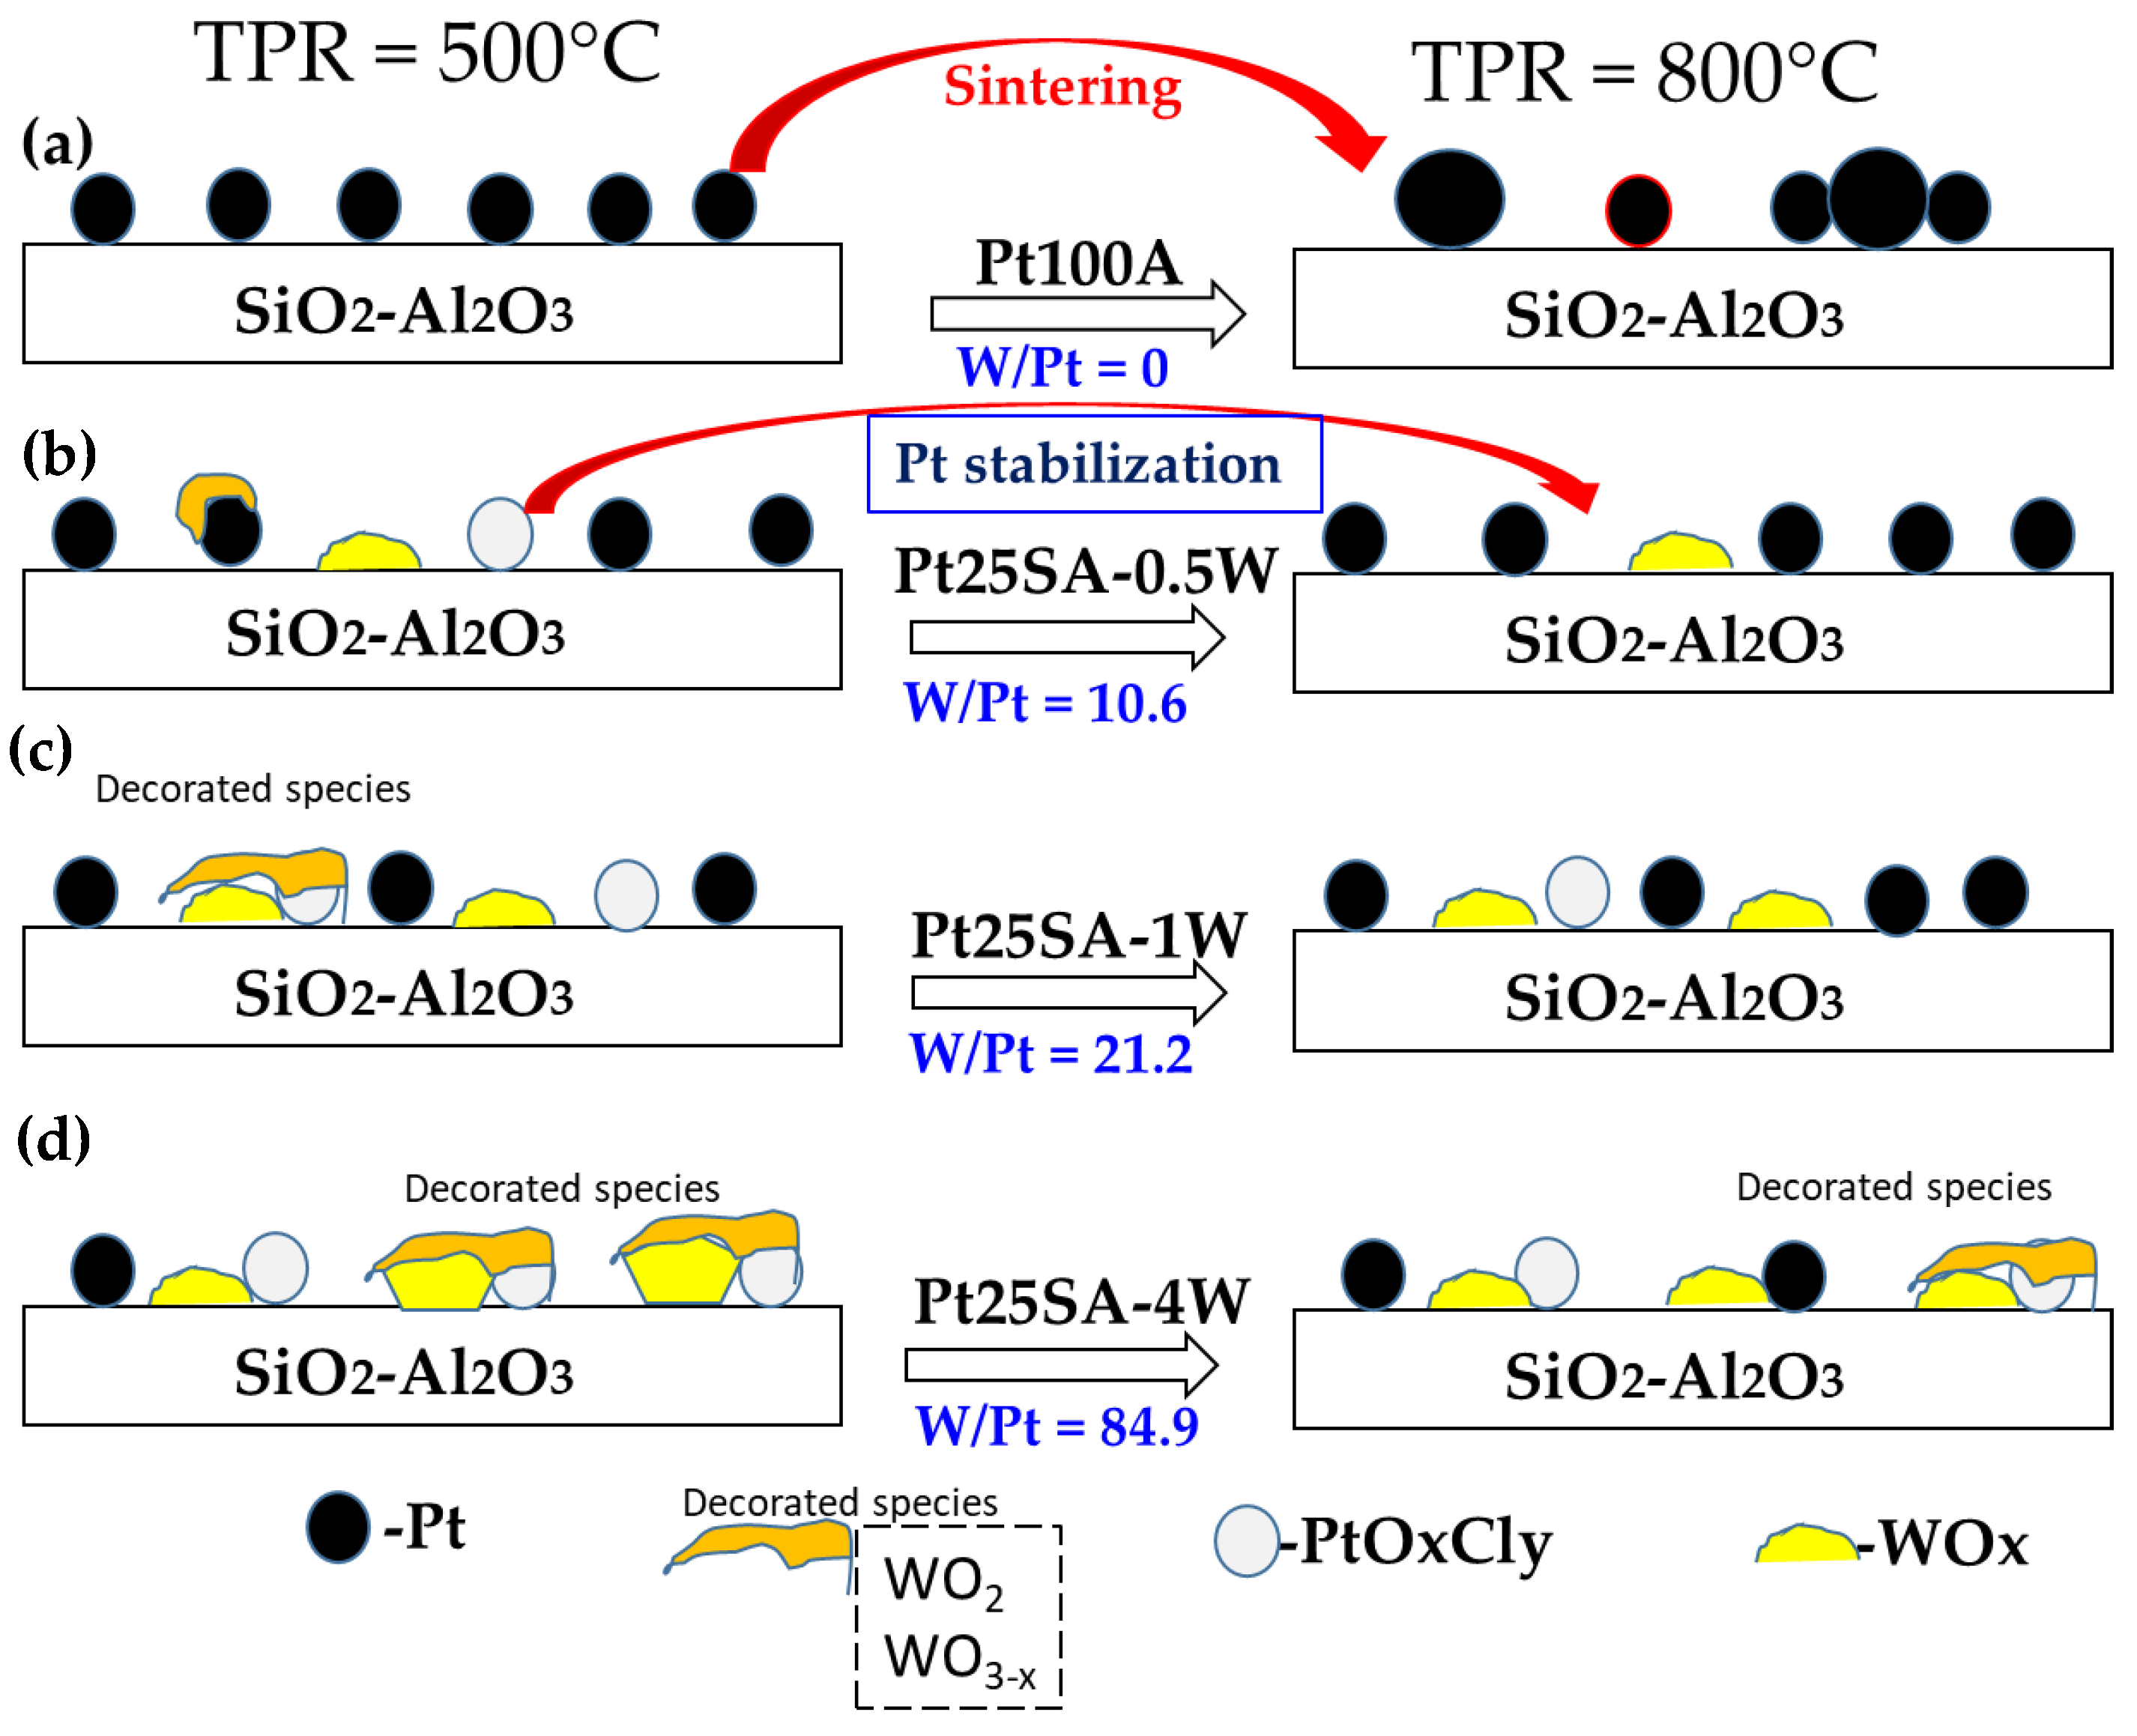
2.11. Surface Model
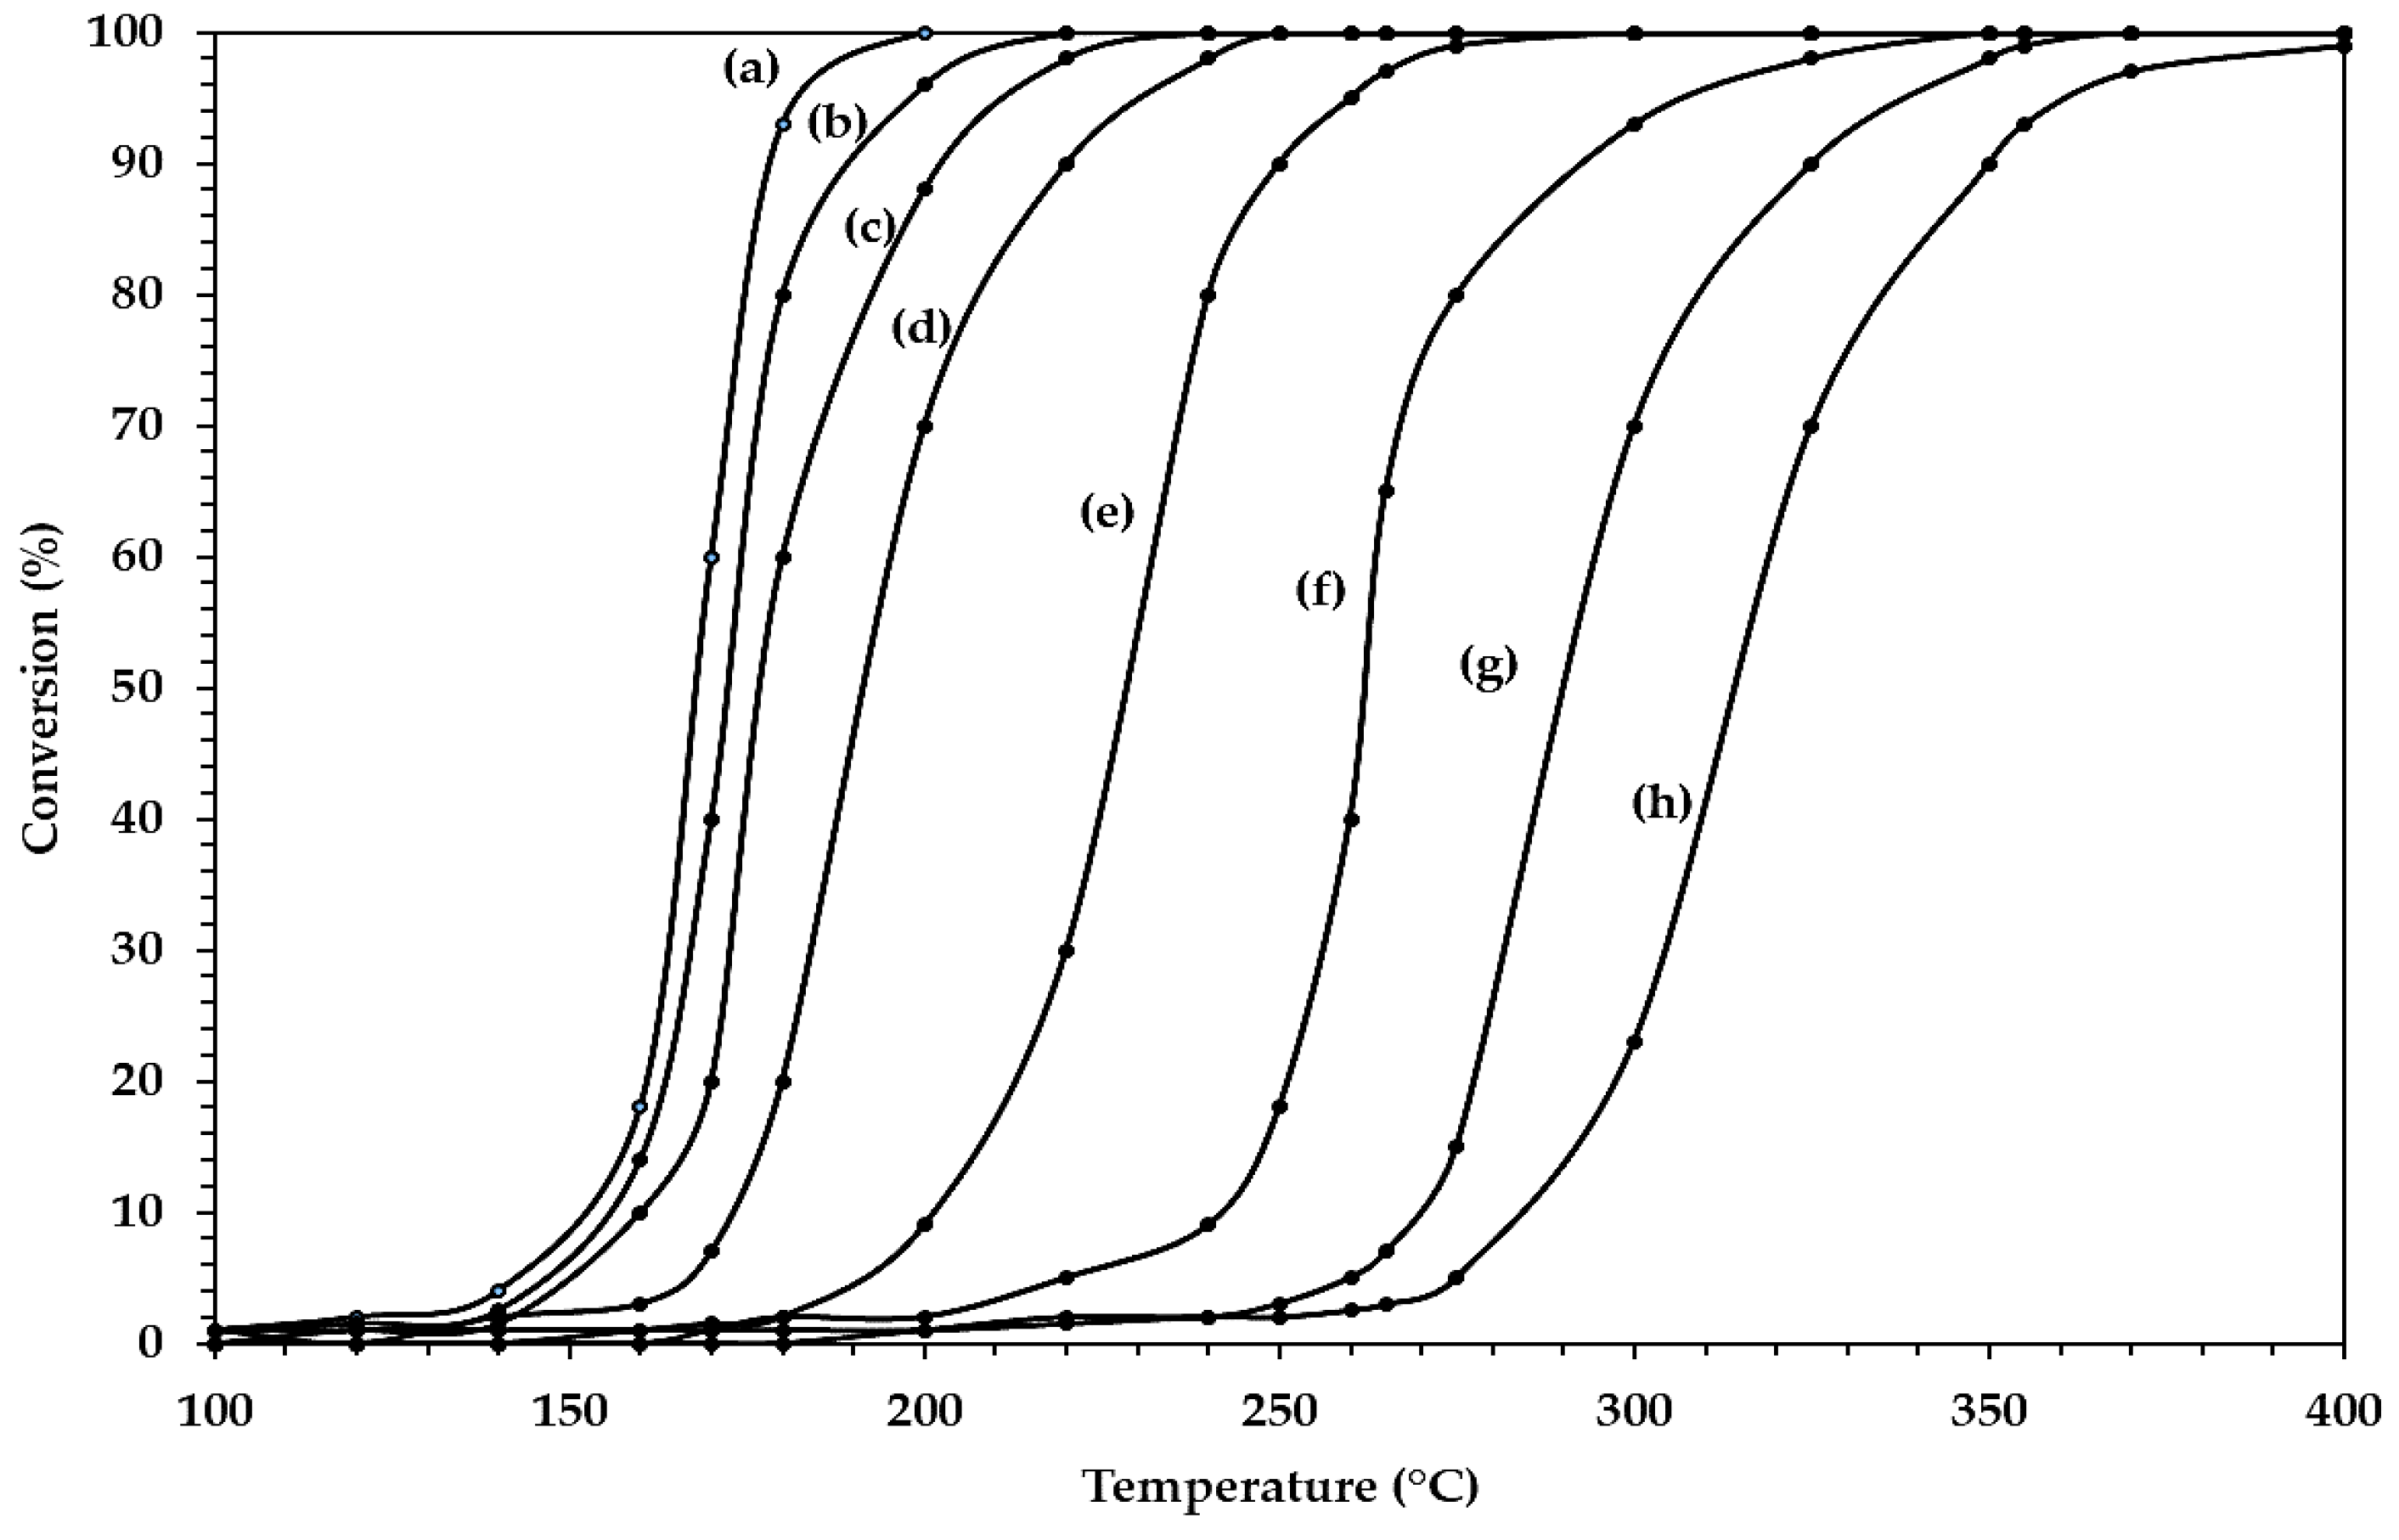
2.12. CO Combustion
2.13. Comparison with Other Studies
3. Materials and Methods
3.1. Preparation of Macro-Spheres of SiO2–Al2O3
3.2. Formation of Fines by Attrition Using the Jet-Cup Technique
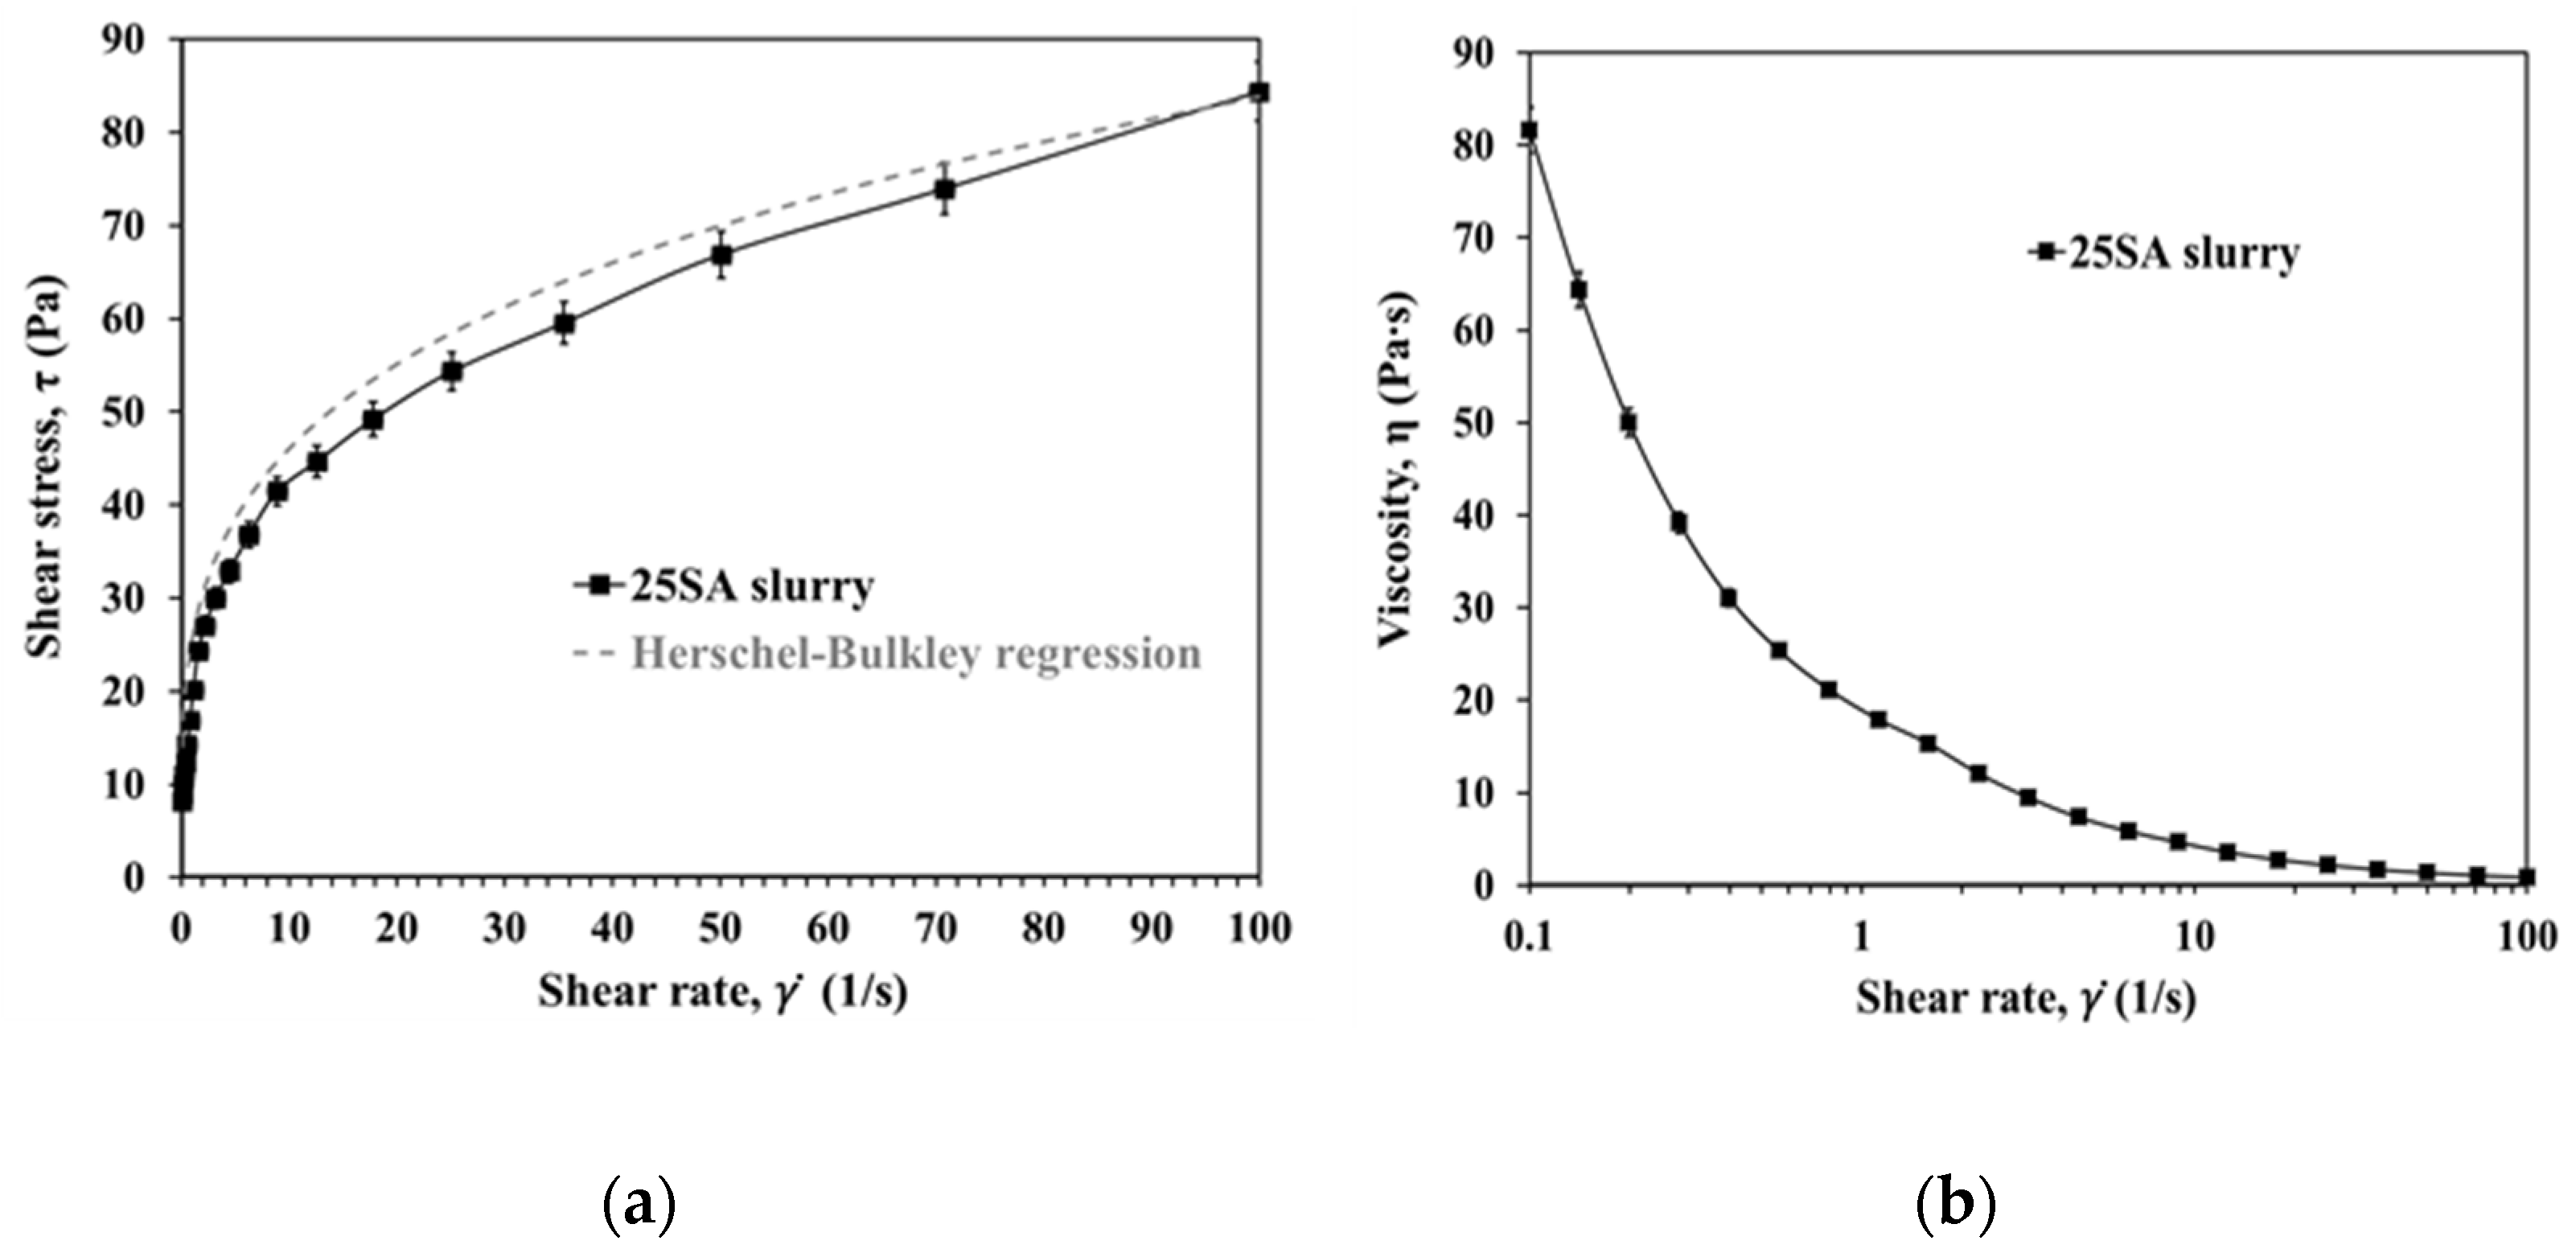
3.3. Preparation and Rheology of the 25SA Suspension for Spray Drying
3.4. Impregnation of WOx and Pt in the Microspheres
3.5. Characterization of SiO2–Al2O3 Oxides and Catalysts
3.5.1. X–ray Diffraction (XRD)
3.5.2. Scanning Electron Microscopy (SEM)
3.5.3. Optical Microscopy and Textural Analysis of Spray-Dried 25SA Microspheres
3.5.4. Temperature Programmed Reduction (TPR)
3.5.5. H2 Chemisorption
3.6. CO Combustion
4. Conclusions
Author Contributions
Funding
Acknowledgments
Conflicts of Interest
Appendix A. 25SA Suspension Rheology
Appendix B
Appendix B.1. Description of the Spray Dryer and Its Operating Parameters

Appendix B.2. Experiments to Obtain Microspheres with Two Disk Atomizers

| Straight Rectangular Vanes Disc | Curved Rectangular Vanes Disc | |||||||
|---|---|---|---|---|---|---|---|---|
| P1–DAR | P2–DAR | P3–DAR | P4–DAR | P1–DAC | P2–DAC | P3–DAC | P4–DAC | |
| Disc rotation speed 1, (rpm) | 3000 | 6000 | 11,500 | 14,000 | 3000 | 6000 | 11,500 | 14,000 |
Appendix B.3. Spray-Dried 25SA Microspheres Obtained with the Curved Rectangular Vanes Disk

Appendix B.4. Effect of the DAC-Disk Rotation Speeds on the Particle-Size Distributions (PSD) and the Sauter Mean Diameter (SMD)

References
- Sadeghbeigi, R. Fluid Catalytic Cracking Handbook, 3rd ed.; Butterworth–Heinemann: Waltham, MA, USA, 2012; pp. 117–123. [Google Scholar]
- Moreno-Montiel, N. Modelamiento de un Reactor de Microactividad para la Evaluación de Catalizadores del Proceso de Desintegración Catalítica: Modelos de Desintegración y Desactivación. Ph.D. Thesis, Metropolitan Autonomous University—Iztapalapa, Mexico City, Mexico, 2004. [Google Scholar]
- Vaarkamp, M.; Matheson-Stockwell, D. CO Oxidation Promoters for Use in FCC Processes. U.S. Patent 7,959,792, 14 June 2011. [Google Scholar]
- Melloa, F.L.; Gobbo, R.; Moure, G.T.; Miracca, I. Oxy–Combustion Technology Development for Fluid Catalytic Crackers (FCC)—Large Pilot Scale Demonstration. Energy Procedia 2013, 37, 7815–7824. [Google Scholar] [CrossRef] [Green Version]
- Chiranjeevi, T.; Ravichander, N.; Gokak, D.T.; Ravikumar, V.; Choudary, N.V. The Selection of Fluid Catalytic Cracking Catalysts and Additives: The Significance of Attrition Studies. Petrol. Sci. Technol. 2014, 32, 470–478. [Google Scholar] [CrossRef]
- de Carvalho, M.C.N.A.; Morgado, E., Jr.; Cerqueira, H.S.; Resende, N.S.; Schmal, M. Behavior of Fresh and Deactivated Combustion Promoter Additives. Ind. Eng. Chem. Res. 2004, 43, 3133–3136. [Google Scholar] [CrossRef]
- Blanton, W.A., Jr. NOx Control in Platinum–Promoted Complete Combustion Cracking Catalyst Regeneration. U.S. Patent 4,290,878, 22 September 1981. [Google Scholar]
- Cheng, W.C.; Kim, G.; Peters, A.W.; Zhao, X.; Rajagopalan, K.; Ziebarth, M.S.; Pereira, C.J. Environmental Fluid Catalytic Cracking Technology. Catal. Rev. Sci. Eng. 1998, 40, 39–79. [Google Scholar] [CrossRef]
- Venuto, P.B.; Habib, E.T., Jr. Fluid Catalytic Cracking with Zeolite Catalysts; Marcel Dekker, Inc.: New York, NY, USA, 1979; pp. 47–132. [Google Scholar]
- Kennedy, J.V.; Dight, L.B. Catalytic Cracking. U.S. Patent 4,214,978, 29 July 1980. [Google Scholar]
- Fraenkel, D.; Moselle, I.L. CO Oxidation Promoter and Use thereof for Catalytic Cracking. U.S. Patent 5,565,399, 15 October 1996. [Google Scholar]
- Child, J.E. NOx Control in Fluidized Bed Combustion. U.S. Patent 4,812,431, 14 March 1989. [Google Scholar]
- Avidan, A.A. Circulating Fluid Bed Combustion with CO Combustion Promoter and Reduced Combustion Air. U.S. Patent 4,927,348, 22 May 1990. [Google Scholar]
- Chester, W.A. CO Combustion Promoters: Past and Present. In Fluid Catalytic Cracking VII: Materials, Methods and Process Innovations, 1st ed.; Ocelli, M.L., Ed.; Elsevier Science & Technology: Oxford, UK, 2007; Volume 166, pp. 67–77. [Google Scholar]
- Silverman, L.D.; Speronello, B.K. Catalytic Cracking with Mullite Composition Promoted Combustion of Carbon Monoxide. U.S. Patent 4,608,357, 26 August 1986. [Google Scholar]
- Guisnet, M.; Mignard, S. Fluid Catalytic Cracking: Process, Catalyst and Chemistry. Actual. Chim. 2000, 2, 14–22. [Google Scholar]
- Passos, M.L.; Birchal, V.S. Manipulating Physical Properties of Powder. In Spray Drying Technology, 1st ed.; Woo, M.W., Mujumdar, A.S., Daud, W.R.W., Eds.; Publisher: Singapore, 2010; Volume 1, pp. 37–60. [Google Scholar]
- Lukasiewicz, S.J. Spray–Drying Ceramic Powders. J. Am. Ceram. Soc. 1989, 72, 617–624. [Google Scholar] [CrossRef]
- Fletcher, D.F.; Guo, B.; Harvie, D.J.E.; Langrish, T.A.G.; Nijdam, J.J.; Williams, J. What is Important in the Simulation of Spray Dryer Performance and How do Current CFD Models Perform? Appl. Math. Model. 2006, 30, 1281–1292. [Google Scholar] [CrossRef] [Green Version]
- Masters, K. Spray Drying Handbook, 5th ed.; Longman Scientific & Technical: London, UK, 1991. [Google Scholar]
- Anandharamakrishnan, C.; Ishwarya, S.P. Spray Drying Techniques for Food Ingredient Encapsulation, 1st ed.; John Wiley & Sons: Chicago, IL, USA, 2015; pp. 1–36. [Google Scholar]
- Filková, I.; Huang, L.X.; Mujumdar, A.S. Industrial Spray Drying Systems. In Handbook of Industrial Drying, 4th ed.; Mujumdar, A.S., Ed.; CRC Press: Boca Raton, FL, USA, 2014; Volume 10, pp. 216–256. [Google Scholar]
- Moyers, C.G.; Baldwin, G.W. Psychrometry, Evaporative Cooling, and Solids Drying. In Perry’s Chemical Engineers’ Handbook, 7th ed.; Perry, R.H., Green, D.W., Eds.; McGraw-Hill: New York, NY, USA, 1997; Volume 7, pp. 12-1–12-90. [Google Scholar]
- Nielse, K. Atomizer Wheel for the Atomization of Suspensions of Hard–Wearing Materials. U.S. Patent 3,454,226, 8 July 1969. [Google Scholar]
- Hansen, O.E. Atomizer Wheel for the Atomization of Liquids. U.S. Patent 4,303,200, 1 December 1981. [Google Scholar]
- Jensen, A.N.; Pisecky, J. Atomizer Wheel for Use in a Spray Drying Apparatus. U.S. Patent 4,733,821, 29 March 1988. [Google Scholar]
- Svarrer, L. Atomizer Wheel with Steel Bushings. U.S. Patent 4,684,065, 4 August 1987. [Google Scholar]
- Svendsen, G. Rotary Atomizer and a Method of Operating It. U.S. Patent 5,518,180, 21 May 1996. [Google Scholar]
- Contreras, J.L.; Fuentes, G.A.; Salmones, J.; Zeifert, B. Thermal Stability of Pt Nanoparticles Supported on WOx/Al2O3 for n-Heptane Hydroconversion. Mat. Res. Soc. Proc. 2010, 1279, 123–141. [Google Scholar] [CrossRef]
- Contreras, J.L.; Fuentes, G.A.; García, L.A.; Salmones, J.; Zeifert, B. WOx Effect on the Catalytic Properties of Pt Particles on Al2O3. J. Alloys Compd. 2009, 483, 450–452. [Google Scholar] [CrossRef]
- Hernández, I.P.; Gochi-Ponce, Y.; Contreras, J.L.; Fernández, A.M. Steam Reforming of Ethanol over Nickel-Tungsten Catalyst. Int. J. Hydrog. Energy 2010, 35, 12098–12104. [Google Scholar] [CrossRef]
- Zhao, R.; Goodwin Jr., J.G.; Oukaci, R. Attrition Assessment for Slurry Bubble Column Reactor Catalysts. Appl. Catal. A Gen. 1999, 189, 99–116. [Google Scholar] [CrossRef]
- Trunov, M.A.; Schoenit, M.; Zhu, X.; Dreizin, E.L. Effect of Polymorphic Phase Transformations in Al2O3 Film on Oxidation Kinetics of Aluminum Powders. Combust. Flame 2005, 140, 310–318. [Google Scholar] [CrossRef]
- Ozawa, M.; Hashimoto, K.; Suzuki, S. High–Temperature Structural Change of Catalytic MnOx-LaOx-Al2O3 Powder for Lean-Exhaust NOx Removal Treatment. J. Mater. Sci. 2001, 36, 1401–1405. [Google Scholar] [CrossRef]
- Wickrsheim, K.A.; Korpi, G.K. Interpretation of the Infrared Spectrum of Boehmite. J. Chem. Phys. 1965, 42, 579–583. [Google Scholar] [CrossRef]
- Sun, J.; Xu, Z.; Li, W.; Shen, X. Effect of Nano-SiO2 on the Early Hydration of Alite-Sulphoaluminate Cement. Nanomaterials 2017, 7, 102. [Google Scholar] [CrossRef] [Green Version]
- Diaz, C.; Valenzuela, M.L.; Cifuentes-Vaca, O.; Segovia, M.; Laguna-Bercero, M.A. Incorporation of NiO into SiO2, TiO2, Al2O3, and Na4.2Ca2.8(Si6O18) Matrices: Medium Effect on the Optical Properties and Catalytic Degradation of Methylene Blue. Nanomaterials 2020, 10, 2470. [Google Scholar] [CrossRef]
- Ivanova, A.S.; Slavinskaya, E.M.; Gulyaev, R.V.; Zaikovskii, V.I.; Stonkus, O.A.; Danilova, I.G.; Plyasova, L.M.; Polukhina, I.A.; Boronin, A.I. Metal–Support Interactions in Pt/Al2O3 and Pd/Al2O3 Catalysts for CO Oxidation. Appl. Catal. B Environ. 2010, 97, 57–71. [Google Scholar] [CrossRef]
- Huang, L.X.; Mujumdar, A.S. The Effect of Rotary Disk Atomizer RPM on Particle Size Distribution in a Semi–Industrial Spray Dryer. Dry. Technol. 2008, 26, 1319–1325. [Google Scholar] [CrossRef]
- Filková, I.; Weberschinke, J. Effect of Vane Geometry on Droplet Size and Size Distribution in Spray Dryer. In Drying’80; Mujumdar, A.S., Ed.; Hemisphere/McGraw–Hill: New York, NY, USA, 1980; Volume 2, pp. 417–424. [Google Scholar]
- Ahmed, M.; Youssef, M.S. Characteristics of Mean Droplet Size Produced by Spinning Disk Atomizers. J. Fluids Eng. 2012, 134, 1–9. [Google Scholar] [CrossRef]
- Ahmed, M.; Youssef, M.S. Influence of Spinning Cup and Disk Atomizer Configurations on Droplet Size and Velocity Characteristics. Chem. Eng. Sci. 2014, 107, 149–157. [Google Scholar] [CrossRef]
- Peng, H.; Shan, X.; Ling, X.; Wang, D.; Li, J. Ligament–Type Granulation of Molten Slag in Different Rotary Disk Configurations. Appl. Therm. Eng. 2018, 128, 1565–1578. [Google Scholar] [CrossRef]
- Sonwane, C.G.; Ludovice, P.J. A Note on Micro–and Mesopores in the Walls of SBA–15 and Hysteresis of Adsorption Isotherms. J. Mol. Catal. A Chem. 2005, 238, 135–137. [Google Scholar] [CrossRef]
- Ryoo, R.; Jun, S.; Kim, J.M.; Kim, M.J. Generalised Route to the Preparation of Mesoporous Metallosilicates via Post–Synthetic Metal Implantation. Chem. Commun. 1997, 41, 2225–2226. [Google Scholar] [CrossRef]
- Esparza, J.M.; Ojeda, M.L.; Campero, A.; Hernández, G.; Felipe, C.; Asomoza, M.; Cordero, S.; Kornhauser, I.; Rojas, F. Development and Sorption Characterization of some Model Mesoporous and Microporous Silica Adsorbents. J. Mol. Catal. A Chem. 2005, 228, 97–110. [Google Scholar] [CrossRef]
- Brunauer, S. The Adsorption of Gases and Vapours; Oxford University Press: London, UK, 1944. [Google Scholar]
- Thomas, R.; van Oers, E.M.; de Beer, V.H.J.; Moulijn, J.A. Characterization of silica-supported molybdenum oxide and tungsten oxide. Reducibility of the oxidic state versus hydrodesulfurization activity of the sulfided state. J. Catal. 1983, 84, 275–287. [Google Scholar] [CrossRef] [Green Version]
- Regalbuto, J.R.; Wolf, E.E. An Integrated Study of Pt/WO3/SiO2 Catalysts for the NO-CO Reaction: I. Catalyst Characterization by XRD, Chemisorption, and XPS. J. Catal. 1987, 107, 114–128. [Google Scholar] [CrossRef]
- Scelza, O.A.; De Miguel, S.R.; Baronetti, G.T.; Castro, A.A. Performance of Pt−Re/Al2O3 Catalysts with Different Radial Distribution Profiles. React. Kinet. Catal. Lett. 1987, 33, 143–148. [Google Scholar] [CrossRef]
- Yao, H.C.; Sieg, M.; Plummer, H.K., Jr. Surface interactions in the Pt/γ-Al2O3 system. J. Catal. 1979, 59, 365–374. [Google Scholar] [CrossRef]
- McNicol, B.D.; Short, R.T. The Reducibility of Ru, Pt/Ru and Pt Oxide Electrocatalysts as Measured by Temperature-Programmed Reduction and Cyclic Voltammetry. J. Electroanal. Chem. Interf. Electrochem. 1978, 92, 115–120. [Google Scholar] [CrossRef]
- Lieske, H.; Lietz, G.; Spindler, H.; Völter, J. Reactions of Platinum in Oxygen- and Hydrogen-Treated Ptγ-Al2O3 Catalysts: I. Temperature-Programmed Reduction, Adsorption, and Redispersion of Platinum. J. Catal. 1983, 81, 8–16. [Google Scholar] [CrossRef]
- Dautzenberg, F.M.; Wolters, H.B.M. State of Dispersion of Platinum in Alumina-Supported Catalysts. J. Catal. 1978, 51, 26–39. [Google Scholar] [CrossRef]
- Hurst, N.W.; Gentry, S.J.; Jones, A.; McNicol, B.D. Temperature Progammed Reduction. Catal. Rev. 1982, 24, 233–309. [Google Scholar] [CrossRef]
- M’Boungou, J.S.; Schmitt, J.L.; Maire, G.; Garin, F. Role of Tungsten in Supported Pt-W Reforming Catalysts Part I. Modification of Platinum Activity and Selectivity by Addition of Tungsten. Catal. Lett. 1991, 10, 391–400. [Google Scholar] [CrossRef]
- Ruckenstein, E.; Pulvermacher, B. Effect of the Pore Size on the Aging of Supported Metals. J. Catal. 1975, 37, 416–423. [Google Scholar] [CrossRef]
- M’Boungou, J.S.; Hilaire, L.; Maire, G.; Garin, F. Role of Tungsten in Supported Pt-W Reforming Catalysts Part II. Influence of the tungsten loading and metal-support interactions effect. Catal. Lett. 1991, 10, 401–411. [Google Scholar] [CrossRef]
- Park, J.W.; Thomas, K.; Gestel, J.V.; Gilson, J.P.; Collet, C.; Dath, J.P.; Houalla, M. Study of Ir/WO3/Al2O3 Ring Opening Catalysts. Appl. Catal. A Gen. 2010, 388, 37–44. [Google Scholar] [CrossRef]
- Contreras, J.L.; Fuentes, G.A.; Zeifert, B.; Salmones, J. Stabilization of Supported Platinum Nanoparticles on γ-Alumina Catalysts by Addition of Tungsten. J. Alloys Compd. 2009, 483, 371–373. [Google Scholar] [CrossRef]
- Alexeev, O.; Gates, B. EXAFS characterization of supported metal-complex and metal-cluster catalysts made from organometallic precursors. Top. Catal. 2000, 10, 273–293. [Google Scholar] [CrossRef]
- Contreras, J.L.; Figueroa, A.; Zeifert, B.; Salmones, J.; Fuentes, G.A.; Vazquez, T.; Angeles, D.; Nuño, L. Production of Hydrogen by Ethanol Steam Reforming using Ni-Co-ex-Hydrotalcite Catalysts, Stabilized with Tungsten Oxides. Int. J. Hydrog. Energy 2021, 46, 6474–6493. [Google Scholar] [CrossRef]
- Regalbuto, J.R.; Allen, C.W.; Wolf, E.E. An Integrated Study of Pt/WO3/SiO2 Catalysts for the NO-CO Reaction. II. TEM Investigation of Overlayer Formation on Model Pt-WO3/SiO2 Catalysts. J. Catal. 1987, 108, 304–322. [Google Scholar] [CrossRef]
- Yermakov, Y.I. Anchored Complexes in Fundamental Catalytic Research. Stud. Surf. Sci. Catal. 1981, 7, 57–76. [Google Scholar]
- Regalbuto, J.R.; Wolf, E.E. An Integrated Study of Pt/WO3/SiO2 Catalysts for the NO-CO Reaction III. FTIR Kinetic Study and Correlation of Promotional Effects. J. Catal. 1988, 109, 12–24. [Google Scholar] [CrossRef]
- Grisel, R.J.H.; Slyconish, J.J.; Niewenhuys, B.E. Oxidation Reactions over Multi-Component Catalysts: Low-Temperature CO Oxidation and the Total Oxidation of CH4. Top. Catal. 2001, 16, 425–431. [Google Scholar] [CrossRef]
- Bourane, A.; Bianchi, D. Oxidation of CO on a Pt/Al2O3 Catalyst: From the Surface Elementary Steps to Lighting-Off Tests: II. Kinetic Study of the Oxidation of Adsorbed CO Species Using Mass Spectroscopy. J. Catal. 2002, 209, 114–125. [Google Scholar] [CrossRef]
- Gu, L.; Chen, X.; Zhou, Y.; Zhu, Q.; Huang, H.; Lu, H. Propene and CO Oxidation on Pt/Ce-Zr-SO42- Diesel Oxidation Catalysts: Effect of Sulfate on Activity and Stability. Chin. J. Catal. 2017, 38, 607–615. [Google Scholar] [CrossRef]
- Thormählen, P.; Skoglundh, M.; Fridell, E.; Anderson, B. Low-Temperature CO Oxidation over Platinum and Cobalt Oxide Catalysts. J. Catal. 1999, 188, 300–310. [Google Scholar] [CrossRef]
- Padilla, R.; Benito, M.; Rodríguez, L.; Serrano-Lotina, A.; Daza, L. Platinum Supported Catalysts for Carbon Monoxide Preferential Oxidation: Study of Support Influence. J. Power Sources 2009, 192, 114–119. [Google Scholar] [CrossRef]
- Manasilp, A.; Gulari, E. Selective CO Oxidation over Pt/Alumina Catalysts for Fuel Cell Applications. Appl. Catal. B Environ. 2002, 37, 17–25. [Google Scholar] [CrossRef]
- Akil, J.; Siffert, S.; Laurence, P.R.; Debecker, D.P.; Devred, F.; Cousin, R.; Poupin, C. Effect of Precious Metals on NO Reduction by CO in Oxidative Conditions. Appl. Sci. 2020, 10, 3042. [Google Scholar] [CrossRef]
- Wilson, R.C. Method of Regenerating a Hydrocarbon Conversion Catalyst to Minimize Carbon Monoxide in Regenerator Effluent. U.S. Patent 3,808,121, 30 April 1974. [Google Scholar]
- Gupta, R.P. Fluidizable Particulate Materials and Methods of Making Same. U.S. Patent 5,972,835, 26 October 1999. [Google Scholar]
- Nayak, B.B.; Mishra, P.K.; Tripathy, H.K.; Acharya, B.S. Jet–Wheel Impact Atomizer for Spray Drying and a Process for the Preparation of Finely Dispersed Spray of Slurry/Liquid. Patent WO 2007/096905, 30 August 2007. [Google Scholar]
- Nayak, B.B.; Mishra, P.K.; Tripathy, H.K.; Acharya, B.S. Jet–Wheel Impact Atomizer for Spray Drying. U.S. Patent 7,829,041, 9 November 2010. [Google Scholar]
- Karakonstantis, K.; Bourikas, K.; Lycourghiotis, A. Tungsten–Oxo-Species Deposited on Alumina. I. Investigation of the Nature of the Tungstates Deposited on the Interface of the γ-Alumina/Electrolyte Solutions at Various pH’s. J. Catal. 1996, 162, 295–305. [Google Scholar] [CrossRef]
- Brunauer, S.; Emmett, P.H.; Teller, E. Adsorption of Gases in Multimolecular Layers. J. Am. Chem. Soc. 1938, 60, 309–319. [Google Scholar] [CrossRef]
- Lippens, B.C.; Boer, J.H. Studies on Pore Systems in Catalysts: V. The t Method. J. Catal. 1965, 4, 319–323. [Google Scholar] [CrossRef]
- Barrett, E.P.; Joyner, L.G.; Halenda, P.P. The Determination of Pore Volume and Area Distributions in Porous Substances. I. Computations from Nitrogen Isotherms. J. Am. Chem. Soc. 1951, 73, 373–380. [Google Scholar] [CrossRef]
- Prasad, J.; Murthy, K.R.; Menon, P.G. The Stoichiometry of Hydrogen-Oxygen Titrations on Supported Platinum Catalysts. J. Catal. 1978, 52, 515–520. [Google Scholar] [CrossRef]
- Holdsworth, S.D. Rheological Models used for the Prediction of the Flow Properties of Food Products: A Literature Review. Trans. Inst. Chem. Eng. Part C. 1993, 71, 139–179. [Google Scholar]
- Rao, M.A. Flow and Functional Models for Rheological Properties of Fluid Foods. In Rheology of Fluid, Semisolid, and Solid Foods, 2nd ed.; Rao, M.A., Ed.; Food Engineering Series: Boston, MA, USA, 2014; pp. 27–58. [Google Scholar]
- Mishra, P.K.; Nayak, B.B.; Mishra, B.K. Influence of Behaviour of Alumina Slurry on Quality of Alumina Powder Prepared by Jet Wheel Impact Atomization. Powder Technol. 2009, 196, 272–277. [Google Scholar] [CrossRef]
- Pradhan, M.; Bhargava, P. Influence of Sucrose Addition on Rheology of Alumina Slurries Dispersed with a Polyacrylate Dispersant. J. Am. Ceram. Soc. 2005, 88, 833–838. [Google Scholar] [CrossRef]
- Lefebvre, A.H.; McDonell, V.G. Atomization and Sprays, 2nd ed.; CRC Press: Boca Raton, FL, USA, 2017; pp. 55–70. [Google Scholar]
- Handscomb, C.S.; Kraft, M.; Bayly, A.E. A New Model for the Drying of Droplets Containing Suspended Solids. Chem. Eng. Sci. 2009, 64, 228–246. [Google Scholar] [CrossRef]
- Elversson, J.; Millqvist–Fureby, A.; Alderborn, G.; Elofsson, U. Droplet and Particle Size Relationship and Shell Thickness of Inhalable Lactose Particles during Spray Drying. J. Pharm. Sci. 2003, 92, 900–910. [Google Scholar] [CrossRef]
- Walton, D.E. The Morphology of Spray–dried Particles a Qualitative View. Dry. Technol. 2000, 18, 1943–1986. [Google Scholar] [CrossRef]
- Alamilla-Beltrán, L.; Chanona-Pérez, J.J.; Jiménez-Aparicio, A.R.; Gutiérrez-López, G.F. Description of Morphological Changes of Particles along Spray Drying. J. Food Eng. 2005, 67, 179–184. [Google Scholar] [CrossRef]


| Sample | wt% SiO2 | wt% Al2O3 | After Jet-Cup Test (%) |
|---|---|---|---|
| 100A | 0 | 100 | 11.1 |
| 15SA | 15.94 | 84.06 | 8.7 |
| 20SA | 19.74 | 80.26 | 8.2 |
| 25SA | 25.82 | 74.18 | 7.1 |
| Straight Rectangular Vanes Disk | Curved Rectangular Vanes Disk | |||||||
|---|---|---|---|---|---|---|---|---|
| P1–DAR | P2–DAR | P3–DAR | P4–DAR | P1–DAC | P2–DAC | P3–DAC | P4–DAC | |
| Rotation speed of the disc, rpm | 3000 | 6000 | 11,500 | 14,000 | 3000 | 6000 | 11,500 | 14,000 |
| Particle diameter range 1, μm | 10–230 | 10–230 | 10–150 | 10–130 | 10–230 | 10–210 | 10–170 | 10–150 |
| Sauter mean diameter (SMD), μm | 125 | 103 | 79 | 63 | 117 | 101 | 81 | 73 |
| Apparent bulk density of powder 2, g/cm3 | 0.61 | 0.63 | 0.64 | 0.67 | 0.64 | 0.74 | 0.77 | 0.79 |
| 100A2 | 25SA–0.5W | 25SA–1W | 25SA–2W | 25SA–4W | 25SA–8W | 25SA–16W | |
|---|---|---|---|---|---|---|---|
| Particle diameter range 1, μm | 10–241 | 10–238 | 10–240 | 10–239 | 10–251 | 10–254 | 10–259 |
| Sauter mean diameter (SMD), μm | 105 | 104 | 106 | 104 | 107 | 109 | 110 |
| Apparent bulk density of powder 2, g/cm3 | 0.63 | 0.62 | 0.63 | 0.62 | 0.64 | 0.66 | 0.69 |
| Sample | TC | SSABET, m2/g | VP, cm3/g | DP, nm |
|---|---|---|---|---|
| P1–DAR | 550 °C | 227 | 0.40 | 7.02 |
| P4–DAR | 230 | 0.41 | 7.17 | |
| P1–DAC | 233 | 0.36 | 6.12 | |
| P4–DAC | 240 | 0.36 | 6.04 | |
| P1–DAR | 750 °C | 119 | 0.37 | 12.33 |
| P4–DAR | 125 | 0.38 | 12.17 | |
| P1–DAC | 120 | 0.37 | 12.34 | |
| P4–DAC | 129 | 0.39 | 11.98 |
| Catalyst | T50 (°C) | T90 (°C) |
|---|---|---|
| Pt100A-(500) | 168 | 180 |
| Pt25SA–0.5W | 172 | 190 |
| Pt100A-(800) | 179 | 203 |
| Pt25SA–1W | 191 | 220 |
| Pt25SA–2W | 230 | 250 |
| Pt25SA–4W | 262 | 290 |
| Pt25SA–8W | 290 | 325 |
| 25SA (support) | 315 | 350 |
| Catalysts | Pt (%) | Calcination (°C), (h) | GHSV (h−1) | Feed Conc. (vol.%) | Pt Dispersion (%) | T50 (°C) | T90 (°C) | Reference |
|---|---|---|---|---|---|---|---|---|
| Pt/Al2O3 | 1 | 550, 450 | 120,000 1 | CO-0.2 O2-1.0 NO-0.05 He-balance | - | 169 | 176 | Ivanova et al. [38] |
| Pt/Ce–Zr–SO42− Ce/Zr = 4:1 | 1 | 500, 3 | 24,000 | CO-0.1 O2-10 NO-0.05 C3H6-0.05 N2-balance | 58 | 175 | 184 | Gu et al. [68] |
| Pt/Al2O3 Sol-gel | 2 | 500, 13 | 34,286 | CO-1.0 O2-1.35 H2-60 CO2-25 H2O-10 He-balance | 8.9 | 100 | 135 | Manasilp and Gulari [71] |
| Pt/Al2O3 | 1 | 500, 4 3 | 80,000 | CO-0.5 O2-10 NO-0.02 CO2-20 H2O-10 He-balance | 40 | 164 | 176 | Akil et al. [72] |
| Pt/Al2O3 | 0.03 | 500, 2 | 2,760,000 2 | CO-6.94 O2-12.97 He-80.09 | 36 | 460 | 475 | de Carvalho et al. [6] |
| Pt/SiO2–Al2O3–WOx | 0.05 | 550, 6 800, 2 3 | 24,000 | CO-7 O2-13.5 He-79.5 | 61 | 168 | 179 | This study |
| Sample | wt%SiO2 1 | wt%Al2O3 2 | pH ± 0.1 |
|---|---|---|---|
| Al2O3 com. | 0 | 100 | 8.2 |
| 100A | 0 | 100 | 8.5 |
| 5SA | 5.7 | 94.3 | 8.1 |
| 10SA | 11.8 | 88.2 | 7.6 |
| 15SA | 15.9 | 84.1 | 7.2 |
| 20SA | 17.6 | 82.4 | 6.8 |
| 25SA | 25.5 | 74.5 | 6.4 |
| 100S | 100 | 0 | 4.5 |
| Sample | wt% SiO2 | wt% Al2O3 | wt% W 1 |
|---|---|---|---|
| 25SA–0.5W | 25.69 | 73.81 | 0.501 |
| 25SA–1W | 25.56 | 73.443 | 0.997 |
| 25SA–2W | 25.30 | 72.692 | 2.008 |
| 25SA–4W | 24.783 | 71.219 | 3.998 |
| 25SA–8W | 23.745 | 68.246 | 8.009 |
| 25SA–16W | 21.697 | 62.312 | 15.991 |
| Sample | wt% SiO2 | wt% Al2O3 | wt% W | wt% Pt 1 | W/Pt (Atom/Atom) |
|---|---|---|---|---|---|
| Pt100A | 0 | 99.946 | 0 | 0.0538 | 0 |
| Pt25SA–0.5W | 25.680 | 73.760 | 0.504 | 0.0554 | 11.60 |
| Pt25SA–1W | 25.553 | 73.409 | 0.982 | 0.0561 | 20.066 |
| Pt25SA–2W | 25.287 | 72.646 | 2.012 | 0.0549 | 39.02 |
| Pt25SA–4W | 24.789 | 71.218 | 3.950 | 0.0426 | 98.34 |
| Pt25SA–8W | 23.760 | 68.165 | 8.030 | 0.0445 | 191.38 |
| Pt25SA–16W | 21.835 | 62.550 | 15.57 | 0.0467 | 353.6 |
| Pt-DAR | 25.857 | 74.100 | 0 | 0.0430 | 0 |
| Pt–DAC | 25.747 | 74.210 | 0 | 0.0439 | 0 |
Publisher’s Note: MDPI stays neutral with regard to jurisdictional claims in published maps and institutional affiliations. |
© 2021 by the authors. Licensee MDPI, Basel, Switzerland. This article is an open access article distributed under the terms and conditions of the Creative Commons Attribution (CC BY) license (https://creativecommons.org/licenses/by/4.0/).
Share and Cite
Pallares-García, A.; Contreras, J.L.; Pérez-Cabrera, J.; Zeifert, B.; Vázquez, T.; Salmones, J.; Gutiérrez-Limón, M.A. Stabilization of Pt in SiO2–Al2O3 Microspheres at High Mechanical Resistance, Promoted with W Oxides for the Combustion of CO. Catalysts 2021, 11, 1320. https://doi.org/10.3390/catal11111320
Pallares-García A, Contreras JL, Pérez-Cabrera J, Zeifert B, Vázquez T, Salmones J, Gutiérrez-Limón MA. Stabilization of Pt in SiO2–Al2O3 Microspheres at High Mechanical Resistance, Promoted with W Oxides for the Combustion of CO. Catalysts. 2021; 11(11):1320. https://doi.org/10.3390/catal11111320
Chicago/Turabian StylePallares-García, Arturo, José Luis Contreras, Jennipher Pérez-Cabrera, Beatriz Zeifert, Tamara Vázquez, José Salmones, and Miguel Angel Gutiérrez-Limón. 2021. "Stabilization of Pt in SiO2–Al2O3 Microspheres at High Mechanical Resistance, Promoted with W Oxides for the Combustion of CO" Catalysts 11, no. 11: 1320. https://doi.org/10.3390/catal11111320
APA StylePallares-García, A., Contreras, J. L., Pérez-Cabrera, J., Zeifert, B., Vázquez, T., Salmones, J., & Gutiérrez-Limón, M. A. (2021). Stabilization of Pt in SiO2–Al2O3 Microspheres at High Mechanical Resistance, Promoted with W Oxides for the Combustion of CO. Catalysts, 11(11), 1320. https://doi.org/10.3390/catal11111320