
Glycerol Hydrogenolysis to Produce 1,2-Propanediol in Absence of Molecular Hydrogen Using a Pd Promoted Cu/MgO/Al2O3 Catalyst


Department of Chemical Engineering, University of Waterloo, 200 University Avenue West, Waterloo, ON N2L3G1, Canada
*
Author to whom correspondence should be addressed.
†
Deceased 2 November 2018, this paper is dedicated to the memory of Professor Garry L. Rempel.
Catalysts 2021, 11(11), 1299; https://doi.org/10.3390/catal11111299
Submission received: 6 October 2021
/
Revised: 25 October 2021
/
Accepted: 25 October 2021
/
Published: 28 October 2021
(This article belongs to the Special Issue Catalytic Conversion of Glycerol)
Abstract
:The catalytic process of glycerol hydrogenolysis to produce 1,2-propandiol (1,2-PD) in the absence of external hydrogen addition has been investigated. The methanol present in the crude glycerol from a biodiesel production process is used to provide in situ hydrogen produced via methanol steam reforming for the glycerol hydrogenolysis process. This process can reduce the additional cost for the transportation and storage of molecular hydrogen and also reduce the safety risks related to using high hydrogen pressure. It was found that the introduction of Pd onto a Cu/MgO/Al2O3 catalyst significantly improved the glycerol conversion and 1,2-PD selectivity. The pseudo-first-order kinetic results suggested that the promoting effect of Pd is primarily attributed to the enhanced activity for the hydrogenation of acetol, which is the intermediate formed via glycerol dehydration. A 27−3 fractional factorial design experiment was carried out to investigate the impacts of seven single factors and their binary effects on two responses, namely 1,2-PD selectivity and glycerol conversion. The results showed that the glycerol feed concentration has the most significant effect on the 1,2-PD selectivity, such that the 1,2-PD selectivity is lower if a more concentrated glycerol is used as the feedstock; stirring speed, inert gas pressure and water to methanol molar ratio have insignificant effects on the reaction system. The addition of Pd, higher temperature and higher catalyst loading are the essential factors in order to obtain a high selectivity of 1,2-PD and a high glycerol conversion.
1. Introduction
In order to fight climate change and to achieve sustainable development for human life, the production of green chemicals from biomass-derived feedstocks has been of great interest in scientific research and industrial applications. Glycerol, as the major byproduct of the biodiesel production process, can be used to produce a number of important chemicals, such as 1,2-propanediol (1,2-PD), 1,3-propanediol, acrolein, acrylic acid and so on [1]. As the production of biodiesel is rapidly increasing, producing value-added chemicals from glycerol derived from biodiesel does not only reduce the biodiesel production cost but also reduces the chemical wastes and environmental hazards caused by handling the large amount of surplus crude glycerol [2].
Glycerol hydrogenolysis to produce 1,2-PD has been considered as a viable alternative process to replace the conventional process via the hydration of propylene oxide, which is derived from fossil resources. The most frequently reported mechanism was the glycerol dehydration to acetol followed by acetol hydrogenation to produce 1,2-PD consecutively. The normal method for converting glycerol into 1,2-PD is to carry out the reaction system in an autoclave batch reactor under a high hydrogen pressure, normally from 400 psi up to 1500 psi, due to the low solubility of hydrogen in the reaction mixture [3,4,5]. However, the high hydrogen pressure is undesirable in a large-scale industrial application. The use of highly pressurized molecular hydrogen can cause significant cost issues related to the transportation and storage of gaseous hydrogen; and also, it can raise safety concerns of the potential explosion on contact with air due to its extreme ease of leakage. In order to avoid the drawbacks of using high-pressure molecular hydrogen, alternative methods to provide hydrogen have been studied. One approach is to produce in situ hydrogen via an aqueous phase reforming (APR) of glycerol, which is also the feedstock to produce 1,2-PD. In 2008, D’Hondt et al. firstly studied the feasibility of this process using a Pt/NaY catalyst [6]. The glycerol conversion and 1,2-PD selectivity were reported to be only 85.4% and 57.2%, respectively, when 20 wt% aqueous glycerol was used as the feedstock under an inert atmosphere at 230 °C after a 15 h reaction. This APR process has been extensively studied since no additional hydrogen donor is needed; thus, the cost of transportation and storage of the hydrogen donor can be avoided. However, low 1,2-PD selectivities were generally reported in the APR processes. Glycerol is a C-3 polyol with three hydroxy groups. The mechanism of glycerol APR involves a series of C–O bond and C–C bond scissions as proposed by a number of studies [7,8,9]. Some undesired glycerol degradation products, such as ethanol, methanol and alkanes, may be produced. This does not only lower the commercial value of the product but also increases the cost for downstream separations. In most of the reports on the APR process for glycerol hydrogenolysis, Pt-based catalysts were used [8,10,11,12] as Pt is known to be an active metal for C–C and C–O cleavage. The reported selectivities of 1,2-PD varied from 35.3% to 50.5%, which were higher than the 1,2-PD selectivities obtained using other catalysts, such as Pd [12], Ni [12,13] [14,15] and Cu [16,17]-based catalysts.
Another alternative way of glycerol hydrogenolysis without molecular hydrogen added is to introduce an external hydrogen donor; the in situ hydrogen formed from the hydrogen donor on the catalyst surface is used for the hydrogenolysis via catalytic transfer hydrogenation (CTH). A suitable hydrogen donor needs to be at a low cost and highly available so that it can be used without sacrificing a part of the feedstock as in an APR process. Musolino et al., in 2009, firstly reported the CTH process to produce 1,2-PD using isopropanol as the hydrogen donor [18]. In their work, at 180 °C, the glycerol conversion and 1,2-PD selectivity were 100% and 92% after a 24 h reaction time using a 10 wt% Pd supported on a Fe3O4 catalyst. It was proposed that the in situ hydrogen formed via isopropanol dehydrogenation was transferred for acetol hydrogenation. Aside from isopropanol [19,20,21,22,23], various hydrogen donors have been studied, such as ethanol [24,25] and formic acid [19,26,27]. Although the results showed that relatively higher 1,2-PD selectivities compared with the APR processes could be obtained, the efficiencies of the hydrogen donors, such as isopropanol and ethanol, which provide hydrogen via dehydrogenation reaction, are extremely low, since one mole of isopropanol or ethanol can only stoichiometrically provide one mole of H atom [28]. This implies that a vast amount of hydrogen donor needs to be added in order to provide enough in situ hydrogen for acetol hydrogenation. In addition, an extra cost will occur due to the downstream separation of the unreacted hydrogen donors and the byproducts formed from the dehydrogenation of the donors, such as the ketones and aldehydes. These features of using external hydrogen donors make this process less feasible in its large-scaled commercialization. Methanol has been considered as an ideal hydrogen donor that can avoid the disadvantages of using other hydrogen donors. Methanol has the highest H/C ratio and can provide hydrogen via a steam reforming reaction without undergoing any C–C cleavage. More importantly, excess methanol is normally used for transesterification in the biodiesel production process; thus, the majority of the unreacted methanol is present in the crude glycerol layer after the decanting stage to separate the crude glycerol and biodiesel [29], as methanol is more preferably dissolved in the glycerol phase compared to the biodiesel layer [30,31]. In our previous work, the industrial data from a biodiesel plant in China showed that the methanol content in the crude glycerol before the methanol recovery step ranges from 40% to 60%, depending on the methanol to oil molar ratio for the feed mixture in a transesterification reaction [32]. Therefore, the methanol in the crude glycerol before the methanol recovery process can be used directly to produce in situ hydrogen for glycerol hydrogenolysis. We have reported the process of using methanol to provide in situ hydrogen using a Cu/ZnO/Al2O3 catalyst [32,33]. The challenge of this process is to obtain a high selectivity of 1,2-PD by minimizing the concentration and the residence time of acetol, which is the intermediate formed via glycerol dehydration, in the reaction mixture as the majority of the undesired byproducts are formed via the condensation reactions between acetol and alcohols [34]. We found that Ni [32] and Pd [33] are active promoters that can improve the selectivity of 1,2-PD. Professor Lemonidou’s group has also reported a similar process using a Cu/ZnO/Al2O3 catalyst [35,36]. They also conducted extensive mechanistic studies using the Langmuir–Hinshelwood kinetic models and concluded that one of the key factors for this process using a Cu/ZnO/Al2O3 catalyst is the availability of hydrogen provided via methanol steam reforming for acetol hydrogenation [37,38,39].
Recently, Cu/MgO/Al2O3 catalysts have brought many researchers’ attention to 1,2-PD production from glycerol as high 1,2-PD selectivities were reported under mild conditions with molecular hydrogen added externally. The application of Cu/MgO/Al2O3 catalyst in the process was reported for the first time by Professor Hou’s group in 2011 [40] after they reported the use of Cu/MgO catalyst in 2010 [41], the 1,2-PD selectivity using a Cu/MgO/Al2O3 catalyst prepared via a coprecipitation method was reported to be 98.2%, which was remarkably higher than most of the reported selectivities using other catalysts. This group, and many other researchers, have extensively studied Cu/MgO/Al2O3 catalysts, including the effects of different promoters and process optimizations [42,43,44,45,46,47,48,49]. Most of the literature precedents reveal that the activity of the catalyst strongly depends on the Cu particle size, and the synergetic interaction between Cu and MgO can result in a better dispersion of nano-size Cu particles over the MgO matrix [50,51].
In this work, we explored the activity of catalysts with different metals for glycerol hydrogenolysis using hydrogen generated from steam reforming of methanol. Cu/MgO/Al2O3 was found to have high activity and selectivity to 1-2PD. The promoting effect of Pd was investigated since Pd is well known for its hydrogenation activity and was found to promote the 1,2-PD selectivity using a Cu/ZnO/Al2O3 catalyst. Pd is well known as one of the most active metals for a CTH process. A small amount of Pd loaded onto a Cu-based catalyst can significantly improve the hydrogenation activity of the catalyst via a spillover effect such that the hydrogen adatoms on the Pd surface can rapidly spill over to adjacent Cu surface, providing more active sites for hydrogenation reactions [43,52,53,54]. A number of the literature precedents have reported that Pd is an effective promoter of various Cu-based catalysts in the glycerol hydrogenolysis process using molecular hydrogen [43,52,55] and also in the methanol steam reforming process [56].
A Cu/MgO/Al2O3 catalyst was also used as the benchmark to study the effect of different process parameters, such as temperature, catalyst loading amount, glycerol feed concentration, Pd loading, stirring speed, inert gas pressure and water to methanol molar ratio, on yield and selectivity. A fractional factorial design was carried out, and a statistical analysis was conducted to investigate the effects of different factors and the interactions between two factors on some important responses, such as the selectivity of 1,2-PD and the conversion of glycerol.
2. Results and Discussion
2.1. Catalyst Screening
Cu-based mixed metal oxide catalysts prepared via the coprecipitation method are the most common catalysts for methanol steam reforming [57] and glycerol hydrogenolysis [58,59]. In this work, the catalysts prepared by the oxalate gel-coprecipitation using Cu with different other metals combinations, i.e., Zn, Al, Mg, Ni, Mg, Zr and La, have been investigated to discover the most active catalyst for the glycerol hydrogenolysis process with in situ hydrogen produced from methanol steam reforming. The experimental results are listed in Table 1. Using Cu/ZnO/ZrO2 [60,61], Cu/ZrO2/Al2O3 [62,63] and Cu/La2O3/Al2O3 [64,65] catalysts, which have been reported recently for glycerol hydrogenolysis and methanol steam reforming, the selectivities of 1,2-PD are all below 60%, and the major undesired byproducts are acetol, EG and some other unknown byproducts, which were formed via the side reactions caused by acetol (Table 1, Entry 1–3). We have recently reported the process using a Cu/ZnO/Al2O3 catalyst [32], the glycerol conversion and 1,2-PD selectivity were 87.1% and 70.7%, respectively, after an 8 h reaction time, which is significantly higher than the results using the Cu/ZnO/ZrO2, Cu/ZrO2/Al2O3 and Cu/La2O3/Al2O3 catalysts (Table 1, entry 4). It was also found in our previous work that the addition of Ni can improve the 1,2-PD selectivity. For instance, adding 5% (molar) Ni onto a Cu/ZnO/Al2O3 catalyst can increase the 1,2-PD selectivity from 70.7% to 85.5%, mainly due to the fact that Ni can enhance the catalyst activity for acetol hydrogenation resulting in a lower yield of other byproducts produced via the side reactions of acetol; however, the glycerol conversion was noticeably reduced, i.e., to 70.0%, mainly due to a reduced Cu surface area and number of acidic sites (Table 1, entry 5) [32]. The Cu/MgO/Al2O3 catalyst showed a remarkably higher activity than the Cu/ZnO/Al2O3 catalyst in terms of glycerol conversion and 1,2-PD selectivity, which were 95.6% and 79.5%, respectively (Table 1, entry 6); this is possibly due to the better dispersion of Cu particles and smaller particle size induced by the interaction between Cu and MgO [50,51], as discussed in the previous sections from the TEM images and the from the XRD profiles.
Palladium can improve the catalytic activities of both Cu/ZnO/Al2O3 and Cu/MgO/Al2O3. By introducing 1 wt% Pd onto the catalysts, the glycerol conversion and 1,2-PD selectivity were all clearly increased to 94.9% and 74.3%, respectively, using a Pd-promoted Cu/ZnO/Al2O3, and to 97.2% and 83.4%, respectively, using a promoted Cu/MgO/Al2O3 (Table 1, entry 7–8). The enhanced glycerol conversion by the addition of Pd is possibly due to the rapid acetol hydrogenation reaction promoted by Pd shifting the reaction equilibrium of glycerol dehydration forward since the glycerol dehydration step has been generally accepted in various reported kinetic studies as an equilibrium-limited reaction [66,67]. Despite similar final glycerol conversions using the Cu/MgO/Al2O3 catalyst with and without being Pd loaded (Table 1, entry 6 and entry 8), the rate of glycerol conversion is significantly higher, which will be discussed in more detail in a later section (Section 2.3). In addition, the selectivity of the undesired byproducts was remarkably reduced from 10.6% to only 6.4% using the Pd-promoted catalyst, resulting in an improved selectivity of 1,2-PD. Furthermore, it was noticed that when a 2Pd/ZnO catalyst was used, the glycerol conversion was found to be 83%, suggesting Pd is also active for the glycerol dehydration reaction (Table 1, entry 9), which can possibly be another reason that a higher glycerol conversion was obtained using a Pd-promoted catalyst. Furthermore, the selectivity of 1,2-PD using a Pd-ZnO is only 49.7%, with high selectivities of acetol and other undesired byproducts. This reveals that the promoting effect of Pd on a Cu-based catalyst is mainly due to the synergetic effect of Pd and Cu via the spillover effect. In addition, Ni, ZnO, MgO and Al2O3 were found to be nearly inactive for glycerol dehydration reaction (Table 1, entries 10–11). The main roles that ZnO and MgO play are to improve the Cu dispersion via their interactions with Cu [32,50,51]. Al2O3 can isolate the individual particles to inhibit their agglomeration over the reaction [68]; when no Al2O3 was added to the Cu/MgO catalyst, the glycerol conversion and 1,2-PD activity are clearly lower (Table 1, entry 12).
2.2. Catalyst Characterization
2.2.1. Temperature Programmed Reduction
The reducibility of the calcined Cu/MgO/Al2O3 catalysts with and without being Pd loaded were characterized by a temperature-programmed reduction (TPR) technique, as illustrated in Figure 1. For a calcined Cu/MgO/Al2O3 catalyst, the reduction peak starts from 130 °C and completes at 300 °C with the peak maxima at 260 °C. When 2 wt% palladium was loaded onto a calcined Cu/MgO/Al2O3 catalyst support, it is interesting to note that the reduction peak is shifted to a lower temperature range than the reduction starts at, from 90°C and completes at 250 °C, and the peak is observed to be at 188 °C. In addition, it is also found that the reduction peak of the calcined 2Pd/Cu/MgO/Al2O3 catalyst is sharper and narrower compared with the calcined Cu/MgO/Al2O3 catalyst, revealing that Pd can improve the reducibility of the catalyst, resulting in a quicker reduction process at a lower temperature range compared with an unpromoted Cu/MgO/Al2O3 catalyst. This improvement of the reducibility of the catalyst by the addition of Pd can be attributed to the hydrogen spillover effect induced by Pd. It has been well known that PdO can be easily reduced by hydrogen at room temperature [4,70], then the adsorbed hydrogen molecules can be easily dissociated on the metallic Pd surface, and the surface hydrogen atoms can rapidly spillover from the Pd surface to the adjacent CuO surface due to the higher diffusivity facilitating the reduction of CuO. Such an effect of Pd addition on the reduction behavior of Cu-based catalysts has been extensively studied and frequently reported publicly [52,54,71].
2.2.2. X-ray Diffraction
Figure 2 illustrates the X-ray Diffraction (XRD) patterns of calcined Cu/MgO/Al2O3 and 2Pd/Cu/MgO/Al2O3 catalysts. The results are also compared with the pattern of the calcined Cu/ZnO/Al2O3 catalyst. For the calcined Cu/MgO/Al2O3 and calcined 2Pd/Cu/MgO/Al2O3 catalysts, the peaks at 2θ angles of 35.5°, 38.8° and 48.6° are attributed to (002), (111) and (202) monoclinic crystal structures of CuO [72]. The crystal structure of (002) and (111) are dominant. The diffraction peaks of CuO for the calcined Cu/MgO/Al2O3 are slightly broader, suggesting CuO is more homogeneously distributed and the CuO crystal size is smaller. The slightly larger CuO crystal sizes for the 2Pd/Cu/MgO/Al2O3 catalyst are possibly due to the occurrence of a slight sintering during the calcination of the catalyst when impregnating Pd onto the Cu/MgO/Al2O3 catalyst. The average particle sizes, calculated via Scherrer’s equation, of CuO (002) and CuO (111) for the calcined Cu/MgO/Al2O3 catalyst were 10.6 and 8.3 nm, respectively; the average particle sizes of CuO (002) and CuO (111) for the calcined 2Pd/Cu/MgO/Al2O3 catalyst were 13.4 and 12.6 nm, respectively, which were slightly larger compared with the calcined Cu/MgO/Al2O3 catalyst. No diffraction peak corresponding to MgO can be clearly observed, suggesting that MgO particles are in a low crystallinity and homogeneously mixed with CuO. No diffraction peak corresponding to PdO is observed for the calcined 2Pd/Cu/MgO/Al2O3 catalyst, possibly due to the fact that the amount of Pd loaded was very low, and the PdO particles were finely distributed over the catalyst. In our previous work, a Cu/ZnO/Al2O3 catalyst was found to be active for this reaction system [32,33]. The results were also listed in Table 1 to compare with the results using the Cu/MgO/Al2O3. To understand the relationship between the activity and the crystallinity of the catalyst, the XRD pattern of Cu/ZnO/Al2O3 catalyst was also demonstrated for comparison. For the diffraction pattern of the calcined Cu/ZnO/Al2O3 catalyst, the three peaks corresponding to the CuO (002), (111) and (202) were also observed, and the calculated average particle sizes of CuO (002) and CuO (111) were 10.5 and 10.7 nm, respectively. In addition, a broad diffraction peak at 31.7° attributed to the (100) crystal plane for hexagonal ZnO is observed [72].
2.2.3. Transmission Electron Microscopy
The calcined Cu/MgO/Al2O3 catalyst has been characterized by Transmission Electron Microscopy (TEM) to investigate the catalyst particle shapes and particle sizes. From Figure 3a it can be observed that the catalyst particles have a spherical shape, and they are well dispersed. The sizes of the particles were very uniform, as illustrated in its histograms of the particle size distribution in Figure 3b. The average particle size of the catalyst was measured to be 9.87 nm, which is smaller than the particle size of a calcined Cu/ZnO/Al2O3 (10.41 nm) reported in our previous work [32]. It has been widely reported that the synergetic interaction between CuO and MgO favors a better dispersion of nano-sized CuO particles over the MgO matrix [50,51].
2.3. Kinetic Analysis
The kinetic analyses were employed for the reaction systems to compare the reaction rates of the system using Cu/MgO/Al2O3 and 1Pd/Cu/MgO/Al2O3 catalysts for a better understanding of the promoting effect of Pd. A reaction pathway was proposed for this kinetic study, as illustrated in Scheme 1; r1, r2 and r3 represent the reaction rates of glycerol dehydration, acetol hydrogenation and EG formation via glycerol C–C cleavage, respectively. Pseudo-first-order kinetic models were applied to the acetol hydrogenation reaction and glycerol C–C cleavage reaction assuming sufficient hydrogenation sites over the reaction time and insignificant effect of Pd on the amount of hydrogen produced from methanol steam reforming [56]; the rate expressions for all three reactions and the mole balance of all components are presented in Table 2. The ordinary differential equations combined with the nonlinear regression via the Levenberg–Marquardt algorithm were solved by RStudio software to estimate the rate constant, k, for each reaction.
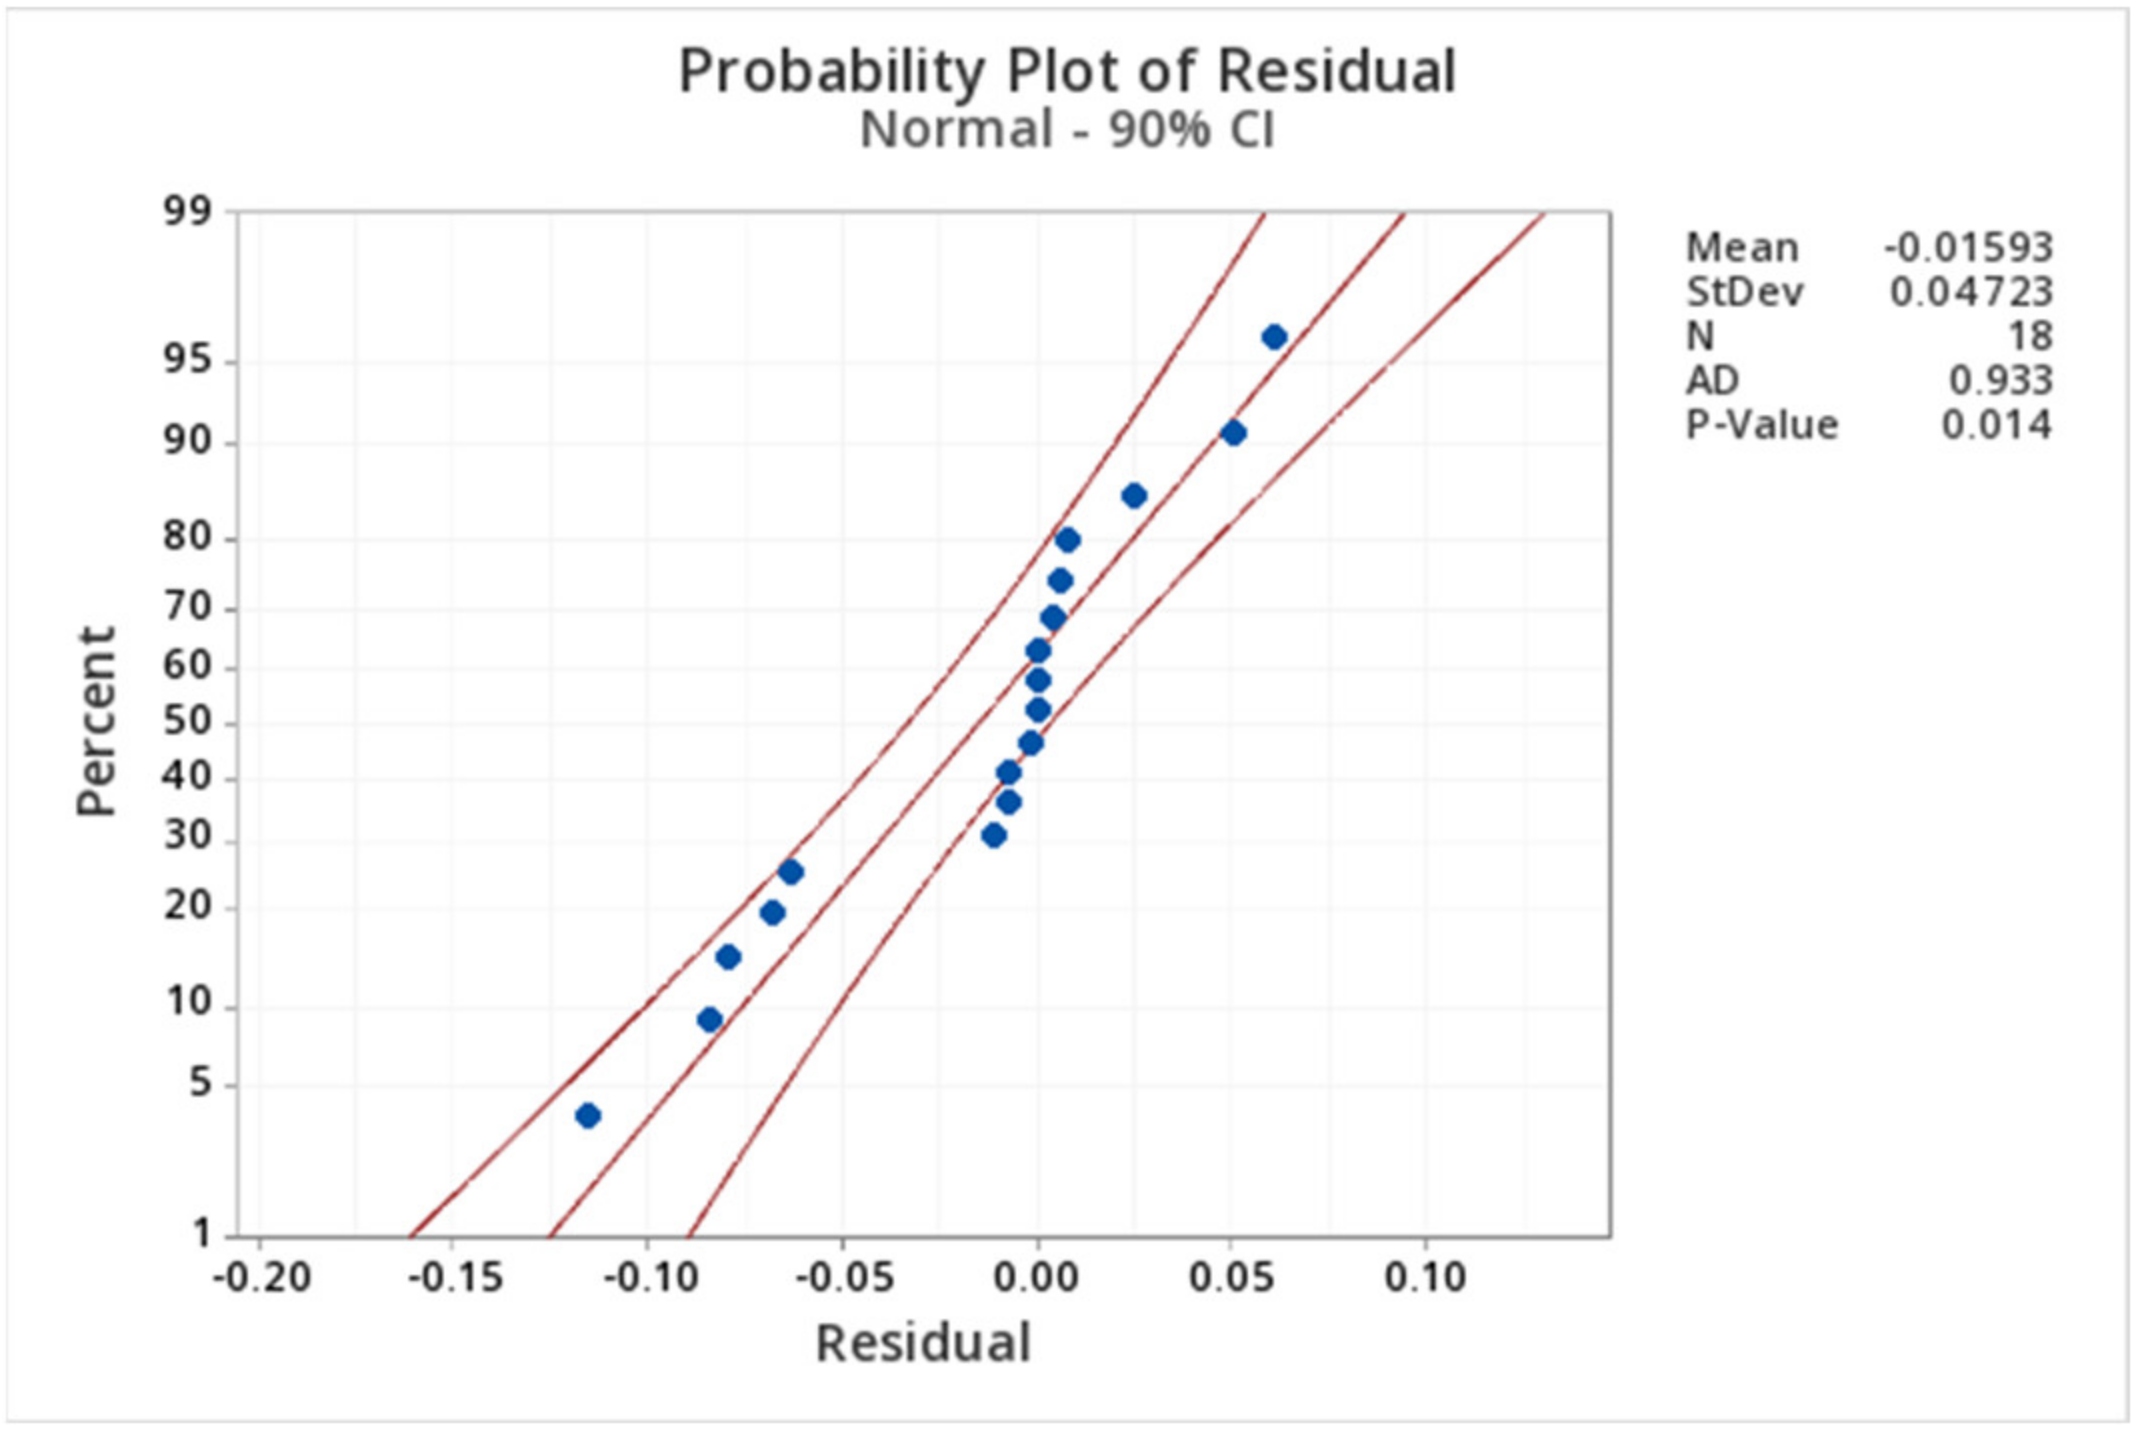
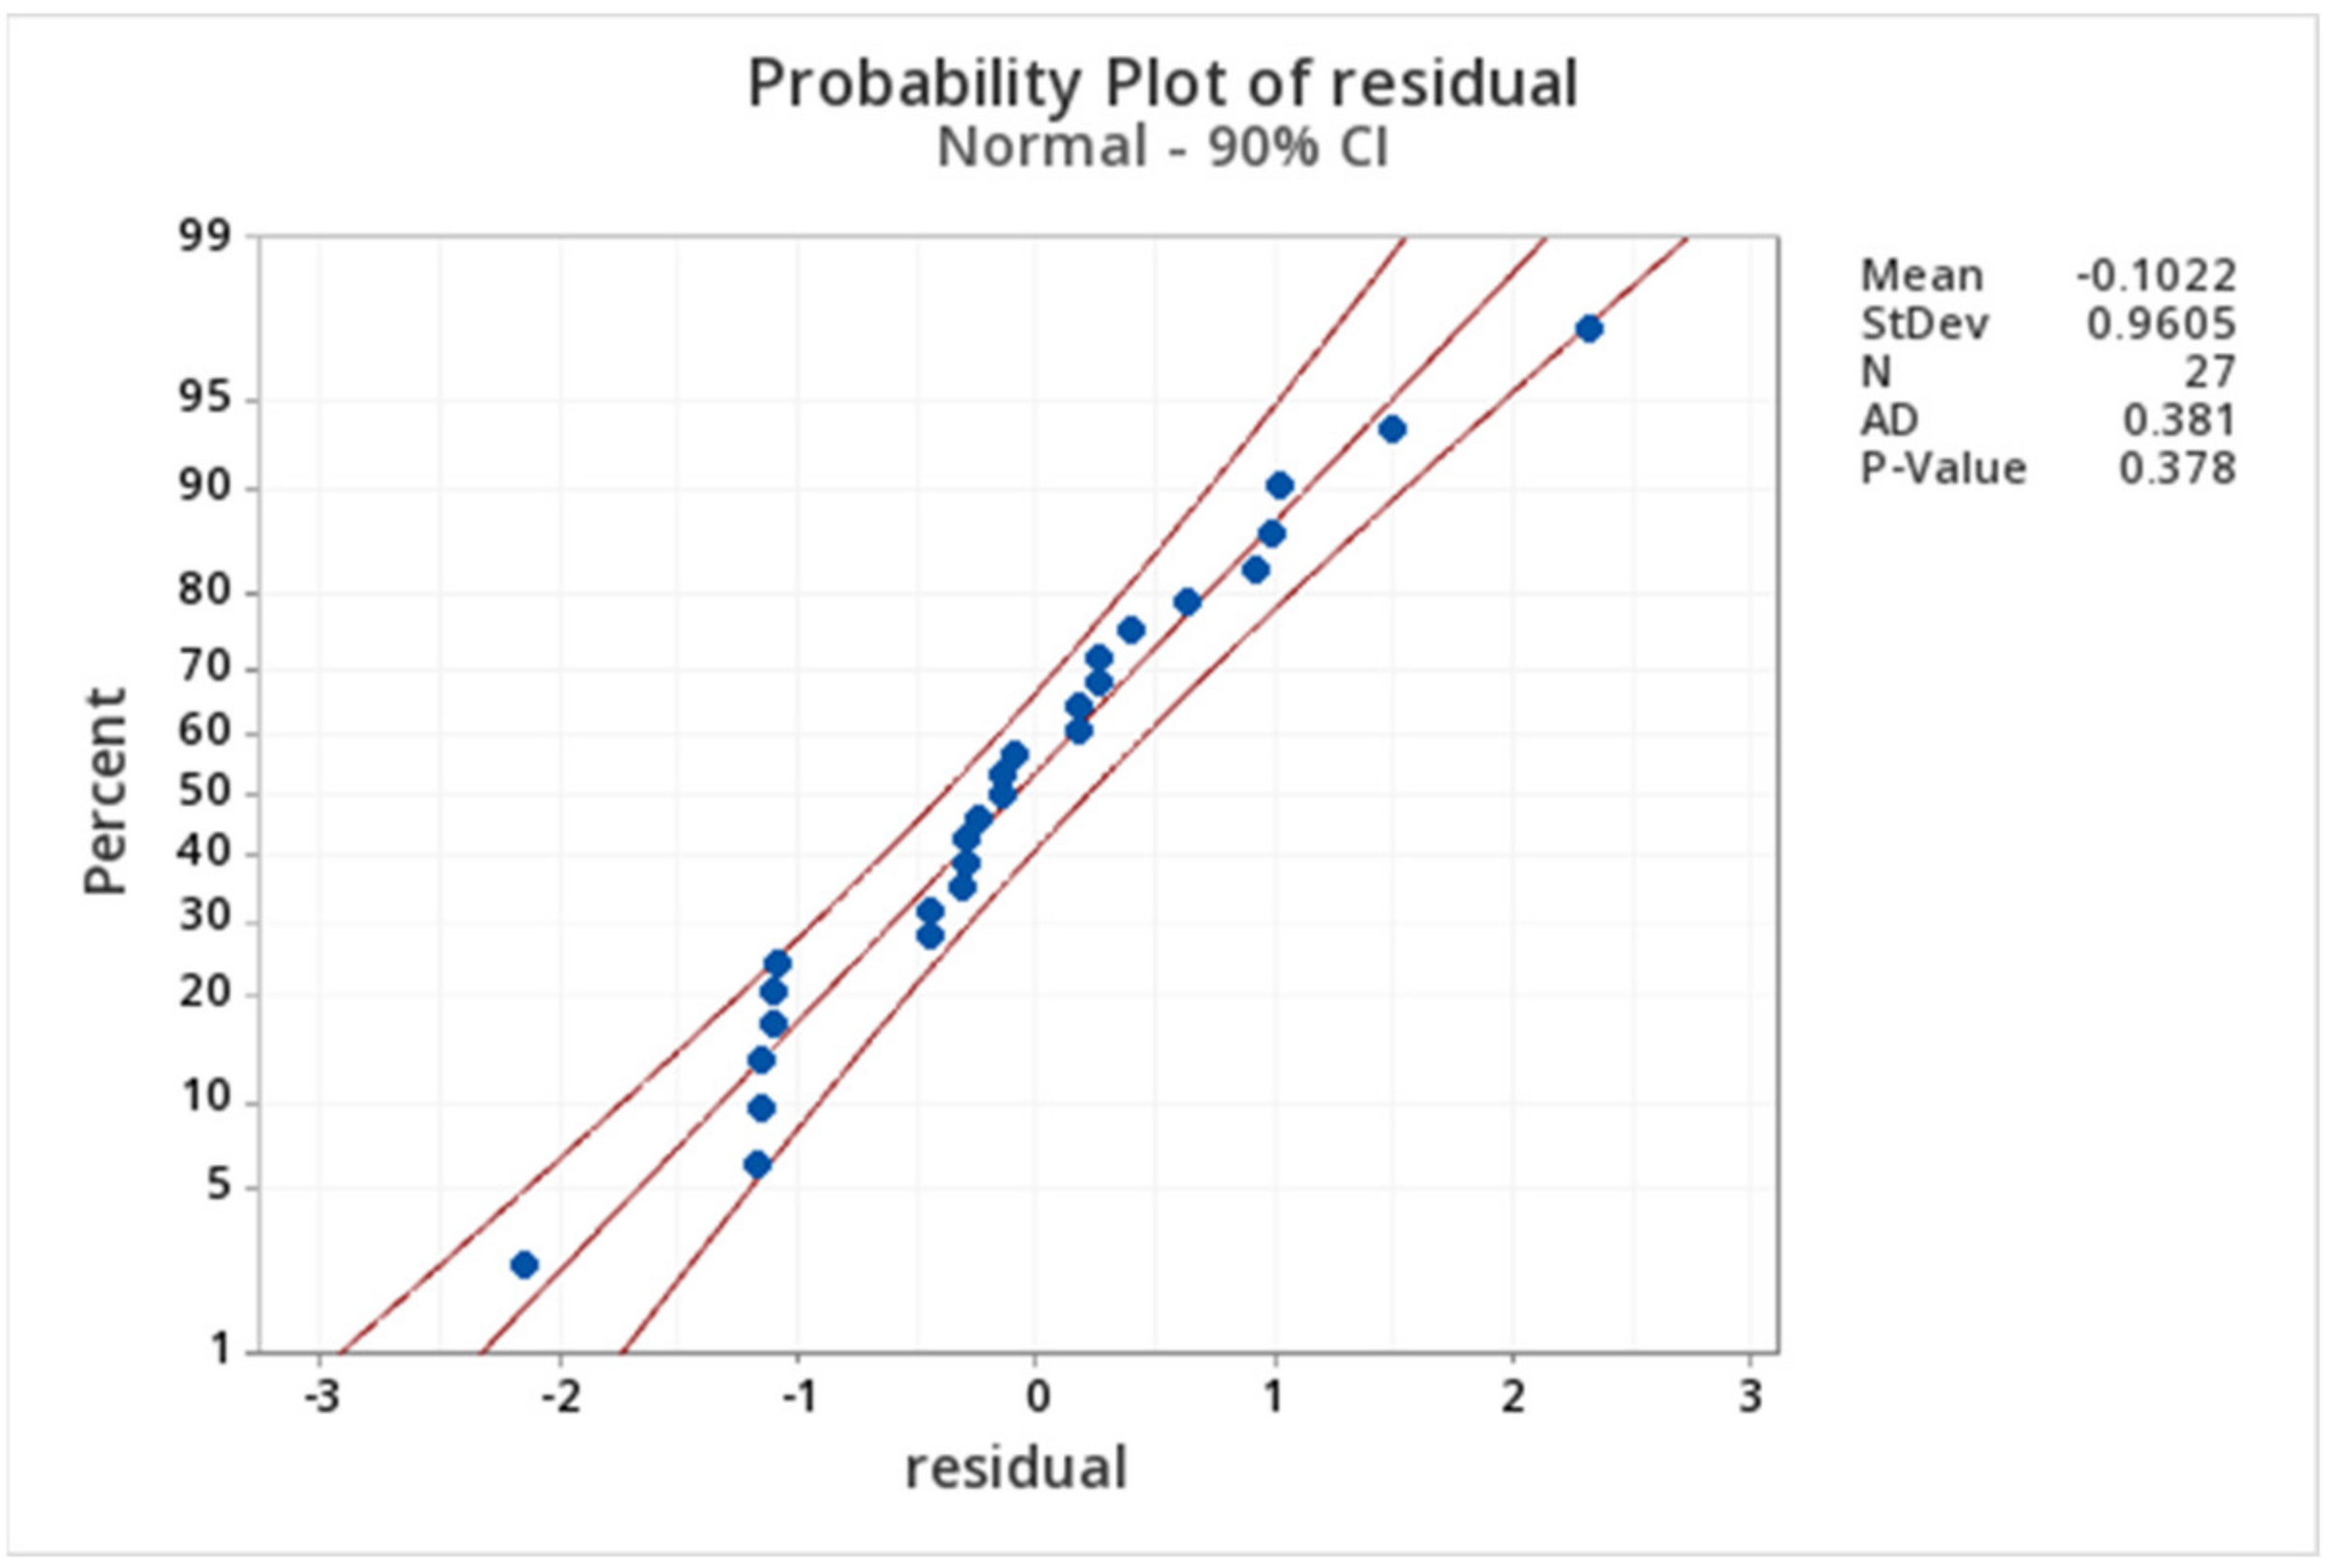
The rate constants for using Cu/MgO/Al2O3 and 1Pd/Cu/MgO/Al2O3 catalysts were compared in Table 3. The experimental values and the predicted values of the concentrations of each component over the reaction time by the kinetic model are illustrated in Figure 4. It can be observed that most of the experimental values can satisfactorily fall alone the lines representing the predicted values by the kinetic model. In addition, from the residual probability plots, as illustrated in Figures S1 and S2 in the Supplementary Materials, almost all the residuals can adequately fall along the straight line within the 90% confidence interval, suggesting that this model is reliable. From Table 3, it is clear that the rate constant of acetol hydrogenation (k2) is higher than the rate constant of glycerol dehydration (k1) by at least one order of magnitude using both catalysts, suggesting that acetol hydrogenation is a much faster reaction compared with glycerol dehydration. The rate constant of glycerol dehydration (k1) for 1Pd/Cu/MgO/Al2O3 is larger compared to Cu/MgO/Al2O3 by nearly two-fold, suggesting the glycerol conversion rate is significantly higher with added Pd. This can also be clearly observed in Figure 4a that the glycerol concentration decreases faster over the reaction time using the 1Pd/Cu/MgO/Al2O3 catalyst than that using the unpromoted Cu/MgO/Al2O3 catalyst. The k3 value using the Pd-promoted catalyst is also higher than that using the unpromoted catalyst, suggesting an enhanced glycerol C–C cleavage activity caused by Pd, which has been widely reported [33,43]. Therefore, the rate of EG formation is higher by adding Pd. This can be observed in Figure 4b, showing that the EG concentration increases at a faster pace over the reaction time using the Pd-promoted catalyst. It is also clearly noticed that the rate constant of acetol hydrogenation (k2) for the 1Pd/Cu/MgO/Al2O3 catalyst is approximately 5.6 times larger than that for the Cu/MgO/Al2O3 catalyst, revealing that the introduction of a small amount of Pd can remarkably improve the acetol hydrogenation activity of the Cu/MgO/Al2O3 catalyst. As a result, using the Pd-promoted catalyst, the 1,2-PD formation rate is higher, and the concentration of acetol in the reaction mixture over the reaction time stays at a lower level, as observed in Figure 4c,d, respectively. The promoting effect of Pd on the acetol hydrogenation can consequently shift the reaction equilibrium of glycerol dehydration forward, resulting in a higher glycerol conversion. This is the main reason that Pd can improve the glycerol dehydration activity.
2.4. The Promoting Effect of Pd on Cu/MgO/Al2O3 Catalysts
2.4.1. Effect of Pd Loadings on the Cu/MgO/Al2O3 Catalysts for the Glycerol Hydrogenolysis with In Situ Hydrogen Produced from Methanol Steam Reforming
It has been generally discussed that the key challenge of improving the 1,2-PD selectivity is to reduce the concentration and the residence time of acetol in the reaction mixture so that the formation of other undesired products can be inhibited. Pd is well known as an effective promoter of a Cu-based catalyst in various hydrogenation applications due to the spillover effect [53,54,73]. The Cu/MgO/Al2O3 catalyst with different amounts of Pd loading (wt%), i.e., 0% (Cu/MgO/Al2O3), 1%, 2% and 3%, were used to investigate their reactivity for the hydrogenolysis of a 40 wt% glycerol feedstock. This high glycerol feed concentration has not been used in any literature reports for glycerol hydrogenolysis via a CTH process since it is a big challenge to achieve a reasonably high 1,2-PD selectivity with such a high glycerol feed concentration. However, a higher glycerol feed concentration is more desirable in its large-scaled commercialization since the capacity of the plant can be increased if a satisfactorily high selectivity can be achieved. Therefore, a high glycerol concentration (40 wt%) was used as the feedstock in these experiments to investigate the promoting effects of different amounts of Pd on the 1,2-PD selectivity. As listed in Table 4, using a Cu/MgO/Al2O3 catalyst, the 1,2-PD selectivity was only 54.9%, and the selectivity of other byproducts due to side reactions caused by acetol was 36.4%. If 1 wt% Pd was loaded onto the catalyst, the 1,2-PD selectivity was improved to 66.8%, and the selectivity of other byproducts was lowered to 26.3%. If the Pd loading was increased to 2 wt%, the 1,2-PD selectivity was further improved to 73.2%, and the selectivity of other byproducts was only 18.4%. When the Pd loading was further increased to 3 wt%, the catalyst activity was not significantly changed, suggesting that the optimum Pd loading onto a Cu/MgO/Al2O3 catalyst is 2 wt% under the specified reaction conditions. It is clear that Pd is an effective promoter that can improve the 1,2-PD selectivity and reduce the selectivity of undesired byproducts. This increment of 1,2-PD selectivity is mainly due to the enhanced acetol hydrogenation activity by the addition of Pd, which has been determined in the aforementioned kinetic analysis (Section 2.3, Table 3).
The effect of Pd on acetal yield for different Pd/Cu/MgO/Al2O3 catalysts is shown in Figure 5. It is noted that the yield of acetol increased first and then decreased over the reaction time. Furthermore, higher Pd loading resulted in lower acetol yield over the reaction time, especially at the early stage of the reaction. This is possibly due to the fact that at the early stage of the reaction when the rate of glycerol dehydration is high, there is a low concentration of hydrogen generated from the steam reforming reaction. Thus, the catalyst hydrogenation activity was not sufficient for effective acetol hydrogenation [37]. When Pd is added to the catalyst, the acetol can be more rapidly hydrogenated compared to the catalyst without Pd loading. This enhancement of acetol hydrogenation led to a lower concentration and a shorter residence time of acetol in the reaction mixture. Therefore, the formation of the undesired byproducts via the side reactions caused by acetol was suppressed, resulting in a lower selectivity of other byproducts and a higher selectivity of 1,2-PD. This promoting effect on acetol hydrogenation activity can be possibly attributed to the hydrogen spillover effect by the addition of Pd and its interaction with Cu, which has been extensively studied [71,74]. By adding a trace amount of Pd onto a Cu surface, the hydrogen atoms are stored on the Pd surface in the form of PdHx and can easily spill over from the Pd surface to the adjacent Cu surface due to the higher diffusivity providing more hydrogenation active sites [43,52]. The aforementioned TPR results (Section 2.2.1) can strongly support this spillover effect. The promoting effect of Pd on acetol hydrogenation using added molecular hydrogen will be further investigated experimentally in the next section (Section 2.4.2). The higher selectivities of EG using the Pd-promoted Cu/MgO/Al2O3 catalysts, as listed in Table 4, are attributed to the enhanced C–C cleavage due to the addition of Pd [33,43], which has also been observed in the earlier kinetic study section (Section 2.3, Table 3). In order to overcome the drawback of insufficient hydrogen produced from a methanol steam reforming, especially at the early stage of the reaction, molecular hydrogen was initially added to the system (15 bar) to assist the acetol hydrogenation at the beginning of the reaction (Table 4, entry 5). It is clear that the selectivity of 1,2-PD significantly improved to 85.3%, and the selectivity of other byproducts was only 5.9% compared to the reaction carried out under N2 (Table 4, entry 3). This result suggests that the low availability of in situ hydrogen at the early stage of the reaction resulted in a higher accumulation of acetol. The amount of hydrogen initially added was calculated to be only approximately 27.8% of the amount of hydrogen consumed in the whole reaction process, so the majority of the hydrogen consumed was still from the methanol steam reforming. This result is in good agreement with the mechanistic study of this process using a Cu/ZnO/Al2O3 reported by Yfanti et al. that the availability of hydrogen from methanol steam reforming can greatly impact the selectivity of 1,2-PD [39]. The EG selectivity is slightly higher when the reaction is pressurized by hydrogen, possibly revealing that high hydrogen pressure can promote the C–C cleavage [75].
2.4.2. The Promoting Effect of Pd on Acetol Hydrogenation with Molecular Hydrogen
In order to further confirm the promoting effect of Pd on acetol hydrogenation, the reactions with aqueous acetol and molecular hydrogen using the Cu/Mg/Al2O3 catalysts with and without Pd promotion were carried out. A pseudo-first-order kinetic analysis was applied, and the rate constant of acetol hydrogenation reaction was calculated by Equation (1). The validation of the model has been provided in Figures S3–S5. The analysis method is the same as introduced in the earlier section (Section 2.3). As shown in Figure 6, the acetol hydrogenation rate was significantly higher using a 2 wt% Pd-promoted Cu/MgO/Al2O3 catalyst rather than using an unpromoted Cu/MgO/Al2O3 catalyst. The pseudo-first-order rate constant for the acetol hydrogenation reaction using a 2Pd/Cu/MgO/Al2O3 catalyst is more than four times higher than that using a Cu/MgO/Al2O3 catalyst, and the selectivity of other byproducts can be significantly reduced (Table 5). Therefore, it is clear that the addition of Pd can improve the acetol hydrogenation activity of the Cu/MgO/Al2O3 catalyst so that the acetol can be more rapidly hydrogenated, resulting in less undesired byproducts formed from the side reactions. The improvement of the acetol hydrogenation activity by the addition of Pd is in very good agreement with what was found in glycerol hydrogenolysis with in situ hydrogen from methanol steam reforming (Figure 5), where acetol yield was always in a lower concentration using a Pd-promoted catalyst over the reaction time.
2.5. Factorial Design Analyses
Since this is a complex reaction system that involves a series of reactions, many factors can possibly affect the productivity of this reaction system, and some factors may have interactions with the productivity of this process. The fractional factorial design of the experiment is a powerful technique to screen and study the significant single-factor and multi-factor joint effects by carrying out a reduced number of experiments because the experiments can be performed at all combinations of factor levels. The center point has been repeated to check the repeatability of the experiments as listed in Table A1 in Appendix A. To the authors’ knowledge, to date in the literature, no comprehensive investigation work on the effects of major single-factor and multi-factor interactions has been publicly reported for this reaction system. In this work, the effect of seven-factor and two-factor interactions on two responses were examined as previously designed in Section 2.4.
2.5.1. Effects of Factors on 1,2-PD Selectivity
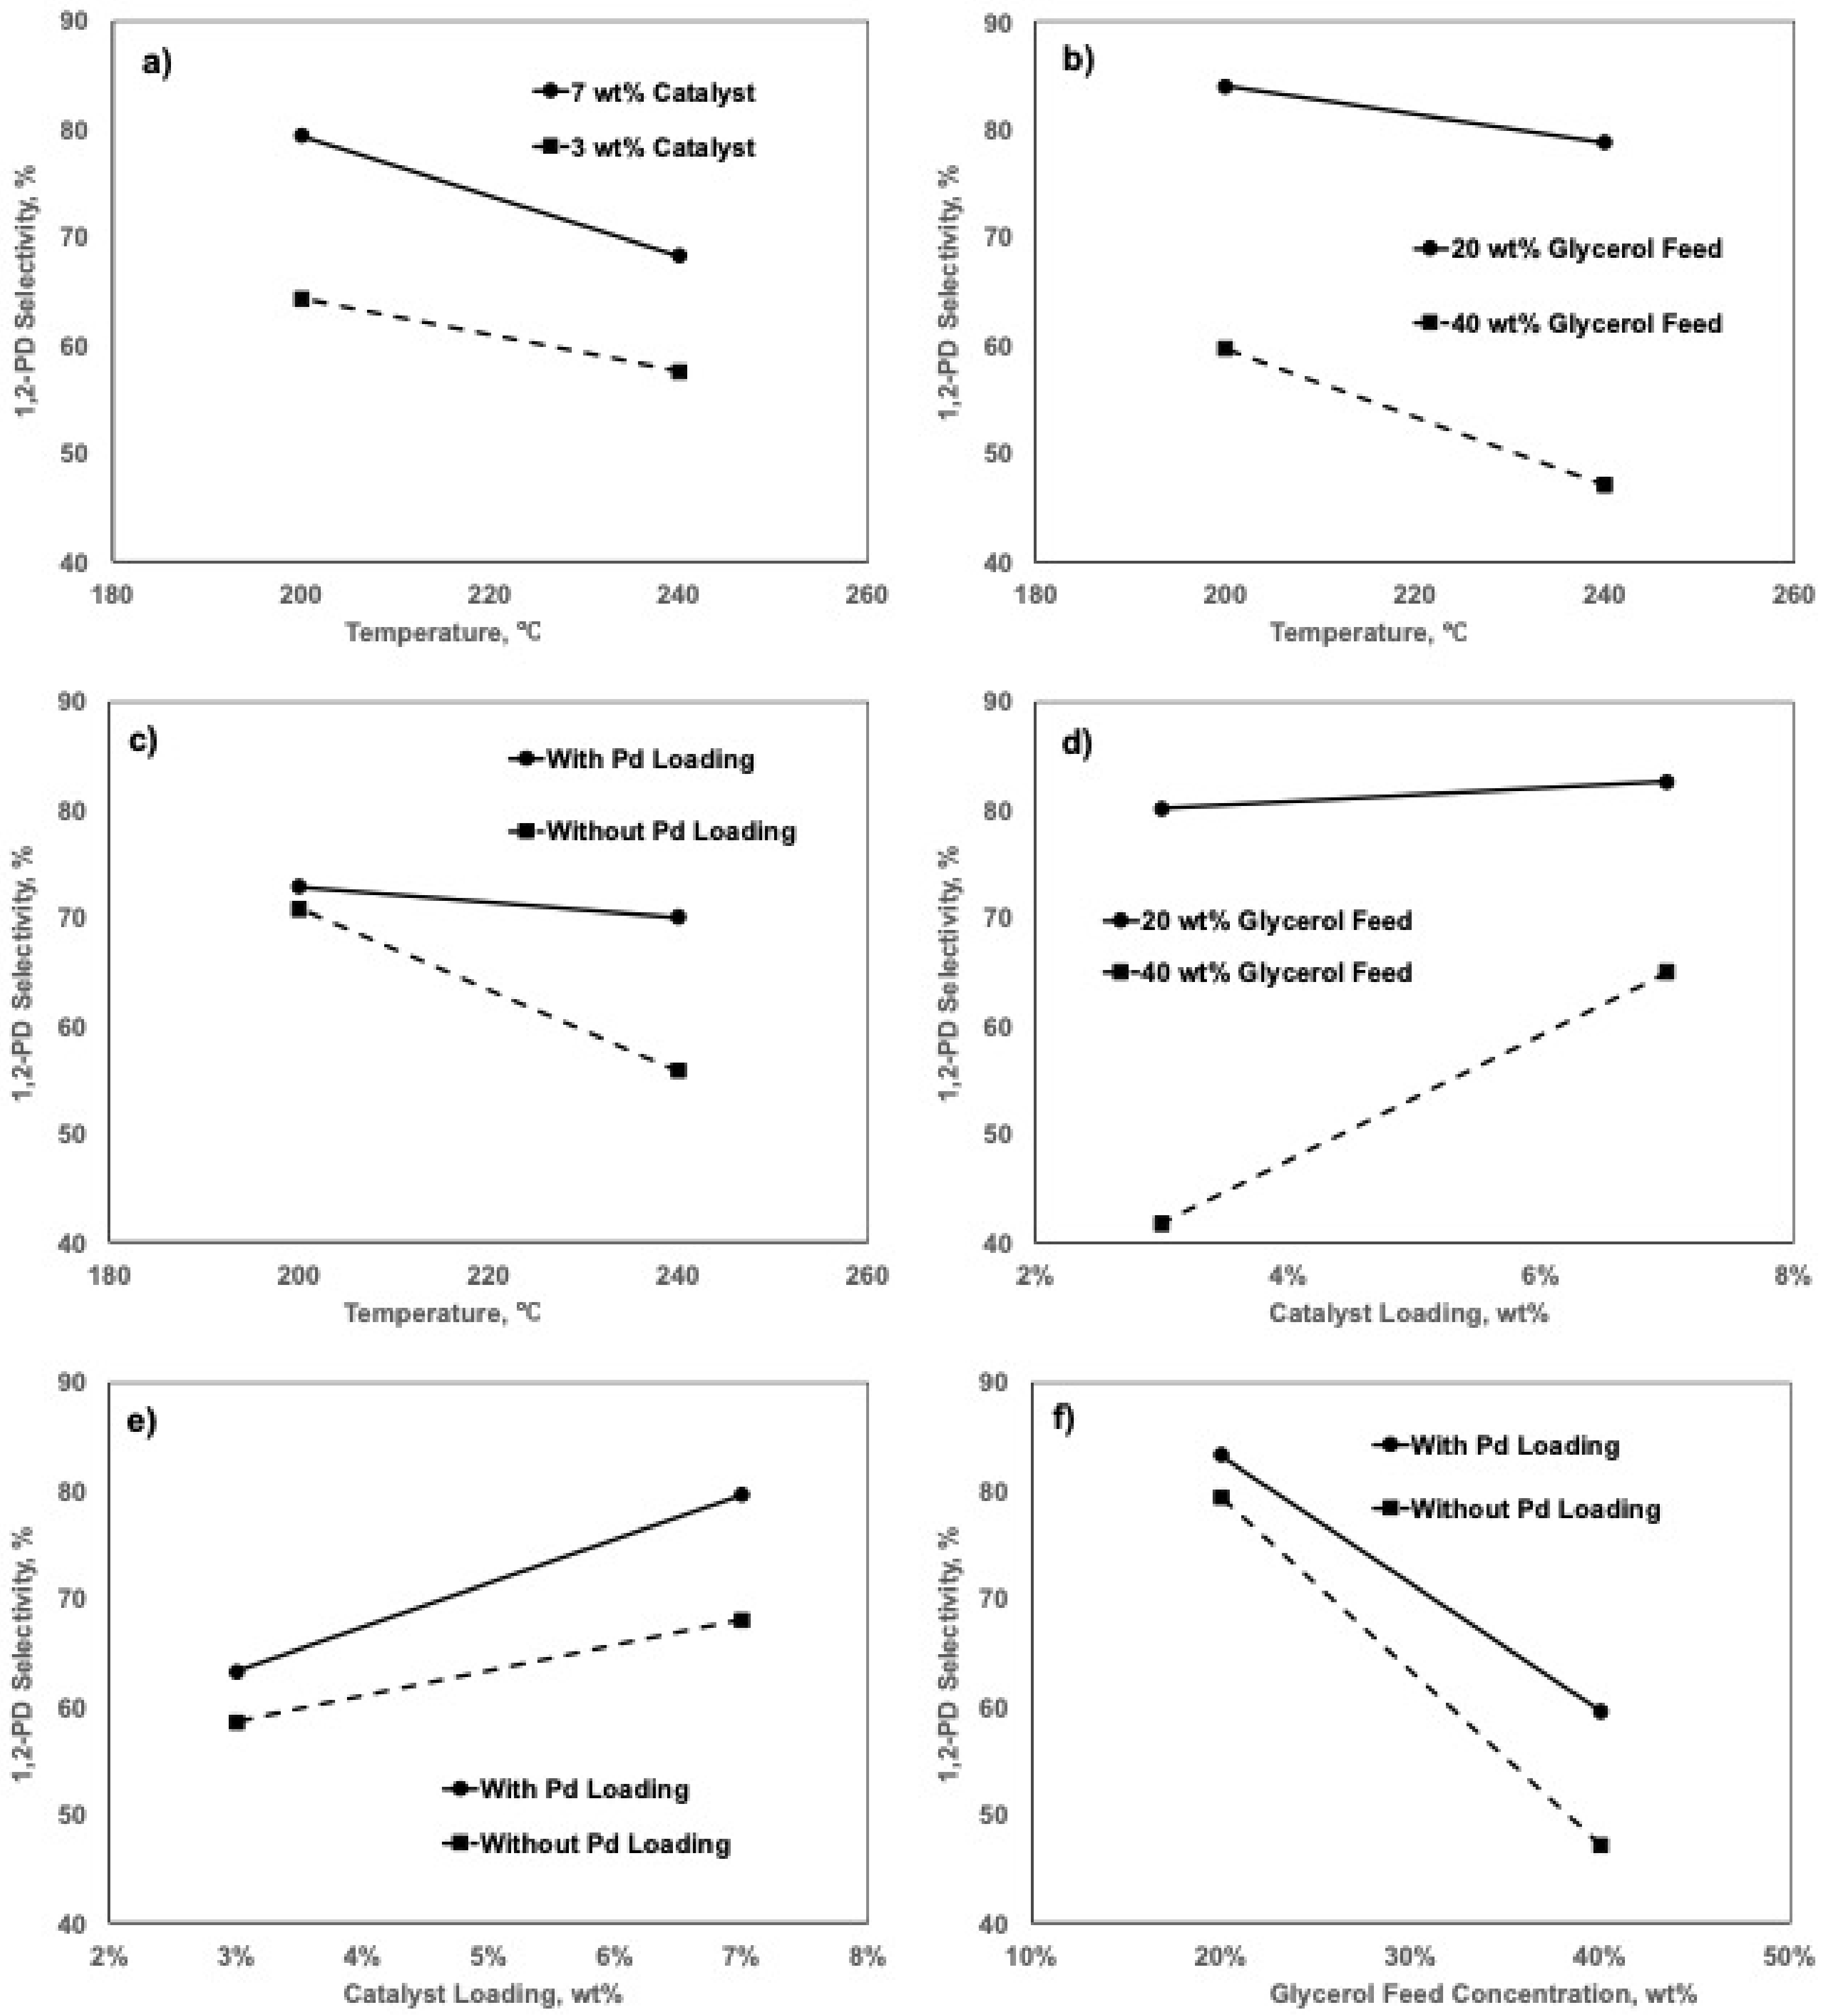
1,2-PD selectivity is the most important response in this process. A high selectivity of 1,2-PD does not only increase the economic value of the products but also saves a significant amount of energy and cost due to the purification of 1,2-PD from other undesired byproducts. As listed in the ANOVA analysis (Table A2 in Appendix A), it can be determined that factors A, B, C and D, which were temperature, catalyst loading, glycerol feed concentration and Pd loading, respectively, have the most significant effects on the 1,2-PD selectivity. As observed in Figure 7, it is clear that the significances of the effects are in the following order: glycerol feed concentration (wt%) > catalyst loading (wt%) > temperature (°C) > Pd loading (wt%). The effects of nitrogen pressure (bar), methanol to water molar ratio and stirring speed (RPM) on 1,2-PD selectivity are insignificant.
The stirring speed essentially does not affect the 1,2-PD selectivity, suggesting that the reaction system is in the absence of an external mass diffusion limitation. In addition, the absence of internal diffusion was also verified mathematically, which has been reported in various works using similar catalysts and reaction conditions [32,37]. Therefore, the reaction system is in the kinetically controlled regime. Among the four factors that can significantly affect the 1,2-PD selectivity, the glycerol feed concentration has the most significant effect, and the effect is negative. It is because a higher glycerol concentration will cause a higher rate of glycerol dehydration; in the meantime, the number of hydrogen donors, i.e., methanol and water, will be accordingly reduced, possibly resulting in a lower amount of in situ hydrogen formed from methanol steam reforming. The addition of Pd can also improve the 1,2-PD selectivity, mainly due to the enhancement of acetol hydrogenation activity, as discussed earlier. It should be noted that the temperature can negatively affect the 1,2-PD selectivity so that a lower temperature is desired to obtain a higher 1,2-PD selectivity. This is possibly because the glycerol dehydration reaction is more temperature-dependent than the acetol hydrogenation reaction by comparing the apparent activation energies between the glycerol dehydration (104.85 kJ/mol) and acetol hydrogenation (18.81 kJ/mol), as determined in Appendix B (Table A7). When the temperature is increased, the increment of glycerol dehydration rate is higher than the acetol hydrogenation rate, resulting in more unreacted acetol in the reaction mixture. It might also be possibly because the desorption of hydrogen from the catalyst surface at a higher temperature is more drastic, causing a significant reduction in the number of active hydrogenation sites.
In a complex reaction system, it is normal that factors can interact with each other on the reaction output. Two-factor interactions, which can indicate if the effect of one factor on an objective response depends on the level of the other factor, are studied in this work. It is clear in Figure A1 in Appendix A, that the interactions between reaction temperature and Pd loading (AD), and between glycerol feed concentration and catalyst loading (BC) have the most significant effects on the selectivity of 1,2-PD. Figure 8a illustrates the selectivities of 1,2-PD change when the temperature is raised from 200 to 240 °C using the catalysts with Pd loading and without Pd loading, respectively. The two lines show a severe lack of parallelism, revealing that the reaction temperature and the Pd loading have a significant interaction on 1,2-PD selectivity. It can be clearly observed that with Pd loaded onto the catalyst, the 1,2-PD selectivity is not significantly reduced while the temperature is increased; in contrast, using the catalyst without Pd promotion, the selectivity of 1,2-PD was clearly lower at a higher reaction temperature, i.e., 240 °C. As aforementioned in the discussion of the single factor effect, the temperature has a negative effect on the 1,2-PD selectivity; the addition of Pd can eliminate this negative effect, making the Pd-promoted catalyst suitable in a larger reaction temperature range. Thus, it will be essential to use a Pd-promoted catalyst when the reaction system is carried out at a higher temperature in order to achieve a higher glycerol conversion. In comparison, the Cu/MgO/Al2O3 catalyst without Pd loading can be used only at a lower temperature in order to obtain a satisfactory selectivity of 1,2-PD. This interaction can be explained by the spillover effect, with Pd doped onto a Cu-based catalyst surface. At a higher temperature, the desorption of surface hydrogen may become more drastic, resulting in a reduction of active sites for acetol hydrogenation. Pd on the Cu surface can assist the hydrogen molecules in the reaction mixture to be dissociatively adsorbed on the Pd surface; the surface hydrogen atoms can rapidly spill over to the otherwise nearly inert Cu surface for acetol hydrogenation [71,74,76]. Figure 8b also shows nonparallelism between the two lines, revealing that the interaction between the catalyst loading and the glycerol feed concentration is also significant on the selectivity of 1,2-PD. It can be observed that when the glycerol feed concentration is low, the 1,2-PD selectivity is not significantly increased, as the catalyst loading is increased, while it is known in the single factor effect study that the catalyst loading has a positive effect on the 1,2-PD selectivity. It has been studied by Professor’s Lemonidou’s group that the insufficient hydrogen is mainly attributed to the competitive adsorption between methanol and glycerol [37,38,39]. When a lower glycerol concentration is applied as the feedstock (i.e., 20 wt%), the methanol and water concentration will be higher accordingly, enhancing their competitive adsorptions onto the catalyst surface. When the glycerol feed concentration is high (i.e., 40 wt%), the adsorptions of methanol and water are more competitively affected; therefore, a higher amount of catalyst is essential to provide a more active site for methanol steam reforming.
2.5.2. Effects of Factors on Glycerol Conversion
Glycerol conversion is another important response for this process. Based on the ANOVA analysis listed in Table A3 in Appendix A, three factors can significantly affect the glycerol conversion, and their effects are in the following order: temperature (°C) > Pd loading (wt%) ≅ catalyst loading (wt%). As illustrated in Figure 9, the temperature has the most significant effect on the glycerol conversion, and the effect is positive. This is because the reaction rates for glycerol dehydration and glycerol C–C cleavage to EG are all highly temperature-dependent, as suggested by their high apparent activation energies (104.85 and 108.97 kJ/mol, respectively) according to the kinetic calculation in section Appendix B (Table A7). Therefore, a higher reaction temperature is of the most importance in order to obtain a higher glycerol conversion. Pd loading can also increase the glycerol conversion because the enhanced acetol hydrogenation activity of the catalyst due to the addition of Pd can consequently shift the equilibrium of the glycerol dehydration reaction forward.
The two-factor interaction analyses reveal that the interactions between temperature and Pd loading (AD), between catalyst loading and Pd loading (BD) and between glycerol feed concentration and Pd loading (CD) can significantly impact the glycerol conversion, as illustrated in Figure A7 in Appendix B. Figure 10a revealed that the catalyst loading and Pd loading could have an interaction with glycerol conversion. It was observed that increasing the catalyst amount was more essential in order to obtain a higher glycerol conversion using the Cu/MgO/Al2O3 catalyst without Pd loading; while using a Pd-promoted Cu/MgO/Al2O3 catalyst, a high glycerol conversion can be obtained using various amounts of catalyst. Nevertheless, both Pd addition and a high amount of the catalyst are essential factors in order to obtain a higher 1,2-PD selectivity, especially when a high glycerol feed concentration is used, i.e., 40 wt%, as discussed previously (Figure 7). It was previously determined that the glycerol feed concentration did not have a significant effect on the glycerol conversion; however, as illustrated in Figure 10b, the glycerol feed concentration could have an interaction with Pd loading on glycerol conversion. If the catalyst with Pd was used, the glycerol conversion was not significantly affected by the glycerol feed concentration; while if the catalyst without Pd was used, the glycerol conversion was clearly decreased when the glycerol feed concentration was increased. Therefore, when the glycerol feed concentration is high, the introduction of Pd is crucial in order to obtain a high glycerol conversion. Figure 10c showed that using the catalyst with Pd loading, the glycerol conversion was less temperature-dependent compared with that using a catalyst without Pd loading. Since glycerol dehydration is highly temperature-dependent (Ea = 104.85 kJ/mol), when the reaction temperature is lower, the glycerol conversion will be lower accordingly; while the enhancement of the acetol hydrogenation activity induced by Pd can more significantly shift the glycerol dehydration reaction forward. Therefore, a higher glycerol conversion can be obtained using a Pd-promoted catalyst if the reaction is carried out at a lower temperature.
3. Materials and Methods
3.1. Catalyst Preparation
Ethanol and acetone (HPLC grade) were purchased from Fisher Scientific Canada (Mississauga, ON, Canada). The other chemicals were purchased from Sigma Aldrich Co. Canada (Oakville, ON, Canada) and all the gases were purchased from Praxair Canada Inc (Mississauga, ON, Canada). The Cu/MgO/Al2O3 catalysts were prepared by an oxalate gel-coprecipitation method, and Pd was loaded onto the Cu/MgO/Al2O3 and other supports via an impregnation method. The preparation methods have been thoroughly reported in our previous reports using Cu(NO3)2.2.5H2O (≥98%), Mg(NO3)2.6H2O (≥98%), Al(NO3)3.9H2O (≥98%) and palladium (II) acetate (98%) as the precursors [3,32,33]. The Cu/MgO/Al2O3 supported Pd catalysts were referred to as xPd/Cu/MgO/Al2O3, in which x represents the weight percentage of Pd loaded onto the catalyst support.
3.2. Catalyst Characterization
Transmission electron microscopy (TEM) images were collected with an FEI Titan 80–300 TEM (Hillsboro, OR, USA) equipped with an aberration corrector for the imaging lens (CEOS). The X-ray diffraction (XRD) patterns were obtained on a Bruker D8 Focus model (Madison, WI, USA). The vacuum tube parameters were set to 40 kV potential and 30 mA current intensity. The Cu kα radiation wavelength was 1.54 Å, and the 2θ angle range was set between 25° and 55° at a ramp of 5° per minute. Temperature program reduction (TPR) analyses were carried out using an Altamira AMI-200 instrument (Pittsburgh, PA, USA). Approximately 100 mg of the catalyst was loaded into a U-shaped quartz reactor for each test. The catalyst was first heated to 200 °C for 60 min under a stream of 30 mL/min Argon flow to remove all the moisture and other species physically adsorbed on the catalyst surface. Then the catalyst was heated under a stream of 30 mL/min 5% H2 balanced with Argon at a heating rate of 2 °C /min until 500 °C.
3.3. Catalyst Activity Test
All the reaction experiments were carried out in a 300 mL Parr Instrument 4560 Series mini benchtop reactor constructed by Hastelloy. Before each experiment, the catalyst was pre-reduced under an ultra-high purity hydrogen flow at 300 °C for 3 h in a quartz tubular reactor enclosed by a furnace. Then the reduced catalyst was quickly transferred into the reaction mixture. For the experiments using in situ hydrogen produced from methanol steam reforming, the reactor was first flushed with an ultra-high purity nitrogen stream 3 times and pressurized at the designated pressure at ambient temperature before being heated to the desired temperature. For the experiments with molecular hydrogen added, the reactor was first flushed by ultra-high purity hydrogen 3 times. Over the reaction time, the hydrogen pressure in the reactor was kept constant by connecting the reactor to the hydrogen cylinder via a gauge. Liquid samples were taken via a sampling valve during the reaction time and analyzed by an Agilent 6890 N gas chromatograph (GC) integrated with a DB-WAX megabore capillary column (30 m × 0.53 mm I.D. × 10 μm film thickness) and a flame ionization detector (FID). 1,4-butanediol in a n-butanol solution mixture with a 1,4-butanediol concentration of 5 g/L used as the standard solvent for GC analysis. The conversion of glycerol, selectivities of different products and yields of the products were calculated on a molar basis as described in our previous work [3,32,33].
3.4. Fractional Factorial Design and Analyses
Seven factors were investigated in this factorial design analysis, which were reaction temperature (°C), catalyst loading (wt% with respect to the weight of total reactant mixture), glycerol feed concentration (wt%), Pd loading (wt% with respect to the weight of support), stirring speed (RPM), nitrogen pressure (bar) and water to methanol molar ratio. A high-level condition and a low-level condition for each factor were applied and coded as +1 and −1, respectively. The experiments at the average of each condition, which was coded as 0, were also carried out and repeated to check the repeatability. The 7 conditions are referred to as A, B, C, D, E, F and G, respectively, and the levels of each condition are listed in Table 6. A 27−3 fractional factorial design experiment was performed in this study; 20 experiments were carried out, including 16 experiments for the factorial design and 4 replications of the center point, which was coded 0, as listed in Table 7. Four basic factors were chosen, which were A, B, C and D. The other three factors were constructed by their generators. The code of each factor was designed as the product of the codes of the other three factors, which were E = ABC, F = BCD and G = ACD. The entire design met the criteria of resolution IV design that no basic factor was aliased with any other basic factor or any two-factor interaction, as suggested in Montgomer and Runger’s book [77]. The design of generators and the resolution for the design with a different number of factors are provided in Table S1. Two responses affected by the factors were examined, 1,2-PD selectivity and glycerol conversion. The effect of a single factor on one response can be estimated by the difference between the average of the responses at the high level (+) of such factor among eight treatments and the average of the responses at the low level (−) of such factor among eight treatments, as shown in Equation (2). The significance of the single factor effects on each response was determined via analysis of variance (ANOVA). The two-factor interactions were investigated by plotting two lines for the average effects of one factor at the high level of the other factor and the average effects of this factor at the low level of the other factor. If the two lines are nearly parallel to each other, the interaction of these two factors on the response is considered to be insignificant. When the lines apparently deviate from being parallel, it is considered that there is a significant interaction between these two factors. The factors and two-factor interactions that have significant effects on the responses were investigated, and the residual normal probability plots from the estimated model were used to check the validity of the analyses. Minitab software was used to calculate different statistical parameters for ANOVA analysis.
where,
- Ei—Effect of single factor i
- Ri—Response at factor i level (+/−)
4. Conclusions
A Pd-promoted Cu/MgO/Al2O3 catalyst was found to be effective for glycerol hydrogenolysis to give a high yield and selectivity to 1,2-PD with in situ hydrogen produced from steam reforming. The addition of Pd up to 2 wt% onto a Cu/MgO/Al2O3 catalyst resulted in a significant improvement of 1,2-PD selectivity from 54.9% to 73.2% when a high glycerol feed concentration of 40 wt% was used; the selectivity of other undesired byproducts from side reactions related to acetol was reduced from 36.4% to 18.4%. This promoting effect was mainly attributed to the enhancement of the activity of acetol hydrogenation reaction induced by the addition of Pd. More rapid acetol hydrogenation can improve the selectivity of 1,2-PD by suppressing the formation of undesired byproducts, which are formed due to the side reactions caused by acetol. The rate constant for acetol hydrogenation using a 2 wt% Pd loaded Cu/MgO/Al2O3 with molecular hydrogen was three times higher than that without added Pd, confirming that the addition of Pd significantly improved the acetol hydrogenation reaction.
A 27−3 fractional factorial analysis showed that glycerol feed concentration was found to be the most significant negative factor on the 1,2-PD selectivity. Higher catalyst loading and the catalyst with Pd loading can improve the 1,2-PD selectivity. Furthermore, the addition of Pd can greatly offset the negative effect of temperature on the 1,2-PD selectivity so that the process can be carried out at a higher temperature without sacrificing the 1,2-PD selectivity. The temperature has the most significant positive effect on the glycerol conversion, indicating that a high temperature is essential to get a high glycerol conversion. Interestingly Pd loading can also enhance the glycerol conversion, mainly due to the enhanced acetol hydrogenation reaction shifting the reaction equilibrium of glycerol dehydration forward. In order to obtain a satisfactory glycerol conversion and 1,2-PD selectivity when a high glycerol feed concentration is used in this process, high temperature, high catalyst loading and the addition of Pd to the catalyst are the most essential factors.
Supplementary Materials
The following are available online at https://www.mdpi.com/article/10.3390/catal11111299/s1, Table S1: Criteria for a Fractional Factorial Design Figure, Figure S1: The normal probability plot of the residual for the glycerol hydrogenolysis process with in situ hydrogen from methanol steam reforming, Catalyst: 1Pd/Cu/MgO/Al2O3, Figure S2: The normal probability plot of the residual for the glycerol hydrogenolysis process with in situ hydrogen from methanol steam reforming, Catalyst: Cu/MgO/Al2O3, Figure S3: The concentration of different components over the reaction time for acetol hydrogenation, Figure S4: The normal probability plot of the residual for the acetol hydrogenation, Catalyst: Cu/MgO/Al2O3, Figure S5: The normal probability plot of the residual for the acetol hydrogenation, Catalyst: 2Pd/Cu/MgO/Al2O3.
Author Contributions
Conceptualization, Y.L. and F.T.T.N.; methodology, Y.L.; validation, G.L.R. and F.T.T.N.; formal analysis, Y.L. and M.W.; writing—original draft preparation, Y.L.; writing—review and editing, G.L.R. and F.T.T.N.; supervision, G.L.R. and F.T.T.N.; project administration, G.L.R. and F.T.T.N.; funding acquisition, G.L.R. and F.T.T.N. All authors have read and agreed to the published version of the manuscript.
Funding
This research was funded by Natural Science and Engineer Research Council of Canada (NSERC) Discovery Grant Program.
Conflicts of Interest
The authors declare no conflict of interest.
Appendix A. Factorial Design Analysis

Table A1.
Repeatability analysis of the center point.
| Exp# | Glycerol Conversion % | Selectivities % | ||||
|---|---|---|---|---|---|---|
| 1,2-PD | Acetol | EG | Propanol | Others | ||
| 17 | 96.2 | 81.7 | 0.7 | 8.5 | 0.7 | 8.3 |
| 18 | 95.3 | 80.7 | 1.1 | 8.1 | 1.2 | 8.9 |
| 19 | 98.2 | 82.1 | 0.6 | 9.3 | 0.2 | 7.8 |
| 20 | 98.8 | 81.5 | 0.5 | 8.3 | 0.2 | 9.5 |
| mean | 97.1 | 81.5 | 0.7 | 8.6 | 0.6 | 8.6 |
| SD a | 1.7 | 0.6 | 0.3 | 0.5 | 0.5 | 0.7 |
| CoV b | 0.02 | 0.01 | 0.4 | 0.1 | 0.8 | 0.1 |
a Standard deviation (SD). b Coefficient of variation (CoV).
Part 1. Effect of Factors on 1,2-PD Selectivity
Table A2.
ANOVA for Single Factor Effects on 1,2-PD Selectivity Analysis.
| Factors | DF | Effect | SS | MS | f-Value a | p-Value b |
|---|---|---|---|---|---|---|
| A | 1 | −8.9 | 315.95 | 315.95 | 4.48 | 0.058 |
| B | 1 | 12. 9 | 664.35 | 664.35 | 9.42 | 0.011 |
| C | 1 | −27.9 | 3122.02 | 3122.02 | 44.27 | 0.000 |
| D | 1 | 8.1 | 261.63 | 261.63 | 3.71 | 0.080 |
| E | 1 | −1.7 | 11.06 | 11.06 | 0.16 | 0.700 |
| F | 1 | 7.0 | 193.91 | 193.91 | 2.75 | 0.126 |
| G | 1 | 5.6 | 127.13 | 127.13 | 1.8 | 0.206 |
| Curvature | 1 | |||||
| Error | 11 | 775.78 | 70.53 | |||
| Total | 19 | 6110.83 |
af(0.1,1,11) = 3.23; b significant factors (p < 0.1).
Figure A1.
Two factor interactions on the 1,2-PD selectivity. (a) AB; (b) AC; (c) AD; (d) BC; (e) BD; (f) CD.
Figure A1.
Two factor interactions on the 1,2-PD selectivity. (a) AB; (b) AC; (c) AD; (d) BC; (e) BD; (f) CD.

A mathematical model describing the significant single-factor effects and two-factor interactions on each response was developed to verify the validity of this analysis. A normal probability plot of residual was constructed to check the adequacy of this analysis. The half value of the effect of each factor was used as the coefficient of each factor. The effect of each factor on 1,2-PD selectivity is described in Equation A1, where Ct represents center point. The normal probability plot is presented in Figure A2 in the Appendix A. Since the errors satisfactorily fall alone a straight line within 90% confident interval and only one point slightly deviates from the line suggesting the assumptions for this analysis are adequate.
Figure A2.
Normal probability plot of residuals for the effects on 1,2-PD selectivity.
Part 2. Effect of Factors on Glycerol Conversion
Table A3.
ANOVA for single factor effects on glycerol conversion analysis.
| Factors | DF | Effect | SS | MS | f-Value a | p-Value b |
|---|---|---|---|---|---|---|
| A | 1 | 21.0 | 1761.90 | 1761.90 | 25.11 | 0.000 |
| B | 1 | 8.6 | 296.70 | 296.70 | 4.23 | 0.000 |
| C | 1 | −1.1 | 4.73 | 4.73 | 0.07 | 0.064 |
| D | 1 | 9.0 | 326.71 | 326.71 | 4.66 | 0.800 |
| E | 1 | 5.9 | 141.02 | 141.02 | 2.01 | 0.054 |
| F | 1 | −6.6 | 172.27 | 172.27 | 2.46 | 0.184 |
| G | 1 | −3.4 | 45.90 | 45.90 | 0.65 | 0.145 |
| Curvature | 1 | |||||
| Error | 11 | 771.79 | 70.16 | |||
| Total | 19 | 3870.04 |
af(0.1,1,11) = 3.23; b significant factors (p < 0.1).
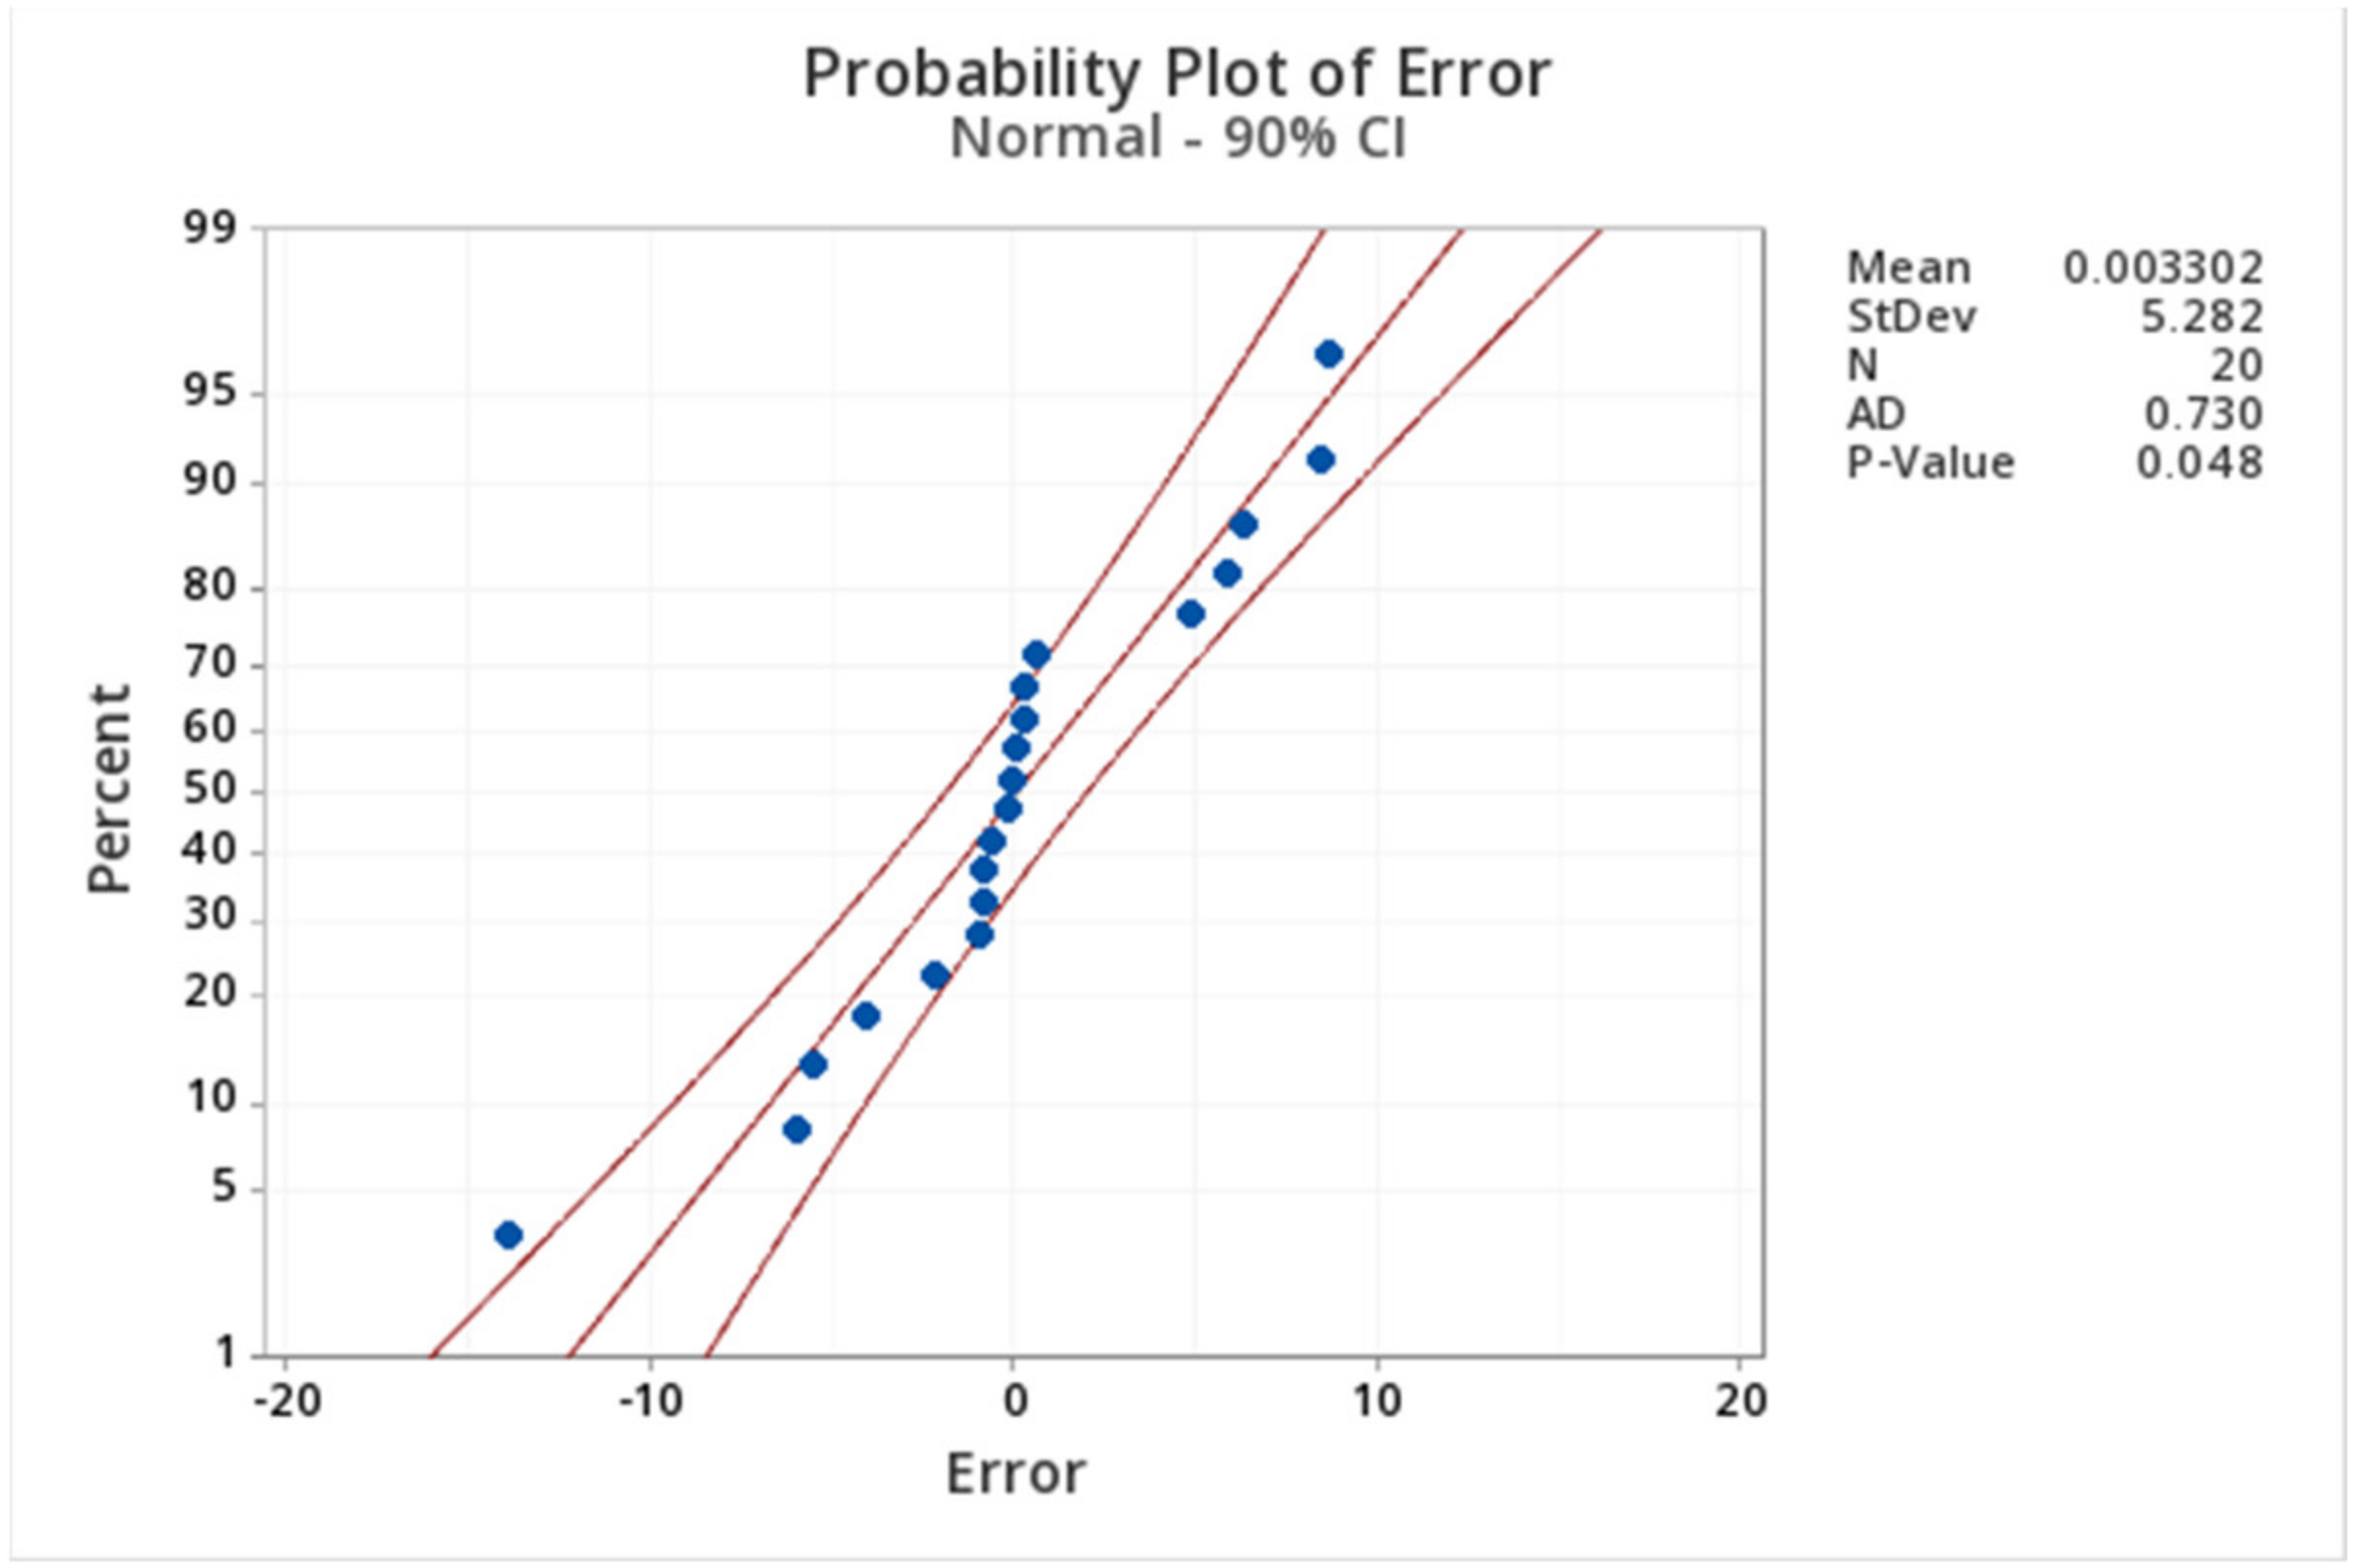
Figure A3 illustrated the two factor interaction on glycerol conversion. As observed in Figure A3a,b,d, the two lines are nearly parallel to each other suggesting that the interaction of the two corresponding factors are insignificant. Therefore, the interactions between temperature and Pd loading (AD), between catalyst loading and Pd loading (BD) and between glycerol feed concentration and Pd loading (CD) can significantly impact the glycerol conversion. The significant single-factor effects and two-factor interactions on the glycerol conversion can be summarized by the model described in Equation (A2) and the normal probability of the residual for Equation (A2) was shown in Figure A4 in the Appendix A. It is clear that all the residual points satisfactorily fall along a straight line suggesting the model analysis is adequate.
Figure A3.
Two factor interactions on the glycerol conversion.
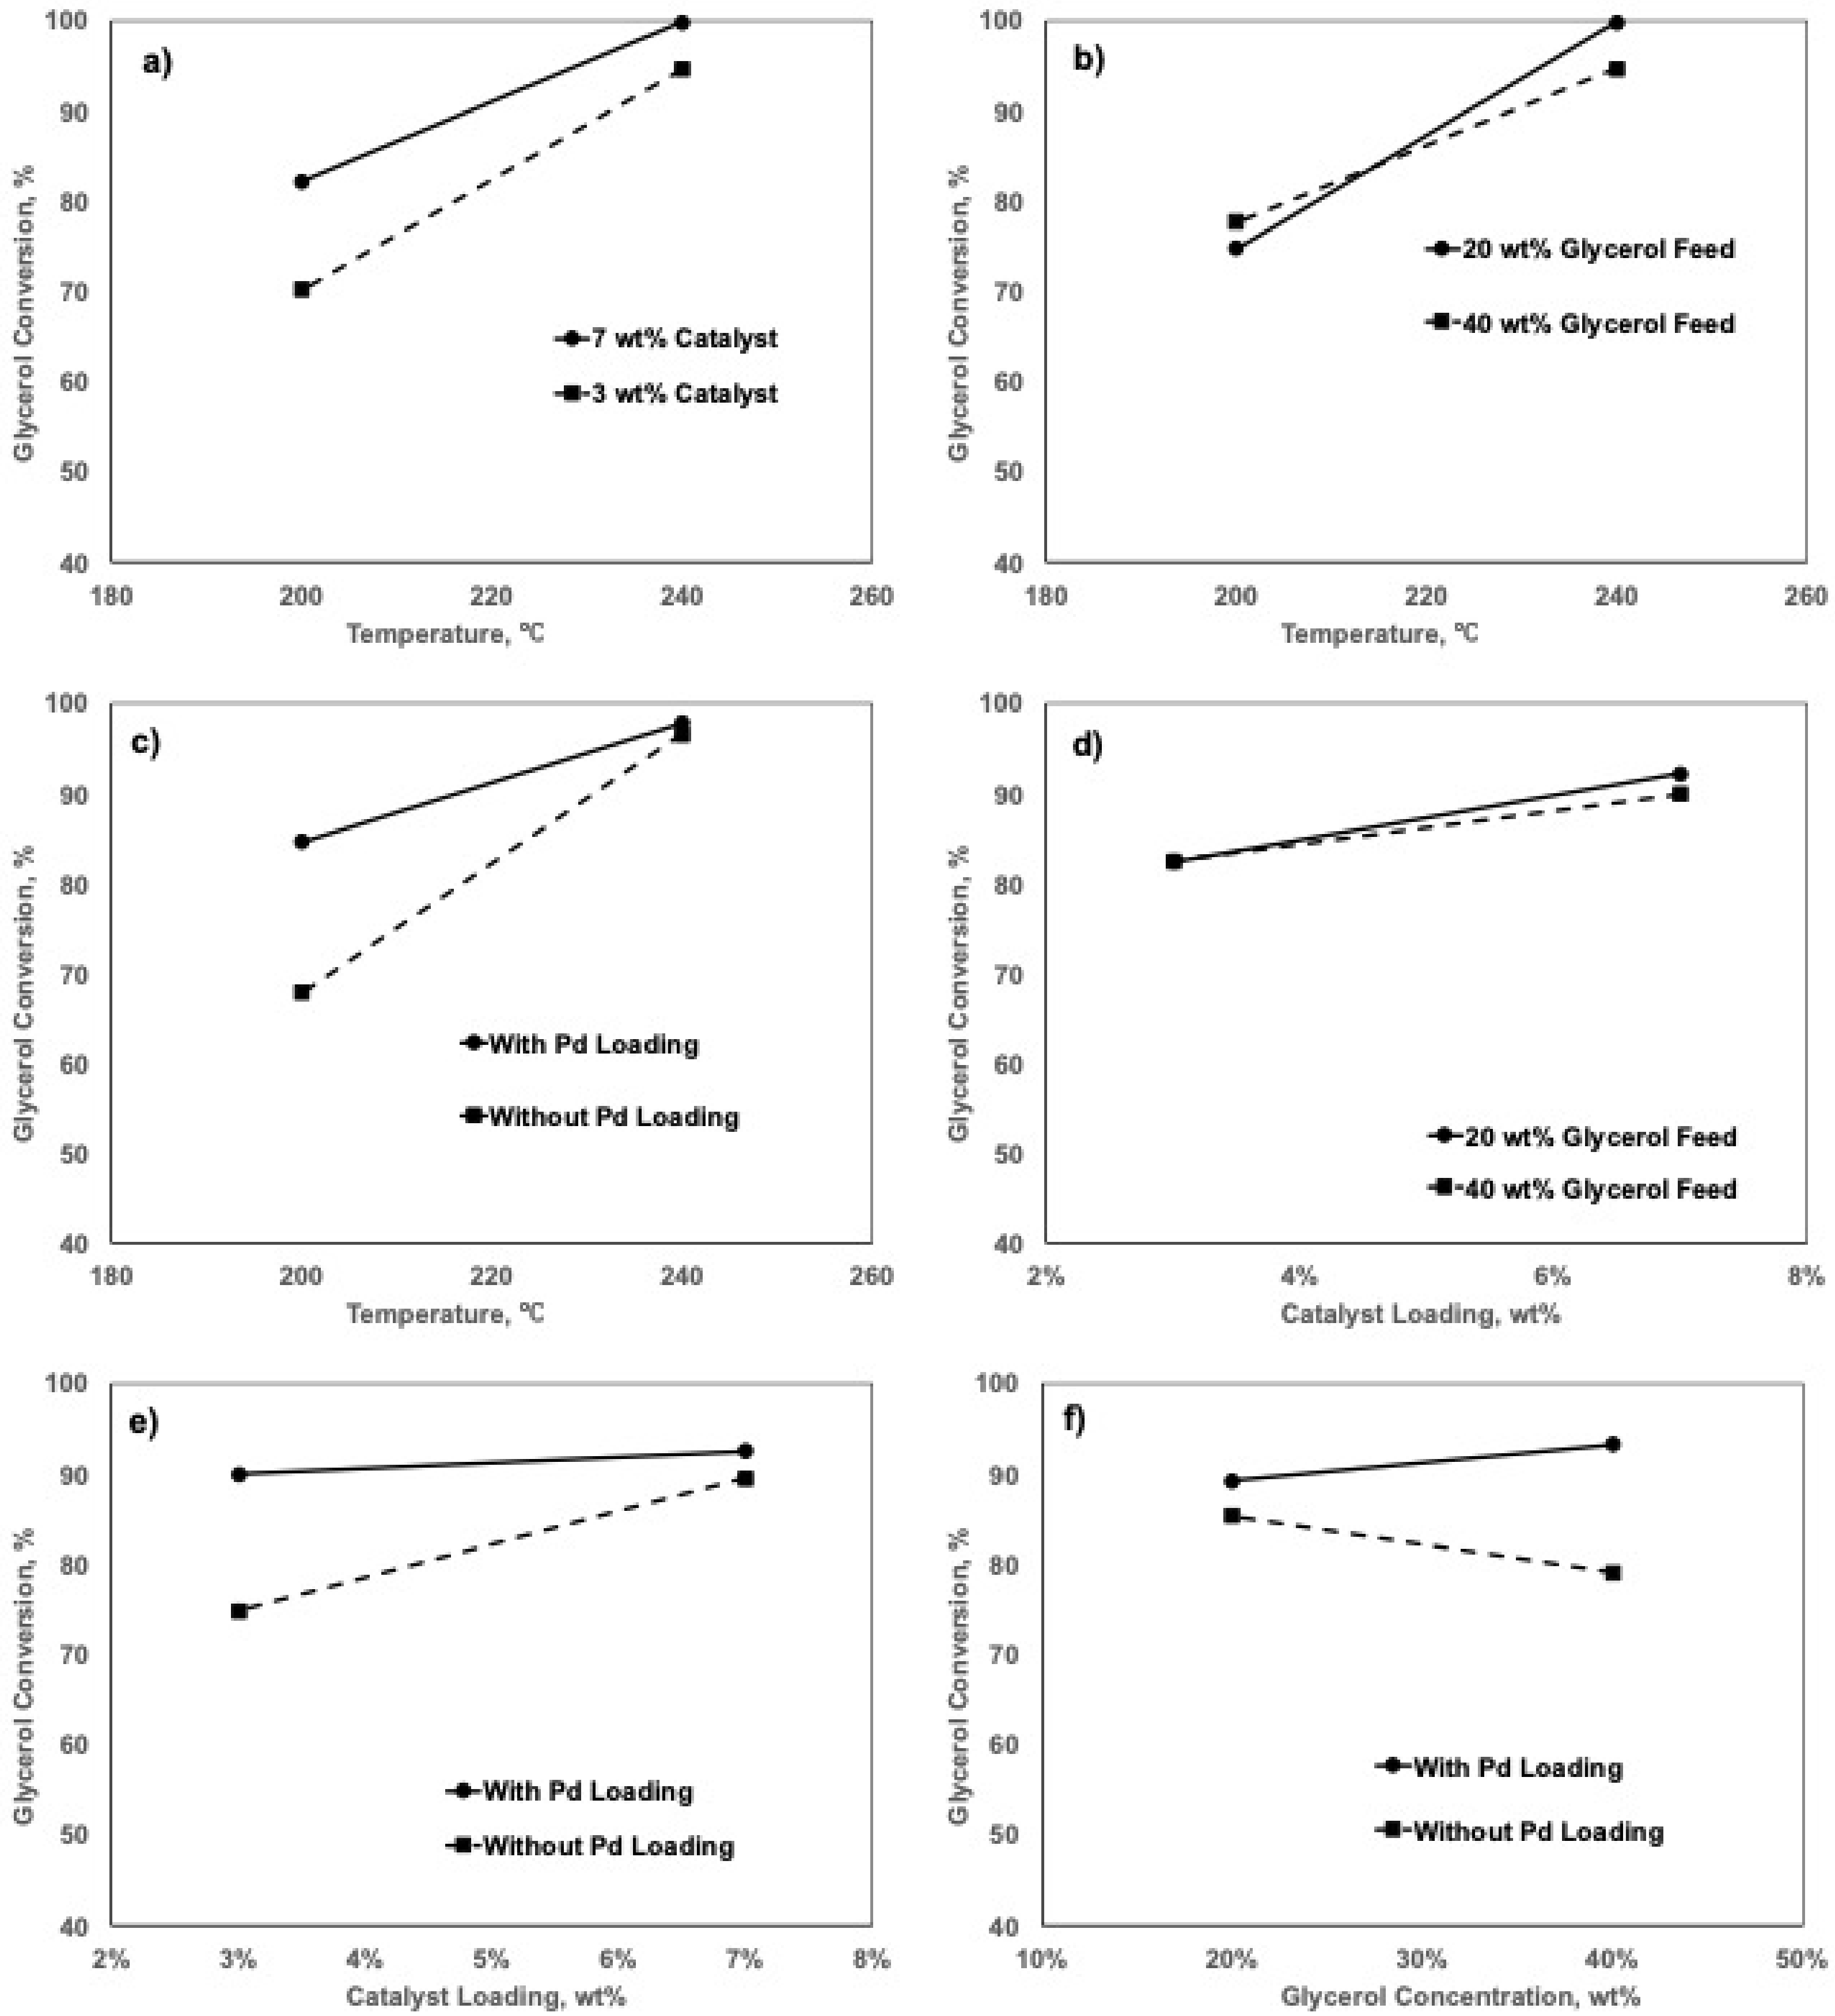
Figure A4.
Normal probability plot of residuals for the effects on glycerol conversion.
Appendix B. Calculation of Kinetic Parameters for Glycerol Hydrogenolysis to 1,2-PD and Glycerol C–C Cleavage to EG with Molecular Hydrogen
A pseudo-first-order kinetic model for glycerol hydrogenolysis with molecular hydrogen has been developed for this reaction system. The processes were carried out with a constant gaseous hydrogen pressure (600 psi) at three different temperatures, which were 180 °C, 200 °C and 220 °C respectively. Because the concentration of acetol is too low, the kinetic model proposed by Scheme 1 in the main text is not able to be applied. Therefore, the rate of acetol hydrogenation, which is also the rate of 1,2-PD formation, can be approximately considered as the rate of glycerol dehydration assuming that the acetol is hydrogenated into 1,2-PD as soon as it is formed via glycerol dehydration and the glycerol dehydration step is the rate-limited-step. A simplified reaction pathway was proposed for this kinetic study so that k1 and k2 represent the rate constants for glycerol dehydration and glycerol C–C cleavage respectively as illustrated in Scheme A1. The rate expression for each compound in the reaction system were presented in Table A4. The rate constant for acetol dehydration will be determined via an aceto dehydration reaction. The ordinary differential equation combined with the nonlinear regression via the Levenberg-Marquardt algorithm was solved by RStudio software to estimate the rate constant k for each reaction.
Scheme A1.
Reaction pathway of glycerol hydrogenolysis.
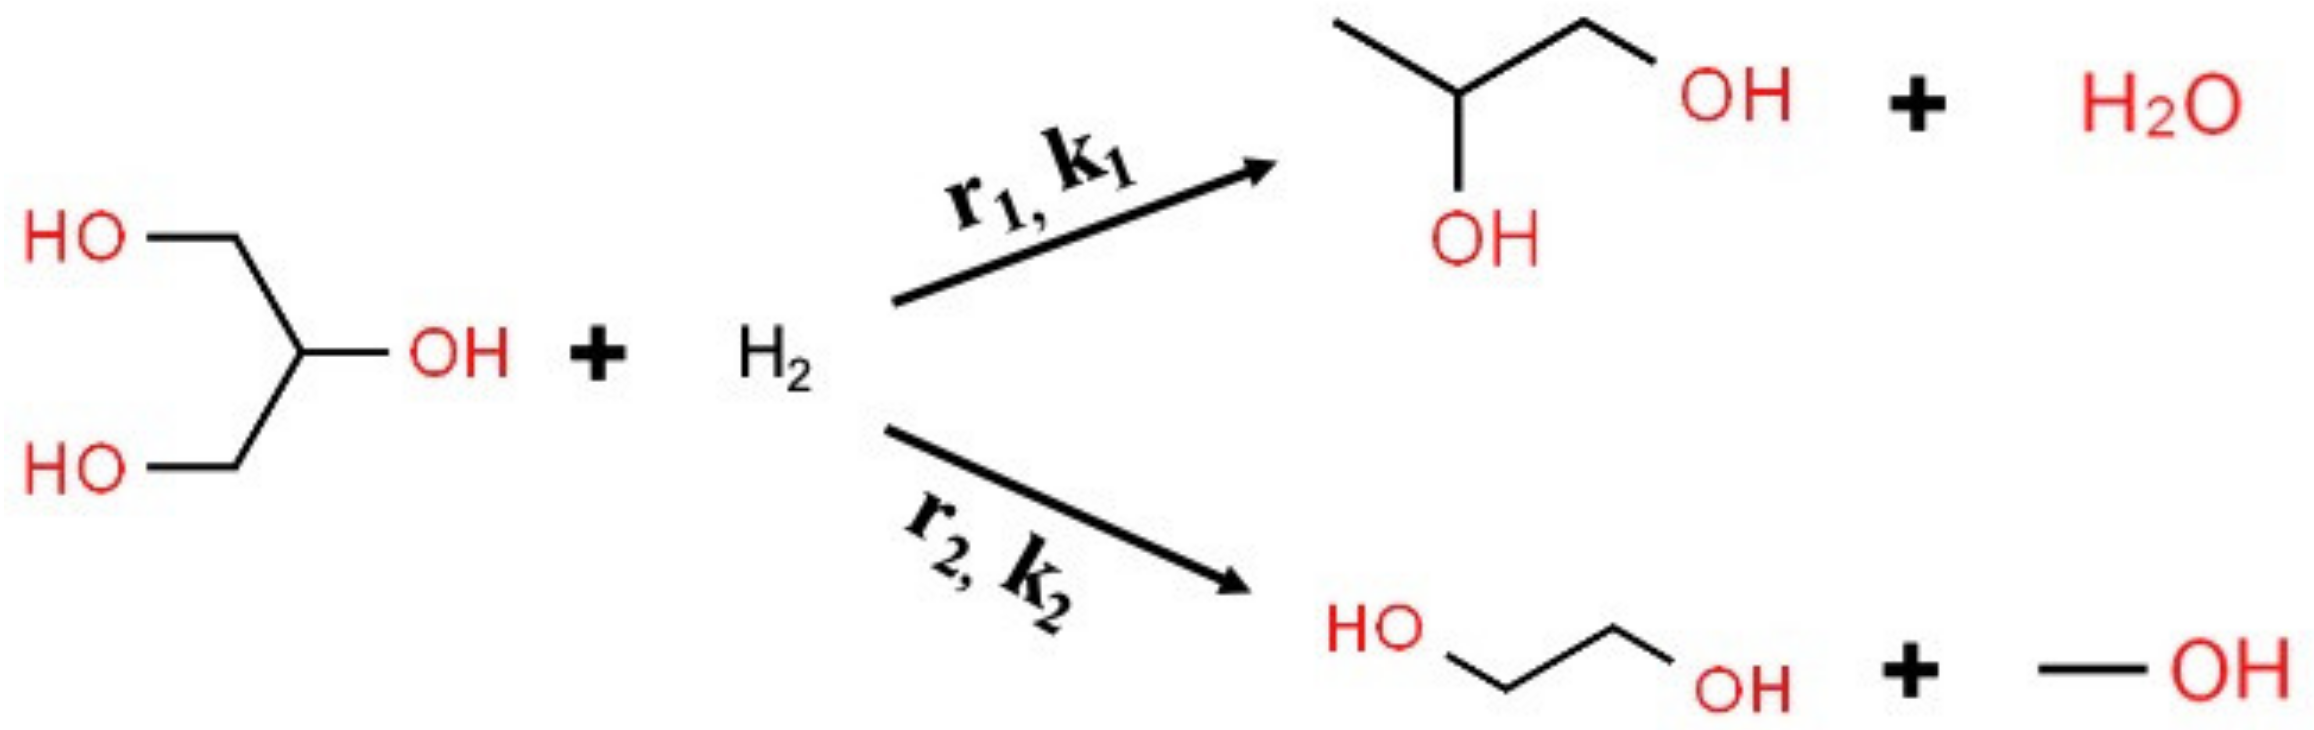
Table A4.
(a) Rate expressions for the compounds in a glycerol hydrogenolysis process, (b) Mole balance equation for each compound.
Table A4.
(a) Rate expressions for the compounds in a glycerol hydrogenolysis process, (b) Mole balance equation for each compound.
| (a) | |
|---|---|
| Reaction | Rate expression |
| Glycerol dehydration | |
| Glycerol C-C cleavage | |
| (b) | |
| Compound | Rate expression |
| Glycerol | |
| 1,2-PD | |
| EG |
[i]: molar concentration of each compound per g of catalyst (mol L−1). ri: rate of the reaction (mol.L−1 s−1 gcat−1). ki: rate constant of each reaction (s−1 gcat−1). w: weight of catalyst (g).
The experimental results of the glycerol hydrogenolysis with molecular hydrogen at three different temperature were listed in Table A5. The reaction rates of both 1,2-PD formation and EG formation were increased with temperature as indicated by the increasing rate constants. Figure A5 suggested that the kinetic model is reliable as the experimental values of the concentrations of each component satisfactorily fall alone the lines which represent the predicted values by the kinetic model; the normal probability plots of the residual at each reaction temperature in Figure A6 also validate the adequacy of this kinetic model as all the errors suitably fall alone a straight line within a 90% confidence interval. The concentration of the acetol is too low in the reaction mixture compared with other components. This is because that the rate of acetol hydrogenation is significantly higher than the rate of glycerol dehydration. The rate constant for acetol hydrogenation is an order of magnitude higher than the rate constant for glycerol dehydration compared with the data in Table 3 in the main text. Therefore, the pseudo-first-order kinetics for acetol hydrogenation was developed separately by carrying out the acetol hydrogenation reaction at three differently temperatures as listed in Table A6. The experimental values of the concentrations of acetol over the reaction time meet a satisfactory agreement with the predicted values from the kinetic data as shown in Figure A7; also the residual values between the experimental values and predicted values adequately fall alone a straight line as shown in Figure A8 suggesting the model is reliable. The activation energy for each reaction (glycerol dehydration, glycerol C-C cleavage and acetol hydrogenation) was estimated graphically using Arrhenius equation by plotting 1/T versus the natural logarithm value of the rate constant as illustrated in Figure A9. The calculated activation energies and pre-exponential factors for the three reactions were listed in Table A7.
Table A5.
Glycerol hydrogenolysis with molecular hydrogen at three temperatures a.
| Temperature °C | Conversion, % | Selectivity, % | Rate Constant, s−1 | ||||
|---|---|---|---|---|---|---|---|
| Glycerol | 1,2-PD | Acetol | EG | Others | k1 | k2 | |
| 180 | 42.9 | 90.0 | 0.0 | 9.3 | 0.7 | 9.72 × 10⁻⁶ | 1.32 × 10⁻⁶ |
| 200 | 83.9 | 89.6 | 0.5 | 9.0 | 0.8 | 3.61 × 10⁻⁵ | 4.34 × 10⁻⁶ |
| 220 | 100.0 | 86.1 | 0.5 | 9.2 | 3.5 | 9.26 × 10⁻⁵ | 1.38 × 10⁻⁵ |
a Conditions: 50 wt% aqueous glycerol, 500 RPM, 400psi hydrogen pressure, 24 hours reaction time, 5 wt% of catalyst with respect to glycerol weight, catalyst: 2 wt% Pd supported on Cu/MgO/Al2O3, Cu/Mg/Al (molar) = 22.5/67.5/10.
Figure A5.
Concentration of each component over the reaction time of glycerol hydrogenaolysis at different temperatures: (a) Glycerol, (b) 1,2-PD, (c) EG. Lines: Predicted value from fitting model.
Figure A5.
Concentration of each component over the reaction time of glycerol hydrogenaolysis at different temperatures: (a) Glycerol, (b) 1,2-PD, (c) EG. Lines: Predicted value from fitting model.

Figure A6.
Residual normal probability plot for the glycerol dehydration and EG formation kinetic parameters estimation: (a) 180 °C, (b) 200 °C, (c) 220 °C.
Figure A6.
Residual normal probability plot for the glycerol dehydration and EG formation kinetic parameters estimation: (a) 180 °C, (b) 200 °C, (c) 220 °C.
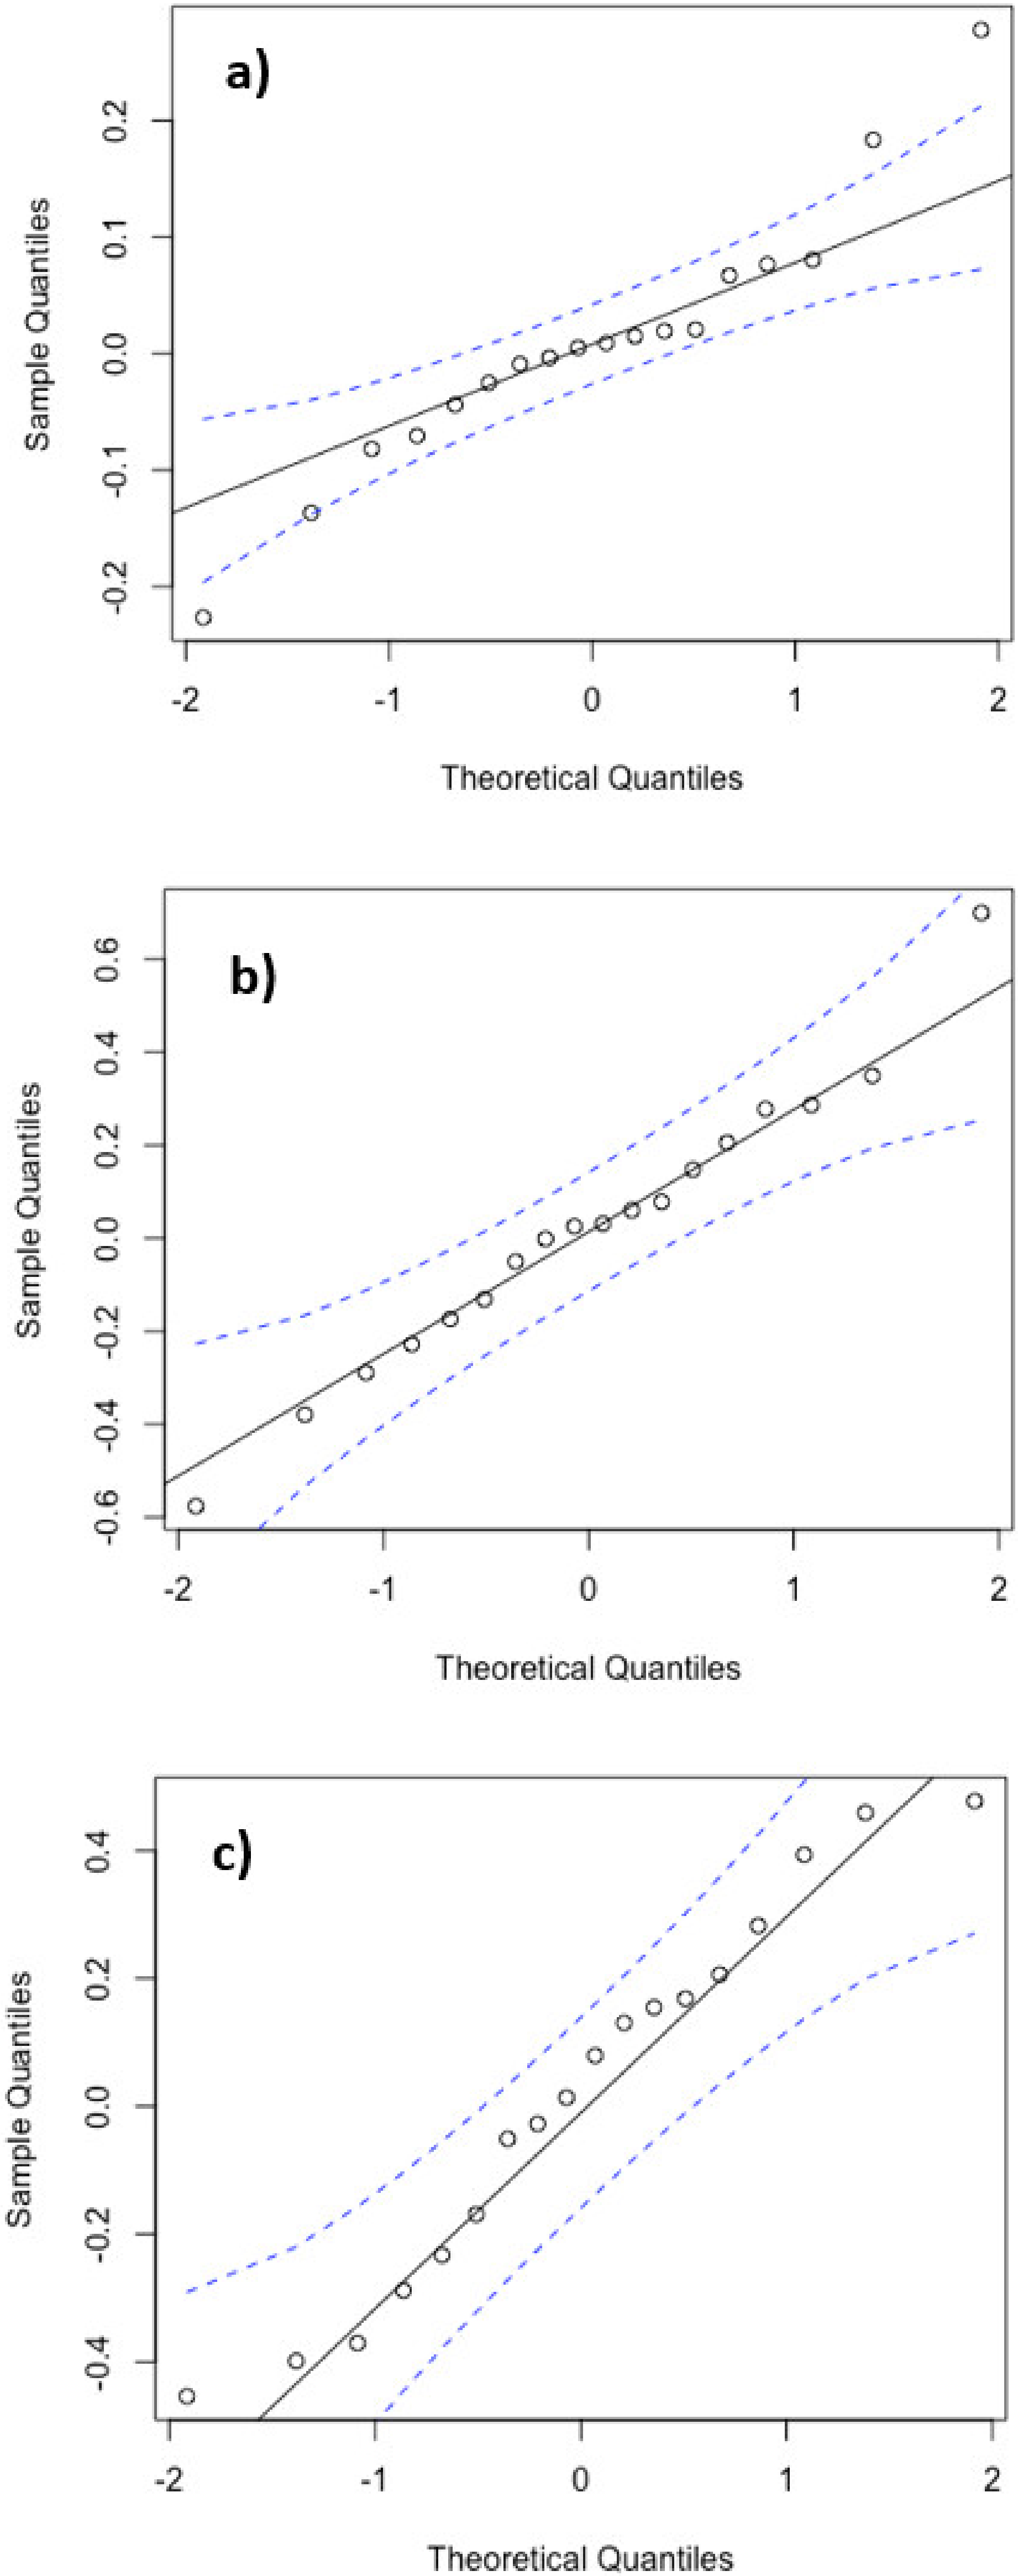
Table A6.
Acetol hydrogenation at different temperatures a.
| Acetol Conversion (%) | 1,-2PD Selectivity (%) | Others Selectivity (%) | k0’ (s-1 gcat−1) | |
|---|---|---|---|---|
| 2% Pd-200 °C | 100.0 | 95.3 | 4.7 | 9.854 × 10⁻⁴ |
| 2% Pd-180 °C | 100.0 | 97.4 | 2.6 | 3.974 × 10⁻⁴ |
| 2% Pd-160 °C | 100.0 | 98.7 | 1.3 | 3.168 × 10⁻⁴ |
a Conditions: 10 wt% aqueous acetol, 500 RPM, 400psi hydrogen pressure, 6 hours reaction time, 5 wt% of catalyst with respect to acetol weight. Catalyst: 2 wt% Pd supported on Cu/MgO/Al2O3, Cu/Mg/Al (molar) = 22.5/67.5/10.
Figure A7.
Concentration of acetol over the reaction time of acetol hyydrogenation at different temperatures.
Figure A7.
Concentration of acetol over the reaction time of acetol hyydrogenation at different temperatures.
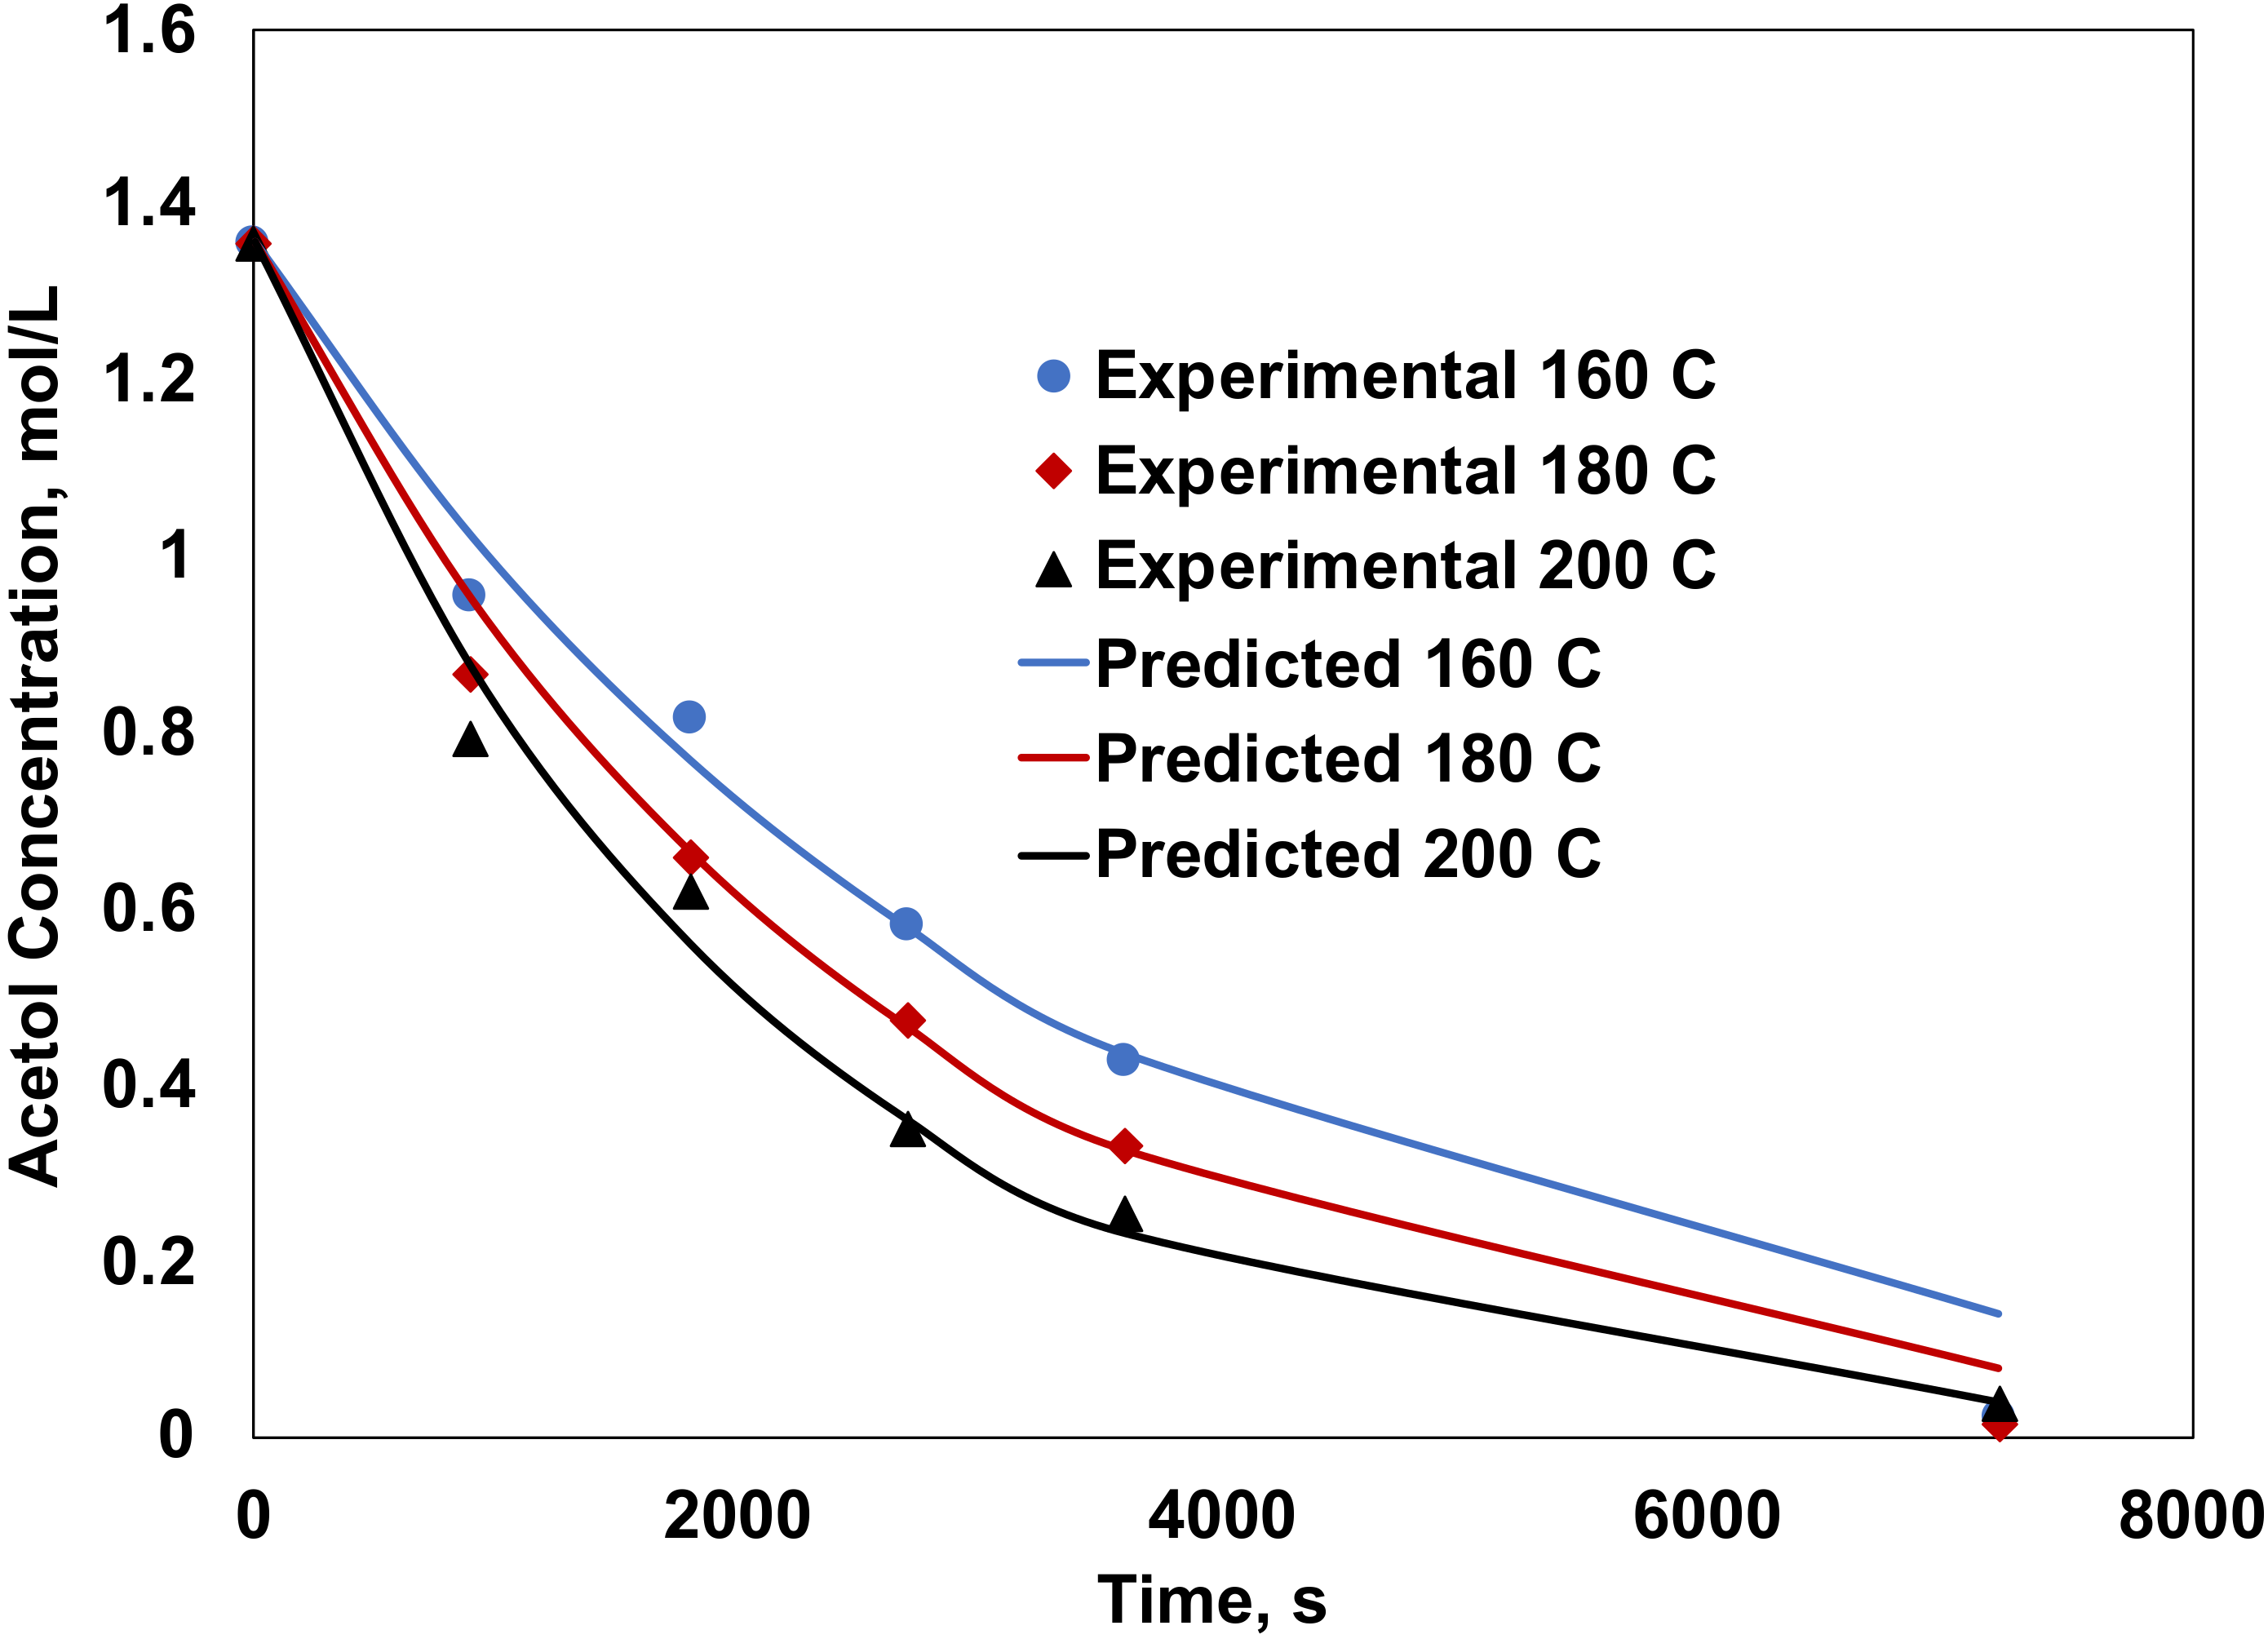
Figure A8.
Residual normal probability plot for the acetol hydrogenation kinetic parameters estimation.
Figure A8.
Residual normal probability plot for the acetol hydrogenation kinetic parameters estimation.

Figure A9.
Arrhenius plot: (a) Glycerol dehydration, (b) Glycerol C-C cleavage, (c) Acetol hydrogenation.
Figure A9.
Arrhenius plot: (a) Glycerol dehydration, (b) Glycerol C-C cleavage, (c) Acetol hydrogenation.
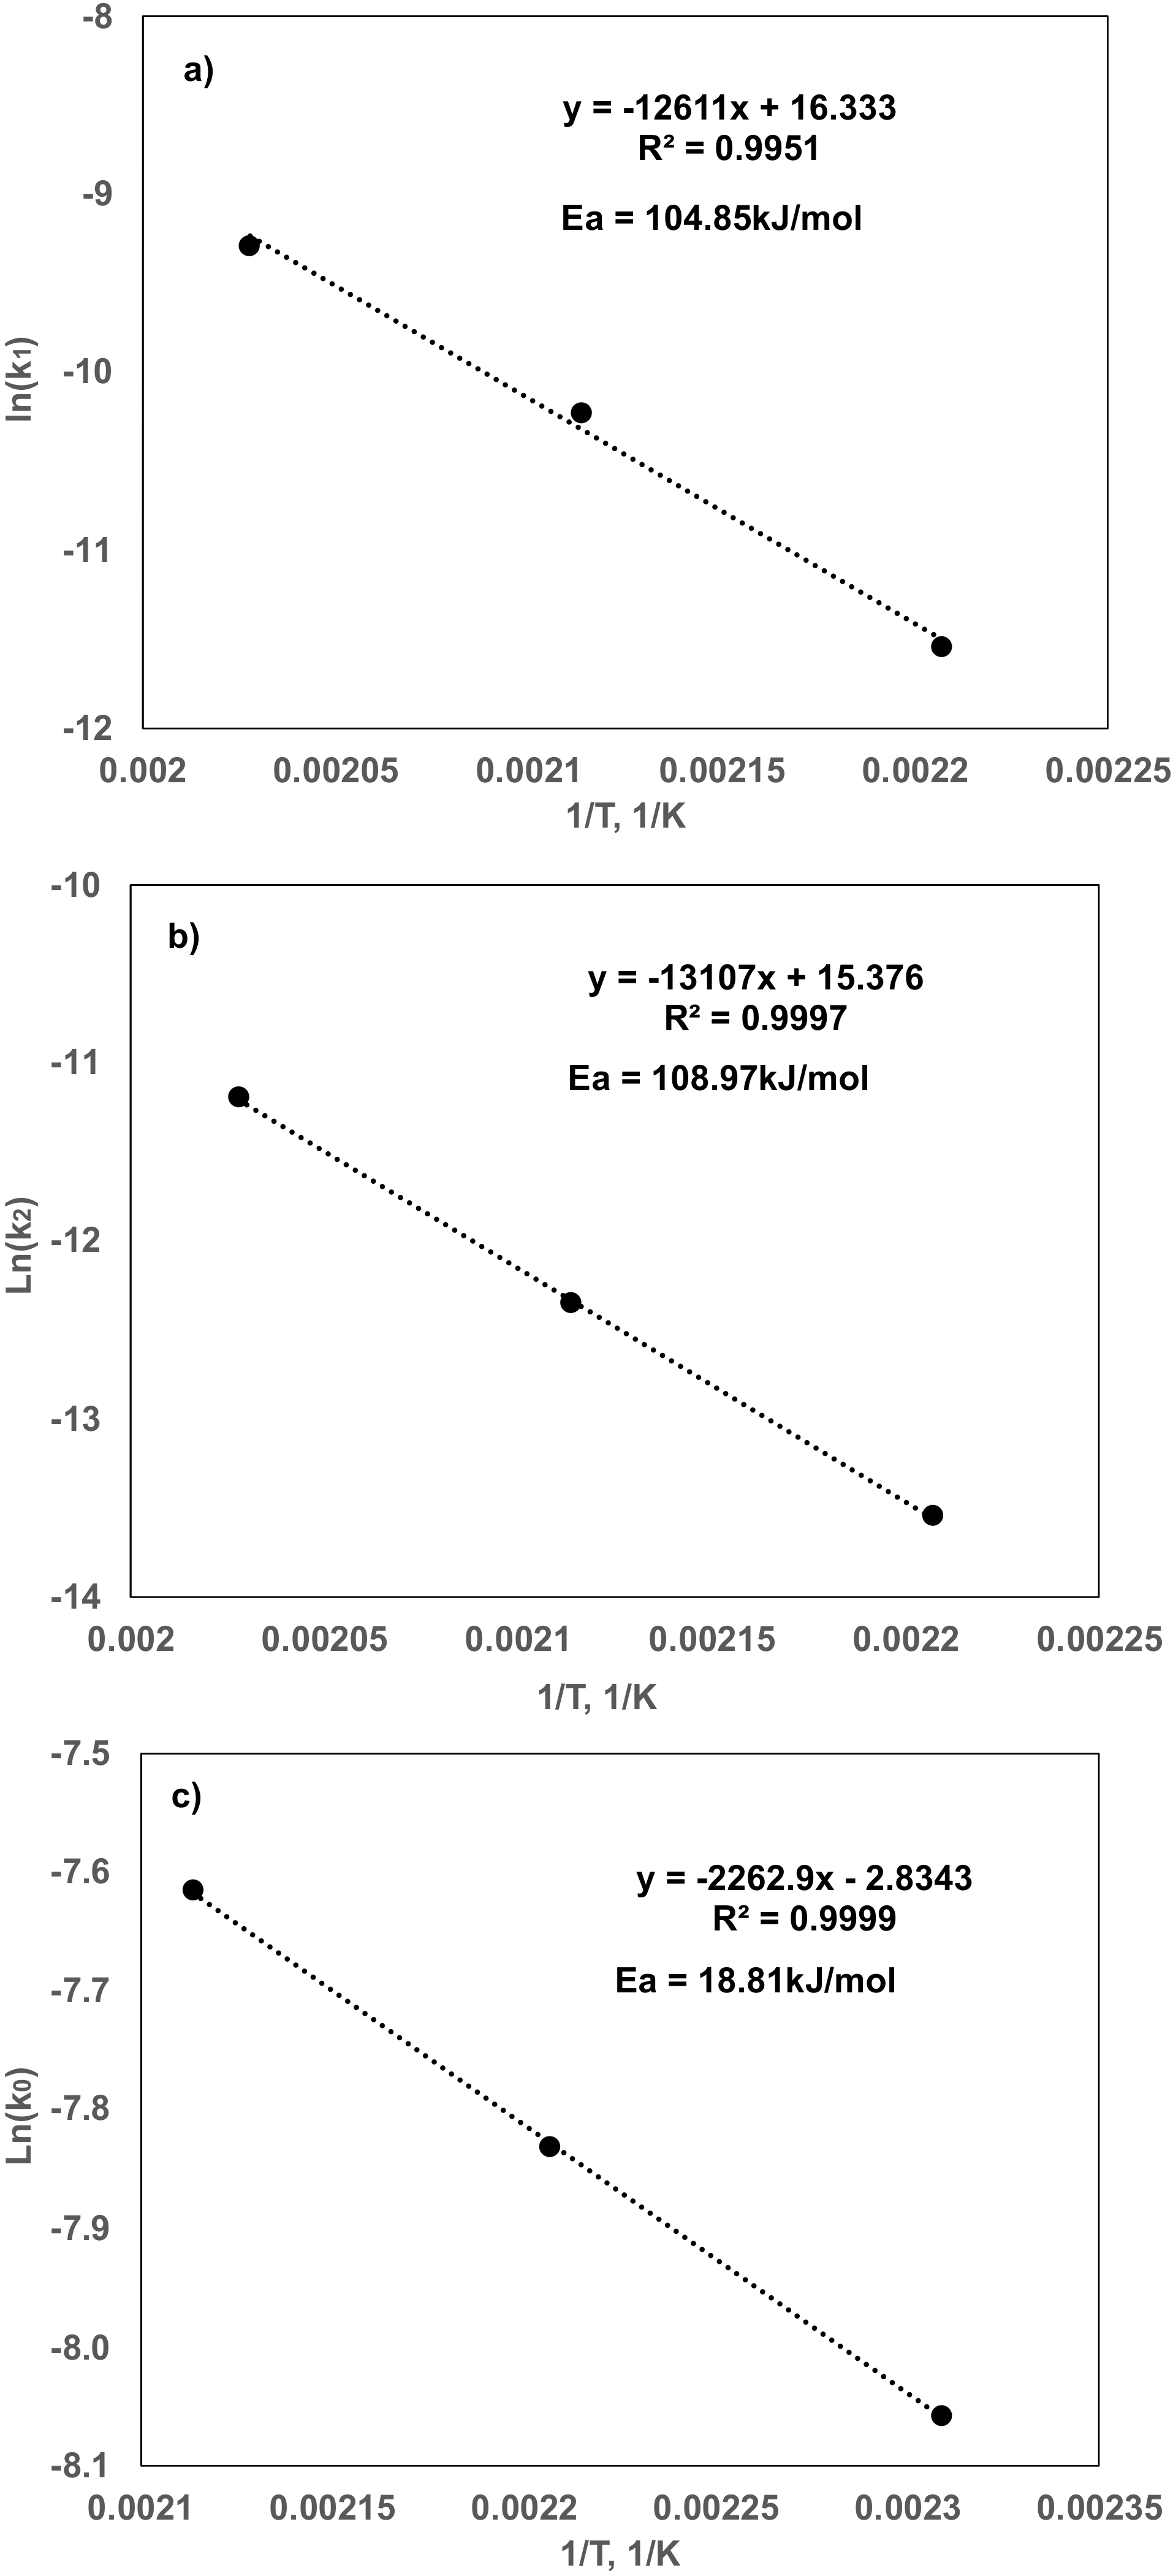
Table A7.
Estimated kinetic parameters.
| Pre-Exponential Factor | Activation Energy kJ/mol | |
|---|---|---|
| Glycerol dehydration | 1.10 × 10⁷ | 104.85 |
| Glycerol C–C cleavage | 5.8 × 10⁶ | 108.97 |
| Acetol Hydrogenation | 0.092 | 18.81 |
The activation energies for glycerol dehydration and EG formation were estimated to be 104.85kJ/mol and 108.97kJ/mol respectively suggesting that these two reactions were highly temperature dependent. The activation energy of acetol hydrogenation was estimated to be 18.81kJ/mol which is significantly lower than glycerol dehydration suggesting that the acetol hydrogenation is less temperature dependent than glycerol dehydration.
References
- Veluturla, S.; Archna, N.; Subba Rao, D.; Hezil, N.; Indraja, I.S.; Spoorthi, S. Catalytic valorization of raw glycerol derived from biodiesel: A review. Biofuels 2018, 9, 305–314. [Google Scholar] [CrossRef]
- Pagliaro, M.; Rossi, M. The Future of Glycerol; The Royal Society of Chemistry: London, UK, 2010; pp. P001–P170. [Google Scholar]
- Liu, Y. Catalytic Glycerol Hydrogenolysis to Produce 1,2-propanediol with Molecular Hydrogen and in situ Hydrogen Produced from Steam Reforming. Ph.D. Thesis, University of Waterloo, Waterloo, ON, Canada, 2014. [Google Scholar]
- Cai, F.; Jin, F.; Hao, J.; Xiao, G. Selective hydrogenolysis of glycerol to 1,2-propanediol on Nb-modified Pd−Zr−Al catalysts. Catal. Commun. 2019, 131, 105801. [Google Scholar] [CrossRef]
- Jiang, T.; Zhou, Y.; Liang, S.; Liu, H.; Han, B. Hydrogenolysis of glycerol catalyzed by Ru-Cu bimetallic catalysts supported on clay with the aid of ionic liquids. Green Chem. 2009, 11, 1000–1006. [Google Scholar] [CrossRef]
- D’Hondt, E.; Van de Vyver, S.; Sels, B.F.; Jacobs, P.A. Catalytic glycerol conversion into 1,2-propanediol in absence of added hydrogen. Chem. Commun. 2008, 45, 6011–6012. [Google Scholar] [CrossRef] [PubMed]
- Liu, S.; Tamura, M.; Shen, Z.; Zhang, Y.; Nakagawa, Y.; Tomishige, K. Hydrogenolysis of glycerol with in-situ produced H2 by aqueous-phase reforming of glycerol using Pt-modified Ir-ReOx/SiO2 catalyst. Catal. Today 2018, 303, 106–116. [Google Scholar] [CrossRef]
- Gandarias, I.; Arias, P.L.; Requies, J.; Güemez, M.B.; Fierro, J.L.G. Hydrogenolysis of glycerol to propanediols over a Pt/ASA catalyst: The role of acid and metal sites on product selectivity and the reaction mechanism. Appl. Catal. B 2010, 97, 248–256. [Google Scholar] [CrossRef]
- Pendem, C.; Gupta, P.; Chaudhary, N.; Singh, S.; Kumar, J.; Sasaki, T.; Datta, A.; Bal, R. Aqueous phase reforming of glycerol to 1,2-propanediol over Pt-nanoparticles supported on hydrotalcite in the absence of hydrogen. Green Chem. 2012, 14, 3107–3113. [Google Scholar] [CrossRef]
- Soares, A.V.; Perez, G.; Passos, F.B. Alumina supported bimetallic Pt–Fe catalysts applied to glycerol hydrogenolysis and aqueous phase reforming. Appl. Catal. B 2016, 185, 77–87. [Google Scholar] [CrossRef]
- Roy, D.; Subramaniam, B.; Chaudhari, R.V. Aqueous phase hydrogenolysis of glycerol to 1,2-propanediol without external hydrogen addition. Catal. Today 2010, 156, 31–37. [Google Scholar] [CrossRef]
- Von Held Soares, A.; Atia, H.; Armbruster, U.; Passos, F.B.; Martin, A. Platinum, palladium and nickel supported on Fe3O4 as catalysts for glycerol aqueous-phase hydrogenolysis and reforming. Appl. Catal. A 2017, 548, 179–190. [Google Scholar] [CrossRef]
- Seretis, A.; Tsiakaras, P. Crude bio-glycerol aqueous phase reforming and hydrogenolysis over commercial SiO2-Al2O3 nickel catalyst. Renewable Energy 2016, 97, 373–379. [Google Scholar] [CrossRef]
- Seretis, A.; Tsiakaras, P. Hydrogenolysis of glycerol to propylene glycol by in situ produced hydrogen from aqueous phase reforming of glycerol over SiO2–Al2O3 supported nickel catalyst. Fuel Process. Technol. 2016, 142, 135–146. [Google Scholar] [CrossRef]
- Yin, A.; Guo, X.; Dai, W.; Fan, K. The synthesis of propylene glycol and ethylene glycol from glycerol using Raney Ni as a versatile catalyst. Green Chem. 2009, 11, 1514–1516. [Google Scholar] [CrossRef]
- Zhou, C.H.; Deng, K.; Serio, M.D.; Xiao, S.; Tong, D.S.; Li, L.; Lin, C.X.; Beltramini, J.; Zhang, H.; Yu, W.H. Cleaner hydrothermal hydrogenolysis of glycerol to 1,2-propanediol over Cu/oxide catalysts without addition of external hydrogen. Mol. Catal. 2017, 432, 274–284. [Google Scholar] [CrossRef]
- Mane, R.B.; Rode, C.V. Simultaneous glycerol dehydration and in situ hydrogenolysis over Cu-Al oxide under an inert atmosphere. Green Chem. 2012, 14, 2780–2789. [Google Scholar] [CrossRef]
- Musolino, M.G.; Scarpino, L.A.; Mauriello, F.; Pietropaolo, R. Selective transfer hydrogenolysis of glycerol promoted by palladium catalysts in absence of hydrogen. Green Chem. 2009, 11, 1511–1513. [Google Scholar] [CrossRef]
- Gandarias, I.; Arias, P.L.; Fernández, S.G.; Requies, J.; El Doukkali, M.; Güemez, M.B. Hydrogenolysis through catalytic transfer hydrogenation: Glycerol conversion to 1,2-propanediol. Catal. Today 2012, 195, 22–31. [Google Scholar] [CrossRef]
- Mauriello, F.; Ariga, H.; Musolino, M.G.; Pietropaolo, R.; Takakusagi, S.; Asakura, K. Exploring the catalytic properties of supported palladium catalysts in the transfer hydrogenolysis of glycerol. Appl. Catal. B 2015, 166–167, 121–131. [Google Scholar] [CrossRef]
- Gandarias, I.; Arias, P.L.; Requies, J.; El Doukkali, M.; Güemez, M.B. Liquid-phase glycerol hydrogenolysis to 1,2-propanediol under nitrogen pressure using 2-propanol as hydrogen source. J. Catal. 2011, 282, 237–247. [Google Scholar] [CrossRef]
- Musolino, M.G.; Scarpino, L.A.; Mauriello, F.; Pietropaolo, R. Glycerol Hydrogenolysis Promoted by Supported Palladium Catalysts. ChemSusChem 2011, 4, 1143–1150. [Google Scholar] [CrossRef]
- Cai, F.; Pan, D.; Ibrahim, J.J.; Zhang, J.; Xiao, G. Hydrogenolysis of glycerol over supported bimetallic Ni/Cu catalysts with and without external hydrogen addition in a fixed-bed flow reactor. Appl. Catal. A 2018, 564, 172–182. [Google Scholar] [CrossRef]
- Xia, S.; Zheng, L.; Wang, L.; Chen, P.; Hou, Z. Hydrogen-free synthesis of 1,2-propanediol from glycerol over Cu-Mg-Al catalysts. RSC Adv. 2013, 3, 16569–16576. [Google Scholar] [CrossRef]
- Vasiliadou, S.E.; Lemonidou, A.A. Catalytic Glycerol Hydrodeoxygenation under Inert Atmosphere: Ethanol as a Hydrogen Donor. Catalysts 2014, 4, 397–413. [Google Scholar] [CrossRef] [Green Version]
- Yuan, J.; Li, S.; Yu, L.; Liu, Y.; Cao, Y. Efficient catalytic hydrogenolysis of glycerol using formic acid as hydrogen source. Chin. J. Catal. 2013, 34, 2066–2074. [Google Scholar] [CrossRef]
- Gandarias, I.; Requies, J.; Arias, P.L.; Armbruster, U.; Martin, A. Liquid-phase glycerol hydrogenolysis by formic acid over Ni–Cu/Al2O3 catalysts. J. Catal. 2012, 290, 79–89. [Google Scholar] [CrossRef]
- Yfanti, V.L.; Lemonidou, A.A. Effect of hydrogen donor on glycerol hydrodeoxygenation to 1,2-propanediol. Catal. Today 2019, 355, 727–736. [Google Scholar] [CrossRef]
- West, A.H.; Posarac, D.; Ellis, N. Assessment of four biodiesel production processes using HYSYS.Plant. Bioresour. Technol. 2008, 99, 6587–6601. [Google Scholar] [CrossRef]
- Andreatta, A.E.; Casás, L.M.; Hegel, P.; Bottini, S.B.; Brignole, E.A. Phase Equilibria in Ternary Mixtures of Methyl Oleate, Glycerol, and Methanol. Ind. Eng. Chem. Res. 2008, 47, 5157–5164. [Google Scholar] [CrossRef]
- Lee, M.; Lo, Y.; Lin, H. Liquid–liquid equilibria for mixtures containing water, methanol, fatty acid methyl esters, and glycerol. Fluid Phase Equilib. 2010, 299, 180–190. [Google Scholar] [CrossRef]
- Liu, Y.; Guo, X.; Rempel, L.G.; Ng, T.T.F. The Promoting Effect of Ni on Glycerol Hydrogenolysis to 1,2-Propanediol with In Situ Hydrogen from Methanol Steam Reforming Using a Cu/ZnO/Al2O3 Catalyst. Catalysts 2019, 9, 412. [Google Scholar] [CrossRef] [Green Version]
- Liu, Y.; Mai, C.T.Q.; Ng, F.T.T. Glycerol Hydrogenolysis with In Situ Hydrogen Produced via Methanol Steam Reforming: The Promoting Effect of Pd on a Cu/ZnO/Al2O3 Catalyst. Catalysts 2021, 11, 110. [Google Scholar] [CrossRef]
- Van Ryneveld, E.; Mahomed, A.S.; van Heerden, P.S.; Friedrich, H.B. Direct Hydrogenolysis of Highly Concentrated Glycerol Solutions Over Supported Ru, Pd and Pt Catalyst Systems. Catal. Lett. 2011, 141, 958–967. [Google Scholar] [CrossRef]
- Vasiliadou, E.S.; Yfanti, V.L.; Lemonidou, A.A. One-pot tandem processing of glycerol stream to 1,2-propanediol with methanol reforming as hydrogen donor reaction. Appl. Catal. B 2015, 163, 258–266. [Google Scholar] [CrossRef]
- Yfanti, V.L.; Vasiliadou, E.S.; Lemonidou, A.A. Glycerol hydro-deoxygenation aided by in situ H2 generation via methanol aqueous phase reforming over a Cu-ZnO-Al2O3 catalyst. Catal Sci. Technol. 2016, 6, 5415–5426. [Google Scholar] [CrossRef]
- Yfanti, V.L.; Ipsakis, D.; Lemonidou, A.A. Kinetic study of liquid phase glycerol hydrodeoxygenation under inert conditions over a Cu-based catalyst. React. Chem. Eng. 2018, 3, 559–571. [Google Scholar] [CrossRef]
- Yfanti, V.L.; Ipsakis, D.; Lemonidou, A.A. Kinetic model of glycerol hydrodeoxygenation under inert conditions over copper catalyst. Mater. Today Proc. 2018, 5, 27482–27490. [Google Scholar] [CrossRef]
- Yfanti, V.L.; Lemonidou, A.A. Mechanistic study of liquid phase glycerol hydrodeoxygenation with in-situ generated hydrogen. J. Catal. 2018, 368, 98–111. [Google Scholar] [CrossRef]
- Yuan, Z.; Wang, L.; Wang, J.; Xia, S.; Chen, P.; Hou, Z.; Zheng, X. Hydrogenolysis of glycerol over homogenously dispersed copper on solid base catalysts. Appl. Catal. B 2011, 101, 431–440. [Google Scholar] [CrossRef]
- Yuan, Z.; Wang, J.; Wang, L.; Xie, W.; Chen, P.; Hou, Z.; Zheng, X. Biodiesel derived glycerol hydrogenolysis to 1,2-propanediol on Cu/MgO catalysts. Bioresour. Technol. 2010, 101, 7088–7092. [Google Scholar] [CrossRef] [PubMed]
- Xia, S.; Nie, R.; Lu, X.; Wang, L.; Chen, P.; Hou, Z. Hydrogenolysis of glycerol over Cu0.4/Zn5.6−xMgxAl2O8.6 catalysts: The role of basicity and hydrogen spillover. J. Catal. 2012, 296, 1–11. [Google Scholar] [CrossRef]
- Xia, S.; Yuan, Z.; Wang, L.; Chen, P.; Hou, Z. Hydrogenolysis of glycerol on bimetallic Pd-Cu/solid-base catalysts prepared via layered double hydroxides precursors. Appl. Catal. A 2011, 403, 173–182. [Google Scholar] [CrossRef]
- Mitta, H.; Devunuri, N.; Sunkari, J.; Mutyala, S.; Balla, P.; Perupogu, V. A highly active dispersed copper oxide phase on calcined Mg9Al2.7-Ga2.3O2 catalysts in glycerol hydrogenolysis. Catal. Today 2020, 375, 204–215. [Google Scholar] [CrossRef]
- Xia, S.; Yuan, Z.; Wang, L.; Chen, P.; Hou, Z. Catalytic production of 1,2-propanediol from glycerol in bio-ethanol solvent. Bioresour. Technol. 2012, 104, 814–817. [Google Scholar] [CrossRef]
- Mallesham, B.; Sudarsanam, P.; Reddy, B.V.S.; Reddy, B.M. Development of cerium promoted copper–magnesium catalysts for biomass valorization: Selective hydrogenolysis of bioglycerol. Appl. Catal. B 2016, 181, 47–57. [Google Scholar] [CrossRef]
- Yue, C.; Zhang, Q.; Gu, L.; Su, Y.; Zhu, S. Oxides-modified Raney copper as catalysts for selective hydrogenolysis of glycerol. Asia-Pac. J. Chem. Eng. 2014, 9, 581–590. [Google Scholar] [CrossRef]
- Rekha, V.; Raju, N.; Sumana, C.; Douglas, S.P.; Lingaiah, N. Selective Hydrogenolysis of Glycerol Over Cu–ZrO2–MgO Catalysts. Catal. Lett. 2016, 146, 1487–1496. [Google Scholar] [CrossRef]
- Pudi, S.M.; Biswas, P.; Kumar, S. Selective hydrogenolysis of glycerol to 1,2-propanediol over highly active copper–magnesia catalysts: Reaction parameter, catalyst stability and mechanism study. J. Chem. Technol. Biotechnol. 2016, 91, 2063–2075. [Google Scholar] [CrossRef]
- Hou, X.; Qing, S.; Liu, Y.; Li, L.; Gao, Z.; Qin, Y. Enhancing effect of MgO modification of Cu–Al spinel oxide catalyst for methanol steam reforming. Int. J. Hydrogen Energy 2020, 45, 477–489. [Google Scholar] [CrossRef]
- Phongboonchoo, Y.; Thouchprasitchai, N.; Pongstabodee, S. Hydrogen production with a low carbon monoxide content via methanol steam reforming over CuxCeyMgz/Al2O3 catalysts: Optimization and stability. Int. J. Hydrogen Energy 2017, 42, 12220–12235. [Google Scholar] [CrossRef]
- Kim, N.D.; Park, J.R.; Park, D.S.; Kwak, B.K.; Yi, J. Promoter effect of Pd in CuCr2O4 catalysts on the hydrogenolysis of glycerol to 1,2-propanediol. Green Chem. 2012, 14, 2638–2646. [Google Scholar] [CrossRef]
- Hu, B.; Yin, Y.; Liu, G.; Chen, S.; Hong, X.; Tsang, S.C.E. Hydrogen spillover enabled active Cu sites for methanol synthesis from CO2 hydrogenation over Pd doped CuZn catalysts. J. Catal. 2018, 359, 17–26. [Google Scholar] [CrossRef]
- Liu, Y.; He, Y.; Zhou, D.; Feng, J.; Li, D. Catalytic performance of Pd-promoted Cu hydrotalcite-derived catalysts in partial hydrogenation of acetylene: Effect of Pd-Cu alloy formation. Catal. Sci. Technol. 2016, 6, 3027–3037. [Google Scholar] [CrossRef]
- Feng, Y.; Liu, C.; Kang, Y.; Zhou, X.; Liu, L.; Deng, J.; Xu, H.; Fu, Y. Selective hydrogenolysis of glycerol to 1,2-propanediol catalyzed by supported bimetallic PdCu-KF/γ-Al2O3. Chem. Eng. J. 2015, 281, 96–101. [Google Scholar] [CrossRef]
- Bichon, P.; Asheim, M.; Sperle, A.J.T.; Fathi, M.; Holmen, A.; Blekkan, E.A. Hydrogen from methanol steam-reforming over Cu-based catalysts with and without Pd promotion. Int. J. Hydrogen Energy 2007, 32, 1799–1805. [Google Scholar] [CrossRef]
- Sá, S.; Silva, H.; Brandão, L.; Sousa, J.M.; Mendes, A. Catalysts for methanol steam reforming—A review. Appl. Catal. B 2010, 99, 43–57. [Google Scholar] [CrossRef]
- Wang, Y.; Zhou, J.; Guo, X. Catalytic hydrogenolysis of glycerol to propanediols: A review. RSC Adv. 2015, 5, 74611–74628. [Google Scholar] [CrossRef]
- Sun, D.; Yamada, Y.; Sato, S.; Ueda, W. Glycerol hydrogenolysis into useful C3 chemicals. Appl. Catal. B 2016, 193, 75–92. [Google Scholar] [CrossRef] [Green Version]
- Feng, Y.; Yin, H.; Wang, A.; Shen, L.; Yu, L.; Jiang, T. Gas phase hydrogenolysis of glycerol catalyzed by Cu/ZnO/MOx (MOx=Al2O3, TiO2, and ZrO2) catalysts. Chem. Eng. J. 2011, 168, 403–412. [Google Scholar] [CrossRef]
- Matter, P.H.; Ozkan, U.S. Effect of pretreatment conditions on Cu/Zn/Zr-based catalysts for the steam reforming of methanol to H2. J. Catal. 2005, 234, 463–475. [Google Scholar] [CrossRef]
- Lindström, B.; Pettersson, L.J.; Menon, P.G. Activity and characterization of Cu/Zn, Cu/Cr and Cu/Zr on γ-alumina for methanol reforming for fuel cell vehicles. Appl. Catal. A 2002, 234, 111–125. [Google Scholar] [CrossRef]
- Cai, F.; Zhu, W.; Xiao, G. Promoting effect of zirconium oxide on Cu-Al2O3 catalyst for the hydrogenolysis of glycerol to 1,2-propanediol. Catal. Sci. Technol. 2016, 6, 4889–4900. [Google Scholar] [CrossRef]
- Yazdani, P.; Wang, B.; Du, Y.; Kawi, S.; Borgna, A. Lanthanum oxycarbonate modified Cu/Al2O3 catalysts for selective hydrogenolysis of glucose to propylene glycol: Base site requirements. Catal. Sci. Technol. 2017, 7, 4680–4690. [Google Scholar] [CrossRef]
- Khani, Y.; Bahadoran, F.; Soltanali, S.; Ahari, J.S. Hydrogen production by methanol steam reforming on a cordierite monolith reactor coated with Cu-Ni/LaZnAlO4 and Cu-Ni/γ -Al2O3 catalysts. Res. Chem. Intermed. 2018, 44, 925–942. [Google Scholar] [CrossRef]
- Chiu, C.; Dasari, M.A.; Suppes, G.J.; Sutterlin, W.R. Dehydration of glycerol to acetol via catalytic reactive distillation. AIChE J. 2006, 52, 3543–3548. [Google Scholar] [CrossRef]
- Pala Rosas, I.; Contreras, J.L.; Salmones, J.; Tapia, C.; Zeifert, B.; Navarrete, J.; Vázquez, T.; García, D.C. Catalytic Dehydration of Glycerol to Acrolein over a Catalyst of Pd/LaY Zeolite and Comparison with the Chemical Equilibrium. Catalysts 2017, 7, 73. [Google Scholar] [CrossRef]
- Bienholz, A.; Blume, R.; Knop-Gericke, A.; Girgsdies, F.; Behrens, M.; Claus, P. Prevention of Catalyst Deactivation in the Hydrogenolysis of Glycerol by Ga2O3-Modified Copper/Zinc Oxide Catalysts. J. Phys. Chem. C 2011, 115, 999–1005. [Google Scholar] [CrossRef]
- Mondal, S.; Janardhan, R.; Meena, M.L.; Biswas, P. Highly active Cu-Zn-Mg-Al-O catalyst derived from layered double hydroxides (LDHs) precursor for selective hydrogenolysis of glycerol to 1,2-propanediol. J. Environ. Chem. Eng. 2017, 5, 5695–5706. [Google Scholar] [CrossRef]
- Iwasa, N.; Mayanagi, T.; Nomura, W.; Arai, M.; Takezawa, N. Effect of Zn addition to supported Pd catalysts in the steam reforming of methanol. Appl. Catal. A 2003, 248, 153–160. [Google Scholar] [CrossRef]
- Kyriakou, G.; Boucher, M.B.; Jewell, A.D.; Lewis, E.A.; Lawton, T.J.; Baber, A.E.; Tierney, H.L.; Flytzani-Stephanopoulos, M.; Sykes, E.C. Isolated Metal Atom Geometries as a Strategy for Selective Heterogeneous Hydrogenations. Science 2012, 335, 1209–1212. [Google Scholar] [CrossRef] [PubMed]
- Rehman, S.; Mumtaz, A.; Hasanain, S.K. Size effects on the magnetic and optical properties of CuO nanoparticles. J. Nanopart. Res. 2011, 13, 2497–2507. [Google Scholar] [CrossRef]
- Ma, L.; Lv, C.; Wang, G. A DFT study and micro-kinetic analysis of acetylene selective hydrogenation on Pd-doped Cu(111) surfaces. Appl. Surf. Sci. 2017, 410, 154–165. [Google Scholar] [CrossRef]
- Tierney, H.L.; Baber, A.E.; Kitchin, J.R.; Sykes, E.C. Hydrogen Dissociation and Spillover on Individual Isolated Palladium Atoms. Phys. Rev. Lett. 2009, 103, 246102. [Google Scholar] [CrossRef] [PubMed]
- Liu, Y.; Pasupulety, N.; Gunda, K.; Rempel, G.L.; Ng, F.T. Glycerol Hydrogenolysis to 1,2-Propanediol by Cu/ZnO/Al2O3 Catalysts. Top. Catal. 2014, 57, 1454–1462. [Google Scholar] [CrossRef]
- Boucher, M.B.; Zugic, B.; Cladaras, G.; Kammert, J.; Marcinkowski, M.D.; Lawton, T.J.; Sykes, E.C.; Flytzani-Stephanopoulos, M. Single atom alloy surface analogs in Pd0.18Cu15 nanoparticles for selective hydrogenation reactions. Phys. Chem. Chem. Phys. 2013, 15, 12187–12196. [Google Scholar] [CrossRef]
- Montgomery, D.C.; Runger, G.C. Design of Experiments with Several Factors. In Applied Statistics and Probability for Engineers; John Wiley & Sons Inc.: Hoboken, NJ, USA, 2002; p. 549. [Google Scholar]
Figure 1.
TPR profiles for the calcined catalysts: (a) Cu/MgO/Al2O3; (b) 2Pd/Cu/MgO/Al2O3. Cu/Mg/Al (molar) = 22.5/67.5/10.
Figure 1.
TPR profiles for the calcined catalysts: (a) Cu/MgO/Al2O3; (b) 2Pd/Cu/MgO/Al2O3. Cu/Mg/Al (molar) = 22.5/67.5/10.

Figure 2.
XRD patterns of calcined catalysts: (a) Cu/ZnO/Al2O3: Cu/Zn/Al (molar) = 35/35/30; (b) Cu/MgO/Al2O3; (c) 2Pd/CuO/MgO/Al2O3. Cu/Mg/Al (molar) = 22.5/67.5/10 for both b) and c).
Figure 2.
XRD patterns of calcined catalysts: (a) Cu/ZnO/Al2O3: Cu/Zn/Al (molar) = 35/35/30; (b) Cu/MgO/Al2O3; (c) 2Pd/CuO/MgO/Al2O3. Cu/Mg/Al (molar) = 22.5/67.5/10 for both b) and c).
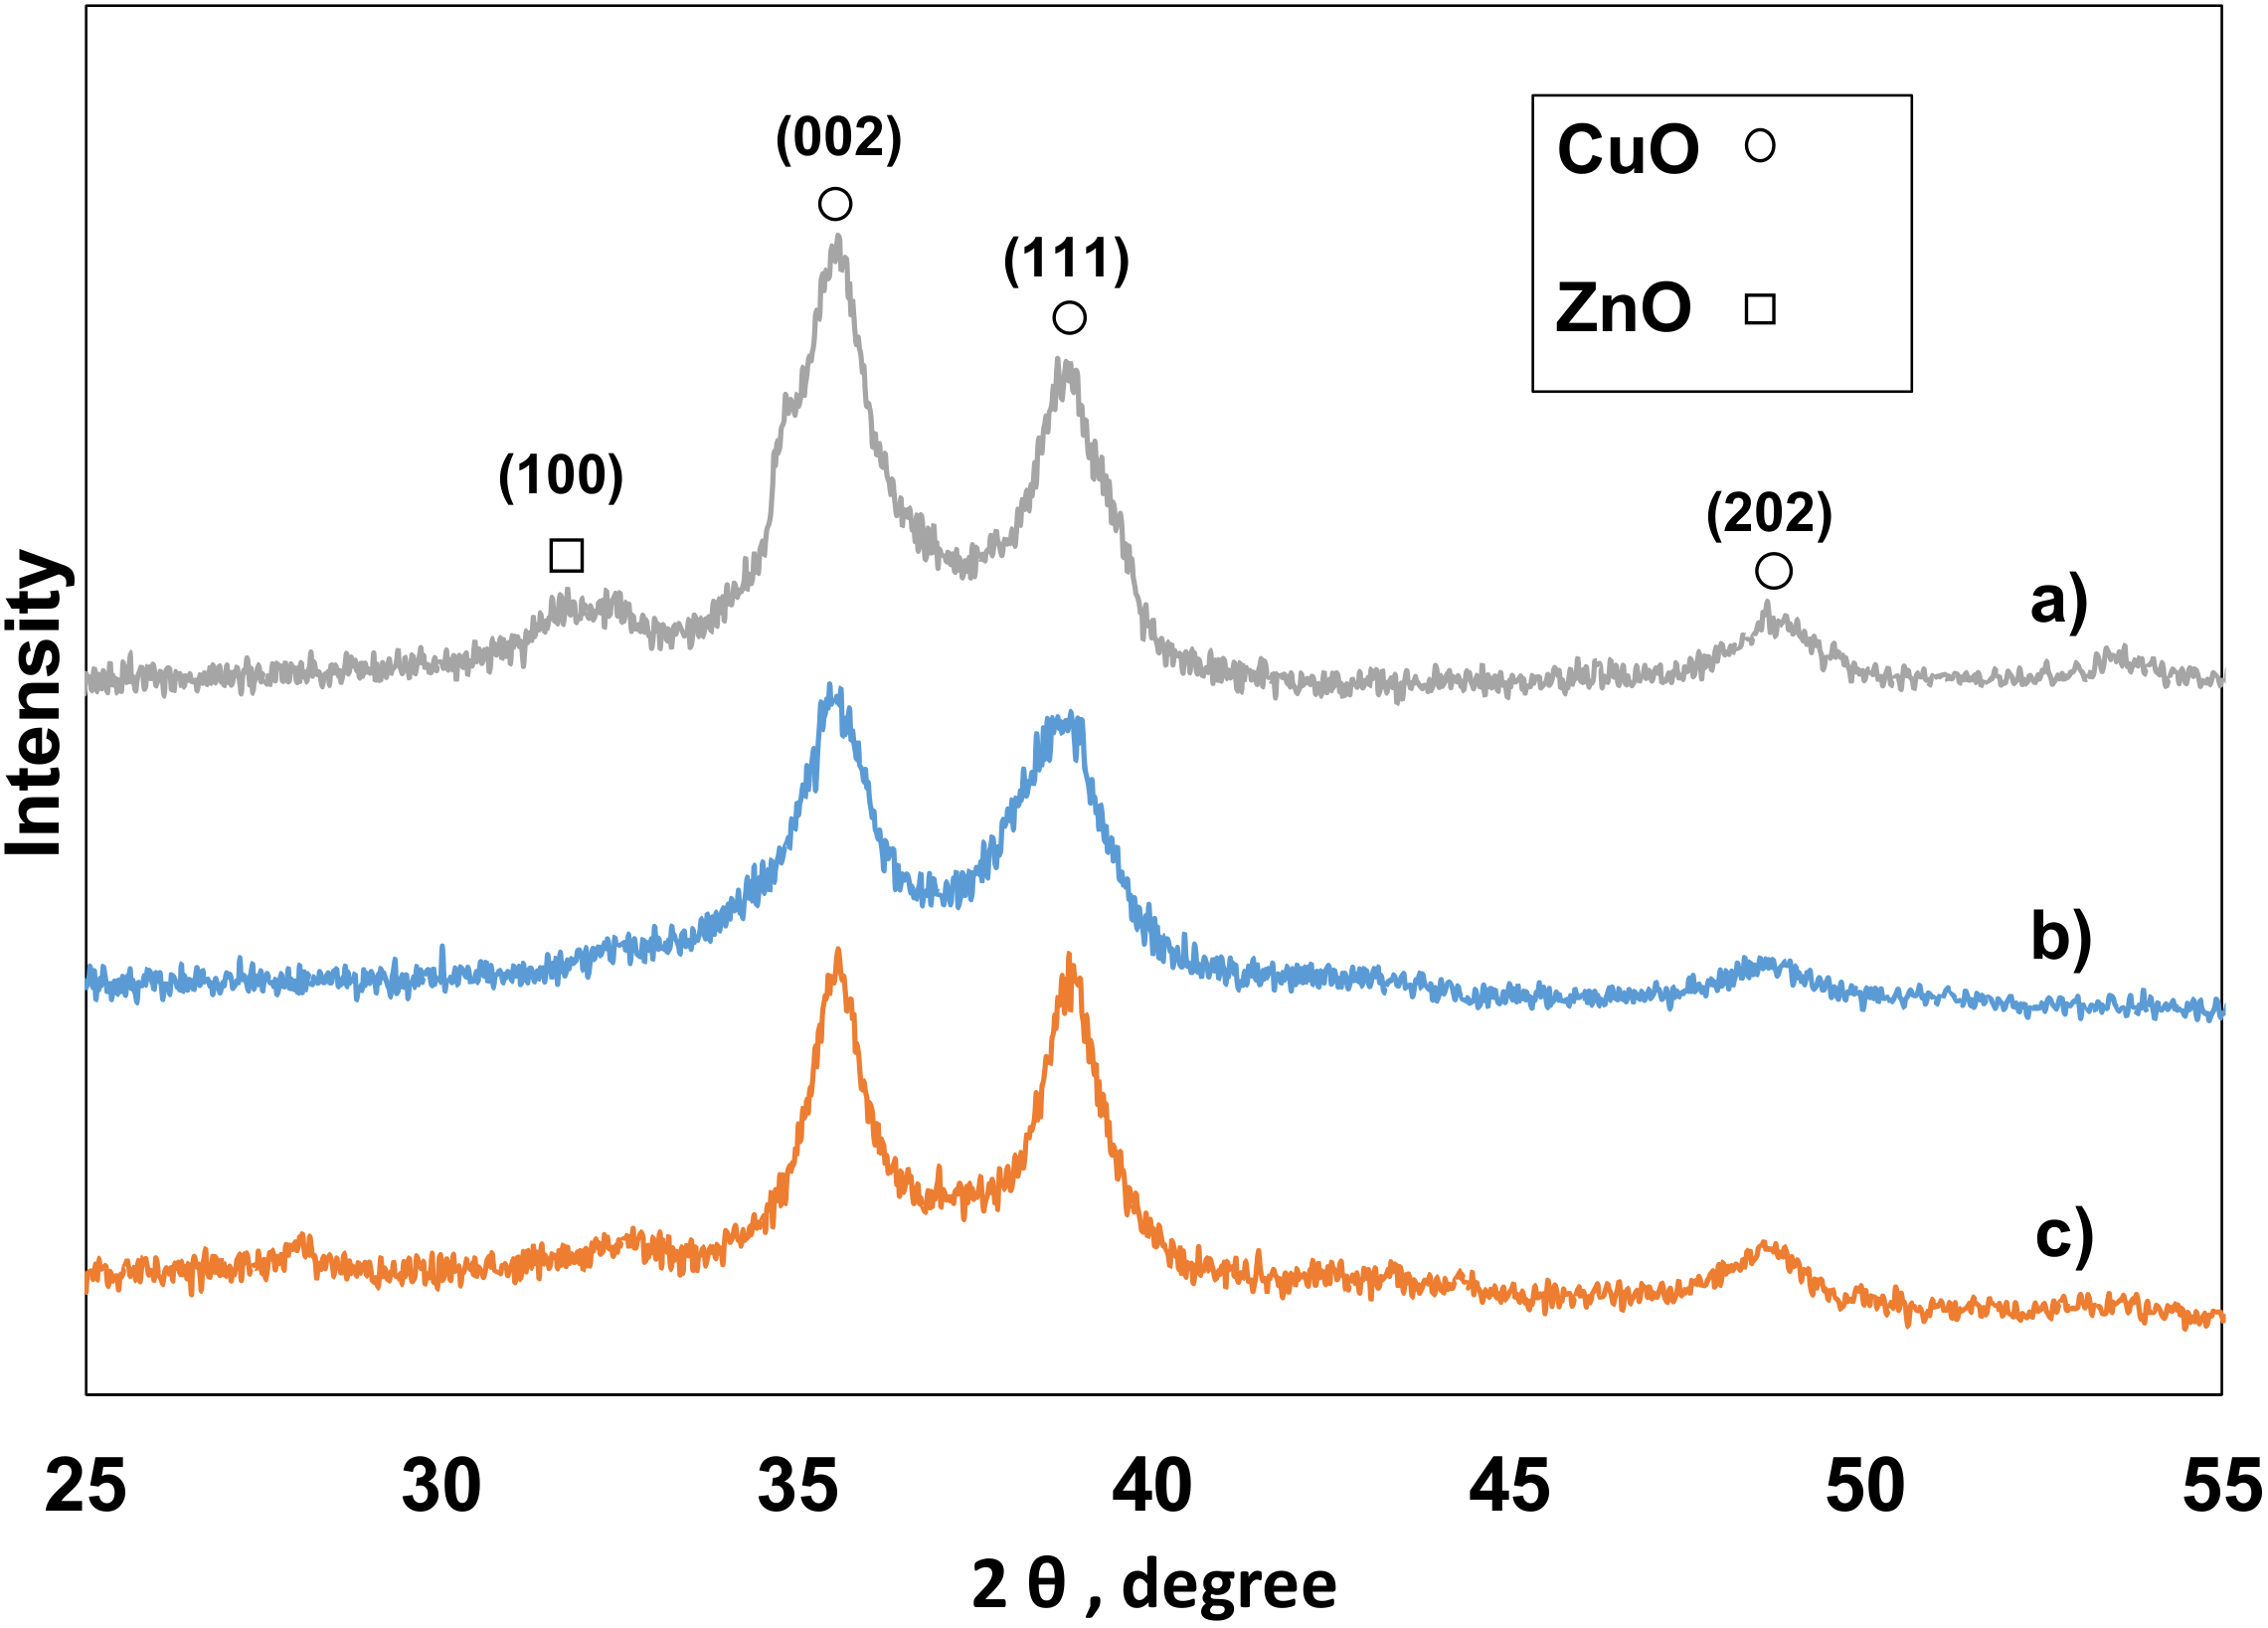
Figure 3.
(a) TEM image of a calcined Cu/MgO/Al2O3 catalyst; (b) Histograms of the particle size distribution determined from TEM image of a calcined Cu/MgO/Al2O3 catalyst. Cu/Mg/Al (molar) = 22.5/67.5/10.
Figure 3.
(a) TEM image of a calcined Cu/MgO/Al2O3 catalyst; (b) Histograms of the particle size distribution determined from TEM image of a calcined Cu/MgO/Al2O3 catalyst. Cu/Mg/Al (molar) = 22.5/67.5/10.

Scheme 1.
Reaction pathway of glycerol hydrogenolysis.
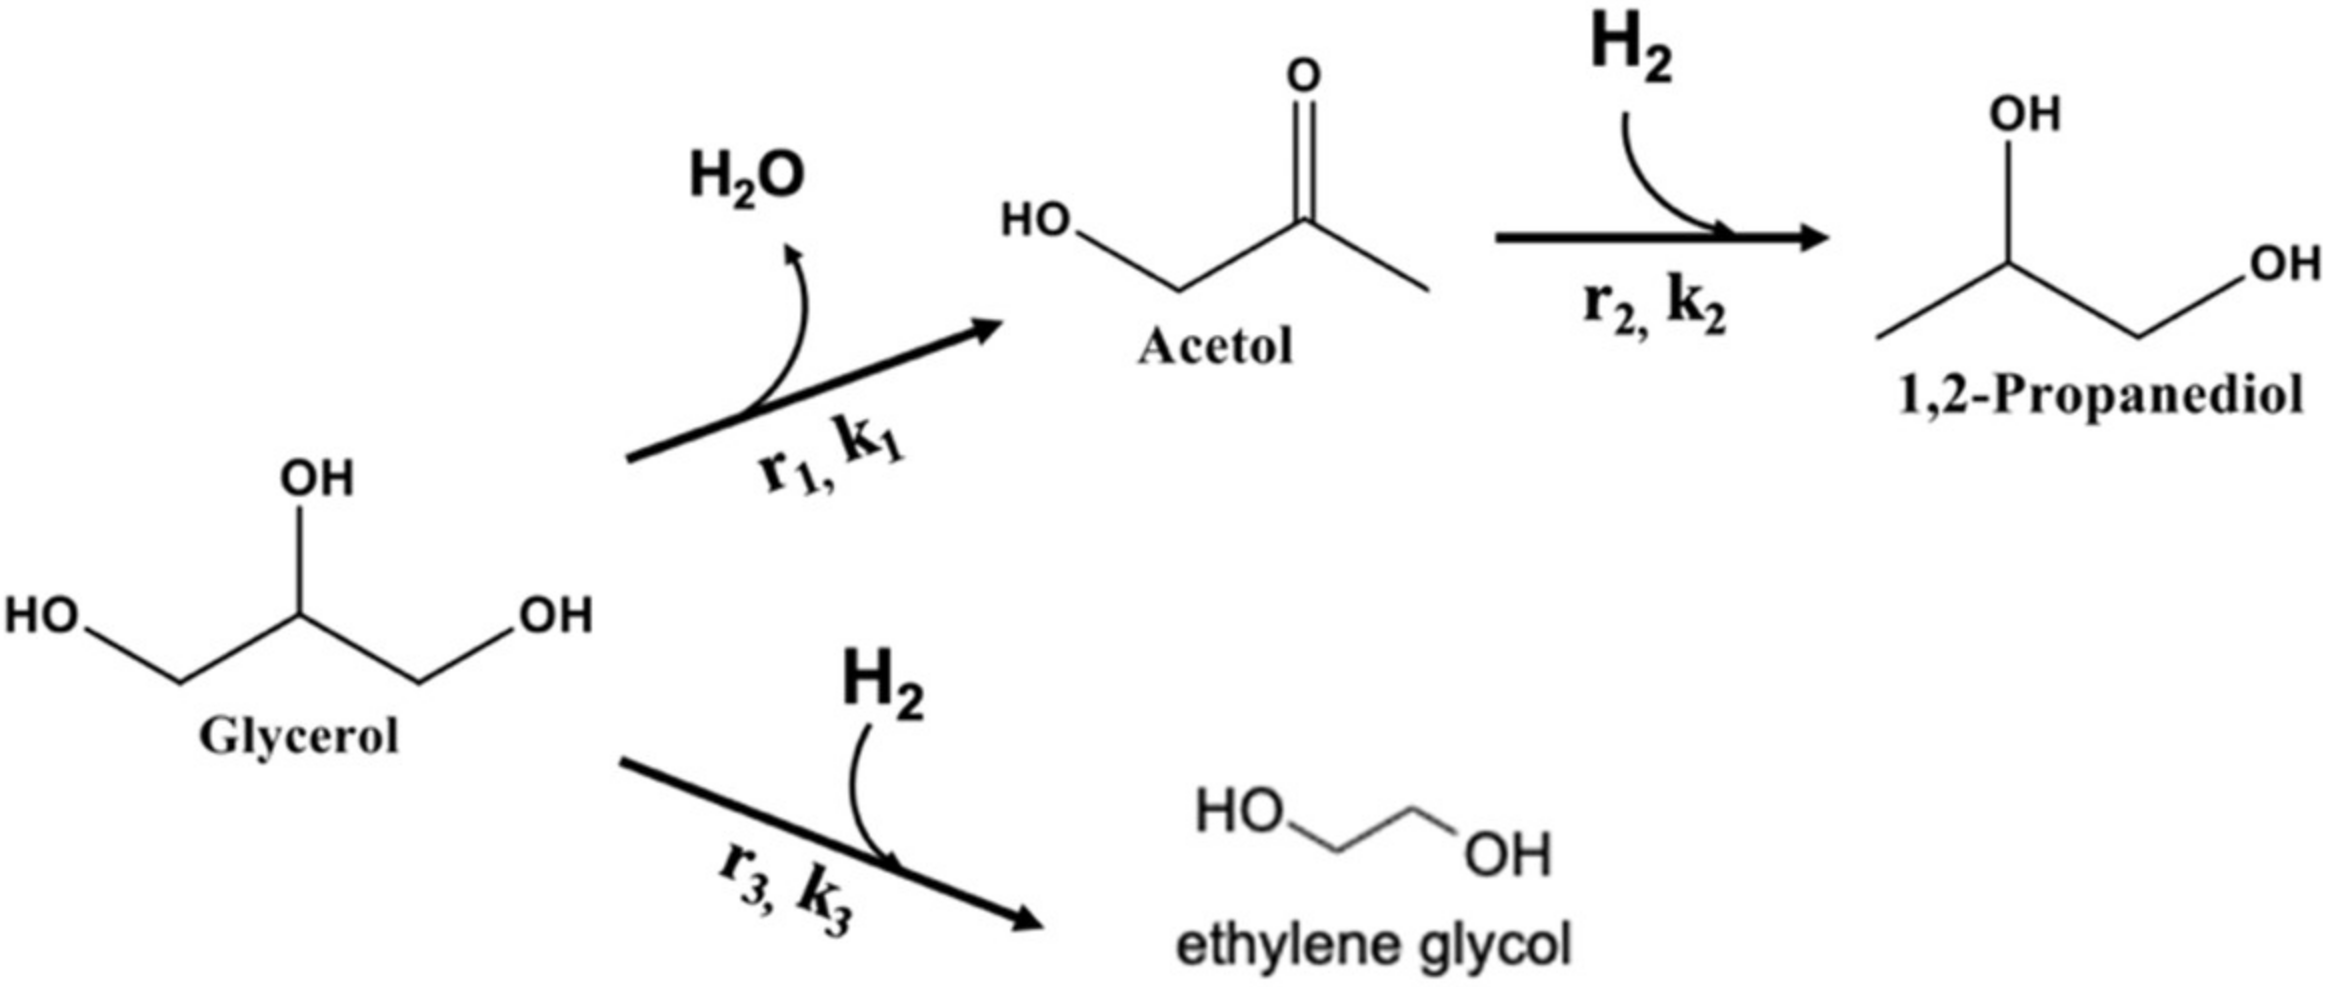
Figure 4.
The concentration of different components over the reaction time: (a) glycerol, (b) EG, (c) 1,2-PD, (d) acetol. Conditions: 220 °C, 15 bar N2, 20 wt% Glycerol, Water/Methanol(molar) = 1.2, 3 wt% catalyst, 500RPM. Error margin: 95% confidence interval.
Figure 4.
The concentration of different components over the reaction time: (a) glycerol, (b) EG, (c) 1,2-PD, (d) acetol. Conditions: 220 °C, 15 bar N2, 20 wt% Glycerol, Water/Methanol(molar) = 1.2, 3 wt% catalyst, 500RPM. Error margin: 95% confidence interval.
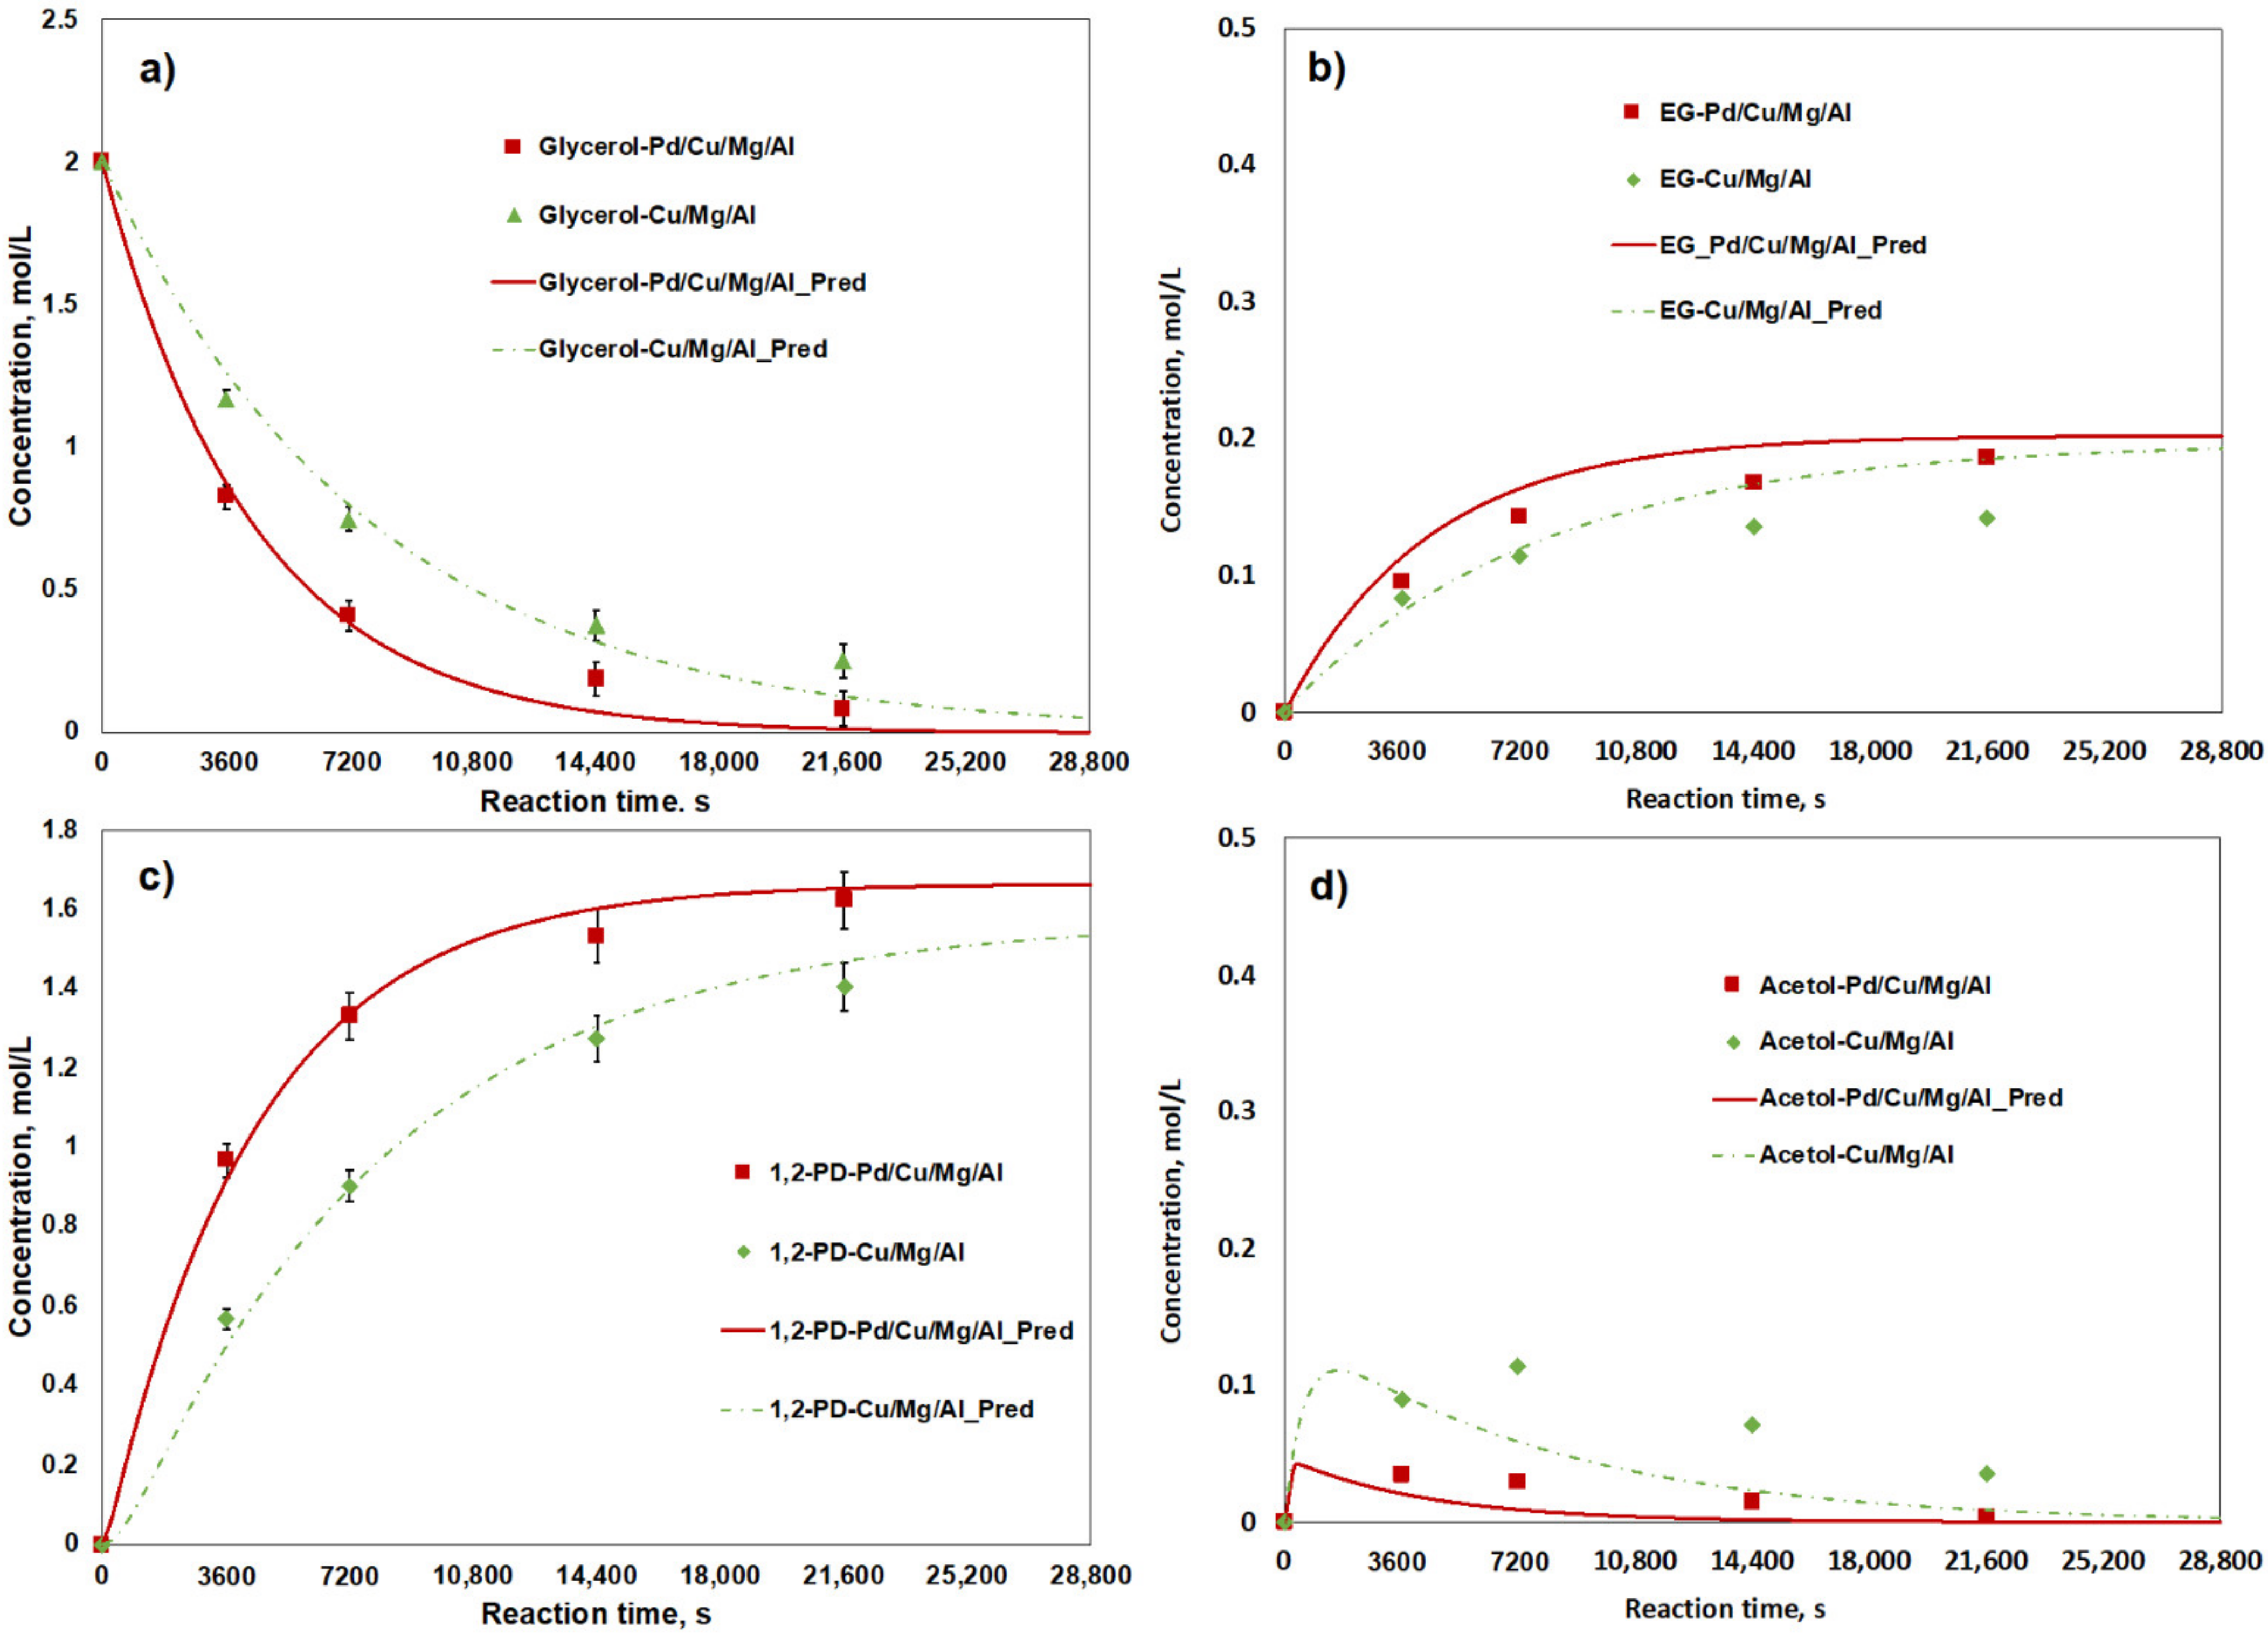
Figure 5.
Effect of Pd loading over the reaction time on acetol yield. Conditions: 220 °C, 15 bar N2, 40 wt% glycerol, water/methanol (molar) = 1.2, 7 wt% catalyst, 500RPM, 8 h, Cu/Mg/Al (molar) = 22.5/67.5/10, 40 wt% glycerol.
Figure 5.
Effect of Pd loading over the reaction time on acetol yield. Conditions: 220 °C, 15 bar N2, 40 wt% glycerol, water/methanol (molar) = 1.2, 7 wt% catalyst, 500RPM, 8 h, Cu/Mg/Al (molar) = 22.5/67.5/10, 40 wt% glycerol.
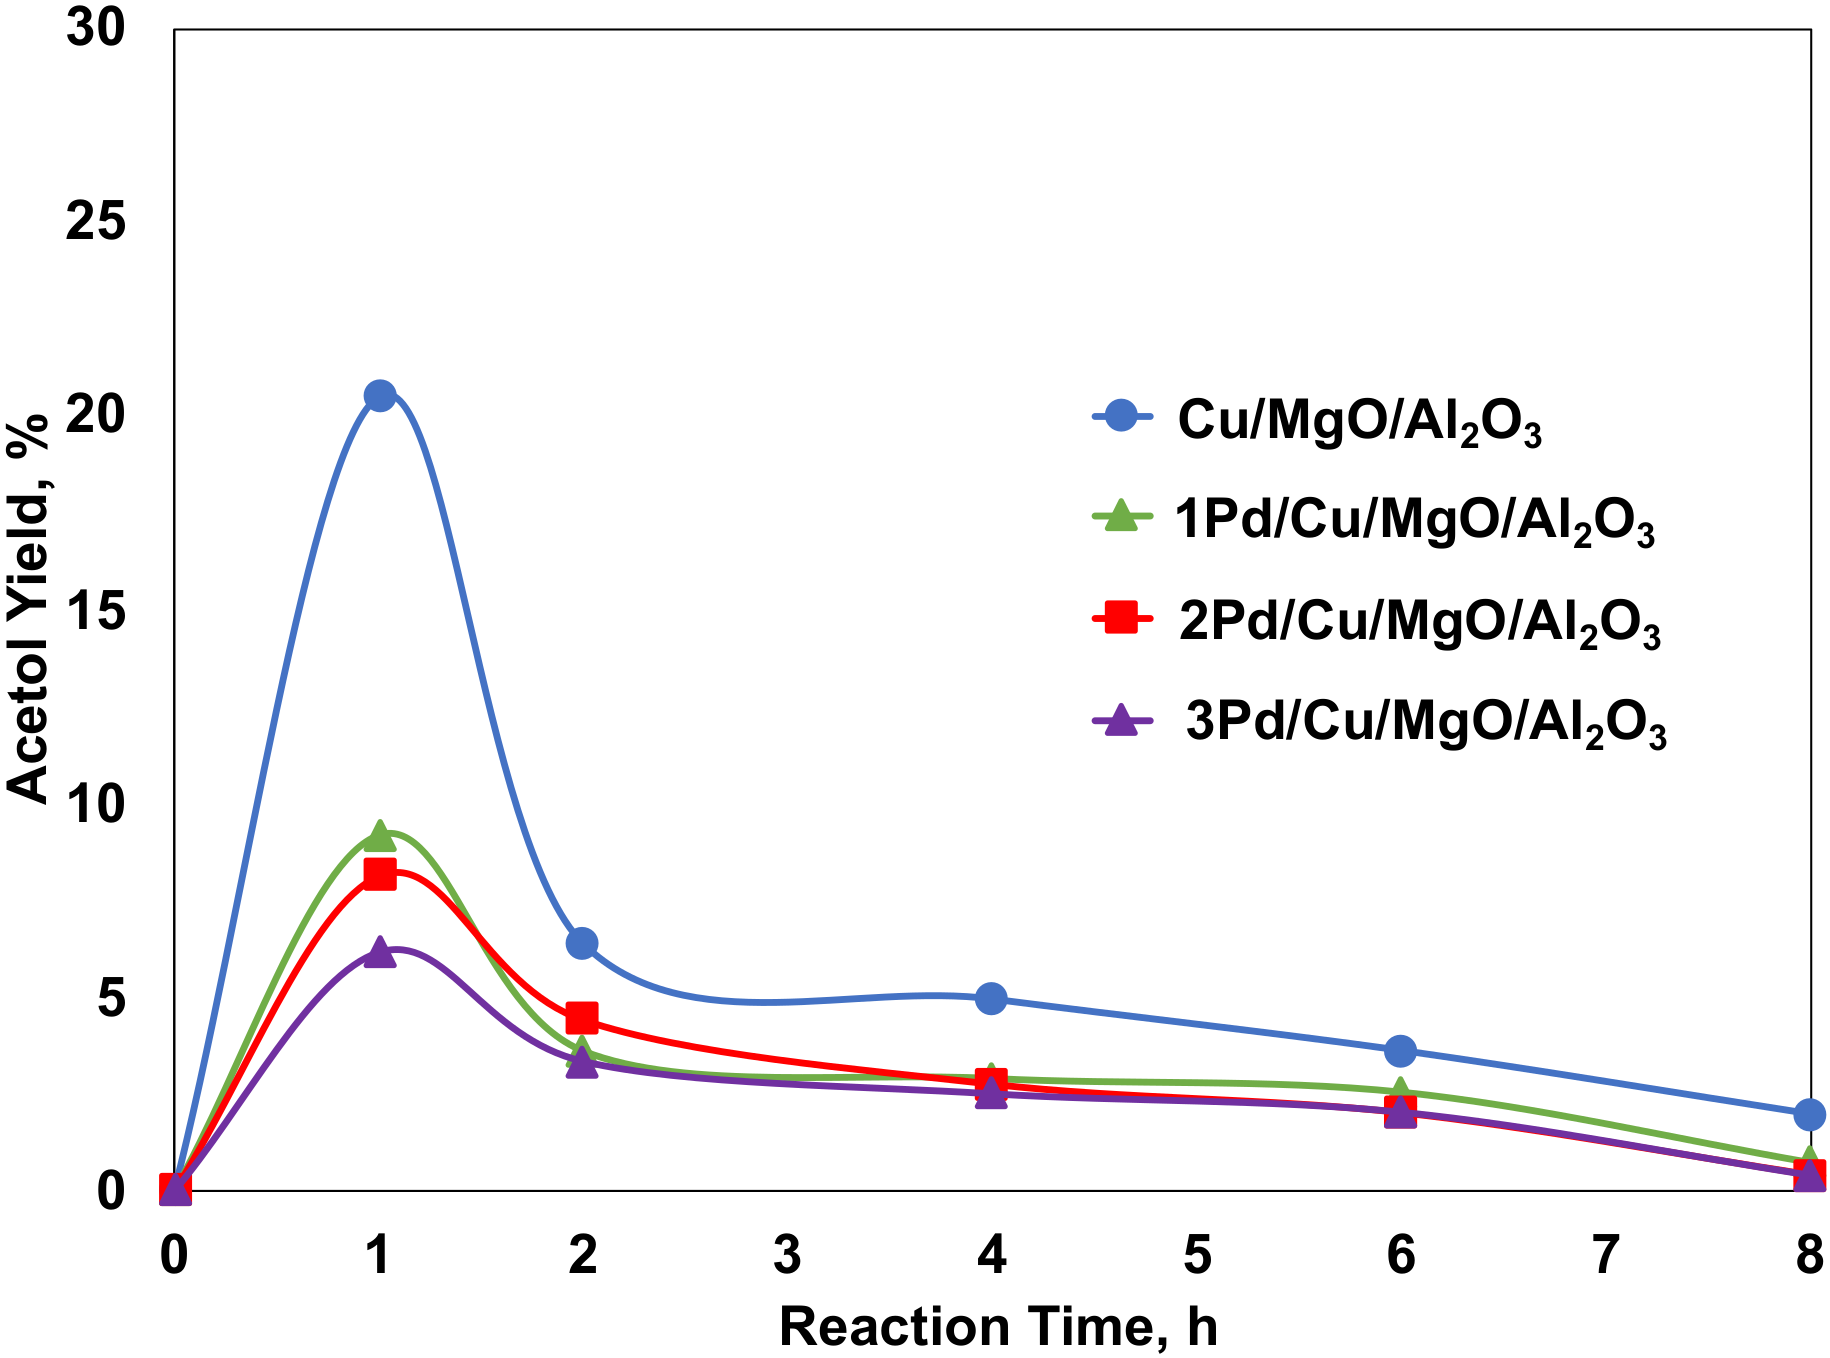
Figure 6.
Effect of Pd on acetol hydrogenation over the reaction time. Reaction conditions: 10 wt% aqueous acetol, 200 °C, 500 RPM, 6 h reaction time, 400 psi hydrogen pressure, 5 wt% of the catalyst with respect to acetol weight. Cu/Mg/Al (molar) = 22.5/67.5/10.
Figure 6.
Effect of Pd on acetol hydrogenation over the reaction time. Reaction conditions: 10 wt% aqueous acetol, 200 °C, 500 RPM, 6 h reaction time, 400 psi hydrogen pressure, 5 wt% of the catalyst with respect to acetol weight. Cu/Mg/Al (molar) = 22.5/67.5/10.
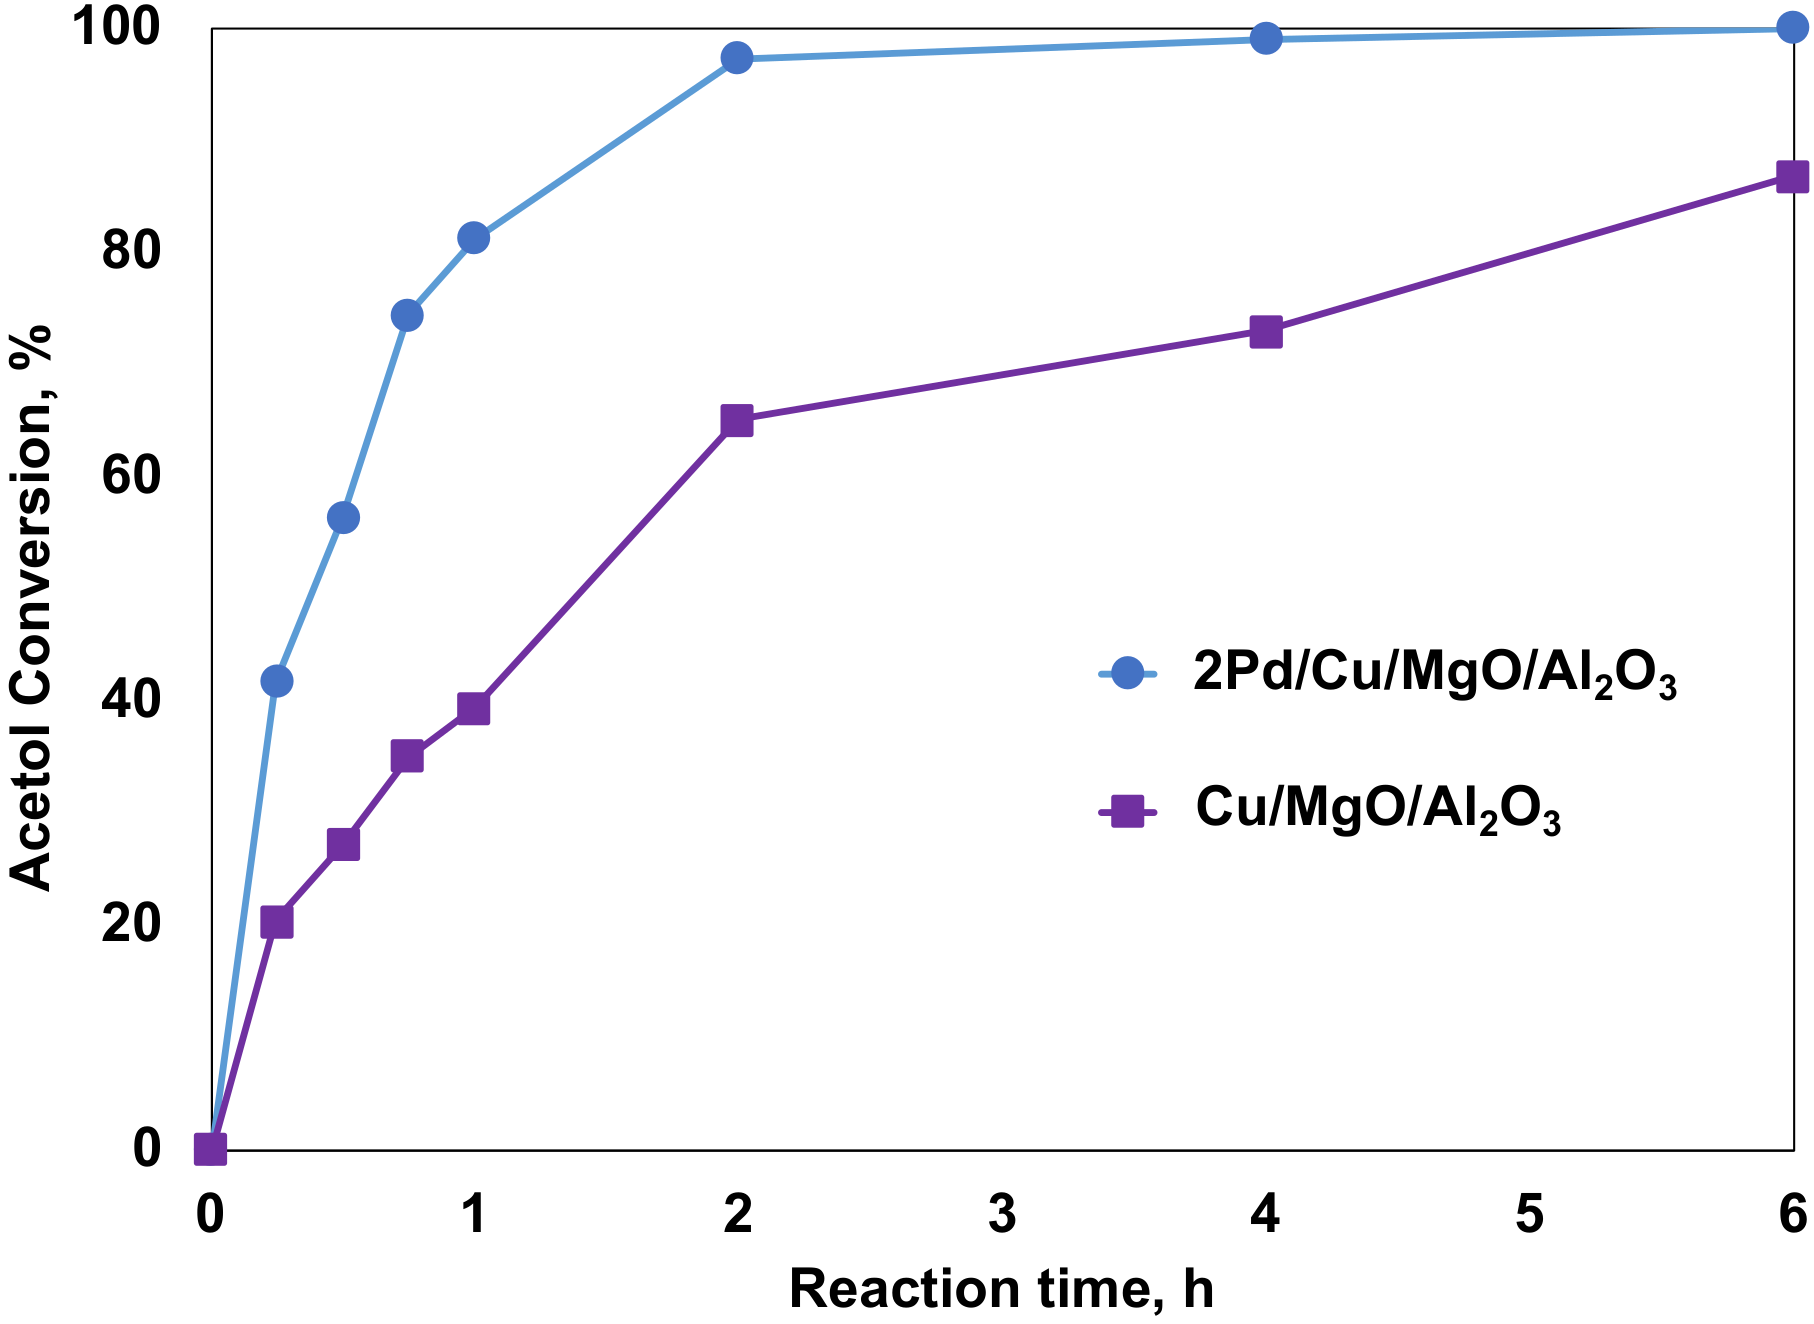
Figure 7.
The effects of single-factors on 1,2-PD selectivity. (Solid bars) positive effects; (patterned bars) negative effects, error margin: 95% confidence interval.
Figure 7.
The effects of single-factors on 1,2-PD selectivity. (Solid bars) positive effects; (patterned bars) negative effects, error margin: 95% confidence interval.

Figure 8.
Two-factor interactions on the 1,2-PD selectivity. (a) Temperature and Pd loading (AD); (b) glycerol feed concentration and catalyst loading (BC), error margin: 95% confidence interval.
Figure 8.
Two-factor interactions on the 1,2-PD selectivity. (a) Temperature and Pd loading (AD); (b) glycerol feed concentration and catalyst loading (BC), error margin: 95% confidence interval.
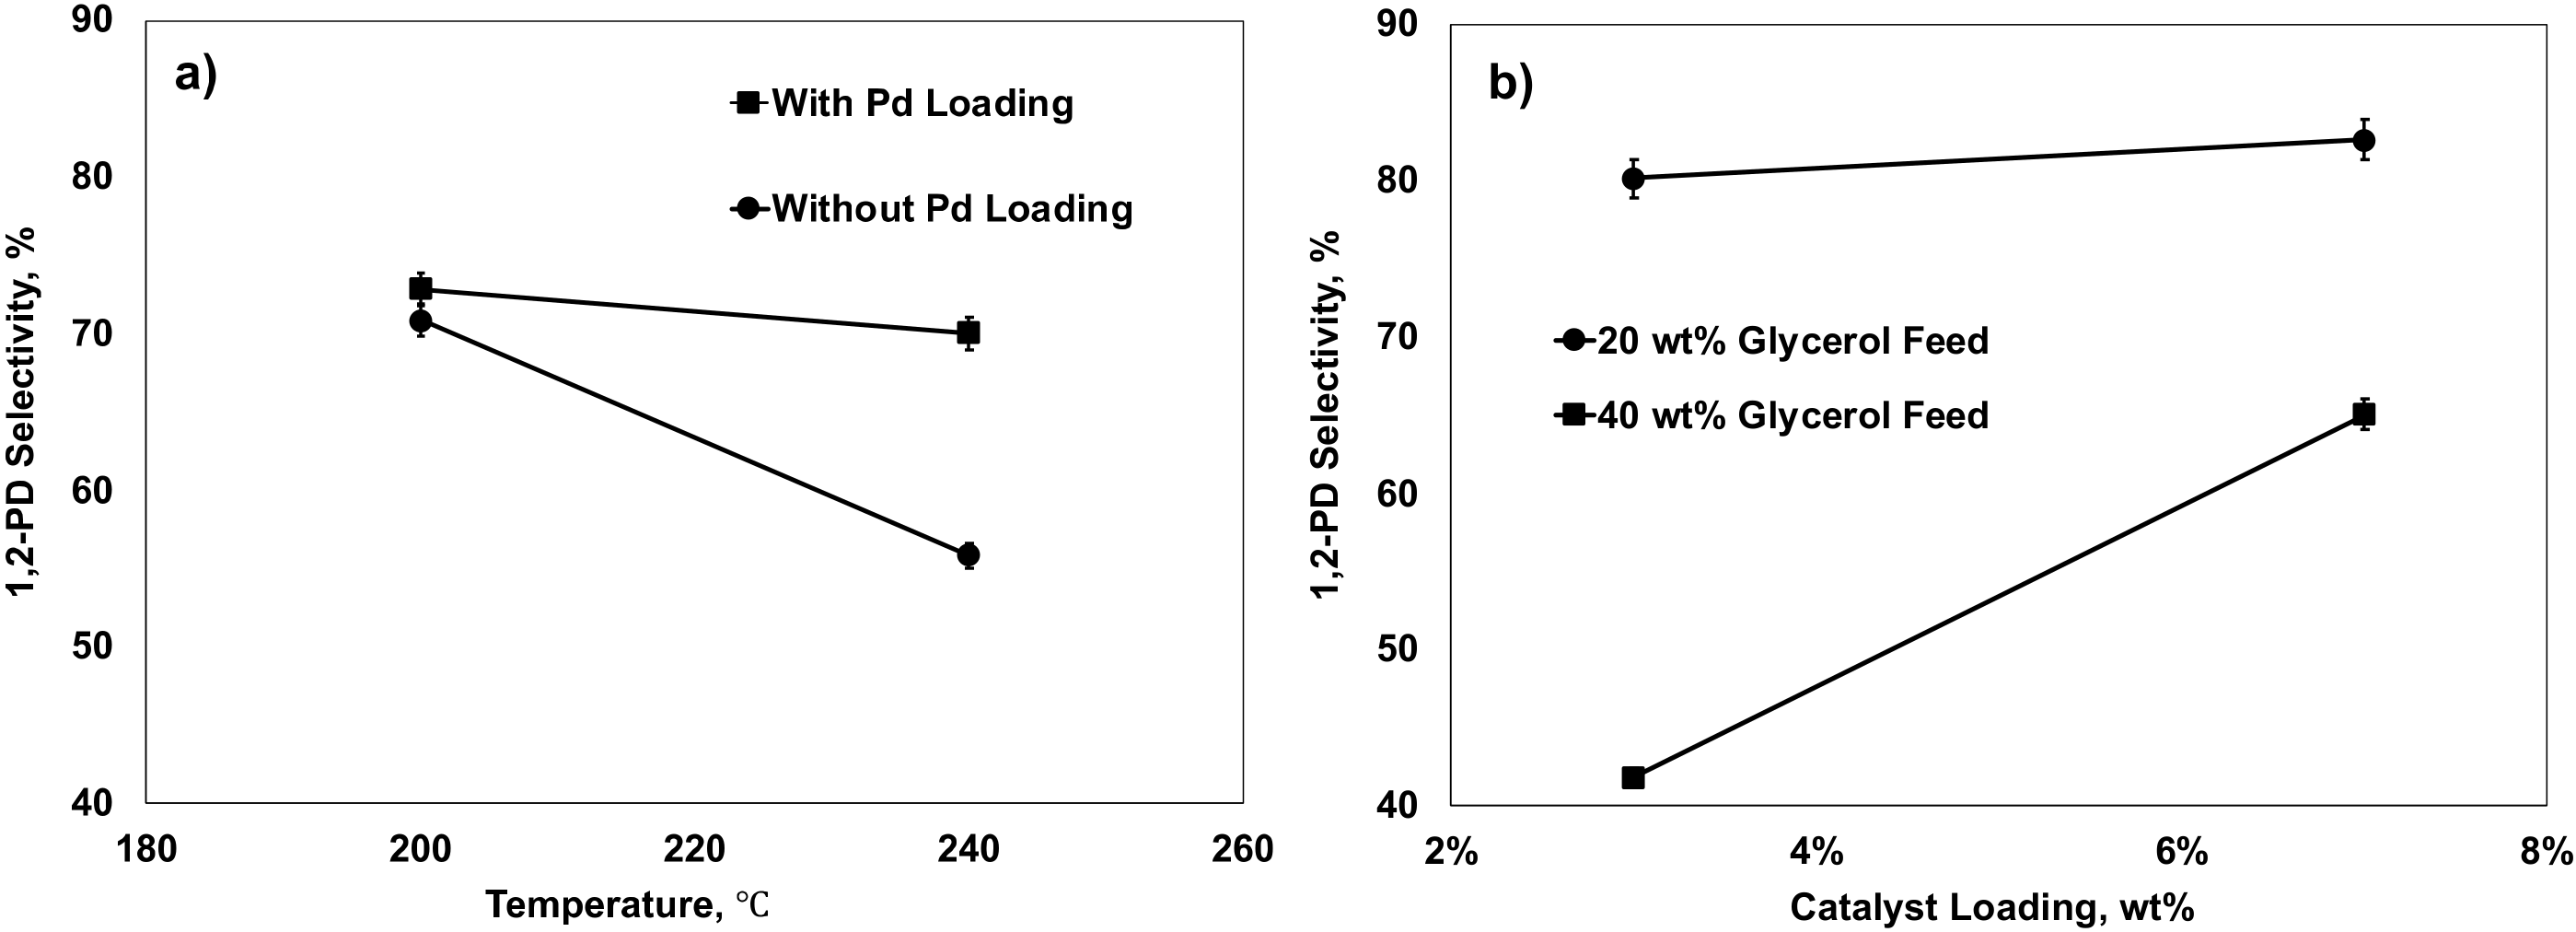
Figure 9.
The effects of single factor on glycerol conversion. (Solid bars) positive effects; (patterned bars) negative effects; error margin: 95% confidence interval.
Figure 9.
The effects of single factor on glycerol conversion. (Solid bars) positive effects; (patterned bars) negative effects; error margin: 95% confidence interval.
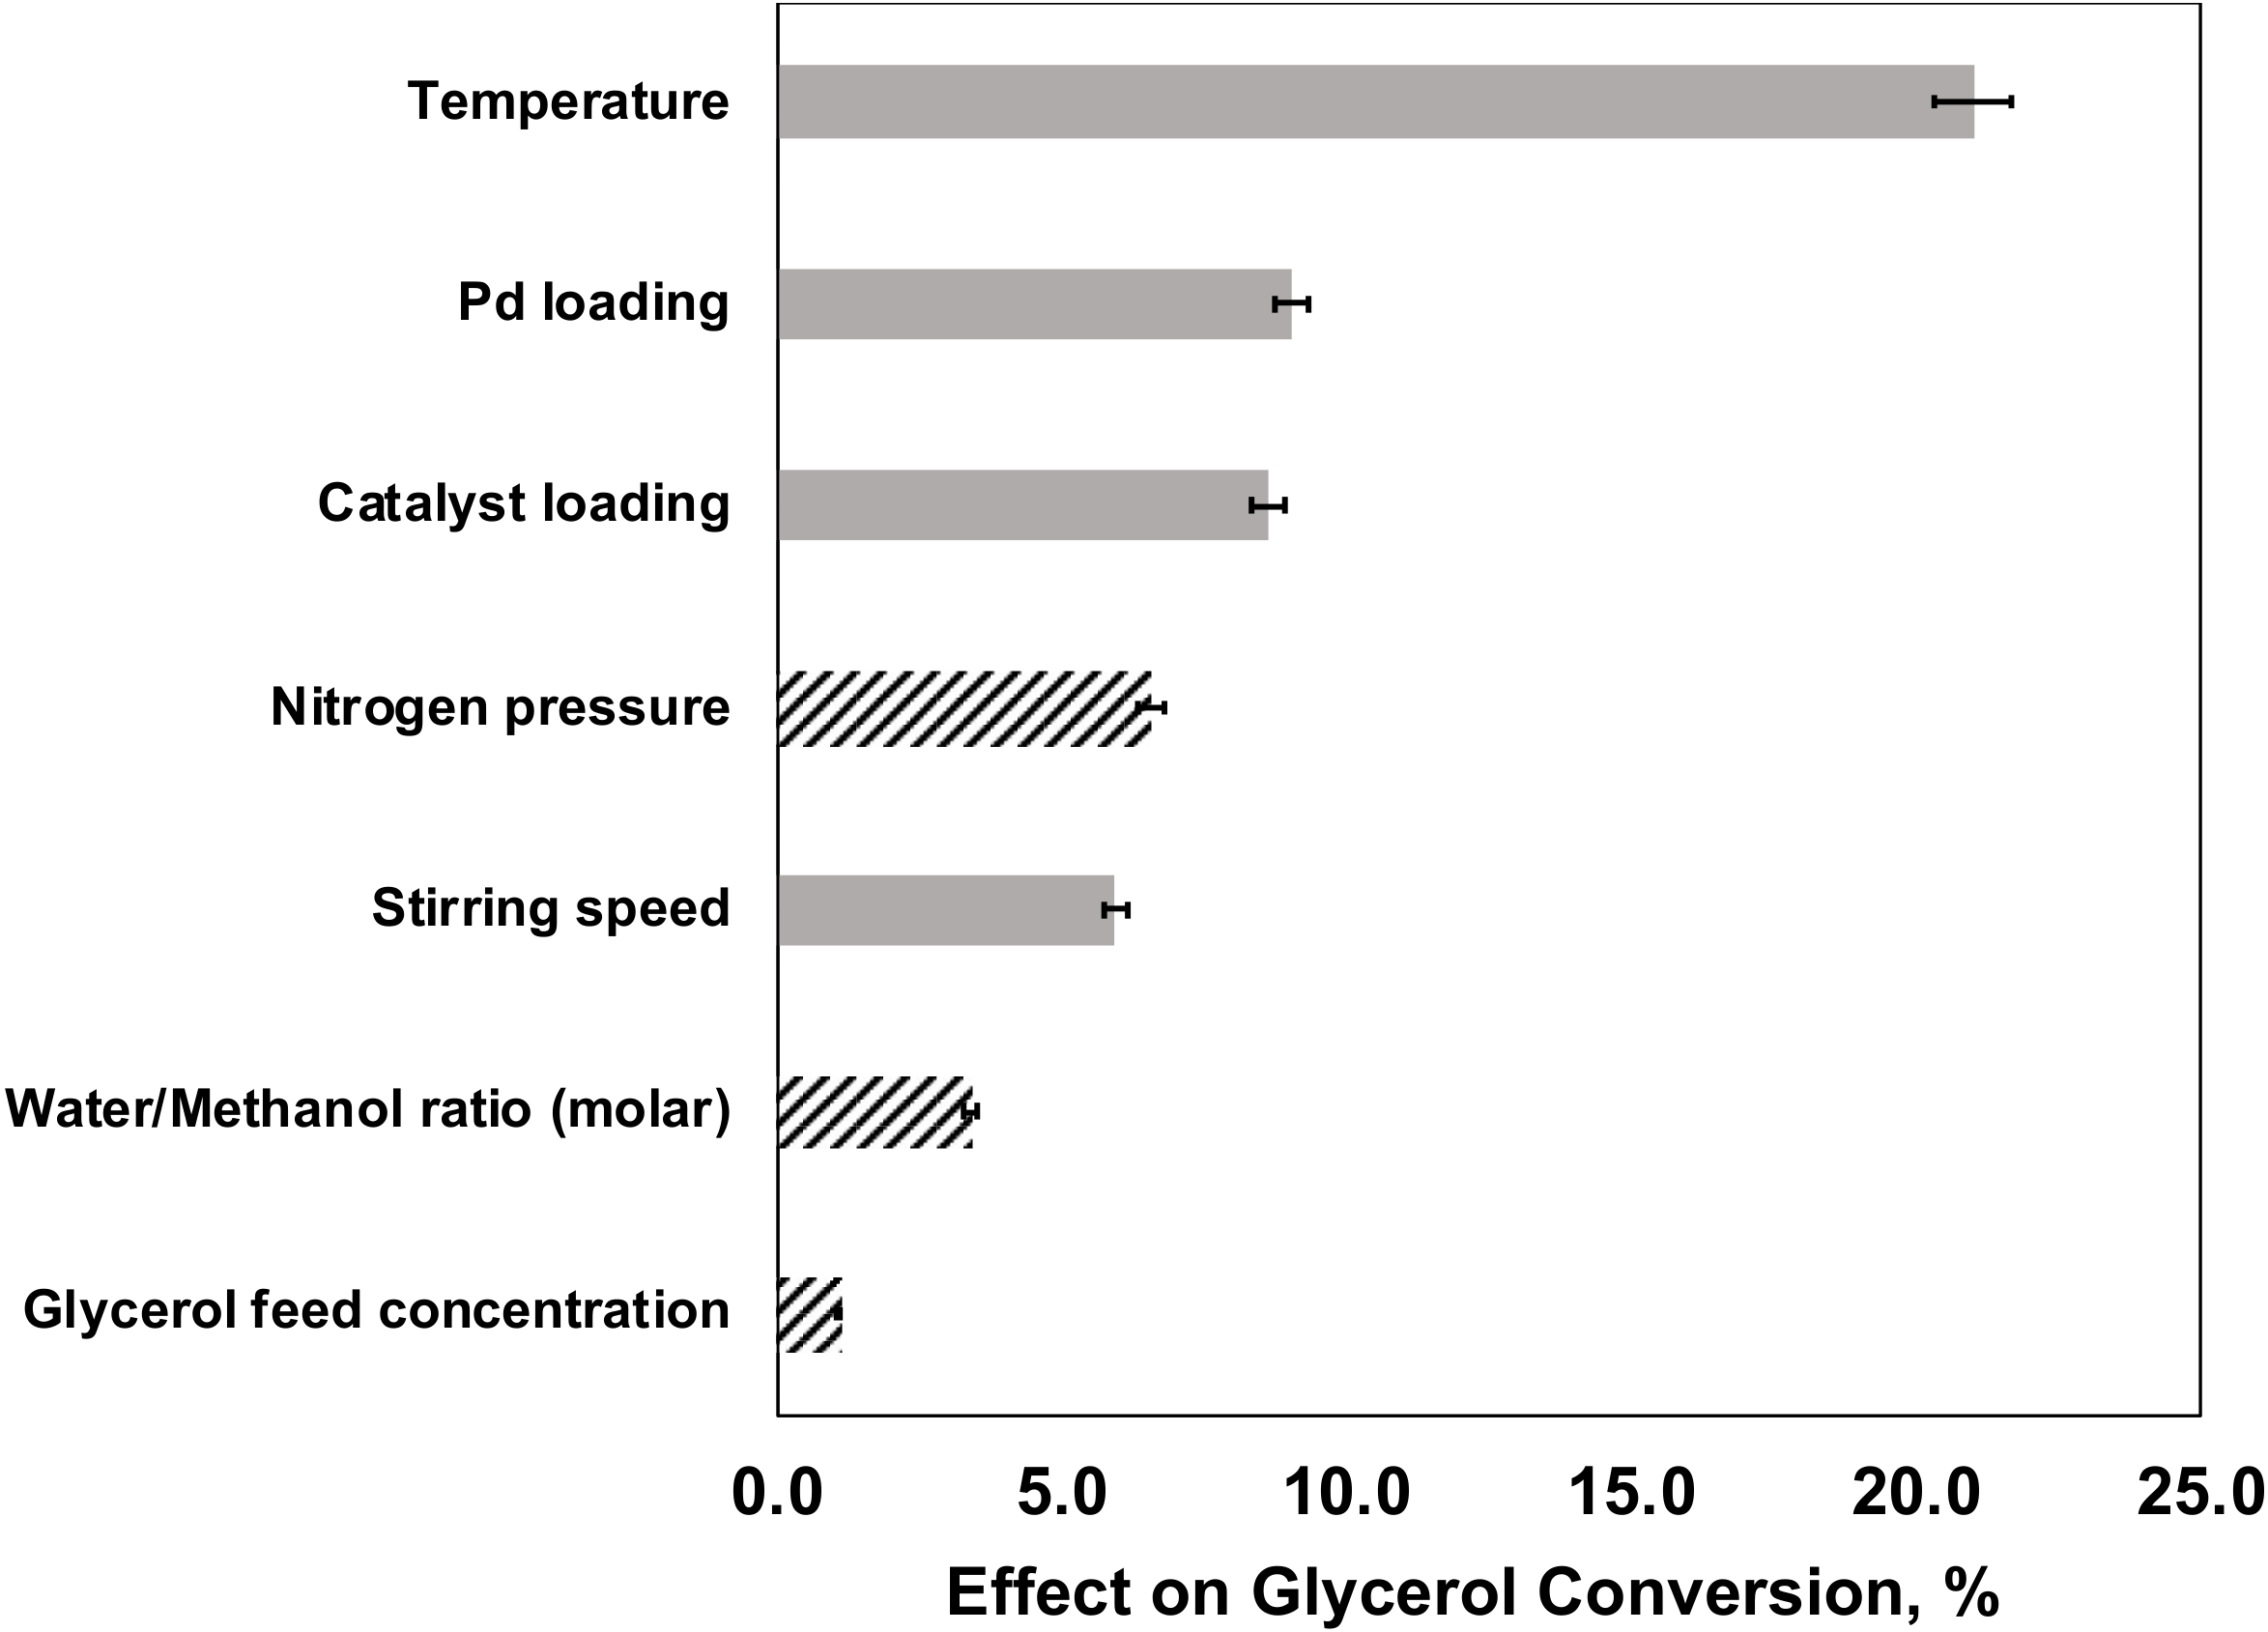
Figure 10.
Two-factor interactions on the glycerol conversion. (a) Catalyst loading and Pd loading (BD); (b) glycerol feed concentration and Pd loading (CD); (c)Temperature and Pd loading (AD), error margin: 95% confidence interval.
Figure 10.
Two-factor interactions on the glycerol conversion. (a) Catalyst loading and Pd loading (BD); (b) glycerol feed concentration and Pd loading (CD); (c)Temperature and Pd loading (AD), error margin: 95% confidence interval.
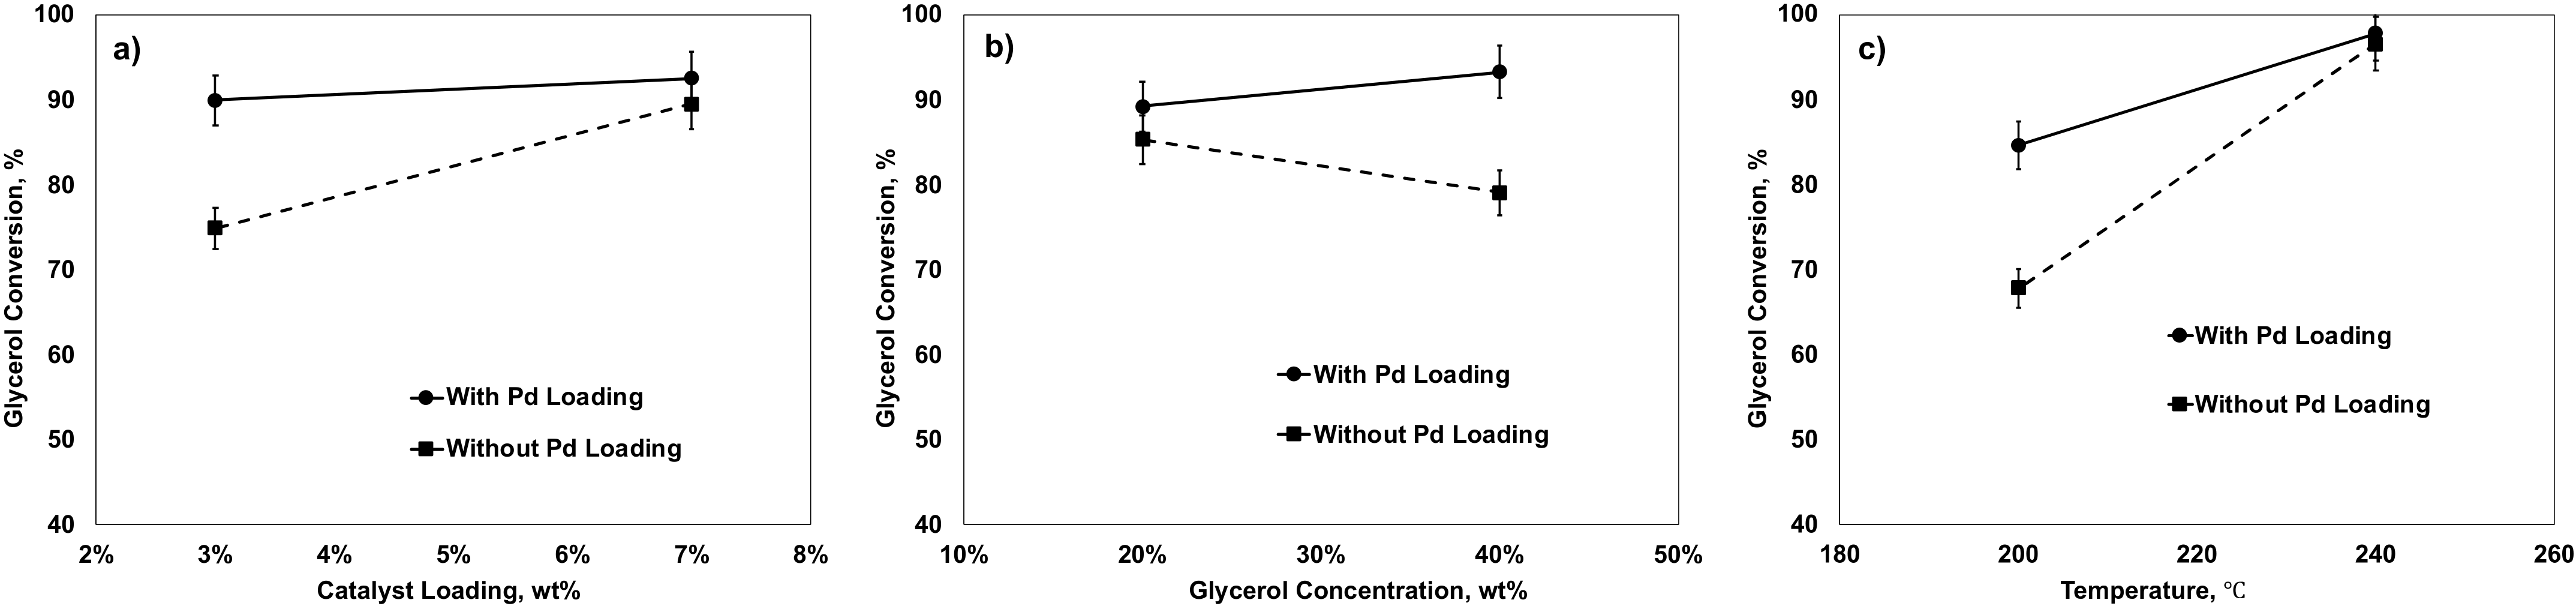
Table 1.
Conversions of glycerol and selectivities of products using the catalysts with different metal combinations 1.
Table 1.
Conversions of glycerol and selectivities of products using the catalysts with different metal combinations 1.
| Entry | Catalysts | Conversion | Selectivity | ||||
|---|---|---|---|---|---|---|---|
| % | % | ||||||
| Glycerol | 1,2-PD | Acetol | EG | Propanol | Others | ||
| 1 | Cu/ZnO/ZrO2 | 75.2 | 57.3 | 13.7 | 3.7 | 0.7 | 24.6 |
| 2 | Cu/ZrO2/Al2O3 | 59.1 | 52.9 | 20.6 | 5.2 | 0.8 | 20.5 |
| 3 | Cu/La2O3/Al2O3 | 29.7 | 58.0 | 30.0 | 6.1 | 0.0 | 6.1 |
| 4 | Cu/ZnO/Al2O3 2 | 87.1 | 70.7 | 6.0 | 3.3 | 0.8 | 19.2 |
| 5 | 5Ni/Cu/ZnO/Al2O3 2 | 70.0 | 85.5 | 5.0 | 5.0 | 0.9 | 3.7 |
| 6 | Cu/MgO/Al2O3 | 95.6 ± 3.2 | 79.5 ± 1.19 | 1.0 ± 0.72 | 8.1 ± 0.93 | 0.8 | 10.6 ± 1.72 |
| 7 | 1Pd/Cu/ZnO/Al2O3 3 | 94.9 | 74.3 | 4.1 | 3.9 | 0.8 | 16.8 |
| 8 | 1Pd/Cu/MgO/Al2O3 | 97.2 ± 3.2 | 83.4 ± 1.25 | 0.0 | 9.5 ± 1.09 | 0.7 | 6.4 ± 1.04 |
| 9 | 2Pd/ZnO 3 | 83.0 | 49.7 | 11.6 | 2.9 | 0.0 | 35.8 |
| 10 | 5Ni/ZnO/Al2O3 2 | 4.8 | 0.0 | 47.9 | 0.0 | 0.0 | 52.1 |
| 11 | ZnO/MgO/Al2O3 4 | 2.9 | 59.2 | N/A | 29.2 | N/A | N/A |
| 12 | Cu/MgO | 80.6 | 62.3 | 2.7 | 7.1 | 1.1 | 26.7 |
Table 2.
(a) Rate expressions for the compounds in a glycerol hydrogenolysis process. (b) Mole balance equation for each compound.
Table 2.
(a) Rate expressions for the compounds in a glycerol hydrogenolysis process. (b) Mole balance equation for each compound.
| (a) | |
|---|---|
| Reaction | Rate Expression |
| Glycerol dehydration | |
| Acetol hydrogenation | |
| Glycerol C–C cleavage | |
| (x): molar concentration of each compound (mol L−1) ri: rate of the reaction (mol L−1 s−1 gcat−1) ki: rate constant of each reaction (s−1 gcat−1) | |
| (b) | |
| Compound | Rate Expression |
| Glycerol | |
| Acetol | |
| 1,2-PD | |
| EG | |
| (i): molar concentration of each compound per g of catalyst (mol L−1) ri: rate of the reaction (mol L−1 s−1 gcat−1) w: weight of catalyst (g) | |
Table 3.
Pseudo-first-order kinetics parameters comparison between Cu/MgO/Al2O3 and 1Pd/Cu/MgO/Al2O3 catalysts 1.
Table 3.
Pseudo-first-order kinetics parameters comparison between Cu/MgO/Al2O3 and 1Pd/Cu/MgO/Al2O3 catalysts 1.
| Catalyst | k1 (s−1 gcat−1) | k2 (s−1 gcat−1) | k3 (s−1 gcat−1) |
|---|---|---|---|
| 1Pd/Cu/MgO/Al2O3 | 6.850 × 10⁻⁵ | 2.752 × 10⁻³ | 7.707 × 10⁻⁶ |
| Cu/MgO/Al2O3 | 3.843 × 10⁻⁵ | 4.897 × 10⁻⁴ | 4.203 × 10⁻⁶ |
1 Conditions: 220 °C, 15 bar N2, 20 wt% Glycerol, Water/Methanol(molar) = 1.2, 3 wt% catalyst, 500 RPM.
Table 4.
Effect of Pd loading on the conversion of glycerol and selectivities of products 1.
| Catalysts | Conversion | Selectivity | ||||
|---|---|---|---|---|---|---|
| % | % | |||||
| Glycerol | 1,2-PD | Acetol | EG | Propanol | Others | |
| Cu/MgO/Al2O3 | 97.4 | 54.9 | 2.0 | 4.5 | 2.1 | 36.4 |
| 1Pd/Cu/MgO/Al2O3 | 100.0 | 66.8 | 0.7 | 5.5 | 0.7 | 26.3 |
| 2Pd/Cu/MgO/Al2O3 | 100.0 | 73.2 | 0.4 | 6.6 | 1.4 | 18.4 |
| 3Pd/Cu/MgO/Al2O3 | 100.0 | 73.6 | 0.4 | 6.6 | 1.2 | 18.2 |
| 2Pd/Cu/MgO/Al2O3 2 | 100.0 | 85.3 | 0.7 | 7.8 | 0.3 | 5.9 |
1 Conditions: 220 °C, 15 bar N2, 40 wt% glycerol, water/methanol (molar) = 1.2, 7 wt% catalyst, 500 RPM, 8 h, Cu/Mg/Al (molar) = 22.5/67.5/10. 2 Reaction was initially pressurized by 15 bar H2 instead of N2.
Table 5.
Effect of Pd on acetol hydrogenation 1.
| Catalysts | Acetol Conversion (%) | 1,2-PD Selectivity (%) | Others Selectivity (%) | k2 (s−1 gcat−1) |
|---|---|---|---|---|
| Cu/MgO/Al2O3 | 86.8 | 68.6 | 31.5 | 2.262 × 10⁻⁴ |
| 2Pd/Cu/MgO/Al2O3 | 100.0 | 95.3 | 4.7 | 9.854 × 10⁻⁴ |
1 Conditions: 10 wt% aqueous acetol, 200 °C, 500 RPM, 400 psi hydrogen pressure, 6 h reaction time, 5 wt% of catalyst with respect to acetol weight. Cu/Mg/Al (molar) = 22.5/67.5/10.
Table 6.
Experimental conditions for a fractional factorial design.
| Conditions | Code | −1 | 0 | +1 |
|---|---|---|---|---|
| Temperature (°C) | A | 200 | 220 | 240 |
| Catalyst loading (wt%) | B | 3 | 5 | 7 |
| Glycerol feed concentration (wt%) | C | 20 | 30 | 40 |
| Pd loading (wt%) | D | 0 | 1 | 2 |
| Stirring Speed (RPM) | E | 400 | 500 | 600 |
| Nitrogen Pressure (bar) | F | 15 | 25 | 35 |
| Water/Methanol (molar) | G | 1 | 1.2 | 1.4 |
Table 7.
27−3 fractional factorial design of the experiments.
| Exp | A | B | C | D | E = ABC | F = BCD | G = ACD |
|---|---|---|---|---|---|---|---|
| 1 | −1 | −1 | −1 | −1 | −1 | −1 | −1 |
| 2 | 1 | −1 | −1 | −1 | 1 | −1 | 1 |
| 3 | −1 | 1 | −1 | −1 | 1 | 1 | −1 |
| 4 | 1 | 1 | −1 | −1 | −1 | 1 | 1 |
| 5 | −1 | −1 | 1 | −1 | 1 | 1 | 1 |
| 6 | 1 | −1 | 1 | −1 | −1 | 1 | −1 |
| 7 | −1 | 1 | 1 | −1 | −1 | −1 | 1 |
| 8 | 1 | 1 | 1 | −1 | 1 | −1 | −1 |
| 9 | −1 | −1 | −1 | 1 | −1 | 1 | 1 |
| 10 | 1 | −1 | −1 | 1 | 1 | 1 | −1 |
| 11 | −1 | 1 | −1 | 1 | 1 | −1 | 1 |
| 12 | 1 | 1 | −1 | 1 | −1 | −1 | −1 |
| 13 | −1 | −1 | 1 | 1 | 1 | −1 | −1 |
| 14 | 1 | −1 | 1 | 1 | −1 | −1 | 1 |
| 15 | −1 | 1 | 1 | 1 | −1 | 1 | −1 |
| 16 | 1 | 1 | 1 | 1 | 1 | 1 | 1 |
| 17 | 0 | 0 | 0 | 0 | 0 | 0 | 0 |
| 18 | 0 | 0 | 0 | 0 | 0 | 0 | 0 |
| 19 | 0 | 0 | 0 | 0 | 0 | 0 | 0 |
| 20 | 0 | 0 | 0 | 0 | 0 | 0 | 0 |
Publisher’s Note: MDPI stays neutral with regard to jurisdictional claims in published maps and institutional affiliations. |
© 2021 by the authors. Licensee MDPI, Basel, Switzerland. This article is an open access article distributed under the terms and conditions of the Creative Commons Attribution (CC BY) license (https://creativecommons.org/licenses/by/4.0/).
Share and Cite
MDPI and ACS Style
Liu, Y.; Wu, M.; Rempel, G.L.; Ng, F.T.T. Glycerol Hydrogenolysis to Produce 1,2-Propanediol in Absence of Molecular Hydrogen Using a Pd Promoted Cu/MgO/Al2O3 Catalyst. Catalysts 2021, 11, 1299. https://doi.org/10.3390/catal11111299
AMA Style
Liu Y, Wu M, Rempel GL, Ng FTT. Glycerol Hydrogenolysis to Produce 1,2-Propanediol in Absence of Molecular Hydrogen Using a Pd Promoted Cu/MgO/Al2O3 Catalyst. Catalysts. 2021; 11(11):1299. https://doi.org/10.3390/catal11111299
Chicago/Turabian StyleLiu, Yuanqing, Michael Wu, Garry L. Rempel, and Flora T.T. Ng. 2021. "Glycerol Hydrogenolysis to Produce 1,2-Propanediol in Absence of Molecular Hydrogen Using a Pd Promoted Cu/MgO/Al2O3 Catalyst" Catalysts 11, no. 11: 1299. https://doi.org/10.3390/catal11111299
Note that from the first issue of 2016, this journal uses article numbers instead of page numbers. See further details here.