Article

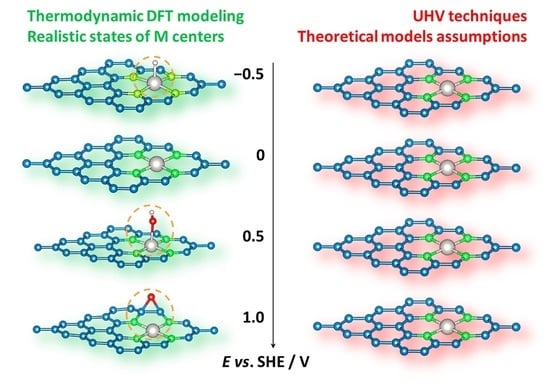
What Is the Real State of Single-Atom Catalysts under Electrochemical Conditions—From Adsorption to Surface Pourbaix Plots?

1
Faculty of Physical Chemistry, University of Belgrade, Studentski trg 12-16, 11000 Belgrade, Serbia
2
Department of Materials Science and Engineering, School of Industrial Engineering and Management, KTH—Royal Institute of Technology, Brinellvägen 23, 100 44 Stockholm, Sweden
3
Serbian Academy of Sciences and Arts, Knez Mihajlova 35, 11000 Belgrade, Serbia
*
Author to whom correspondence should be addressed.
Catalysts 2021, 11(10), 1207; https://doi.org/10.3390/catal11101207
Submission received: 8 September 2021 / Revised: 3 October 2021 / Accepted: 4 October 2021 / Published: 8 October 2021

Abstract

:
The interest in single-atom catalysts (SACs) is increasing, as these materials have the ultimate level of catalyst utilization, while novel reactions where SACs are used are constantly being discovered. However, to properly understand SACs and to further improve these materials, it is necessary to consider the nature of active sites under operating conditions. This is particularly important when SACs are used as electrocatalysts due to harsh experimental conditions, including extreme pH values or high anodic and cathodic potential. In this contribution, density functional theory-based thermodynamic modelling is used to address the nature of metal centers in SACs formed by embedding single metal atoms (Ru, Rh, Ir, Ni, Pd, Pt, Cu, Ag, and Au) into graphene monovacancy. Our results suggest that none of these SAC metal centers are clean at any potential or pH in the water thermodynamic stability region. Instead, metal centers are covered with Hads, OHads, or Oads, and in some cases, we observed the restructuring of the metal sites due to oxygen incorporation. Based on these findings, it is suggested that setting up theoretical models for SAC modelling and the interpretation of ex situ characterization results using ultra-high vacuum (UHV) techniques requires special care, as the nature of SAC active sites under operating conditions can significantly diverge from the basic models or the pictures set by the UHV measurements.

Graphical Abstract

1. Introduction

Single-atom catalysts (SACs) present the ultimate limit of catalyst utilization [1,2,3]. Since virtually every atom possesses catalytic function, even SACs based on Pt-group metals are attractive for practical applications. So far, the use of SACs has been demonstrated for numerous catalytic and electrocatalytic reactions, including energy conversion and storage-related processes such as hydrogen evolution reactions (HER) [4,5,6,7,8,9], oxygen reduction reactions (ORR) [7,10,11,12], oxygen evolution reactions (OER) [8,13,14], and others. Moreover, SACs can be modeled relatively easily, as the single-atom nature of active sites enables the use of small computational models that can be treated without any difficulties. Hence, a combination of experimental and theoretical methods is frequently used to explain or predict the catalytic activities of SACs or to design novel catalytic systems. As the catalytic component is atomically dispersed and is chemically bonded to the support, in SACs, the support or matrix has an equally important role as the catalytic component. In other words, one single atom at two different supports will never behave the same way, and the behavior compared to a bulk surface will also be different [1,2,3].
Looking at the current research trends, understanding the electrocatalytic properties of different materials relies on the results of the physicochemical characterization of these materials. Many of these characterization techniques operate under ultra-high vacuum (UHV) conditions [15,16], so the state of the catalyst under operating conditions and during the characterization can hardly be the same. Moreover, potential modulations under electrochemical conditions can cause a change in the state of the catalyst compared to under UHV conditions. A well-known example is the case of ORR on platinum surfaces. ORR commences at potentials where the surface is partially covered by OHads, which acts as a spectator species [17,18,19,20]. Changing the electronic structure of the surface and weakening the OH binding improves the ORR activity [20]. Moreover, the same reaction can switch mechanisms at very high overpotentials from the 4e- to the 2e-mechanism when the surface is covered by underpotential deposited hydrogen [21,22]. These surface processes are governed by potential modulation and cannot be seen using some ex situ surface characterization technique, such as XPS.
However, the state of the electrocatalyst surface can be predicted using the concept of the Pourbaix plot, which connects potential and pH regions in which certain phases of a given metal are thermodynamically stable [23,24]. Such approaches were used previously to understand the state of (electro)catalyst surfaces, particularly in combination with theoretical modeling, enabling the investigation of the thermodynamics of different surface processes [25,26,27].
The concept of Pourbaix plots has not been widely utilized for SACs, although there are some examples of their construction [12,28]. However, their use would be exceptionally helpful for understanding the nature of the active sites in SACs under operating conditions and the proper modelling of SACs using computational approaches of different complexity. The latter is specifically related to the fact that the majority of computational models that have been used so far to address he catalytic activity SACs treat SACs as a perfect (single atom + support) combination and do not consider possible changes of the active site due to the potential or pH changes (which are in catalysis, as a rule, rather extreme). Moreover, the use of Pourbaix plots is widespread in electrochemistry and puts the results of DFT thermodynamic calculations in direct connection with the experimental stability of different phases that are present in an electrochemical cell.
In this work, we investigate model SACs consisting of single metal atoms (Ru, Rh, Ir, Ni, Pd, Pt, Cu, Ag, and Au) that have been embedded into a single-vacancy graphene site. Such models have been present in the literature for a while [29]. The incorporation of 3D transition metals, noble metals, and Zn in graphene’s single vacancy was studied in detail in Ref. [30]. The reactivity of graphene with a single vacancy (vG) towards the elements of rows 1–6 of the periodic table of elements, excluding lanthanides, is reported in detail in Ref. [31], and the high thermodynamic stability of such systems is observed. Moreover, such systems have also been implemented experimentally and have shown appreciable electrocatalytic activities [32,33]. We start with pristine models of SACs and consider several surface processes, connecting them into Pourbaix plots for given model SACs at the end. We show that the predicted thermodynamically stable states of model SACs change with electrode potential and pH. In fact, the model SACs are actually never pristine, which is the opposite of usual assumptions in the theoretical models of SACs (re)activity that have been considered so far.

2. Results

To evaluate the stability of different SACs structures under electrochemical conditions, we considered the reactivity of model SACs (M@vG systems) with H, OH, and O. The purpose of this was to estimate which potential regions metal center dissolution (Equation (1)), hydrogen underpotential deposition (UPD, Equation (2)), and the oxidation of metal centers (Equations (3) and (4)) can take place in. To be specific, the considered redox processes were:
Mz+ + ze + vG → M@vG,
M@vG + H+ + e → H-MvG,
OH-M@vG + H+ + e → M@vG + H2O,
O-M@vG + 2H+ + 2e → M@vG + H2O.
Once the total energies of the investigated systems were known, and the adsorption energies of the studied adsorbates were determined, it was possible to evaluate standard potentials (E°(O/R)) and to construct the surface Pourbaix plots for the investigated systems (see Section 4 for more details). For reactions (1)–(4), the Nernst equations (at 298 K) were given as:
E(Mz+/M@vG) = E°(Mz+/M@vG) − (0.059/z) × loga(Mz+),
E(M@vG/H-MvG) = E°(M@vG/H-MvG) − 0.059 × pH,
E(OH-M@vG/M@vG) = E°(OH-M@vG/M@vG) − 0.059 × pH,
E(O-M@vG/M@vG) = E°(O-M@vG/M@vG) − 0.059 × pH.

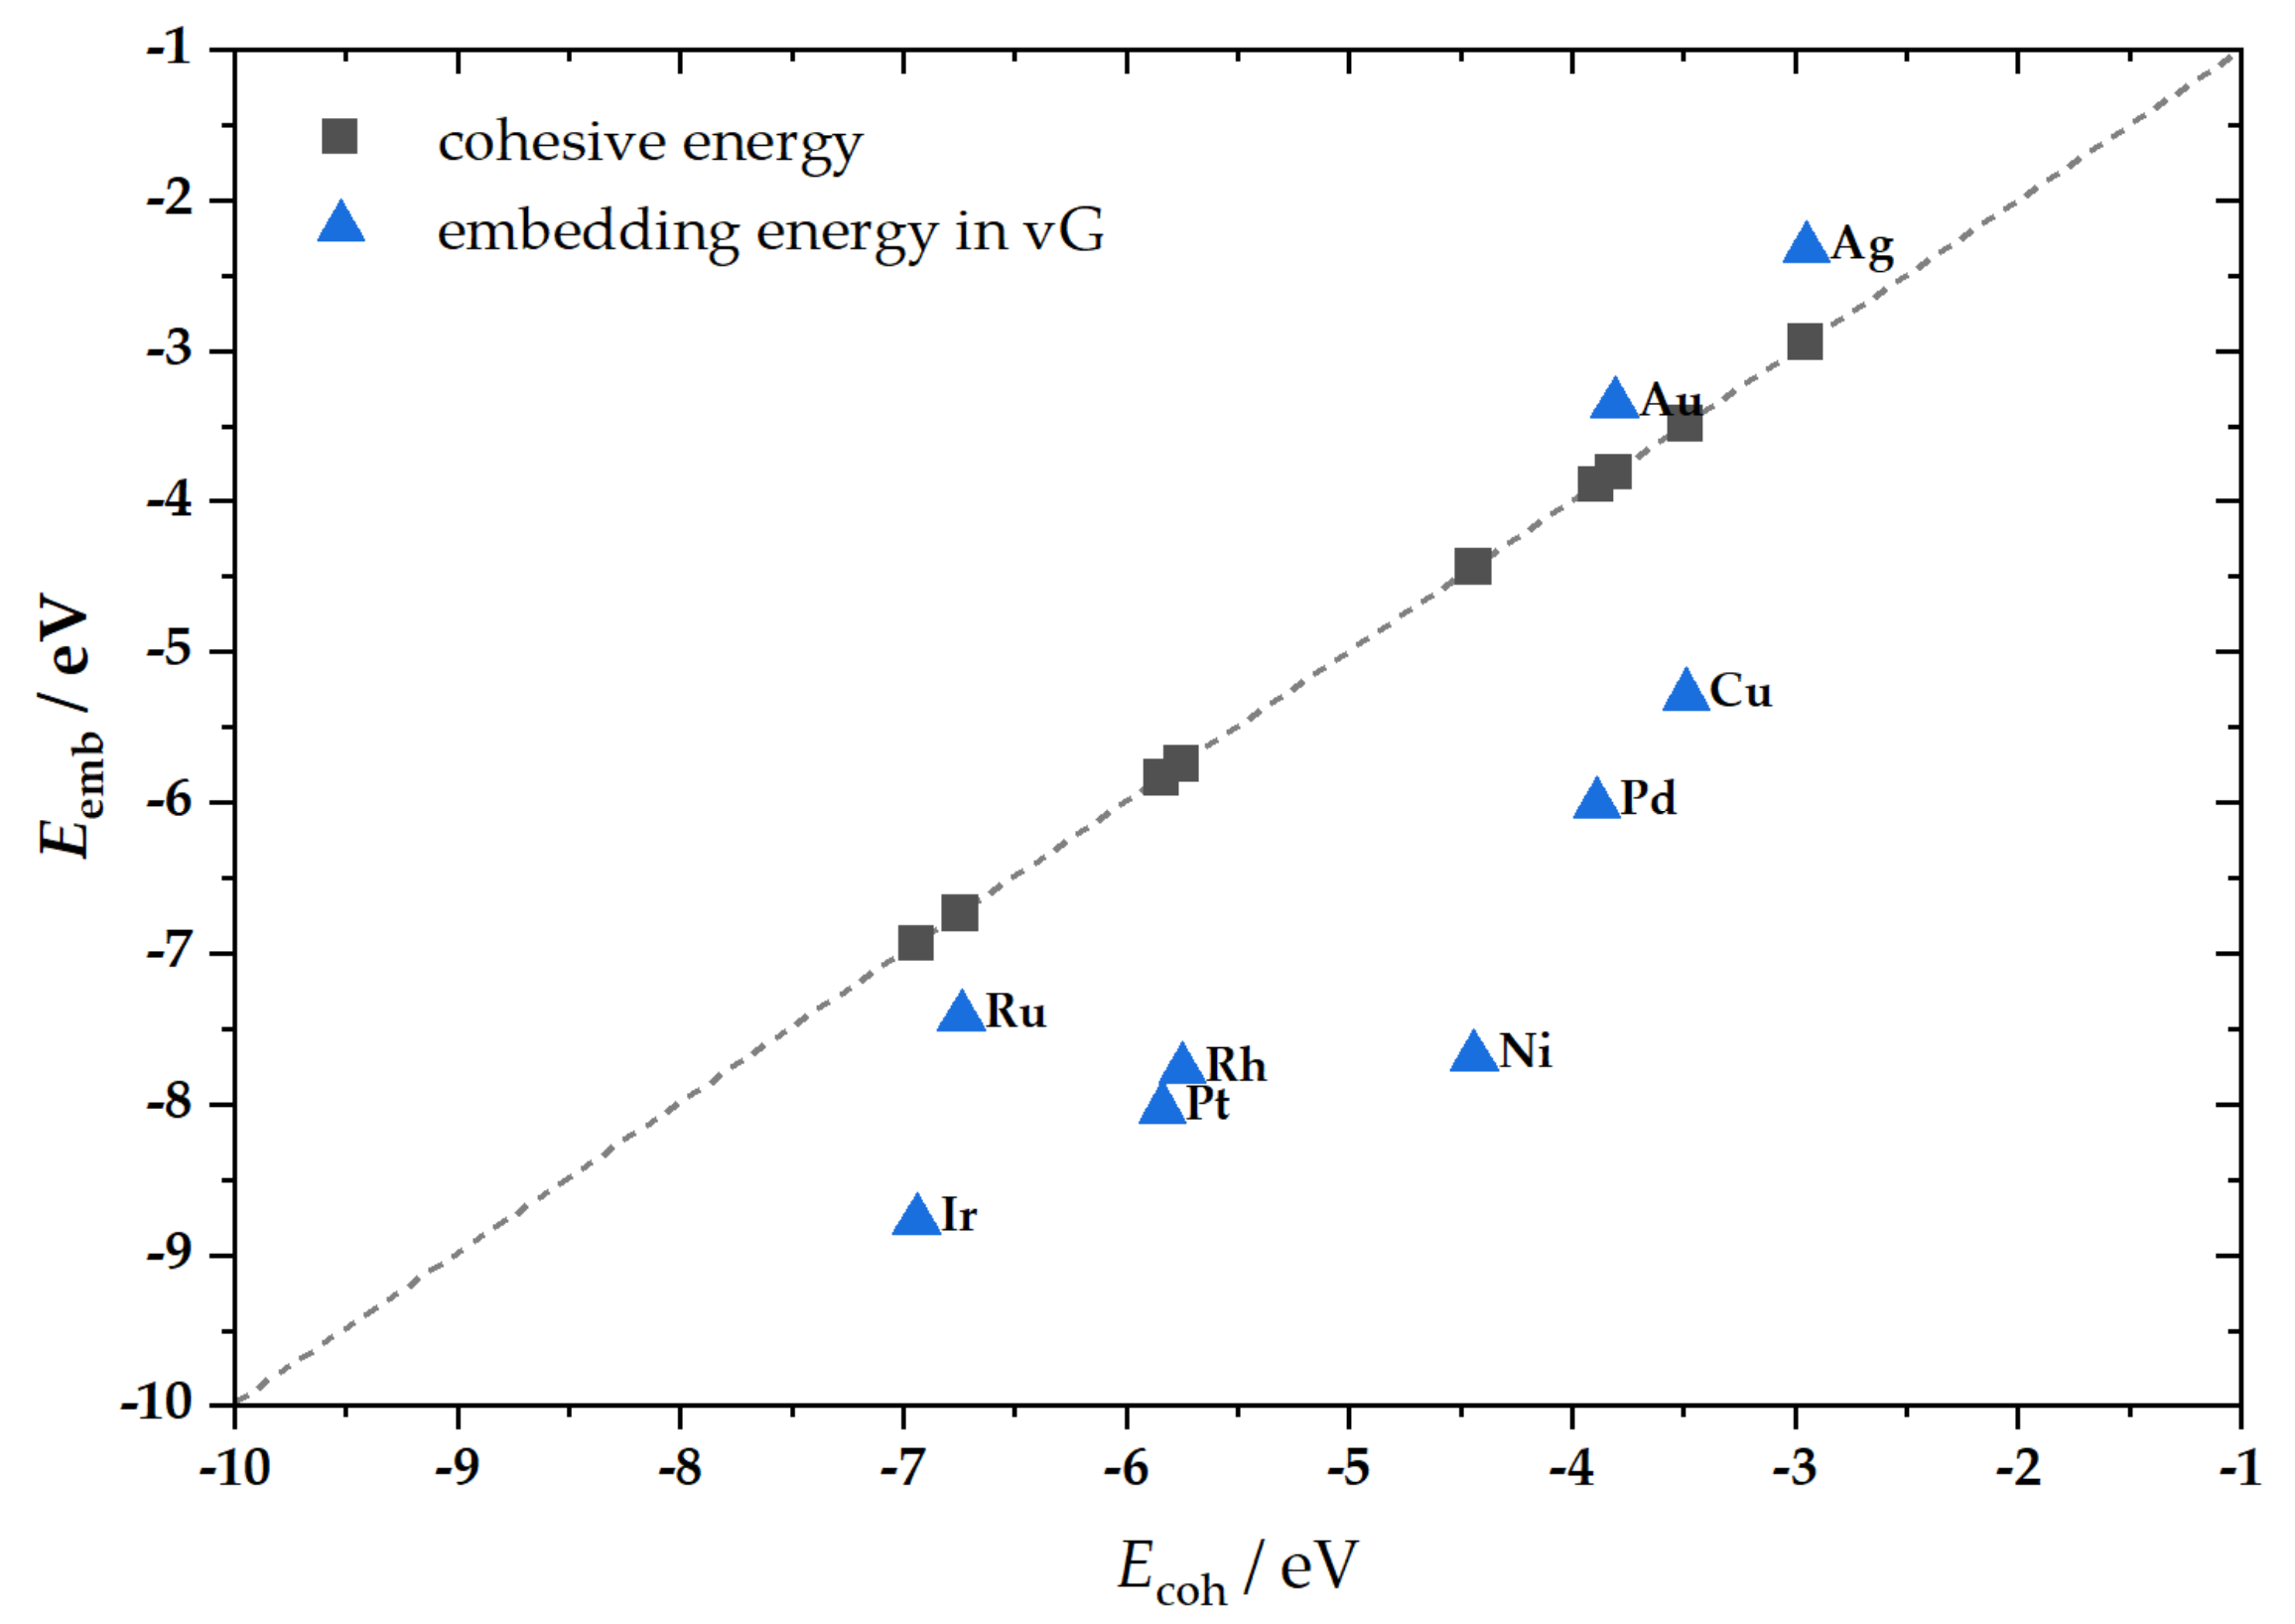
2.1. M@v-Graphene—Formation of SACs

First, we investigated the embedding of Ni, Cu, and Ag and the noble metals Ru, Rh, Pd, Ir, Pt, and Au into the single vacancy site in graphene, i.e., the formation of SACs. When the chosen metal atoms were incorporated into the vacancy of vG, the so-obtained C3M sites in the M@vG structures were qualitatively very similar, showing C3v symmetry in most cases (Figure 1). In all of the cases, the metal atom protruded from the graphene basal plane, and to a lesser extent, its first three C-neighbours protruded into the plane as well (Figure 1 and Table 1). The exception to the perfect C3v symmetry of C3M can be found in Ag@vG and Au@vG. Not all M−C bonds have the same length in these systems due to Jahn–Teller distortion (up to the second decimal in Å, Figure 1 and Table 1).
From the investigated metals, Ag shows the weakest binding, and Ir shows the strongest (Table 1). The calculated energies caused by embedding M into the vacancy of vG are in good agreement with available literature reports (Table 1). For the metals belonging to groups 8 and 10 of PTE, we found the total magnetization of M@vG to be equal to zero, while for M from group 11, the total magnetization of M@vG was around 1 μB (Table 1). Bader charge analysis reveals that some charge is transferred from M to graphene in all the cases (Table 1). While a nearly linear relationship between Eemb(M) and the charge transferred from M to graphene was found for Ir, Ru, Ni, Pd, and Au; other investigated elements (Cu, Ag, Rh, and Pt) do not follow this trend. The strongest M binding (Ir) case corresponded to the maximum charge transfer from M to graphene (Table 1).
By comparing the metal embedding energies and the corresponding cohesive energies (experimental data [35], Figure 2), it can be concluded that the majority of the studied metals were less susceptible to dissolution when embedded into vG than the corresponding bulk phase, which is in agreement with our previous findings [36]. The exceptions are Ag and Au, which have lower embedding energies than the cohesive energies of bulk phase (absolute values).
Before proceeding further, we note that for the electrochemical applications of SACs, their conductivity must be high. Otherwise, Ohmic losses would affect the energy efficiency of an electrocatalytic process. For this purpose, we investigated the densities of states (DOS, Figure 3) of the studied model SACs. None of the systems show a bandgap, suggesting that all of the studied SACs exhibit metallic behavior.

2.2. A−M@v-Graphene

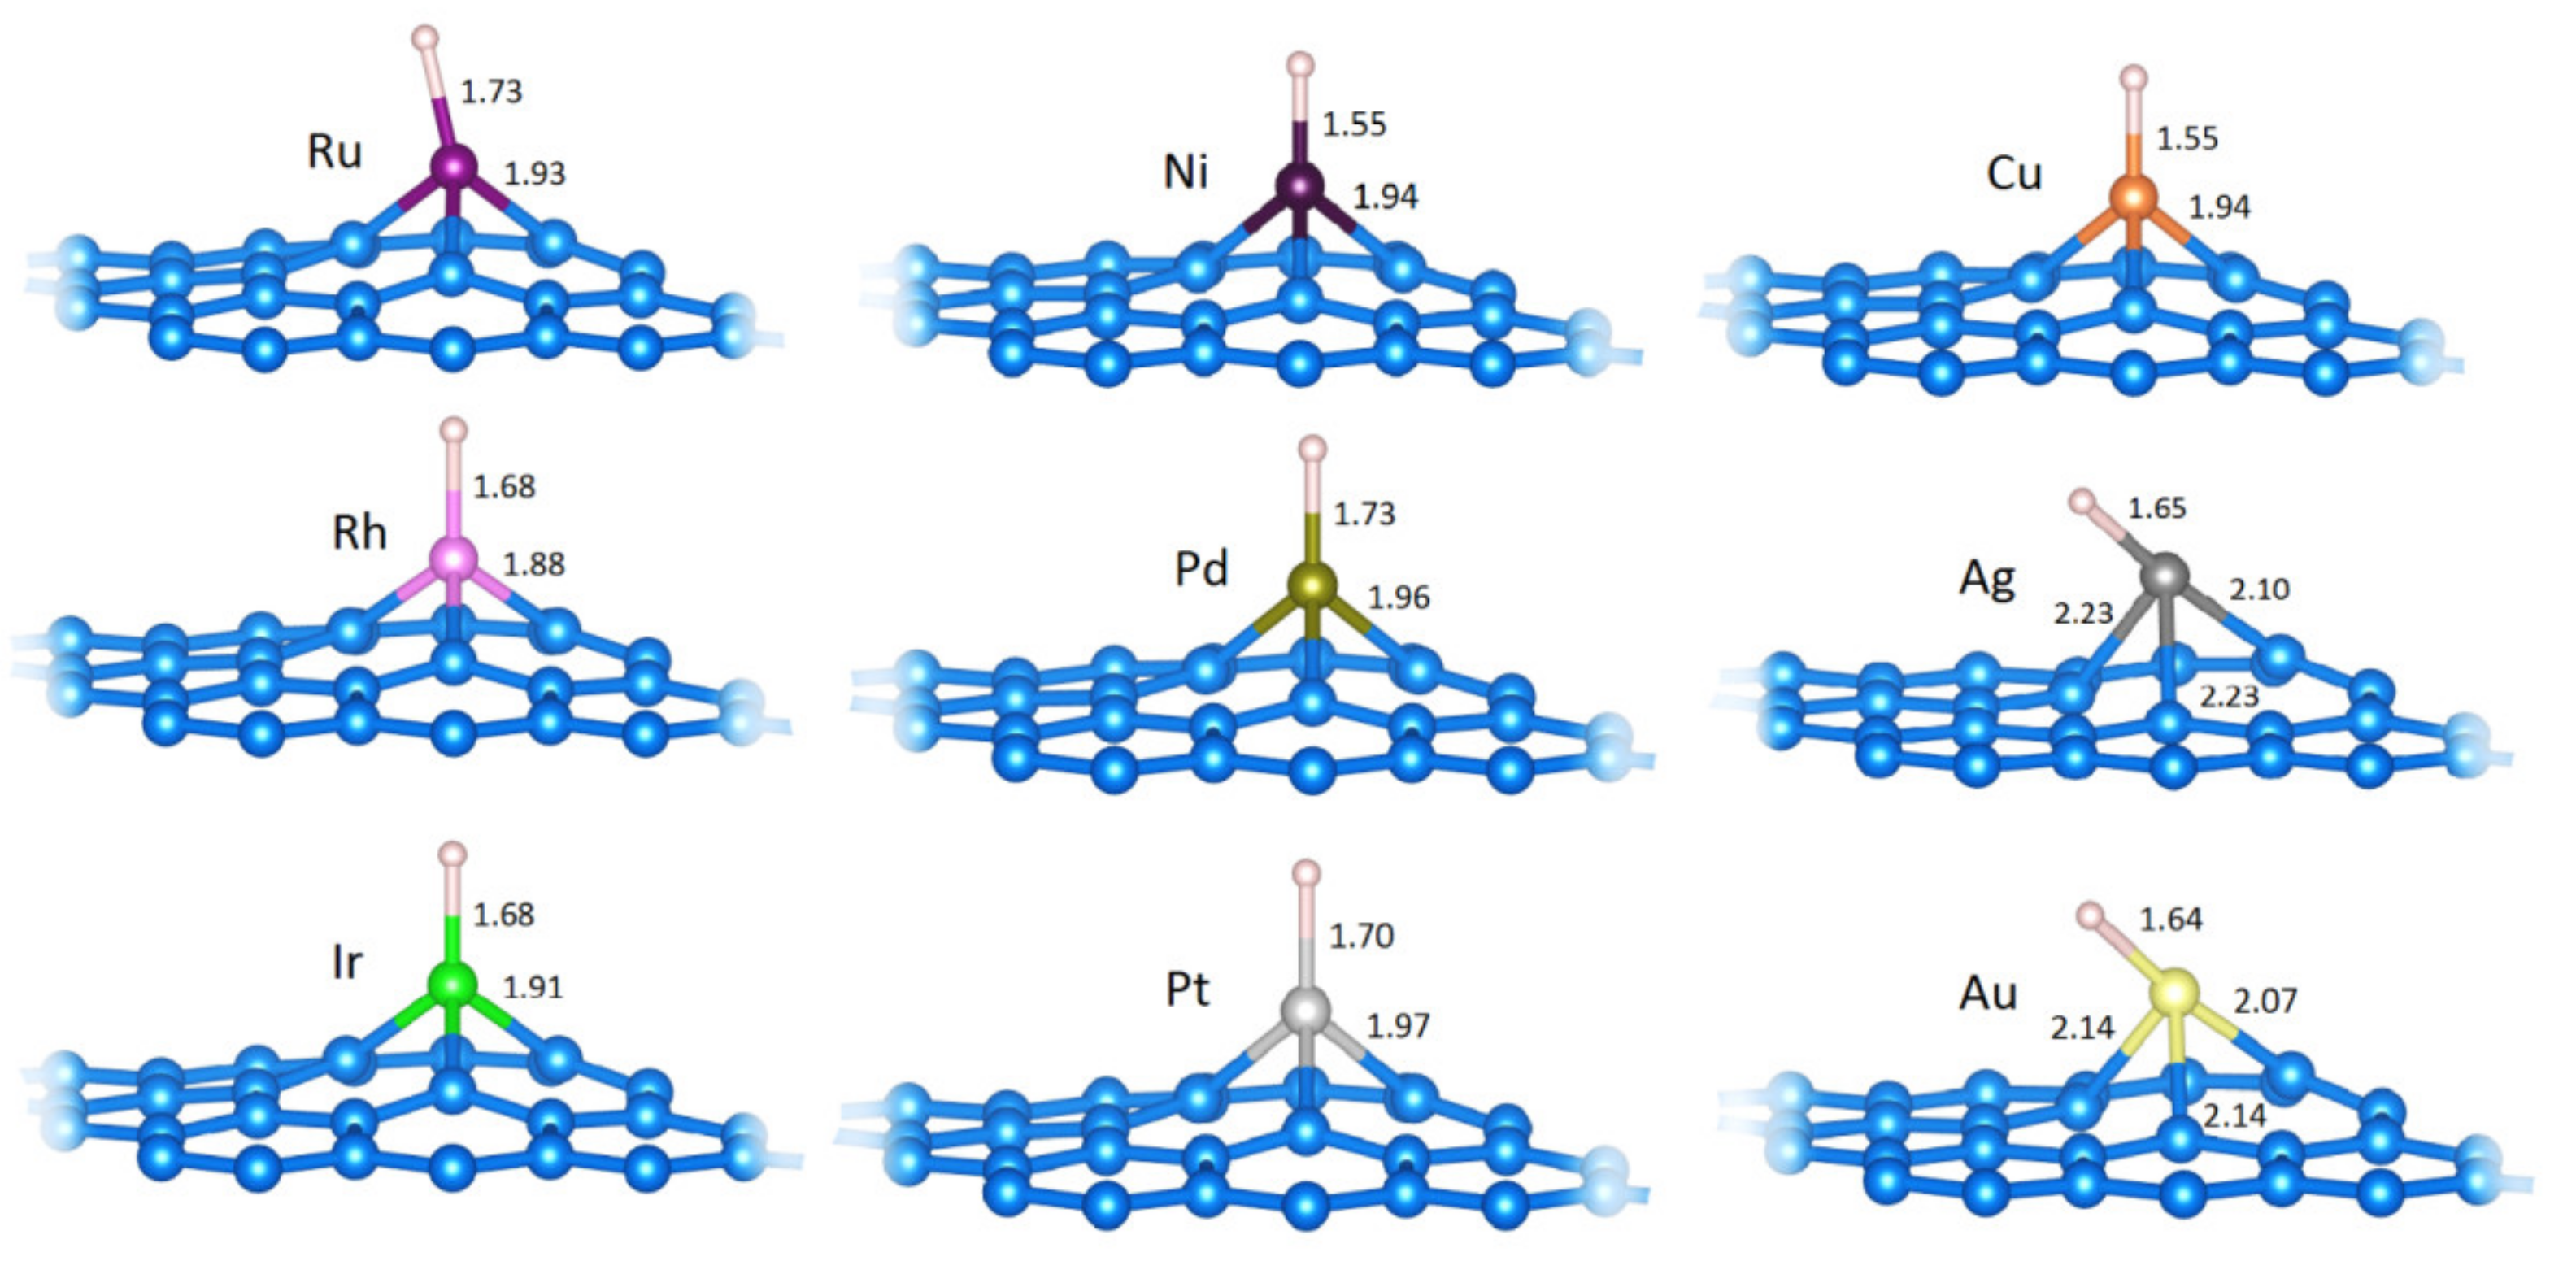
2.2.1. H Adsorption (H−M@vG)

The first adsorbate we investigated was atomic hydrogen to explore the possible hydrogen UPD at model SACs. Namely, the bulk surfaces of some of the studied metals show H UPD, such as Pt, Pd, Ir, Rh [38,39,40], as a consequence of the exergonic H2 dissociation process on these surfaces. Therefore, it is reasonable to expect that at least some of the corresponding SACs could show similar behavior. On the other hand, some other metals, such as Ni, build hydrides, so it is essential to understand the interaction of SAC metal centers with atomic hydrogen.
The calculated Eads(H) (Table 2) show a relatively wide range of adsorption energies of atomic H on the metal centers of SACs (Figure 4). Interestingly, the weakest interaction is seen for Ni (which interacts strongly with H in the bulk phase [41,42]) and the strongest is seen for Au (which in bulk interacts very weakly with H [41]). The magnetic moments of SACs are quenched upon H adsorption, but in the cases of Cu and Ru, the magnetic moments arise upon Hads formation.
It is important to consider the geometries of Hads on model SACs. As shown (Figure 3), Hads is formed directly on the metal center in all cases. Furthermore, the Hads formation is followed by reducing a partial charge of the metal center compared to pristine SACs (Table 2), except for in the cases of Ag and Ir, where the situation is the opposite. Based on the obtained results, we can conclude that if Hads is formed on the metal center, the center itself is covered by H and cannot be considered a bare metal site.

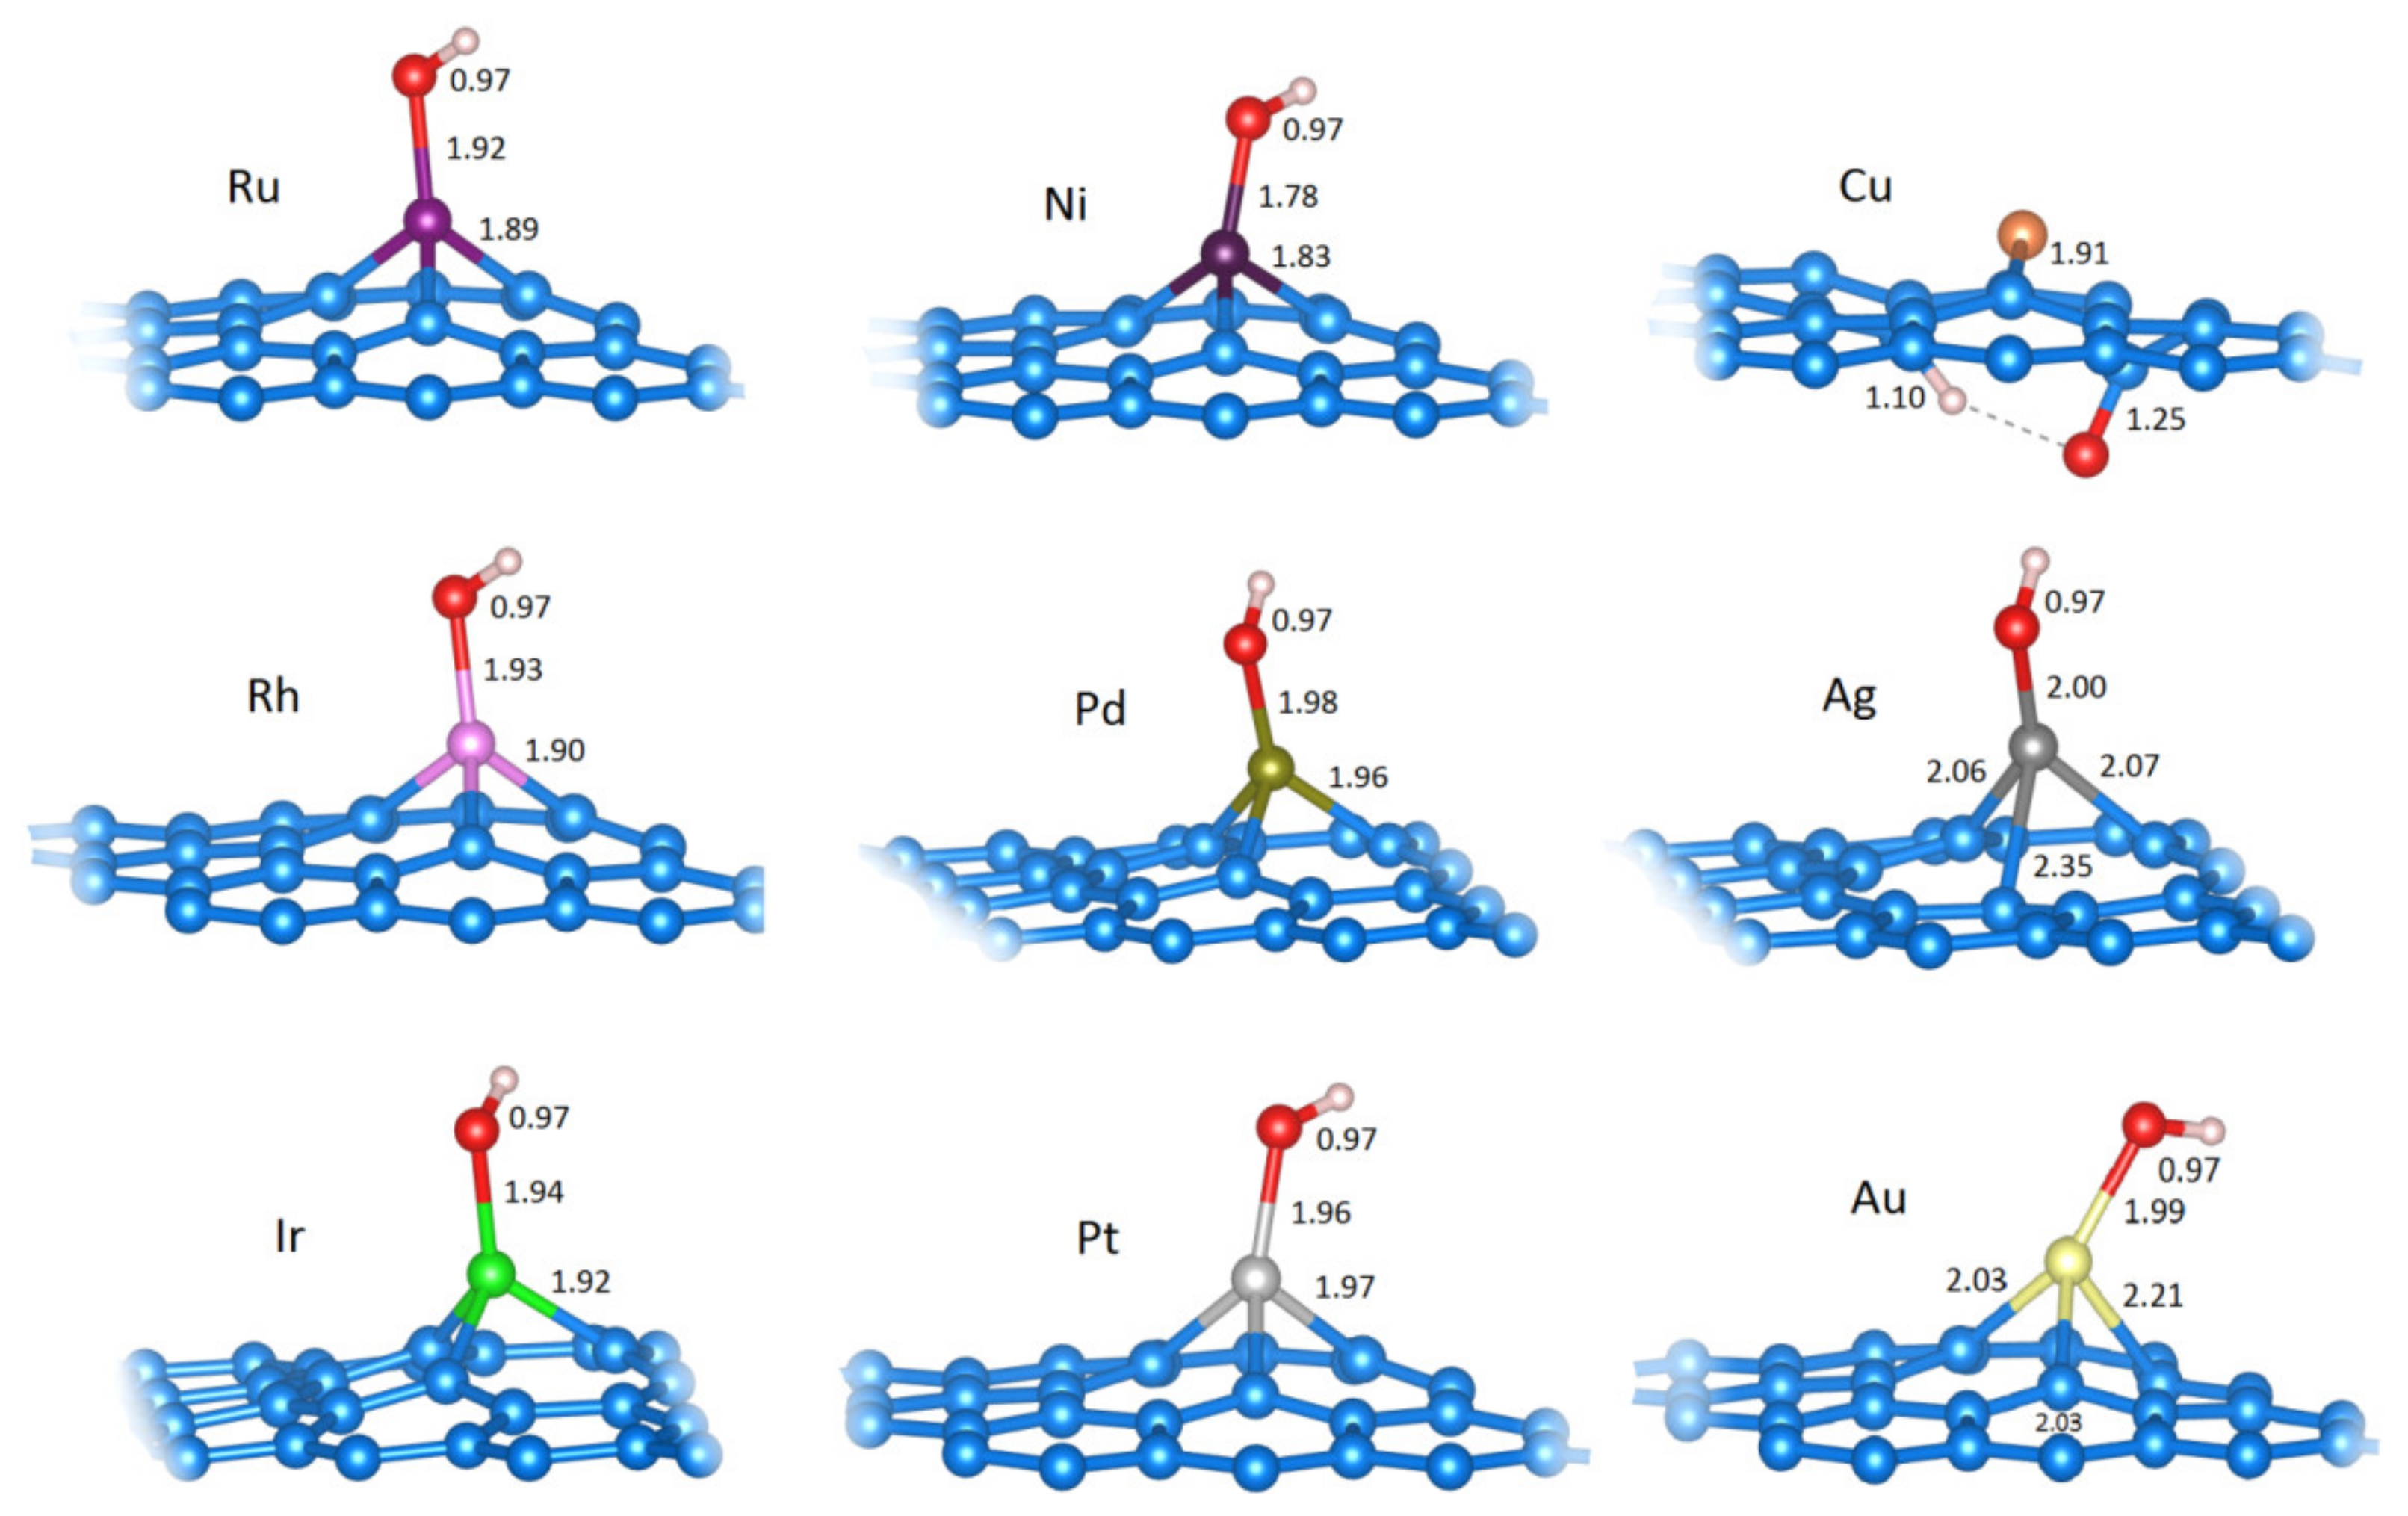
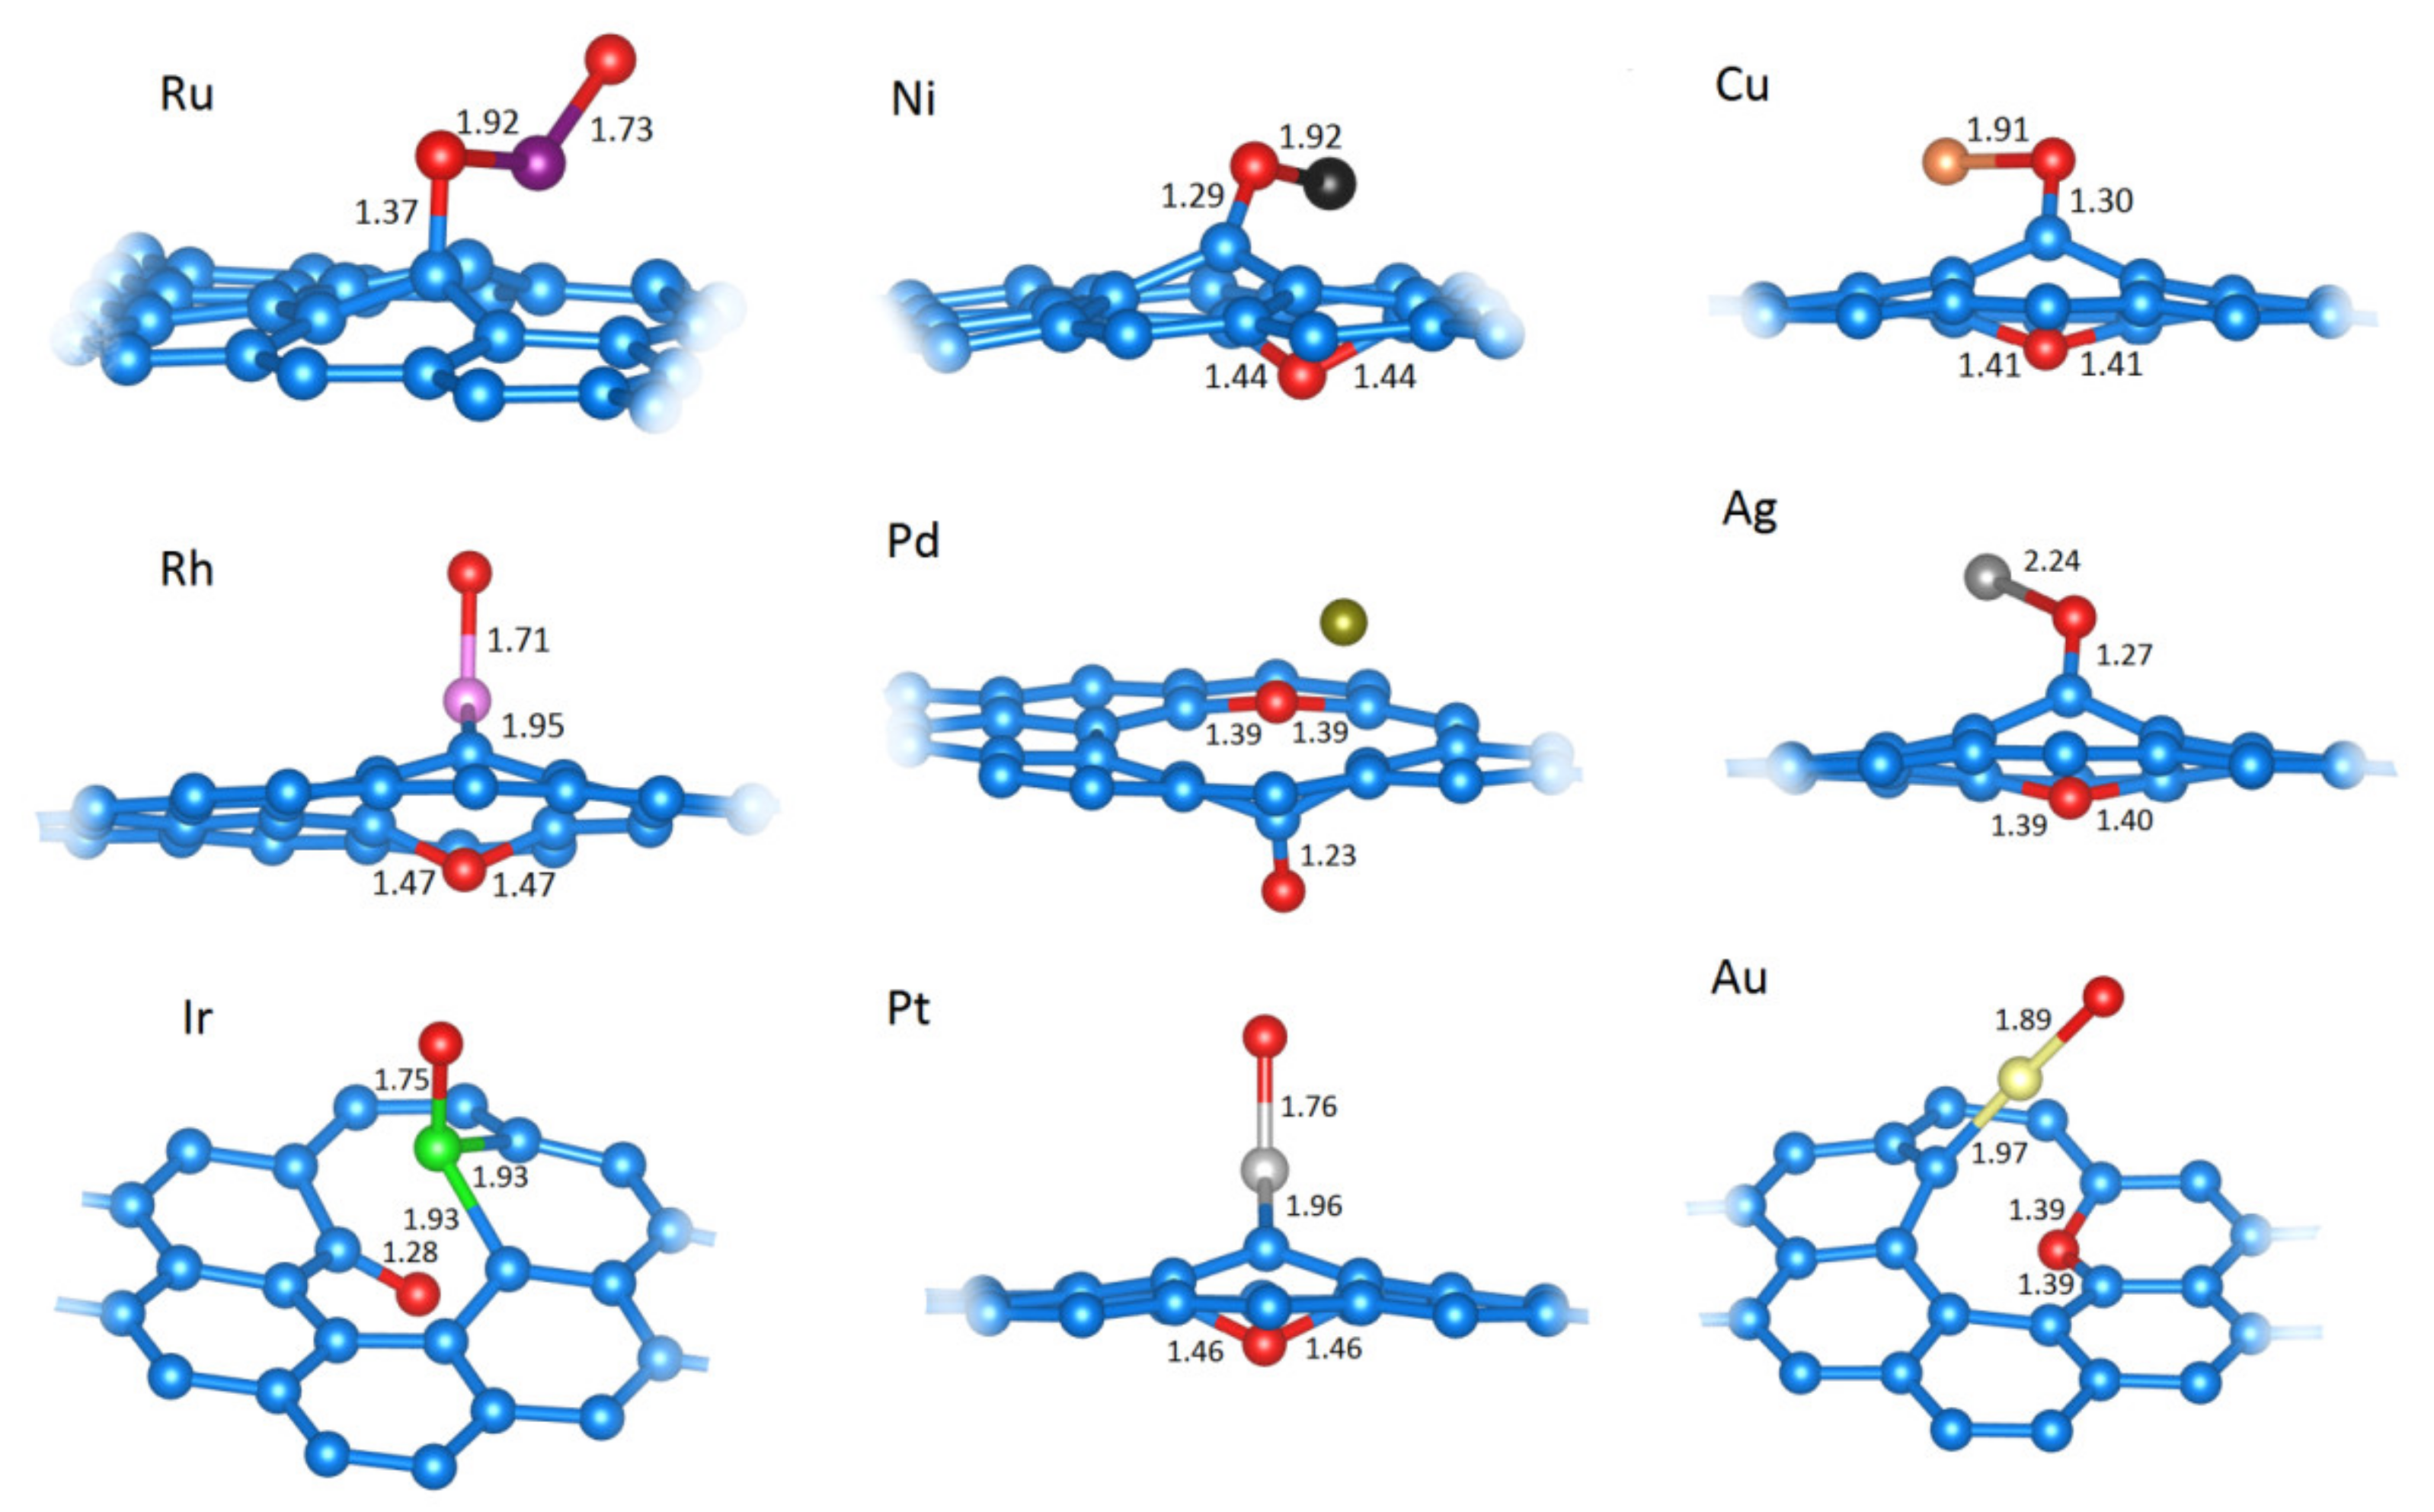
2.2.2. OH Adsorption (OH−M@vG)

The OH adsorption energies, referred to as the isolated OH radical, are generally more negative than Eads(H), suggesting a stronger M−OH bond than the M−H bond (Table 3). In all of the systems where OH is bonded directly to the metal center, except for Pd@vG, the partial charge of the metal is lower than in pristine SACs. However, for Cu@vG, we observed an interesting ground state where OH is not bonded to Cu but is instead dissociated and bonded to the carbon atoms adjacent to the Cu center (Figure 5). This finding is a strong indication that exposing Cu@vG to oxidizing conditions could cause the corrosion of the carbon lattice instead of the oxidation of the metal center.

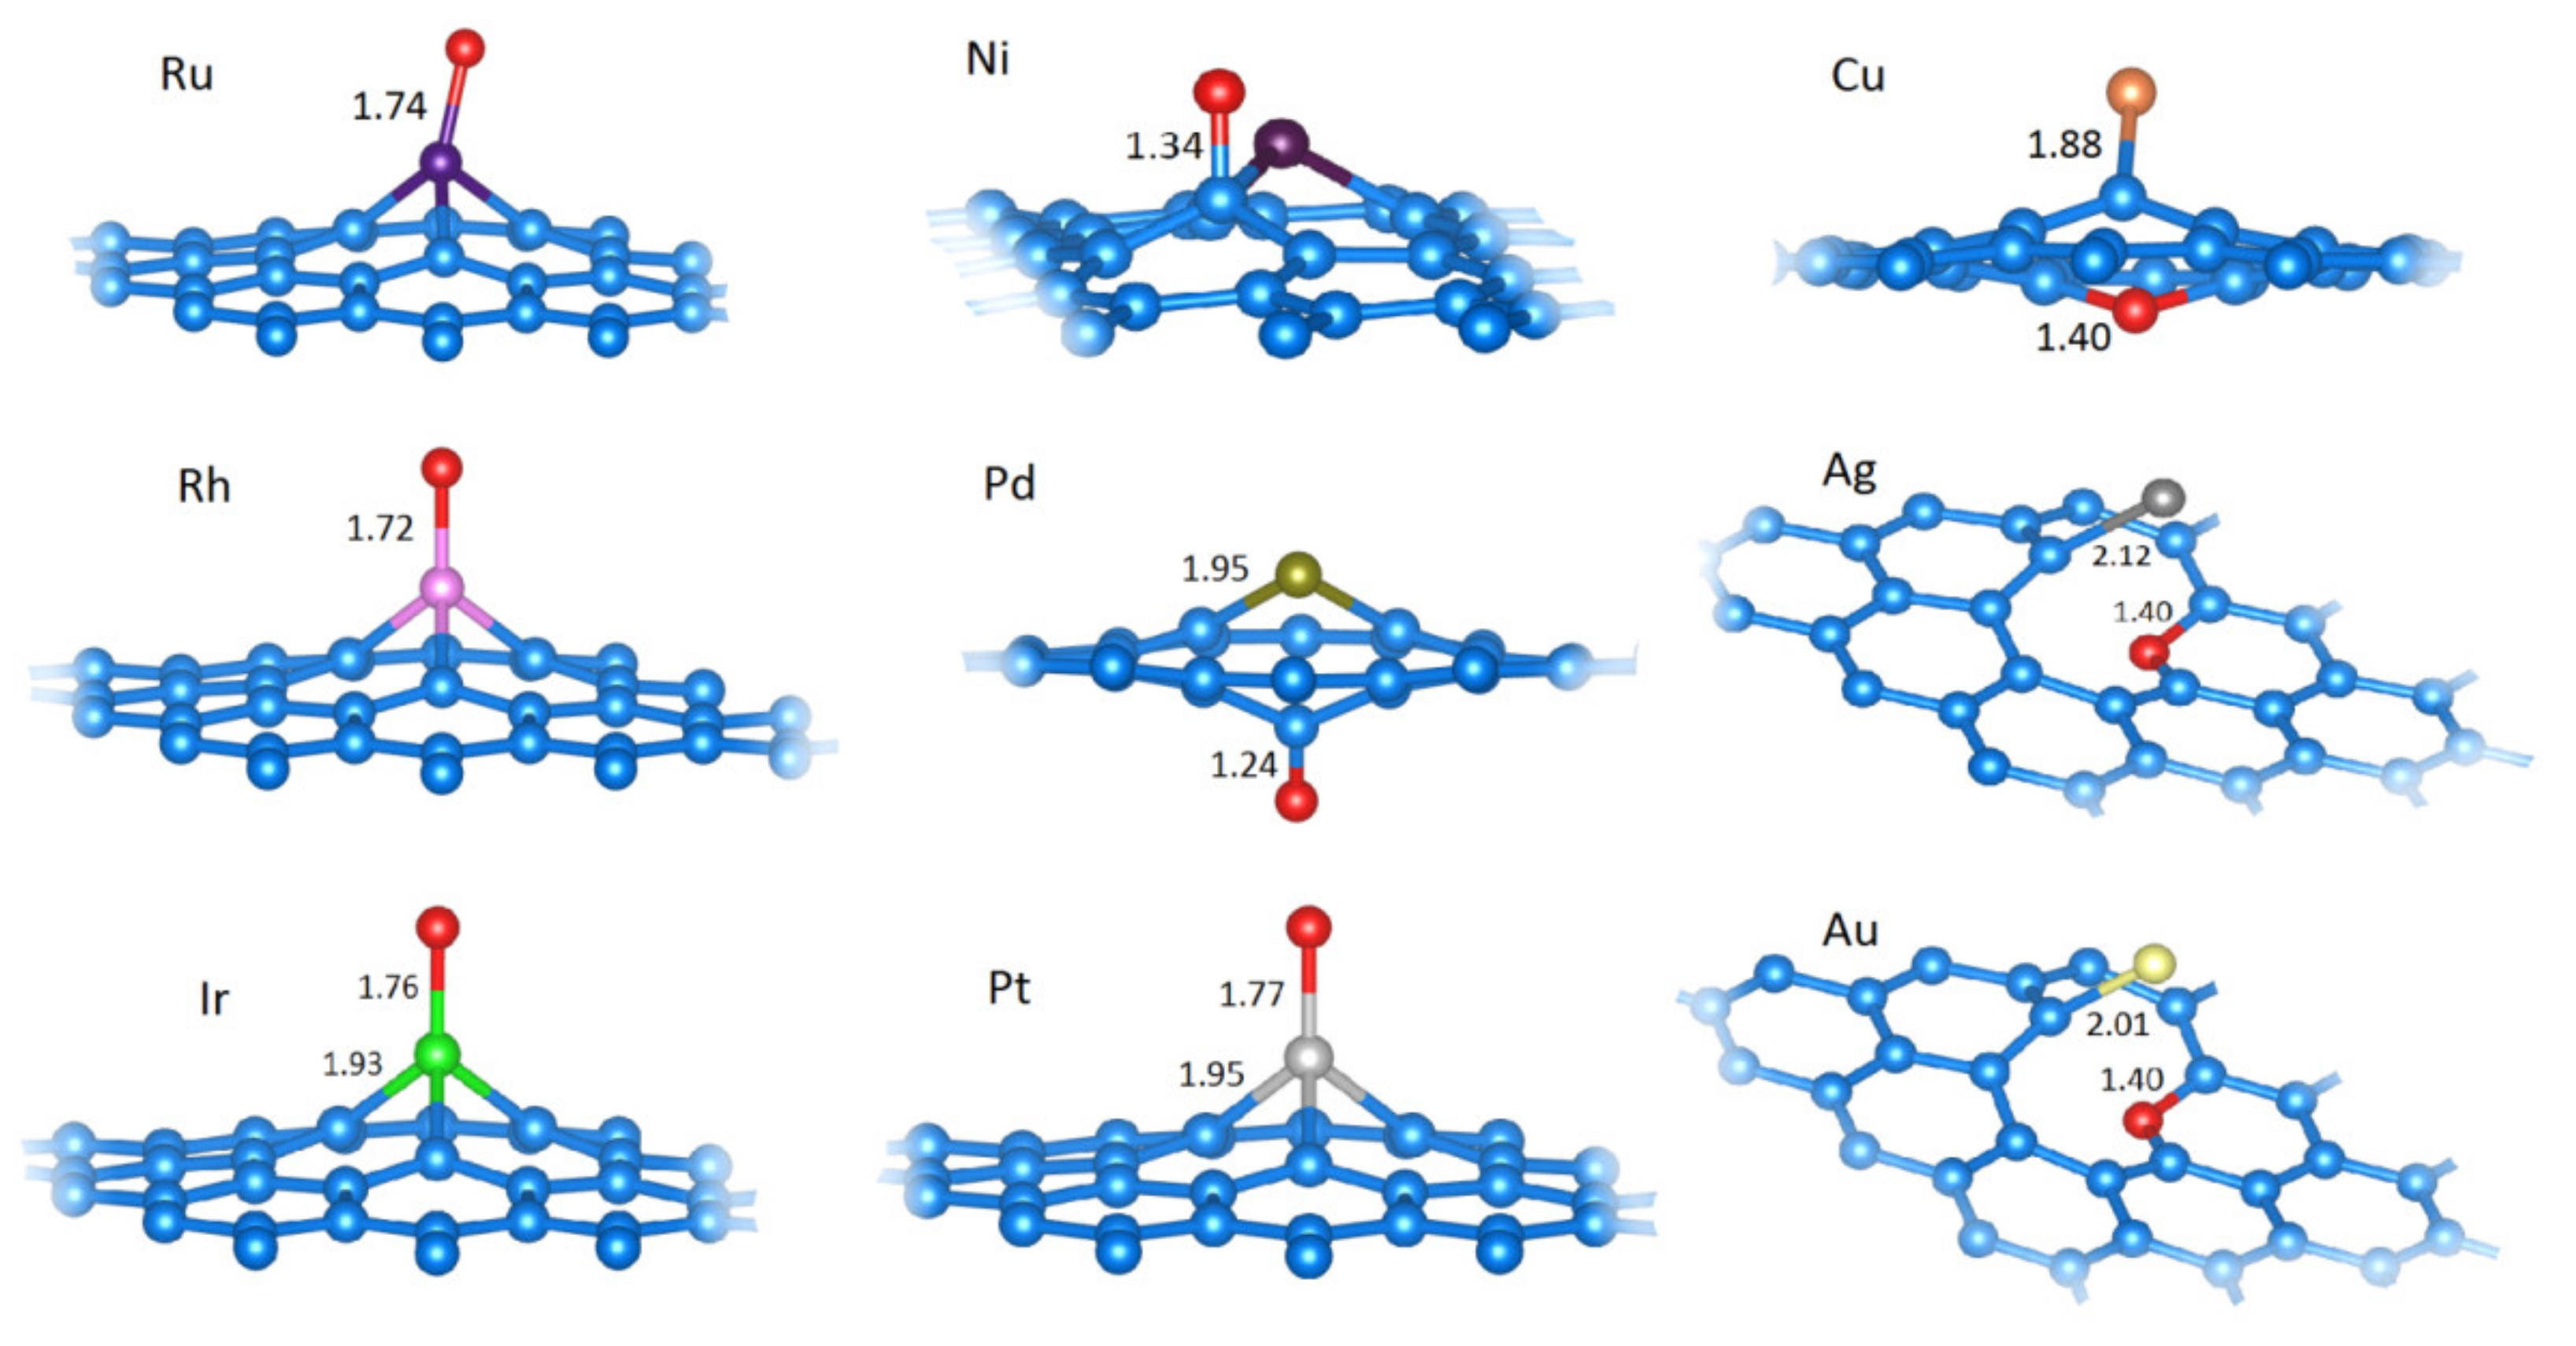
2.2.3. O Adsorption (O−M@vG)

The studied model SACs bind to the O atom very strongly (Table 4). However, in comparison to OH adsorption and particularly H adsorption, the situation is much less uniform. Ru, Rh, Ir, and Pt SACs bind O directly at the metal center (Figure 6). Ni and Pd SACs do not bind to O directly, but they do bind at the C atom adjacent to the metal center (Figure 6). In these cases, the coordination of Pd and Ni by the surrounding carbon atoms reduces from three (pristine SACs) to two, and the C−M−C bridge is formed. For the coinage metals, the metal center coordination numbers are reduced to one (Figure 6), while oxygen atoms are incorporated into the vacancy, resulting in the formation of a pyran-like ring. For these metals, while the system is overall oxidized, the metal center itself is reduced, increasing its partial charge compared to the corresponding pristine SACs (Table 4). In contrast, the metal centers that directly bind O become oxidized as they lose an appreciable amount of charge (Table 4, Ru, Rh, Ir, Pt).

2.2.4. Extensive Oxidation of M@vG (2O−M@vG)

The results presented p until this point indicate that the metal centers and the surrounding carbon atoms in SACs are sensitive to oxidation. While the oxidation beyond Equation (4) is not considered in the construction of the surface Pourbaix plots (for the reasons explained later on), here, we present the results considering the addition of one more oxygen atom to the O−M@vG systems (Table 5, Figure 7). The scenario considered in this section could be operative upon the exposure of SACs to the O2-rich atmosphere. As seen from differential adsorption energies (Table 5), O−M@vG systems are prone to further oxidation and bind to O easily. However, this process has devastating consequences on the structure of SACs (Figure 7). In some cases, M can be completely ejected from the vacancy site, while the carbon lattice accepts oxygen atoms. Thus, considering the results presented here, the reactivity of M centers in SACs can be considered both a blessing and a curse. Namely, besides the desired reaction, M centers also present the sites where corrosion starts and, ultimately, lead to irreversible changes and the loss of activity.

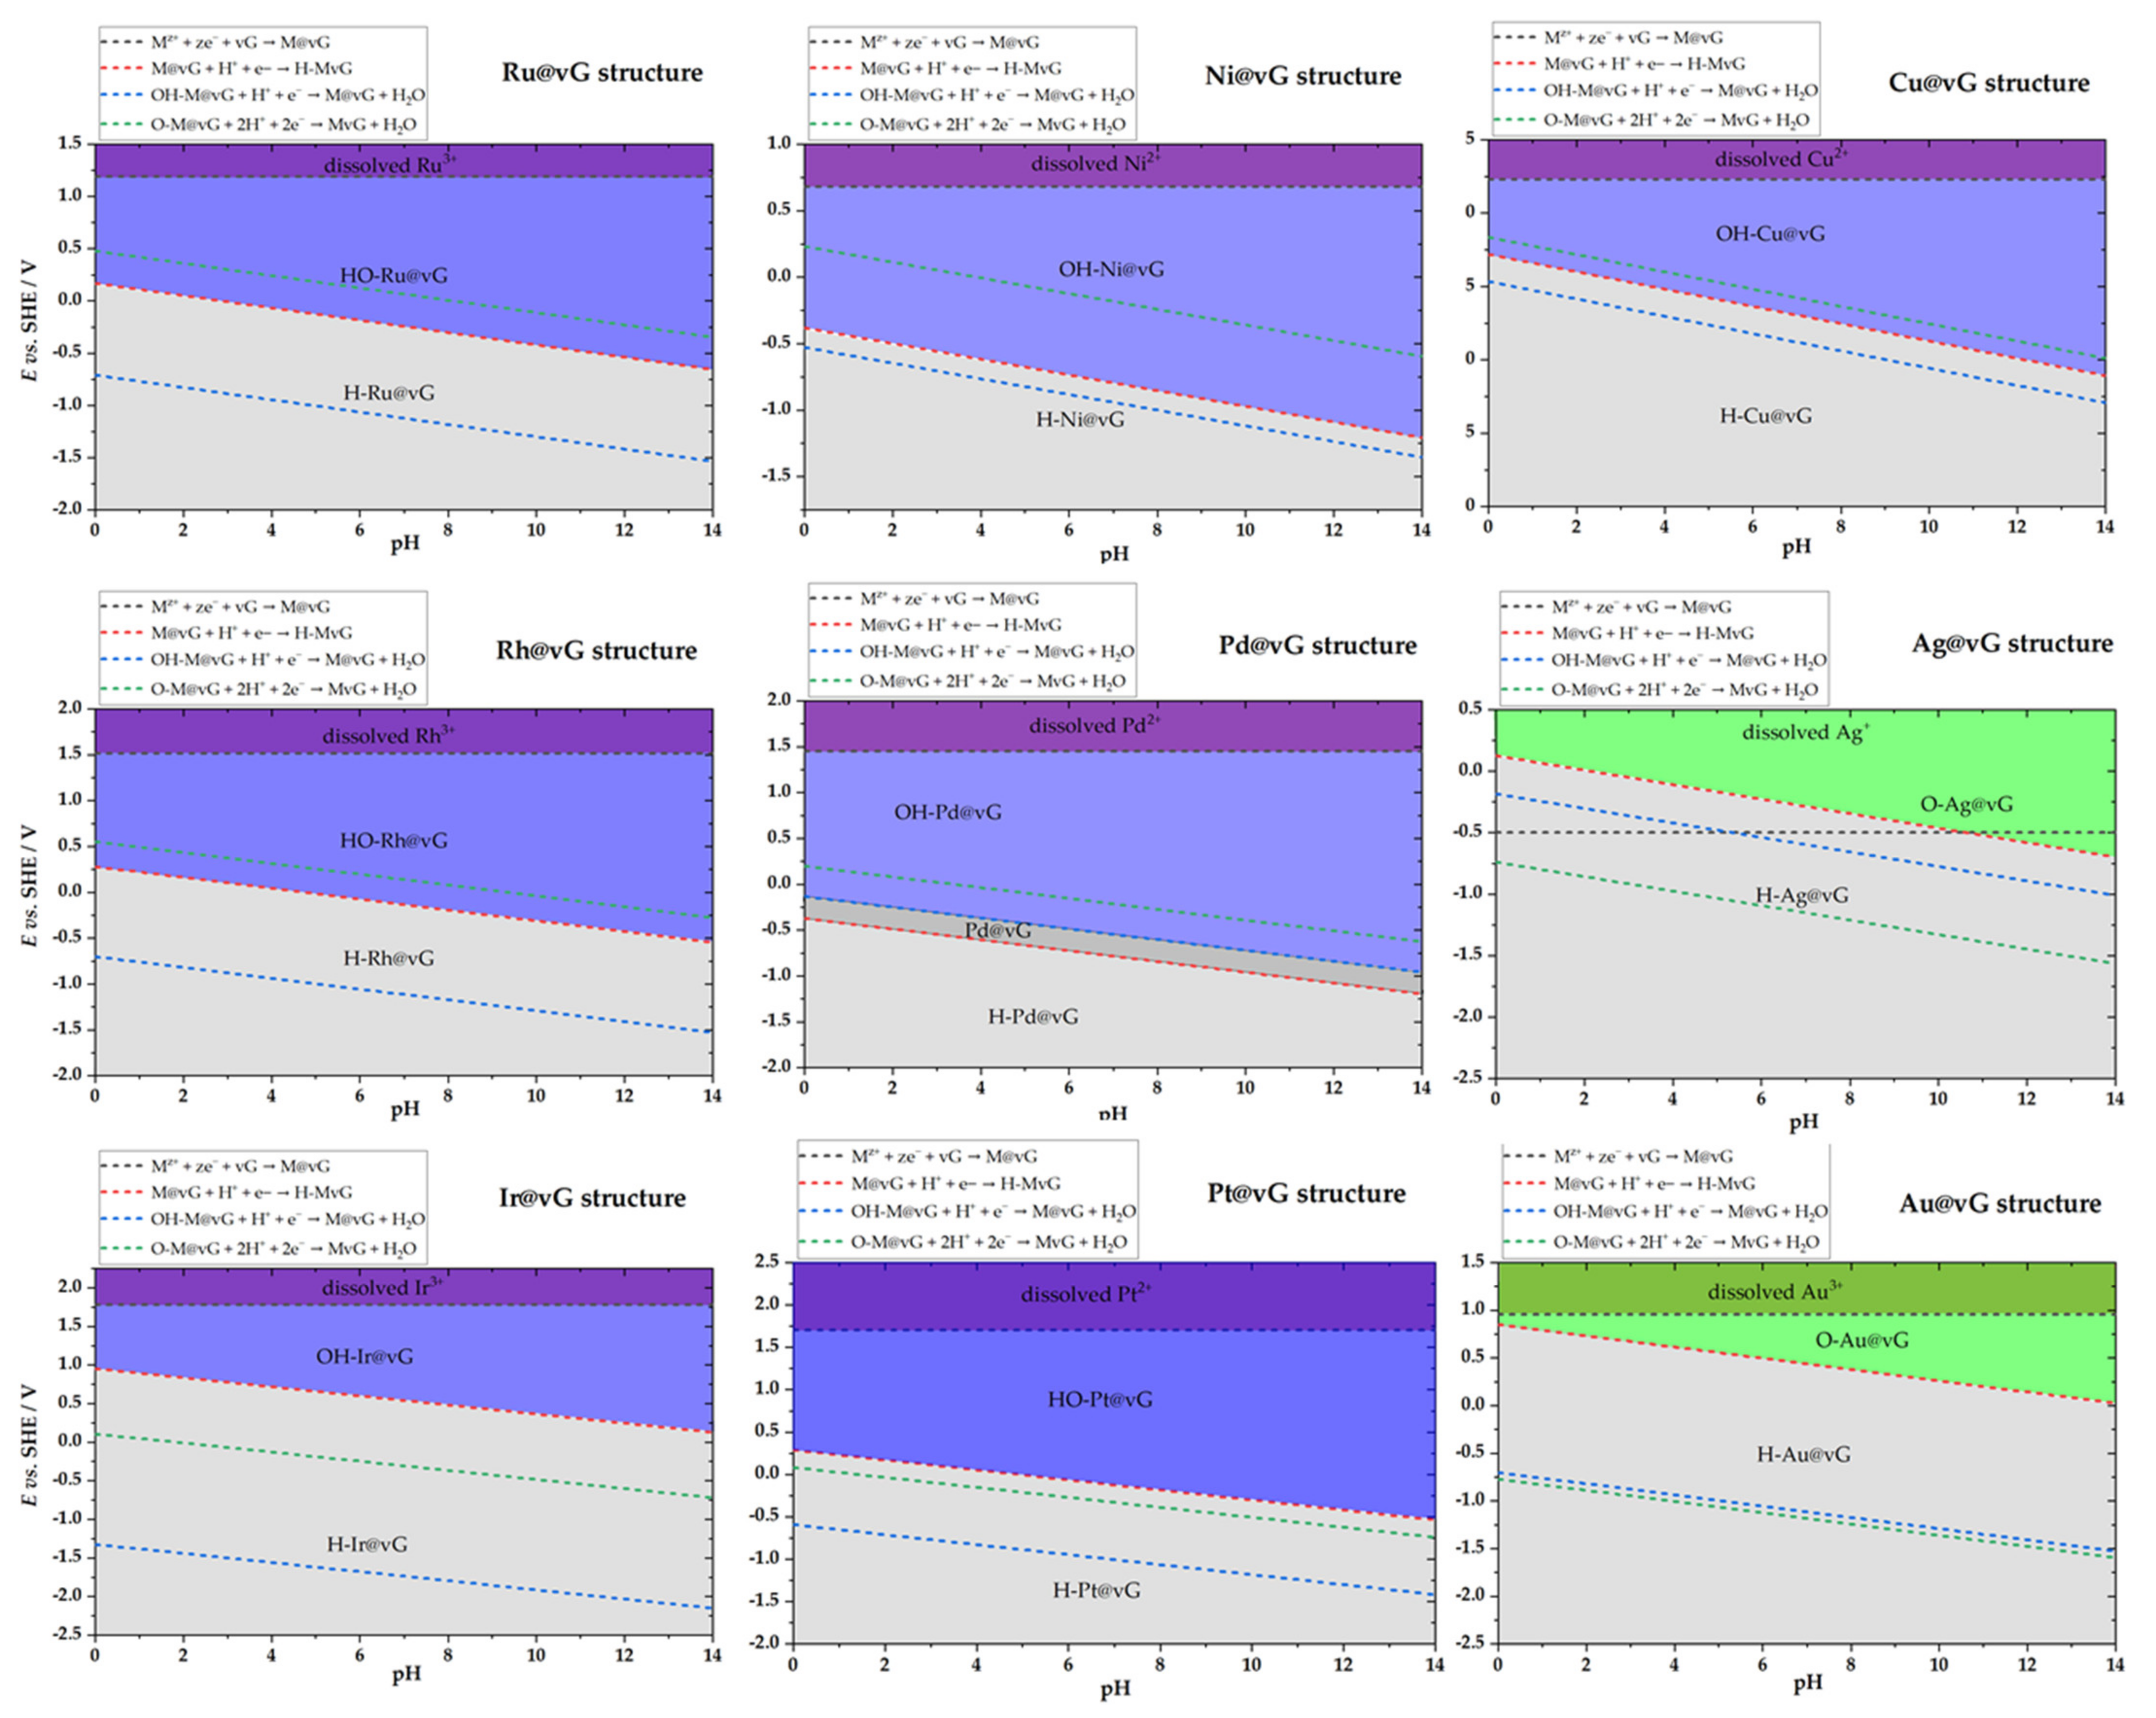
2.3. Surface Pourbaix Plots for M@vG Catalysts

Using the results obtained for the M@vG, H−M@vG, HO−M@vG, and O−M@vG systems, the surface Pourbaix plots for the studied model SACs were constructed. The construction of the Pouraix plots was completed in several steps. First, using calculated standard redox potentials for the reactions described by Equations (1)–(4) and the corresponding Nernst equations (Equations (R1)–(R4)), the equilibrium redox potentials were calculated for a pH from 0 to 14. Metal dissolution, Equation (R1), is not pH-dependent, but Hads and OHads formation are, and the slope of the equilibrium potential versus the pH line is 0.059 mV per pH unit in all the cases. Then, the stable phases are identified following the rule that the most stable oxidized phase has the lowest equilibrium potential, while the most stable reduced phase is the one with the highest equilibrium potential. For example, in the case of Ru@vG at pH = 0, the most stable reduced phase is Hads-Ru@vG up to the potential of 0.17 V vs. a standard hydrogen electrode (Figure 8). Above this potential, bare Ru@vG should be stable. However, the potential for the formation of OHads-Ru@vG is below the potential of the Ru@vG/Hads-Ru@vG couple. This means that the state of the Ru-center immediately switches to OHads-Ru@vG. The OHads-Ru@vG phase is the most stable oxidized phase, as it has the lowest redox potential. In the case of Pd@vG, the potential for the OHads-Pd@vG/ Pd@vG couple is above the one for the Pd@vG/Hads-Ru@vG couple, and there is a narrow pH-potential region where the Pd site is bare. The obtained plots for all of the studied model SACs are presented in Figure 8. Regarding electrochemical applications, we note that all of the systems considered in Section 2.2.1, Section 2.2.2 and Section 2.2.3 are conductive, as seen from the corresponding DOS plots (no bandgap, Supplementary Materials, Figures S1–S3).
While we are aware that the picture presented by Equations (1)–(4) is relatively simple, it is sufficient to capture the essential message provided by the obtained surface Pourbaix plots. As it can be seen, none of the SACs studied here can be considered as being in the pristine M@vG model under electrochemical conditions. Within the water stability window, the metal sites are either covered with hydrogen, or the SAC is oxidized in some way—either at the metal center or the carbon lattice.

3. Discussion

Based on the presented results, it can be concluded that the actual state of SACs under electrochemical conditions is more complex than in theoretical models. While this conclusion is not surprising, it also points that it is expected that the data obtained under UHV conditions during the SACs characterization could show a completely different picture than the actual one. Our results suggest that considered model SACs are either covered by Hads or are oxidized in some way in the water stability region (formed OHads or Oads). Metal dissolution is also possible for some of them in a certain potential-pH range (Ni, Cu, Ag, and Au), but thermodynamically speaking, these metals are anodically protected. Ru, Rh, and Ir centers are either covered by Hads or OHads. The situation is similar for Ni and Pt. In an aqueous solution, Ni is practically always in the oxidized form (OH−Ni@vG). Pt@vG is covered by Hads at low potentials, while the state switches to the oxidized form at potentials close to the “double layer” region of bulk Pt surfaces [38,43]. It is the same for Pd, where there is a narrow potential region in which the Pd center is bare. However, this region is below the potential of H2 evolution. Otherwise, Pd is covered by OHads. In the coinage metal group, Cu behavior is similar to that of Ni. The low stability of Ag and Au at the graphene vacancy (Figure 2) makes these SACs impractical, and they will not be discussed any further. However, their state switches from Hads-covered to Oads-covered.
The obtained results have implications in terms of both the theoretical modelling of SACs and their practical applications. While the current study is restricted to the metal embedded in the graphene single vacancy site, it should be noted that recently, it was shown that oxygen reconstitutes the Cu-N2C2 site in Cu-based SACs and that Cu-N2C2-O site is the actual active species of alkaline ORR, while the oxygen reconstitution process is not operative at a low pH [12]. Such oxygen reconstitution is seen here as well (Figure 5 and Figure 6) for Cu@vG. Moreover, the online ICP-MS showed that the dissolution behavior of as-synthesized Pt SACs with S-containing carbon, as the support is significantly different from that of metallic Pt/C and that the SACs are more stable [16]. However, the S ligands, which stabilize Pt, are prone to oxidation at high potentials (1.5 V vs. RHE), leading to the loss of stability upon the leaching of S and its oxidation. However, the most straightforward confirmation of our conclusions regarding the importance of the realistic nature of SAC probably relates to the in operando characterization of FeN4-based SACs under ORR conditions [44]. While this class of SACs is different from the one we investigated, it is of the utmost importance to emphasize that the ORR activities of FeN4-based SACs were dictated by the dynamic structure associated with the Fe(2+/3+) redox transition and not the static structure of the bare sites. In this specific work, the Fe centers were found to be covered by Oads or OHads, depending on the potential in the ORR overpotential range [44].
Overall, the results presented here and in previously published experimental findings [12,16,44] indicate that theoretical models for SACs should be carefully set to match realistic operating conditions. Moreover, UHV characterization results must be taken with care when interpreting the electrochemical performance of SACs. In fact, the in situ characterization techniques might be a better choice for extracting SAC properties. Finally, this approach for modelling and evaluating SACs could help us better understand the nature of active sites in these advanced catalysts and point to new strategies for designing single-atom catalysts. To emphasize the importance of considering the state of SACs under realistic conditions, we point to Figure 9. For both Ni@vG and Cu@vG, there is a tremendous impact on the electronic structure upon the oxidation of the metal center according to reaction (1). The well-known relationship between the electronic structure and catalytic activity [45] makes knowing the exact state of the metal centers under electrochemical conditions essential.

4. Materials and Methods

Graphene with a single vacancy (vG) was obtained by removing one C atom from the graphene plane modelled using a 4 × 4 cell (C32) and relaxing the structure. The 4 × 4 cell was previously confirmed as being large enough to provide valid results for the purposes of this study [30] and Ref. [31]. M@vG systems (C31M) were obtained by embedding metal atoms into the single-vacancy site of vG.
The first-principle DFT calculations were performed using the Vienna ab initio simulation code (VASP) [46,47,48]. The generalized gradient approximation (GGA) in the parametrization by Perdew, Burk, and Ernzerhof [49] combined with the projector augmented wave (PAW) method was used [50]. The cut-off energy of 600 eV and Gaussian smearing with a width of σ = 0.025 eV for the occupation of the electronic levels were used. A Monkhorst–Pack Γ-centered 10 × 10 × 1 k-point mesh was used. Chosen metal atoms were placed at the SV site, and during structural optimization, the relaxation of all of the atoms in the simulation cell was allowed. The relaxation proceeded until the Hellmann–Feynman forces acting on all the atoms became smaller than 10−2 eV Å−1. Spin polarization was included in all calculations. To include dispersion interactions, which are not accounted for in PBE, we used the DFT+D3 approach of Grimme [51], which corrects the total energy by a pairwise term.
The energy of the metal atom embedding into the single vacancy site of graphene is quantified as its embedding energy:
Eemb(M) = E0[M@vG] − E0[vG] − E0[M],
where E0 is the ground state energy of the metal adsorbed on the single vacancy site of graphene [M@vG], graphene with a single vacancy [vG], and isolated metal atom [M]. After obtaining M@vG systems by M embedding into vG, we probed their reactivity using H, O, and OH as adsorbates. The reactivity of the M@vG systems is described by the adsorption energy of these species, calculated analogously to Eemb(M):
Eads(A) = E0[A-M@vG] − E0[M@vG] − E0[A],
where E0 is the ground state energy of the adsorbate (A = H, O or OH) adsorbed on M@vG [A−M@vG], the M@vG system [M@vG], and isolated adsorbate [A]. Negative Eads indicates exothermic adsorption.
Vibrational analysis was used to confirm that the relaxed systems are in their stable ground states and to evaluate zero-point energies (ZPE) and vibrational contributions to the entropy (TSvib). Then, the standard potentials (vs. standard hydrogen electrode) were calculated for the reactions given by Equations (2)–(4) using the total energies of the individual systems (Etot), zero-point energies, and vibrational entropy contributions (at 298 K), using the computational hydrogen electrode approach [20]. In other words, the equilibrium of the hydrogen electrode is considered:
H+ + e ↔ H2(g),
Matching the electrochemical potential of (H+ + e) to that of H2 at pH = 0. Further, for each of the competing phases I, the chemical potential (μi) was calculated as:
μi = Etot + ZPE − TSvib,
The effects of electric field were disregarded, as explained in ref. [25]. To obtain the chemical potential of liquid water, we calculated its chemical potential at the gas phase at 298 K and 1 atm and then corrected it by means of the Gibbs free energy change (ΔG) for evaporation under specified conditions. When the chemical potentials for all phases were obtained, the equilibrium potentials for reactions (1)–(4) were calculated by taking the given reaction (Equations (1)–(4)) as a cathode in a hypothetical galvanic cell with a hydrogen electrode as anode, similar to the approach used in [26]. First, the Gibbs free energy changes (ΔG) were calculated for each reaction as:
Δ G = i , products μ i i , reactants μ i ,
The electromotive force of a hypothetical galvanic cell is obtained by dividing calculated ΔG (in eV) with the number of electrons exchanged in the reaction. As the anode is a standard hydrogen electrode, Equation (7), and its standard potential is 0 V, the obtained values are numerically equal to the standard electrode potentials for reaction (2)–(4). For the reaction given by Equation (1), the dissolution potential of M from vG was calculated using the approach described in Ref. [31], considering a hypothetical galvanic cell where one electrode is a massive piece of metal M, while the other is M@vG electrode. For a full description, the reader is referred to ref. [31]. While constructing the surface Pourbaix plots, we kept the concentration of [Mz+] = 1 × 10⁻⁸ mol dm−3.

5. Conclusions

Developing novel electrocatalysts requires an understanding of the nature of the active sites under operating conditions. Our DFT-based modelling of SACs comprised of single metal atoms embedded in graphene monovacancy suggests that under realistic conditions, the nature of metal sites changes, and metal centers are covered with adsorbed H, OH, or O, depending on the electrode potential and pH. We suggest that these changes of the active site architecture under operating conditions must be considered when modelling SACs and when interpreting the results of the ex situ physical and chemical characterization of SACs but should also be taken into account when designing novel SACs.

Supplementary Materials

The following are available online at https://www.mdpi.com/article/10.3390/catal11101207/s1, Figure S1: Densities of states for the investigated MG systems with adsorbed hydrogen, Figure S2: Densities of states for the investigated MG systems with adsorbed OH, Figure S3: Densities of states for the investigated MG systems with adsorbed O.

Author Contributions

Conceptualization, S.V.M. and I.A.P.; data curation, I.A.P.; formal analysis, A.S.D. and T.Đ.; funding acquisition, N.V.S. and I.A.P.; investigation, A.S.D. and T.Đ.; methodology, A.S.D., S.V.M., N.V.S. and I.A.P.; resources, N.V.S.; writing—original draft, A.S.D., T.Đ. and I.A.P.; writing—review and editing, A.S.D., S.V.M., N.V.S. and I.A.P. All authors have read and agreed to the published version of the manuscript.

Funding

This research was funded by the Science Fund of the Republic of Serbia (PROMIS project RatioCAT); the NATO Science for Peace and Security Programme, grant G5729; the Ministry of Education, Science and Technological Development of the Republic of Serbia (Contract No. 451-03-68/2020-14/200146); the Carl Tryggers Foundation for Scientific Research (grant no. 18:177), Sweden; and Swedish Research Council (grant no. 2019-05580). The computations and data handling were enabled by resources provided by the Swedish National Infrastructure for Computing (SNIC) at the National Supercomputer Centre (NSC) at Linköping University, partially funded by the Swedish Research Council through grant agreement No. 2018-05973.

Data Availability Statement

The data are available upon request from the authors.

Conflicts of Interest

Authors declare no conflict of interest.

References

  1. Yang, X.-F.; Wang, A.; Qiao, B.; Li, J.; Liu, J.; Zhang, T. Single-Atom Catalysts: A New Frontier in Heterogeneous Catalysis. Acc. Chem. Res. 2013, 46, 1740–1748. [Google Scholar] [CrossRef]
  2. Zhang, H.; Liu, G.; Shi, L.; Ye, J. Single-Atom Catalysts: Emerging Multifunctional Materials in Heterogeneous Catalysis. Adv. Energy Mater. 2018, 8, 1701343. [Google Scholar] [CrossRef]
  3. Liang, S.; Hao, C.; Shi, Y. The Power of Single-Atom Catalysis. ChemCatChem 2015, 7, 2559–2567. [Google Scholar] [CrossRef]
  4. Hossain, M.D.; Liu, Z.; Zhuang, M.; Yan, X.; Xu, G.L.; Gadre, C.A.; Tyagi, A.; Abidi, I.H.; Sun, C.J.; Wong, H.; et al. Rational Design of Graphene-Supported Single Atom Catalysts for Hydrogen Evolution Reaction. Adv. Energy Mater. 2019, 9, 1803689. [Google Scholar] [CrossRef]
  5. Cheng, N.; Stambula, S.; Wang, D.; Banis, M.N.; Liu, J.; Riese, A.; Xiao, B.; Li, R.; Sham, T.K.; Liu, L.M.; et al. Platinum single-atom and cluster catalysis of the hydrogen evolution reaction. Nat. Commun. 2016, 7, 1–9. [Google Scholar] [CrossRef]
  6. Pu, Z.; Amiinu, I.S.; Cheng, R.; Wang, P.; Zhang, C.; Mu, S.; Zhao, W.; Su, F.; Zhang, G.; Liao, S.; et al. Single-Atom Catalysts for Electrochemical Hydrogen Evolution Reaction: Recent Advances and Future Perspectives. Nano-Micro Lett. 2020, 12, 1–29. [Google Scholar] [CrossRef] [Green Version]
  7. Kim, J.; Kim, H.-E.; Lee, H. Single-Atom Catalysts of Precious Metals for Electrochemical Reactions. ChemSusChem 2018, 11, 104–113. [Google Scholar] [CrossRef]
  8. Zhu, C.; Shi, Q.; Feng, S.; Du, D.; Lin, Y. Single-Atom Catalysts for Electrochemical Water Splitting. ACS Energy Lett. 2018, 3, 1713–1721. [Google Scholar] [CrossRef]
  9. Gutić, S.J.; Dobrota, A.S.; Fako, E.; Skorodumova, N.V.; López, N.; Pašti, I.A. Hydrogen Evolution Reaction-From Single Crystal to Single Atom Catalysts. Catalysts 2020, 10, 290. [Google Scholar] [CrossRef] [Green Version]
  10. Song, P.; Luo, M.; Liu, X.; Xing, W.; Xu, W.; Jiang, Z.; Gu, L. Zn Single Atom Catalyst for Highly Efficient Oxygen Reduction Reaction. Adv. Funct. Mater. 2017, 27, 1700802. [Google Scholar] [CrossRef]
  11. Cui, L.; Cui, L.; Li, Z.; Zhang, J.; Wang, H.; Lu, S.; Xiang, Y. A copper single-atom catalyst towards efficient and durable oxygen reduction for fuel cells. J. Mater. Chem. A 2019, 7, 16690–16695. [Google Scholar] [CrossRef]
  12. Yang, L.; Xu, H.; Liu, H.; Zeng, X.; Cheng, D.; Huang, Y.; Zheng, L.; Cao, R.; Cao, D. Oxygen-Reconstituted Active Species of Single-Atom Cu Catalysts for Oxygen Reduction Reaction. Research 2020, 2020, 7593023. [Google Scholar] [CrossRef]
  13. Zhang, J.; Liu, J.; Xi, L.; Yu, Y.; Chen, N.; Sun, S.; Wang, W.; Lange, K.M.; Zhang, B. Single-Atom Au/NiFe Layered Double Hydroxide Electrocatalyst: Probing the Origin of Activity for Oxygen Evolution Reaction. J. Am. Chem. Soc. 2018, 140, 3876–3879. [Google Scholar] [CrossRef]
  14. Zhang, Z.; Feng, C.; Li, X.; Liu, C.; Wang, D.; Si, R.; Yang, J.; Zhou, S.; Zeng, J. In-Situ Generated High-Valent Iron Single-Atom Catalyst for Efficient Oxygen Evolution. Nano Lett. 2021, 21, 4795–4801. [Google Scholar] [CrossRef]
  15. Wang, K.; Wang, X.; Liang, X. Synthesis of High Metal Loading Single Atom Catalysts and Exploration of the Active Center Structure. ChemCatChem 2021, 13, 28–58. [Google Scholar] [CrossRef]
  16. Speck, F.D.; Paul, M.T.Y.; Ruiz-Zepeda, F.; Gatalo, M.; Kim, H.; Kwon, H.C.; Mayrhofer, K.J.J.; Choi, M.; Choi, C.H.; Hodnik, N.; et al. Atomistic Insights into the Stability of Pt Single-Atom Electrocatalysts. J. Am. Chem. Soc. 2020, 142, 15496–15504. [Google Scholar] [CrossRef]
  17. Stamenkovic, V.R.; Fowler, B.; Mun, B.S.; Wang, G.; Ross, P.N.; Lucas, C.A.; Markovic, N.M. Improved oxygen reduction activity on Pt3Ni(111) via increased surface site availability. Science 2007, 315, 493–497. [Google Scholar] [CrossRef] [Green Version]
  18. Stamenkovic, V.R.; Mun, B.S.; Arenz, M.; Mayrhofer, K.J.J.; Lucas, C.A.; Wang, G.; Ross, P.N.; Markovic, N.M. Trends in electrocatalysis on extended and nanoscale Pt-bimetallic alloy surfaces. Nat. Mater. 2007, 6, 241–247. [Google Scholar] [CrossRef]
  19. Stamenkovic, V.; Mun, B.S.; Mayrhofer, K.J.J.; Ross, P.N.; Markovic, N.M.; Rossmeisl, J.; Greeley, J.; Nørskov, J.K. Changing the Activity of Electrocatalysts for Oxygen Reduction by Tuning the Surface Electronic Structure. Angew. Chem. 2006, 118, 2963–2967. [Google Scholar] [CrossRef]
  20. Nørskov, J.K.; Rossmeisl, J.; Logadottir, A.; Lindqvist, L.; Kitchin, J.R.; Bligaard, T.; Jónsson, H. Origin of the overpotential for oxygen reduction at a fuel-cell cathode. J. Phys. Chem. B 2004, 108, 17886–17892. [Google Scholar] [CrossRef]
  21. Markovic, N.M.; Gasteiger, H.A.; Ross, P.N. Oxygen reduction on platinum low-index single-crystal surfaces in sulfuric acid solution. Rotating ring—Pt(hkl) disk studies. J. Phys. Chem. 1995, 99, 3411–3415. [Google Scholar] [CrossRef]
  22. Marković, N.M.; Gasteiger, H.A.; Ross, P.N. Oxygen reduction on platinum low-index single-crystal surfaces in alkaline solution: Rotating ring disk Pt(hkl) studies. J. Phys. Chem. 1996, 100, 6715–6721. [Google Scholar] [CrossRef]
  23. Minguzzi, A.; Fan, F.R.F.; Vertova, A.; Rondinini, S.; Bard, A.J. Dynamic potential–pH diagrams application to electrocatalysts for water oxidation. Chem. Sci. 2011, 3, 217–229. [Google Scholar] [CrossRef] [Green Version]
  24. Zeng, Z.; Chan, M.K.Y.; Zhao, Z.-J.; Kubal, J.; Fan, D.; Greeley, J. Towards First Principles-Based Prediction of Highly Accurate Electrochemical Pourbaix Diagrams. J. Phys. Chem. C 2015, 119, 18177–18187. [Google Scholar] [CrossRef]
  25. Hansen, H.A.; Rossmeisl, J.; Nørskov, J.K. Surface Pourbaix diagrams and oxygen reduction activity of Pt, Ag and Ni(111) surfaces studied by DFT. Phys. Chem. Chem. Phys. 2008, 10, 3722–3730. [Google Scholar] [CrossRef] [PubMed]
  26. Marenich, A.V.; Majumdar, A.; Lenz, M.; Cramer, C.J.; Truhlar, D.G. Construction of Pourbaix Diagrams for Ruthenium-Based Water-Oxidation Catalysts by Density Functional Theory. Angew. Chem. Int. Ed. 2012, 51, 12810–12814. [Google Scholar] [CrossRef]
  27. Gossenberger, F.; Juarez, F.; Groß, A. Sulfate, Bisulfate, and Hydrogen Co-adsorption on Pt(111) and Au(111) in an Electrochemical Environment. Front. Chem. 2020, 8, 634. [Google Scholar] [CrossRef]
  28. Zagal, J.H.; Koper, M.T.M. Reactivity Descriptors for the Activity of Molecular MN4 Catalysts for the Oxygen Reduction Reaction. Angew. Chem. Int. Ed. 2016, 55, 14510–14521. [Google Scholar] [CrossRef]
  29. Krasheninnikov, A.V.; Lehtinen, P.O.; Foster, A.S.; Pyykkö, P.; Nieminen, R.M. Embedding transition-metal atoms in graphene: Structure, bonding, and magnetism. Phys. Rev. Lett. 2009, 102, 126807. [Google Scholar] [CrossRef] [Green Version]
  30. Santos, E.J.G.; Ayuela, A.; Sanchez-Portal, D. First-Principles Study of Substitutional Metal Impurities in Graphene: Structural, Electronic and Magnetic Properties. New J. Phys. 2010, 12, 053012. [Google Scholar] [CrossRef] [Green Version]
  31. Pašti, I.A.; Jovanović, A.; Dobrota, A.S.; Mentus, S.V.; Johansson, B.; Skorodumova, N.V. Atomic adsorption on graphene with a single vacancy: Systematic DFT study through the periodic table of elements. Phys. Chem. Chem. Phys. 2018, 20, 858–865. [Google Scholar] [CrossRef] [Green Version]
  32. Jiang, K.; Siahrostami, S.; Zheng, T.; Hu, Y.; Hwang, S.; Stavitski, E.; Peng, Y.; Dynes, J.; Gangisetty, M.; Su, D.; et al. Isolated Ni single atoms in graphene nanosheets for high-performance CO2 reduction. Energy Environ. Sci. 2018, 11, 893–903. [Google Scholar] [CrossRef]
  33. Jiang, K.; Siahrostami, S.; Akey, A.J.; Li, Y.; Lu, Z.; Lattimer, J.; Hu, Y.; Stokes, C.; Gangishetty, M.; Chen, G.; et al. Transition-Metal Single Atoms in a Graphene Shell as Active Centers for Highly Efficient Artificial Photosynthesis. Chem 2017, 3, 950–960. [Google Scholar] [CrossRef] [Green Version]
  34. Momma, K.; Izumi, F. VESTA: A three-dimensional visualization system for electronic and structural analysis. J. Appl. Crystallogr. 2008, 41, 653–658. [Google Scholar] [CrossRef]
  35. Kittel, C. Introduction to Solid State Physics, 8th ed.; John Wiley & Sons: New York, NY, USA, 1996; ISBN 047141526X. [Google Scholar]
  36. Jovanović, A.Z.; Mentus, S.V.; Skorodumova, N.V.; Pašti, I.A. Reactivity Screening of Single Atoms on Modified Graphene Surface: From Formation and Scaling Relations to Catalytic Activity. Adv. Mater. Interfaces 2021, 8, 2001814. [Google Scholar] [CrossRef]
  37. Ganose, A.M.; Jackson, A.J.; Scanlon, D.O. sumo: Command-line tools for plotting and analysis of periodic ab initio calculations. J. Open Source Softw. 2018, 3, 717. [Google Scholar] [CrossRef]
  38. Marković, N.M.; Ross, P.N. Surface science studies of model fuel cell electrocatalysts. Surf. Sci. Rep. 2002, 45, 117–229. [Google Scholar] [CrossRef]
  39. Gabrielli, C.; Grand, P.P.; Lasia, A.; Perrot, H. Investigation of Hydrogen Adsorption-Absorption into Thin Palladium Films: I. Theory. J. Electrochem. Soc. 2004, 151, A1925. [Google Scholar] [CrossRef]
  40. Łosiewicz, B.; Jurczakowski, R.; Lasia, A. Kinetics of hydrogen underpotential deposition at iridium in sulfuric and perchloric acids. Electrochim. Acta 2017, 225, 160–167. [Google Scholar] [CrossRef]
  41. Nørskov, J.K.; Bligaard, T.; Logadottir, A.; Kitchin, J.R.; Chen, J.G.; Pandelov, S.; Stimming, U. Trends in the exchange current for hydrogen evolution. J. Electrochem. Soc. 2005, 152, J23–J26. [Google Scholar] [CrossRef] [Green Version]
  42. Nordlander, P.; Holloway, S.; Nørskov, J.K. Hydrogen adsorption on metal surfaces. Surf. Sci. 1984, 136, 59–81. [Google Scholar] [CrossRef]
  43. Park, J.; Elmlund, H.; Ercius, P.; Yuk, J.M.; Limmer, D.T.; Chen, Q.; Kim, K.; Han, S.H.; Weitz, D.A.; Zettl, A.; et al. 3D structure of individual nanocrystals in solution by electron microscopy. Science 2015, 349, 290–295. [Google Scholar] [CrossRef] [Green Version]
  44. Jia, Q.; Ramaswamy, N.; Hafiz, H.; Tylus, U.; Strickland, K.; Wu, G.; Barbiellini, B.; Bansil, A.; Holby, E.F.; Zelenay, P.; et al. Experimental Observation of Redox-Induced Fe–N Switching Behavior as a Determinant Role for Oxygen Reduction Activity. ACS Nano 2015, 9, 12496–12505. [Google Scholar] [CrossRef] [PubMed]
  45. Nilsson, A.; Pettersson, L.G.M.; Hammer, B.; Bligaard, T.; Christensen, C.H.; Nørskov, J.K. The electronic structure effect in heterogeneous catalysis. Catal. Lett. 2005, 100, 111–114. [Google Scholar] [CrossRef]
  46. Kresse, G.; Hafner, J. Ab initio molecular dynamics for liquid metals. Phys. Rev. B 1993, 47, 558–561. [Google Scholar] [CrossRef] [PubMed]
  47. Kresse, G.; Furthmüller, J. Efficiency of ab-initio total energy calculations for metals and semiconductors using a plane-wave basis set. Comput. Mater. Sci. 1996, 6, 15–50. [Google Scholar] [CrossRef]
  48. Kresse, G.; Furthmüller, J. Efficient iterative schemes for ab initio total-energy calculations using a plane-wave basis set. Phys. Rev. B 1996, 54, 11169–11186. [Google Scholar] [CrossRef] [PubMed]
  49. Perdew, J.; Burke, K.; Ernzerhof, M. Generalized Gradient Approximation Made Simple. Phys. Rev. Lett. 1996, 77, 3865–3868. [Google Scholar] [CrossRef] [Green Version]
  50. Blöchl, P.E. Projector augmented-wave method. Phys. Rev. B 1994, 50, 17953–17979. [Google Scholar] [CrossRef] [Green Version]
  51. Grimme, S.; Antony, J.; Ehrlich, S.; Krieg, H. A consistent and accurate ab initio parametrization of density functional dispersion correction (DFT-D) for the 94 elements H-Pu. J. Chem. Phys. 2010, 132, 154104. [Google Scholar] [CrossRef] [Green Version]
Figure 1. The most stable structures of the studied C31M systems (M is labeled for each structure), with C−M bond lengths given in Å (if all C−M bonds are of equal length, only one such length is indicated). Structural models were made using VESTA [34].
Catalysts 11 01207 g001
Figure 2. The correlation between embedding energies (Eemb) of SA in vG and the cohesive energies (Ecoh) of corresponding bulk metal phases.
Catalysts 11 01207 g002
Figure 3. Densities of states for the investigated M@vG systems. Total DOS, carbon, and metal states are given. Plots were generated using the SUMO Python toolkit for VASP [37], and the energy scale is referred to the Fermi level.
Catalysts 11 01207 g003
Figure 4. The relaxed structures of H@M-top on C31M systems (M is labeled for each structure). M−H and C−M bond lengths are given in Å (if all C−M bonds are of equal length, only one such length is indicated). Structural models were made using VESTA [34].
Catalysts 11 01207 g004
Figure 5. The relaxed structures of OH on the most favorable positions on C31M systems (M is labeled for each structure). Bond lengths for H−O or H−C, O−M or O−C, and M−C are given in Å (if all bonds between two same atom types are of equal length, only one such length is indicated). Structural models were made using VESTA [34].
Catalysts 11 01207 g005
Figure 6. The relaxed structures of O at the most favorable positions on C31M systems (M is labeled for each structure). M−O or C−O (depending on O position) and C−M bond lengths are given in Å (if all C−M bonds are of equal length, only one such length is indicated). Structural models were made using VESTA [34].
Catalysts 11 01207 g006
Figure 7. The relaxed structures of the second O at the most favorable positions on C31M systems (M is labeled for each structure). M−O, C−O, and C−M bond (depending on O position) lengths are given in Å (if all C−M bonds are of equal length, only one such length is indicated). Structural models were made using VESTA [34].
Catalysts 11 01207 g007
Figure 8. Surface Pourbaix plots for the considered models of SACs. The dashed lines give the values for the equilibrium potentials for reactions given by Equations (1)–(4). Identified stable phases are indicated directly on the plots. [Mz+] was taken to 1 × 10⁻⁸ mol dm−3 (T = 298 K). We note that in all the cases, metal sites oxidation (OHads or Oads formation is favored over metal dissolution, and the region of metal dissolution is indicated for completeness, except for Ag, to avoid confusion.
Catalysts 11 01207 g008
Figure 9. The comparison of DOS of metal centers for Ni@vG and Cu@vG before and after the addition of OH to the system. The energy scale is referred to the Fermi level (vertical dashed line).
Catalysts 11 01207 g009
Table 1. Metal (M) incorporation into the vacancy site of vG: total magnetizations (Mtot), M adsorption energies obtained in this study (Eemb(M)) and the corresponding values found in the literature (Eembref(M)), relaxed M−C distances (d(C−M)), M protrusion out of the graphene basal plane (h(M)) and change of Bader charge of M upon adsorption. If all C−M distances are equal, only one value is given.
MMtotBEemb(M)/eVEembref(M)/eVd(C−M)/Åh(M)/ÅΔq(M)/e
Ni0.00−6.77−6.64 1,*; −6.89 1,#
−6.78 1,†; −5.72 1,‡
1.791.19−0.42
Cu0.85−3.75 −3.61 1,*; −3.87 1,#
−3.75 1,†; −2.89 1,‡; −3.69 2,*
1.881.35−0.52
Ru0.00−8.98−8.81 1,*; −9.16 1,#
−8.99 1,†; −7.67 1,‡
1.881.47−0.54
Rh0.03−8.48−8.34 1,*; −8.69 1,#
−8.49 1,†; −7.05 1,‡
1.891.44−0.35
Pd0.00−5.43−5.27 1,*; −5.62 1,#
−5.44 1,†; −4.30 1,‡
1.941.45−0.34
Ag1.01−1.89−1.72 1,*; −2.11 1,#
−1.89 1,†; −1.28 1,‡−1.76 2,*
2.16
2.21
2.21
1.77−0.46
Ir0.71−9.31−9.28 1,*; −9.77 1,#
−9.45 1,†; −7.67 1,‡
1.901.50−0.59
Pt0.00−7.34−7.08 1,*; −7.57 1,#
−7.34 1,†; −6.02 1,‡
1.941.51−0.28
Au0.99−2.60−2.40 1,*; −2.93 1,#;
−2.60 1,†; −1.80 1,‡
−2.07 2,*
2.082.082.091.65−0.22
1 = ref. [31]; 2 = ref. [30]; * PBE, # PBE+D2, PBE+D3, vdW-DF2. Δq(M) is calculated as the Bader charge of M in the given model minus the Bader charge of isolated M.
Table 2. The H adsorption onto M@vG at the M-top site: total magnetizations (Mtot), H adsorption energies (Eads(H)), relaxed M−H distance (d(M−H)), change of the Bader charge of M upon adsorption (Δq(M)) and change of the Bader charge of H upon adsorption (Δq(H)).
MMtotBEads(H)/eVd(M−H)/ÅΔq(M)/eΔq(H) */e
Ni0.00−1.891.55−0.100.41
Cu1.67−1.991.55−0.050.34
Ru0.96−2.441.73−0.600.23
Rh0.00−2.551.68−0.170.27
Pd0.00−1.901.73−0.050.29
Ag0.00−2.401.650.060.29
Ir0.00−3.221.680.110.23
Pt0.00−2.561.70−0.100.28
Au0.00−3.121.64−0.030.20
* Δq(M)=q(M in H-M@vG)-q(M in M@vG), Δq(H)=q(H in H-M@vG)-q(H isolated)=q(H in H-M@vG)-1.
Table 3. The OH adsorption on the most stable site of M@vG: total magnetizations (Mtot), OH adsorption energies (Eads(OH)), relaxed M−O or C−O distance (depending on the OH position, d(M/C−O)), change of the Bader charge of M upon adsorption (Δq(M)) and change of the Bader charge of OH upon adsorption Δq(OH).
MMtotBEads(OH)/eVd(M/C−O)/ÅΔq(M)*/eΔq(OH) */e
Ni0.01−3.611.78−0.350.50
Cu0.00−3.551.250.050.54
Ru0.00−3.791.92−0.440.53
Rh0.00−3.781.93−0.370.50
Pd0.00−3.211.980.080.54
Ag0.10−3.272.00−0.190.49
Ir0.00−4.401.94−0.160.49
Pt0.00−3.671.96−0.330.49
Au0.00−3.781.99−0.290.32
* Δq(M)=q(M in OH−M@vG)-q(M in M@vG); Δq(OH)=q(O in OH−M@vG)+q(H in OH−M@vG)-7.
Table 4. O adsorption on the most stable site of M@vG: total magnetizations (Mtot), O adsorption energies (Eads(O)), relaxed M−O or C−O distance (depending on O position, d(M/C−O)), change of the Bader charge of M upon adsorption (Δq(M)) and change of the Bader charge of O upon adsorption (Δq(O)).
MMtotBEads(O)/eVd(M/C−O)/ÅΔq(M) */eΔq(O) */e
Ni0.00−5.071.34−0.141.76
Cu−0.66−5.861.400.351.58
Ru0.96−4.581.74−0.580.72
Rh0.00−4.431.72−0.630.84
Pd0.00−5.141.240.051.73
Ag0.80−7.011.400.281.49
Ir0.00−5.321.76−0.340.78
Pt0.00−5.371.77−0.530.77
Au0.70−7.081.400.311.57
* Δq(M)=q(M in O−M@vG)—q(M in M@vG); Δq(O)=q(O in O−M@vG)—q(O isolated)=q(O in O−M@vG)−6.
Table 5. Second O adsorption on the most stable site of M@vG: total magnetizations (Mtot), O adsorption energies: differential (Eadsdiff(O)) and integral (Eadsint(O)).
MMtotBEadsdiff(O)/eVEadsint(O)/eV
Ni0.00−4.43−4.75
Cu0.00−5.72−5.79
Ru0.89−4.13−4.35
Rh0.00−3.31−3.87
Pd0.00−4.91−5.02
Ag0.00−5.64−6.32
Ir0.00−3.24−4.28
Pt0.00−2.67−4.02
Au1.00−3.34−5.21
Publisher’s Note: MDPI stays neutral with regard to jurisdictional claims in published maps and institutional affiliations.

