Article

Modulation of Human Mesenchymal Stem Cells by Electrical Stimulation Using an Enzymatic Biofuel Cell

1
School of Chemical Engineering, Sungkyunkwan University, Suwon 16419, Korea
2
Department of Nanobiomedical Sciences and BK21 PLUS NBM Global Research Center for Regenerative Medicine, Dankook University, Anseo-Dong, Cheonan 31116, Korea
3
School of Materials Science and Engineering, Nanyang Technological University, 50 Nanyang Avenue, Singapore 6397798, Singapore
4
Department of Microbiology, College of Natural Science, Dankook University, Cheonan 31116, Korea
5
Department of Pathology, CHA University, Pocheon-si 11160, Korea
6
Department of Biomedical Science, College of Life Science, CHA University, Pocheon-si 11160, Korea
7
Department of Chemistry, College of Natural Science, Dankook University, Anseo-dong, Cheonan 31116, Korea
8
CHA Fertility Center Seoul Station, Jung-gu, Seoul 04637, Korea
*
Authors to whom correspondence should be addressed.
W.-Y. Jeon and S. Mun contributed equally to this paper.
Catalysts 2021, 11(1), 62; https://doi.org/10.3390/catal11010062
Submission received: 27 November 2020 / Revised: 18 December 2020 / Accepted: 31 December 2020 / Published: 5 January 2021
(This article belongs to the Special Issue Recent Advances in Enzyme Technology)

Abstract

:
Enzymatic biofuel cells (EBFCs) have excellent potential as components in bioelectronic devices, especially as active biointerfaces to regulate stem cell behavior for regenerative medicine applications. However, it remains unclear to what extent EBFC-generated electrical stimulation can regulate the functional behavior of human adipose-derived mesenchymal stem cells (hAD-MSCs) at the morphological and gene expression levels. Herein, we investigated the effect of EBFC-generated electrical stimulation on hAD-MSC cell morphology and gene expression using next-generation RNA sequencing. We tested three different electrical currents, 127 ± 9, 248 ± 15, and 598 ± 75 nA/cm2, in mesenchymal stem cells. We performed transcriptome profiling to analyze the impact of EBFC-derived electrical current on gene expression using next generation sequencing (NGS). We also observed changes in cytoskeleton arrangement and analyzed gene expression that depends on the electrical stimulation. The electrical stimulation of EBFC changes cell morphology through cytoskeleton re-arrangement. In particular, the results of whole transcriptome NGS showed that specific gene clusters were up- or down-regulated depending on the magnitude of applied electrical current of EBFC. In conclusion, this study demonstrates that EBFC-generated electrical stimulation can influence the morphological and gene expression properties of stem cells; such capabilities can be useful for regenerative medicine applications such as bioelectronic devices.

1. Introduction

There is broad interest in developing enzymatic biofuel cells as components within wearable sensors and bioelectronic devices to regulate cell behavior [1,2,3]. Electrical stimulation plays an important role in regulating the function of mammalian cells and tissues, including neurons, muscle, and cardiomyocytes. Additionally, electrical stimulation can regulate cellular respiration in mitochondria and aid cellular signaling [4,5,6,7,8]. A specific range of electrical stimulation conditions also plays a biophysical role in wound healing and homeostasis by regulating stem cell behavior [9,10]. Several studies have investigated how electrical stimulation regulates stem cell behavior like migration, proliferation, and differentiation in vitro [11,12,13,14,15]. Previous reports demonstrate that cellular-level electrical stimulation affects axon outgrowth and neuronal function [16,17,18,19]. Although electrical stimulation regulates cells, it is not easily or directly applicable as a therapeutic tool since most electrical stimulation systems are bulky electrical generators which are neither implantable nor biocompatible. In the medical field, direct current electrical stimulation has been used to treat Parkinson’s disease [20]. Implanted electrical devices, such as deep brain stimulators [8,9], often cause surgical complications and inflammation caused by inorganic materials. Although direct implantation of inorganic fuel cells can be substituted by indirect therapy using electromagnetic systems, the systems are expensive and provide only localized stimulation [21]. As such, there is broad interest in alternative device designs, especially ones that are compatible with a wearable format.
In contrast to the above shortcomings, enzymatic biofuel cells (EBFCs) have several advantages. Basic EBFC structures consist of two different enzyme components for a hydrogen/oxygen fuel cell, an anode, a cathode, and a separator [22]. EBFCs are composed of biocompatible organic materials, with a simple system design, nano-scale electrical current control, user-defined fuel cell formulation, and economical operation compared with cellular electrical stimulation using other power sources [23,24,25,26]. Until now, EBFCs have been introduced and developed for over 45 years as bioelectrical tools for electrical machines, biosensors, and bioelectronics. Although real-life viable EBFC application has been demonstrated in living plants, snails [27,28], and small animals [25], EBFCs still have limitations and intrinsic issues for commercial clinical application in humans, such as limited reaction time, low power density, and insufficient voltage for device operation [23,29,30]. However, EBFCs have enough capacity as direct electrical stimulation tools on the cellular level in a physiological medium [31]. One promising area involves stem cell-based regenerative medicine, however, there are no studies using EBFCs to control mesenchymal stem cell differentiation with specific electrical stimulation.
Mesenchymal stem cells (MSCs) hold great potential for damaged tissue replacement and regeneration [32,33]. The mesenchymal stem cell niche, which consists of micro-environmental cues that control stem cells is highly dependent on the physical condition of specific tissues [34,35]. Physiological stimulation, such as electric current, could activate stem cells to differentiate, thereby inducing regeneration and recovery [14,16,36]. Electrophysiology has been used to study the therapeutic efficacy of electrical stimulation for mesenchymal stem cell regulation [14,19]. However, research in this direction requires further investigation, especially with EBFCs which remain to be tested in this application scope. Therefore, we investigated how EBFC-generated nano-currents could control MSC behavior via electrical stimulation. Moreover, EBFC systems show excellent potential to serve as the basis for self-powered implantable devices, which can aid injury recovery and/or stimulate MSC activity for self-regeneration without requiring stem cell transplantation.
Herein, we investigated the effect of EBFC-generated electrical stimulation on hAD-MSC cell morphology and gene expression using next-generation RNA sequencing, which is a powerful tool for screening and identifying molecular mechanisms [37]. Specifically, mRNA-seq (whole-transcriptome shotgun sequencing) can profile total gene expression and identify signaling network pathways activated by specific environmental conditions such as the applied electrical current. Based on this integrated approach, we demonstrate that specific electrical currents can elicit mesenchymal stem cell differentiation and can guide the future development of EBFC-based sensors and devices as cell regulators.

2. Results

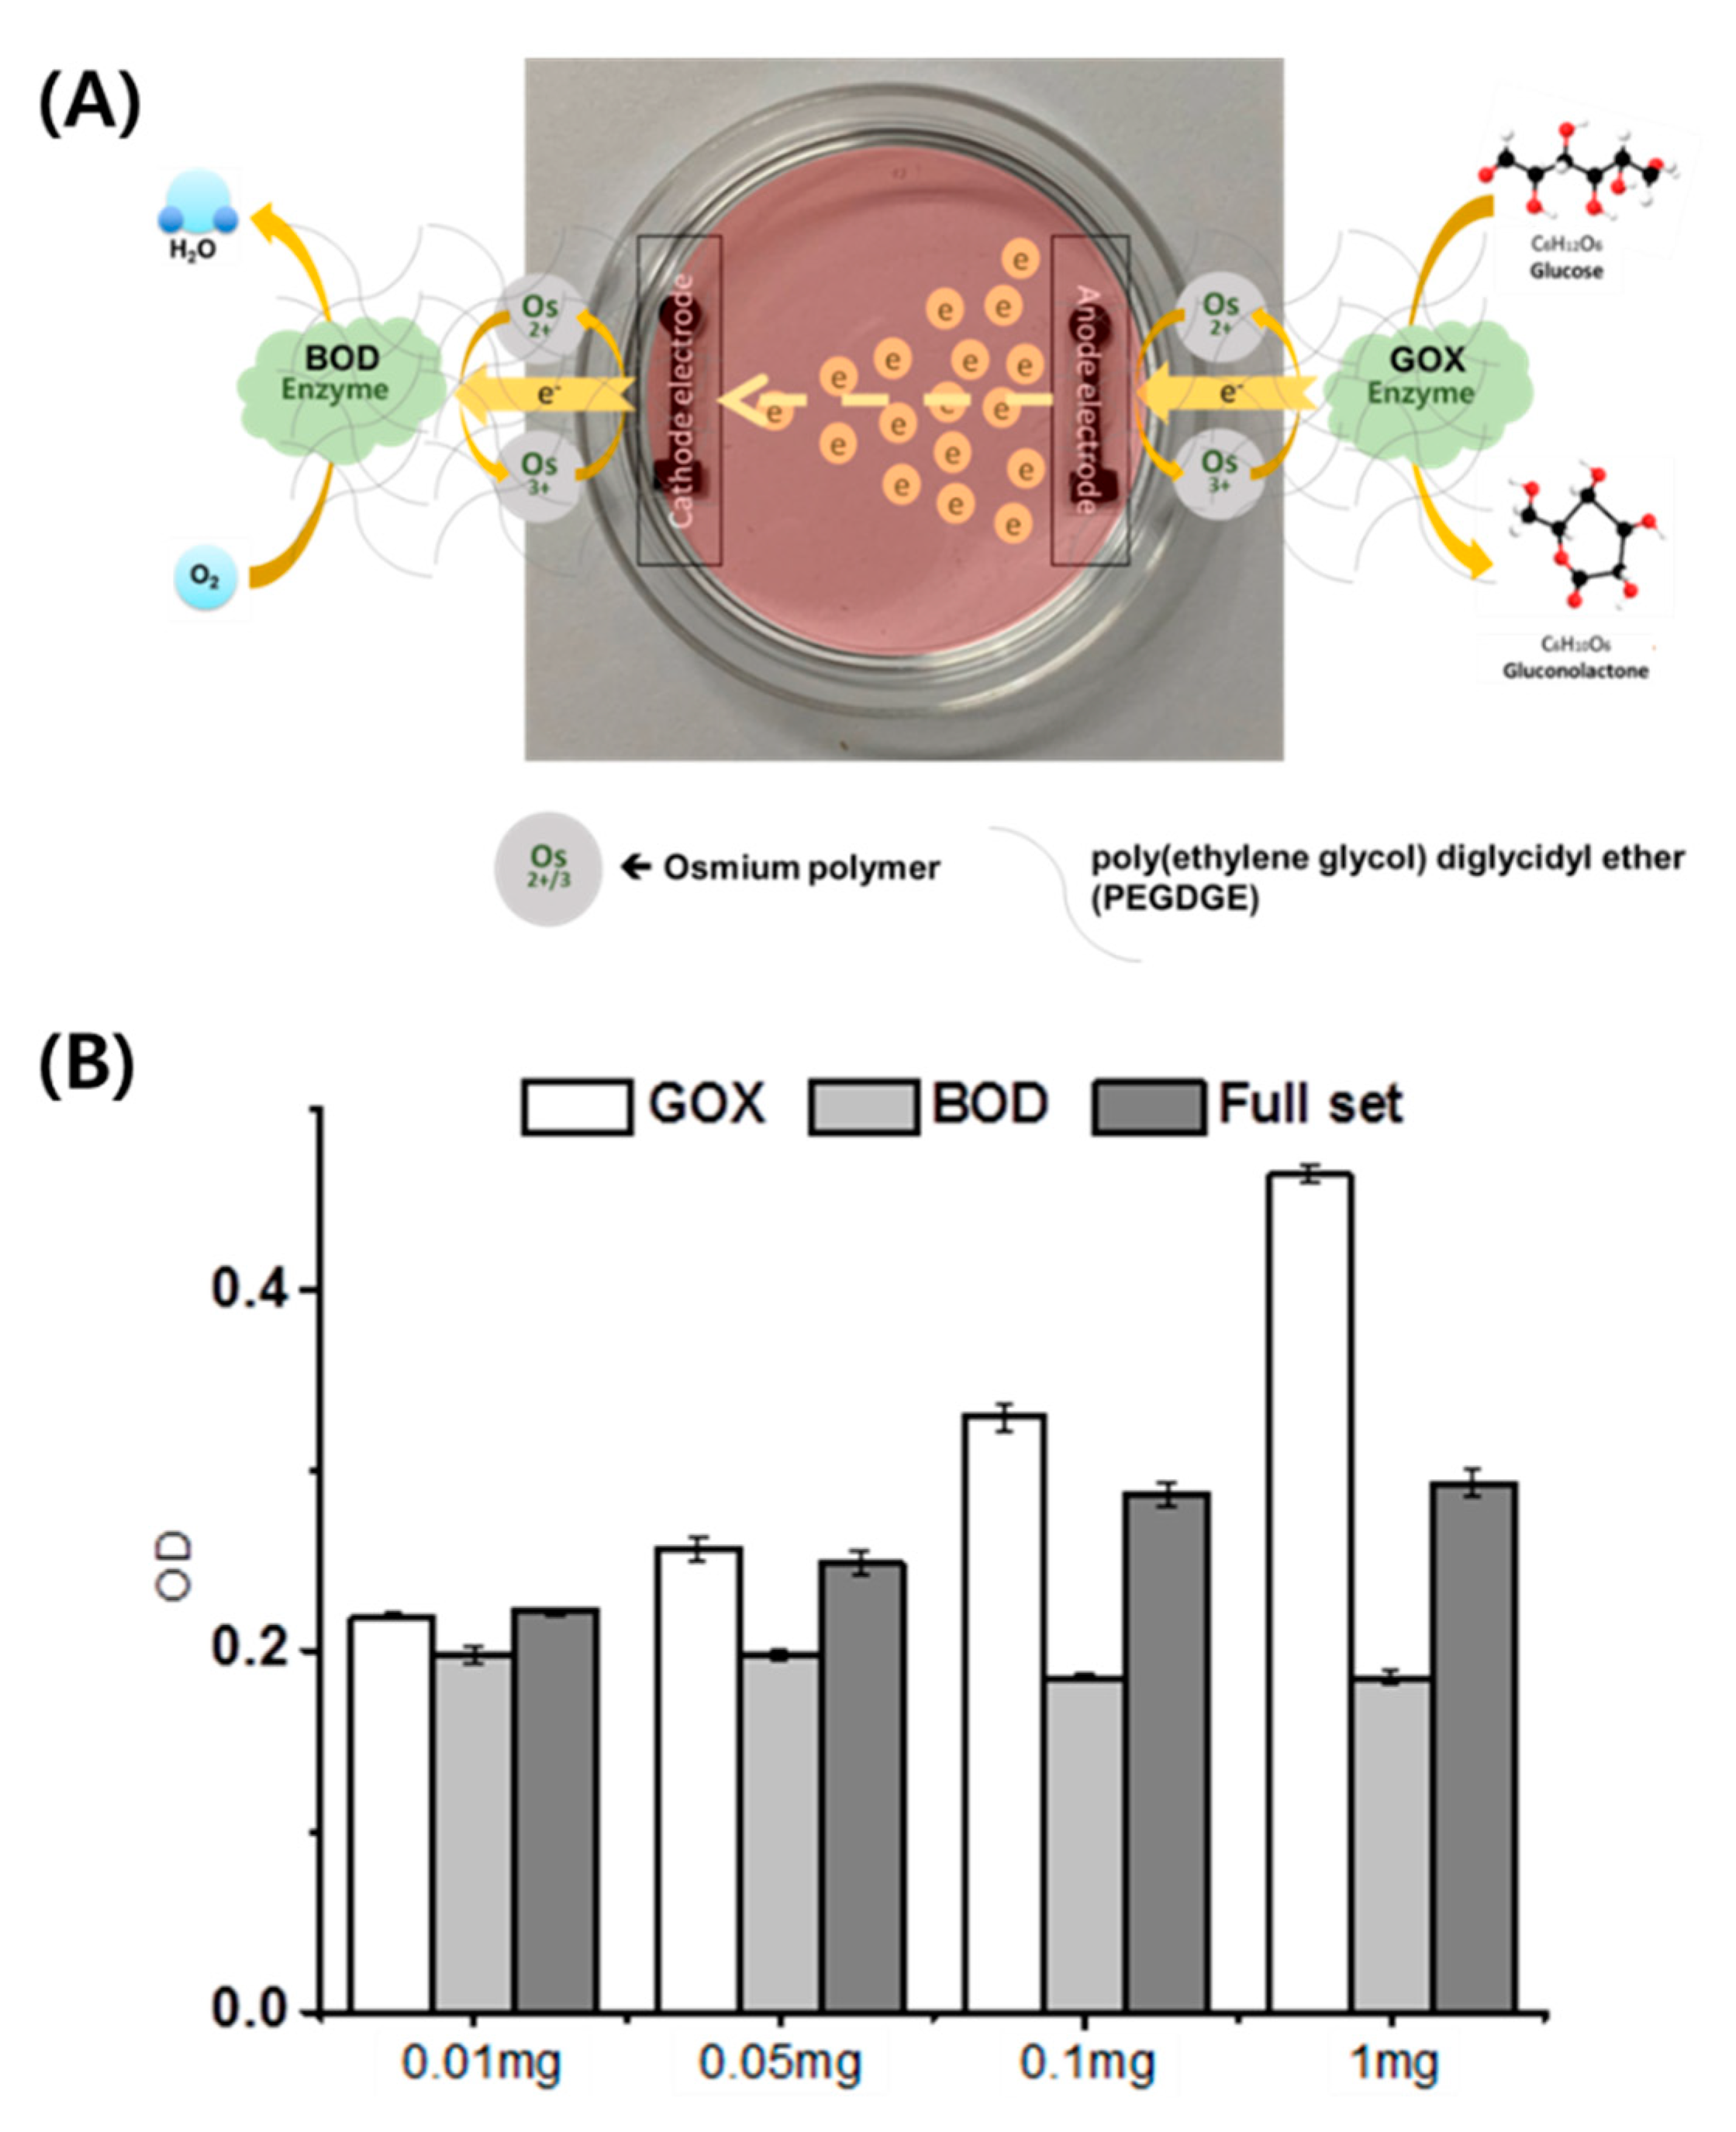
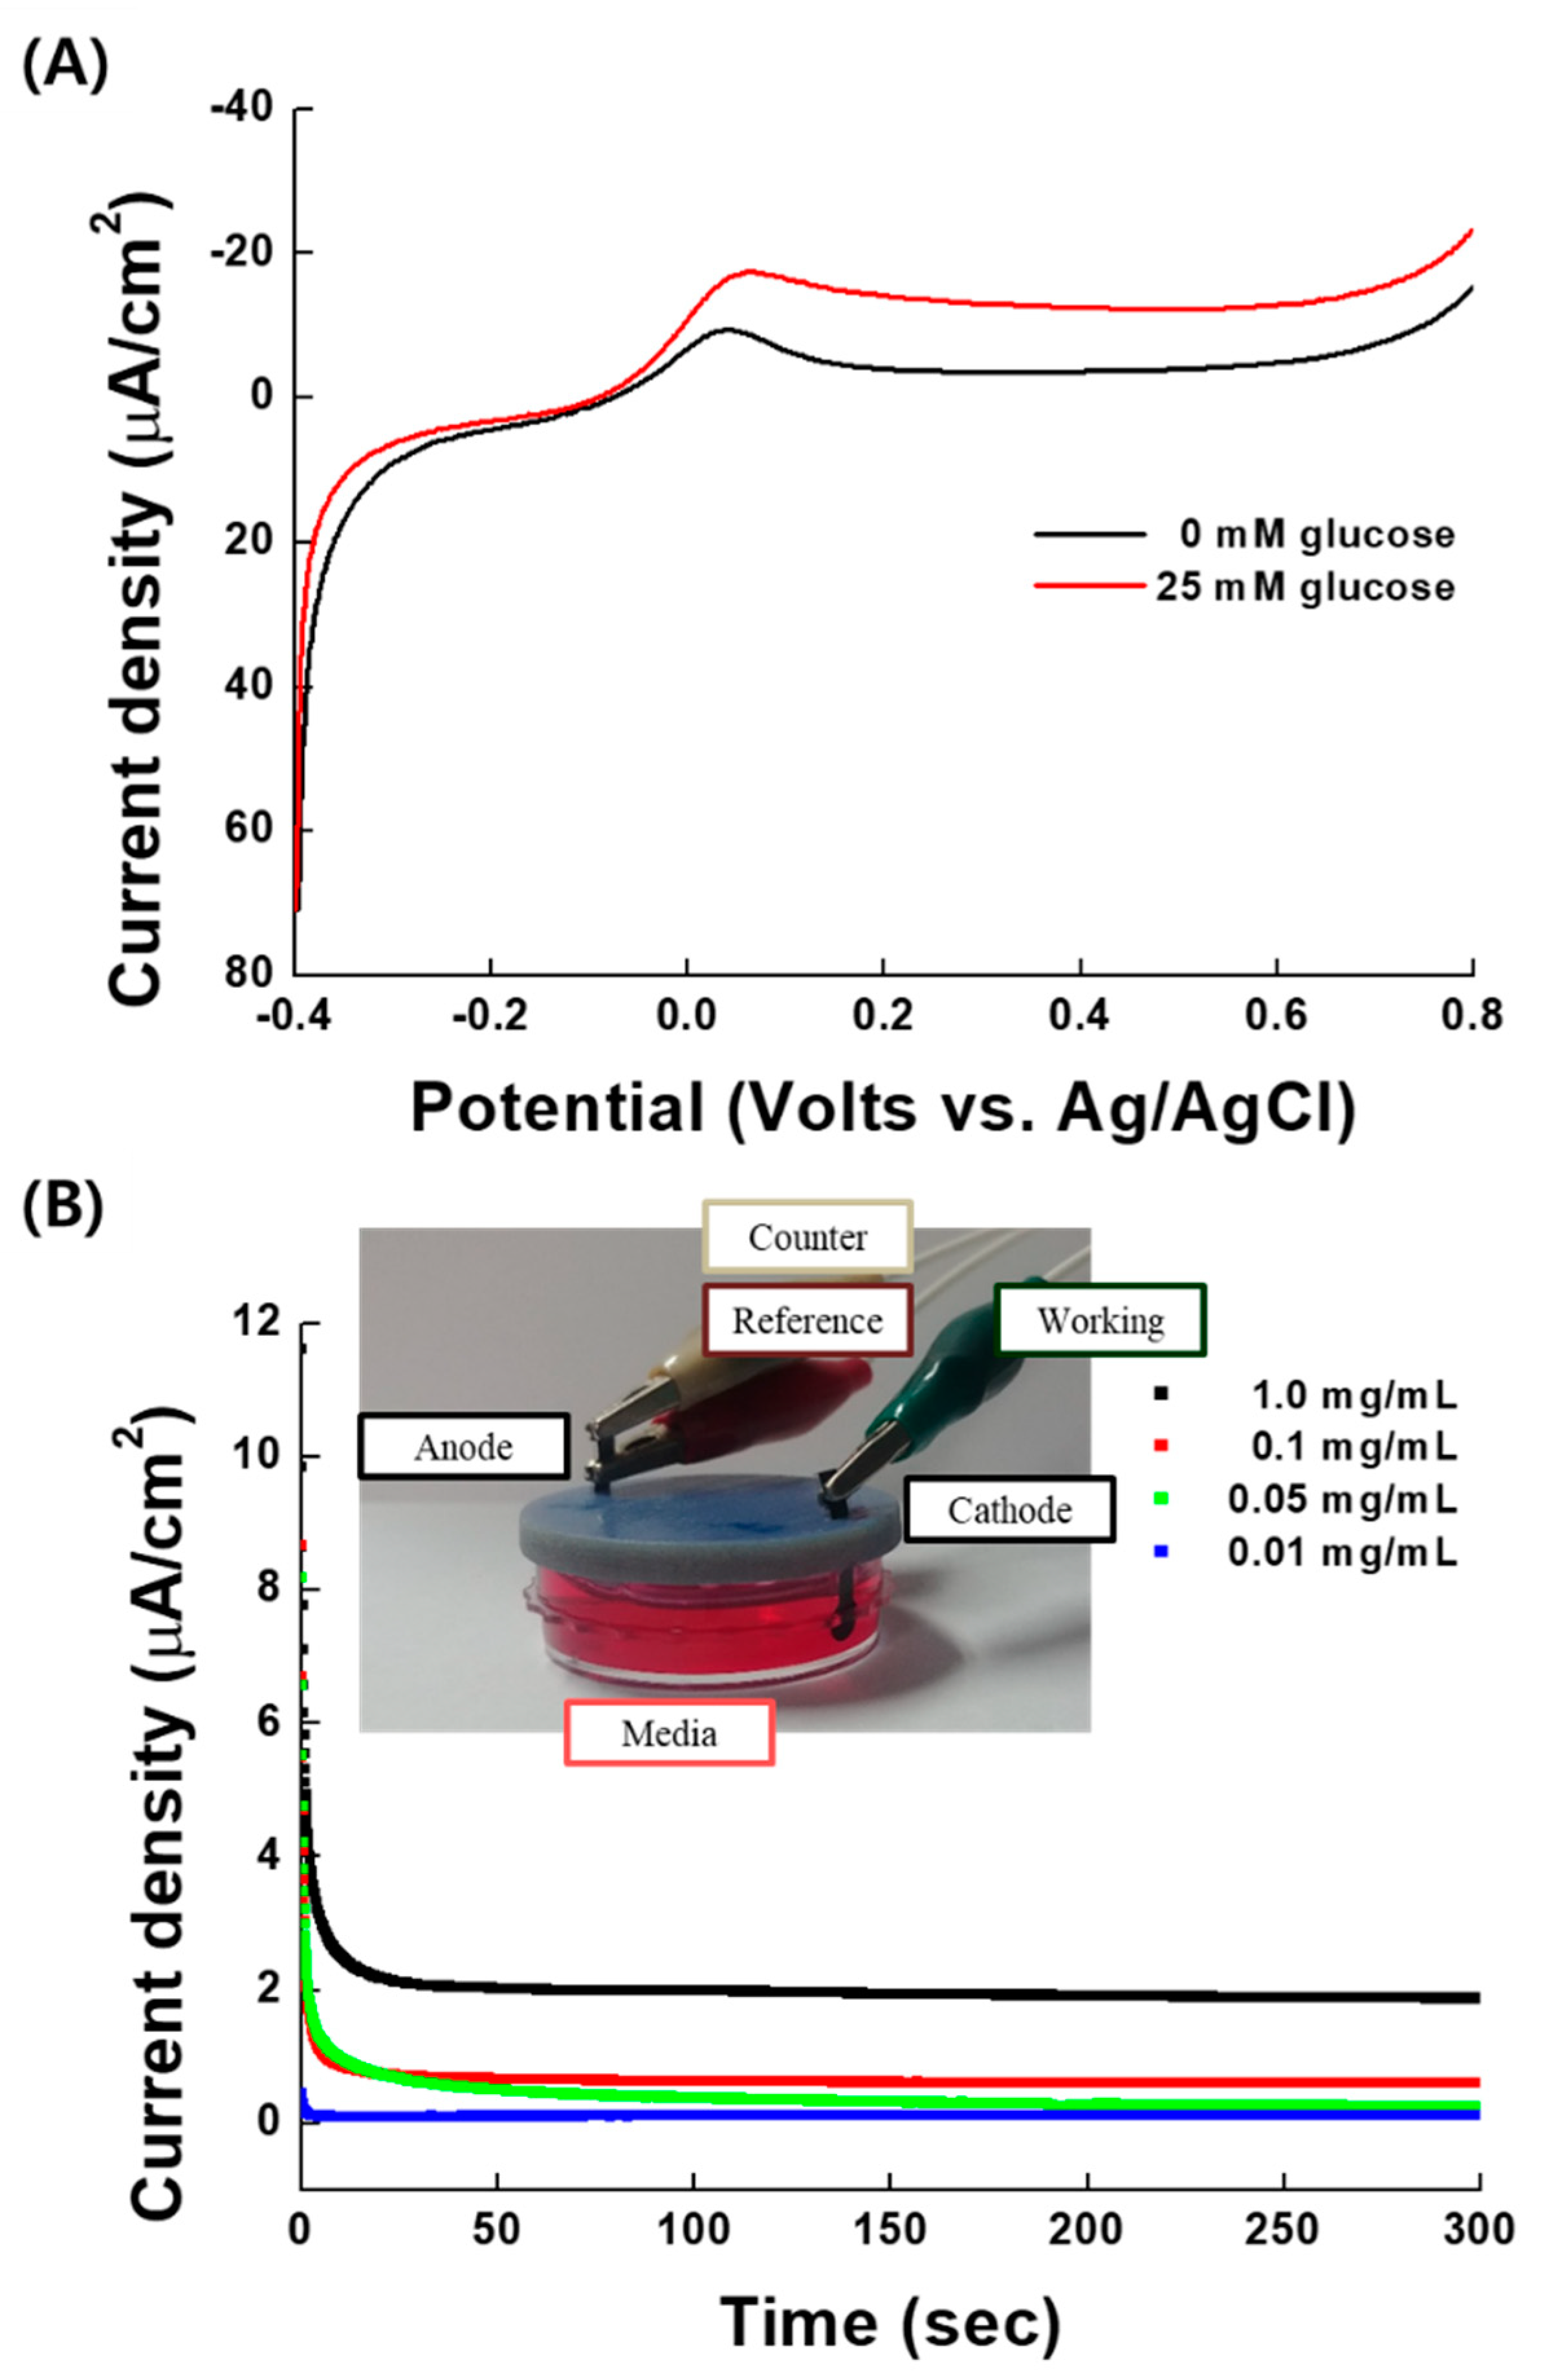
2.1. Characterization of EBFCs Used for Cellular Studies

We investigated human mesenchymal stem cell behavior with electrical stimulation delivered by EBFCs. We fabricated EBFCs of different designs using different enzyme concentrations (0.01, 0.05, 0.1 and 1 mg/mL), to investigate the behavior of hAD-MSCs after nano-scale electrical stimulation. The basic design is presented in Figure 1A. We measured electron rich or poor conditions with WST-8 dye as the colorimetric chemical dye. In Figure 1B, glucose oxidase (GOx) exhibited a significantly increased electron oxidation (rich) environment, bilirubin oxidase (BOD) showed a significantly decreased electron reduction (poor) environment depending on the enzyme concentration in culture media. These data support that the EBFCs are operational. In addition, we measured the electrochemical glucose response on the anode electrode, as shown in Figure 2A. There are GOx enzymes present, which can oxidize glucose (with/without 25 mM). It means that the GOx enzyme is working well to operate as an EBFC. And BOD enzyme electrode was investigated by LSV in Figure S1A. The power density and polarization curves with 0mM (Figure S1B) and 25 mM (Figure S2C) glucose were obtained by LSVs of Figure 2A and Figure S1A. Also, the I-t curve was measured to determine how much current exists in different conditions as a function of the enzyme concentration (Figure 2B). The different EBFC designs are described in Table 1. A BOD-modified cathode electrode was used as the working electrode, while a GOx-modified anode electrode was used as a single reference and counter electrode, as shown in the inset of Figure 2B.

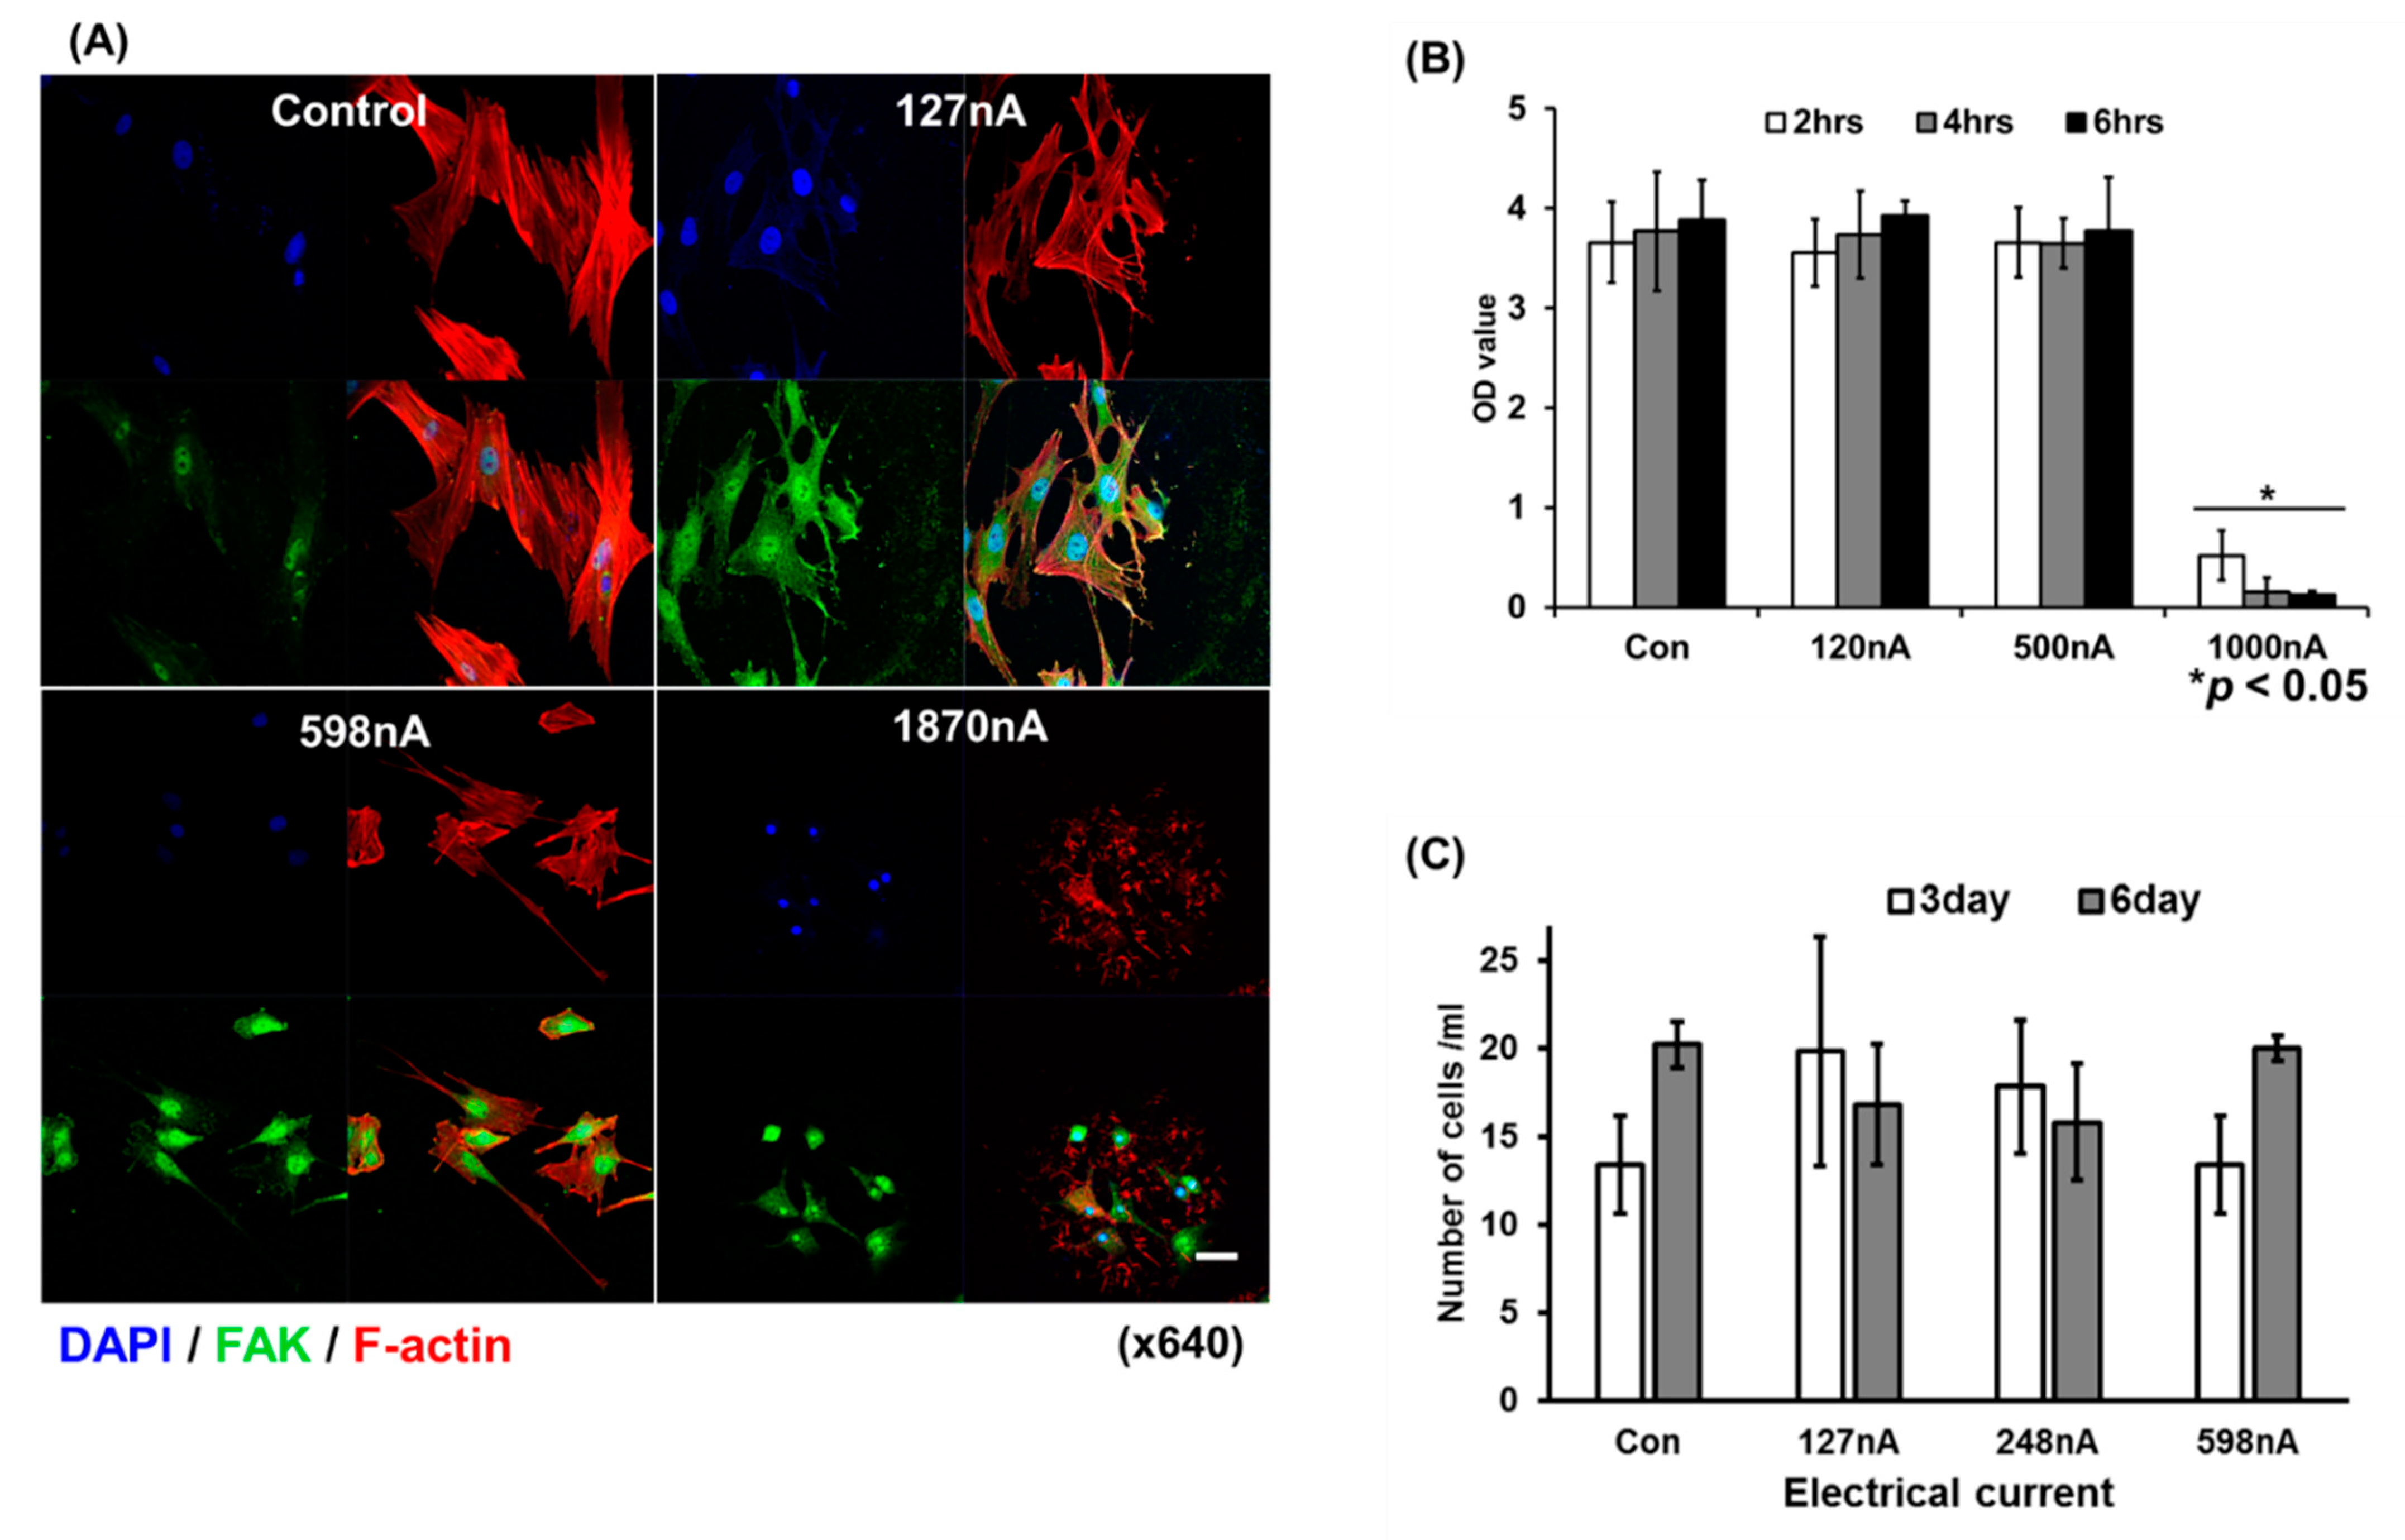
2.2. EBFC Electrical Current for Determining Cell Viability

The EBFC system components, including enzyme solution and conductors, exhibit strong biocompatibility without damaging hAD-MSCs. We investigated cellular behavior under electrical stimulation by immunocytochemistry to elucidate the effect of high electrical current on hAD-MSCs. In the case of high electrical current, F-actin structure disassembly occurred in the 1870 ± 305 nA/cm2 current levels within 6 h (Figure 3A). However, hAD-MSCs survived and grew in the presence of electrical currents between 127 ± 9 nA/cm2 and 598 ± 75 nA/cm2. The number of cells stabilized from 2 to 6 h within the 127 and 598 nA current range, but high current caused the cell number to immediately decrease compared to the low current group (Figure 3B). Thus, the EBFC system could modulate cell survival characteristics and did not cause additional cell proliferation (Figure 3C).

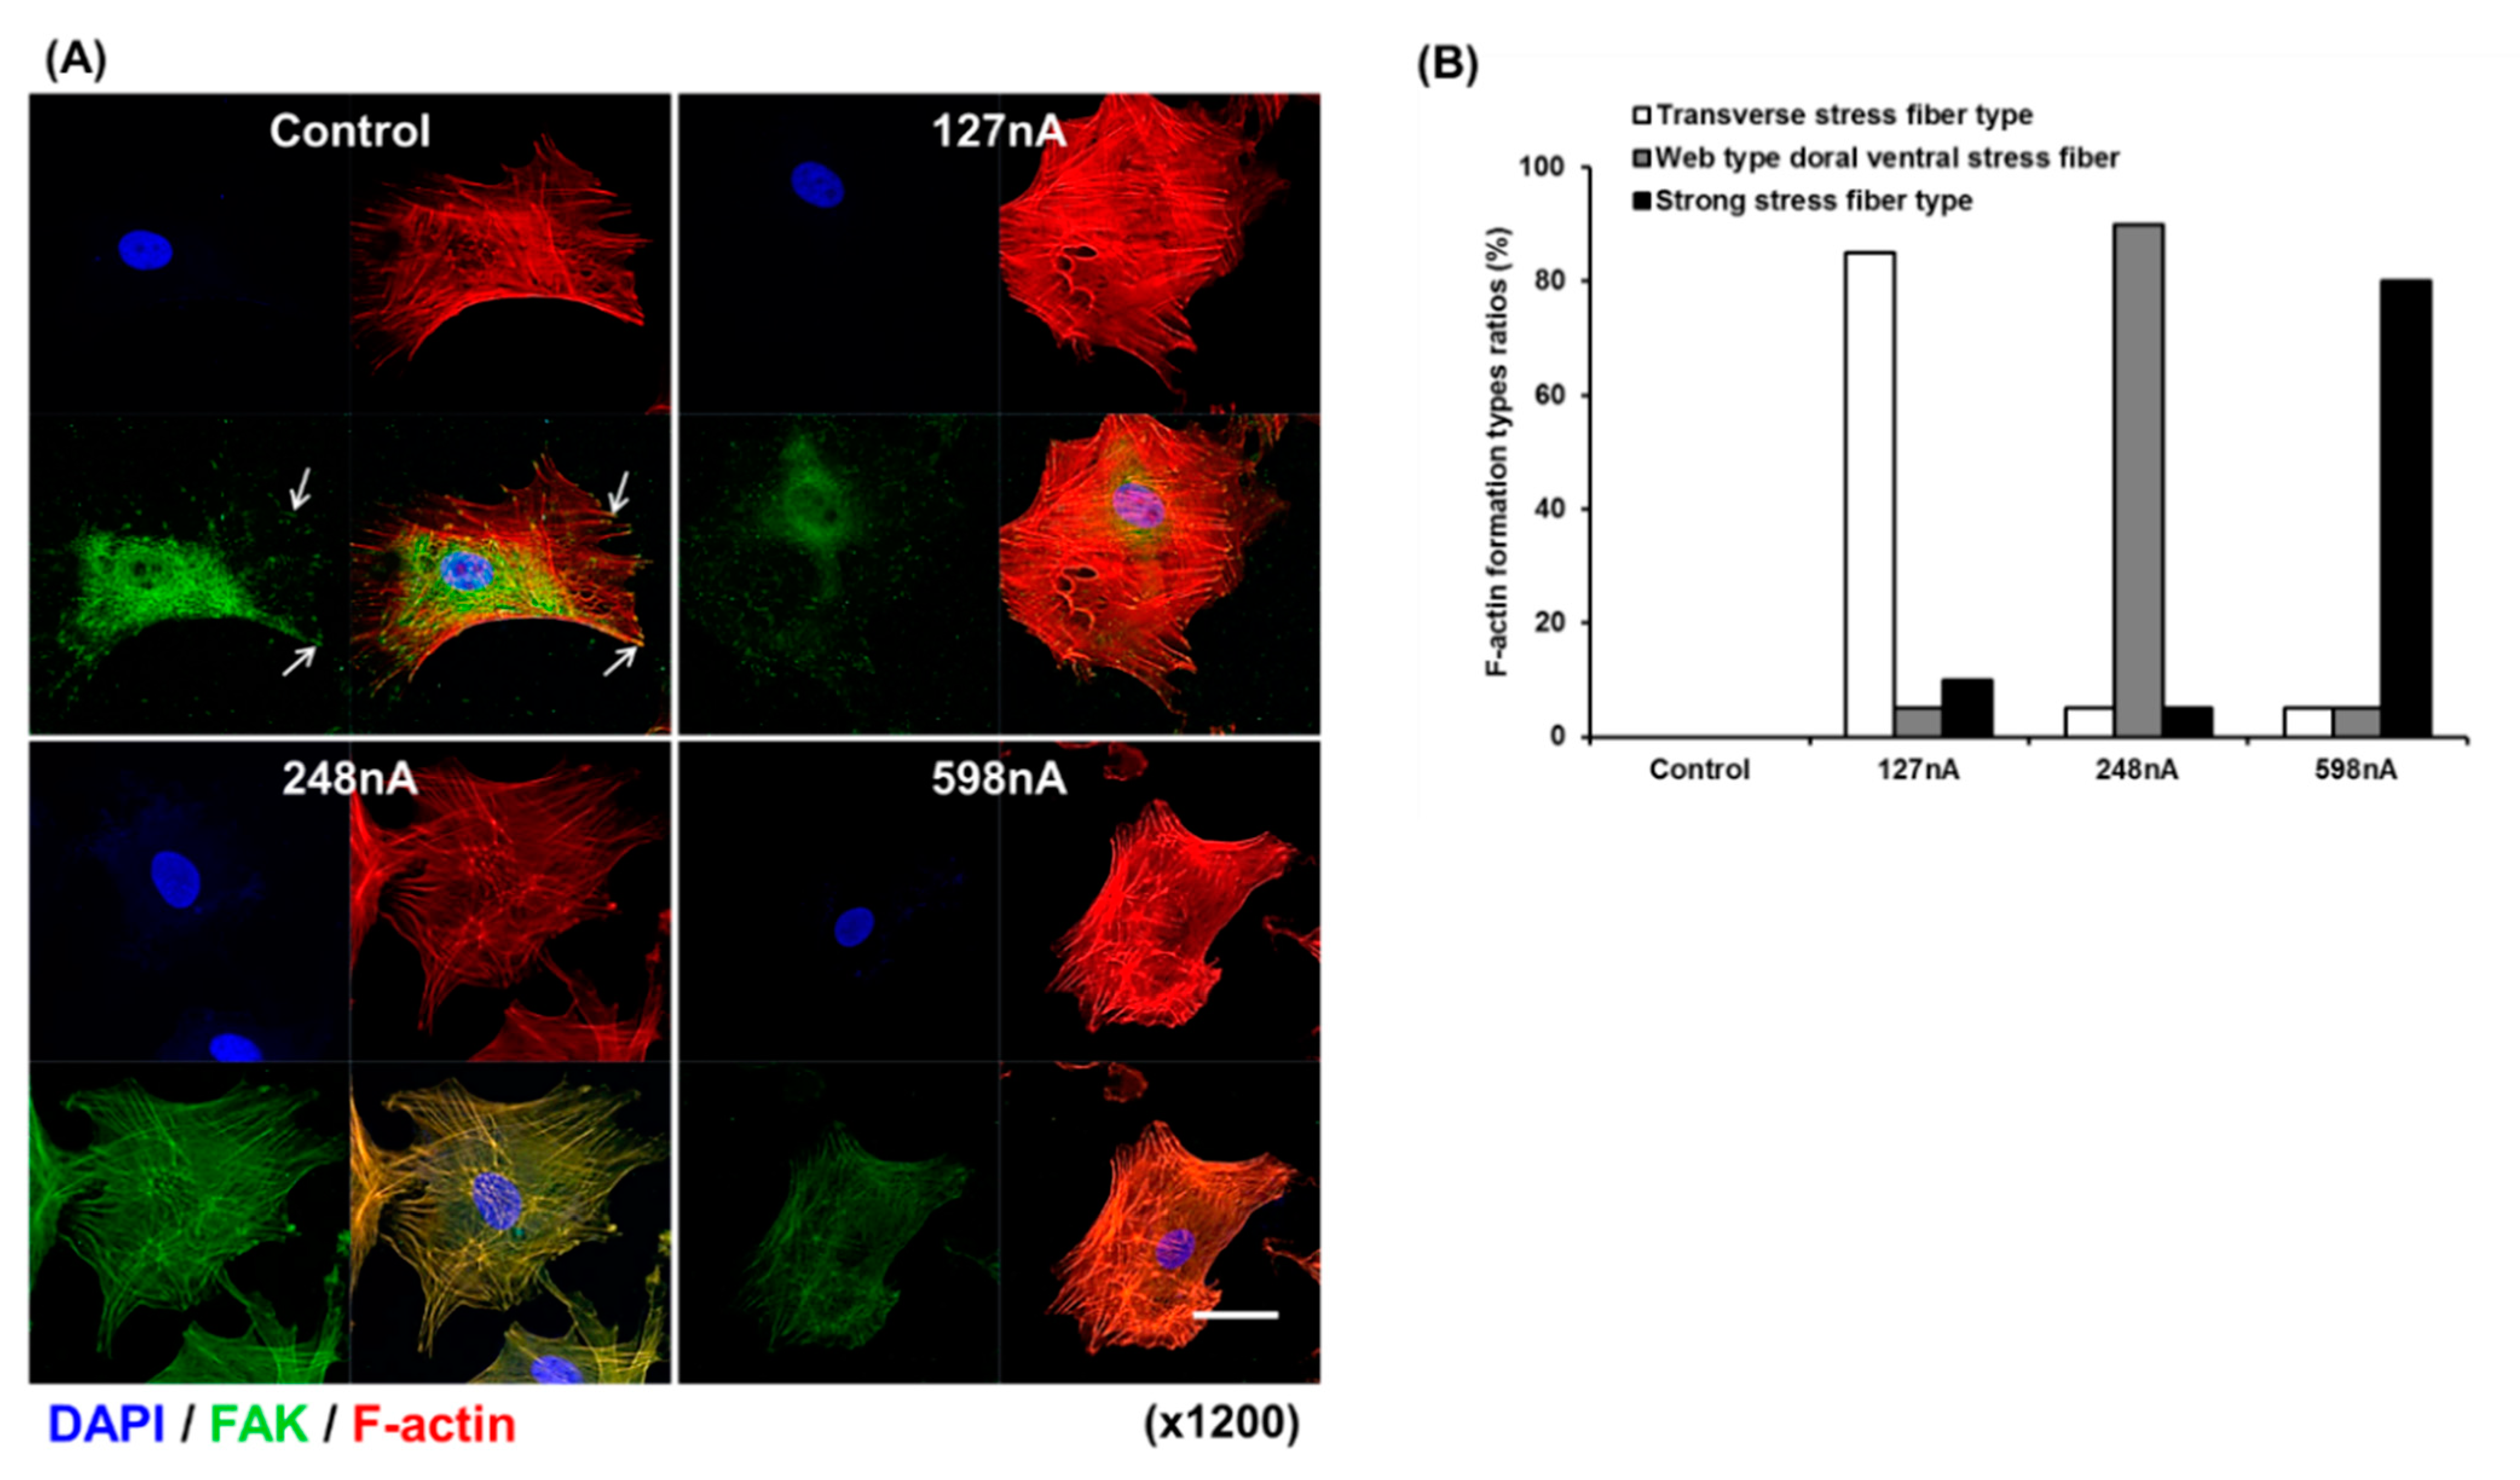
2.3. Morphological Analysis of Electrically Stimulated hAD-MSCs

Figure 4A show the change in cell morphology based on the F-actin arrangement by immunocytochemistry. Figure 4B presents numerical analysis of F-actin arrangement and shows a marked change in its arrangement within the hAD-MSCs depending on the electrical current. 127 nA/cm2 electrical current caused the disappearance of focal adhesion protein at the edge point in the cells and increased transverse and ventral stress fiber type actin arrangements in the cells (about 85%). And 248 nA/cm2 electrical stimulation caused dramatically different types of arrangements involving web-like structures such as cross linked dorsal–ventral stress fibers with a perinuclear actin cap in the cells (90%) compared with controls. Furthermore, the 598 nA/cm2 current caused strongly stressed fiber type actin assembly formation in the cells (80%).

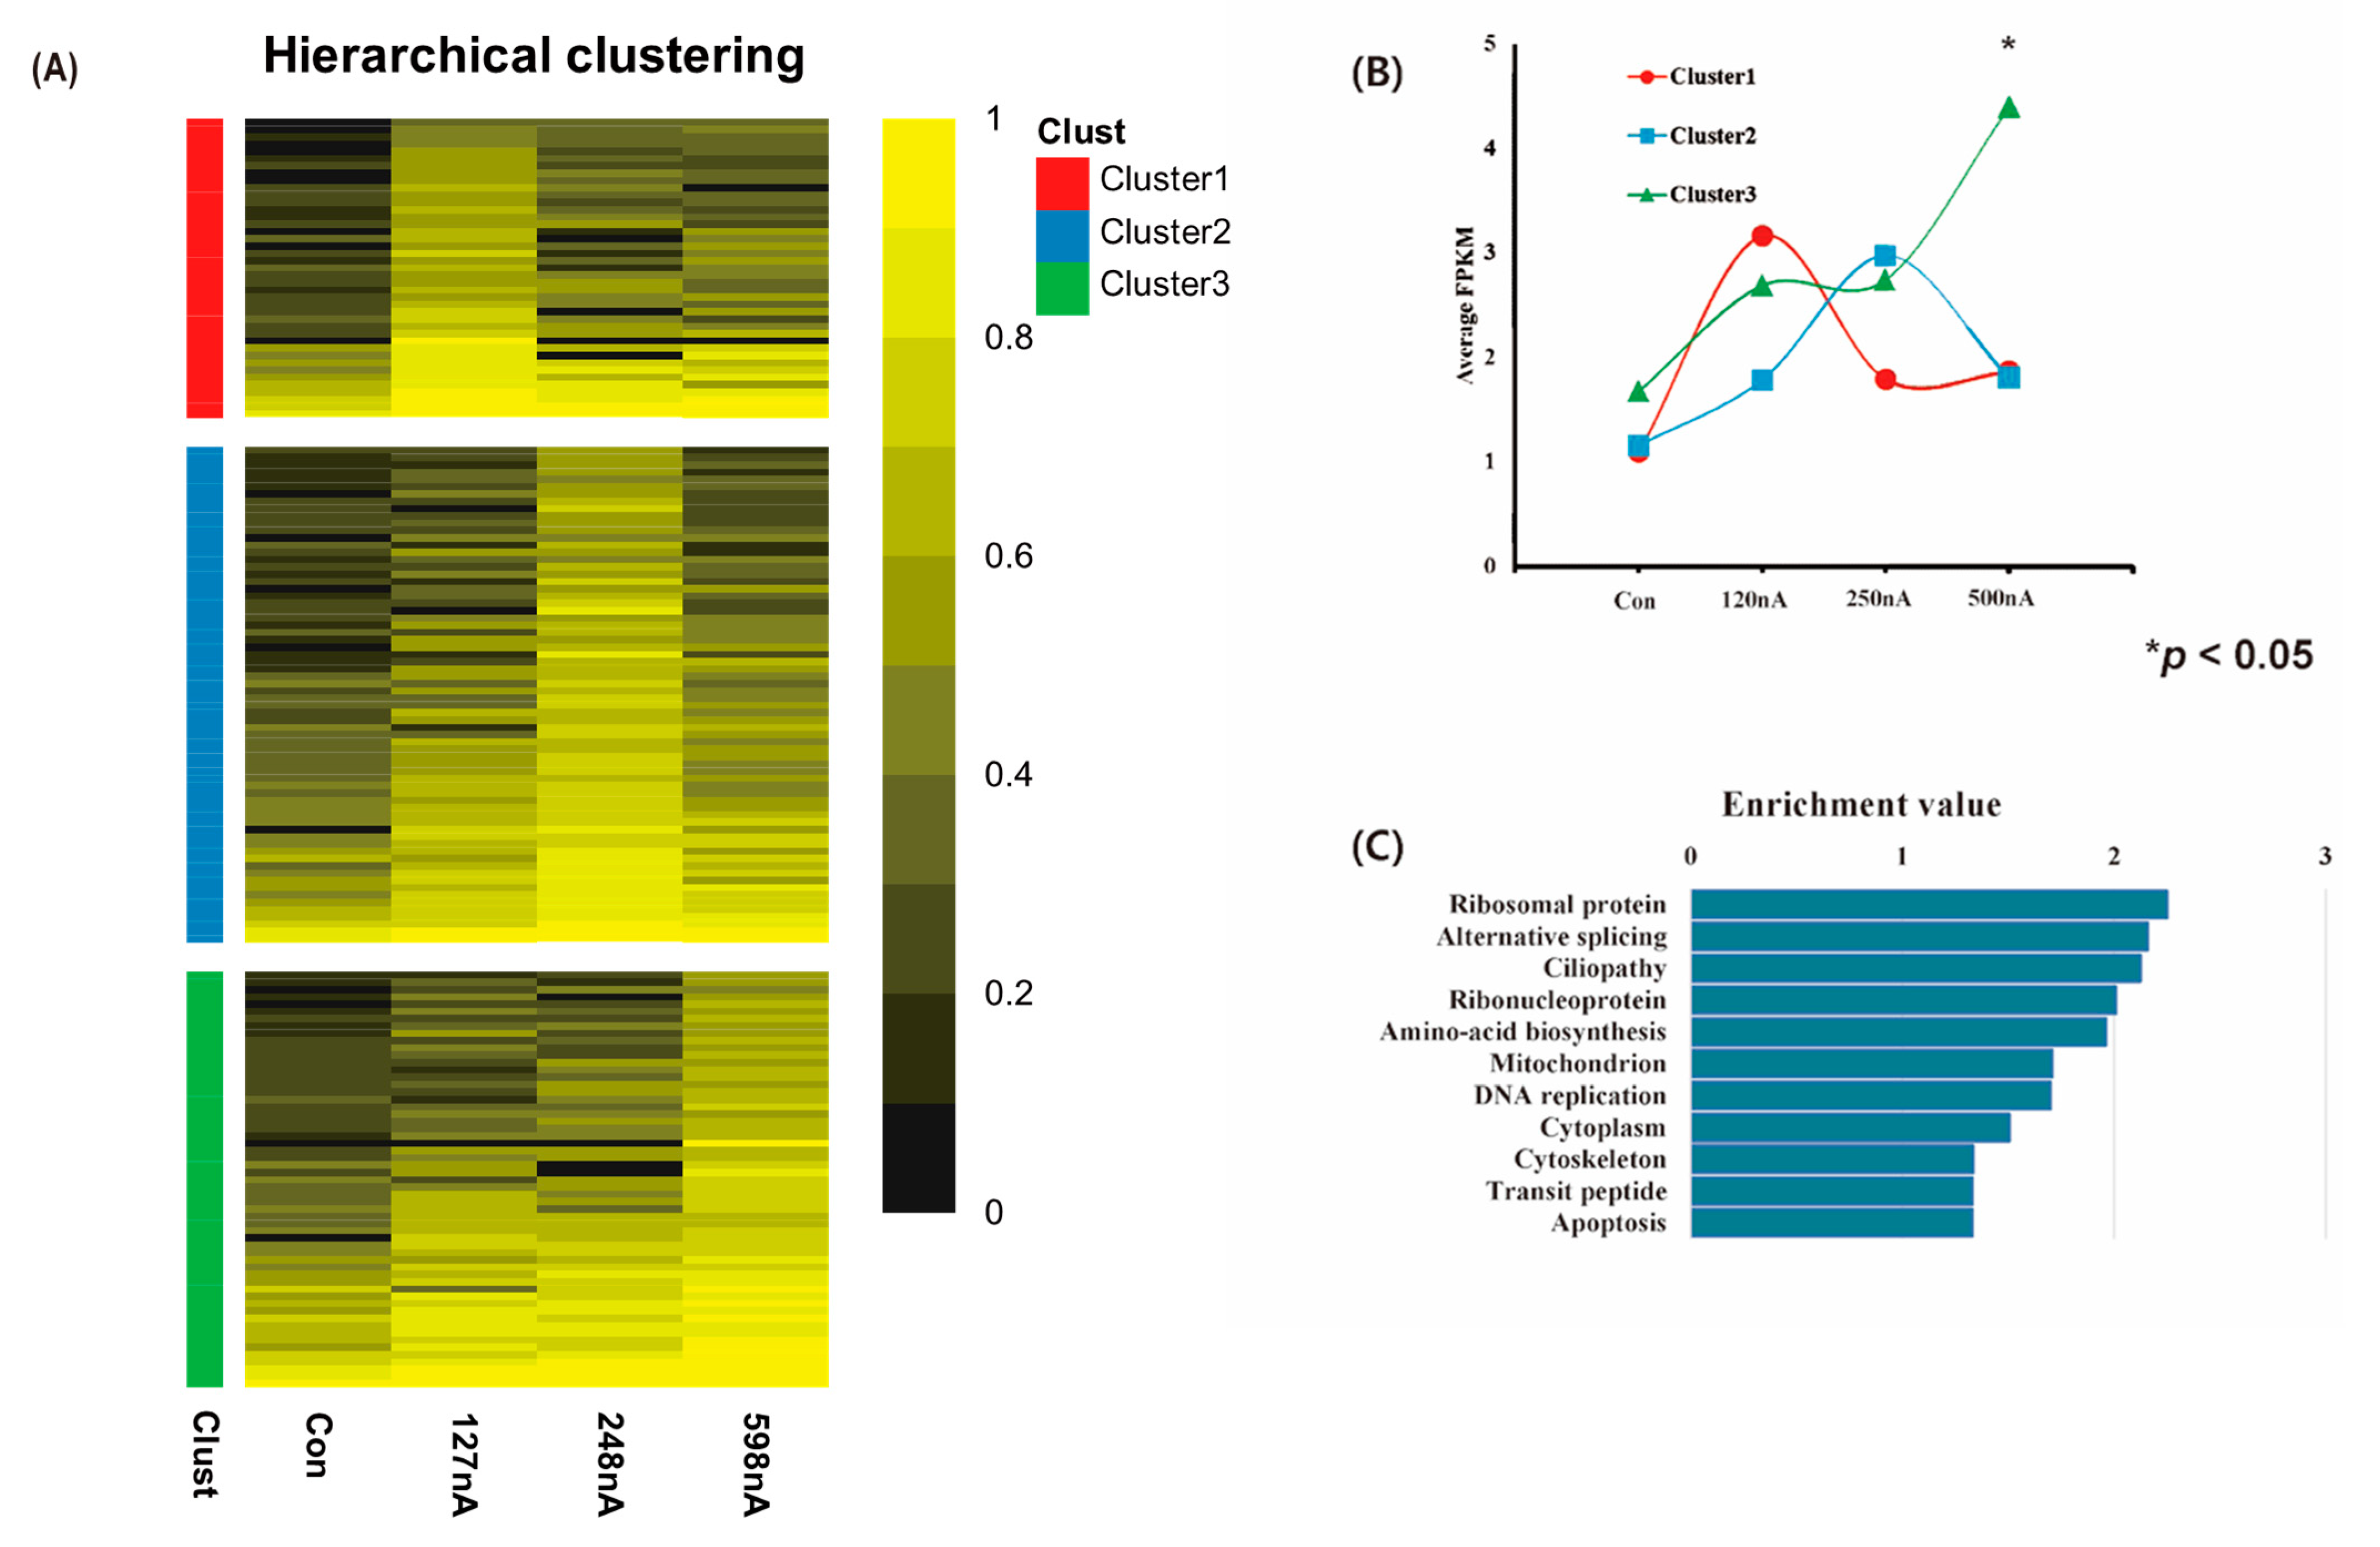
2.4. Transcriptomic Analysis of Electrically Stimulated hAD-MSCs

We next investigated mRNA expression profiles of MSCs that were subjected to electrical stimulation over time. We first confirmed that the sequencing quality of the purified mRNA was acceptable with several quality measures (e.g., total number of reads and genome coverage; Figure 5A). Cluster analysis of the DEGs in hAD-MSCs affected by electrical stimulation was performed. Therefore, we screened significantly up- and down-regulated gene clusters (filtering p < 0.05) (Figure 5A,B).
To determine transcriptomic differences between the control and EBFC groups, we analyzed RNA-seq data by Pearson correlation coefficient and hierarchical clustering. The results showed a dose-dependent increase in the distance of gene expression clusters from 127 nA/cm2, 248 nA/cm2, and 598 nA/cm2 electrical stimulation (Supplementary Figure S2), which means the gene expression profiling significantly changed depending on the electrical current. A total of 166 up-regulated genes showing gene expression significance compared to the control in each electrical condition were used for hierarchical clustering analysis, based on log2 Fragment per Kilobase of transcript per Million mapped reads (FPKM) values. We found that the up-regulated genes were divided into three clusters according to the highest expression level at each current (127 nA/cm2: red present 41,248 nA/cm2: blue present 68,598 nA/cm2: green present 57 genes). In the hierarchical clustering graph, the EBFC-generated electrical current induced differential gene expression in hAD-MSCs (Figure 5A). When comparing the expression level of the up-regulated genes, the three clusters showed a significantly higher expression by the electrical stimulation of EBFC (Figure 5B). To classify the functions of the 166 up-regulated genes in the EBFC group, we analyzed the genes using the UniProtKB database in the DAVID functional annotation tool v6.8 [38]. Among the 166 up-regulated genes, 98 genes were significantly enriched in UniProtKB functional categories such as ribosomal protein, alternative splicing, ribonucleoprotein, and amino-acid biosynthesis (Figure 5B,C). Metabolic regulation likely changed rapidly by promoting the tricarboxylic acid (TCA) cycle and subsequent oxidative phosphorylation in mitochondria. Up-regulation of genes related to amino-acid and nucleotide synthesis may have increased as a result of changes in TCA cycle genes [39].

2.5. Transcriptome Visualization of Electrically Stimulated hAD-MSCs by Reduce Visualize Gene Ontology (REVIGO) Program

The REVIGO program was used to visualize the statistically enriched GO terms in DEGs (>2-fold), using a clustering algorithm that relies on semantic similarity measures [40]. We imaged the major GO data using scatter plots and interactive graphs for each functional gene cluster under each culture condition (Figure S3). In Figure S3A, 127 nA/cm2 of electrical stimulation induced up-regulation genes regarding “alcohol metabolism”, “detection of stimulus”, “NIK/NF-κB signaling”, and “epithelial cell proliferation” on day 3. Next, “metal ion transport”, “inositol phosphate biosynthesis”, “drug membrane transport” and “NIK/NF-κB signaling” gene was notably up-regulated with 248 nA/cm2 electrical current caused by the EBFC (Figure S3B). On the other hand, 598 nA/cm2 of electrical current induced the up-regulated gene groups classified as “multicellular organismal process”, “cell surface receptor signaling pathway”, and “detection of stimulus” on day 3 (Figure S3C). Figure S3D,E showed the up-and down-regulation of specific gene groups on day 6. Specifically, 127 nA/cm2 and 248 nA/cm2 electrical stimulation significantly up-regulated “G-protein coupled receptor signaling pathway”, “response to stimulus”, “cell fate commitment”, “sensory perception”, and “glial cell differentiation” over 6 d (Figure S3E). In the case of 598 nA/cm2, the electrical stimulation led to up-regulation of "response to stimulus" and "regulation of localization and transport" gene groups on day 6. However, it down-regulated to "negative regulation of skeletal muscle cell differentiation" on day 6 (Figure S3F).

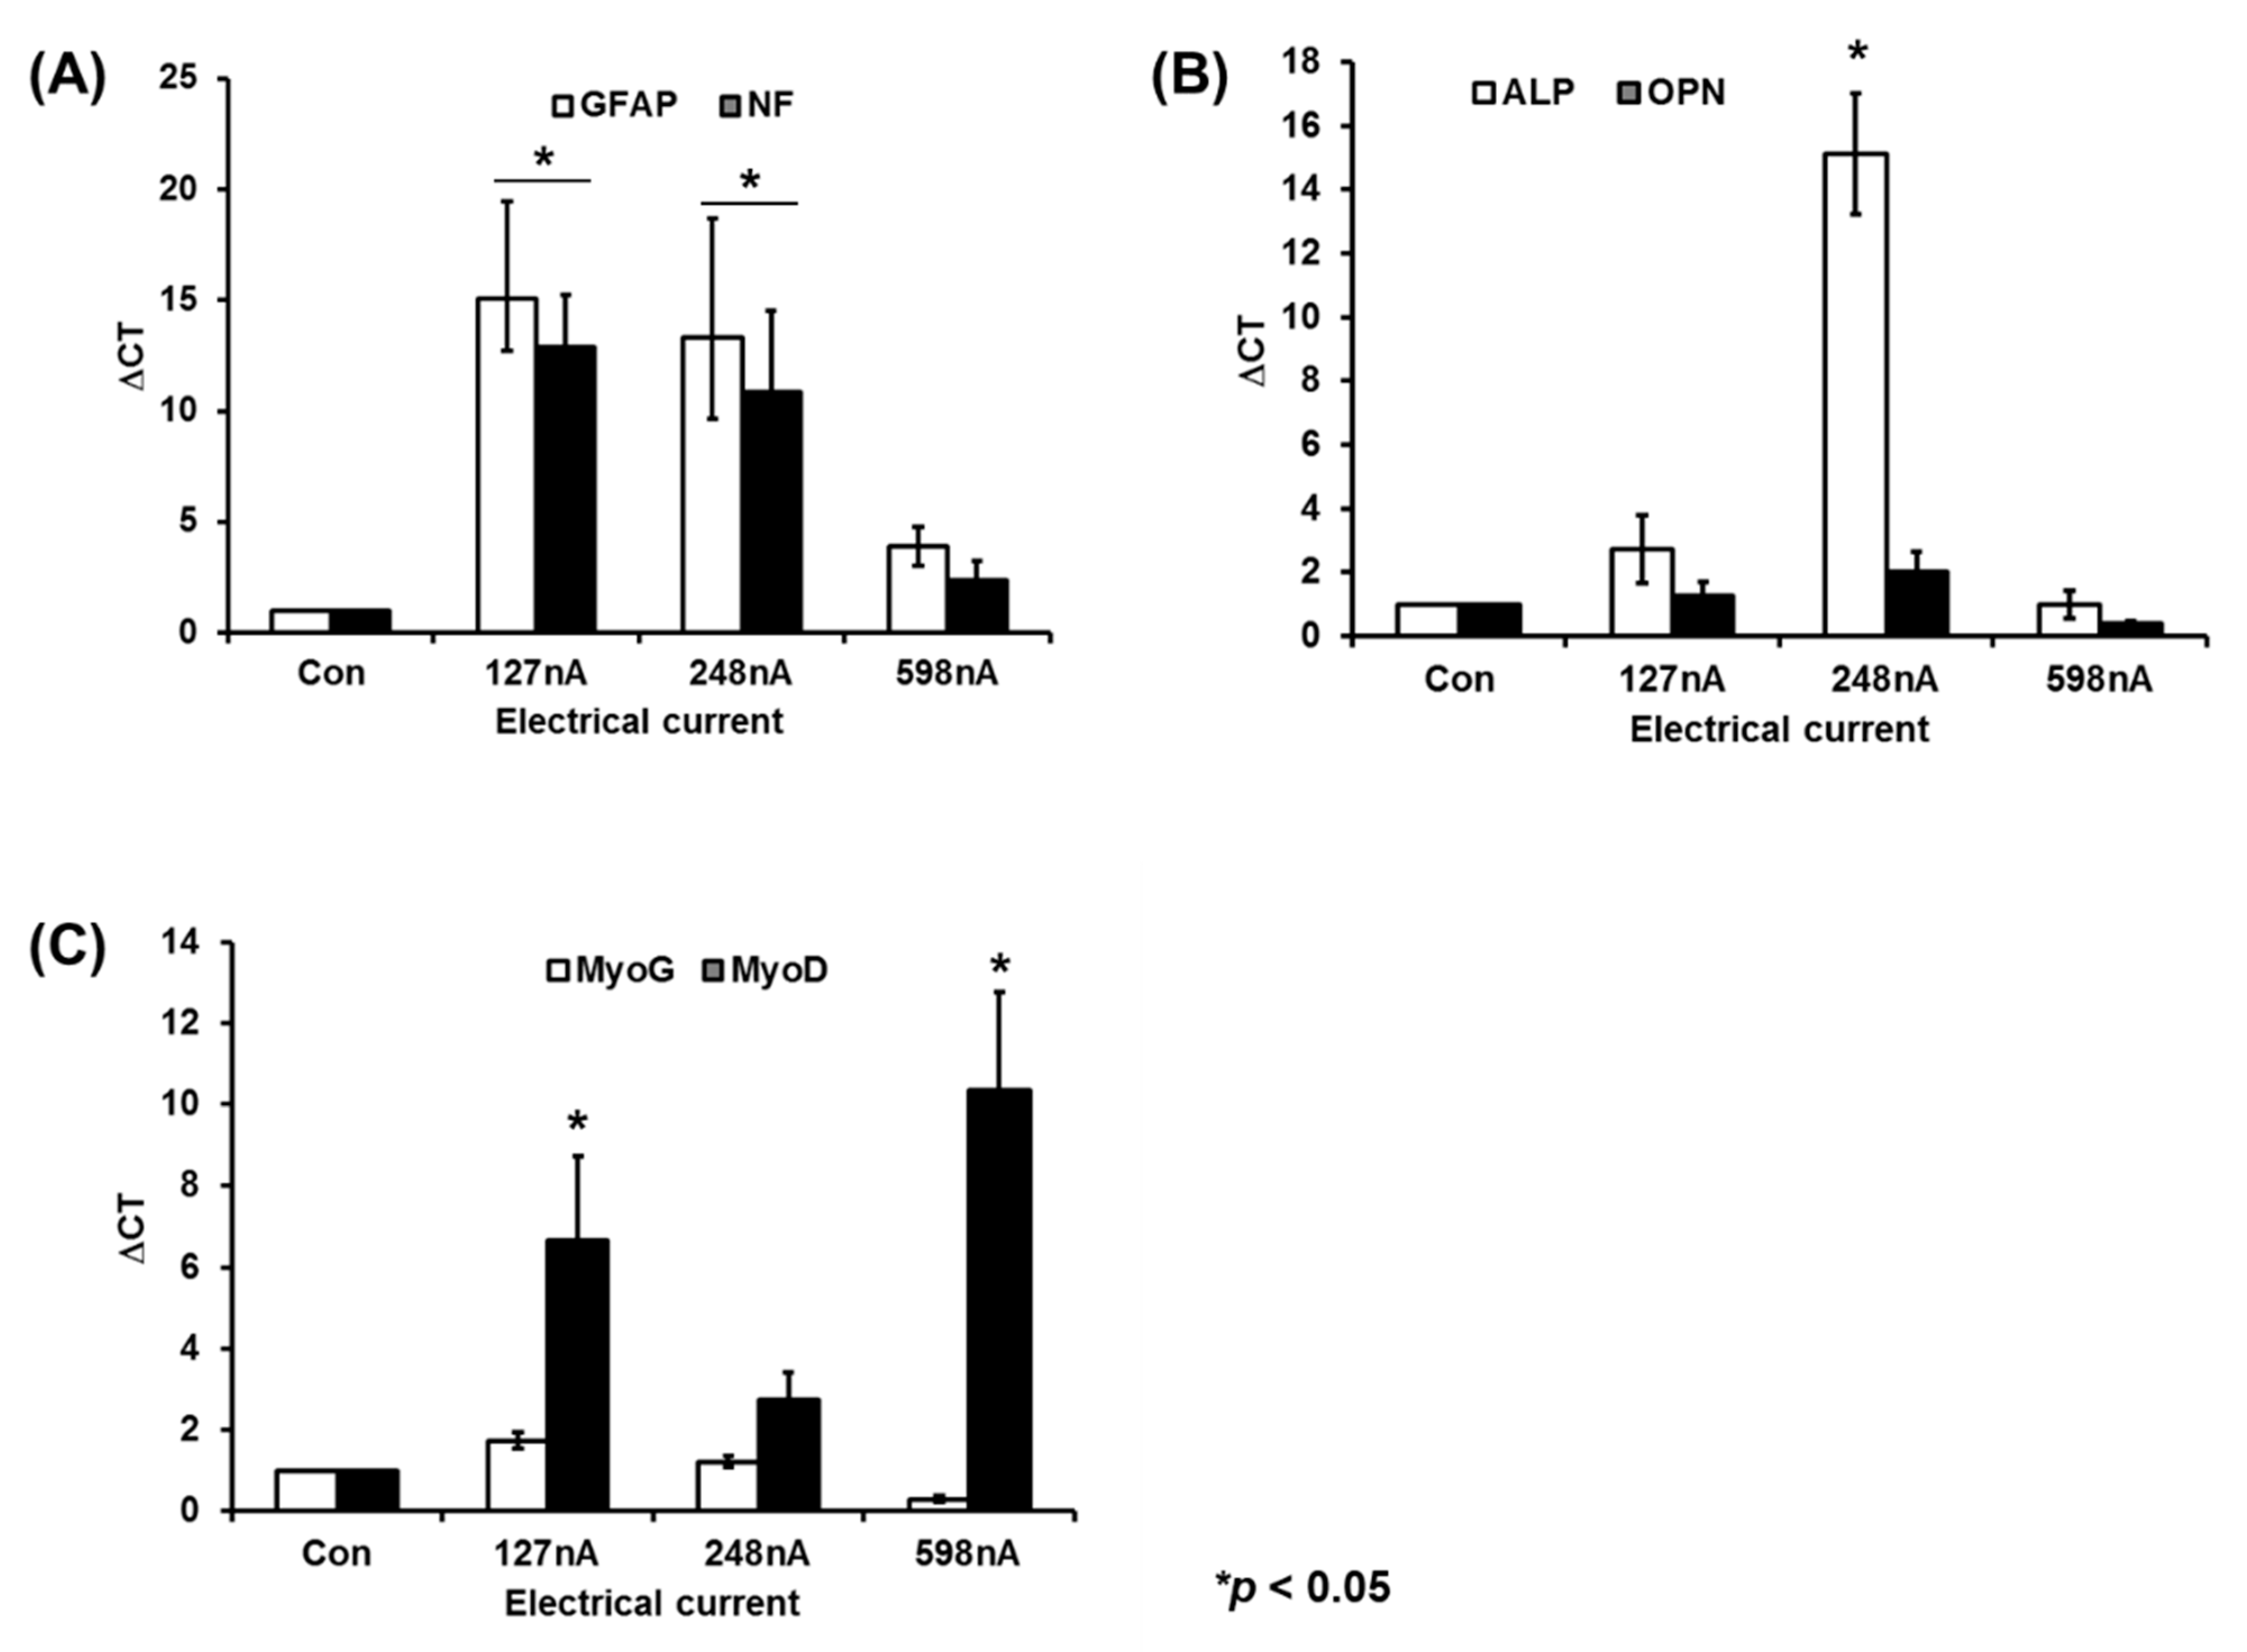
2.6. Early-Phase Differentiation-Related Gene Expression of Electrically Stimulated hAD-MSCs

We next performed real-time qPCR analysis of early-phase differentiation-related genes in hAD-MSCs under electrical stimulation at day 6 (Figure 6A–C). We analyzed neurogenesis-, osteogenesis-, and myogenesis-gene related expression after nano-electrical stimulation. Each electrical current increased early differentiation markers in a current-specific manner after 6 d. The current densities of the three EBFC conditions are summarized in Figure S3. The 127 nA/cm2 and 248 nA/cm2 levels of EBFC electrical current ranges induced early neurogenesis genes such as GFAP and NF, after 6 d culture. ALP, which is an early osteogenesis marker, increased after culture with 248 nA/cm2 electrical current of EBFC. Finally, both 127 nA/cm2 and 598 nA/cm2 of electrical current enhanced MyoD gene-like early myogenesis markers after 6 d.

3. Discussion

In this study, we found that electrical stimulation of EBFCs can control the property of MSCs. Based on the immunocytochemistry images and transcriptomic data, electrically stimulated hAD-MSCs clearly exhibited specific DEG clusters after electrical stimulation for days 3 and 6.
Interestingly, immunocytochemistry of electrically stimulated hAD-MSC exhibited dramatically altered actin assembly formation depending on the electrical current. F-actin as an actin-cytoskeleton block is an important signaling transfer and responder cue to cell from the extracellular space [41]. FAK is one of the regulatory factors at adhesion zones for influencing cell behaviors like proliferation, migration, and differentiation [42]. Generally, FAK can improve cell migration, proliferation, and the prevention of cell apoptosis through the integrin signaling pathway [43]. Electrically stimulated hAD-MSCs show that FAK proteins move from focal adhesion point and the edges of cell focal adhesion points. Intracellular localization of FAK promoted cell proliferation and migration [44]. Also, FAK and F-actin assembly linked for cell signaling from outside signal for regulation of cell behaviors [45,46]. In particular, the FAK linked with actin cytoskeleton for response from physical cure like mechanotransduction of mechanical sensing [47,48,49,50,51,52]. Indeed, environmental mechanosensing is a crucial element for stress fiber organization and the fate determination of stem cells [53,54]. Therefore, optimal electrical stimulation influences the FAK linked actin-cytoskeleton to stem cell behavior.
Additionally, our results indicate that gene expression profiling and hAD-MSC behavior can be regulated by nano-scale electrical currents (Figure S2A,B). Based on bioinformatics analysis, we found several hundred different genes that underwent up- or down-regulation in response nano-levels of electrical stimulation. Based on the GO data analysis, each of the gene profiles was associated with specific up-, stay-, and down-regulated genes by specific electrical currents, such as NF for neurogenesis, myofibril assembly for myogenesis, and acid phosphatase activity for osteogenesis [55,56,57]. The functional annotation enrichment data presented an effect of EBFC electrical stimulation up-regulated protein translation activity, including ribosomal proteins, which is essential for cell differentiation [58]. Therefore, the data presents the potential of EBFC for regenerative medicine applications.
Here, we attempted to understand the mechanism underlying EBFC electrical stimulation and which gene clusters are up- and down-regulated during electrically induced hAD-MSC differentiation. Several reports indicate that protein-based ligand binding forces are determined by electrical status and electrical constants [59,60]. Therefore, we suggest that EBFC electrical stimulation could supply a specific electrical status or constant condition depending on the EBFC-generated electrical current. Ligand binding interactions with receptors are primarily driven by an electrical constant. Each ligand-like growth factor has a different electrical constant controlling receptor binding [60]. Therefore, an electrical constant mimicked by EBFCs could induce specific signaling, gene expression, or regulation similar to the specific ligand as a biophysical cue for regulation of MSC behavior. In the real time-qPCR data, specific electrical current range of EBFC occurred for expression of specific early differentiation genes in the hAD-MSC like GFAP, ALP and MyoD [39,57,61]. Therefore, nano-ampere range electrical stimulation may have an application tool for directional differentiation of mesenchymal stem cells that could be useful for regenerative medicine applications. Indeed, EBFCs have excellent reported biocompatibility for in vitro and in vivo implantation, and could also be useful for wearable sensors and devices. Indeed, our findings show that EBFCs have excellent potential to create self-powered devices for wearable sensor and medical implant applications related to bioelectrical stimulation of cells [3,23,62]. This potential is further supported by past animal studies showing that implanted EBFCs can be self-powered intracorporeally [62,63].
Taken together, we identified gene sets related to various biological pathways associated with electrically stimulated hAD-MSCs based on an EBFC system. Nano-scale electrical stimulation induced specific gene expression profiles under constant electrical currents. The specific range of electrical currents induced differentiation depending on the culture time. In general, regeneration processes require cell growth for tissue repair and differentiation for specific cell or tissue recovery processes. Electrical stimulation can be used for directional hAD-MSC differentiation into neurons, muscle cells, and bone/multi-organ processing between 248 and 598 nA/cm2. Our results could have potential applications using MSC differentiation for wound repair via direct EBFC electrical stimulation. Further, our data show the feasibility of MSC-based biomedical engineering using direct EBFC-generated electrical stimulation.

4. Materials and Methods

4.1. Chemicals

Screen-printed carbon electrodes (Electrodag 423SS, Acheson, CA, USA) were prepared in-house on OHP films using a screen-printing machine (BS-860AP, Bando, Jeonam-do, Korea). Glucose oxidase (GOx) derived from Aspergillus niger (243 U/mg) was purchased from Amano Enzyme Inc. (Nagoya, Japan). Bilirubin oxidase (BOD) from Myrothecium verrucaria (10.5 U/mg, B0390), ammonium hexachloroosmate (IV), 4,4’-dimethoxy-2,2’-bipyridine, poly(ethylene glycol) diglycidyl ether (PEGDGE), sodium hydrosulfite, 1-vinylimidazole, and azobisisobutyronitrile (AIBN) were purchased from Sigma Aldrich (Milwaukee, WI, USA). Phosphate-buffered saline (PBS, 4.3 mM NaH2PO4, 15.1 mM Na2HPO4, and 140 mM NaCl) and all other aqueous solutions were prepared using deionized Milli-Q water (Millipore, Bedford, MA, USA). The mediator named PVI-[Os(dmo-bpy)2Cl]+/2+ was provided by Prof. Hyug-Han Kim’s group. All chemicals used were of analytical grade.

4.2. Preparation of Enzyme Electrodes

EBFC electrodes were prepared using an enzyme loading solution. The loading solutions for enzyme electrodes were composed of enzyme, redox mediator, and cross-linker. The anodic catalyst comprised 4:4:1 (v/v/v) cross-linked GOx adduct (Amano Enzyme Inc., Japan: 0.05, 0.02, and 0.01 mg/mL), PVI-[Os(dmo-bpy)2Cl]+/2+ (1 mg/mL), and PEGDGE (5.0 mg/mL). The cathodic catalyst consisted of 4:4:1 (v/v/v) cross-linked BOD adduct (0.05, 0.025, and 0.01 mg/mL: Sigma enzyme), PVI-[Os(dmo-bpy)2Cl]+/2+ (1 mg/mL), and PEGDGE (5.0 mg/mL). 10 μL loading solution mixtures were placed on the SPCEs, which were then dried for 24 h in a desiccator at room temperature (25 ± 1 °C). To prevent microorganism contamination and to ensure electrode sterility, electrodes were sterilized using ethylene oxide (EO) (Person-EO50, Person medical, Gyeonggi-do, Korea).
We measured oxidation and reduction ratios of GOx and BOD enzymes in cell culture media. We utilized a specific colorimetric dye, WST-8 (2-(2-methoxy-4-nitrophenyl)-3-(4-nitrophenyl)-5-(2,4-disulfophenyl)-2H-tetrazolium, monosodium salt), as the reporter. It is a formazan chemical dye that, upon bioreduction of the electron carrier, changes color depending on the electron concentration in the culture media. The colorimetric reaction of GOx and BOD was analyzed with a microplate reader (Epoch microplate spectrophotometer; BioTek Instruments, Inc., Winooski, VT, USA) based on the absorbance intensity at 450 nm wavelength.

4.3. EBFC Set-Up for 2D Cell Culture

The hAD-MSCs (1 × 10⁵ cells/mL) were seeded and cultured in a 35 mm dish set up under three different enzyme concentrations as 0.01 mg/mL, 0.05 mg/mL, and 0.1 mg/mL and without enzyme as the negative control (printed carbon only without enzyme). Cell seeding on the culture dish was completed until adhesive on the dish was replaced by alpha MEM high glucose (4500 mg/mL) media supplemented with 10% FBS for electrical stimulation of EBFC. The enzyme-loaded cathode and anode electrodes were inserted into the EBFC system. We made the film ring and cascade of both BOD and GOx enzymes. Starting at the initial time point, the cells were cultured at predetermined time points for required assays.

4.4. Measurements of Electrical Currents

A CHI 660B potentiostat/galvanostat (Austin, TX, USA) was used to obtain linear sweep voltammetry (LSV) and amperometry (I-t curve) data. The GOx based working electrode was carried out for LSV with/without 25 mM glucose in 1X PBS solution. The I-t curves were measured using different concentrations of GOx modified electrode by immersing the EBFC in cell culture media. A BOD-modified screen-printed carbon electrode (SPCE; 3.0 mm diameter) was used as the working electrode. GOx-modified SPCEs were used as the counter and reference electrode. The experiments were carried out under ambient air conditions at room temperature.

4.5. Human Adipose-Derived Mesenchymal Stem Cell Preparation and Maintenance

hAD-MSCs (HUXMD-01001, Cyagen Biosciences Inc., Santa Clara, CA, USA) were cultured with MSC media (HUXMD-90011, Cyagen Biosciences Inc., Santa Clara, CA, USA) and 1% penicillin/streptomycin (10378016; Invitrogen, Carlsbad, CA, USA) at 37 °C in a humidified atmosphere containing 5% CO2. Cells were harvested for subculture every 3 d by trypsinization, washing, and re-suspending at 1 × 10⁵ cells/mL in normal growth medium. Less than 80% confluence was maintained throughout all experiments.

4.6. Cell Survival, Proliferation and Cell Morphology under Electrical Stimulation

Cell proliferation was determined under EBFC electrical stimulation on days 3 and 6. On each experimental day, cells were harvested by trypsinization with a 0.25% trypsin/0.53 mM EDTA solution. Cell number was determined using a hemocytometer, and dead cells were identified by trypan blue staining. Each sample was analyzed in triplicate for statistical analysis.
For cell morphology analysis, we performed immunocytochemistry with anti-rabbit focal adhesion kinase antibody in electrically stimulated hAD-MSCs. hAD-MSCs were fixed with 4% PFA for 5 min at 24 °C. The samples were then treated with 0.1% Triton-X for antigen retrieval and were washed with PBS. A polyclonal rabbit anti-FAK antibody (A-17, Santa Cruz Biotechnology, Dallas, TX, USA; 1:100 diluted with 0.1% BSA in PBS) was applied to samples, and incubated overnight at 4 °C. Thereafter, the samples were incubated with the anti-rabbit secondary FITC-conjugated antibody and mixed with phalloidin (A34055, Alexa Fluor 555 phalloidin, Invitrogen, Waltham, MA, USA) for 2 h at room temperature. The nuclei were stained with 1 µg/mL Hoechst® 33342 nuclear stain (H1399; Thermo Fisher Life Technologies, Pleasanton, CA, USA) for 5 min at room temperature. After washing thrice with PBS, the stained cells were mounting by anti-fade media (H-1000, Vectashield mouting media Vector Labs, Burlingame, CA, USA). Images of the stained cells were acquired using a confocal microscope (LSM700, Zeiss AG, Oberkochen, Germany), and were captured from all angles, and the z-stacks of 25–30 images were used for image analysis using ZEISS software (ZEN2008, ZEISS, Oberkochen, Germany).

4.7. mRNA-Seq Analysis

After electrical stimulation, hAD-MSCs were harvested by trypsinization, washed with PBS, and stored at -80 ºC until mRNA purification. All samples were processed with an mRNA purification kit (RNeasy Mini Kit; 74104, Qiagen, Frederick, MD, USA). Isolated mRNA was transferred to TheragenEtex (Suwon, South Korea) for NGS analysis. mRNA quality for each sample was measured, and only samples with optimal mRNA quality were used for subsequent NGS. Each sample sheet was prepared on a HiSeq 2500 System and 150 bp paired-end reads (Illumina, San Diego, CA, USA). We analyzed differentially expressed genes depending on each condition within specific gene clusters to identify hAD-MSC gene expression profiles and interaction networks due to EBFC nano-scale electrical stimulation.

4.8. Gene Ontology Analysis of Transcriptome Data

A gene ontology (GO) database was used to infer significantly enriched terms on each gene set using DAVID bioinformatics resources. The particular genes, which are shown by expression differences in each electrical stimulation condition, were evaluated to classify the function of genes using the DAVID functional annotation tool v6.8 (https://david.ncifcrf.gov/) with the UniProtKB dataset. Cumulative hypergeometric p-values and enrichment factors were calculated and used for filtering. The remaining significant terms were hierarchically clustered based on Kappa-statistical similarities among gene groups. A 0.3 kappa score was used as the threshold to categorize the tree into term clusters. A web-based program called REVIGO was used to determine the biological function of differentially expressed genes (DEGs). We employed a multidimensional scaling procedure to initially place the terms using an eigenvalue-decomposed pairwise distance matrix, followed by a stress minimization step.

4.9. Reverse Transcription-qPCR Analysis

We verified early phase differentiatial gene expression in hAD-MSCs by using RT-qPCR. Gene expression was analyzed using glial fibrillary acidic protein (GFAP), neurofilament (NF), osteopontin (OPN), alkaline phosphate (ALP), myogenin, and MyoD. Electrically stimulated mesenchymal stem cells were cultured for 6 d, harvested, and centrifuged. The resulting cell pellets were homogenized with a guanidine isothiocyanate-based cell lysis buffer (Qiagen Ltd., Frederick, MD, USA). Total RNA was extracted from the lysate by using a RNeasy Mini Kit (Qiagen Ltd., Frederick, MD, USA). Total RNA was converted to cDNA using a Superscript kit (Invitrogen) with random hexamers. qPCR was performed using Sensimix Plus SYBR master mix (Quantace) in a spectrofluorometric thermal cycler (Rotor-Gene 3000; Corbett Research, Saffron Walden, UK). RT-qPCR data were analyzed by the comparative threshold cycle (CT) method, with Glyceraldehyde-3-Phosphate Dehydrogenase (GAPDH) as the reference gene. Triplicate samples were tested. RT-qPCR primer sequences are presented in Table 2.

4.10. Statistical Analysis

Statistical analysis of whole transcriptome NGS data was performed by modified Fisher’s exact test method. All other data are expressed as mean ± standard error of the mean (SEM) in triplicate. Statistical analyses were carried out using one-way ANOVA with the significance level set at * p < 0.05. Significant differences are indicated by asterisks (p < 0.05) in each figure.

5. Conclusions

This study demonstrates that EBFCs can induce specific MSC differentiation via electrically stimulated neurogenesis, osteogenesis, and myogenesis. Moreover, our findings show how electrochemical characterization of EBFC-based sensors can be integrated together with biological methods and next-generation RNA sequencing to unravel the effects of EBFCs on hAD-MSC cell morphology and gene expression levels. Thus, EBFCs may have increased potential for therapeutic applications in regenerative medicine and can be further considered as components within wearable sensors and bioelectronic devices.

Supplementary Materials

The following are available online at https://www.mdpi.com/2073-4344/11/1/62/s1.

Author Contributions

W.-Y.J., S.M., contributed to sample collection, acquisition, analysis, and interpretation of data. W.B.N., K.K., K.H., and S.H., contributed provided critical discussions. H.-H.K., and J.H.L. contributed to study conception and design. All authors have read and agreed to the published version of the manuscript.

Funding

This work was supported by the Basic Science Research Program through the National Research Foundation of Korea (NRF) funded by the Ministry of Education, Science and Technology (2013R1A1A4A01012572). In addition, the work was supported in part by the Basic Science Research Program through the National Research Foundation of Korea (NRF), funded by the Ministry of Education (2019R1A2C1086882), and (2020R1C1C1005523).

Data Availability Statement

All raw sequencing data and analyzed results are deposited in the NCBI Gene Expression Omnibus (GEO). Data can be found under GEO accession number GSE140781.

Conflicts of Interest

The authors declare no conflict of interest.

References

  1. Hickey, D.P.; Reid, R.C.; Milton, R.D.; Minteer, S.D. A self-powered amperometric lactate biosensor based on lactate oxidase immobilized in dimethylferrocene-modified LPEI. Biosens. Bioelectron. 2016, 77, 26–31. [Google Scholar] [CrossRef] [PubMed] [Green Version]
  2. Jeon, W.Y.; Lee, J.H.; Dashnyam, K.; Choi, Y.B.; Kim, T.H.; Lee, H.H.; Kim, H.W.; Kim, H.H. Performance of a glucose-reactive enzyme-based biofuel cell system for biomedical applications. Sci. Rep. 2019, 9, 10872. [Google Scholar] [CrossRef]
  3. Kim, J.; Jeerapan, I.; Sempionatto, J.R.; Barfidokht, A.; Mishra, R.K.; Campbell, A.S.; Hubble, L.J.; Wang, J. Wearable Bioelectronics: Enzyme-Based Body-Worn Electronic Devices. Acc. Chem. Res. 2018, 51, 2820–2828. [Google Scholar] [CrossRef] [PubMed]
  4. Burdick, J.A.; Vunjak-Novakovic, G. Engineered microenvironments for controlled stem cell differentiation. Tissue Eng. Part A 2009, 15, 205–219. [Google Scholar] [CrossRef] [PubMed]
  5. Kondrashova, M.N. Control of mitochondria respiration during potentiating effects on the cell. Biofizika 1970, 15, 312–323. [Google Scholar] [PubMed]
  6. Levin, M. Bioelectric mechanisms in regeneration: Unique aspects and future perspectives. Semin. Cell Dev. Biol. 2009, 20, 543–556. [Google Scholar] [CrossRef] [PubMed] [Green Version]
  7. Levin, M.; Stevenson, C.G. Regulation of cell behavior and tissue patterning by bioelectrical signals: Challenges and opportunities for biomedical engineering. Annu. Rev. Biomed. Eng. 2012, 14, 295–323. [Google Scholar] [CrossRef] [PubMed]
  8. Peckham, P.H.; Knutson, J.S. Functional electrical stimulation for neuromuscular applications. Annu. Rev. Biomed. Eng. 2005, 7, 327–360. [Google Scholar] [CrossRef]
  9. Song, B.; Gu, Y.; Pu, J.; Reid, B.; Zhao, Z.; Zhao, M. Application of direct current electric fields to cells and tissues in vitro and modulation of wound electric field in vivo. Nat. Protoc. 2007, 2, 1479–1489. [Google Scholar] [CrossRef]
  10. Ud-Din, S.; Bayat, A. Electrical Stimulation and Cutaneous Wound Healing: A Review of Clinical Evidence. Healthcare 2014, 2, 445–467. [Google Scholar] [CrossRef] [PubMed] [Green Version]
  11. Chang, K.A.; Kim, J.W.; Kim, J.A.; Lee, S.E.; Kim, S.; Suh, W.H.; Kim, H.S.; Kwon, S.; Kim, S.J.; Suh, Y.H. Biphasic electrical currents stimulation promotes both proliferation and differentiation of fetal neural stem cells. PLoS ONE 2011, 6, e18738. [Google Scholar] [CrossRef] [Green Version]
  12. Du, J.; Zhen, G.; Chen, H.; Zhang, S.; Qing, L.; Yang, X.; Lee, G.; Mao, H.Q.; Jia, X. Optimal electrical stimulation boosts stem cell therapy in nerve regeneration. Biomaterials 2018, 181, 347–359. [Google Scholar] [CrossRef] [PubMed]
  13. Jin, L.; Hu, B.; Li, Z.; Li, J.; Gao, Y.; Wang, Z.; Hao, J. Synergistic Effects of Electrical Stimulation and Aligned Nanofibrous Microenvironment on Growth Behavior of Mesenchymal Stem Cells. ACS Appl. Mater. Interfaces 2018, 10, 18543–18550. [Google Scholar] [CrossRef] [PubMed]
  14. Kwon, H.J.; Lee, G.S.; Chun, H. Electrical stimulation drives chondrogenesis of mesenchymal stem cells in the absence of exogenous growth factors. Sci. Rep. 2016, 6, 39302. [Google Scholar] [CrossRef] [PubMed]
  15. Mobini, S.; Leppik, L.; Barker, J.H. Direct current electrical stimulation chamber for treating cells in vitro. Biotechniques 2016, 60, 95–98. [Google Scholar] [CrossRef] [PubMed] [Green Version]
  16. Lee, H.U.; Blasiak, A.; Agrawal, D.R.; Loong, D.T.B.; Thakor, N.V.; All, A.H.; Ho, J.S.; Yang, I.H. Subcellular electrical stimulation of neurons enhances the myelination of axons by oligodendrocytes. PLoS ONE 2017, 12, e0179642. [Google Scholar] [CrossRef] [PubMed] [Green Version]
  17. Liu, Y.; Grumbles, R.M.; Thomas, C.K. Electrical stimulation of embryonic neurons for 1 h improves axon regeneration and the number of reinnervated muscles that function. J. Neuropathol. Exp. Neurol. 2013, 72, 697–707. [Google Scholar] [CrossRef] [Green Version]
  18. Malyshevskaya, O.; Shiraishi, Y.; Kimura, F.; Yamamoto, N. Role of electrical activity in horizontal axon growth in the developing cortex: A time-lapse study using optogenetic stimulation. PLoS ONE 2013, 8, e82954. [Google Scholar] [CrossRef]
  19. Zhu, R.; Sun, Z.; Li, C.; Ramakrishna, S.; Chiu, K.; He, L. Electrical stimulation affects neural stem cell fate and function in vitro. Exp. Neurol. 2019, 319, 112963. [Google Scholar] [CrossRef]
  20. Jackson, A.; Zimmermann, J.B. Neural interfaces for the brain and spinal cord--restoring motor function. Nat. Rev. Neurol. 2012, 8, 690–699. [Google Scholar] [CrossRef]
  21. Jaermann, T.; Suter, F.; Osterwalder, D.; Luechinger, R. Measurement and analysis of electromagnetic fields of pulsed magnetic field therapy systems for private use. J. Radiol. Prot. 2011, 31, 107–116. [Google Scholar] [CrossRef] [PubMed]
  22. Yahiro, A.T.; Lee, S.M.; Kimble, D.O. Bioelectrochemistry. I. Enzyme Utilizing Bio-Fuel Cell Studies. Biochim. Biophys. Acta 1964, 88, 375–383. [Google Scholar] [PubMed]
  23. Barton, S.C.; Gallaway, J.; Atanassov, P. Enzymatic biofuel cells for implantable and microscale devices. Chem. Rev. 2004, 104, 4867–4886. [Google Scholar] [CrossRef] [PubMed]
  24. Heller, A. Miniature biofuel cells. Phys. Chem. Chem. Phys. 2004, 6, 209. [Google Scholar] [CrossRef]
  25. Mano, N.; Mao, F.; Heller, A. Characteristics of a miniature compartment-less glucose-O2 biofuel cell and its operation in a living plant. J. Am. Chem. Soc. 2003, 125, 6588–6594. [Google Scholar] [CrossRef]
  26. Rapoport, B.I.; Kedzierski, J.T.; Sarpeshkar, R. A glucose fuel cell for implantable brain-machine interfaces. PLoS ONE 2012, 7, e38436. [Google Scholar] [CrossRef] [Green Version]
  27. Halamkova, L.; Halamek, J.; Bocharova, V.; Szczupak, A.; Alfonta, L.; Katz, E. Implanted biofuel cell operating in a living snail. J. Am. Chem. Soc. 2012, 134, 5040–5043. [Google Scholar] [CrossRef]
  28. Rasmussen, M.; Ritzmann, R.E.; Lee, I.; Pollack, A.J.; Scherson, D. An implantable biofuel cell for a live insect. J. Am. Chem. Soc. 2012, 134, 1458–1460. [Google Scholar] [CrossRef]
  29. Wen, D.; Eychmuller, A. Enzymatic Biofuel Cells on Porous Nanostructures. Small 2016, 12, 4649–4661. [Google Scholar] [CrossRef]
  30. Zebda, A.; Gondran, C.; Le Goff, A.; Holzinger, M.; Cinquin, P.; Cosnier, S. Mediatorless high-power glucose biofuel cells based on compressed carbon nanotube-enzyme electrodes. Nat. Commun. 2011, 2, 370. [Google Scholar] [CrossRef] [Green Version]
  31. Justin, G.A.; Zhang, Y.; Cui, X.T.; Bradberry, C.W.; Sun, M.; Sclabassi, R.J. A metabolic biofuel cell: Conversion of human leukocyte metabolic activity to electrical currents. J. Biol. Eng. 2011, 5, 5. [Google Scholar] [CrossRef] [Green Version]
  32. Lee, K.D. Applications of mesenchymal stem cells: An updated review. Chang. Gung Med. J. 2008, 31, 228–236. [Google Scholar] [PubMed]
  33. Sigurjonsson, O.E.; Guethmundsson, K.O.; Guethmundsson, S. Mesenchymal stem cells. A review. Laeknabladid 2001, 87, 627–632. [Google Scholar] [PubMed]
  34. Guilak, F.; Cohen, D.M.; Estes, B.T.; Gimble, J.M.; Liedtke, W.; Chen, C.S. Control of stem cell fate by physical interactions with the extracellular matrix. Cell Stem Cell 2009, 5, 17–26. [Google Scholar] [CrossRef] [Green Version]
  35. Park, J.; Kim, P.; Helen, W.; Engler, A.J.; Levchenko, A.; Kim, D.H. Control of stem cell fate and function by engineering physical microenvironments. Integr. Biol. 2012, 4, 1008–1018. [Google Scholar]
  36. Zhang, B.; Fan, L.; Zhong, H.; Liu, Y.; Chen, S. Graphene nanoelectrodes: Fabrication and size-dependent electrochemistry. J. Am. Chem. Soc. 2013, 135, 10073–10080. [Google Scholar] [CrossRef] [PubMed]
  37. He, J.; Jiao, Y. Next-generation sequencing applied to flower development: RNA-seq. Methods Mol. Biol. 2014, 1110, 401–411. [Google Scholar] [CrossRef] [PubMed]
  38. Banks, M.A.; Persily, G.L. Campus perspective on the National Institutes of Health public access policy: University of California, San Francisco, library experience. J. Med. Libr. Assoc. 2010, 98, 256–259. [Google Scholar] [CrossRef] [Green Version]
  39. Zhang, J.; Jiao, J. Molecular Biomarkers for Embryonic and Adult Neural Stem Cell and Neurogenesis. Biomed. Res. Int. 2015, 2015, 727542. [Google Scholar] [CrossRef] [Green Version]
  40. Hill, C.B.; Cassin, A.; Keeble-Gagnere, G.; Doblin, M.S.; Bacic, A.; Roessner, U. De novo transcriptome assembly and analysis of differentially expressed genes of two barley genotypes reveal root-zone-specific responses to salt exposure. Sci. Rep. 2016, 6, 31558. [Google Scholar] [CrossRef] [Green Version]
  41. Uzer, G.; Fuchs, R.K.; Rubin, J.; Thompson, W.R. Concise Review: Plasma and Nuclear Membranes Convey Mechanical Information to Regulate Mesenchymal Stem Cell Lineage. Stem Cells 2016, 34, 1455–1463. [Google Scholar] [CrossRef] [PubMed] [Green Version]
  42. Kleinschmidt, E.G.; Schlaepfer, D.D. Focal adhesion kinase signaling in unexpected places. Curr. Opin. Cell Biol. 2017, 45, 24–30. [Google Scholar] [CrossRef] [PubMed] [Green Version]
  43. Visavadiya, N.P.; Keasey, M.P.; Razskazovskiy, V.; Banerjee, K.; Jia, C.; Lovins, C.; Wright, G.L.; Hagg, T. Integrin-FAK signaling rapidly and potently promotes mitochondrial function through STAT3. Cell Commun. Signal. 2016, 14, 32. [Google Scholar] [CrossRef] [PubMed] [Green Version]
  44. Schlaepfer, D.D.; Hauck, C.R.; Sieg, D.J. Signaling through focal adhesion kinase. Prog. Biophys. Mol. Biol. 1999, 71, 435–478. [Google Scholar] [CrossRef] [Green Version]
  45. Moujaber, O.; Stochaj, U. The Cytoskeleton as Regulator of Cell Signaling Pathways. Trends Biochem. Sci. 2020, 45, 96–107. [Google Scholar] [CrossRef] [PubMed]
  46. Wozniak, M.A.; Modzelewska, K.; Kwong, L.; Keely, P.J. Focal adhesion regulation of cell behavior. Biochim. Biophys. Acta 2004, 1692, 103–119. [Google Scholar] [CrossRef] [PubMed]
  47. Alenghat, F.J.; Ingber, D.E. Mechanotransduction: All signals point to cytoskeleton, matrix, and integrins. Sci. STKE 2002, 2002, pe6. [Google Scholar] [CrossRef]
  48. Lee, F.Y.; Zhen, Y.Y.; Yuen, C.M.; Fan, R.; Chen, Y.T.; Sheu, J.J.; Chen, Y.L.; Wang, C.J.; Sun, C.K.; Yip, H.K. The mTOR-FAK mechanotransduction signaling axis for focal adhesion maturation and cell proliferation. Am. J. Transl. Res. 2017, 9, 1603–1617. [Google Scholar]
  49. Leucht, P.; Kim, J.B.; Currey, J.A.; Brunski, J.; Helms, J.A. FAK-Mediated mechanotransduction in skeletal regeneration. PLoS ONE 2007, 2, e390. [Google Scholar] [CrossRef] [Green Version]
  50. Shafrir, Y.; Forgacs, G. Mechanotransduction through the cytoskeleton. Am. J. Physiol. Cell Physiol. 2002, 282, C479–C486. [Google Scholar] [CrossRef] [Green Version]
  51. Shao, Y.; Mann, J.M.; Chen, W.; Fu, J. Global architecture of the F-actin cytoskeleton regulates cell shape-dependent endothelial mechanotransduction. Integr. Biol. 2014, 6, 300–311. [Google Scholar] [CrossRef] [PubMed] [Green Version]
  52. Wei, L.; Chen, Q.; Zheng, Y.; Nan, L.; Liao, N.; Mo, S. Potential Role of Integrin alpha(5)beta(1)/Focal Adhesion Kinase (FAK) and Actin Cytoskeleton in the Mechanotransduction and Response of Human Gingival Fibroblasts Cultured on a 3-Dimension Lactide-Co-Glycolide (3D PLGA) Scaffold. Med. Sci. Monit. 2020, 26, e921626. [Google Scholar] [CrossRef] [PubMed]
  53. Engler, A.J.; Sen, S.; Sweeney, H.L.; Discher, D.E. Matrix elasticity directs stem cell lineage specification. Cell 2006, 126, 677–689. [Google Scholar] [CrossRef] [PubMed] [Green Version]
  54. Zemel, A.; Rehfeldt, F.; Brown, A.E.; Discher, D.E.; Safran, S.A. Cell shape, spreading symmetry and the polarization of stress-fibers in cells. J. Phys. Condens. Matter. 2010, 22, 194110. [Google Scholar] [CrossRef] [PubMed] [Green Version]
  55. Denis-Donini, S.; Caprini, A.; Frassoni, C.; Grilli, M. Members of the NF-kappaB family expressed in zones of active neurogenesis in the postnatal and adult mouse brain. Brain Res. Dev. Brain Res. 2005, 154, 81–89. [Google Scholar] [CrossRef]
  56. Furst, D.O.; Osborn, M.; Weber, K. Myogenesis in the mouse embryo: Differential onset of expression of myogenic proteins and the involvement of titin in myofibril assembly. J. Cell Biol. 1989, 109, 517–527. [Google Scholar] [CrossRef]
  57. Rutkovskiy, A.; Stenslokken, K.O.; Vaage, I.J. Osteoblast Differentiation at a Glance. Med. Sci. Monit. Basic Res. 2016, 22, 95–106. [Google Scholar] [CrossRef] [Green Version]
  58. Zhou, X.; Liao, W.J.; Liao, J.M.; Liao, P.; Lu, H. Ribosomal proteins: Functions beyond the ribosome. J. Mol. Cell Biol. 2015, 7, 92–104. [Google Scholar] [CrossRef] [Green Version]
  59. Atanasova, M.; Whitty, A. Understanding cytokine and growth factor receptor activation mechanisms. Crit. Rev. Biochem. Mol. Biol. 2012, 47, 502–530. [Google Scholar] [CrossRef] [Green Version]
  60. Sanders, J.M.; Wampole, M.E.; Thakur, M.L.; Wickstrom, E. Molecular determinants of epidermal growth factor binding: A molecular dynamics study. PLoS ONE 2013, 8, e54136. [Google Scholar] [CrossRef] [Green Version]
  61. Bentzinger, C.F.; Wang, Y.X.; Rudnicki, M.A. Building muscle: Molecular regulation of myogenesis. Cold Spring Harb. Perspect. Biol. 2012, 4. [Google Scholar] [CrossRef] [PubMed]
  62. Ogawa, Y.; Kato, K.; Miyake, T.; Nagamine, K.; Ofuji, T.; Yoshino, S.; Nishizawa, M. Organic transdermal iontophoresis patch with built-in biofuel cell. Adv. Healthc. Mater. 2015, 4, 506–510. [Google Scholar] [CrossRef] [PubMed]
  63. Lee, D.Y.; Yun, J.H.; Park, Y.B.; Hyeon, J.S.; Jang, Y.; Choi, Y.B.; Kim, H.H.; Kang, T.M.; Ovalle, R.; Baughman, R.H.; et al. Two-Ply Carbon Nanotube Fiber-Typed Enzymatic Biofuel Cell Implanted in Mice. IEEE Trans. Nanobiosci. 2020, 19, 333–338. [Google Scholar] [CrossRef] [PubMed]
Figure 1. (A) Schematic illustrating the EBFC mechanism using electrodes with Os2+/3+ and PEVGEC. (B) Oxidation/reduction ratios of GOx (Anode) and BOD (Cathode) enzymes in the culture media. Open bar is GOx enzyme only as oxidation status, BOD enzyme only as reduction status and Full set is GOx and BOD enzyme in the dish as electrical current status.
Catalysts 11 00062 g001
Figure 2. (A) Linear sweep voltammogram of the anode electrode with glucose concentration of 25 mM (red line) and without glucose (black line). (B) The average EBFC electrical current with anodes fabricated using enzyme with concentration of 0.01 (blue), 0.05 (green), 0.1 (red), or 1.0 mg/mL (black). The inset is the measurement figure in the cell culture media.
Catalysts 11 00062 g002
Figure 3. Confocal microscopy imaging of immunocytochemistry staining hAD-MSC responses induced by EBFC electrical stimulation. (A) Cell morphology present depending on electrical current. (B) Cell viability in range of 127, 598, and 1870 ± 101 nA/cm2 electrical current during 2 h, 4 h, and 6 h. There was a statistically significant decrease in viability upon stimulation with 1870 nA/cm2 electrical current within 2 h * p < 0.05. (C) hAD-MSC proliferation ratios under EBFC electrical stimulation with 172, 248, and 598 nA/cm2 for 3 and 6 d. No significant difference between control and electrical stimulation groups.
Catalysts 11 00062 g003
Figure 4. Confocal microscopy imaging of electrically stimulated hAD-MSCs within optimal electrical current range. (A,B) Immunocytochemistry stained with anti-FAK (green) antibody and F-actin (red) dye of hAD-MSCs exposed to different electrical currents. (A) 1200× magnification and arrows point to focal adhesion kinase, Scar bar = 50 m). (B) Plot of numerical data of cytoskeleton formation. All data are means ±SEM from three independent replicates.
Catalysts 11 00062 g004
Figure 5. Gene expression profiles after EBFC treatment with different enzyme concentration. (A) Hierarchical clustering heatmap indicating differentially up-regulated genes (rows) compared with control hAD-MSCs. Color intensity indicates gene expression normalized using log2 FPKM values. Yellow and black indicate up- and down-regulation, respectively. Among 166 up-regulated genes, 41, 68, and 57 genes formed clusters 1 (red), 2 (blue), and 3 (green), respectively. (B) Average FPKM-normalized gene expression of the three up-regulated gene clusters. Each cluster exhibits an enzyme concentration-specific expression pattern. X and Y axes indicate sample and average FPKM values, respectively. (C) Functional annotation enrichment analysis of the 166 up-regulated genes, as categorized by UniProt Keywords (David annotation tool: https://david.ncifcrf.gov/). * p < 0.05.
Catalysts 11 00062 g005
Figure 6. Early-phase differentiation marker gene expression analyzed by real-time PCR. hAD-MSC gene expression was analyzed for the three EBFC electrical currents used in this study. (A) Neurogenesis-related gene expression. (B) Osteogenesis-related gene expression. (C) Myogenesis marker gene expression. All data are means ± SEM of three independent replicates. * p < 0.05.
Catalysts 11 00062 g006
Table 1. Electrical current density range (unit = nA/cm2) of EBFC depend on the enzyme concentration.
ConditionAnode Electrodes GOx
(Cathode Electrode; BOD Fixed to 0.1 mg/mL)
Enzyme concentration0.01 mg/mL0.05 mg/mL0.1 mg/mL1.0 mg/mL
IT current (nA/cm2) of the full system127 ± 9248 ± 15598 ± 751870 ± 305
Table 2. Primer sequences used to amplify gene by real-time RT-PCR.
Forward PrimerReverse Primer
GFAP5′-GGCGCTCAATGCTGGCTTCA-3′5′-TCTGCCTCCAGCCTCAGGTT-3′
NF5′-TCAAGGCTAAGACCCTGGAG-35-AGGCCATCTTGACATTGAGG-3
ALP5′-CCTCGTTGACACCTGGAAGAG-3′5′-TTCCGTGCGGTTCCAGA-3′
OPN5-ATCGATGTCCTTACTG-35-GGGATACTGTTCATCAGAAA-3
MyoG5-GGATATGTCTGTTGCCTTC-3′5-TGGGTGTTAGCCTTATGT-3
MyoD5-GGAGTGGCAGAAAGTTAAG-35-ACGGGTCATCATAGAAGTC-3
beta-actin5′-GCACCACACCTTCTACAATG-3′5′-TGCTTGCTGATCCACATCTG-3′
Publisher’s Note: MDPI stays neutral with regard to jurisdictional claims in published maps and institutional affiliations.

