2.1. The Effect of Surface Lligand on Co-Catalyst Doping
The photodegradation of perovskite QDs is one of the main factors limiting their photocatalytic efficiency. To understand the photodegradation behavior, we investigated the photophysical properties of various types of perovskite QDs: Pristine QD, encapsulated perovskite QD (QD/SiO
2), co-catalyst-doped perovskite QD (QD/Ni(ppy)), and encapsulated co-catalyst-doped perovskite QD (QD/Ni(ppy)/SiO
2). Organic–inorganic perovskite QDs were used in this study because of their conduction band alignment with the CO
2 reduction reaction [
9].
Figure 1a is a schematic illustration of the synthesis of QD/Ni(ppy)/SiO
2. The reaction conditions were modified from a previous ligand-assisted precipitation method [
10]. The pristine QDs was synthesized using oleic acid and oleylamine as a surface ligand (method 3.2). The transmission electron microscopy (TEM) image of a pristine QD demonstrated a cubic shape of approximately 5 nm side length (
Figure 1b). The photoluminescence quantum yield (PLQY) of this material was 71% with a full width at half maximum (FWHM) of approximately 27 nm (
Figure 1c). For QD/SiO
2 fabrication, the as-synthesized pristine QDs were re-dispersed in an APTES/toluene solution. Further, the 5 µL of ammonia was to ensure the silanization of the APTES (method 3.3) [
11,
12]. The QD/SiO
2 demonstrated a PLQY of 69% and an FWHM of approximately 21 nm (
Figure 1d). The PL peak position shifted from 511 to 516 nm after SiO
2 coating. In addition, the position of the band edge in the ultraviolet–visible (UV–Vis) spectra changed from 520 nm for pristine QD to 529 nm for QD/SiO
2. The TEM image in
Figure 1e indicates that the size of QD/SiO
2 increased to 15–30 nm. We determined the energy-dispersive X-ray spectroscopy (EDS) line profile for the TEM image in
Figure 1f. The EDS line profiles of several QDs were determined and all displayed similar behaviors.
Figure 1g indicates that QD/SiO
2 has a core-shell structure consisting of a perovskite QD core and a SiO
2 shell. The radius of the core was approximately 10 nm, which was larger than that of the pristine QD, and the SiO
2 shell thickness was approximately 5 nm. The larger particle size of perovskite QD/SiO
2 resulted in a redshift of the PL peak; however, the PLQY of QD/SiO
2 did not significantly change compared with pristine QD. We predict that core-shell structure enhanced the quantum confinement of QD/SiO
2, leading to a higher PLQY. Quantum confinement with size had a smaller impact on PLQY of QD/SiO
2 [
13].
The synthesis process for QD/Ni(ppy) is similar to that of pristine QDs. For QD/Ni(ppy), a trace of Ni(ppy) was mixed with the other precursors. The 5-hexynoic acid was additionally inserted with original surface ligands (method 3.5). Additional Ni(ppy) was added during purification to increase the Ni(ppy) content. During purification, a short alkyl ligand (i.e., 3-butynoic acid) was combined with Ni(ppy) in methanol to facilitate ligand exchange [
14] and the co-catalyst doping reaction (method 3.6). Without the Ni addition step during purification, QD/Ni(ppy) demonstrated a PLQY of 71% with a PL peak at 509 nm (FWHM ~26 nm in
Figure 2a). The absorption band edge displayed blueshift. Ni(ppy) appeared to prevent the lattice growth of perovskite QDs during ligand-assisted precipitation [
15]. However, when additional Ni(ppy) was introduced through ligand exchange during purification, the PL peak shifted to 511 nm (
Figure 2b). However, the PLQY of QD/Ni(ppy) dropped to 52% with a FWHM of 26 nm because of the Ni(ppy)-facilitated charge separation in the perovskite QDs [
16]. Finally, QD/Ni(ppy)/SiO
2 was fabricated via a modified ligand-assisted precipitation method, described in method 3.8. Once QD/Ni(ppy) was obtained, the QD/Ni(ppy) was re-dispersed in the APTES/toluene solution. Subsequently, 5 µL of ammonia was added to silanize the APTES. Then, Ni(ppy) was additionally inserted through the purification process. The obtained QD/Ni(ppy)/SiO
2 demonstrated a PLQY of 59% with a FWHM of 24 nm (
Figure 2c).
When we synthesized QD/Ni(ppy), we added Ni(ppy) with a short alkyl chain (i.e., 5-hexynoic acid) at the reaction pot. When QD/Ni(ppy) was fabricated without a short alkyl chain ligand (see process P1-1 in
Figure 3a), Ni(ppy) could not effectively interact with the perovskite QDs because the densely-packed oleic acid and oleylamine prevented the diffusion of Ni(ppy) to the perovskite QD surface [
17,
18]. As a result, QD/Ni(ppy) formed during P1-1 displayed no significant Ni peak in the X-ray photoelectron spectroscopy (XPS) spectrum (
Figure 3b). In contrast, when QD/Ni(ppy) was synthesized via a short alkyl chain ligand (P1-2 process in
Figure 3a), we could distinguish various Ni components via XPS. The deconvoluted XPS Ni 2p spectra of P1-2 in
Figure 3b revealed several oxidation states (i.e., Ni
3+ at 861.1 eV, Ni(OH)
2 at 857.5 and 878.9 eV, NiO at 855.6 and 875.5 eV, Ni(ppy) at 853.7 and 873.0 eV, and metallic Ni at 852 eV) [
19]. Even though a Ni
2+ precursor was used in the reaction, Ni(ppy) underwent oxidation and reduction. In particular, Ni
3+ was formed when the Ni precursor reacted with the vacant positions of methylammonium (MA
+) or Pb
2+ cations in perovskite structure [
20]. Thus, we obtained QD/Ni(ppy) with a high Ni
3+ content as well as NiO via P1-2 owing to in-situ doping reaction.
To increase catalytic efficiency, the co-catalyst mobility should be improved. Mobility is enhanced when Ni is in the form of metallic Ni
0 or Ni(ppy). We further developed the Ni(ppy) doping process via a ligand exchange strategy (P2-1 and P2-2 processes in
Figure 3a). In P2-1, ligand exchange with Ni(ppy) was conducted once, while in P2-2, ligand exchange with Ni(ppy) was conducted twice. P2-1 and P2-2 were executed using perovskite QDs produced via P1-2. During ligand exchange, a ligand with a shorter alkyl chain (i.e., 3-butynoic acid, which is shorter than 5-hexynoic acid) was used to replace the bound oleic acid and oleylamine as much as possible. P2-1 perovskite QDs contained similar oxidation states to those in P1-2 perovskite QDs (
Figure 3b). However, the intensity of the peak at 852 eV corresponding to metallic Ni
0 dramatically increased, while the intensity of the peak at 861.1 eV corresponding to Ni
3+ decreased after Ni(ppy) doping, indicating a co-catalyst composition conducive to charge separation. In addition, the total amount of Ni increased as the number of ligand exchange cycles increased (
Table 1).
We next measured the atomic ratio of Si and Ni after chemical SiO
2 coating using APTES (
Figure 3c). QD/Ni(ppy)/SiO
2 was fabricated using QD/Ni(ppy) from three different processes, namely P1-2, P2-1, and P2-2. QD/SiO
2 exhibited a Si content of 2.5%. When QD/Ni(ppy) was coated with SiO
2, the Ni content reduced slightly. The P1-2 product contained 0.13% Ni without SiO
2 coating, which reduced to 0.10% with SiO
2 coating. The P2-1 and P2-2 products yielded similar results. The Ni content reduced from 0.62% to 0.54% for P2-1 and from 4.20% to 4.12% for P2-2 after SiO
2 coating. Interestingly, QD/Ni(ppy)/SiO
2 fabricated via P2-1 displayed a lower Si content than QD/Ni(ppy)/SiO
2 fabricated via P2-2. This was attributed to the large solvated radii of the Ni(ppy)-rich QDs. Even though the Si content of QD/Ni(ppy)/SiO
2 produced via P2-2 was higher than those of other types of QD/Ni(ppy)/SiO
2, the Ni content was higher than the Si content, which is preferred for enhanced catalytic behavior. Finally, we examined the Ni and Si contents resulting from different Si coating methods, namely chemical (in-situ silanization) and physical (P3/SiO
2 in
Figure 3a). For P3/SiO
2, QD/Ni(ppy) was fabricated via P2-2 and subsequently deposited on the desired substrate. Then, a solution of 10 µM of APTES in benzene was spin-coated onto the QD/Ni(ppy) film and annealed at 50 °C for 5 min in a vacuum. Unlike chemical silanization, the Ni content rapidly decreased to 1.09%, while the Si content increased to 35%, indicating that an effective shell coating was only achieved via chemical silanization. Moreover, we examined the XPS Si 2p spectra (
Figure 3d) of QD/Ni(ppy)/SiO
2 produced via the different processes (i.e., P2-1/SiO
2, P2-2/SiO
2) to confirm the chemical composition of the SiO
2. A single peak appeared for both P2-1/SiO
2 and P2-2/SiO
2; however, the peak position shifted from a XPS binding energy (E
binding) of 102 eV for P2-1/SiO
2 to 104 eV for P2-2/SiO
2. In general, Si 2p ½ and ⅓ peaks appear at 102 eV. The shape of the resultant peak should be asymmetric because of the overlapping of the Si 2p ½ and ⅓ peaks. However, the XPS Si 2p spectra of P2-1/SiO
2 displayed a Gaussian shape, which indicated that the peak of the Si 2p spectra originated from the oxide form of Si [
21]. Thus, the peak shift of the binding energies was attributed to the doping effect [
22,
23].
Figure 3d shows that the N-type doping became stronger as ligand exchange with Ni(ppy) increased (E
binding (P2-1) < E
binding (P2-2)). Moreover, we examined the XPS Pb 4f spectra of pristine QDs, P1-2/SiO
2, and P2-2/SiO
2 (
Figure 3e). An n-type shift for P2-2/SiO
2 and a p-type shift for P1-2/SiO
2 relative to pristine QDs occurred. Both peak shifts were driven by strong chemical interactions between the perovskite QD, Ni(ppy), and the SiO
2 shell, which contributed to the redistribution of charge in the perovskite QDs [
24]. This confirms the PL results in
Figure 2 where the wavelength of the peak for P1-2/SiO
2 decreased and that of the peak for P2-2/SiO
2 increased compared to pristine QD.
2.2. The Photodegradation Phenomina of Perovskite QD
Next, we investigated the photophysical properties of the four different perovskite QDs: Pristine QD, QD/SiO
2, QD/Ni(ppy), and QD/Ni(ppy)/SiO
2.
Figure 4 demonstrates the photodegradation behavior of the QD solutions in ambient conditions. Each solution was exposed to UV light (1 mW), and a non-polar solvent, benzene, was used. The pristine QD displayed dramatic photodegradation as the duration of the exposure increased (
Figure 4a). The PL intensity halved after 20 min of UV exposure and the peak width increased because of defect generation. The PL intensity was almost zero after 30 min. In contrast, QD/Ni(ppy) fabricated via P1-2 displayed slightly higher PL intensity (4%) after 5 min of UV treatment, and an 11% loss of the original PL intensity after 30 min of UV treatment (
Figure 4b). Photodegradation appeared to have been suppressed by co-catalyst doping. We hypothesize that charge separation induced by the co-catalyst prevented hot-carrier generation and resulted in better photophysical stability [
25].
The SiO
2 coating inhibited photodegradation in QD/Ni(ppy).
Figure 4c shows the relationship between PL intensity and UV exposure time for QD/Ni(ppy)/SiO
2 produced via P2-2. A 29% enhancement in PL intensity was observed after 10 min of UV treatment, however, the intensity decreased as the UV exposure time increased further. However, after 30 min of UV exposure, QD/Ni(ppy)/SiO
2 still exhibited a higher PL intensity than that of the fresh sample. Interestingly, the PL peak of P1-2 was slightly red-shift as the UV exposure time increases, while no significant PL shift was observed for P2-2/SiO
2. In general, the perovskite QD demonstrates the red-shifted PL with the larger size of QD. Under the UV exposure, perovskite QD underwent crystal reconstruction with the Ni content; the crystal reconstruction was facilitated without hot carrier generation, leading to the collision with the nearby QDs. On the other hand, the P2-2/SiO
2 did not show the PL peak shift because the SiO
2 coating prevented the collision behavior, but it only facilitated the crystal reconstruction within one QD.
To elucidate photostability enhancement due to the SiO
2 coating, we conducted a PL-versus-power experiment. The results are shown in
Figure 4d. As the excitation power increased from 0.3 to 1 mW, the PL intensity of pristine QDs at 2.43 eV increased at rate of 3.50. The PL intensity at 2.40 eV of QD/SiO
2 increased more rapidly at a rate of 7.91. The PL intensity of pristine QDs rapidly plateaued with increasing excitation density. The numerous defects in pristine QDs limited the number of carriers available to generate excitons, resulting in a lower PL changes for pristine QDs compared with QD/SiO
2. We hypothesize that the SiO
2 coating plays an important role in passivating the surface defects of perovskite QDs [
26]. In contrast, the PL changes of the QD/Ni(ppy) with excitation power decreased in inverse proportion to the amount of Ni(ppy) doping. The PL changes of QD/Ni(ppy) with excitation power produced via P1-2 and P2-2 were 2.65 and 1.87, respectively. This phenomenon was attributed to the limited number of minor carriers in QD/Ni(ppy). After Ni(ppy) doping, charge carriers in the QDs effectively moved to the Ni(ppy), resulting in a loss of PL and a slower PL intensity increase with increasing excitation power [
27]. Next, we observed the photodegradation of pristine QDs, QD/SiO
2, QD/Ni(ppy), and QD/Ni(ppy)/SiO
2 in the form of films. First, the relationship between photodegradation and UV power was examined for pristine QDs (
Figure 5a) and for QD/Ni(ppy)/SiO
2 (
Figure 5b). Pristine QDs only sustained PL up to 0.08 mW UV exposure. At 0.6 mW and 0.3 mW UV exposure, pristine QDs exhibited PL enhancement for the first 20 min; however, PL degraded with further UV exposure. The PL enhancement during short low-power UV exposure was because of defect repair via UV light [
28]. However, SiO
2 coating prevented the photodegradation of perovskite QDs. At 0.6 mW, 0.3 mW, and 0.08 mW UV exposure, QD/Ni(ppy)/SiO
2 displayed PL enhancement for 40 min and the PL intensity was maintained.
Photodegradation due to high-power UV exposure was significantly different even for short exposure times. Pristine QDs exhibited a 19% PL loss after only 6 min at 1 mW UV light exposure (
Figure 5c). QD/Ni(ppy) produced via P1-2 displayed the opposite tendency (
Figure 5d), namely an increase in PL at 1 mW UV light exposure up to 3 min. Compared to the PL spectra of the solution, the PL spectra of the film became broader because the stacked QD/Ni(ppy) in the film facilitated intermolecular charge transport between the QD and the Ni co-catalyst [
29]. In contrast to PL enhancement during short low-power UV exposure, only the P1-2 sample displayed PL enhancement with high-power UV exposure, which was attributed to defect repair via UV light. We hypothesize that the effective interaction between the perovskite QD and Ni(ppy) in the P1-2 sample inhibited hot-carrier generation under high-power UV light and enhanced PL intensity. In addition, the two discernible PL peaks appeared for P1-2 sample due to the crystal reconstruction and collision behavior under UV exposure, as we mentioned. Hence, QD/Ni(ppy) produced via P2-2 did not show PL enhancement with 1 mW UV light exposure (
Figure 5e), but it demonstrated a smaller PL loss (10%) than that of pristine QDs. Finally, QD/Ni(ppy)/SiO
2 produced via P2-2 displayed no significant change during 1 mW.
To demonstrate the importance of the interface between the QD and the Ni complex, we used NiBr
2 as the Ni doping precursor. In contrast to Ni(ppy), the PL intensity did not decrease as the amount of Ni doping increased (
Figure 6a). The PL intensity of QD/NiBr
2 increased by 20% after a single ligand exchange and by 28% after a double ligand exchange. However, QD/Ni(ppy) displayed excellent PL quenching behavior because of the strong interaction between the QDs and Ni(ppy) and the multi-electron-conjugated structure of Ni(ppy), which enhanced the electron transfer and storage ability of the Ni co-catalyst [
30]. Interestingly, when we conducted the P2-1 process without P1-2 pre-treatment, the resultant QD/Ni(ppy) displayed significantly lower PL quenching behavior because of the small amount of immobilized Ni(ppy) (
Figure 6b), but still exhibited a 6% PL loss with 20 μM Ni(ppy) addition. With P1-2 pre-treatment, the PL intensity dramatically decreased as the amount of Ni doping increased because of effective charge separation (
Figure 6c), indicating that P1-2 promoted interactions between Ni(ppy) and QD during Ni doping via the ligand exchange processes (i.e., P2-1 and P2-2).
The TCSPC PL spectra supported this result (
Figure 6d). The PL lifetimes of pristine QD, QD/Ni(ppy) via P2-2, QD/SiO
2, and QD/Ni(ppy)/SiO
2 were 6.80 ns (χ
2 = 1.031), 4.87 ns (χ
2 = 1.007), 13.60 ns (χ
2 = 1.010), and 6.15 ns (χ
2 = 0.984), respectively; χ
2 is the reduced chi-squared value. After Ni(ppy) doping, the PL lifetime of QD/Ni(ppy) decreased to less than that of pristine QD because of charge separation. In contrast, the PL lifetime of QD/SiO
2 dramatically increased because of defect passivation. As a result, QD/Ni(ppy)/SiO
2 produced via P2-2 demonstrated a longer lifetime than QD/Ni(ppy) produced via P2-2 but demonstrated a significantly shorter lifetime than QD/SiO
2, indicating that PL quenching via Ni(ppy) still occurred after SiO
2 coating.
2.3. Catalytic Behavior of Perovskite QD
To increase the catalytic selectivity for CO
2 conversion, the conduction band of the photocatalyst should be close to the CO
2 reduction potential. Red perovskite QDs are known to have excellent band alignment with the CO
2 reduction potential. However, red perovskite QDs are impractical to use as photocatalysts for CO
2 conversion because of their rapid photodegradation. We improved the photo-stability of perovskite QDs via SiO
2 encapsulation to produce a red/green perovskite QD/Ni(ppy)/SiO
2 for use as a CO
2 conversion photocatalyst.
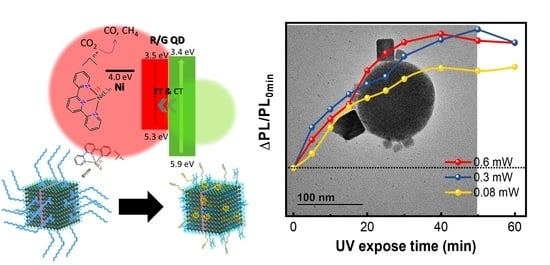
Figure 7a shows the schematic band alignment of red/green perovskite QD/Ni(ppy)/SiO
2. The solar simulator has a continuous light spectrum from 400 to 1100 nm, with 400–700 nm light contributing approximately 40% of the total irradiance. The red/green perovskite QDs in this study can absorb a wider range of light compared with the green perovskite QDs. Moreover, red/green perovskite QDs facilitated photocarrier generation efficiency. Higher energies above 500 nm generated multiexcitons in red and green QDs. In particular, the excitons from green QDs were delivered to red QDs through energy transfer and charge transfer, dramatically increasing photocarrier generation in the red QDs. The photo-induced electrons transferred to the Ni complex for use in CO
2 reduction.
Figure 7b shows the PL intensities of various materials. The pristine green and red perovskite QDs that were used to synthesize red/green perovskite QD/Ni(ppy) demonstrated a 78% PLQY and 41% PLQY, respectively. The red/green perovskite QD/Ni(ppy) was fabricated using different amounts of Ni(ppy) doping. When the red perovskite QD/Ni(ppy) and green perovskite QD/Ni(ppy) were mixed, the PL intensities of both reduced significantly even at a low Ni(ppy) content. This PL quenching is evidence of energy transfer and charge transfer between the green and red perovskite QDs. Next, we measured the PL intensities at different Ni(ppy) contents. The PL intensities of both the green QDs and red QDs decreased in inverse proportion to the Ni(ppy) content. Finally, red/green perovskite QD/Ni(ppy)/SiO
2 was synthesized. The TEM image of red/green perovskite QD/Ni(ppy)/SiO
2 indicated a strong interaction between the red and green perovskite QDs (
Figure 7c,d). Small green perovskite QDs attached to the surface of large red perovskite QDs. Interestingly, we observed many small perovskite QDs (~10 nm in diameter) similar to the original green perovskite QDs. However, we identified mid-sized perovskite QDs (20–30 nm in diameter) on the surface of the red perovskite QDs. Pristine green QDs normally exhibit diameters less than 10 nm. In the red/green perovskite QD/Ni(ppy)/SiO
2, mid-sized perovskite QDs were fabricated via mixing of red and green perovskite QDs during the silanization reaction [
31]. Rapid silanization prevents a large number of mid-sized QD formation because the red and green perovskite QD experience less nanocrystal confusion through rapid silanization. There were significantly fewer mid-sized perovskite QDs than small perovskite QDs. In addition, we observed an ultrathin SiO
2 coating at the edge of the red/green perovskite QD/Ni(ppy)/SiO
2.
Finally, the catalytic behavior of different types of perovskite QDs is presented in
Figure 8: pristine QD, perovskite QD/SiO
2, and red/green perovskite QD/Ni(ppy)/SiO
2. We firstly investigated the photocatalytic activity in CO
2-saturated water (4%). The pristine QDs demonstrated a low CO
2 reduction catalytic activity of approximately 3 µmol/g in
Figure 8a. The CO
2 reduction rate of pristine QD was higher over a 6 h period than over a 24 h period because QD catalytic activity reduced and finally stopped during the CO
2 reduction. Interestingly, the amount of generated H
2 gas was also reduced after 18 h. It indicated the fast degradation behavior of pristine QD. The perovskite QD/SiO
2 demonstrated significantly lower catalytic activity because the SiO
2 coating impaired efficient charge separation for CO
2 reduction (
Figure 8b). The catalytic behavior of red/green perovskite QD/Ni(ppy)/SiO
2 was improved. The photocatalytic hydrogen reduction activity of QD/Ni(ppy)/SiO
2 improved to 72 μmol/g, compared to that of pristine QD (16 μmol/g) in
Figure 8c. The perovskite QD/Ni(ppy)/SiO
2 exhibited more consistent activity, and its catalytic behavior still sustained until 27 h, resulting in enhanced catalytic stability after SiO
2 coating. However, the CO conversion rate of this material was inferior (
Figure 8d). To improve the CO
2 reduction rate, we optimized the hole scavenger and the ratio between red and green QDs. The CO
2-saturated ethyl acetate in the presence of water (1%) showed a 15-fold CO
2 reduction rate compared to ~4% H
2O hole scavenger (
Figure 8e). Finally, the 1:2 ratio of red/green perovskite QD/Ni(ppy)/SiO
2 demonstrated catalytic activity of approximately 0.56 μmol/g·h for CO (
Figure 8f).
The photodegradation of perovskite QD/Ni(ppy) and perovskite QD/Ni(ppy)/SiO
2 was investigated via a TCSPC PL study. The PL lifetime of pristine red/green QD mixtures without SiO
2 coating is difficult to observe because of nanocrystal confusion and defect generation over time. Thus, we measured the TCSPC PL of green perovskite QD/Ni(ppy) (
Figure 9a) and red perovskite QD/ Ni(ppy) (
Figure 9b) separately. The TCSPC PL of green perovskite QD/Ni(ppy) at different excitation power levels revealed significant photon losses as the excitation power increased. The average PL lifetime reduced from 4.80 to 4.09 ns when the TCSPC tests were conducted at the same spot in the film. The red perovskite QD/Ni(ppy) demonstrated a reduction in average PL lifetime as the excitation power increased but to a lesser degree than the green perovskite QD/Ni(ppy), even though the stability of green perovskite QDs was better than that of red perovskite QDs. We hypothesize that good alignment of the red perovskite QD and Ni(ppy) facilitated charge transport between them and prevented a photoinduced redox reaction in the perovskite QDs. In contrast, red/green perovskite QD/Ni(ppy)/SiO
2 displayed no significant change at different excitation power levels, indicating high stability. The PL lifetimes at 511 nm (
Figure 9c) and 612 nm (
Figure 9d) were measured at the same spot in the film of the red/green perovskite QD/Ni(ppy)/SiO
2 sample. Both red and green PL were detected and their lifetimes were constant within the same excitation power range used for the pristine QDs. The SiO
2 coating appeared to effectively minimize photodegradation via defect passivation behavior.


