Abstract
To optimize the Sabatier process, quaternary supported catalyst materials are synthesized and tested. The syntheses are performed by the industrially established, reproducible and automated methods of impregnation and sol–gel synthesis. The screening of the 588 quaternary catalysts is carried out in a specially designed 10-fold parallel gas flow micro-structured reactor as wall catalysts in sequential operation mode at a temperature of T = 573 K and a pressure of p = 15 bar. For the description of the activity, the reaction parameters CO2 conversion, CH4 yield, and CH4/CO2 selectivity are used. These are determined by analyses of the gas phase composition using µGC-FID. The catalysts with the highest activities are validated in a micro-structured reactor with similar characteristics as the screening reactor in the temperature range between T = 573–673 K and a pressure of p = 15 bar. Characterization by powder X-ray diffraction, Raman spectra, and scanning transmission electron microscopic images data on the phase and element distribution after calcination and reduction was conducted.
1. Introduction
The Power-to-Gas (PtG) concept offers an economical and environmentally friendly approach to reduce greenhouse gas emissions of carbon dioxide. The electric power generated from renewable sources can be stored in chemical form by water electrolysis to produce hydrogen [1]. Further on, in the Sabatier reaction it can be used to convert carbon dioxide into another storage molecule, methane.
In contrast to hydrogen, the methane produced by this reaction can be fed into the
already existing natural gas grid at any portion, provided it is of sufficient purity, whereas hydrogen is allowed in Germany only to 5% in the gas grid. Thus, methane serves as an energy storage system to compensate for the volatility of renewable energies [2]. In the scientific literature, the metals of the groups 8 to 10 are found to be particularly catalytically active for the Sabatier reaction [3]. Due to the low natural occurrence of precious metals and the associated high costs, nickel, cobalt, and iron are primarily used as catalysts for this reaction [4]. Under certain operating conditions, these metals tend to cause severe coking of the catalyst surface, which leads to deactivation of the catalysts [5]. Furthermore, the combination of a metal with a specific metal oxide support plays a decisive role in the improvement of the stability of a catalyst, as both components have a specific function in the mechanism of the catalytic reaction cycle [6]. The use of supported catalysts for the Sabatier reaction allows promotion of the reaction by the support via a bifunctional mechanism. While hydrogen is chemisorbed on the surface of the active component, carbon dioxide accumulates on the carrier material. The reaction takes place at the interface of the two components at the metal/metal oxide three-phase interface [7]. Therefore, it is interesting to also specifically consider the combination of different support materials in one material to elucidate synergetic effects. In addition to the currently used alumina, ceria offers promising support material properties [8], such as Oxygen Storage Capacity (OSC), which reduces coking by carbon deposition on the catalyst surface [9].
Due to the strong exothermic nature of the Sabatier reaction (), hot-spot formation occurs frequently in conventional fixed-bed and even multi-tubular reactors, resulting in selectivity losses and catalyst deactivation [10]. New reactor concepts with the implementation of a considerably higher heat transport coefficient are indispensable, which can be realized by micro-process engineering [11]. In this work, samples of quaternary catalysts consisting of the active components Co, Fe, Ir, Ni, Rh, Ru, or Pd and support materials Al2O3, CeO2, SiO2, TiO2, or ZrO2 are generated using industrially established synthesis methods and tested as thick layers in micro-structured wall reactor systems. The coating of micro-slit plates of the reactors is carried out by the High-Volume Low-Pressure (HVLP) spraying process [12]. The slurry used for this process consists of the catalyst material as powder, a binder compositionally comparable to the support material used, and water as dispersant. The plate–catalyst combinations are mounted in the primary screening process to the 10-fold parallel gas flow reactor system and tested sequentially. The assembly of coated micro-slit plates as wall catalysts together with the gas phase flow reactor creates a micro-structured reaction system which is characterized by at least one lateral dimension in the sub-millimeter range, i.e., the gap of the gas slit above the wall-coated micro-plate. The total height of the catalyst layer and gas channel is less than 1 mm. In this regime, the gases flow laminarly over the highly porous catalyst layer [13]. Figure 1 illustrates the formation of this micro-structured reaction system.
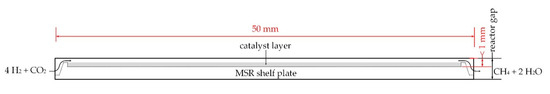
Figure 1.
Schematic representation of a section of the microstructured 10-fold parallel reactor system consisting of reactor wall, micro-slit reactor (MSR) plate, and catalyst layer. The gas inlet and outlet are realized by stainless steel capillaries connected to multiport valves.
This micro-structured system is realized in the parallel gas flow reactor in form of a 10-fold design. The reactor components and the assembled reactor system are both shown in Figure 2. The parallel reactor system is operated in sequential operation mode in combination with two 10-fold multiport valves and a backpressure regulator. Non-analyzed reactor channels are kept under a nitrogen atmosphere. After a reduction step in N2: H2 = 1: 1 at T = 773 K for t = 2 h the catalyst layers with a typical thickness of d = 250 µm are tested in an undiluted laminar gas flow of H2: CO2 = 4: 1 with GHSV = 50,000 h−1. Further details as the flow diagram of the whole setup can be found in Section 2.2 as well as in [13].
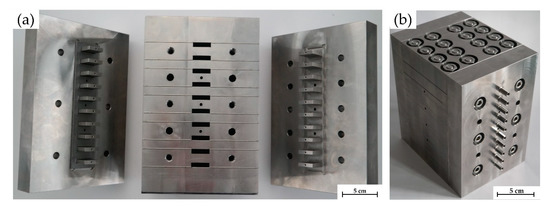
Figure 2.
Reactor block components with gas inlet (left) and outlet units (right) as well as ten reactor gaps in the reactor central block (middle) for accommodation of micro-split plates (a) and assembled reactor block unit (b); note that the central block of the 10-fold parallel gas phase flow reactor was manufactured from individual steel plates and diffusion-bonded to achieve pressure strength; drillings with mounting screw threads and for thermocouple insertion [13].
The influence of the support materials on the activity of the catalysts can be investigated by gas adsorption measurements utilizing specific gas molecules as probes for the interaction with active sites (chemisorption). The most active catalysts are additionally validated in a micro-slit reactor of similar geometry as the screening reactor under variation of an additional number of reaction parameters in a secondary screening process. This workflow offers the advantage of a catalyst screening in an uniform reactor geometry facilitating upscaling of the catalysts and reactor system for industrial applications. Note that the scale-up of the micro-slit reactor system can be simply achieved by enlargement of the reactor’s physical dimensions in the two lateral directions without losing flow and high surface-to-volume heat removal characteristics.
2. Results
2.1. Catalyst Selection and Syntheses
As the most common supporting materials for the Sabatier reaction Al2O3 [14,15], CeO2 [16], TiO2 [17,18], ZrO2 [19], and SiO2 [20] are applied, while as active components Ni [15,16,18,19,20], Co [14,15] Fe [14], Ir [18], Rh [16,19], Ru [17,20], and Pd [20] are used in metal/metal oxide combinations. The combination of two different active metals in a catalyst material using seven different chemical elements results in variations. For the catalyst syntheses by the two impregnation variants incipient wetness impregnation (IWI) and wet impregnation (WI), we use two different alumina and three different silica commercial supports with varying particle sizes, two different zirconia supports with different polymorphic modifications, as well as one titania and one ceria support material. These variations increase the number of possible combinations to 21 element combinations × 9 different support materials × 2 preparation methods = 378. For the sol–gel synthesis technique this differentiation of active metal components is obsolete, because with this method all catalyst components originate from a single homogeneous precursor solution mixture. Due to the use of two sol–gel synthesis routes (propionic acid route—PA; citric acid route—CA), the number of combinations is 21 element combinations × 5 different support elements × 2 preparation methods = 210 only for this synthesis method. For the catalyst screening of the quaternary mixed metal/metal oxide catalysts consisting of two active metals and one support material as specified above, in total 588 catalysts of different compositions have been synthesized.
Table 1 lists the general stoichiometric composition of the catalysts. Due to the high number of possible combinations, the composition of all these samples can only be optimized after validation of the most active catalysts.

Table 1.
General composition design of the quaternary metal/metal oxide catalysts indicating the molar ratios of the metal components of active and support materials normalized to 100% (x not specified as it depends on preparation conditions, chemicals, and equipment used for syntheses are listed in Supplementary Materials, Tables S1 and S2.
2.2. Catalyst Screening
To compare the catalytic activities of the individual catalysts, it is necessary to determine suitable reaction parameters such as conversion and selectivity. Active reference catalysts, such as, for example, Ni on alumina of different metal loading characterized by preliminary tests, have been measured over the temperature range from T = 523 K to 673 K. Higher hydrocarbons with more than two carbon atoms in the chain, which can be formed as follow-up products for instance through oxidative dehydrogenation of methane (ODHM) by carbon dioxide during high-throughput catalyst screening, are also detected and quantified by micro-gas chromatography with flame-ionization detection (µGC-FID). At a reaction temperature of T = 573 K, a broad spectrum of CO2 conversions and selectivities of CO2 to CH4 have been observed. This temperature was used for ranking of the catalysts as reaction temperature for the primary screening of the catalysts. The following reaction parameters have been defined for primary screening: T = 573 K; p = 15 bar; H2: CO2 = 4: 1; GHSV = 50,000 h−1 [13].
Out of the 588 catalysts prepared and tested, only 143 show significant conversion of CO2 as well as significant selectivity of CH4 with respect to CO2. To identify the most active catalysts, the so-called hits, the most reactive combinations of active components, are first examined under specific evaluation criteria for conversion and selectivity. In Figure 3, these combinations are depicted.
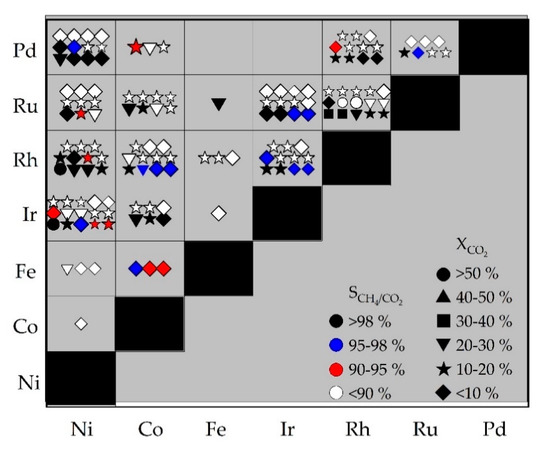
Figure 3.
Illustration of the Sabatier reaction screening data evaluation for combinations of two active metal components resulting in 143 reactive combinations out of a total number of 588 catalysts synthesized revealing hit distributions of the active metal elements without consideration of support materials; data from primary screening in 10-fold parallel gas phase micro-reactor as function of CO2 conversion and CH4/CO2 selectivity. Reaction parameters: T = 573 K; p = 15 bar; H2: CO2 = 4: 1; GHSV = 50,000 h−1; dcatalyst layer = 250 µm; numerical data available in Supplementary Materials, Table S3.
The highest conversions with > 50% (symbol: circles) are achieved with the element combinations Ni-Ir, Ni-Rh, and Rh-Ru. Out of the 21 element combinations shown in Figure 3, 13 show at least one catalyst with selectivities > 98% (black symbols). Neither combinations of two non-precious metals (Fe-Ni, Co-Ni, Fe-Co) nor other ferrous catalysts (Ru-Fe, Rh-Fe, Ir-Fe) are promising through their activities for methane formation. It can also be seen that there are large differences in conversion and selectivity even within several of these 21 fields for combinations of active components. It is therefore of special interest to consider the support material used and the synthesis method applied. For this purpose, combinations are considered which have at least one catalyst with a selectivity > 98% and simultaneously result in at least a number of 10 active catalysts (more than 10 symbols in Figure 3). Thus, the combinations Ni-Ir, Ni-Rh, Ni-Pd, Co-Rh, Ir-Rh, Ir-Ru, Rh-Ru, and Rh-Pd have been considered more closely.
Figure 4 illustrates the influence of the support materials and synthesis methods used on the reaction parameters CO2 conversion, , and CH4/CO2 selectivity, , as a function of selected element combinations of active components.
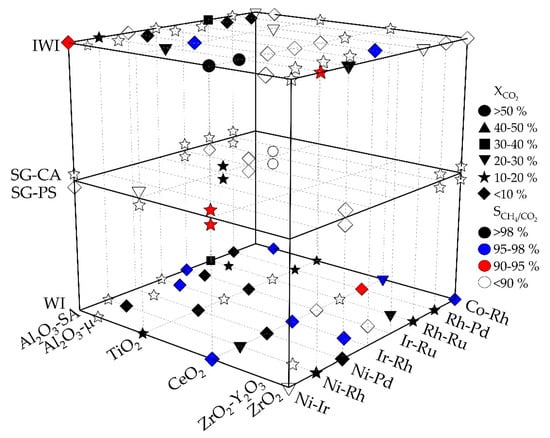
Figure 4.
Representation of the Sabatier reaction catalytic activities of the 8 most active element combinations selected from Figure 3 (lower right axis) as a function of the support materials (lower left axis) and the synthesis methods (different heights); catalysts with silica as support material were not represented as they are not revealing significant activities for methanation reaction; Al2O3-SA: alumina SA63158, Saint Gobain Norpro; Al2O3-µ: alumina HSA microspheres, Saint Gobain Norpro; reaction settings: T = 573 K; p = 15 bar; H2: CO2 = 4: 1; GHSV = 50,000 h−1; dcatalyst layer = 250 µm.
A comparison of the synthesis methods shows that in an overall comparison the impregnation methods IWI and WI (74 from all in all 96 samples, i.e., 77%) result in a larger number of active catalysts than the sol–gel methods (25 from all in all 64 samples, i.e., 39%). In both impregnation methods, CeO2- and Al2O3-supported catalysts show higher activities than catalysts with other support materials. Note that not a single sample with silica as support independent of preparation method fulfilled the selection criterion, and thus silica as support material is missing in Figure 4. Silica with a point of zero charge (PZC) close to 4 is considered as the most acidic of the supports used without basic sites to interact with CO2. The sol–gel methods on the other hand show better results with TiO2 as support material. For the selection of the catalyst systems to be validated, the catalysts with the highest activities are considered for each synthesis method. This leads to the following list of selected catalyst systems for validation in the micro-slit reactor (IWI: incipient wetness impregnation; WI: wet impregnation; SG: sol–gel synthesis; CA: citric acid; PA: propionic acid route).
- NiIrCeOx_IWI
- NiRhCeOx_IWI
- RhRuAlSAOx_IWI
- RhRuAlSAOx_WI
- RhRuZrYOx_WI
- IrRhTiOx_SGCA
- IrRhTiOx_SGPA
- RhRuTiOx_SGCA
- RhRuTiOx_SGPA
The influence of the support materials used on the activity of catalysts can be explained by the adsorption properties of these support materials. Due to the bifunctional mechanism of the Sabatier reaction, it is highly plausible that carbon dioxide is adsorbed on the surface of the support materials used. The reaction takes place at the three-phase interfaces between metal oxide support material and active metal component, on which the hydrogen is chemisorbed. Therefore, a comparison of the adsorption and desorption capabilities of the support materials with respect to CO2 in relation to the different activities is highly advisable, but would go beyond the scope of this publication.
2.3. Validation of the Screening Results in the Micro-Slit Reactor
The catalysts selected in Section 2.2 are validated in a micro-slit reactor under the following reaction conditions.
- T = 573 K–663 K; p = 15 bar
- gas hourly space velocity (GHSV) = 42,500 h−1; = 100 NmL/min (H2: CO2 = 4: 1 without dilutant)
- dgas gap: 500 µm; dcatalyst layer = 250 µm.
- time on stream (TOS) = 3600 s
Additionally, Ni15Ce42,5Al42,5Ox_IWI [21] was synthesized and used as reference catalyst. Figure 5 shows the results of the validation testing for the reference catalyst as well as the nine catalyst composition synthesis method combinations as specified above.
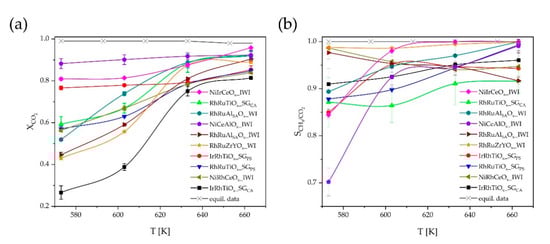
Figure 5.
Sabatier reaction CO2 conversion, , (a) and CH4/CO2 selectivity, , (b) diagrams as function of temperature T of the nine catalyst samples validated and the reference catalyst in relation to equilibrium data [22]; lines connecting data points for eye guidance; reaction Scheme 573. K–663 K; p = 15 bar; H2: CO2 = 4: 1; GHSV = 50,000 h−1; dcatalyst layer = 250 µm.
All validated catalysts show the highest activity at T = 663 K, i.e., the highest temperature tested. Conversions of CO2 range from = 81.4% to 95.8%, while selectivities of CH4 depending on CO2 range from = 91.6% to 99.9%. The catalyst NiIrCeOx_IWI shows the highest activity close to equilibrium data with a conversion of = 95.8% together with a selectivity of = 99.9% at T = 663 K.
2.4. Characterization of NiIrCeOx_IWI
Powder X-ray diffractometry is used to determine the crystalline phases formed during reduction. Due to the small amounts of 12 mol.% nickel and 3 mol.% iridium in the samples, the reflections of the two active metal components Ni and Ir only become visible at higher reduction temperatures due to a higher crystallinity and thus lower full width at half maximum (FWHM) of the reflections of the metallic phases. For this purpose the catalyst is reduced at T = 973 K and 1173 K and subsequently investigated by PXRD (see Figure 6).
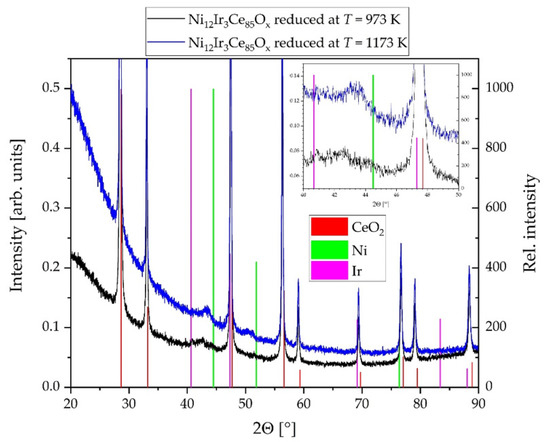
Figure 6.
Powder X-ray diffraction pattern (PXRD) of Ni12Ir3Ce85Ox_IWI coating layers reduced at two different temperatures in a gas flow of 5 vol.% H2 in Ar; intensity data (left y-axis) magnified to reveal low intensity reflections of the metallic alloy components in the system Ni–Ir; ICDD data of CeO2 (75-0076), Ni (87-0712), und Ir (87-0715) (normalized to a relative intensity of 1000, right y-axis) are used for qualitative phase identification; STOE Stadi P diffractometer (λKα1(Cu) = 154.056 pm).
The reduction of the catalysts spray-coated as 250 µm thick layers onto micro-slit plates was done directly in the micro-slit reactor system used for catalyst validation testing with the following reduction parameters.
- T = 773 K; p = 15 bar
- GHSV = 42,500 h−1; = 100 NmL/min (N2: H2 = 7: 3)
- treduction = 4 h
Ex situ Raman spectroscopy is used to investigate any changes in the surface species of the catalyst NiIrCeOx_IWI during calcination, reduction and reaction. The spectra acquired are shown in Figure 7.
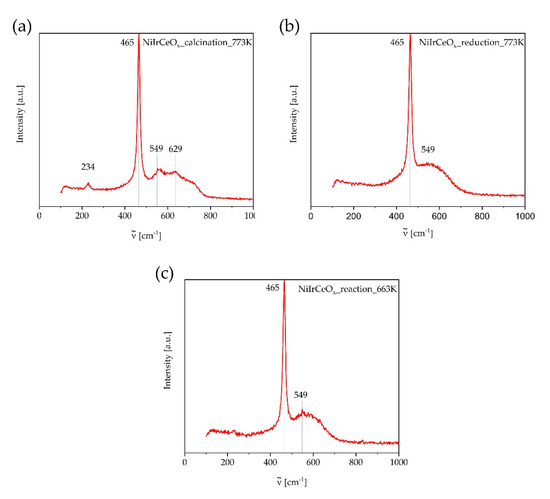
Figure 7.
Raman spectra of the catalyst NiIrCeOx_IWI after calcination at T = 773 K (a), reduction at T = 773 K (b), and reaction at T = 663 K (c). Spectra were normalized in intensity to the F2g band of CeO2 at = 465 cm−1.
For comparison, Raman spectra for the deployed CeO2 support material without active components were acquired to detect possible oxygen vacancies in the crystal lattice of substoichiometrix CeO2-x. The spectra measured are shown in Figure 8. For more details see the discussion in Section 3.2.
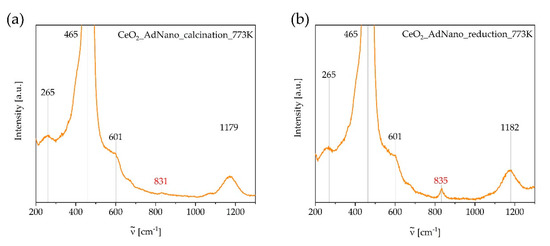
Figure 8.
Raman spectra of the support material CeO2 after calcination (a) and reduction (b) at T = 773 K. Intensity axes magnified to reveal low intensity bands.
HAADF-STEM images and EDS mappings reveal additional information on the morphology and the element distribution of the sample NiIrCeOx_IWI. The AdNano Ceria 50 used as support for IWI has been produced by flame spray pyrolysis (FSP) and consists of highly agglomerated ceria nanoparticles of about d50 = 82 nm diameter and SBET ~ 60 m2/g [23]. Figure 9a–c and Figure 10a–c, each representing three different sample locations after calcination and after reduction, show typical morphologies of the nanoscale support material and no changes on reduction. The EDS mapping after calcination and before reduction shows a homogeneous distribution of the chemical elements Ce, Ir, Ni, and O in the sample (Figure 9e–h) corresponding to topology (Figure 9d). This shows that the incipient wetness impregnation of AdNano Ceria is resulting in a uniform distribution of the impregnated metal solutions on the support. Several other locations of the sample show the same behaviour. This changes after reduction of the sample in H2/N2 for t = 2 h at T = 773 K. As shown in Figure 10c–l, different sample areas show variations in the element distributions. Whereas the Ce and O mappings correlate well with the topology observed, the Ni and Ir mappings show differences in the spacial elemental distributions with areas of higher Ni as well as areas of higher Ir concentration.
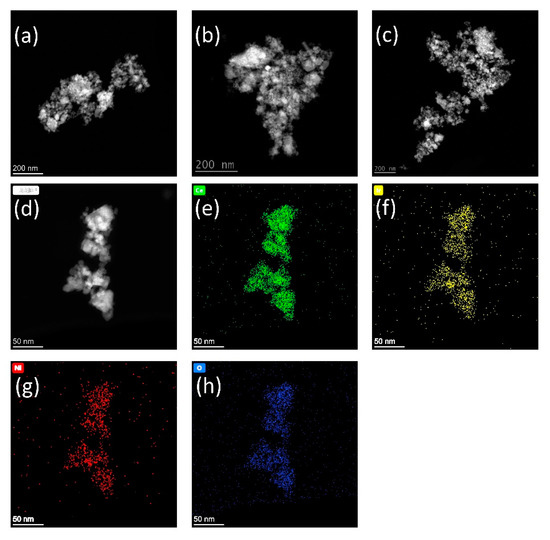
Figure 9.
HAADF-STEM images and EDS mappings revealing morphology and elemental distributions of the catalyst sample NiIrCeOx_IWI after calcination at T = 773 K. (a–d) topologies of 4 different sample locations; (e–h) Ce, Ir, Ni, and O elemental distributions corresonding to topology (d).
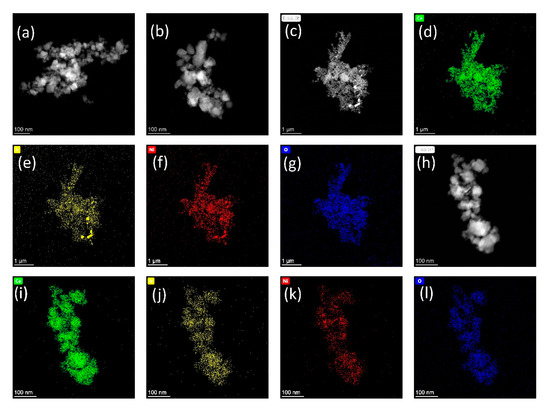
Figure 10.
HAADF-STEM images and EDS mappings revealing morphology and elemental distributions of the catalyst sample NiIrCeOx_IWI after reduction at T = 773 K. (a–c,h) topologies of 4 different sample locations; (d–g,i–l) Ce, Ir, Ni, and O elemental distributions corresponding to topologies (c,h), respectively.
3. Discussion
3.1. Validation Studies in the Micro-Slit Reactor
In addition to the catalyst NiIrCeOx_IWI, the catalysts RhRuAlOx_WI, RhRuTiOx_SGCA, and the reference catalyst NiCeAlOx_IWI also reveal CO2 conversions of over 90% in the validation tests. Among these catalysts, the reference catalyst shows the lowest variations of conversion over the entire temperature window and highest low temperature activity (see Figure 5). The maximum conversion of NiCeAlOx_IWI is reached with = 92.3% at T = 663 K. The catalyst NiIrCeOx_IWI exceeds the CO2 conversion of the reference catalyst above temperatures of T = 650 K and reveal a conversion maximum of = 95.8% at the highest temperature and under the reaction parameters used in the measurements (compared to the equilibrium conversion of = 99.9%). The catalysts RhRuAlOx_WI and RhRuTiOx_SGCA show lower conversions in the range = 50–70% at lower temperatures. The conversion rates increase with increasing temperature and reach plateaus in the temperature range from T = 640 to 670 K and conversions of = 90–91%.
When considering the selectivities for CH4 in relation to CO2, the catalyst RhRuTiOx_SGCA achieves a rather low value of = 91.7% at T = 663 K. Ethane is obtained as a by-product with = 8.3%. The catalysts NiIrCeOx_IWI, RhRuAlOx_WI, and NiCeAlOx_IWI show selectivities > 99% at T = 663 K. Here, ethane formation only occurs at temperatures T < 620 K.
The catalyst NiIrCeOx_IWI shows at a reaction temperature of T = 663 K among the catalysts investigated the highest activity with a CO2 conversion of = 95.8% and a CH4/CO2 selectivity of = 99.9%. Investigations on mass transport limitations show that the activity of the catalyst NiIrCeOx_IWI can be optimized by varying the gas gap height and residence time. To present this effect more clearly, the temperature was reduced again to T = 573 K. At this temperature the catalyst showed in the screening reactor a conversion = 72.2% and a selectivity = 98.3% at T = 573 K; p = 15 bar; H2: CO2 = 4: 1; GHSV = 50,000 h−1; dcatalyst layer = 250 µm, dgas gap = 750 µm. During validation in the micro-gap reactor the gas gap is reduced to dgap = 500 µm. This results in a conversion = 80.9% and a selectivity = 98.0% while keeping the remaining reaction parameters constant. The increase of the temperature to T = 663 K results in a CO2 conversion of = 95.8% and a CH4/CO2 selectivity of = 99.9%. By reducing the gas gap to dgas gap = 250 µm, which at a constant GHSV and constant catalyst mass leads to an increase of the residence time, a CO2 conversion of = 99.5% and a CH4/CO2 selectivity of = 99.9% is reached. By reducing the gas gap and increasing the residence time, diffusion is intensified and transport limitation is prevented, leading to an activity close to thermodynamic equilibrium [22].
The pore diffusion and chemisorption of CO2 on the surface of the support material as well as H2 on the surface of the active components can show a significant influence on the reaction rate and thus on the activity. This could support the description of a two-step reaction mechanism with adsorption and dissociation of CO2 on the supporting material and reaction of the formed CO with H2 at the interface supporting material/active component [7].
For structural elucidation, the catalyst NiIrCeOx_IWI is examined in a reduced state using powder X-ray diffraction (PXRD; see Figure 8). Additionally, the changes of the catalyst and its properties during calcination, reduction and reaction are investigated by Raman spectroscopy and thermogravimetric analyses.
3.2. Characterization of the Catalyst NiIrCeOx_IWI
The PXRD studies of the catalyst reduced in 5% H2 in Ar at elevated temperature reveals the formation of a solid solution phase between the elements nickel and iridium, i.e., alloy formation. However, the crystallinity of the alloy phase is rather poor indicated by high FWHM of the reflections, which can only be clearly separated from the background at reduction temperatures of Tred = 973 K and higher. The phase assignment is in agreement with Ni-Ir phase diagram revealing no formation of intermetallic phases but a complete miscibility of the boundary phases Ni and Ir crystallizing in a cubic close packed (ccp) structure in the temperature range applied [24].
The reflections at diffraction angles of 2Θ(hklccp) = (111) ≈ 43.8° and 2Θ(hklccp) = (200) ≈ 51.1° indicate this solid solution formation as these values lie between the reflection positions of the pure phases of nickel (2Θ(111) = 44.50°, 2Θ(200) = 51.85°, ICDD 87-0712) and iridium (2Θ(111) = 40.67°, 2Θ(200) = 47.31°, ICDD 87-0715). As the diffraction angles observed for this phase are more close to the corresponding data of Ni than Ir, they also indicate a higher amount of Ni than Ir in the alloy in agreement with the nominal composition of the sample with a Ni: Ir ratio of 4:1 (see also Table 1). Due to the high FWHM of the Ni-Ir alloy PXRD reflections a low crystallite size and possibly also a small particle size/high dispersion of this phase onto the support can be concluded. All reflections with the highest intensities can be assigned to the support material CeO2 according to the ICCD database without any significant shift in peak positions and thus not indicating significant solid solution formation between components of the mixture.
Examinations of the catalyst calcined at T = 773 K by Raman spectroscopy always show the characteristic band of CeO2 at ν = 465 cm−1 [25]. This is the most intense band observed in Figure 7 and Figure 8. In theory, the cubic fluorite-type crystal structure of CeO2 reveals only a single Raman active fundamental mode at ν = 464 cm−1, which is the triply degenerate F2g mode that corresponds to a symmetric Ce-O stretching vibration in the point group Oh representing the symmetric breathing mode of six O2- around the central Ce4+ ion. Bands near ν = 260, 600, and 1170 cm−1 are attributed to the second-order transverse acoustic (2TA) mode, a defect-induced (D) mode representing Frenkel-type oxygen vacancies, and the second-order longitudinal optical (2LO) mode, respectively (see Figure 8) [26]. The investigation of the pure support material CeO2 after reduction also shows one additional band at ν = 835 cm−1. This band indicates the vibration of a peroxide group at the CeO2-x(111) surface with/Ovacancies = 1. The oxygen vacancies together with Ce3+ ions are generated in CeO2-x/Ce2O3 through reduction in a 5 vol% H2/Ar mixture [27]. Oxygen molecules are adsorbed at the surface during the ex situ measurements due to contact with air. The corresponding equilibrium can be specified as
After calcination, this band is hardly visible indicating only a low deviation from stoichiometry in CeO2−x (x ~ 0).
In Figure 7, the band at ν = 549 cm−1 after calcination of the catalyst NiIrCeOx_IWI shows the Eg vibration mode of iridium dioxide, which is partly formed during the calcination of the catalyst due to the Ir(III)acetate precursor and a disproportionation into IrO2 and Ir. The broad structure below this band could also originate in part from a stretching vibration mode involving oxygen vacancies, confirming that the presence of Ir favors the formation of oxygen vacancies and Ce3+ cations [27]. According to Schilling et al., two broad bands at ν = 510 cm−1 and 570 cm−1 can be assigned to oxygen vacancy formation of Frenkel-type and [25]. These broad bands are also visible after reduction and reaction. Note that the additional bands after calcination at ν = 234 cm−1 and ν = 629 cm−1 have been also observed by Derafa et al. for Ni0.1Ce0.9O2-x synthesized from heterobimetallic Schiff bases complex precursors and assigned to the incorporation of Ce3+ and Ni3+ into the ceria lattice [28]. After reduction and reaction, no additional bands to be assigned to NiO and IrO2 are visible, which describes a complete reduction under the conditions used.
The findings of PXRD and Raman spectroscopy are supported by the EDS elemental mappings based on HAADF-STEM images. Impregnation of the ceria support with metal salt solutions in the incipient wetness impregnation method results in a homogeneous distribution of all elements after calcination. At this stage of catalyst preparation it is to be expected that the metal salt solutions after drying and calcination are converted into Ni1-xO as well as IrO2 and Ir after disproportionation of the Ir(III) precursor. The lower Ni intensity after calcination in the mapping of Figure 9g compared to that after reduction in Figure 10f,k might indicate an infiltration of Ni into the ceria surface and a solid solution formation in the system NiO·CeO2 as NixCe1-xO2-x. Neither in PXRD pattern nor in Raman spectra Ni-O phases can be identified. The other side signals for IrO2 can be seen in the PXRD pattern as well as Raman spectra (see above). After reduction in hydrogen at much higher temperatures than during catalytic testing Ni-Ir alloy reflections can be identified in the XPRD pattern (see Figure 6). Ni and Ir elemental mappings show not always the same element distributions and thus spatial inhomogeneities in the Ni/Ir metal ratio. In the PXRD pattern of the sample reduced at the lower temperature of T = 973 K, this can be seen in the 2Θ-range between 40 and 45° as a rather broad peak structure ((111) reflections of Ir and Ni) even with a maximum at the Ir(111) reflection position at 2Θ = 40.67 °. This finding might also have consequences for the catalytic activity data interpretation and should be considered in kinetic investigations regarding to the reaction mechanism.
4. Materials and Methods
All chemicals and equipment used are listed in Tables S1 and S2 (Supplementary Material).
4.1. Sol–Gel Method by Propionic Acid (PA) Route
In this solution-based sol–gel route, molar ratios of the active components M1, M2, support material T, the complexing agent (CPA), and the propionic acid (PA) are used to synthesize catalyst samples bottom up by a hydrolysis–condensation process [29]. In the first synthesis step, solvent is added to the metal precursors to form 1 molar solutions. The solvent used is methanol. In a 50 mL glass vial with rolled rim and snap-on lid, the solutions are combined and homogenized in the desired molar ratio M: CPA: PA = 50: 150: 1 while M stands for the sum of the quantity of all metal components—including the support–the catalyst finally consists of. Subsequently, the complexing agent is added, followed by the propionic acid. The mixture is aged for t = 24 h in a drying oven at T = 353 K and then calcined using the calcination program shown in Figure 11. The catalyst powders obtained are ground and the specific sieving fraction of 100–200 µm selected for catalytic testing. Exceptions in the choice of solvent used (instead of methanol) include the following precursors: palladium(II) nitrate hydrate (using a 1:1 molar mixture of methanol and dimethylformamide as solvent), titanium(IV) isopropoxide (initially transferred into a solution with fourfold molar excess of acetylacetone as complexing agent (CPA)), and zirconium(IV) oxide nitrate hydrate (using a 1:1 molar mixture of isopropanol and propionic acid as solvent).
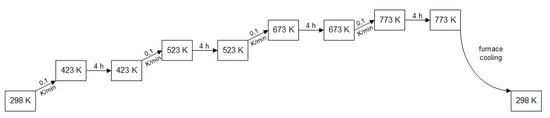
Figure 11.
Calcination program for catalyst synthesis using sol–gel propionic acid route.
4.2. Modified Sol–Gel Method by Citric Acid (CA) Route
The sol–gel synthesis method described above was modified according to Kakihana et al. [30] into a polymer–complex route. First, an aqueous citric acid (CA) monohydrate solution is mixed with ethylene glycol (EG) in a volume ratio of 50: 33.48. The metal (M,T) precursors are then dissolved with a molar ratio of H2O: EG: CA: M/T = 20: 4: 1.5: 0.4 and combined in a molar ratio according to Table 2 without adding complexing agent and propionic acid. The drying and calcination program is carried out analogously to Section 4.1.
Table 2.
Composition of the molar ratios of the active components (M1, M2) in the reduced metallic state, the carrier materials (T) in the oxide state, the complexing agent (KB) and the propionic acid (PS).
4.3. Incipient Wetness Impregnation (IWI)
For IWI, the metal precursors are dissolved in a volume of water corresponding to 80% of the pore volume of the respective support material. The solubility of the solid precursor in the solvent is the factor limiting the maximum metal loading of the support material to be achieved in a single impregnation step. The Pd precursor is dissolved in a 1:1 molar mixture of water and dimethylformamide. The metal precursor solutions are transferred with Eppendorf pipettes into 5 mL polypropylene containers with lids containing the pre-weighted support powders. The filled containers are sealed by lids, mounted to a two-axis centrifuge of type Speedmixer supplied by Hauschild Corp. and rotation-centrifuged for t = 240 s at r = 2500 min−1. Thus, a parallel IWI synthesis of 8 catalysts of different compositions is possible. After mixing, the powder obtained is dried at T = 80 °C for t = 24 h, subsequently ground, separated into fractions by sieving, and subjected to the calcination program shown in Figure 12. This complete impregnation step is repeated until the desired metal loading is achieved.
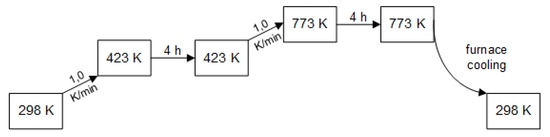
Figure 12.
Calcination program for catalyst synthesis using incipient wetness impregnation IWI.
4.4. Wet Impregnation (WI)
For WI the metal precursors are dissolved in the appropriate solvent as described in Section 4.3. In contrast to IWI, the solvent quantity added to the support powder is not restricted by pore volume but is chosen as 20 times the molar excess of the metal components. The solution is then mixed with the support materials in powder form in 5 mL polytetrafluoroethylene (PTFE) beakers mounted into a heating block for six-fold parallel tempering of sample dispersions by means of a circular vortex mixer for t = 24 h at a speed of r = 350 min−1 at room temperature. Then, the temperature of the heating block is raised to T = 353 K and the solvent slowly evaporated within the following 24 h. Again, this step is followed by grinding, sieving, and calcination as described in Figure 11.
4.5. Catalyst Screening in a 10-Fold Parallel Gas Flow Micro-Structured Reactor
Primary screening in a 10-fold parallel gas flow micro-structured reactor (see Figure 1 and Figure 2) is performed in sequential mode due to downstream analysis using a single gas chromatograph. First, the catalyst powders synthesized are HVLP spray-coated onto the micro-slit steel plates using a catalyst–binder–water formulation until the desired layer thickness is achieved. Subsequently, the plates are calcined to remove the binder. After inserting a catalyst-coated micro-slit plate into each of the ten parallel plate reactors, the whole reactor assembly consisting of reactor body and two cover plates is sealed via graphite flat gaskets with metal sheet inserts and closed with a torque wrench. Subsequently, a nitrogen gas flow with a standard flow rate of
= 100 mL·min−1 is adjusted by high-pressure mass flow controllers (hpMFC) and two 10-fold multiport valves and back pressure valve controlled in a completely automated setup by a Labview-based computer program (for details see in [13]). By means of the hpMFCs each gas channel is purged with nitrogen gas for t = 6 min at the preset pressure (typically p = 15 bar). Subsequently, the temperature program (see Figure 13) for catalyst screening was started.
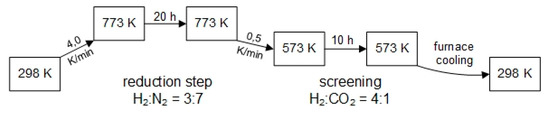
Figure 13.
Temperature program of the 10-fold parallel gas phase micro-structured reactor for primary screening.
After the reactor has reached the set point temperature of T = 773 K, controlled by the computer program and six Ni/Cr-Ni K-type temperature sensors, a flow of the gas mixture H2:N2 = 3:7 is set and started by hpMFCs at a total standard volume flow of
= 100 mL·min−1. Each catalyst is reduced for t = 2 h under this gas flow rate. The reactor assembly is then cooled down to T = 573 K and the catalysts are sequentially tested by means of 10-fold multiport valves in the reaction gas mixture H2:CO2 = 4:1 at p = 15 bar. The composition of the resulting product gas mixture is analyzed by means of a calibrated µGC with FID. After the screening process is completed and the reactor temperature is allowed to cool down naturally to T = 298 K, the micro-slit plates are removed from the reactor and cleaned for the next coating process.
4.6. Validation in the Micro-Slit Reactor
The testing workflow for the validation of selected catalysts is analogous to the catalyst screening, see Figure 12. After reduction of the catalysts, the reaction parameter screening is performed in a temperature window of T = 573 K to 663 K in steps of ∆T = 10 K. The catalysts are each subjected to the reaction gas mixture H2:CO2 = 4:1 for t = 60 min. During heating to reach the next temperature level, the gas flow over the catalysts was changed into the reduction gas mixture H2:N2 = 3:7 by electrically driven valves. The composition of the resulting gas mixture is analyzed using a calibrated µGC with FID. After the validation is completed and the reactor temperature lowered to room temperature, the micro-slit plates are removed from the reactor and cleaned for the next coating process.
4.7. Catalyst Characterisation
Powder X-Ray diffraction (PXRD) was performed on a STOE-Stadi P with Cu fine focus X-ray source (monochromator, λKα1 = 1.54056 Å, Θ-Θ geometry, MYTHEN2 R1K detector). The selected intensity data were collected in the 2Θ range from 20 to 85°. Qualitative phase identification was achieved by diffraction pattern assignment according to ICDD data as specified.
Raman spectra were recorded on an inVia Raman Microscope from Renishaw Corp. A frequency-doubled Nd:YAG laser of the model RL473C from Renishaw with a wavelength of λ = 532 nm and a UVDD-CCD-Array detector with a grid consisting of 1800 lines/mm is used. The measuring time to achieve the same S/N ratio of the spectra depends on laser power. Usually, laser powers of 0.5% of the maximal laser power P = 50 mW and a measuring time of t = 60 s are employed. The calcined samples are placed on a 96-well microplate with V-shaped bottom from Greiner Corp. The microscope is used in line focus.
STEM studies were performed using an FEI Titan ChemiSTEM operated at 200 kV equipped with a Cs-probe corrector and a HAADF detector. Compositional maps were obtained with EDX using four large-solid-angle symmetrical Si drift detectors.
5. Summary and Conclusions
For the Sabatier reaction 588 quaternary supported catalysts consisting of the elements Ni, Co, Fe, Ir, Rh, Ru, Pd, Al, Si, Ti, Ce, Zr, and O have been prepared and screened in a 10-fold parallel gas flow micro-structured reactor.
The evaluation of the reaction parameters CO2 conversion, , and selectivity of CH4 in relation to CO2, , resulted in the identification of the most active combinations of active components, Ni-Ir, Ni-Rh, Ni-Pd, Ir-Rh, Ir-Ru, Rh-Ru, Rh-Pd, and Co-Rh. These were further studied in dependency of the support materials and synthesis methods used resulting in the identification of these two parameters as crucial variables for catalyst activity.
For validation, the most active catalysts for each synthesis method were selected. The identified nine catalysts and additionally a reference catalyst NiCeAlOx_IWI were validated by means of a micro-slit reactor system. The catalyst NiIrCeOx showed the best results at a temperature of T = 663 K and a pressure of p = 15 bar with a CO2 conversion of = 95.8% and a CH4/CO2 selectivity of = 99.9%. Conversion data close the equilibrium values were achieved by elimination mass transport limitations by increasing residence time.
The most active catalyst was characterized by PXRD, Raman spectroscopy, and STEM. In the diffraction pattern of the reduced catalyst, a solid solution formation between nickel and iridium could be identified. Investigations using Raman spectroscopy showed complete reduction of the active components, no change in the catalyst components during the reaction and no carbon deposits during reaction. The treatment of the pure support material CeO2 under the same conditions as the catalysts revealed signals in the Raman spectra to be assigned to vacancies in the oxygen sublattice of the fluorite-type ceria lattice. HAADF-STEM images with EDS mappings revealed uniform distribution of the impregnated elements Ni and Ir on the ceria support and an unchanged morphology of the nanoscale support material on impregnation. After reduction, the element distribution of Ni and Ir are not always coincident indicating that the Ni-Ir alloy formation with a formal Ni: Ir ratio of 4:1 is spatially not uniform with areas more rich in Ir or Ni than the average composition.
In conclusion, both the composition of the active components and the choice of supporting material have a significant influence on the catalytic activity of the Sabatier reaction. The assumption of a two-step reaction mechanism with CO dissociation as the rate-determining step does not describe the influence of the supporting materials. There is reason to believe that the adsorption of CO2 on the surface of the supporting material contributes to the reaction rate. Further investigations using CO2 adsorption at reaction conditions are necessary.
Supplementary Materials
The following are available online at https://www.mdpi.com/2073-4344/11/1/6/s1, Table S1. Chemicals used as well as their manufacturers and purity, s—solid, l—liquid, g—gas. Table S2. Equipment used as well as their manufacturers and intended use. Table S3. Measured activities (-conversion CO2; -selectivity CH4) of the 143 active catalysts from the catalyst screening (double determination).
Author Contributions
M.P. built the experimental setups, conducted experiments, analyzed data, and wrote this paper. T.S. designed and constructed the reactors. P.C. recorded all STEM images, K.S. supervised the work, wrote the paper and reviewed the article. All authors have read and agreed to the published version of the manuscript.
Funding
This work was financially supported by the European Social Fund (ESF) and the Sächsische Aufbaubank (SAB).
Acknowledgments
We thank the professorship Coordination Chemistry (M. Mehring, M.Sc. I. Köwitsch) at TUC for measuring PXRD pattern. We also gratefully acknowledge the help of M. Heggen at ERC Juelich in STEM measurement time application.
Conflicts of Interest
The authors declare no conflict of interest.
References
- Aldashukurova, G.; Mironenko, A.; Mansurov, Z.; Shikina, N.; Yashnik, S.; Ismagilov, Z. Carbon dioxide reforming of methane over Co-Ni catalysts. Chem. Eng. Trans. 2011, 25, 63–68. [Google Scholar] [CrossRef]
- Benson, E.E.; Kubiak, C.P.; Sathrum, A.J.; Smieja, J.M. Electrocatalytic and homogeneous approaches to conversion of CO2 to liquid fuels. Chem. Soc. Rev. 2009, 38, 89–99. [Google Scholar] [CrossRef] [PubMed]
- Bligaard, T.; Nørskov, J.K.; Dahl, S.; Matthiesen, J.; Christensen, C.H.; Sehested, J. The Brønsted-Evans-Polanyi relation and the volcano curve in heterogeneous catalysis. J. Catal. 2004, 224, 206–217. [Google Scholar] [CrossRef]
- Bradford, M.C.J.; Vannice, M.A. CO2 reforming of CH4. Catal. Rev. Sci. Eng. 1999, 41, 1–42. [Google Scholar] [CrossRef]
- Mutz, B.; Sprenger, P.; Wang, W.; Wang, D.; Kleist, W.; Grunwaldt, J.-D. Operando Raman spectroscopy on CO2 methanation over alumina-supported Ni, Ni3Fe and NiRh0.1 catalysts: Role of carbon formation as possible deactivation pathway. Appl. Catal. A Gen. 2018, 556, 160–171. [Google Scholar] [CrossRef]
- Mondal, K.C.; Choudhary, V.R.; Joshi, U.A. CO2 reforming of methane to syngas over highly active and stable supported CoOx (accompanied with MgO, ZrO2 or CeO2) catalysts. Appl. Catal. A Gen. 2007, 316, 47–52. [Google Scholar] [CrossRef]
- Marwood, M.; Doepper, R.; Renken, A. In-situ surface and gas phase analysis for kinetic studies under transient conditions. The catalytic hydrogenation of CO2. Appl. Catal. A Gen. 1997, 151, 223–246. [Google Scholar] [CrossRef]
- Fukuhara, C.; Hayakawa, K.; Suzuki, Y.; Kawasaki, W.; Watanabe, R. A novel nickel-based structured catalyst for CO2 methanation: A honeycomb-type Ni/CeO2 catalyst to transform greenhouse gas into useful resources. Appl. Catal. A Gen. 2017, 532, 12–18. [Google Scholar] [CrossRef]
- Tang, L.; Yamaguchi, D.; Burke, N.; Trimm, D.; Chiang, K. Methane decomposition over ceria modified iron catalysts. Catal. Commun. 2010, 11, 1215–1219. [Google Scholar] [CrossRef]
- Myrstad, R.; Eri, S.; Pfeifer, P.; Rytter, E.; Holmen, A. Fischer–Tropsch synthesis in a microstructured reactor. Catal. Today 2009, 147S, S301–S304. [Google Scholar] [CrossRef]
- Gödde, M.; Liebner, C.; Hieronymus, H. Sicherheit in der Mikroreaktionstechnik. Chem. Ing. Tech. 2009, 81, 73–78. [Google Scholar] [CrossRef]
- Schwarz, T.; Schirrmeister, S.; Döring, H.; Klemm, E. Herstellung von Wandkatalysatoren für Mikrostrukturreaktoren mittels der Niederdruckspritztechnologie. Chem. Ing. Tech. 2010, 82, 921–928. [Google Scholar] [CrossRef]
- Pfeifer, M.; Schwarz, T.; Stöwe, K. Quaternäre metall/metalloxid-katalysatoren als wandkataly satoren in mikroreaktoren für power-to-gas-applikationen mittels kombinatorischer hochdurchsatzmethoden. Chem. Ing. Tech. 2019, 91, 1–8. [Google Scholar] [CrossRef]
- Satthawong, R.; Koizumi, N.; Song, C.; Prasassarakich, P. Bimetallic Fe-Co catalysts for CO2 hydrogenation to higher hydrocarbons. J. CO2 Util. 2013, 3–4, 102–106. [Google Scholar] [CrossRef]
- San-José-Alonso, D.; Juan-Juan, J.; Illán-Gómez, M.J.; Román-Martínez, M.C. Ni, Co and bimetallic Ni-Co catalysts for the dry reforming of methane. Appl. Catal. A Gen. 2009, 371, 54–59. [Google Scholar] [CrossRef]
- Kugai, J.; Velu, S.; Song, C. Low-temperature reforming of ethanol over CeO2-supported Ni-Rh Bimetallic catalysts for H2 production. Catal. Lett. 2005, 101, 255–264. [Google Scholar] [CrossRef]
- Traa, Y.; Weitkamp, J. Kinetik der methanisierung von kohlendioxid an ruthenium auf titandioxid. Chem. Ing. Tech. 1998, 70, 1428–1430. [Google Scholar] [CrossRef]
- Lin, W.; Cheng, H.; He, L.; Yu, Y.; Zhao, F. High performance of Ir-promoted Ni/TiO2 catalyst toward the selective hydrogenation of cinnamaldehyde. J. Catal. 2013, 303, 110–116. [Google Scholar] [CrossRef]
- Irusta, S.; Cornaglia, L.M.; Lombardo, E.A. Hydrogen production using Ni–Rh on ZrO2 as potential low-temperature catalysts for membrane reactors. J. Catal. 2002, 210, 263–272. [Google Scholar] [CrossRef]
- Crisafulli, C.; Scirè, S.; Maggiore, R.; Minicò, S.; Galvagno, S. CO2 reforming of methane over Ni–Ru and Ni–Pd bimetallic catalysts. Catal. Lett. 1999, 59, 21–26. [Google Scholar] [CrossRef]
- Nie, W.; Zou, X.; Shang, X.; Wang, X.; Ding, W.; Lu, X. CeO2-assisted Ni nanocatalysts supported on mesoporous γ-Al2O3 for the production of synthetic natural gas. Fuel 2017, 202, 135–143. [Google Scholar] [CrossRef]
- Gao, J.; Wang, Y.; Ping, Y.; Hu, D.; Xu, G.; Gu, F.; Su, F. A thermodynamic analysis of methanation reactions of carbon oxides for the production of synthetic natural gas. RSC Adv. 2012, 2, 2358–2368. [Google Scholar] [CrossRef]
- Degussa VP AdNano® Ceria 50 product sheet, Degussa AG, Advanced Nanomaterials, Germany.
- Raub, E.; Röschel, E. Die Legierungen des Nickels mit Iridium und Rhodium. Z. Met. 1970, 61, 113–115, Searched at Springer Materials. Available online: https://materials.springer.com/isp/phase-diagram/docs/c_0901433 (accessed on 3 February 2020).
- Schilling, C.; Hofmann, A.; Hess, C.; Ganduglia-Pirovano, M.V. Raman spectra of polycrystalline CeO2: A density functional theory study. J. Phys. Chem. C 2017, 121, 20834–20849. [Google Scholar] [CrossRef]
- Weber, W.; Hass, K.; McBride, J. Raman study of CeO2: Second-order scattering, lattice dynamics and particle-size effects. Phys. Rev. B Cover. Condens. Matter Mater. Phys. 1993, 48, 178–185. [Google Scholar] [CrossRef]
- Nguyen, T.-S.; Postole, G.; Loridant, S.; Bosselet, F.; Burel, L.; Aouine, M.; Massin, L.; Gélin, P.; Morfin, F.; Piccolo, L. Ultrastable iridium–ceria nanopowders synthesized in one step by solution combustion for catalytic hydrogen production. J. Mater. Chem. A 2014, 2, 19822–19832. [Google Scholar] [CrossRef]
- Derafa, W.; Paloukis, F.; Mewafy, B.; Baaziz, W.; Ersen, O.; Petit, C.; Corbel, G.; Zafeiratos, S. Synthesis and characterization of nickel-doped ceria nanoparticles with improved surface reducibility. RSC Adv. 2018, 8, 40712–40719. [Google Scholar] [CrossRef]
- Saalfrank, J.W.; Maier, W.F. Directed evolution of noble-metal-free catalysts for the oxidation of CO at room temperature. Angew. Chem. Int. Ed. 2004, 43, 2028–2031. [Google Scholar] [CrossRef]
- Kakihana, M.; Arima, M.; Yoshimura, M.; Ikeda, N.; Sugitani, Y. Synthesis of high surface area LaMnO3+d by a polymerizable complex method. J. Alloy. Compd. 1999, 283, 102–105. [Google Scholar] [CrossRef]


Publisher’s Note: MDPI stays neutral with regard to jurisdictional claims in published maps and institutional affiliations. |
© 2020 by the authors. Licensee MDPI, Basel, Switzerland. This article is an open access article distributed under the terms and conditions of the Creative Commons Attribution (CC BY) license (http://creativecommons.org/licenses/by/4.0/).