Carbon Nanotube Formation on Cr-Doped Ferrite Catalyst during Water Gas Shift Membrane Reaction: Mechanistic Implications and Extended Studies on Dry Gas Conversions

 , ,
, ,  ,
, 

Abstract
1. Introduction
2. Results and Discussion
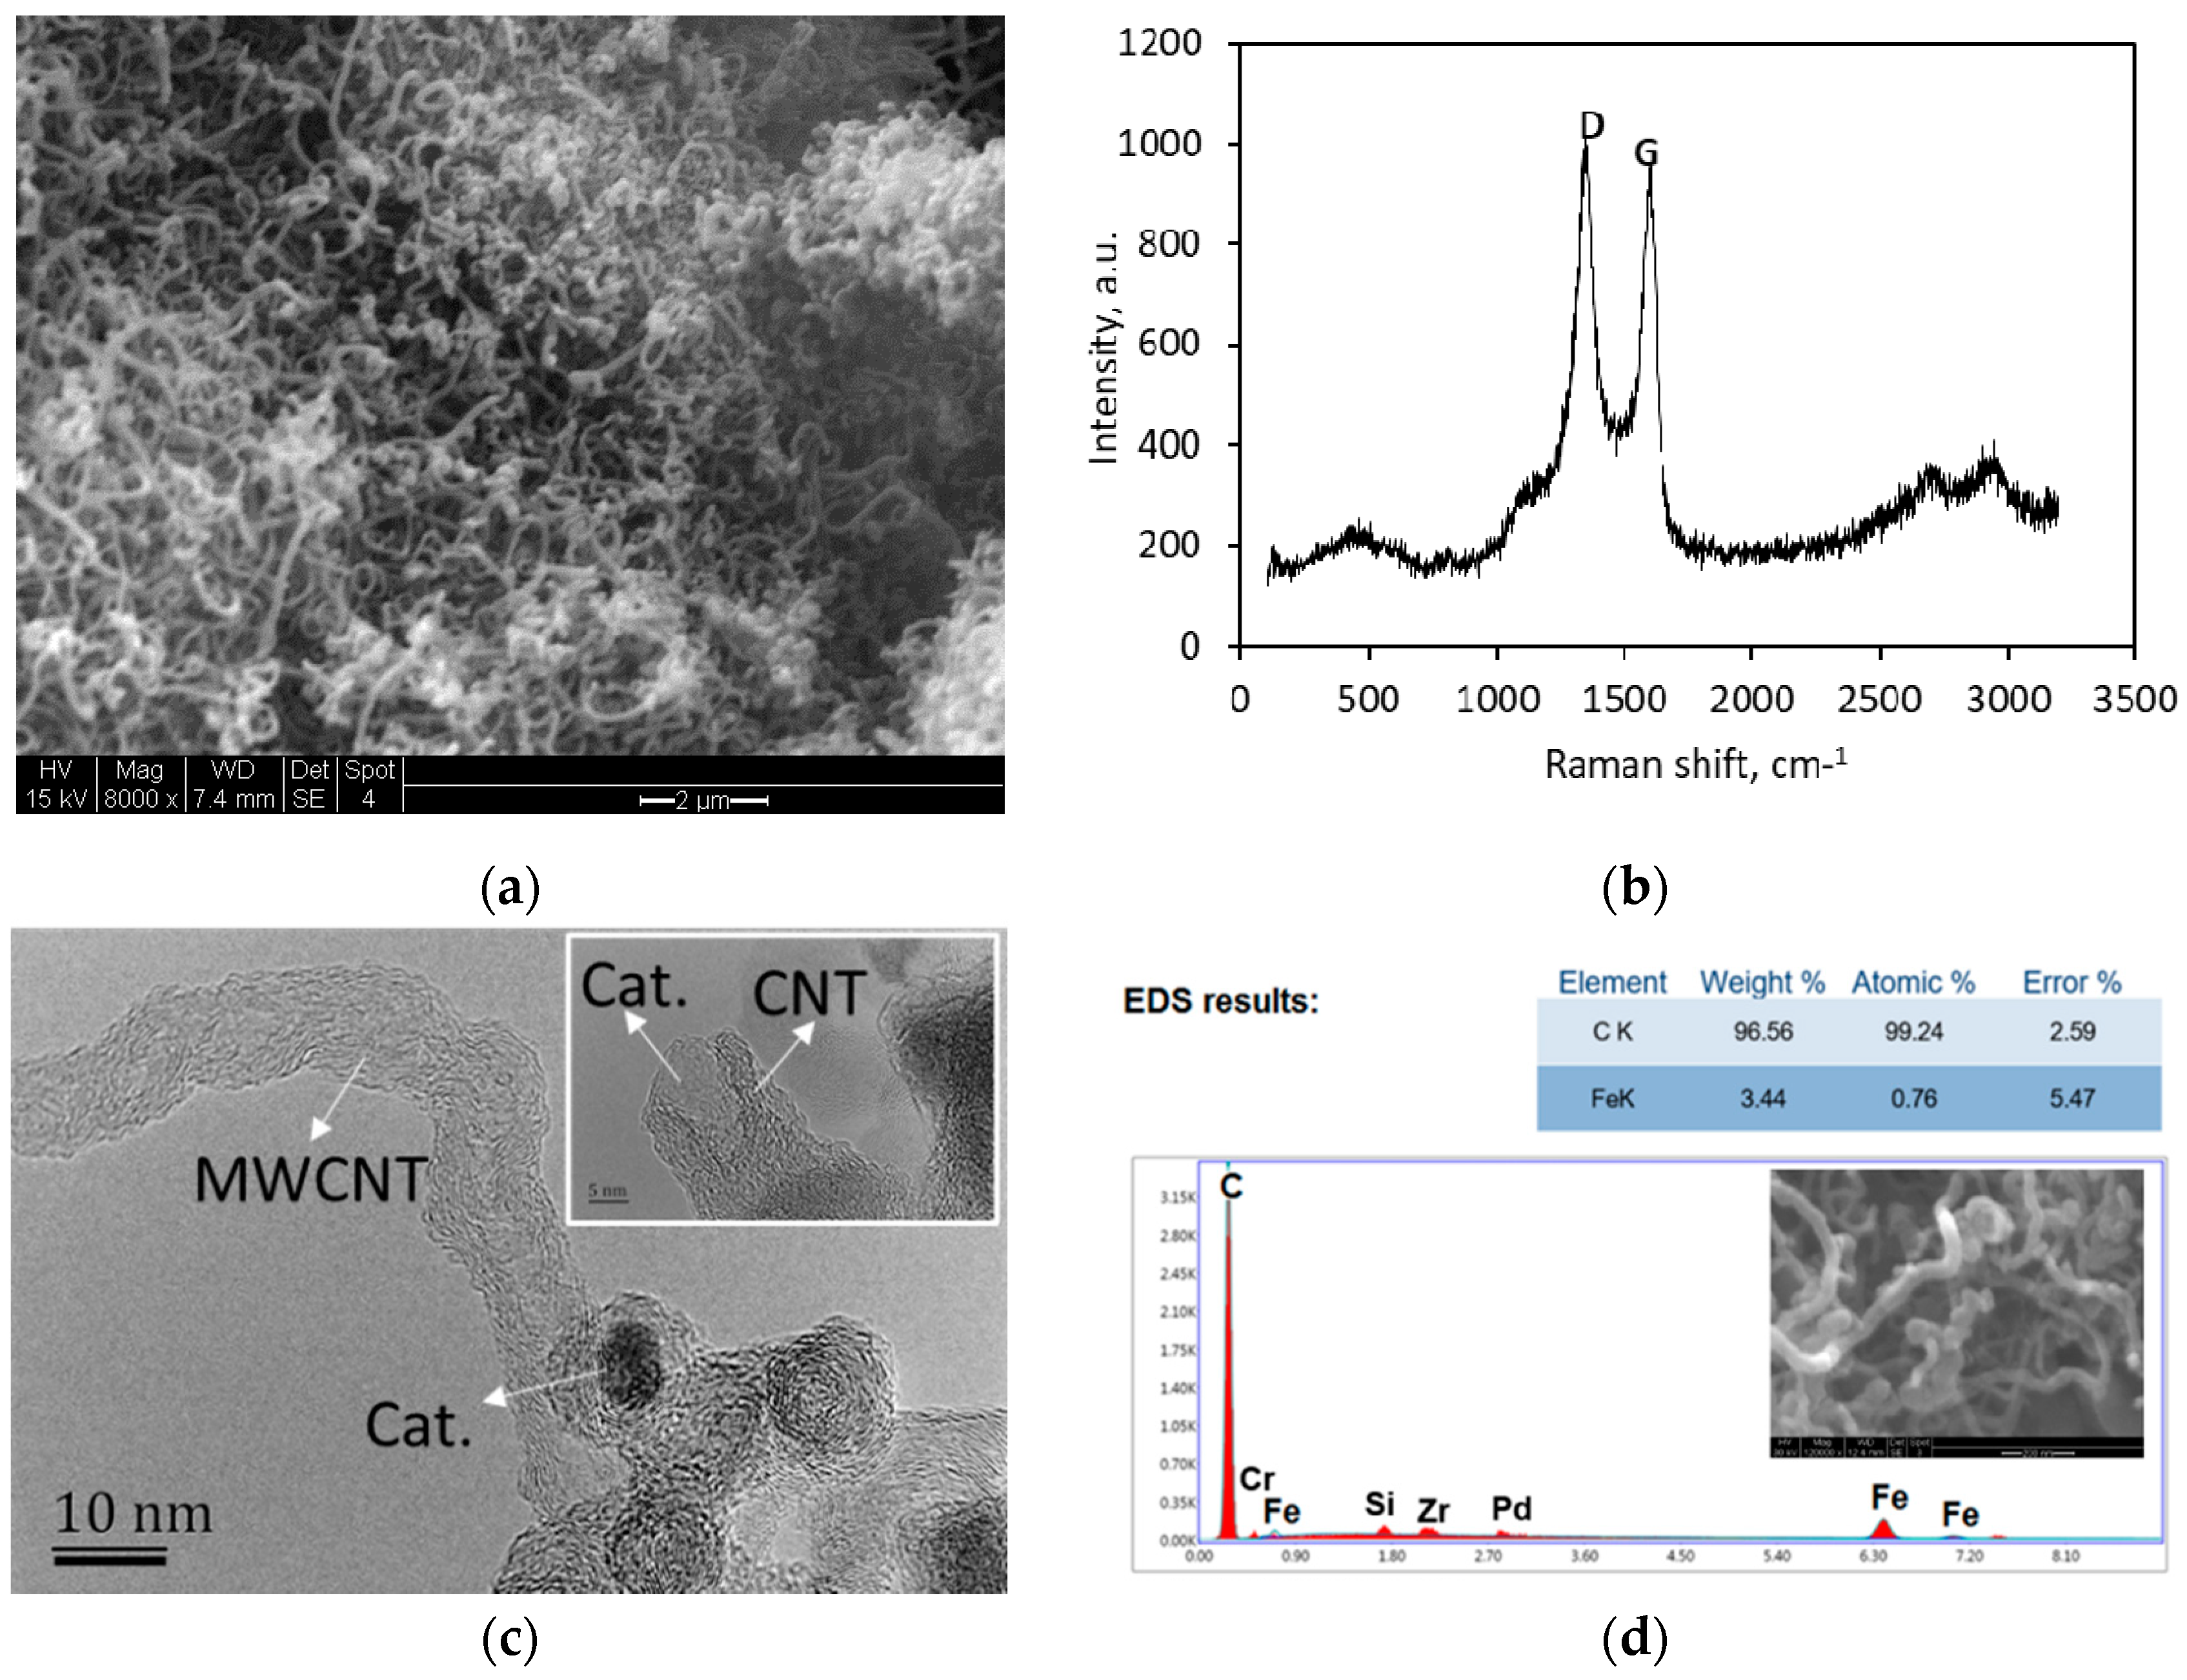
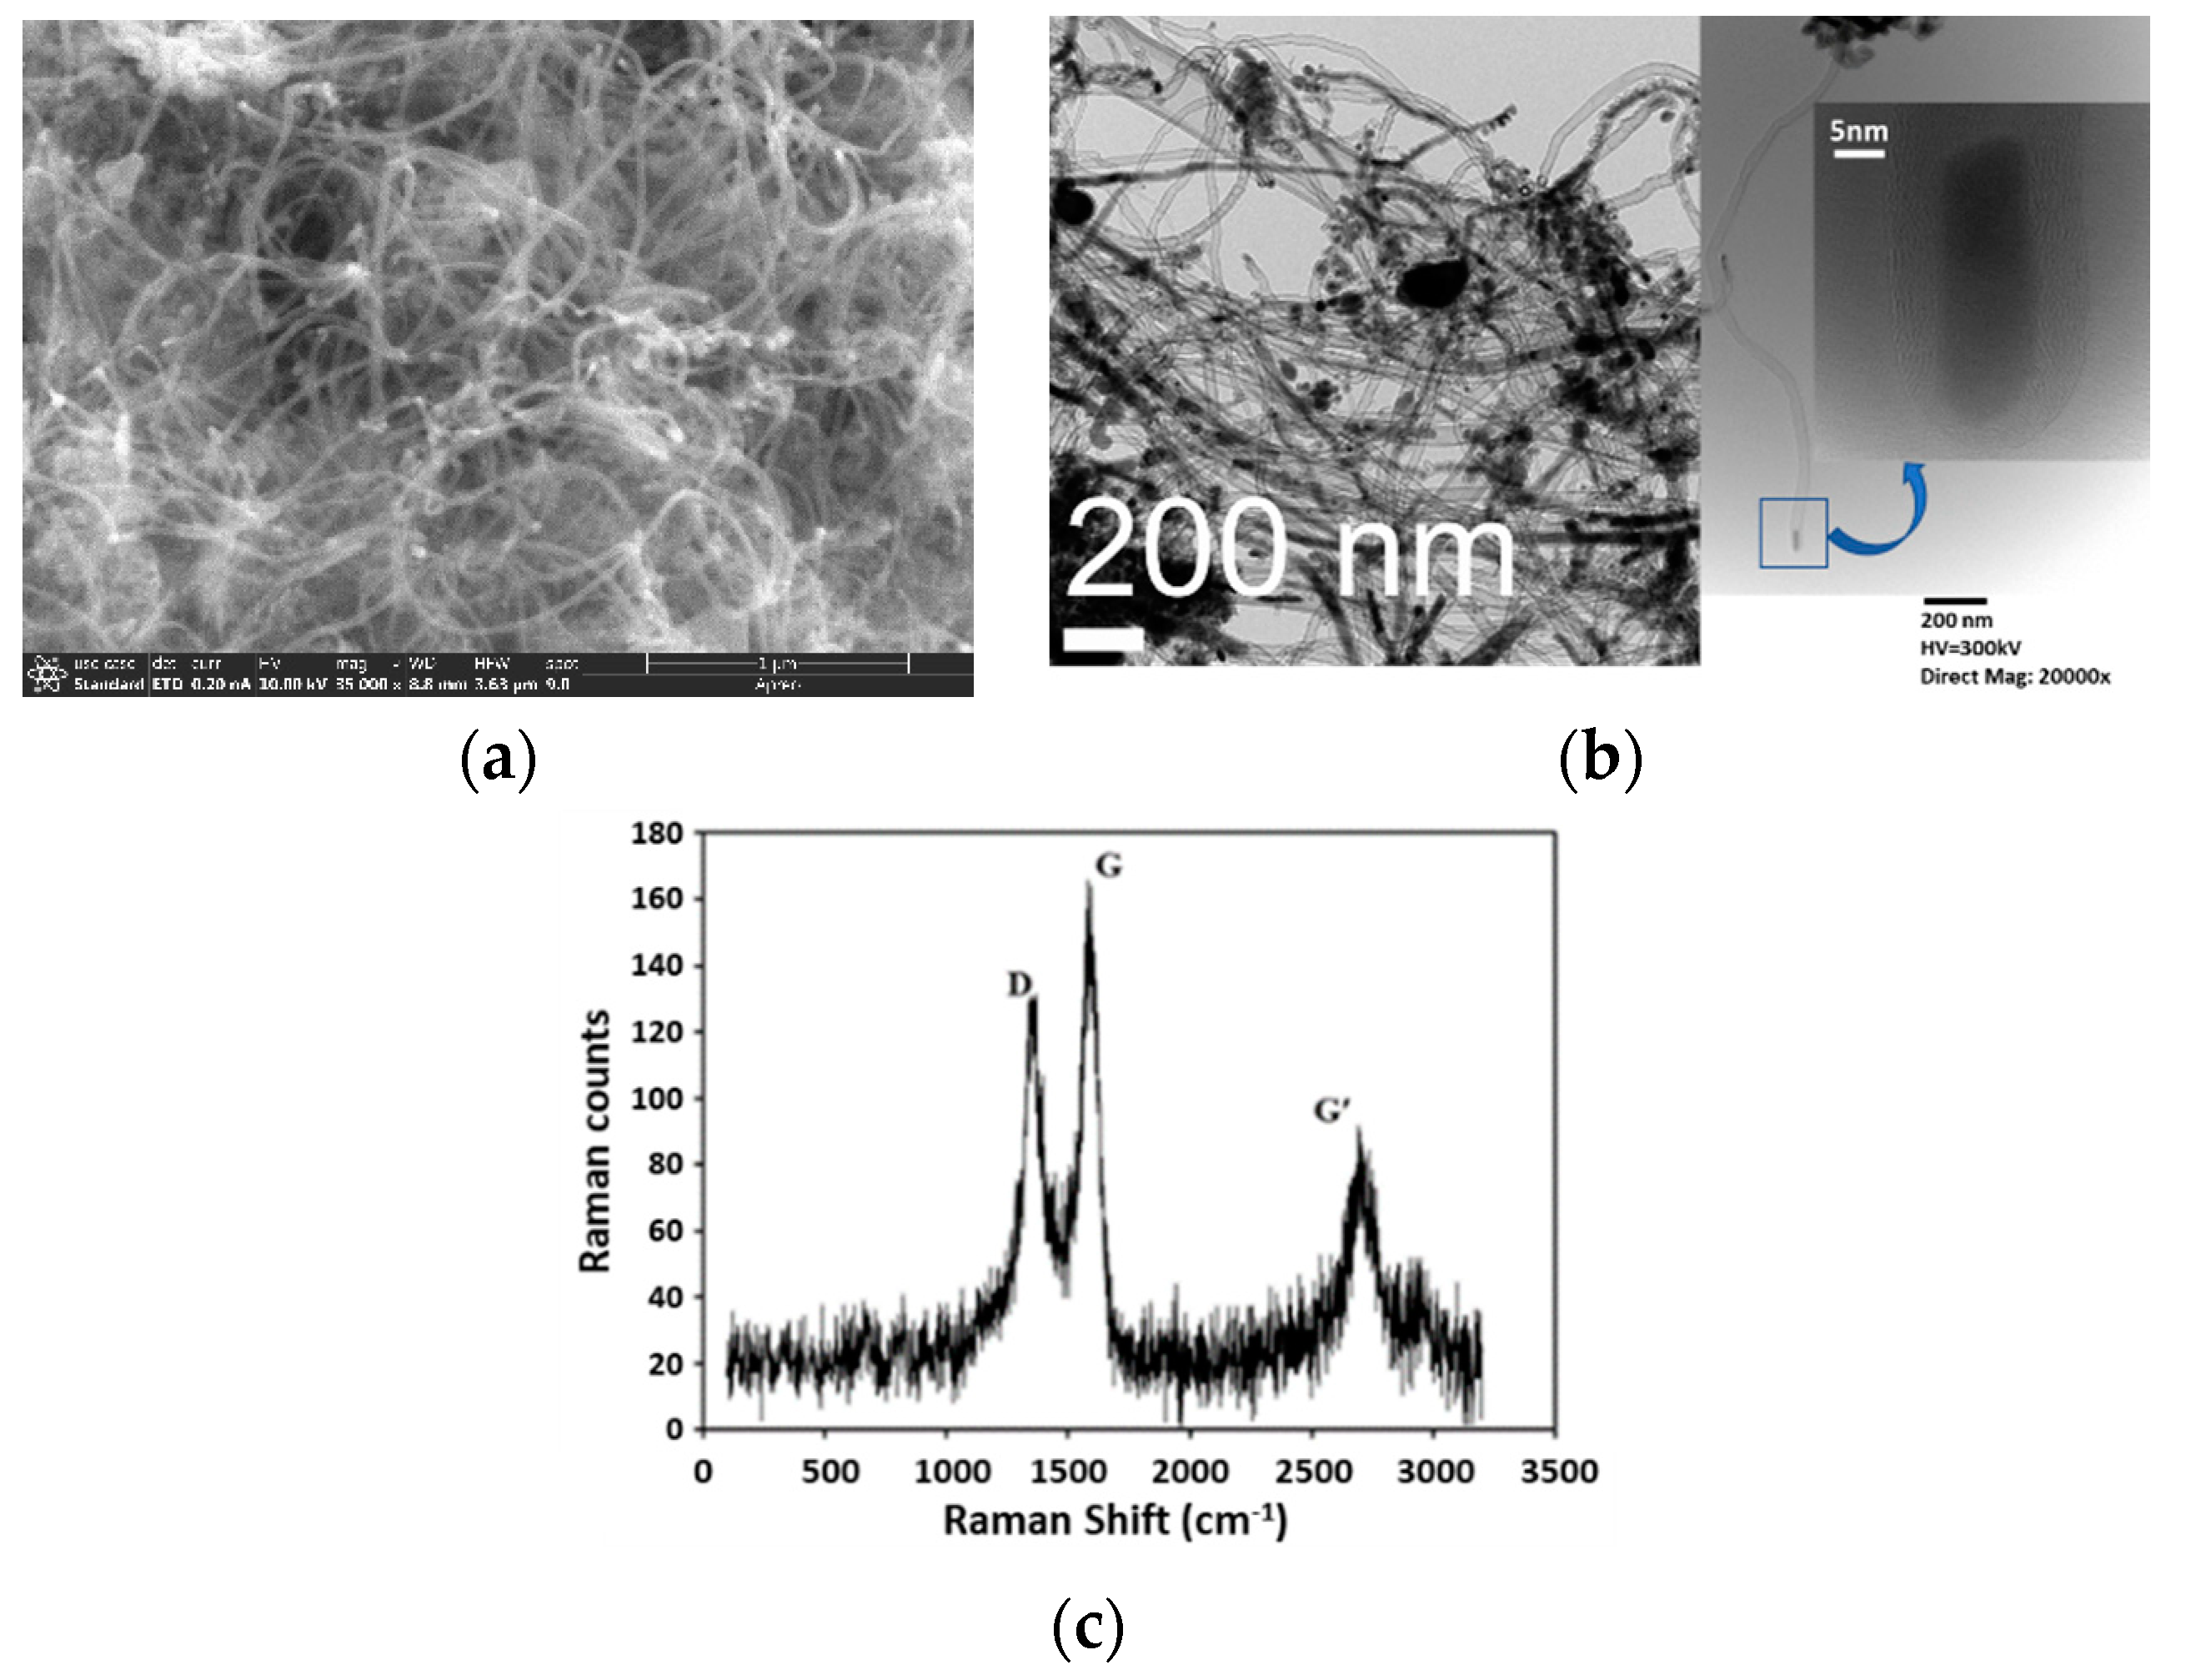
2.1. MWCNT Formation in WGS MR
2.2. Reaction of Dry Source Gases on FeCr Catalysts
2.2.1. Pure CO Feed
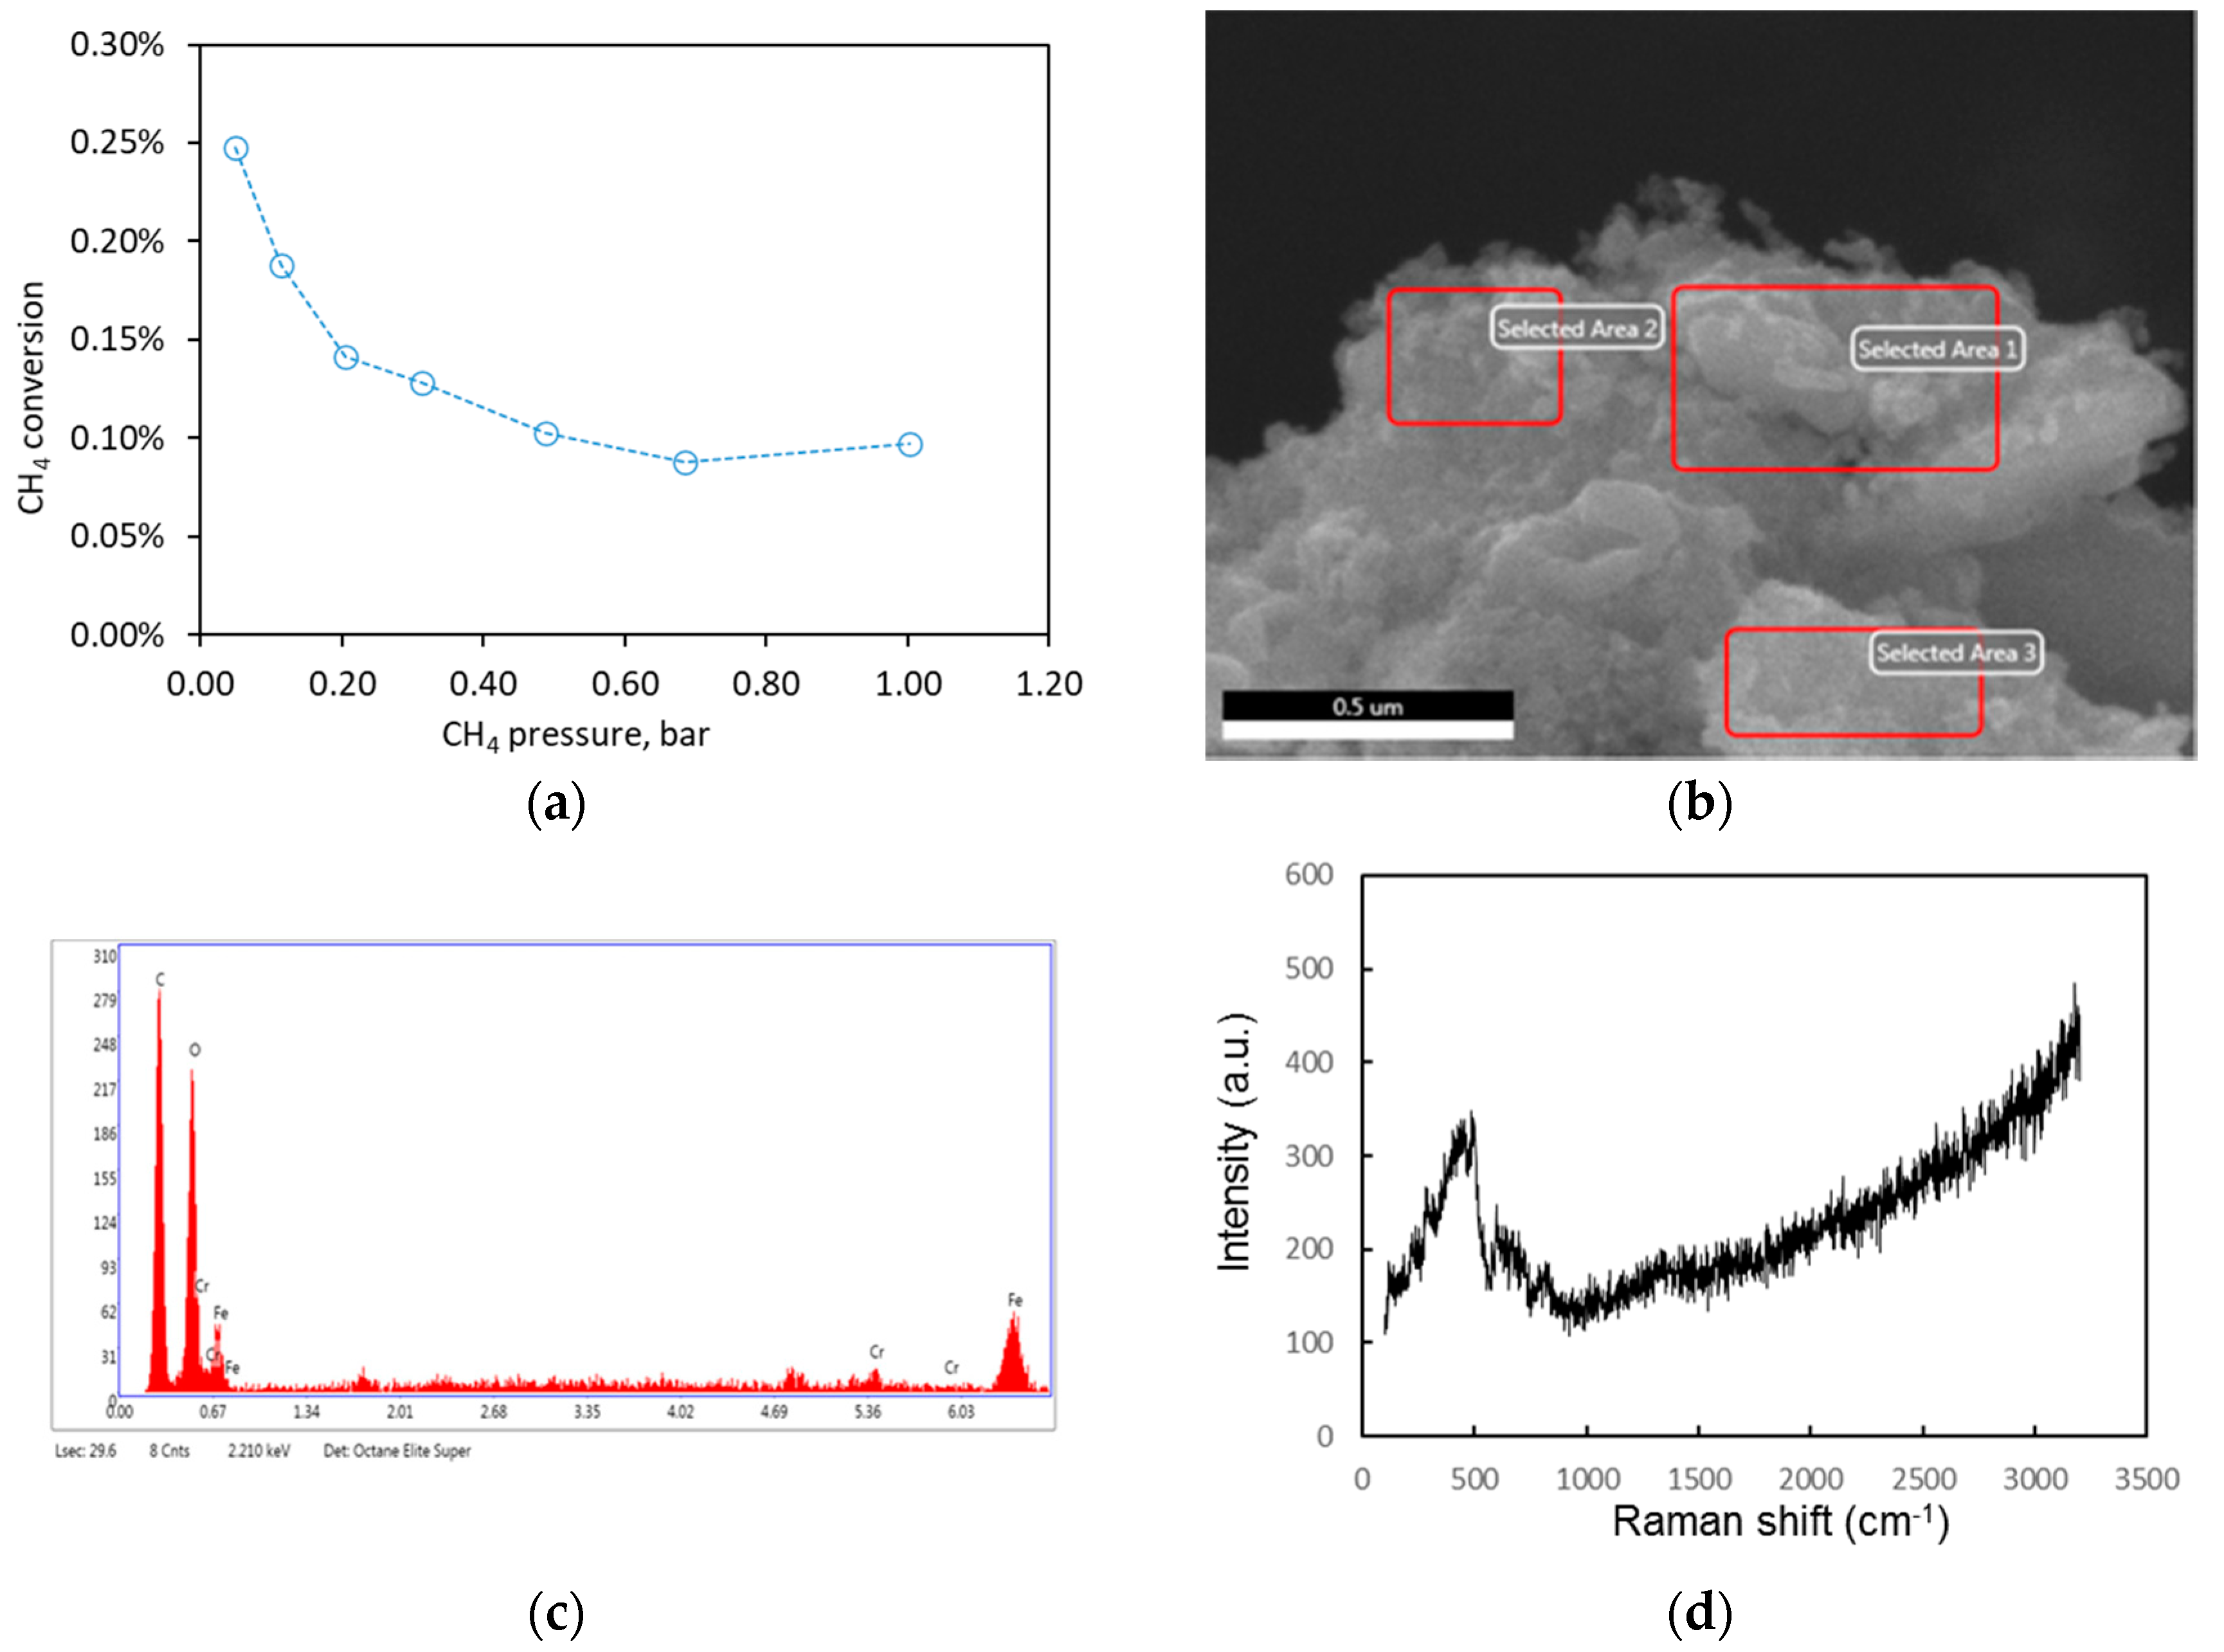
2.2.2. Pure CH4 Fee
2.3. CO/CH4 Mixture Reaction and Effects of H2S
2.3.1. CO/CH4 Mixture Feed
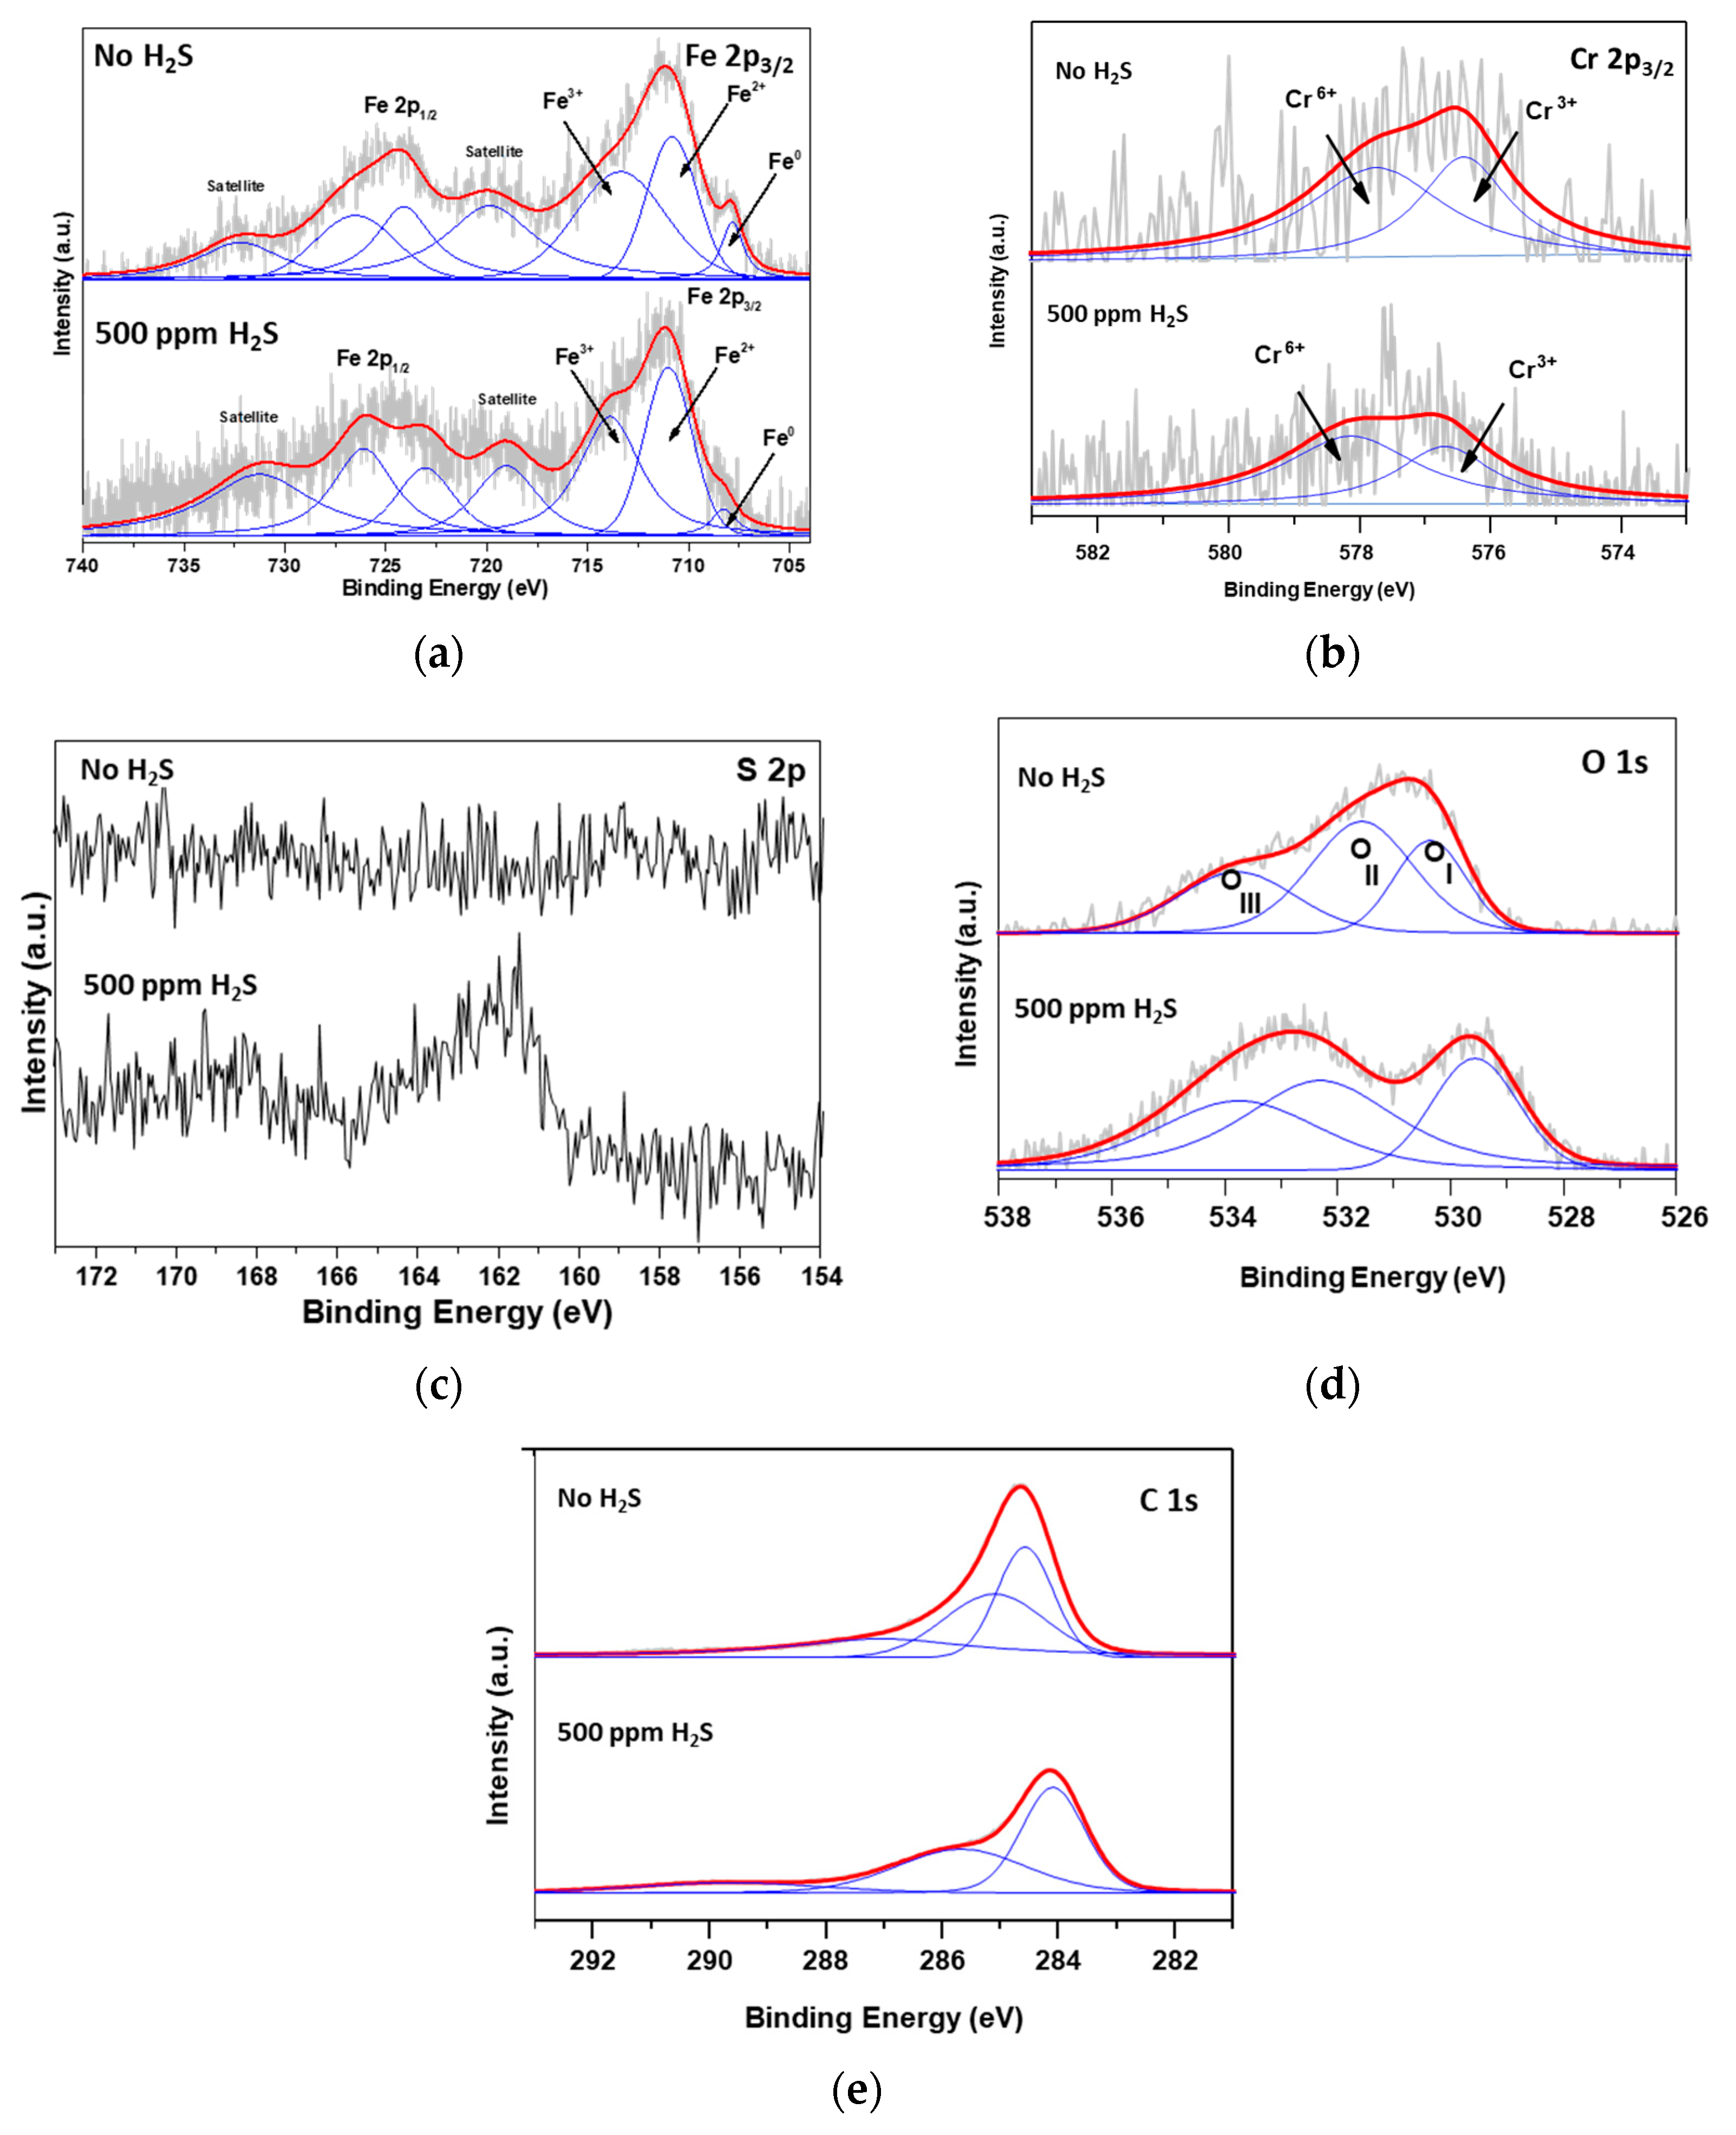
2.3.2. Effects of H2S in Feed
3. Materials and Methods
3.1. Catalyst Preparation
3.2. Membrane Fabrication
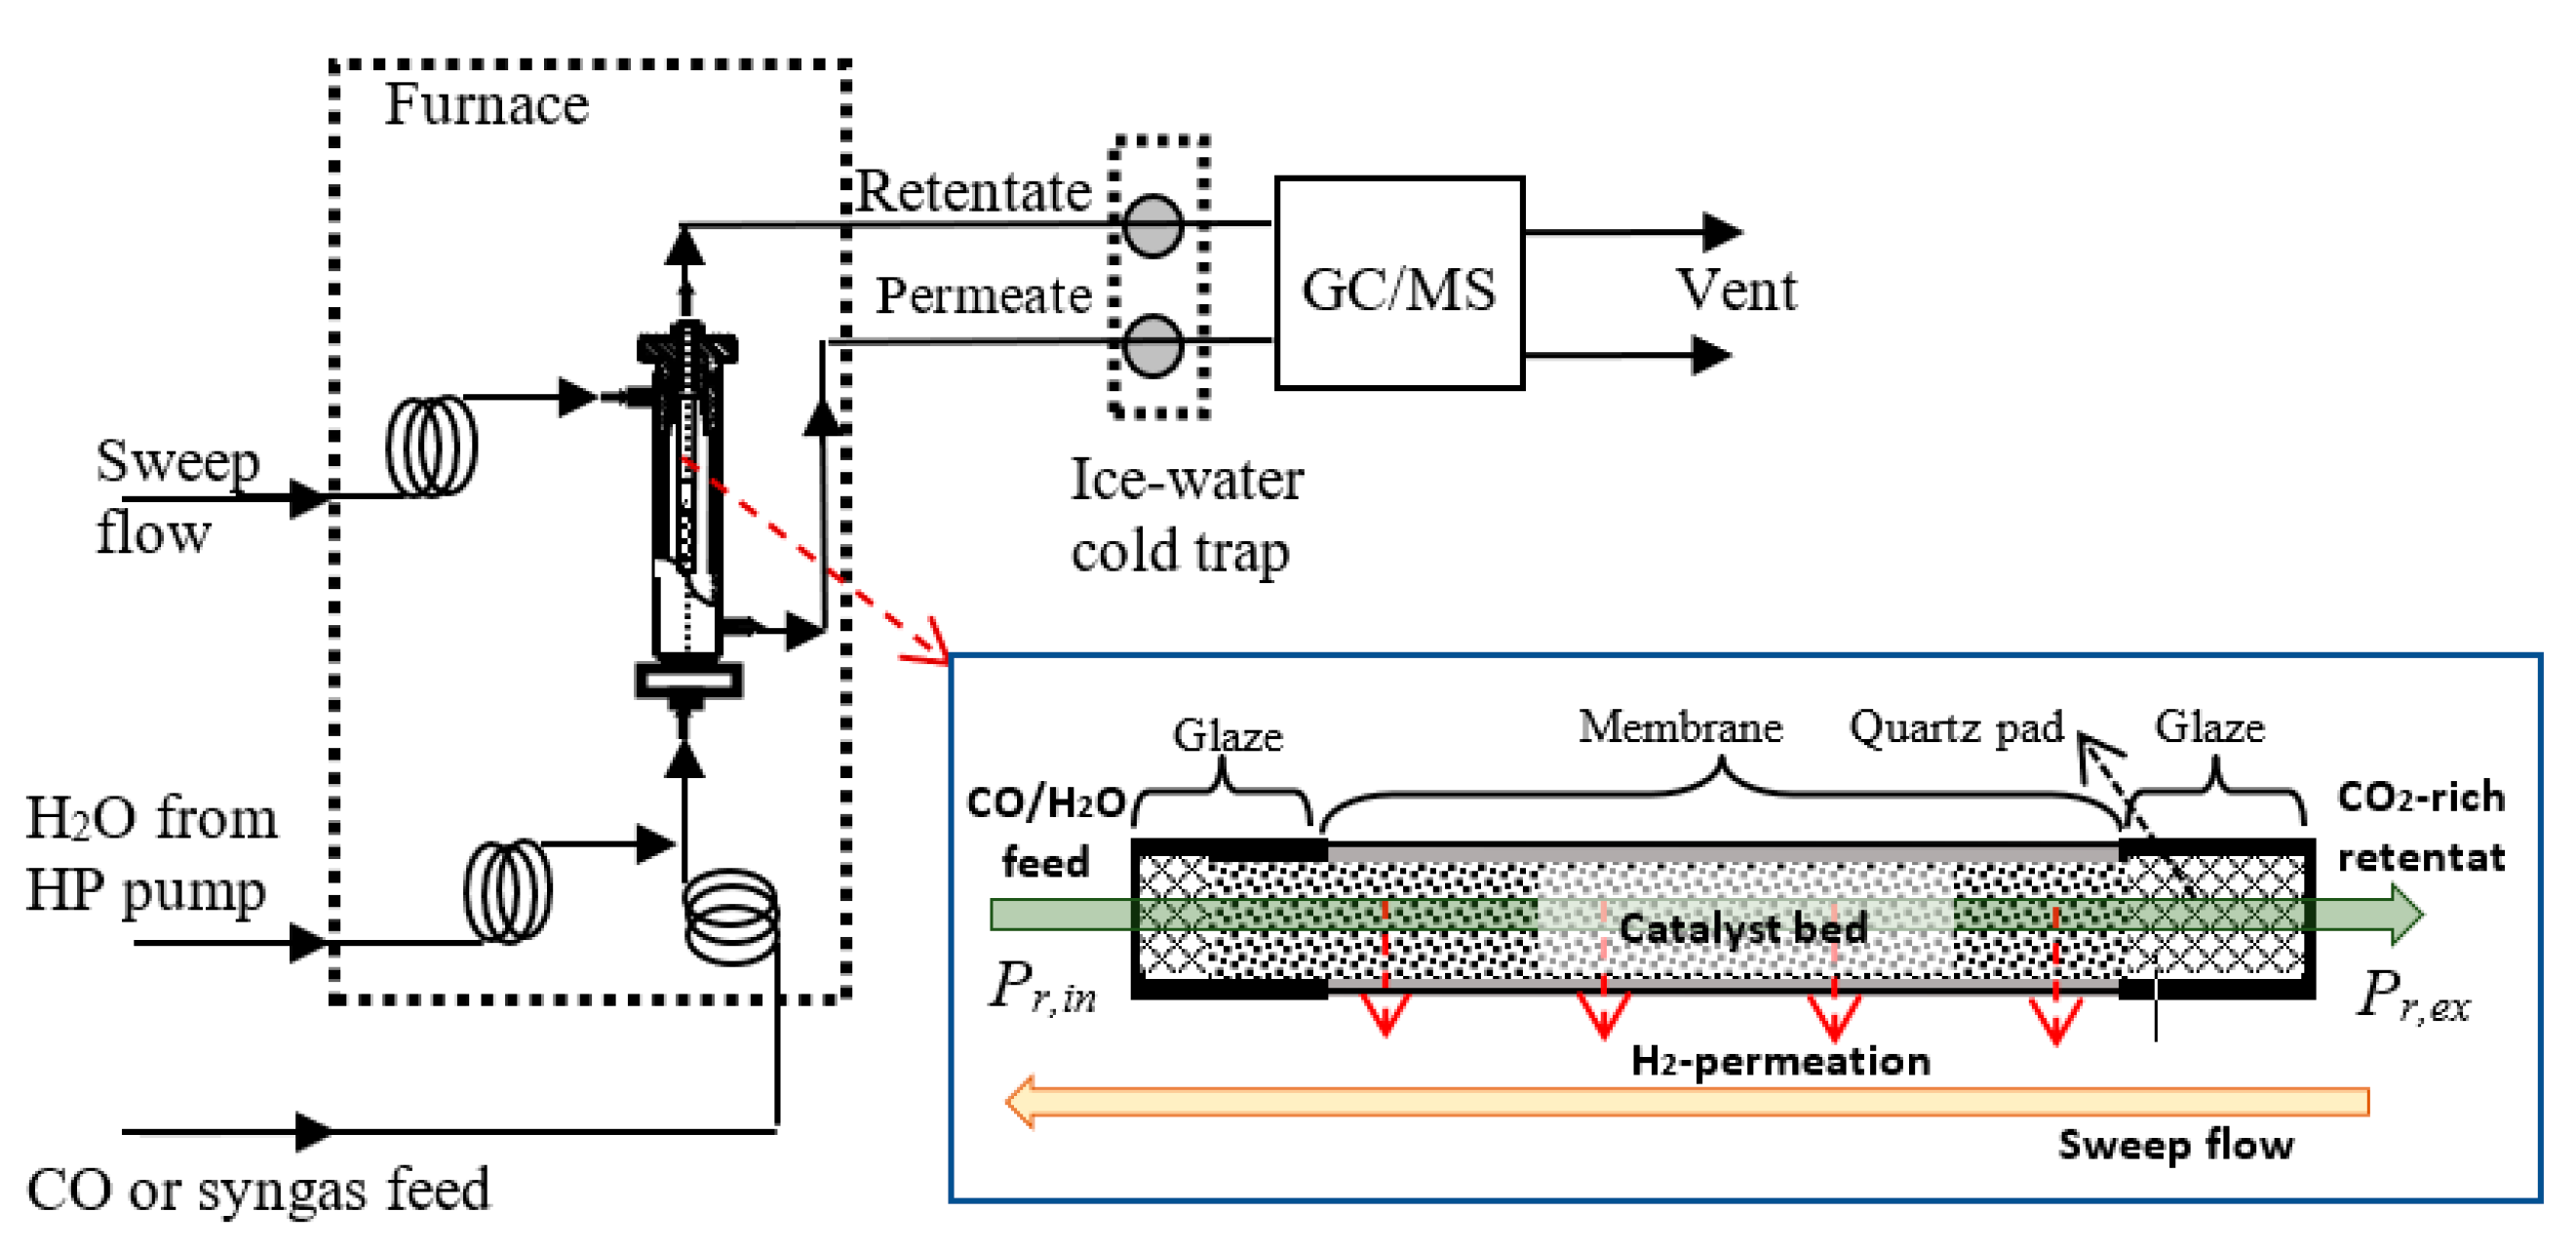
3.3. Reactors and Operations
4. Conclusions and Perspectives
Supplementary Materials
Author Contributions
Funding
Conflicts of Interest
References
- Lin, Y.S. Inorganic Membranes for Process Intensification: Challenges and Perspective. Ind. Eng. Chem. Res. 2018, 58, 5787–5796. [Google Scholar] [CrossRef]
- Damma, D.; Smirniotis, P.G. Recent advances in iron-based high-temperature water-gas shift catalysis for hydrogen production. Curr. Opin. Chem. Eng. 2018, 21, 103–110. [Google Scholar] [CrossRef]
- Kim, S.J.; Xu, Z.; Reddy, G.K.; Dong, J.; Smirniotis, P. Effect of Pressure on High Temperature Water Gas Shift Reaction in Microporous Zeolite Membrane Reactor. Ind. Eng. Chem. Res. 2012, 51, 1364–1375. [Google Scholar] [CrossRef]
- Kim, S.J.; Yang, S.; Reddy, G.K.; Dong, J.; Smirniotis, P. Zeolite membrane reactor for high temperature water gas shift reaction: Experimental and simulation studies. Energy Fuels 2013, 27, 4471–4480. [Google Scholar] [CrossRef]
- Arvanitis, A.; Sun, X.; Yang, S.; Damma, D.; Smirniotis, P.; Dong, J. Approaching Complete CO Conversion and Total H2 Recovery for Water Gas Shift Reaction in a High-Temperature and High-Pressure Zeolite Membrane Reactor. J. Membr. Sci. 2018, 549, 575–580. [Google Scholar] [CrossRef]
- LeValley, T.L.; Richard, A.R.; Fan, M. The progress in water gas shift and steam reforming hydrogen production technologies—A review. Int. J. Hydrog. Energy 2014, 39, 16983–17000. [Google Scholar] [CrossRef]
- Nikolaev, P.; Bronikowski, M.J.; Bradley, R.K.; Rohmund, F.; Colbert, D.T.; Smith, K.A.; Smalley, R.E. Gas-phase catalytic growth of single-walled carbon nanotubes from carbon monoxide. Chem. Phys. Lett. 1999, 313, 91–97. [Google Scholar] [CrossRef]
- Selbmann, D.; Bendjemil, B.; Leonhardt, A.; Pichler, T.; Täschner, C.; Ritschel, M. A parametric study of the synthesis and purification of single-walled carbon nanotubes using the high-pressure carbon monoxide process. Appl. Phys. A 2008, 90, 637–643. [Google Scholar] [CrossRef]
- Ashik, U.P.M.; Daud, W.W.; Abbas, H.F. Production of greenhouse gas free hydrogen by thermocatalytic decomposition of methane—A review. Renew. Sustain. Energy Rev. 2015, 44, 221–256. [Google Scholar] [CrossRef]
- Tang, L.; Yamaguchi, D.; Burke, N.; Trimm, D.; Chiang, K. Methane decomposition over ceria modified iron catalysts. Catal. Commun. 2010, 11, 1215–1219. [Google Scholar] [CrossRef]
- Gunugunuri, K.R.; Kim, S.J.; Dong, J.; Jasinski, J.B.; Smirniotis, P. Long-term WGS stability of Fe/Ce and Fe/Ce/Cr catalysts at high and low steam to CO ratios—XPS and Mössbauer spectroscopic study. Appl. Catal. A Gen. 2012, 415, 101–110. [Google Scholar]
- Lee, S.H.; Park, J.P.; Kim, H.R.; Lee, J.G.; Hong, K.H. Synthesis of high-quality carbon nanotube fibers by controlling the effects of sulfur on the catalyst agglomeration during the direct spinning process. RSC Adv. 2015, 5, 41894–41900. [Google Scholar] [CrossRef]
- Moon, S.Y.; Kang, I.J.; Kim, S.M.; Kim, W.S. Influence of the Sulfur Content Catalyst on the Packing Density of Carbon Nanotube Forests. Nanomaterials 2019, 9, 889. [Google Scholar] [CrossRef]
- Wang, H.; Wei, L.; Ren, F.; Wang, Q.; Pfefferle, L.D.; Haller, G.L.; Chen, Y. Chiral-Selective CoSO4/SiO2 Catalyst for Single-Walled Carbon Nanotube Growth. ACS Nano 2013, 7, 614–626. [Google Scholar] [CrossRef]
- Wang, H.; Ren, F.; Liu, C.; Si, R.; Yu, D.; Pfefferle, L.D.; Haller, G.L.; Chen, Y. CoSO4/SiO2 catalyst for selective synthesis of single-walled carbon nanotubes: Effect of catalyst calcination. J. Catal. 2013, 300, 91–101. [Google Scholar] [CrossRef]
- Wang, H.; Yang, L.; Sui, X.; Karhan, H.E.; Wang, X.; Chen, Y. Selective synthesis of single walled carbon nanotubes on metal (iron, nickel or cobalt) sulfate-based catalysts. Carbon 2018, 129, 128–136. [Google Scholar] [CrossRef]
- Rhodes, C.; Williams, P.B.; King, F.; Hutchings, G.J. Promotion of Fe3O4/Cr2O3 high temperature water gas shift catalyst. Catal. Commun. 2002, 3, 381–384. [Google Scholar] [CrossRef]
- Damma, D.; Smirniotis, P.G. Effects of the Ce and Cr Contents in Fe−Ce−Cr Ferrite Spinels on the High-Temperature Water—Gas Shift Reaction. Ind. Eng. Chem. Res. 2017, 56, 1772–1781. [Google Scholar]
- Choudhary, T.V.; Aksoylu, E.; Goodman, D.W. Nonoxidative Activation of Methane. Catal. Rev. 2003, 45, 151–203. [Google Scholar] [CrossRef]
- Gu, X.; Zhang, J.; Dong, J.; Nenoff, T.M. A Platinum-Cobalt-Loaded NaY Zeolite Membrane for Nonoxidative Conversion of Methane to Higher Hydrocarbons and Hydrogen. Catal. Lett. 2005, 102, 9–13. [Google Scholar] [CrossRef]
- Robertson, J. Heterogeneous catalysis model of growth mechanisms of carbon nanotubes, graphene and silicon nanowires. J. Mater. Chem. 2012, 22, 19858–19862. [Google Scholar] [CrossRef]
- Hofmann, S.; Sharma, R.; Ducati, C.; Du, G.; Mattevi, C.; Cepek, C.; Cantoro, M.; Pisana, S.; Parvez, A.; Cervantes-Sodi, F.; et al. In situ Observations of Catalyst Dynamics during Surface-Bound Carbon Nanotube Nucleation. Nano Lett. 2007, 7, 602–608. [Google Scholar] [CrossRef] [PubMed]
- Rönsch, S.; Schneider, J.; Matthischke, S.; Schlüter, M.; Götz, M.; Lefebvre, J.; Prabhakaran, P.; Bajohr, S. Review on methanation—From fundamentals to current projects. Fuel 2016, 166, 276–296. [Google Scholar] [CrossRef]
- Chen, C.J.; Back, M.H.; Back, B.A. The Thermal Decomposition of Methane. I. Kinetics of the Primary Decomposition to C2H6+H2; Rate Constant for the Homogeneous Unimolecular Dissociation of Methane and its Pressure Dependence. Can. J. Chem. 1975, 53, 3580–3590. [Google Scholar] [CrossRef]
- Pinilla, J.L.; Utrilla, R.; Lázaro, M.J.; Moliner, R.; Suelves, I.; García, A.B. Ni- and Fe-based catalysts for hydrogen and carbon nanofilament production by catalytic decomposition of methane in a rotary bed reactor. Fuel Process. Technol. 2011, 92, 1480–1488. [Google Scholar] [CrossRef]
- Moothi, K.; Simate, G.S.; Falcon, R.; Iyuke, S.E.; Meyyappan, M. Carbon Nanotube Synthesis Using Coal Pyrolysis. Langmuir 2015, 31, 9464–9472. [Google Scholar] [CrossRef]
- Jia, Z.; Kou, K.; Qin, M.; Wu, H.; Puleo, F.; Liotta, L.F. Controllable and Large-Scale Synthesis of Carbon Nanostructures: A Review on Bamboo-Like Nanotubes. Catalysts 2017, 7, 256. [Google Scholar] [CrossRef]
- Shandakov, S.D.; Kosobutsky, A.V.; Rybakov, M.S.; Sevostyanov, O.G.; Russakov, D.M.; Lomakin, M.V.; Vershinina, A.I.; Chirkova, I.M. Effect of gaseous and condensate products of ethanol decomposition on aerosol CVD synthesis of single-walled carbon nanotubes. Carbon 2018, 126, 522–531. [Google Scholar] [CrossRef]
- Gili, A.; Schlicker, L.; Bekheet, M.F.; Görke, O.; Penner, S.; Grünbacher, M.; Götsch, T.; Littlewood, P.; Marks, T.J.; Stair, P.C.; et al. Surface Carbon as a Reactive Intermediate in Dry Reforming of Methane to Syngas on a 5% Ni/MnO Catalyst. ACS Catal. 2018, 8, 8739–8750. [Google Scholar] [CrossRef]
- Anoshkin, I.V.; Nasibulin, A.G.; Tian, Y.; Liu, B.; Jiang, H.; Kauppinen, E.I. Hybrid carbon source for single-walled carbon nanotube synthesis by aerosol CVD method. Carbon 2014, 78, 130–136. [Google Scholar] [CrossRef]
- Hata, K.; Futaba, D.N.; Mizuno, K.; Namai, T.; Yumura, M.; Iijima, S. Water-Assisted Highly Efficient Synthesis of Impurity-Free Single-Walled Carbon Nanotubes. Science 2004, 306, 1362–1364. [Google Scholar] [CrossRef] [PubMed]
- Pumera, M.; Iwai, H. Multicomponent Metallic Impurities and Their Influence upon the Electrochemistry of Carbon Nanotubes. J. Phys. Chem. C 2009, 113, 4401–4405. [Google Scholar] [CrossRef]
- Srikanth, I.; Padmavathi, N.; Prasad, P.S.R.; Ghosal, P.; Jaini, R.K.; Subrahmanya, C. Effect of high-temperature heat treatment duration on the purity and microstructure of MWCNTs. Bull. Mater. Sci. 2016, 39, 41–46. [Google Scholar] [CrossRef]
- Zhang, B.; Piao, G.; Zhang, J.; Bub, C.; Xie, H.; Wu, B.; Kobayashi, N. Synthesis of carbon nanotubes from conventional biomass-based gasification Gas. Fuel Process. Technol. 2018, 180, 105–113. [Google Scholar] [CrossRef]
- Kuznetsov, B.N.; Chudinov, M.G.; Alekseev, A.M.; Yakerson, V.I. Effect of reaction mixture, oxidative and reductive media on element distribution and iron valence state on the surface of a medium-temperature iron-chromium catalyst. Kinet. Catal. 1996, 37, 846–849. [Google Scholar]
- Furlan, A.; Jansson, U.; Lu, J.; Hultman, L.; Magnuson, M. Structure and bonding in amorphous iron carbide thin films. J. Phys. Condens. Matter 2015, 27, 045002. [Google Scholar] [CrossRef]
- Da Cunha, T.H.R.; De Oliveira, S.; Martins, I.L.; Geraldo, V.; Miquita, D.; Ramos, S.L.M.; Lacerda, R.G.; Ladeira, L.O. High-yield synthesis of bundles of double- and triple-walled carbon nanotubes on aluminum flakes. Carbon 2018, 133, 53–61. [Google Scholar] [CrossRef]
- Gu, X.; Tang, Z.; Dong, J. On-Stream Modification of MFI Zeolite Membranes for Enhancing Hydrogen Separation at High Temperature. Microporous Mesoporous Mater. 2008, 111, 441–448. [Google Scholar] [CrossRef]
- Tang, Z.; Nenoff, T.M.; Dong, J. Internal Surface Modification of MFI-Type Zeolite Membranes for High Selectivity and High Flux for Hydrogen. Langmuir 2009, 25, 4848–4852. [Google Scholar] [CrossRef]
- Masuda, T.; Fukumoto, N.; Kitamura, M. Modification of pore size of MFI-type zeolite by catalytic cracking of silane and application to preparation of H2-separating zeolite membrane. Microporous Mesoporous Mater. 2001, 48, 239–245. [Google Scholar] [CrossRef]
- Palma, V.; Ruocco, C.; Cortese, M.; Martino, M. Recent Advances in Structured Catalysts Preparation and Use in Water-Gas Shift Reaction. Catalysts 2019, 9, 991. [Google Scholar] [CrossRef]
- Haber, J. Manual on Catalyst Characterization. Pure Appl. Chem. 1991, 63, 1227–1246. [Google Scholar] [CrossRef]


© 2020 by the authors. Licensee MDPI, Basel, Switzerland. This article is an open access article distributed under the terms and conditions of the Creative Commons Attribution (CC BY) license (http://creativecommons.org/licenses/by/4.0/).
Share and Cite
Sun, X.; Arvanitis, A.; Damma, D.; Alvarez, N.T.; Shanov, V.; Smirniotis, P.G.; Dong, J. Carbon Nanotube Formation on Cr-Doped Ferrite Catalyst during Water Gas Shift Membrane Reaction: Mechanistic Implications and Extended Studies on Dry Gas Conversions. Catalysts 2020, 10, 927. https://doi.org/10.3390/catal10080927
Sun X, Arvanitis A, Damma D, Alvarez NT, Shanov V, Smirniotis PG, Dong J. Carbon Nanotube Formation on Cr-Doped Ferrite Catalyst during Water Gas Shift Membrane Reaction: Mechanistic Implications and Extended Studies on Dry Gas Conversions. Catalysts. 2020; 10(8):927. https://doi.org/10.3390/catal10080927
Chicago/Turabian StyleSun, Xinhui, Antonios Arvanitis, Devaiah Damma, Noe T. Alvarez, Vesselin Shanov, Panagiotis G. Smirniotis, and Junhang Dong. 2020. "Carbon Nanotube Formation on Cr-Doped Ferrite Catalyst during Water Gas Shift Membrane Reaction: Mechanistic Implications and Extended Studies on Dry Gas Conversions" Catalysts 10, no. 8: 927. https://doi.org/10.3390/catal10080927
APA StyleSun, X., Arvanitis, A., Damma, D., Alvarez, N. T., Shanov, V., Smirniotis, P. G., & Dong, J. (2020). Carbon Nanotube Formation on Cr-Doped Ferrite Catalyst during Water Gas Shift Membrane Reaction: Mechanistic Implications and Extended Studies on Dry Gas Conversions. Catalysts, 10(8), 927. https://doi.org/10.3390/catal10080927