Article

Synthesis of Ce1−xPdxO2−δ Solid Solution in Molten Nitrate

1
Materials Science and Biotechnology, Graduate School of Science and Engineering, Ehime University, 3 Bunkyo-cho, Matsuyama, Ehime 790-8577, Japan
2
Technical Division, Faculty of Engineering, Ehime University, 3 Bunkyo-cho, Matsuyama, Ehime 790-8577, Japan
*
Author to whom correspondence should be addressed.
Catalysts 2020, 10(6), 640; https://doi.org/10.3390/catal10060640
Submission received: 16 May 2020 / Revised: 3 June 2020 / Accepted: 4 June 2020 / Published: 8 June 2020

Abstract

:
CeO2-based solid solutions in which Pd partially substitutes for Ce attract considerable attention, owing to their high catalytic performances. In this study, the solid solution (Ce1−xPdxO2−δ) with a high Pd content (x ~ 0.2) was synthesized through co-precipitation under oxidative conditions using molten nitrate, and its structure and thermal decomposition were examined. The characteristics of the solid solution, such as the change in a lattice constant, inhibition of sintering, and ionic states, were examined using X-ray diffraction (XRD), scanning electron microscopy–energy-dispersive X-ray spectroscopy (SEM−EDS), transmission electron microscopy (TEM)−EDS, and X-ray photoelectron spectroscopy (XPS). The synthesis method proposed in this study appears suitable for the easy preparation of CeO2 solid solutions with a high Pd content.

1. Introduction

Platinum group metals (PGMs) supported on oxides are widely used as catalysts. Among these systems, Pd particles supported on ceria (CeO2) are used for the oxidation of carbon monoxide and hydrocarbons such as methane [1,2,3,4,5,6,7,8,9,10,11,12,13,14,15,16,17]. However, catalysts with a better performance are needed for environmental protection. In addition, it is important to reduce the use of Pd, because of its limited availability. Therefore, catalysts with better performance are being developed with a focus on their microscopic structures, active sites, and thermal stability. Acting as a promoter, CeO2 not only facilitates the catalytic reactions through the storage and release of oxygen, but also prevents Pd particles from sintering. In addition, the chemical interaction between Pd and CeO2 has attracted much attention in recent years; thus, current studies are focusing not only on Pd particles on CeO2, but also on solid solutions in which Pd ions partially substitute for Ce4+ in CeO2 [1].
Pd-doped CeO2 can be obtained through various routes, as reviewed in Ref. [1]. The most common method is impregnation, in which Pd is dispersed on a porous oxide support [2,3,4]. In the case of the synthesis of solid solutions, combustion processes [4,5,6,7,8,9] and co-precipitation in aqueous solution [10,11,12] were found to be effective. Water-in-oil microemulsion [13,14], sonochemical synthesis [15], plasma arc [16] and ultrasonic spray pyrolysis [17] methods were employed in special cases.
In a previous study [18], we applied the synthesis method of Adams’ catalyst (platinum oxide, PtO2) [19,20] to obtain powders consisting of a PtO2−CeO2 solid solution. Because this method enables the co-precipitation of oxide particles at a moderately high temperature under oxidative conditions in molten nitrate, it successfully produced a homogeneous oxide with high Pt content. In addition, it was found that the thermal decomposition of the PtO2−CeO2 solid solution generated Pt3O4 particles, which were not formed by the decomposition of bare PtO2. In this study, the co-precipitation approach was applied to the synthesis of PdO−CeO2 powders to obtain a solid solution (Ce1−xPdxO2−δ) with a high Pd content. The structure and thermal decomposition of the solid solution were examined and compared with those of bare PdO and CeO2 prepared in the same manner.

2. Results and Discussion

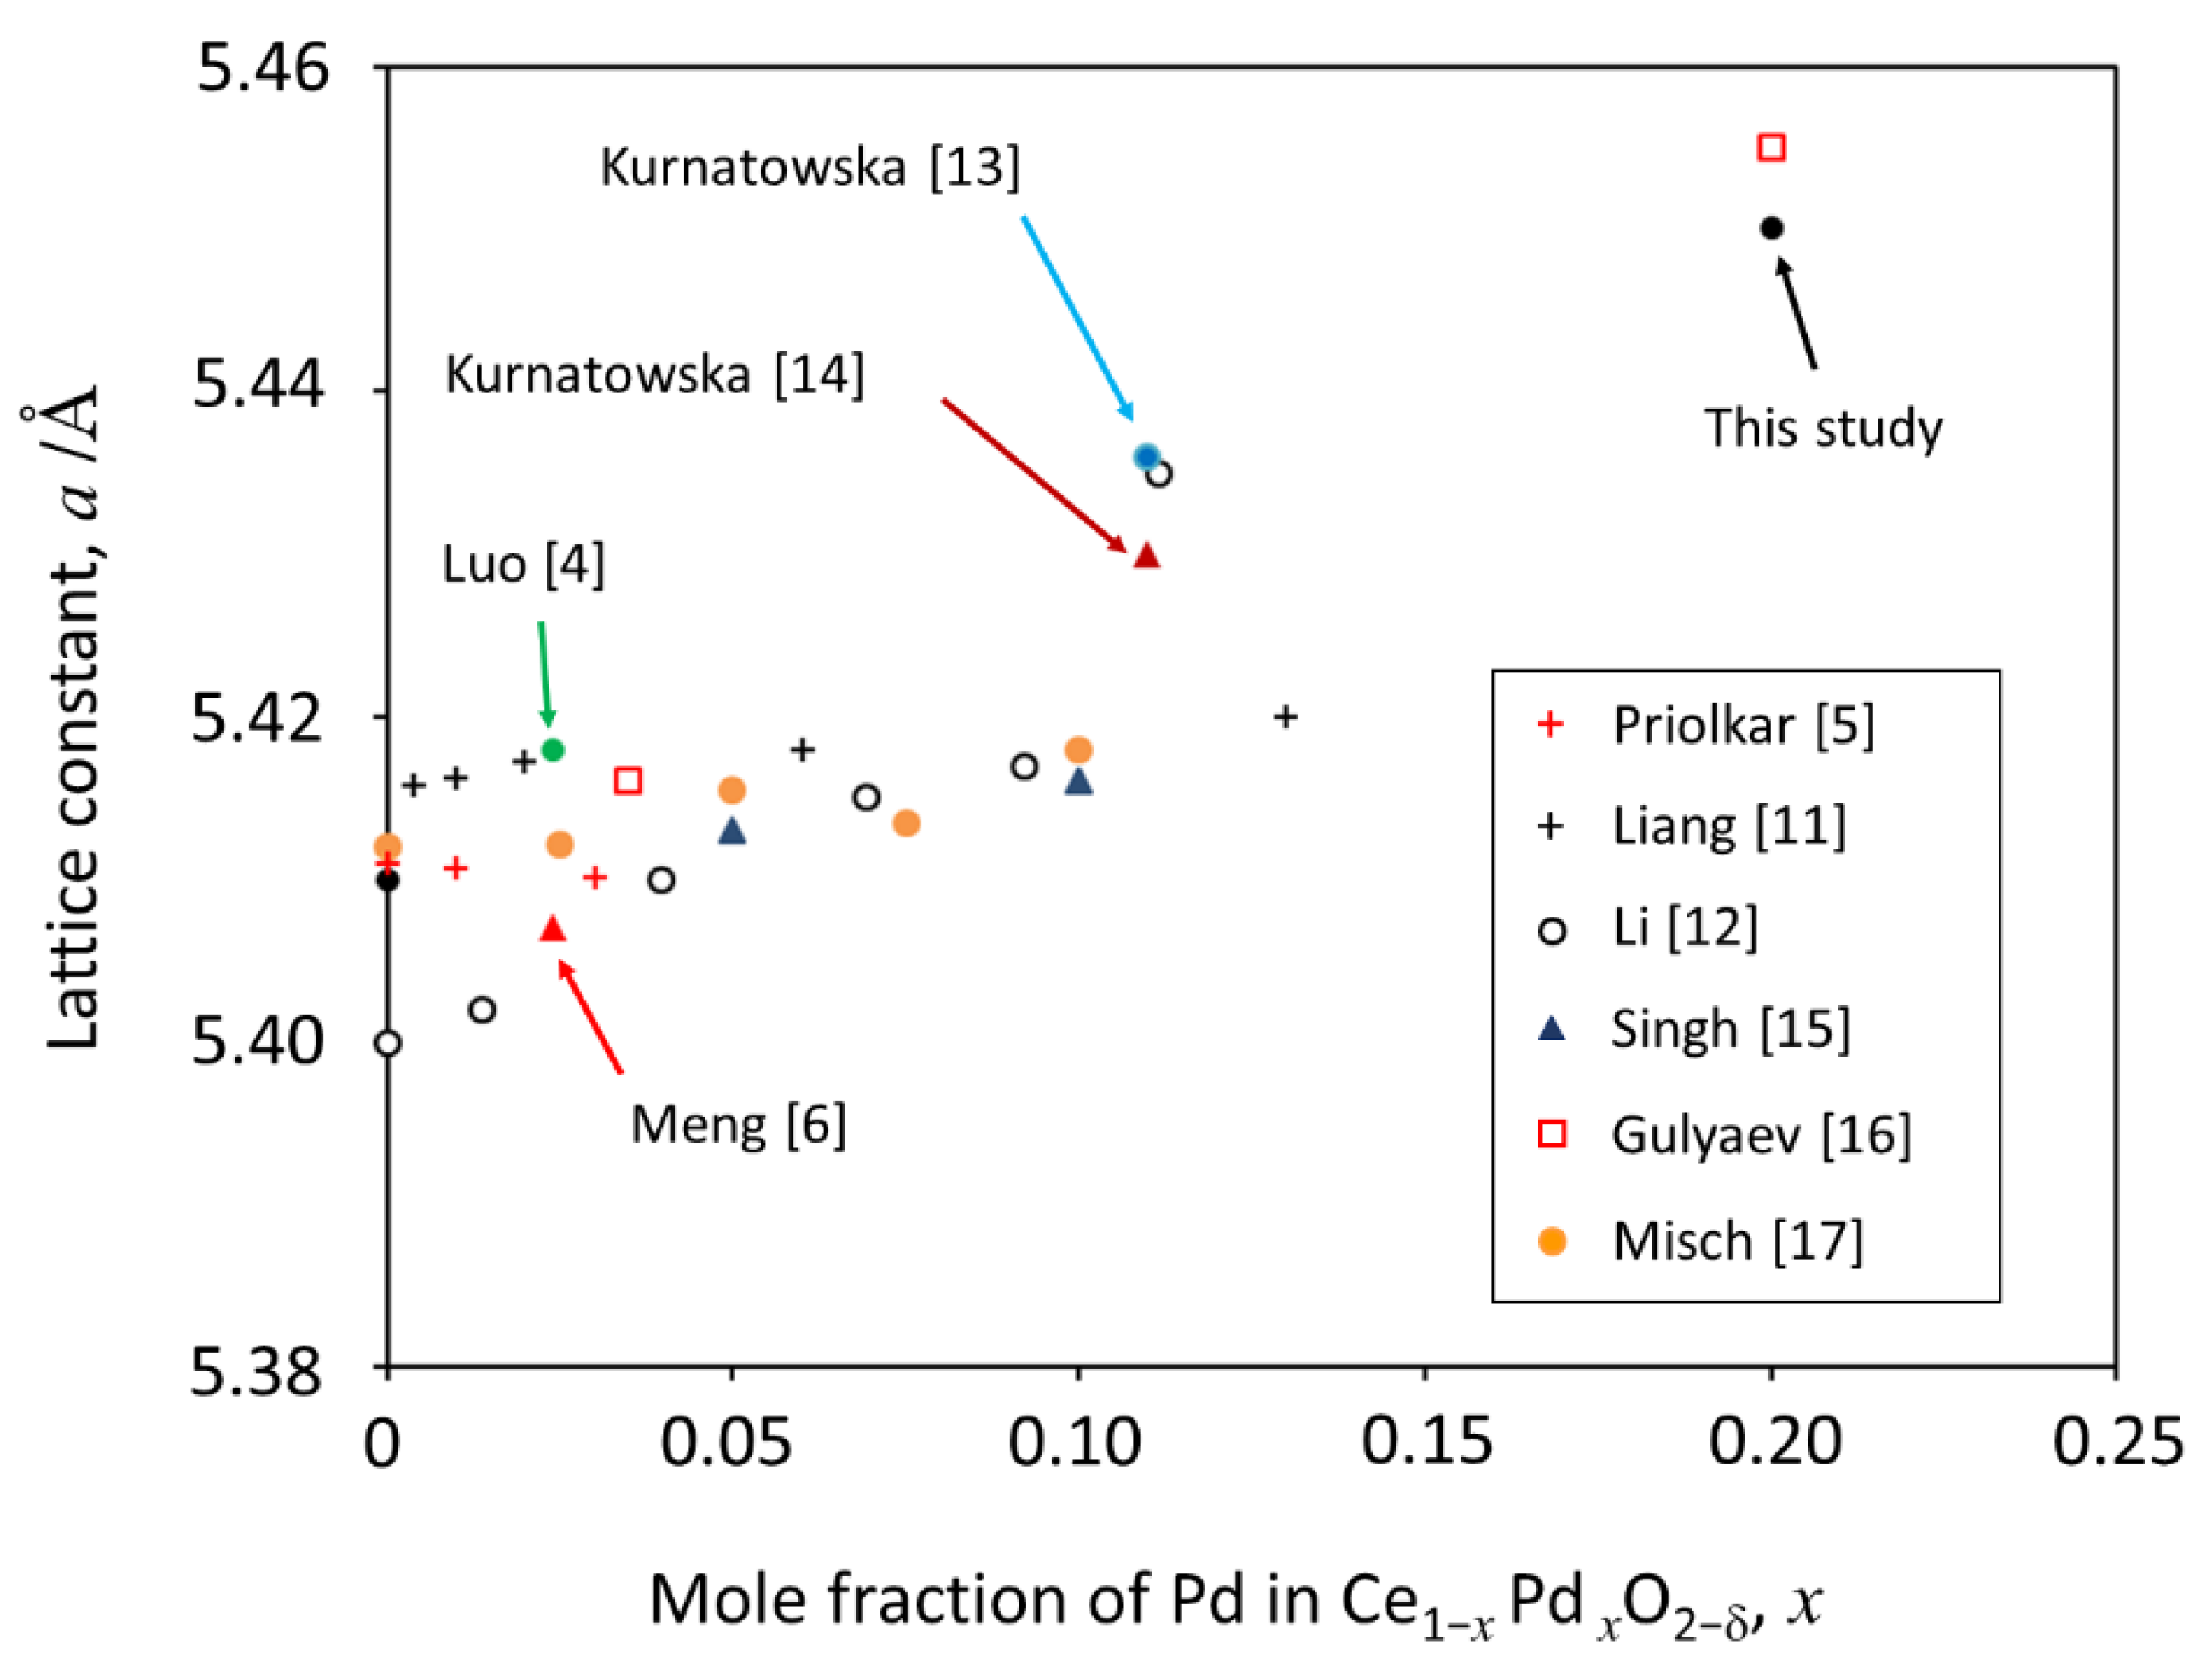
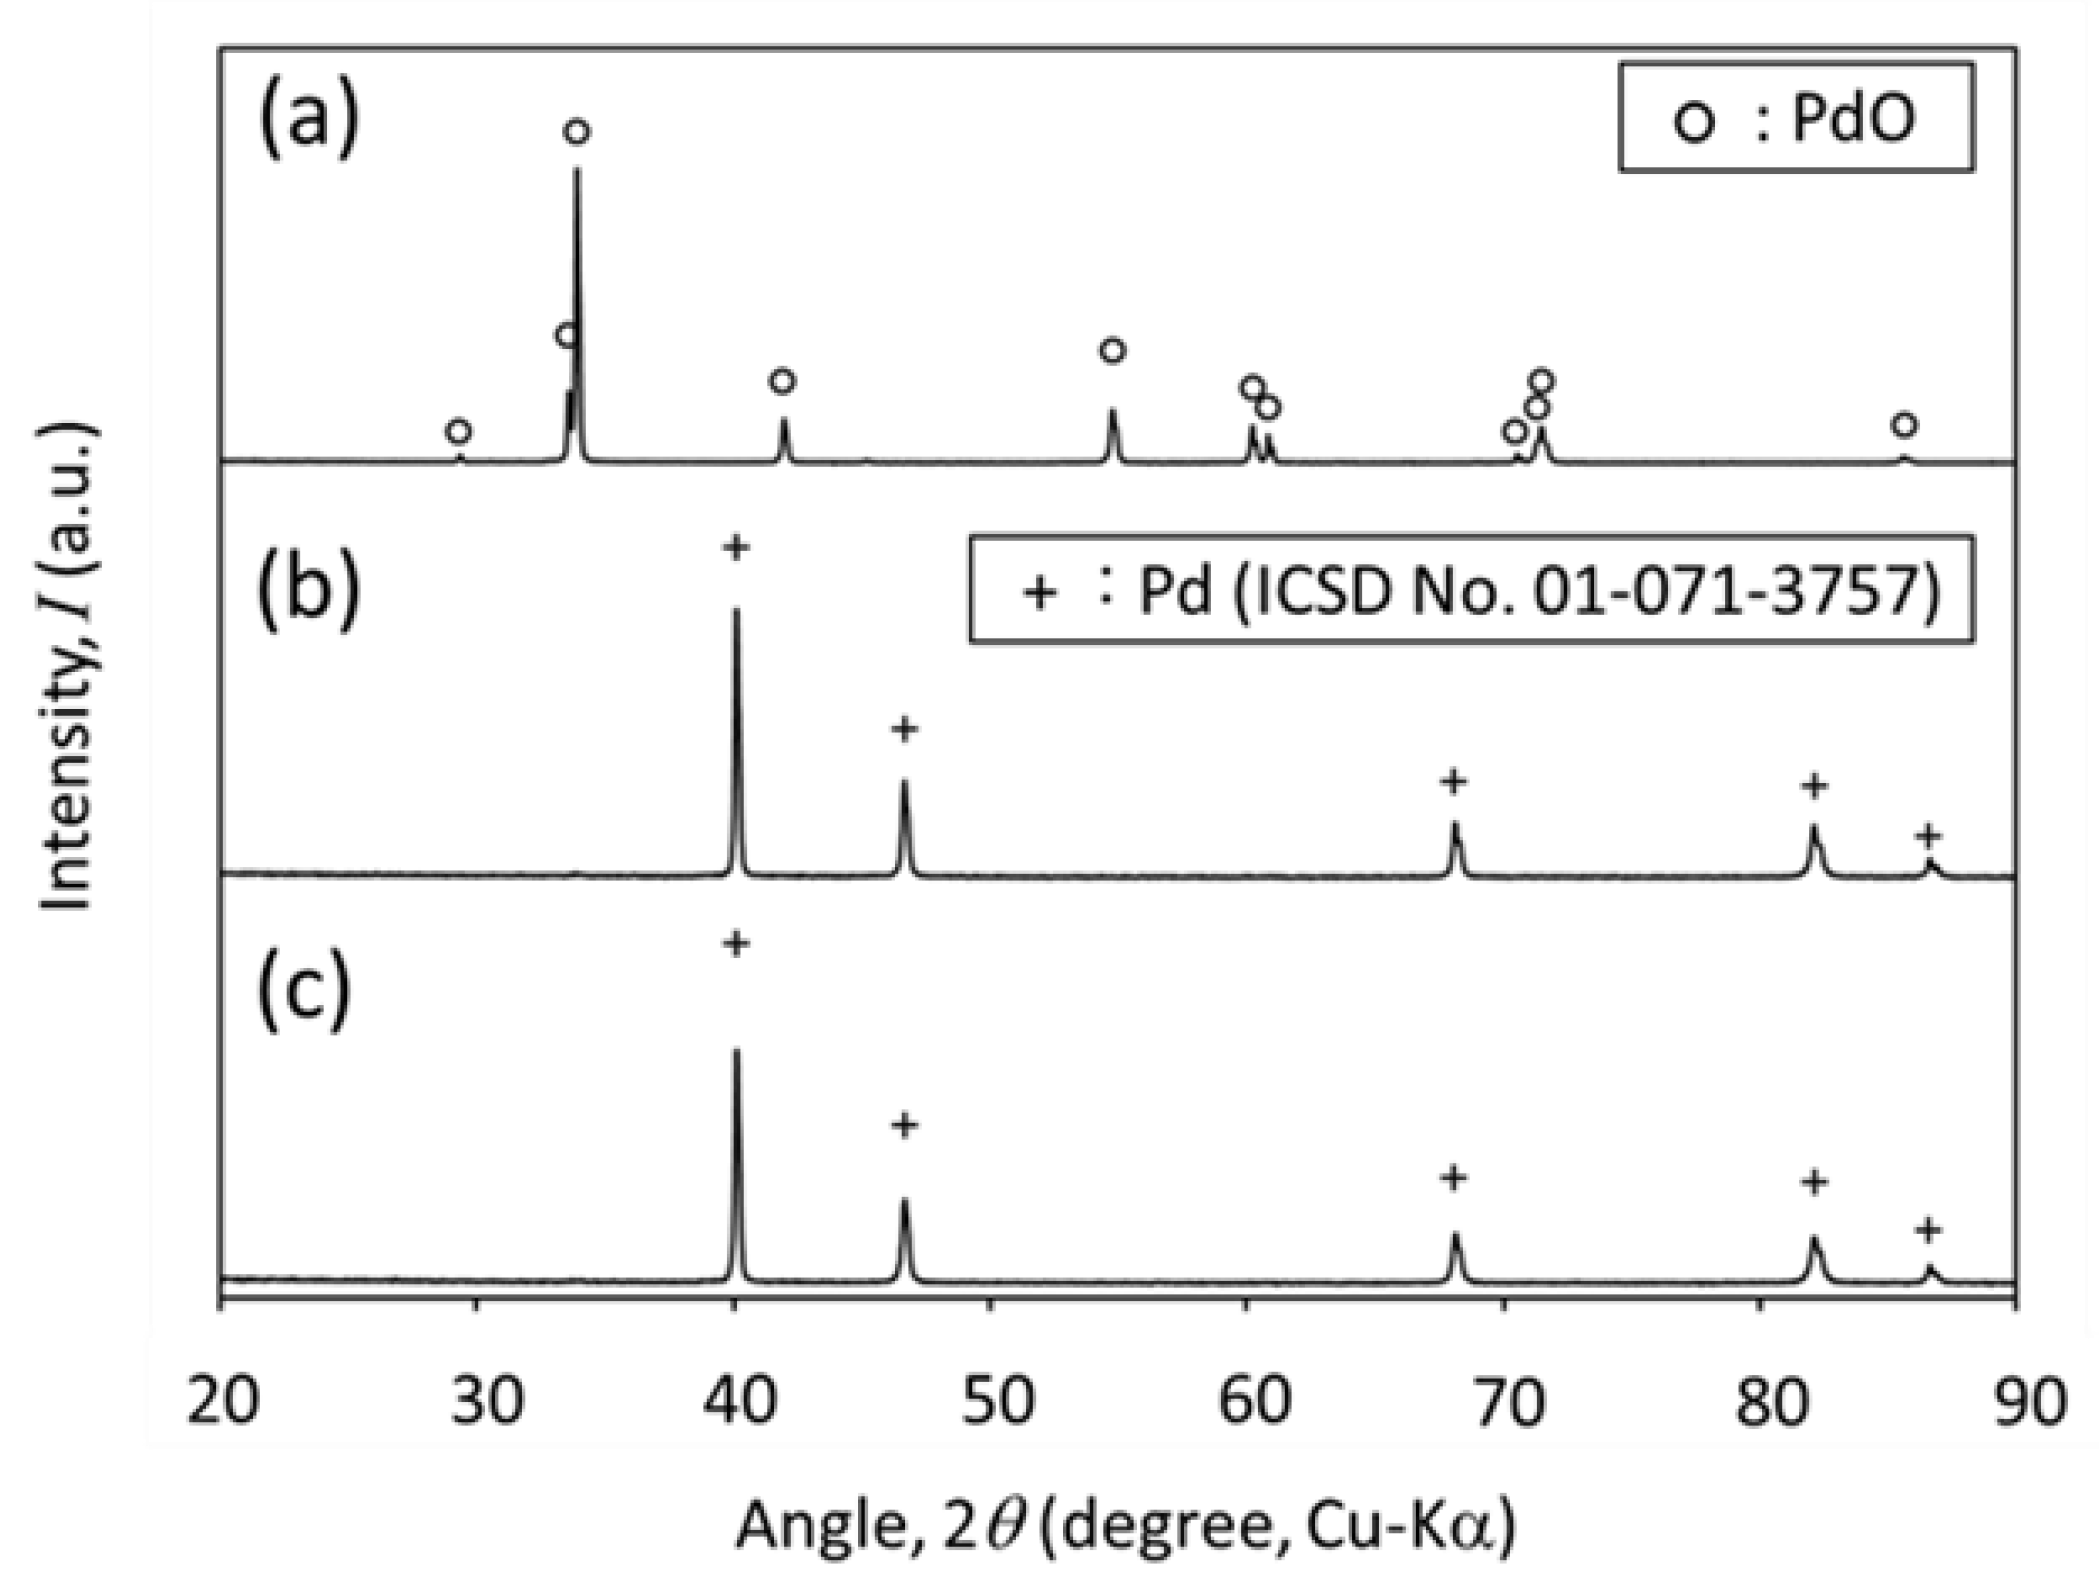
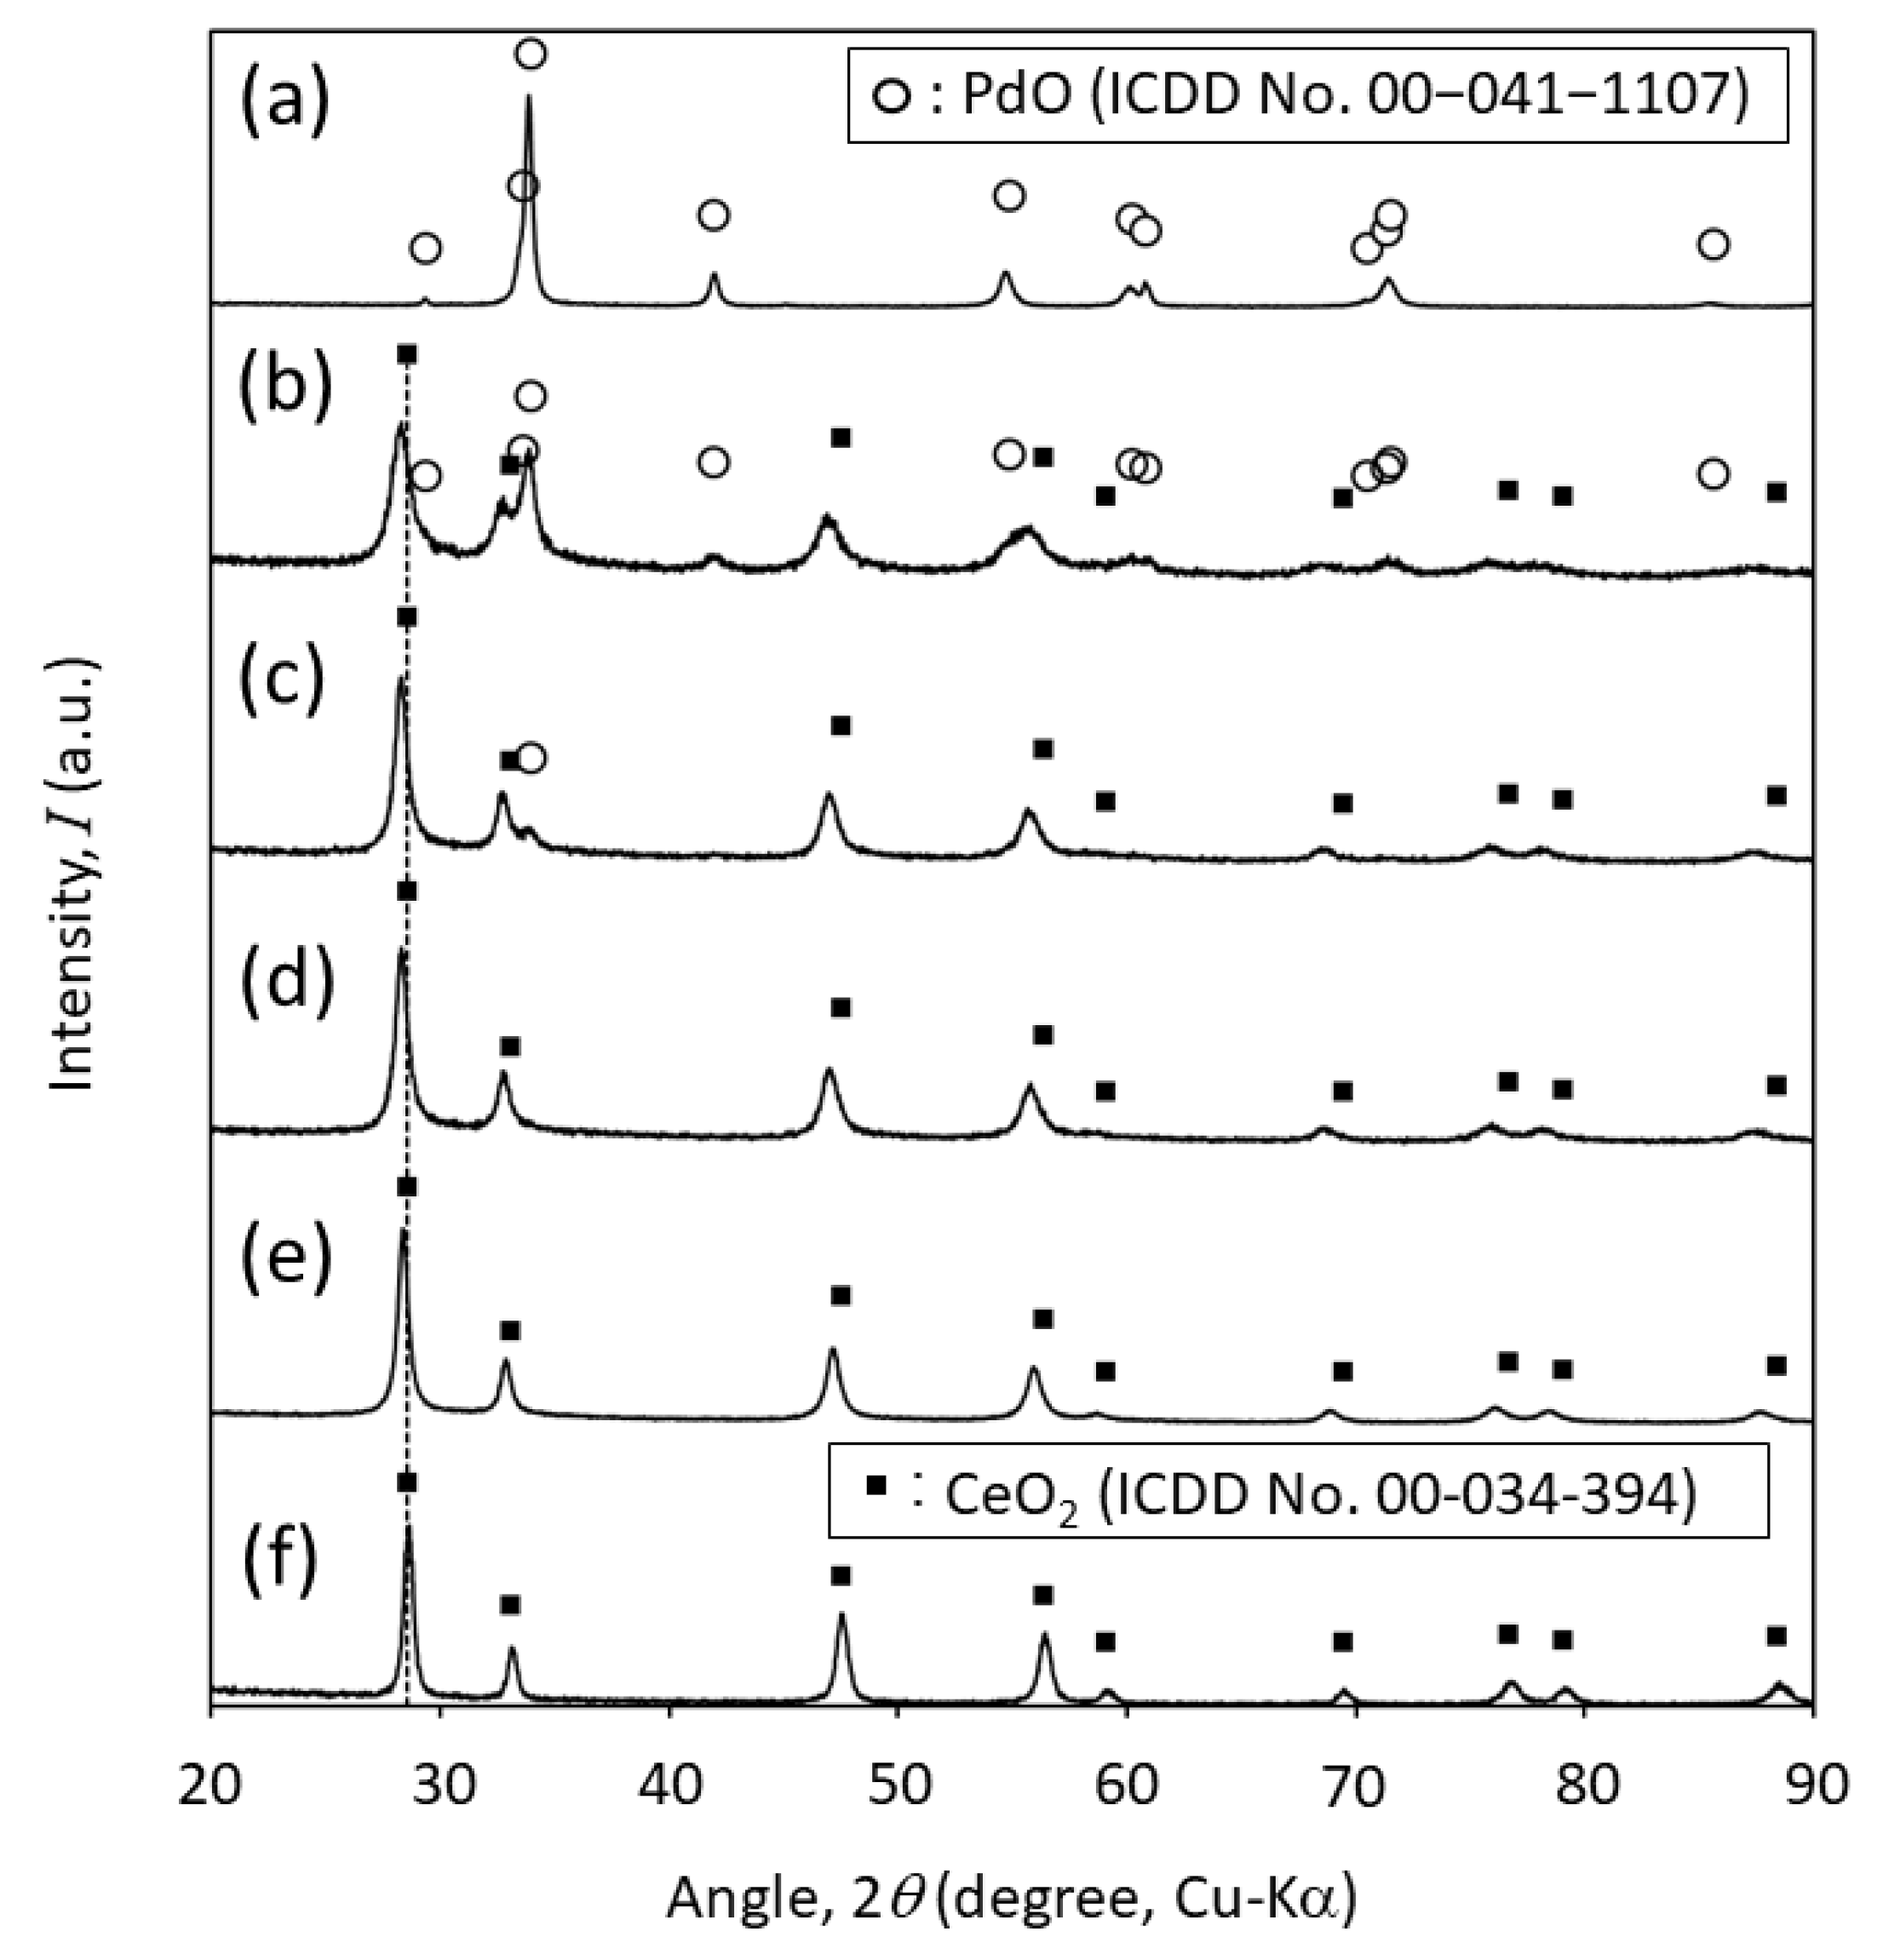
2.1. Crystal Structures of PdO−CeO2 Powders

The molar ratios of Ce to Pd in the PdO−CeO2 powders prepared in this study were 1, 2, 3, and 4. The PdO−CeO2 powder with a Ce/Pd molar ratio of y is hereafter referred to as PdCey. The X-ray diffraction (XRD) patterns of the prepared PdO and PdO−CeO2 powders are shown in Figure 1a–e. For comparison, the XRD pattern of a CeO2 sample synthesized by the same method is shown in Figure 1f. Figure 1a confirms that the synthesized PdO has a tetragonal structure (ICDD No. 00-041-1107). The XRD patterns of PdCe1 and PdCe2 in Figure 1b,c show peaks corresponding to both PdO and CeO2. On the other hand, as shown in Figure 1d,e, the patterns of PdCe3 and PdCe4 do not display peaks related to PdO, and thus only the fluorite structure of CeO2 can be detected. The disappearance of PdO phase indicates that almost entire Pd in PdCe3 and PdCe4 is incorporated into CeO2 phase. The peaks of the CeO2 in these PdO−CeO2 powders are located at lower angles compared to those of CeO2 reported in the literature (a = 5.411 Å, ICDD No. 00-034-394) and of the prepared CeO2, as shown in Figure 1f. The peak shift reflects the lattice expansion of the CeO2-based fluorite structure, due to the formation of a Pd-substituted CeO2 solid solution (Ce1−xPdxO2−δ). Using Bragg’s law, the lattice constant of PdCe4 can be estimated to be 5.450 Å.
The structure of Ce1−xPdxO2−δ has been examined in several studies. For example, Gulyaev et al. reported the lattice constant of a solid solution obtained by the oxidation of a Pd−Ce−C composite prepared by the plasma arc method [16]. To compare the result of this study with those available in the literature [4,5,6,11,12,13,14,15,16,17], the reported lattice constants are plotted against the composition in Figure 2. The mole fraction of Pd in PdCe4 is 0.2, which is higher than that reported in most previous studies. Figure 2 shows a positive correlation between the mole fraction of Pd and the lattice constant of Ce1−xPdxO2−δ.
A substitution of Pt for Ce in CeO2 results in a decrease in its lattice constant, as confirmed in a previous study [18]. This can be explained in terms of ionic radii, because Pt2+ and Pt4+ (0.80 and 0.63 Å, respectively [21]) are smaller than Ce4+ (0.97 Å [21]). On the other hand, the increase in lattice constant upon substituting Pd for Ce cannot be explained by the difference in their ionic radii, because Pd2+ and Pd4+ (0.86 and 0.62 Å, respectively [21]) are smaller than Ce4+, similar to Pt. Therefore, the increase in lattice constant might be explained in several different ways. First, the substitution of Pd2+ for Ce4+ gives rise to an oxygen vacancy accompanied by a Ce3+ ion; thus, the increase in lattice constant can be attributed to the larger ionic radius of Ce3+ (1.14 Å [21]) than that of Ce4+ [15]. In addition, the removal of oxygen caused by the substitution of Pd2+ for Ce4+ might enhance the cation−cation repulsion [17]. On the other hand, some previous studies [13,14,17] ascribed the change in lattice constant to the small particle size, because the lattice constant of CeO2 increases to more than 5.6 Å in the nanoparticle form [22,23]. Gulyaev et al., who proposed that CeO2 can contain water molecules in the vicinity of Pd substituting for Ce, also explained the expansion of the lattice in terms of the sizes of the particles [24]. In the case of the present study, it can be assumed that the grain size of the Ce1−xPdxO2−δ solid solution is similar to that of CeO2 prepared by the same method; hence, the increase in lattice constant is likely to be caused not by the grain size, but by the substitution of Pd for Ce.

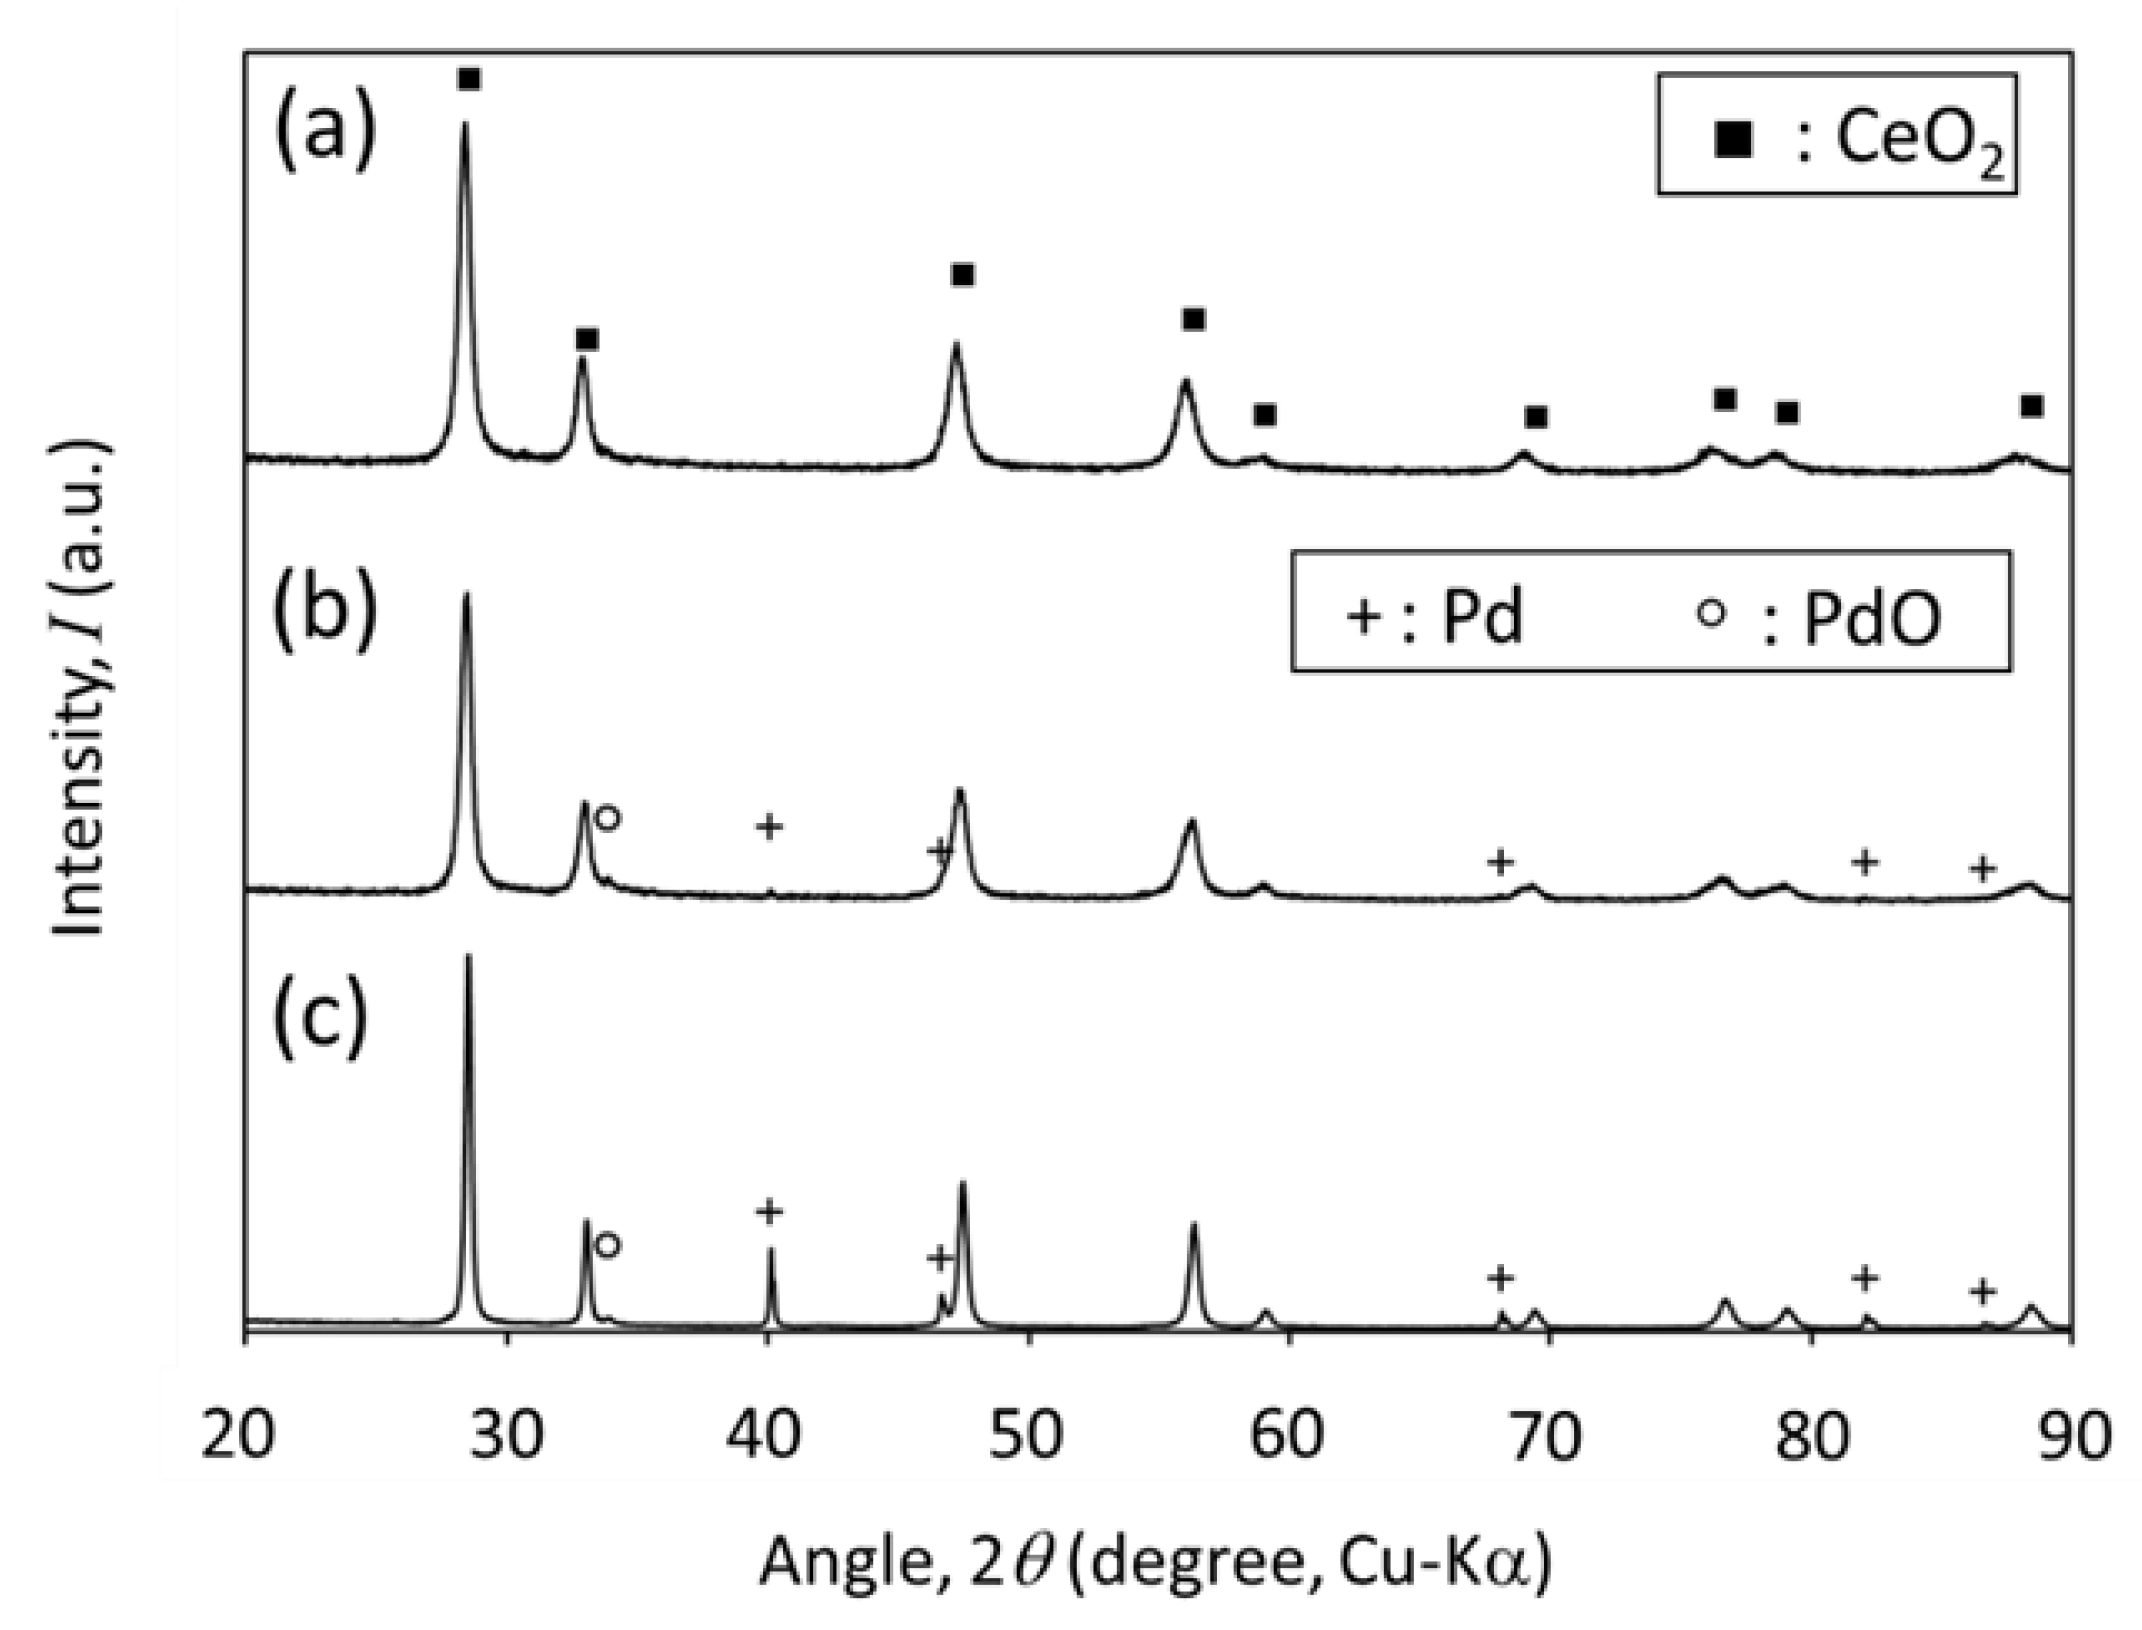
2.2. Thermal Decomposition of PdO−CeO2

The decomposition temperature of bare PdO to Pd in air was reported to be 800 °C [25]. In the case of the PdO−CeO2 solid solution, the formation of Pd by thermal decomposition started at 825 °C in Ref. [13]. The XRD patterns of PdO after heating are shown in Figure 3. Figure 3a shows that heating at 800 °C for 2 h does not lead to the decomposition of PdO, and the crystallinity of this phase is improved compared with that before heating (Figure 1a). Heating at 850 and 900 °C results in the decomposition of PdO and formation of metallic Pd (ICSD No. 01-071-3757), as shown in Figure 3b,c, respectively. Figure 4 shows the XRD patterns of PdCe4 after heating. Heating at 800 °C for 2 h does not induce changes in the XRD pattern, as shown by Figure 4a. Heating at 850 °C generates small peaks that denote the formation of metallic Pd (Figure 4b). This shows that the thermal decomposition of PdO is hindered by the formation of a solid solution with CeO2, as reported in a previous study [13]. The XRD pattern obtained after heating at 900 °C (Figure 4c) shows the peaks of the Pd phase more clearly. A small peak at 33.9°, which is visible in Figure 4b,c but not clear in Figure 4a, might be attributed to the PdO formed by oxidation of Pd during cooling.

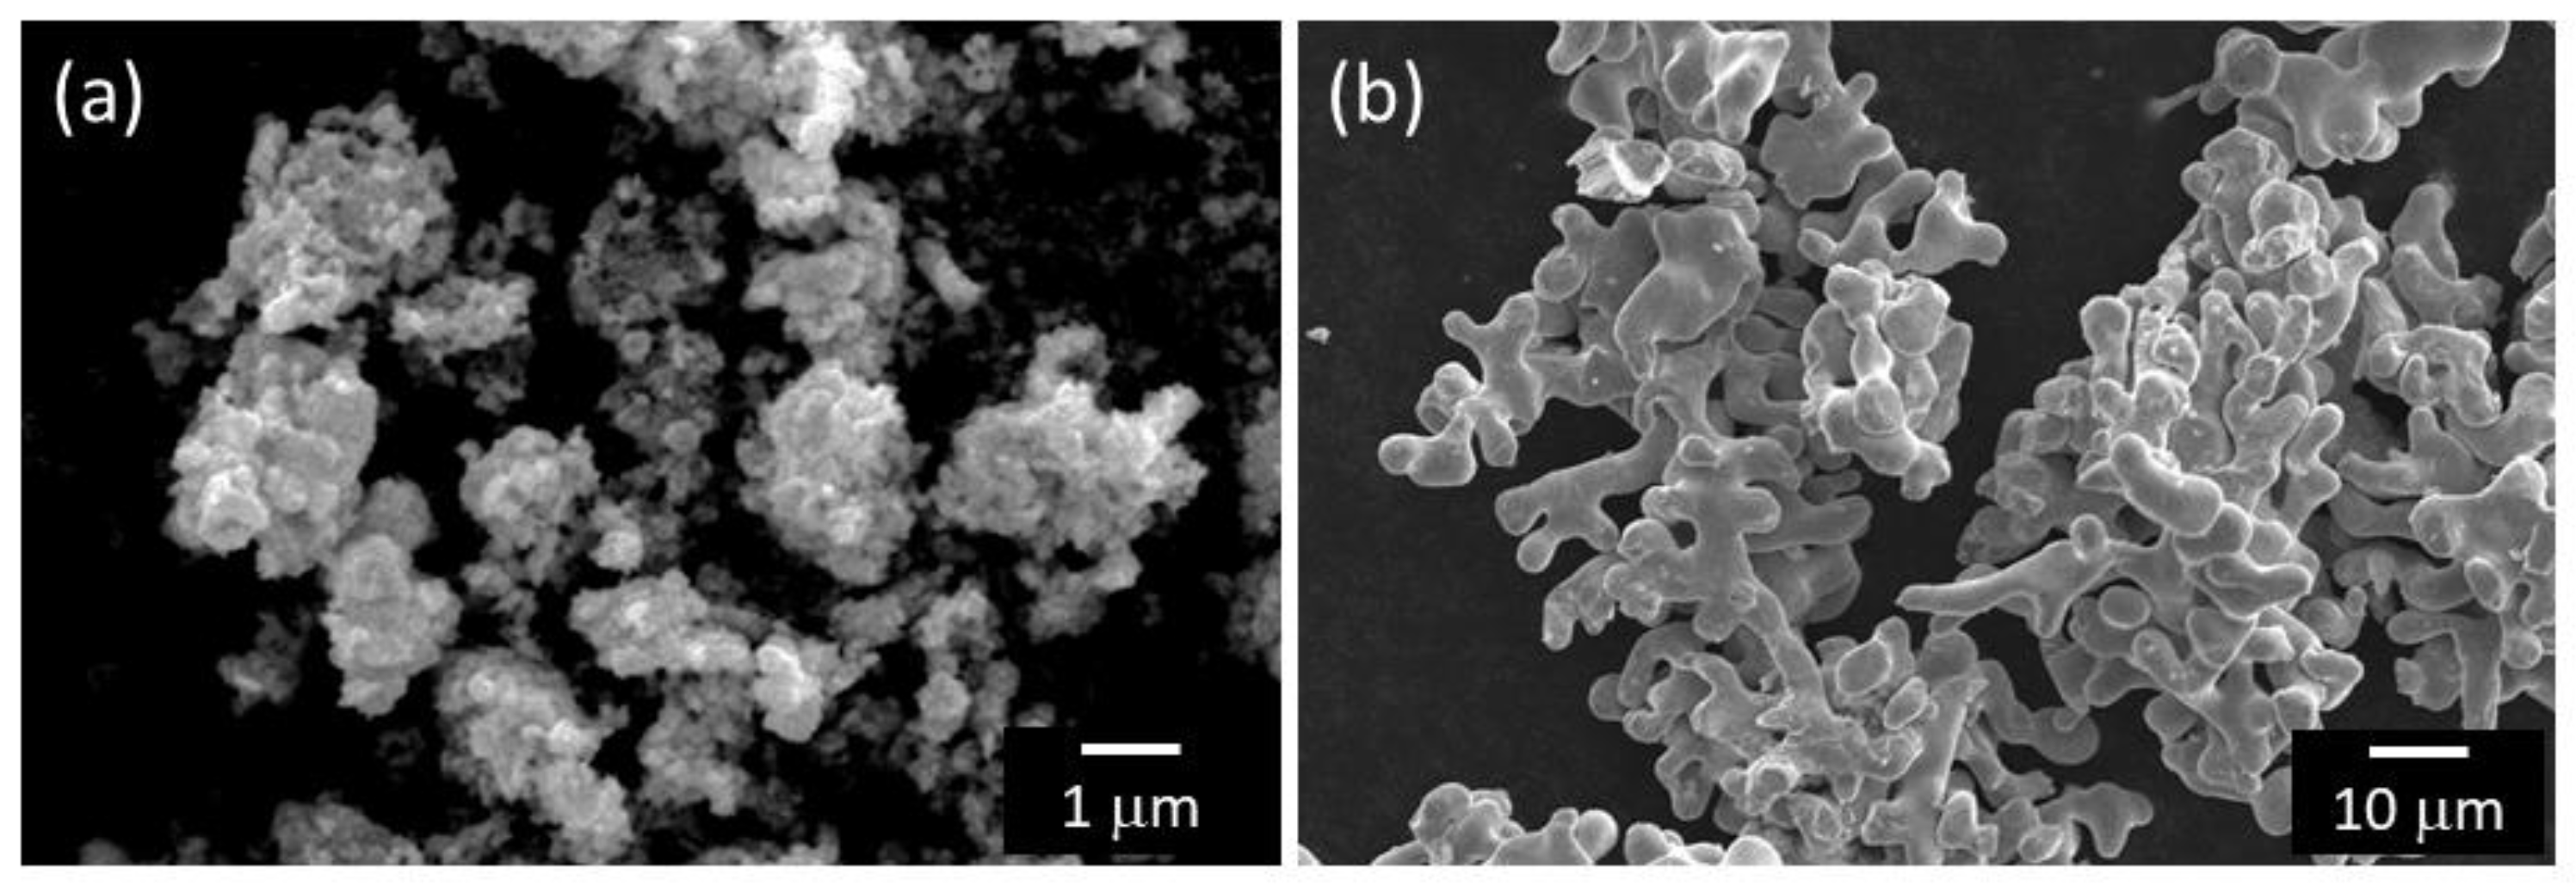
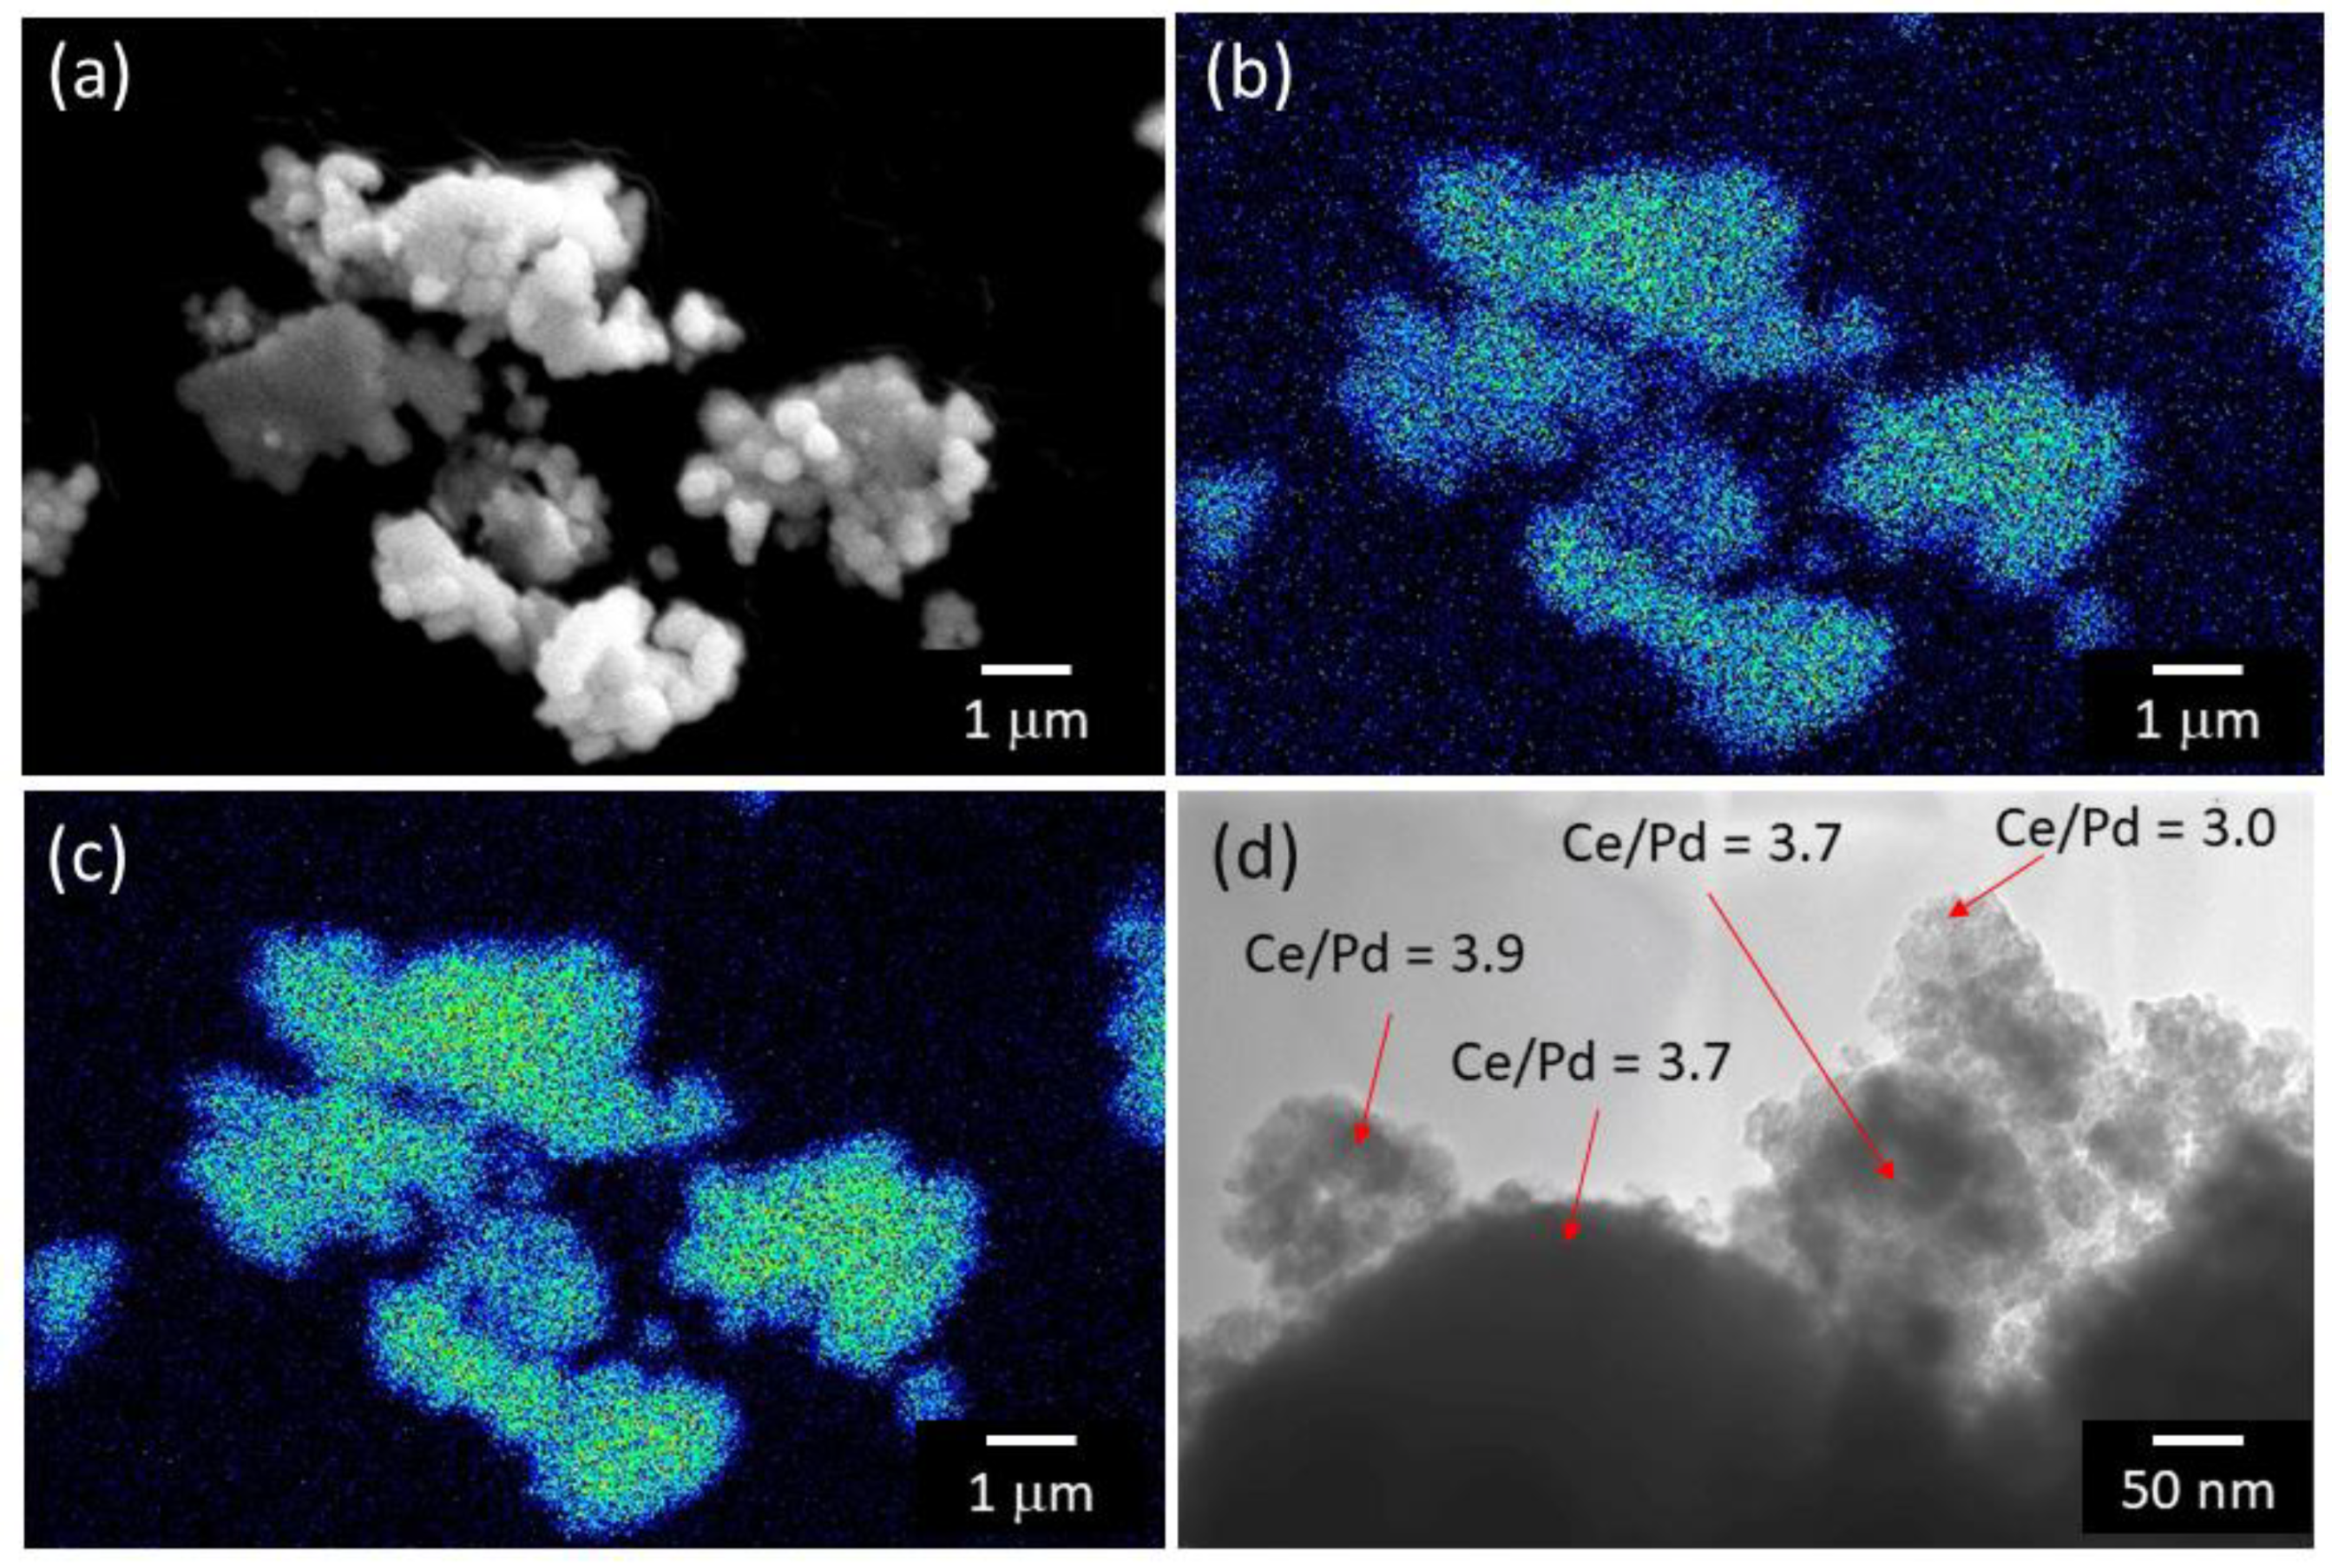
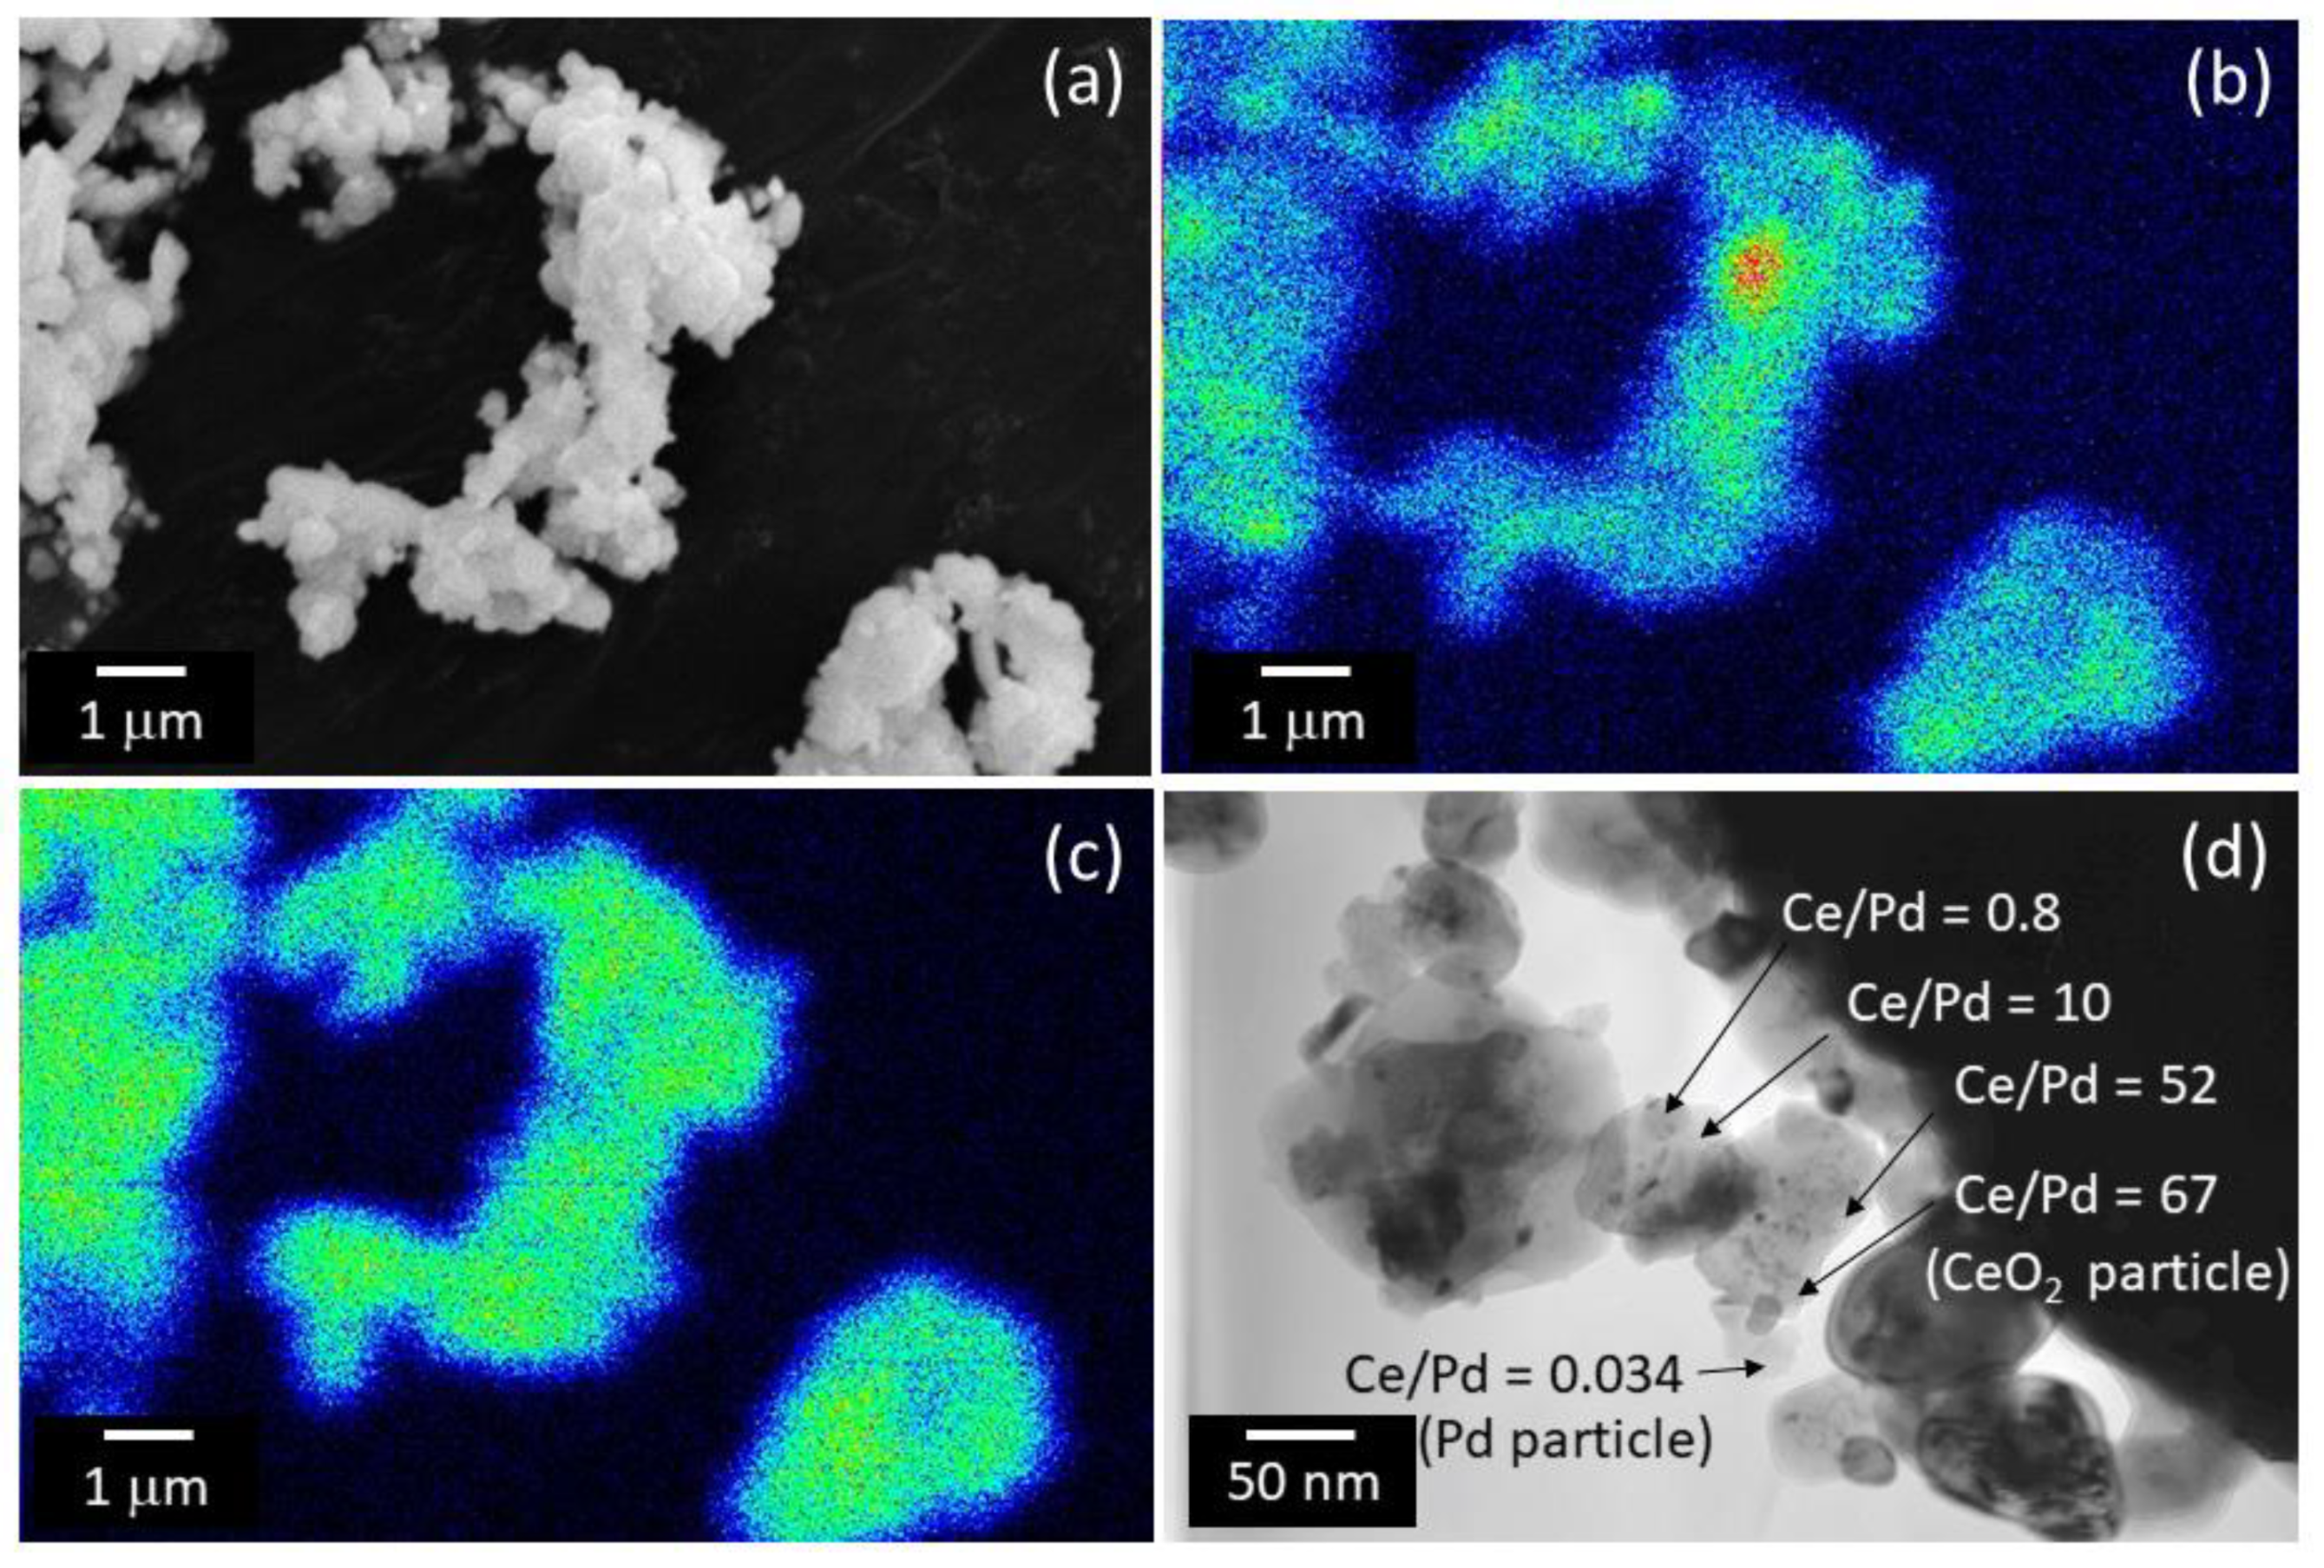
2.3. Microscopic Observation

Figure 5a shows a scanning electron microscopy (SEM) image of the PdO powder, which appears as an aggregate of particles smaller than 1 μm. Figure 5b displays the SEM image of the powder obtained by heating PdO at 900 °C for 2 h, which consists of sintered micrometre-sized Pd particles.
Figure 6a shows a SEM image of the prepared PdCe4 sample, which is an aggregate of particles smaller than 1 μm. As shown by the elemental mapping in Figure 6b,c, obtained by energy-dispersive X-ray spectroscopy (EDS), these particles include both Pd and Ce. A transmission electron microscopy (TEM) image with higher magnification is shown in Figure 6d, with the Ce/Pd atomic ratios obtained by EDS. The ratios of Ce to Pd are close to the expected value (i.e., 4), although some nonuniformity is present.
Figure 7a shows a SEM image of the PdCe4 sample after heating at 900 °C for 2 h, while Figure 7b,c show the elemental distributions of Pd and Ce, respectively. Although the XRD data confirmed that the heat treatment leads to the formation of a metallic Pd phase, the Pd particles formed on CeO2 are not visible in the magnified SEM image. The results of TEM observation and EDS analysis are shown in Figure 7d. Although it is difficult to distinguish Pd particles from CeO2 in the image, the EDS analysis confirms the existence of Ce- and Pd-rich particles. The particles have sizes of several tens of nanometres, and are thus much smaller than the Pd particles obtained upon heating PdO, shown in Figure 5b. Therefore, CeO2 hinders the sintering of Pd particles at high temperature, as reported in a previous study [26].

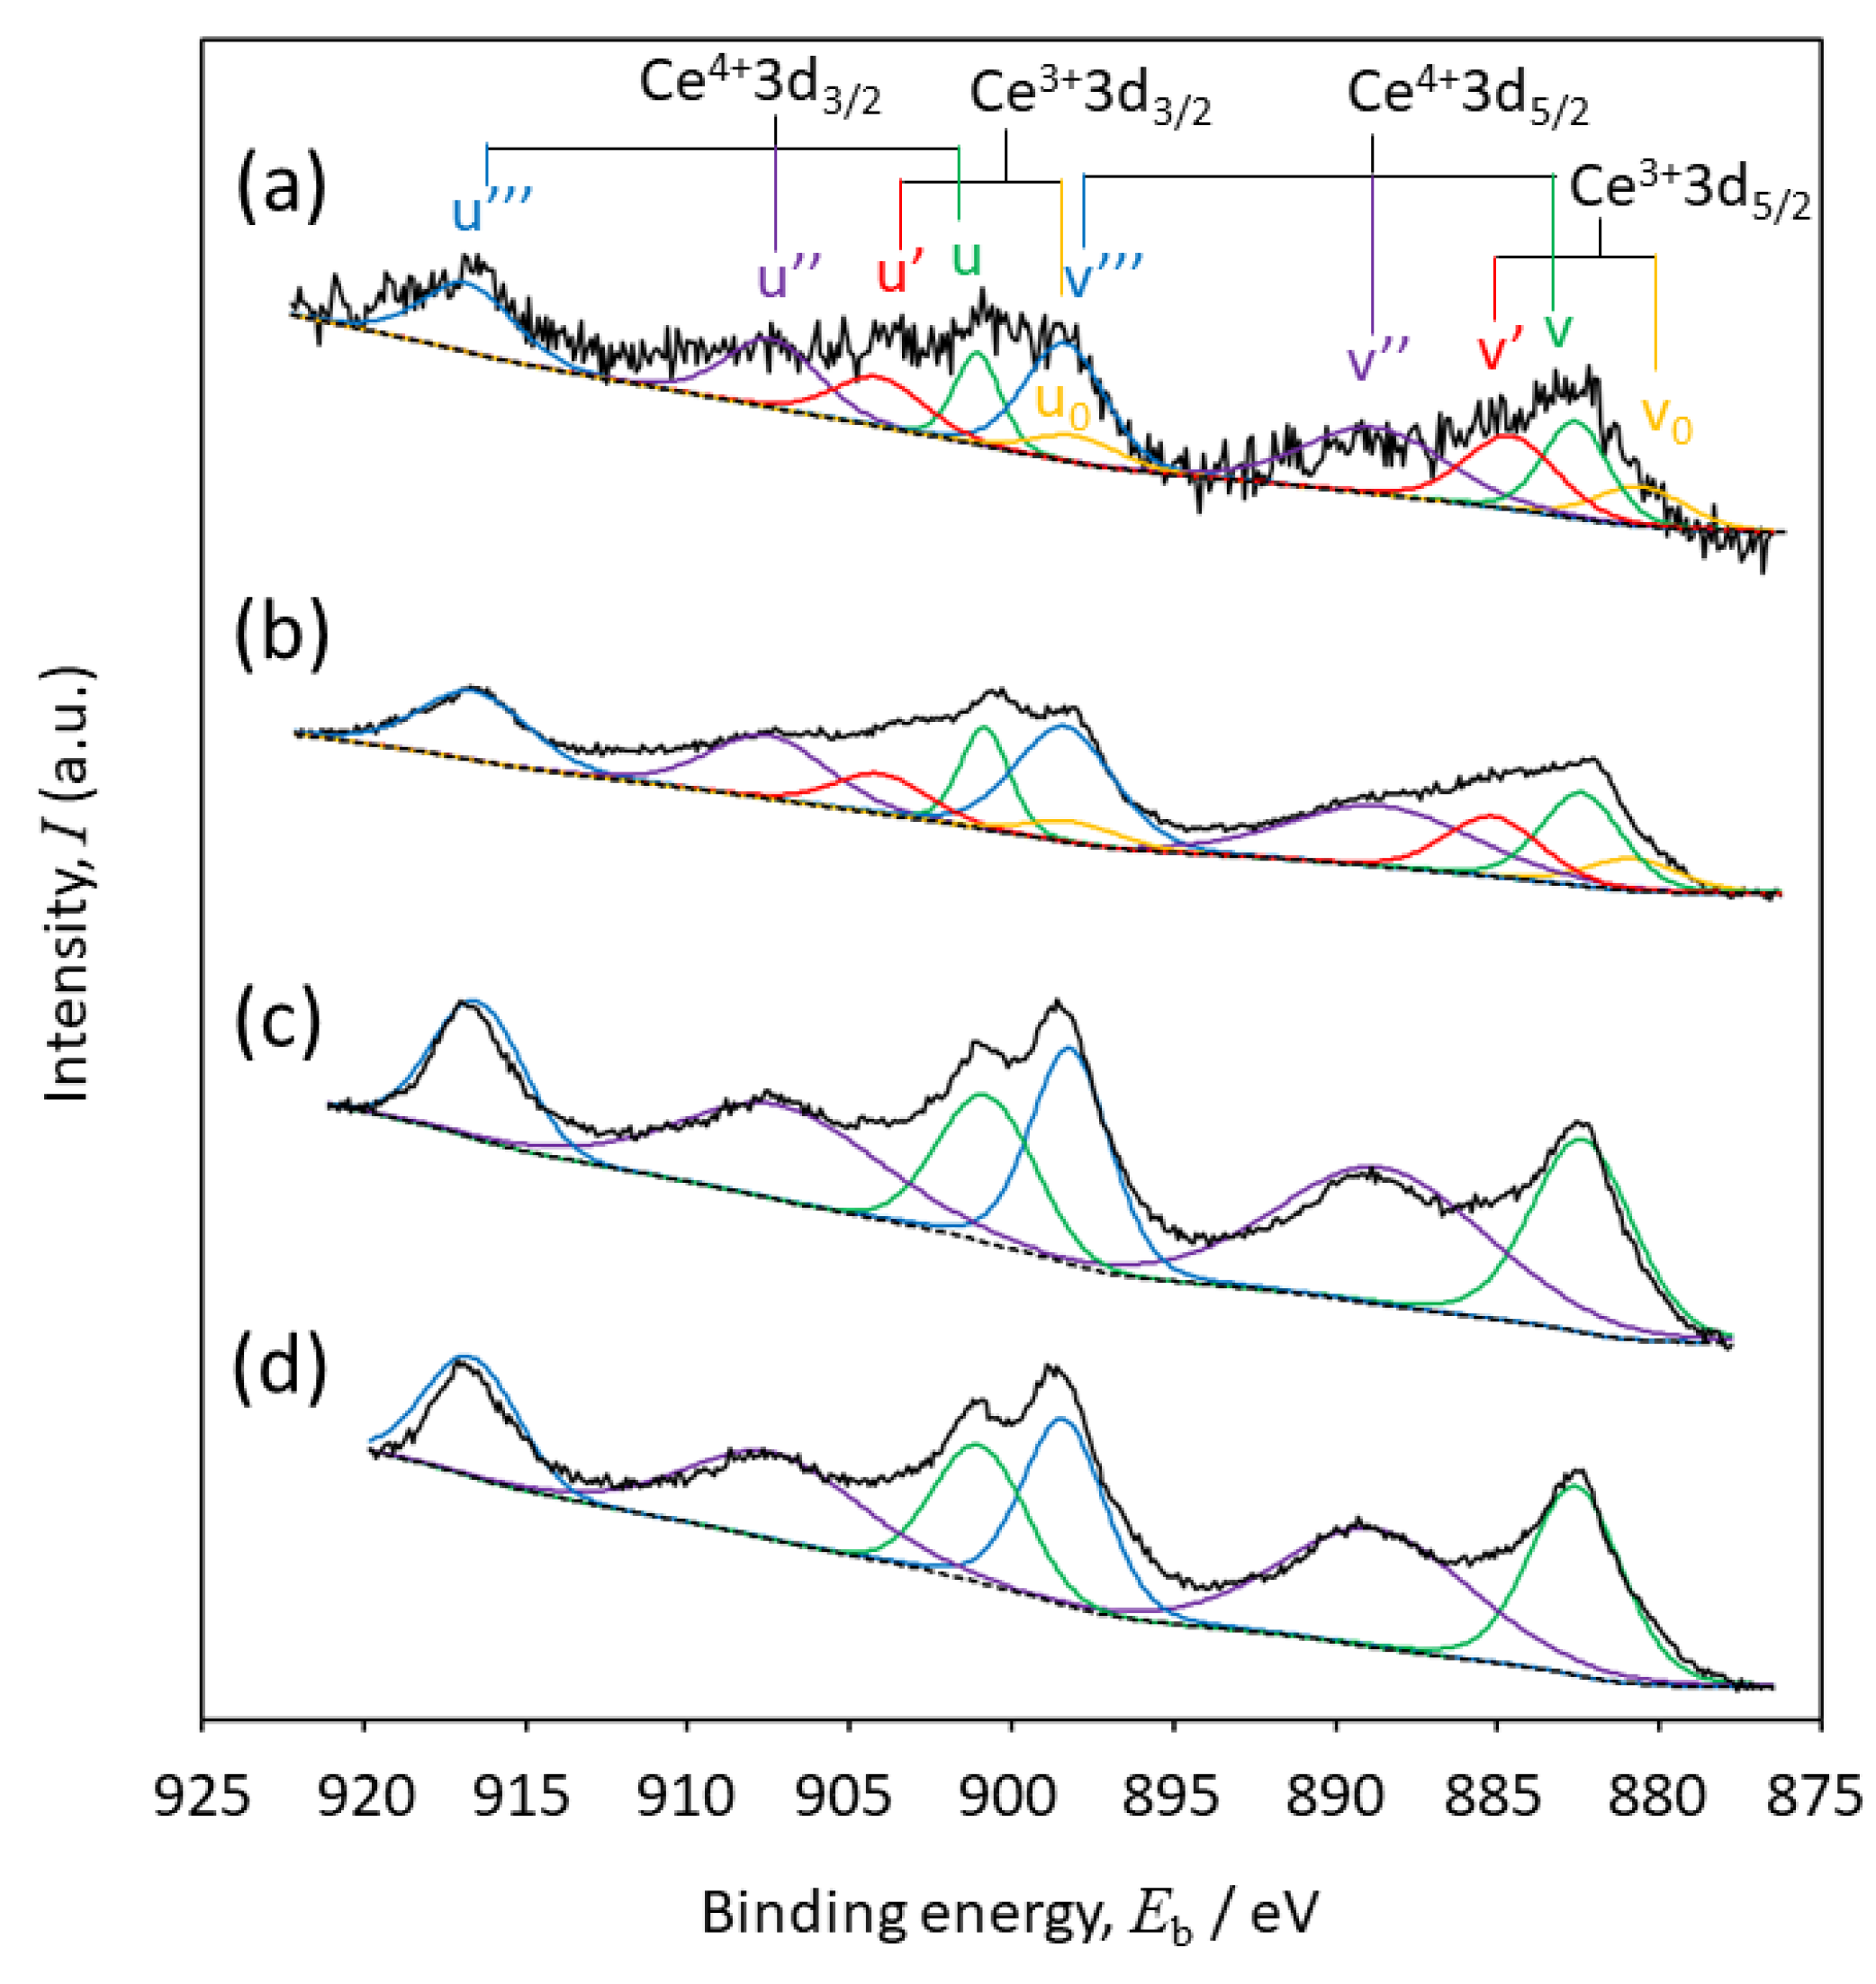
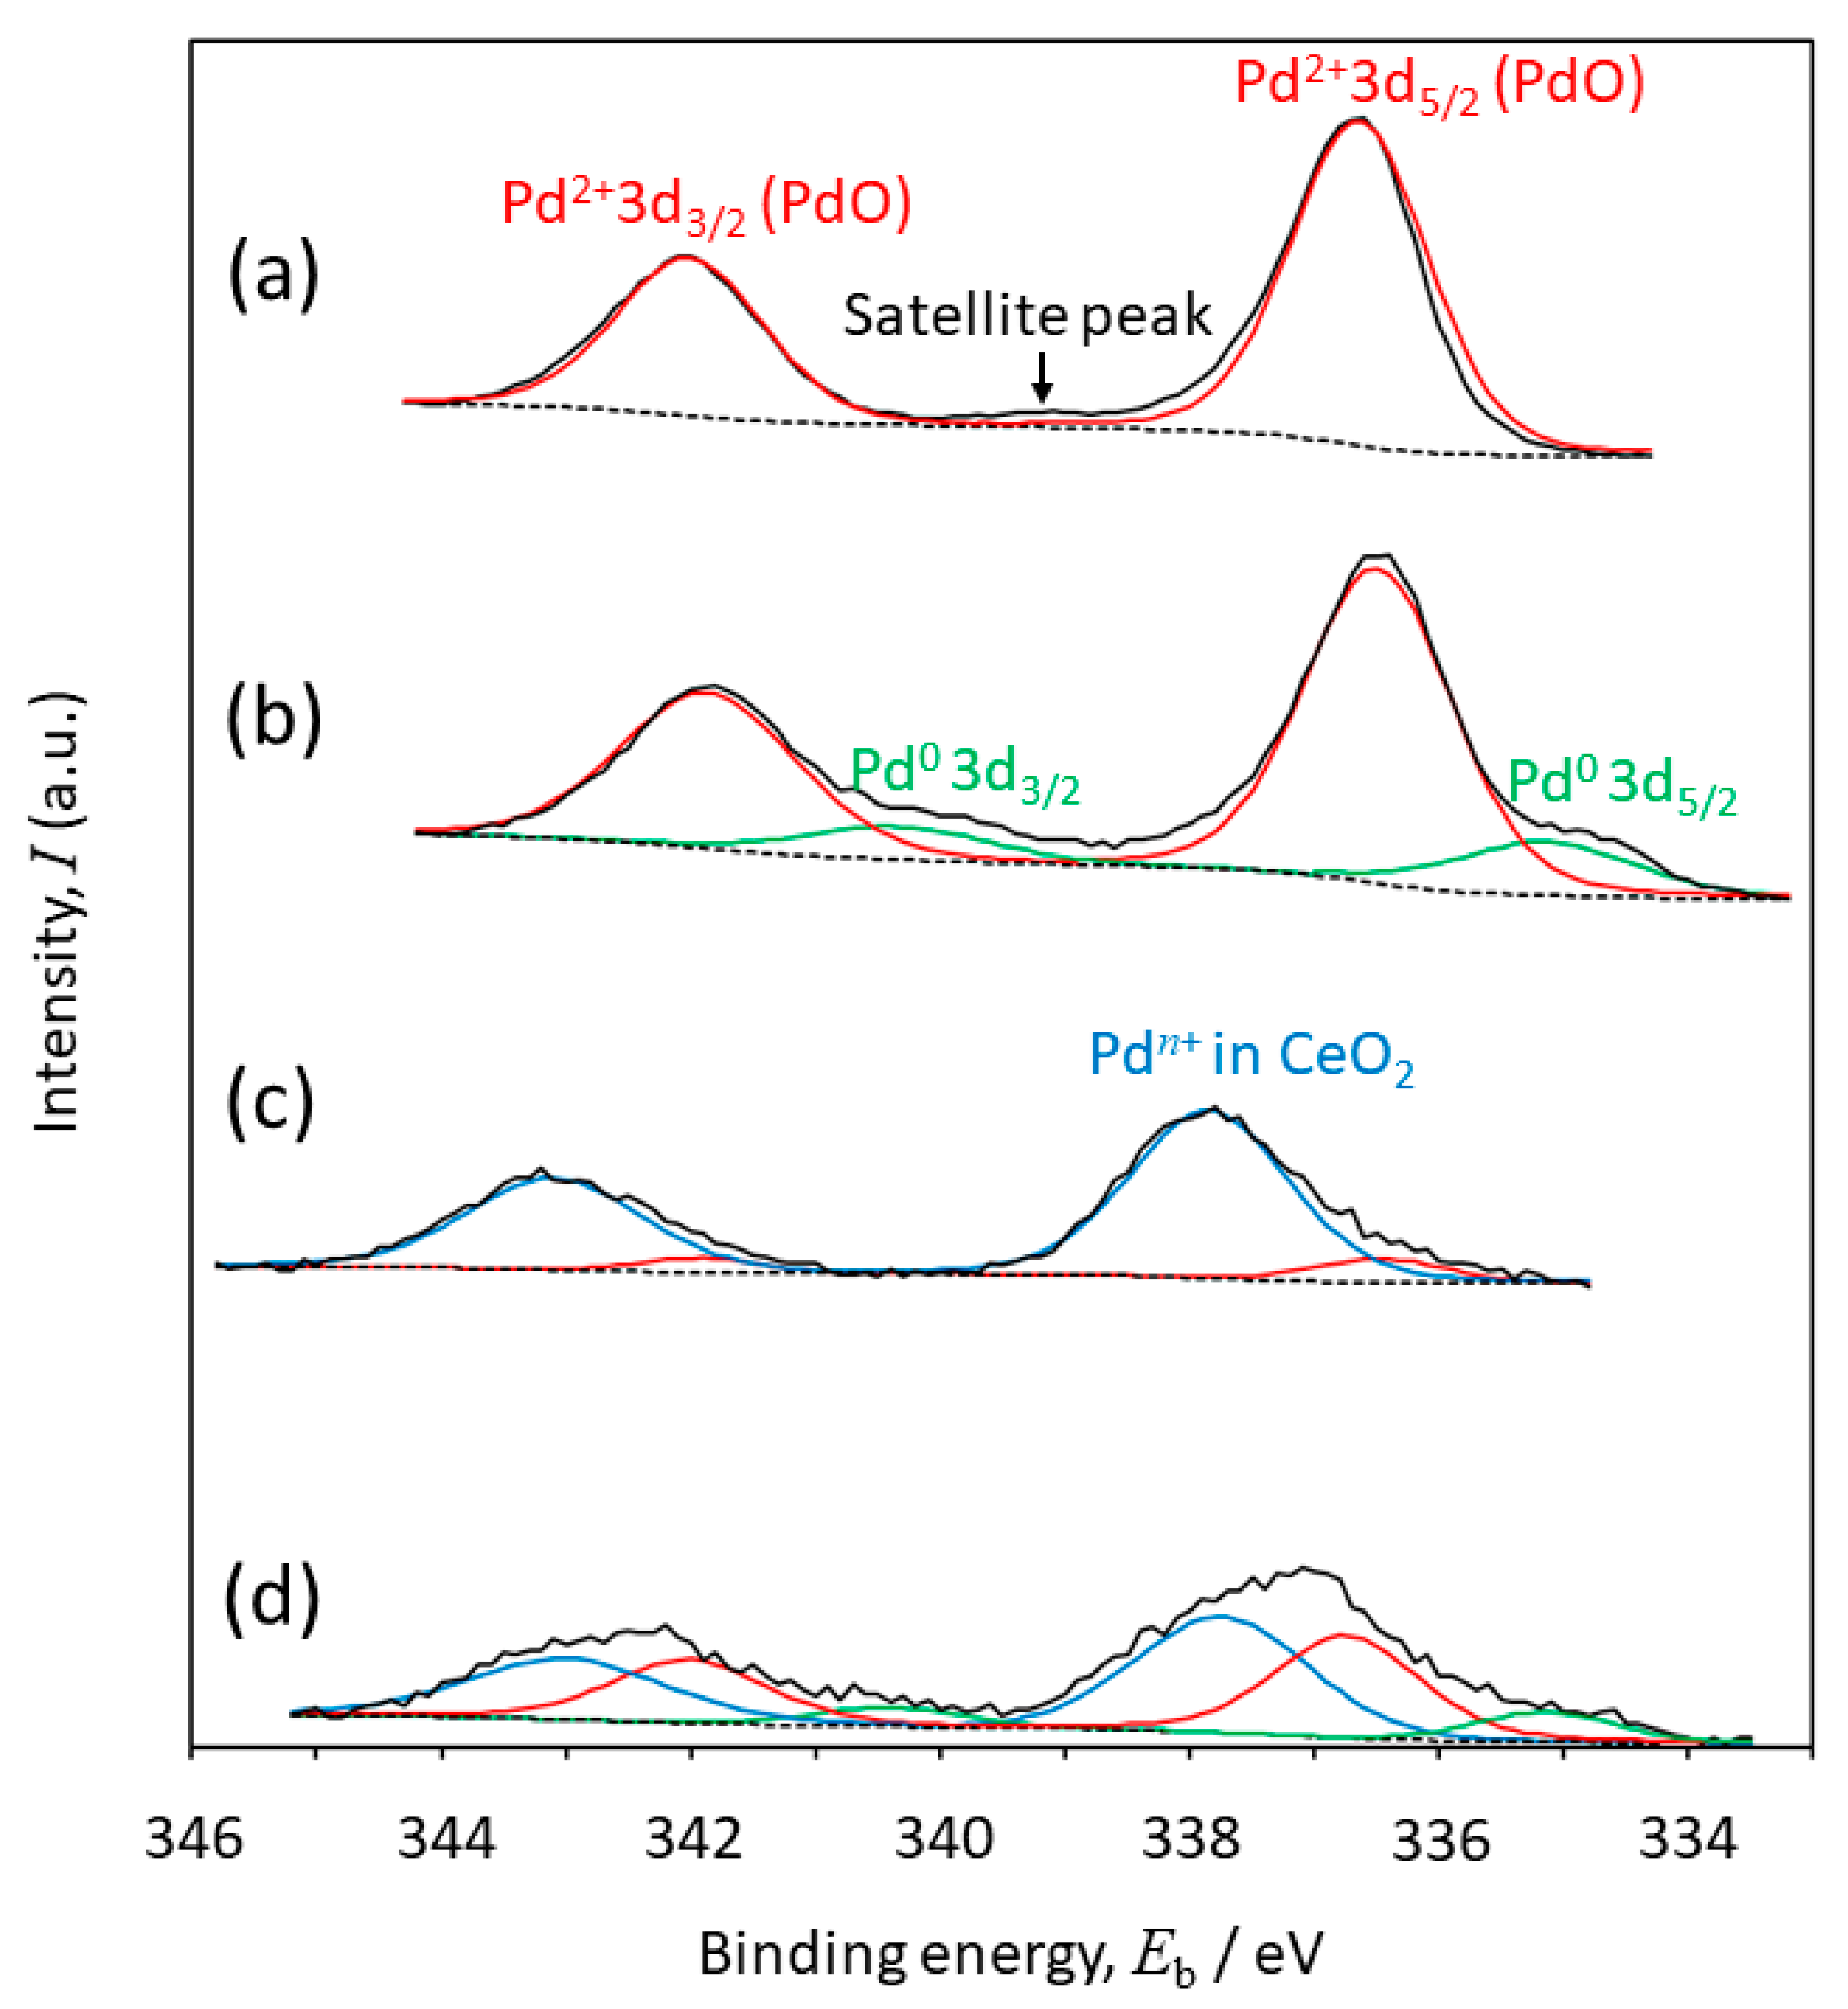
2.4. Oxidation States

The oxidation states of Pd and Ce in the prepared powders before and after heating were examined by X-ray photoelectron spectroscopy (XPS). The Pd3d spectra of PdO and PdCe4 before and after heating are compared in Figure 8. The Pd3d spectrum of PdO (Figure 8a) shows peaks at binding energies (Eb) of 336.7 and 342.1 eV, which are close to the Pd3d5/2 and Pd3d3/2 energies of PdO reported in literature [27,28]. Another small satellite peak is observed around 339 eV [27]. After heating PdO at 900 °C for 2 h, new peaks are detected at lower Eb, indicating the formation of metallic Pd (Figure 8b). The spectrum was separated into peaks corresponding to metallic Pd (Eb = 335.1 eV for Pd3d5/2 and 340.3 eV for Pd3d3/2), according to the literature [27,28]. Although the XRD pattern in Figure 3c shows that the whole PdO was converted to metallic Pt, the XPS data suggest that a large fraction of Pd2+ ions (82%, according to the peak areas) remain on the surface. This is probably due to surface oxidation during cooling from 900 °C to room temperature in air.
The Pd3d spectrum of PdCe4 shows main peaks at 337.8 and 343.1 eV, whose binding energies are higher than peaks of the PdO, as indicated by a blue line in Figure 8c. This result agrees with earlier research on Pd-substituted CeO2 solid solutions [5,6,7,8,9,10,16,17,29,30]. Because Pd ions in CeO2 have binding energies similar to those of Pd4+ in PdO2 (337.9 eV for Pd3d5/2 [31]), some studies assumed that Pd4+ ions exist as a solid solution [6,8,9]. Other researchers ascribed these peaks to Pd2+ in CeO2 [29,30]. Therefore, in Figure 8c, we tentatively indicate Pd in CeO2 as Pdn+. According to the peak areas, 92% of the Pd species are present as Pdn+ on the surface of PdCe4, while 8% forms PdO. The Pd3d spectrum of PdCe4 after heating (Figure 8d) displays new peaks corresponding to metallic Pd formed by thermal decomposition and PdO produced by surface oxidation of Pd during cooling. The atomic percentages of Pdn+, Pd2+, and Pd were estimated to be 50%, 40% and 10%, respectively.
The Ce3d spectra of PdCe4 are compared with those of CeO2 in Figure 9. Figure 9a,b show the spectra of CeO2 synthesized in molten nitrate and that of CeO2 after calcination at 600 °C, respectively. The Ce3d spectrum of CeO2 is known to include ten peaks, six of which can be ascribed to Ce4+ (v, v″, and v‴ for Ce4+3d5/2, u, u″, and u‴ for Ce4+3d3/2), while the other four correspond to Ce3+ (v0 and v′ for Ce3+3d5/2, u0 and u′ for Ce3+3d3/2) [32]. The Ce3d spectra of CeO2 obtained in this study indicate that Ce4+ coexists with Ce3+, as represented by red and yellow lines in Figure 9a,b, and the percentage of Ce3+ is 20−30%. On the other hand, the Ce3d spectra of PdCe4 do not show the presence of Ce3+ before and after heating. Hence, we tentatively separate the spectra into Ce4+ peaks, as shown in Figure 9c,d. As discussed in Section 2.1, some researchers ascribed the large lattice constant of Pd-substituted CeO2 to Ce3+. The XPS data of our study, however, suggest that the substitution of Pd for Ce stabilizes Ce4+. In contrast, the substitution of Pt for Ce in CeO2 did not lead to such effects in our previous study [18]. Therefore, it seems necessary to propose a new explanation for the structure of the solid solution. For example, the substitution of Ce4+ by two Pd2+ ions, which was proposed by Su et al. for the surface of Pd-doped CeO2 [33], might explain the lattice expansion.

3. Materials and Methods

PdO−CeO2 powders with various molar ratios were prepared by a procedure similar to that reported in a previous study of PtO2−CeO2 [18] based on Ref. [34]. For the preparation of the PdO powder, 1.0 g of PdCl2 (99.0%, Kishida Chemical Co., Ltd., Japan), 10 g of NaNO3 (99%, Kishida Chemical Co., Ltd., Japan) and 5 mL of reagent water with an electrical conductivity below 0.5 mS∙m−1 were mixed in a quartz crucible (15 mL capacity, 34 mm outer diameter, 42 mm height). The crucible containing the mixture was heated with a resistance furnace under gradually increasing temperature. An evaporation of water was apparently completed after heating for 40 min, leaving a dark brown powder. The powder became liquid at around the melting point of NaNO3 (308 °C), and then generated a reddish-brown gas (NO2) for a short time. After heating for 2 h, the temperature reached 500 °C and then the crucible was removed from the furnace. After cooling naturally, water was poured onto the crucible to dissolve residual NaNO3 and NaCl. The obtained mixture was filtered (filter paper 5C, Advantec Toyo Kaisha, Ltd., Japan) to collect an insoluble brown powder, which was shown to be PdO.
To prepare PdO−CeO2 powders, Ce(NO3)3∙6H2O (98%, Kishida Chemical Co., Ltd., Japan) was mixed with PdCl2 and NaNO3 in water and heated following the same procedure described above. For example, PdCe4 was synthesized from 0.15 g of PdCl2 and 1.48 g of Ce(NO3)3∙6H2O. Bare CeO2 was also prepared by the same method reported in Ref. [18].
A portion of the prepared oxide powders (PdO and PdCe4) was heated in air to examine their thermal decomposition at 800, 850, and 900 °C for 2 h.
The phases formed in the prepared powders and after the heat treatment were examined with an X-ray diffractometer (X’Pert PRO Alpha-1, PANalytical B.V., The Netherlands), using Cu-Kα emission and a θ-2θ geometry.
The morphology of the particles was examined using a scanning electron microscope (JSM-6510LA, JEOL, Japan) equipped with an energy dispersive X-ray spectrometer (JED-2300, JEOL, Japan). Higher magnification images were obtained using a transmission electron microscope (JEM-2100, JEOL, Japan) operated at 200 kV. For the TEM observation, a specimen was ground with a mortar and pestle, and then suspended in ethanol. A small drop of the suspension was placed onto a collodion-coated Cu grid and dried before observation.
The oxidation states of Pd and Ce in the prepared powders before and after heating were examined with an XPS instrument (1600E, ULVAC PHI Inc., Japan), using Mg-Kα radiation operated at 15 kV and 400 W. Argon sputtering, which is widely used for depth profiling in XPS measurements, was not employed here because it might reduce Pd and Ce to lower oxidation states [35,36]. The experimental data were analysed with the MultiPak ver. 6.2.1 software, to fit the spectra with Gaussian-Lorentzian peaks after Shirley background subtraction. A C1s peak of a contamination carbon was used as an internal standard.

4. Conclusions

Ce1−xPdxO2−δ solid solution with a high Pd content (x ~ 0.2) was synthesized in molten nitrate. The lattice constant of CeO2 increased upon the substitution of Pd for Ce, in agreement with the literature. The formation of a solid solution hindered the formation and sintering of Pd particles during heating, and thermal decomposition thus resulted in Pd particles of much smaller size than those obtained from thermal decomposition of bare PdO. The synthesis method proposed in this study appears suitable for the easy preparation of CeO2 solid solutions with high Pd content. In addition, the XPS analysis indicated that the formation of a solid solution did not result in increased Ce3+ amounts and stabilized the Ce4+ ions in CeO2.

Author Contributions

Conceptualization, H.S.; methodology, H.S.; investigation, K.S., M.M. and T.S. All authors have read and agreed to the published version of the manuscript.

Funding

This study was partially supported by Grant-in-Aid for Scientific Research (JSPS KAKENHI, Grant Number 15K14192).

Acknowledgments

XRD analysis and SEM observations were carried out at the Research and Education Center of Materials Engineering, Course of Materials Design Engineering, Faculty of Engineering, Ehime University. TEM observations were performed at the Division of Material Science, Advanced Research Support Center (ADRES), Ehime University.

Conflicts of Interest

The authors declare no conflict of interest.

References

  1. Hegde, M.S.; Bera, P. Noble metal ion substituted CeO2 catalysts: Electronic interaction between noble metal ions and CeO2 lattice. Catal. Today 2015, 253, 40–50. [Google Scholar] [CrossRef]
  2. Feio, L.S.F.; Hori, C.E.; Mattos, L.V.; Zanchet, D.; Noronha, F.B.; Bueno, J.M.C. Partial oxidation and autothermal reforming of methane on Pd/CeO2–Al2O3 catalysts. Appl. Catal. A 2008, 348, 183–192. [Google Scholar] [CrossRef]
  3. Ryou, Y.; Lee, J.; Lee, H.; Kim, C.H.; Kim, D.H. Effect of sulfur aging and regeneration on low temperature NO adsorption over hydrothermally treated Pd/CeO2 and Pd/Ce0.58Zr0.42O2 catalysts. Catal. Today 2017, 297, 53–59. [Google Scholar] [CrossRef]
  4. Luo, Y.; Xiao, Y.; Cai, G.; Zheng, Y.; Wei, K. Complete methanol oxidation in carbon monoxide streams over Pd/CeO2 catalysts: Correlation between activity and properties. Appl. Catal. B 2013, 136–137, 317–324. [Google Scholar] [CrossRef]
  5. Priolkar, K.R.; Bera, P.; Sarode, P.R.; Hegde, M.S.; Emura, S.; Kumashiro, R.; Lalla, N.P. Formation of Ce1−xPdxO2−δ solid solution in combustion-synthesized Pd/CeO2 catalyst: XRD, XPS, and EXAFS investigation. Chem. Mater. 2002, 14, 2120–2128. [Google Scholar] [CrossRef]
  6. Meng, L.; Lin, J.; Pu, Z.; Luo, L.; Jia, A.; Huang, W.; Luo, M.; Lu, J. Identification of active sites for CO and CH4 oxidation over PdO/Ce1−xPdxO2−δ catalysts. Appl. Catal. B 2012, 119–120, 117–122. [Google Scholar] [CrossRef]
  7. Bera, P.; Patil, K.C.; Jayaram, V.; Subbanna, G.N.; Hegde, M.S. Ionic dispersion of Pt and Pd on CeO2 by combustion method: Effect of metal-ceria interaction on catalytic activities for NO reduction and CO and hydrocarbon oxidation. J. Catal. 2000, 196, 293–301. [Google Scholar] [CrossRef]
  8. Sánchez-Rodríguez, D.; Yamaguchi, S.; Ihara, D.; Yamaura, H.; Yahiro, H. Self-propagating high-temperature synthesis of highly dispersed noble metals on ceria powder: Application to Pd/CeO2 catalyst. Ceram. Int. 2017, 43, 14533–14536. [Google Scholar] [CrossRef]
  9. Khader, M.M.; Al-Marri, M.J.; Ali, S.; Abdelmoneim, A.G. Active and stable methane oxidation nano-catalyst with highly-ionized palladium species prepared by solution combustion synthesis. Catalysts 2018, 8, 66. [Google Scholar] [CrossRef] [Green Version]
  10. Slavinskaya, E.M.; Gulyaev, R.V.; Zadesenets, A.V.; Stonkus, O.A.; Zaikovskii, V.I.; Shubin, Y.V.; Korenev, S.V.; Boronin, A.I. Low-temperature CO oxidation by Pd/CeO2 catalysts synthesized using the coprecipitation method. Appl. Catal. B 2015, 166–167, 91–103. [Google Scholar] [CrossRef]
  11. Liang, H.; Raitano, J.M.; He, G.; Akey, A.J.; Herman, I.P.; Zhang, L.; Chan, S. Aqueous co-precipitation of Pd-doped cerium oxide nanoparticles: Chemistry, structure, and particle growth. J. Mater. Sci. 2012, 47, 299–307. [Google Scholar] [CrossRef]
  12. Li, G.; Li, L.; Jiang, D. Facile synthesis of highly active mesoporous PdCeOx solid solution for low-temperature CO oxidation. J. Phys. Chem. C 2015, 119, 12502–12507. [Google Scholar] [CrossRef]
  13. Kurnatowska, M.; Kepinski, L.; Mista, W. Structure evolution of nanocrystalline Ce1−xPdxO2−y mixed oxide in oxidizing and reducing atmosphere: Reduction-induced activity in low-temperature CO oxidation. Appl. Catal. B 2012, 117–118, 135–147. [Google Scholar] [CrossRef]
  14. Kurnatowska, M.; Schuster, M.E.; Mista, W.; Kepinski, L. Self-regenerative property of nanocrystalline Ce0.89M0.11O2y (M=Pd, Rh) mixed oxides. ChemCatChem 2014, 6, 3125–3131. [Google Scholar] [CrossRef]
  15. Singh, P.; Hegde, M.S. Sonochemical synthesis of thermally stable hierarchical Ce1xMxO2δ (M=Pt or Pd, 0 ≤ x ≤ 0.10) nanocrystallites: Redox properties and methanol electro-oxidation activity. Cryst. Growth Des. 2010, 10, 2995–3004. [Google Scholar] [CrossRef]
  16. Gulyaev, R.V.; Slavinskaya, E.M.; Novopashin, S.A.; Smovzh, D.V.; Zaikovskii, A.V.; Osadchii, D.Y.; Bulavchenko, O.A.; Korenev, S.V.; Boronin, A.I. Highly active PdCeOx composite catalysts for low-temperature CO oxidation, prepared by plasma-arc synthesis. Appl. Catal. B 2014, 147, 132–143. [Google Scholar] [CrossRef]
  17. Misch, L.M.; Kurzman, J.A.; Derk, A.R.; Kim, Y.; Seshadri, R.; Metiu, H.; McFarland, E.W.; Stucky, G.D. C−H bond activation by Pd-substituted CeO2: Substituted ions versus reduced species. Chem. Mater. 2011, 23, 5432–5439. [Google Scholar] [CrossRef]
  18. Sasaki, H.; Matsushita, H.; Sakamoto, K.; Sakamoto, T.; Maeda, M. Formation of Pt3O4 particles on PtO2−CeO2 solid solution. J. Phys. Chem. Solids 2019, 135, 109097. [Google Scholar] [CrossRef]
  19. Voorhees, V.; Adams, R. The use of the oxides of platinum for the catalytic reduction of organic compounds. I. J. Am. Chem. Soc. 1922, 44, 1397–1405. [Google Scholar] [CrossRef] [Green Version]
  20. Adams, R.; Voorhees, V.; Shriner, R.L. Platinum catalyst for reductions. Org. Synth. 1928, 8, 92. [Google Scholar]
  21. Shannon, R.D. Revised effective ionic radii and systematic studies of interatomic distances in halides and chaleogenides. Acta Cryst. A 1976, 32, 751–767. [Google Scholar] [CrossRef]
  22. Deshpande, S.; Patil, S.; Kuchibhatla, S.V.; Seal, S. Size dependency variation in lattice parameter and valency states in nanocrystalline cerium oxide. Appl. Phys. Lett. 2005, 87, 133113. [Google Scholar] [CrossRef]
  23. Hailstone, R.K.; DiFrancesco, A.G.; Leong, J.G.; Allston, T.D.; Reed, K.J. A study of lattice expansion in CeO2 nanoparticles by transmission electron microscopy. J. Phys. Chem. C 2009, 113, 15155–15159. [Google Scholar] [CrossRef]
  24. Gulyaev, R.V.; Kardash, T.Y.; Malykhin, S.E.; Stonkus, O.A.; Ivanova, A.S.; Boronin, A.I. The local structure of PdxCe1xO2xδ solid solutions. Phys. Chem. Chem. Phys. 2014, 16, 13523–13539. [Google Scholar] [CrossRef] [PubMed]
  25. Zhang, H.; Gromek, J.; Fernando, G.W.; Boorse, S.; Marcus, H.L. PdO/Pd system equilibrium phase diagram under a gas mixture of oxygen and nitrogen. J. Phase Equilibria 2002, 23, 246–248. [Google Scholar] [CrossRef]
  26. Hinokuma, S.; Fujii, H.; Okamoto, M.; Ikeue, K.; Machida, M. Metallic Pd nanoparticles formed by Pd-O-Ce interaction: A reason for sintering-induced activation for CO oxidation. Chem. Mater. 2010, 22, 6183–6190. [Google Scholar] [CrossRef]
  27. Pillo, T.; Zimmermann, R.; Steiner, P.; Hüfner, S. The electronic structure of PdO found by photoemission (UPS and XPS) and inverse photoemission (BIS). J. Phys. Condens. Matter 1997, 9, 3987–3999. [Google Scholar] [CrossRef]
  28. Brun, M.; Berthet, A.; Bertolini, J.C. XPS, AES and Auger parameter of Pd and PdO. J. Electron Spectrosc. Relat. Phenom. 1999, 104, 55–60. [Google Scholar] [CrossRef]
  29. Slavinskaya, E.M.; Boronin, A.I.; Danilova, I.G.; Amosov, Y.I.; Ivanova, A.S.; Kuznetsov, P.A.; Polukhina, I.A.; Gulyaev, R.V.; Stadnichenko, A.I.; Koshcheev, S.V.; et al. Synthesis and physicochemical characterization of palladium-cerium oxide catalysts for the low-temperature oxidation of carbon monoxide. Kinet. Catal. 2009, 50, 819–823. [Google Scholar] [CrossRef]
  30. Gulyaev, R.V.; Stadnichenko, A.I.; Slavinskaya, E.M.; Ivanova, A.S.; Koscheev, S.V.; Boronin, A.I. In situ preparation and investigation of Pd/CeO2 catalysts for the low-temperature oxidation of CO. Appl. Catal. A 2012, 439–440, 41–50. [Google Scholar] [CrossRef]
  31. Kim, K.S.; Gossmann, A.F.; Winograd, N. X-ray photoelectron spectroscopic studies of palladium oxides and the palladium-oxygen electrode. Anal. Chem. 1974, 46, 197–200. [Google Scholar] [CrossRef]
  32. Paparazzo, E. Use and mis-use of X-ray photoemission spectroscopy Ce3d spectra of Ce2O3 and CeO2. J. Phys. Condens. Matter 2018, 30, 343003. [Google Scholar] [CrossRef] [PubMed]
  33. Su, Y.; Liu, J.; Filot, I.A.W.; Zhang, L.; Hensen, E.J.M. Highly active and stable CH4 oxidation by substitution of Ce4+ by two Pd2+ ions in CeO2(111). ACS Catal. 2018, 8, 6552–6559. [Google Scholar] [CrossRef] [PubMed]
  34. Shriner, R.L.; Adams, R. The Preparation of palladous oxide and its use as a catalyst in the reduction of organic compounds. VI. J. Am. Chem. Soc. 1924, 46, 1683–1693. [Google Scholar] [CrossRef]
  35. Naguib, H.M.; Kelly, R. Criteria for bombardment-induced structural changes in non-metallic solids. Radiat. Eff. 1975, 25, 1–12. [Google Scholar] [CrossRef]
  36. Holgado, J.P.; Alvarez, R.; Munuera, G. Study of CeO2 XPS spectra by factor analysis: Reduction of CeO2. Appl. Surf. Sci. 2000, 161, 301–315. [Google Scholar] [CrossRef]
Figure 1. X-ray diffraction (XRD) patterns of prepared powders: (a) PdO, (b) PdCe1, (c) PdCe2, (d) PdCe3, (e) PdCe4, and (f) CeO2.
Catalysts 10 00640 g001
Figure 2. Composition dependences of lattice constants of Pd-substituted CeO2 reported in the literature [4,5,6,11,12,13,14,15,16,17] and obtained in this study.
Catalysts 10 00640 g002
Figure 3. XRD patterns of powders obtained by heating PdO at (a) 800 °C, (b) 850 °C, and (c) 900 °C for 2 h in air.
Catalysts 10 00640 g003
Figure 4. XRD patterns of PdCe4 after heating at (a) 800 °C, (b) 850 °C, and (c) 900 °C for 2 h in air.
Catalysts 10 00640 g004
Figure 5. Scanning electron microscopy (SEM) images of (a) prepared PdO and (b) Pd obtained by heating PdO at 900 °C for 2 h.
Catalysts 10 00640 g005
Figure 6. Microscopic observation of prepared PdCe4. (a) Secondary electron image and elemental mapping of (b) Pd and (c) Ce obtained by SEM−energy dispersive X-ray spectroscopy (EDS). (d) Transmission electron microscopy (TEM) image with atomic ratios obtained by EDS.
Catalysts 10 00640 g006
Figure 7. Microscopic observation of PdCe4 after heating at 900 °C for 2 h. (a) Secondary electron image and elemental mapping of (b) Pd and (c) Ce obtained by SEM−EDS. (d) TEM image with atomic ratios obtained by EDS.
Catalysts 10 00640 g007
Figure 8. Pd3d spectra of (a) as-synthesized PdO, (b) PdO after heating at 900 °C for 2 h, (c) as-synthesized PdCe4, and (d) PdCe4 after heating at 900 °C for 2 h.
Catalysts 10 00640 g008
Figure 9. Ce3d spectra of (a) as-synthesized CeO2, (b) CeO2 after heating at 600 °C for 2 h, (c) as-synthesized PdCe4, and (d) PdCe4 after heating at 900 °C for 2 h.
Catalysts 10 00640 g009

