Article

In Situ Raman Spectroscopy as a Tool for Discerning Subtle Structural Differences between Commercial (Ce,Zr)O2-Based OSC Materials of Identical Composition

by
Chrysanthi Andriopoulou
1,
Deb Harris
2,
Hazel Stephenson
2,
Angelos M. Efstathiou
3 and
Soghomon Boghosian
1,*
1
Department of Chemical Engineering, University of Patras & FORTH/ICE-HT, GR-26504 Patras, Greece
2
Elektron Technology Center, Luxfer MEL Technology, Lumns Lane, Manchester M27 8LN, UK
3
Department of Chemistry, University of Cyprus, University Campus, 2109 Nicosia, Cyprus
*
Author to whom correspondence should be addressed.
Catalysts 2020, 10(4), 462; https://doi.org/10.3390/catal10040462
Submission received: 4 March 2020 / Revised: 7 April 2020 / Accepted: 22 April 2020 / Published: 24 April 2020

Abstract

:
In situ Raman spectroscopy was used at temperatures in the 50–480 °C range under oxidizing (20% O2/He) and reducing (5% H2/He) flowing gas atmospheres to compare the spectra obtained for a series of industrial rare earth doped CexZr1−xO2−δ oxygen storage capacity (OSC) mixed metal oxide materials of identical at % composition, which were prepared by the same chemical synthesis route, in which one synthesis parameter of the aqueous chemistry was slightly varied. The Raman fingerprint of the anionic sublattice is very sensitive to O atom relocations within the bulk of the material matrix and to the pertinent defect topology in each case. A protocol of sequential Raman measurements and analysis was proposed to discern subtle differences between the oxygen vacancy and defect topologies of the examined materials. It can be concluded that for two materials under comparison for their structures, identical Raman spectra are obtained only if the procedures followed for their preparation are identical; a slight variation of one single parameter (e.g., in the aqueous chemistry stage) results in discernible differences in the Raman spectra. The proposed procedure can serve as a tool for proving or disproving infringement of IPR (Intellectual Property Rights) protected preparation methods of ceria-based mixed metal oxide materials.

1. Introduction

Ceria–zirconia mixed oxides (Ce1−xZrxO2−δ) constitute materials of great and topical technological interest due to their formidable oxygen storage capacity (OSC) properties as well as to numerous applications in industrial catalysis [1,2,3,4]. Pertinent applications include (but are not restricted to) promotion of the water gas shift (WGS) and steam reforming reactions, favoring of activity at the interface of the metal/support, promotion of CO oxidation by utilization of lattice oxygen, and most importantly, three-way-catalysis (TWC) where ceria–zirconia based oxides are used to eliminate toxic exhaust gases in vehicles [5,6]. Ceria–zirconia based mixed oxides used in TWC perform best when they exhibit a high ability to store oxygen under lean conditions and deliver oxygen under rich conditions. The exceptional redox properties of ceria ensure a great functionality of such materials in grounds of of oxygen storage and delivery under working dynamic conditions [2] by allowing interactions with reducing and oxidizing components of the reactant mixtures [7] and thereby broadening the air/fuel ratio value in which the catalysts are active. ZrO2 has been established as one of the most useful additives to CeO2 for improving its thermal stability and functional properties [6,8,9,10]. Thermal stability is a key issue in TWCs, where during engine start-up, the catalyst is typically exposed to 900–1000 °C. The more refractory nature of ZrO2-containing mixed oxides, combined with the spectacular downshift of the reduction temperature (some 200–300 °C below the respective reduction temperature of pure ceria) resulting by the ZrO2 insertion in the ceria matrix, results in materials that are resistant to sintering that may be caused as a consequence of prolonged thermal aging [6,7].
The most topical and present major use of Ce1−xZrxO2−δ-based oxides is in three-way-catalysis, in which highly desired properties including phase homogeneity, oxygen mobility combined with structural stability, thermal stability/durability upon use, low reduction temperature, high degree of reducibility and high OSC are required [6]. The “good mix” and “favorable balance” of these properties is attributed to the structure and configuration of the anionic (oxygen) sublattice and the best pertinent performance (i.e., in TWC) is achieved by the t pseudo-cubic phase (tetragonal phase with “no tetragonality”, c / a     1 ) [5,6,10]. The reliable phase diagram of Yashima et al. [11] based on powder X-ray diffraction (XRD) as well as Raman measurements is very often referred to as the benchmark. However, the CeO2–ZrO2 phase diagrams are inadequate for allowing predictions for the prevailing phases existing in nanoparticles at the intermediate composition range because of the different ranges of phase stability resulting from variations during preparation [10,11,12,13,14]. Different extents of O atom displacements from their ideal cubic (fluorite) sites give rise to defects and to numerous possible structural transitions of the material’s anionic sublattice that cannot be detected by powder XRD [10]. The urge for ceria-based mixed metal oxides with improved functional properties has galvanized the great development of preparation/synthesis protocols that result in materials with a diversity of defect topologies. Various synthesis routes have been applied for preparing Ce1−xZrxO2−δ and related mixed metal oxides [15]. Worth mentioning are solid state synthesis, co-precipitation, high energy ball-milling, the use of various additives/gelification agents (e.g., hydrazine, oxalic acid, citric acid), sol-gel methods using alkoxide precursors, and the formation of high surface area aerogels by the supercritical drying of hydrogels.
Among the numerous techniques used for the structural characterization of Ce1−xZrxO2−δ-based materials, Raman spectroscopy has been proven to be very powerful in detecting structural transitions resulting from intra-lattice displacements of O atoms and probing short as well as intermediate range vibrational properties [10,11,16,17,18,19]. A Raman spectrum obtained under well-controlled in situ conditions can serve as a fingerprint for an anionic sublattice structure of Ce1−xZrxO2−δ-based materials [10]. Raman spectroscopy is a particularly suitable technique for fingerprinting the bulk structure of the anionic sublattice of Ce1−xZrxO2−δ-based materials. The catalyst’s bulk structure and defect and vacancy topologies are of particular relevance to the bulk oxygen mobility and diffusivity, which, in turn, is of key importance to the oxygen storage capacity (oxygen storage and release). Often, comparisons of Raman spectra may pertain to Ce1−xZrxO2−δ-based materials with identical composition on at% basis exhibiting seemingly (i.e., based on XRD analysis) identical structures. Such comparisons can be of relevance to prove or disprove eventual infringements of IPR-protected ceria-based mixed metal oxide commercial products. Raman spectra are typically complicated due to the lack of long range periodicity, which is caused by perturbations resulting from heterocationic doping (Ce4+→Zr4+, Ce4+→RE3+; RE, rare earth) that gives rise to defects and vacancies due to oxygen mobility and relocation in interstitial sites [10], and/or vacancies compensating the effective negative charge in the case of heterovalent cation exchange. The lack of long-range periodicity results, in turn, in a complex defect topology that transforms the Raman spectrum to broad overlapping continua rather than to a set of well-defined bands. Thus, whereas the number and positions of the observed bands may be adequate for classifying the anionic sublattice configurations of the studied Ce1−xZrxO2−δ-based materials to a particular structure, more effort and carefully designed experimental protocols are required for discerning differences among isostructural materials with identical at % compositions. To the best of our knowledge, there has been no previous report of a Raman protocol used to identify differences of seemingly identical materials.
The present work complements a recent report on a novel analysis of transient isothermal 18O/16O isotopic exchange [20] over the same materials reported here, and is concerned with the use of a special protocol for performing in situ Raman measurements over four OSC industrial Ce1−xZrxO2−δ-based oxides with identical chemical compositions on at% basis and produced by the same chemical route [21] in which the value of one single parameter in the aqueous chemistry of the preparation route was slightly varied. The authors in [20] were concerned with the differences in transient kinetic rates and characteristics of the 16O/18O exchange via bulk diffusion for the industrial ceria-zirconia based oxides studied and their possible origin from subtle differences in the anionic (oxygen) sub-lattice structure with special emphasis in defects and O vacancies. The present work aims to demonstrate that amongst the studied materials, there indeed exist subtle differences in the anionic sublattice structure, particularly in the defect and vacancy topologies. This was done in order to demonstrate that a slight variation of a synthesis parameter in the aqueous chemistry stage results in discernible differences of the anionic sublattice structure as evidenced by their Raman fingerprints. Conversely, if the Raman fingerprints for two materials are identical, then the materials are likely to have been synthesized by exactly the same procedure, thereby providing sound evidence for IPR infringement. Hence, the objective is to illustrate the adequacy of the proposed Raman protocol for the following: (i) discerning subtle differences amongst the studied isostructural materials; (ii) identifying identical materials; and (iii) demonstrating the reproducibility of the structural evolutions with respect to temperature-induced oxygen mobility and to reduction/oxidation cycles taking place under alternating O2 and H2 containing gas atmospheres.

2. Results and Discussion

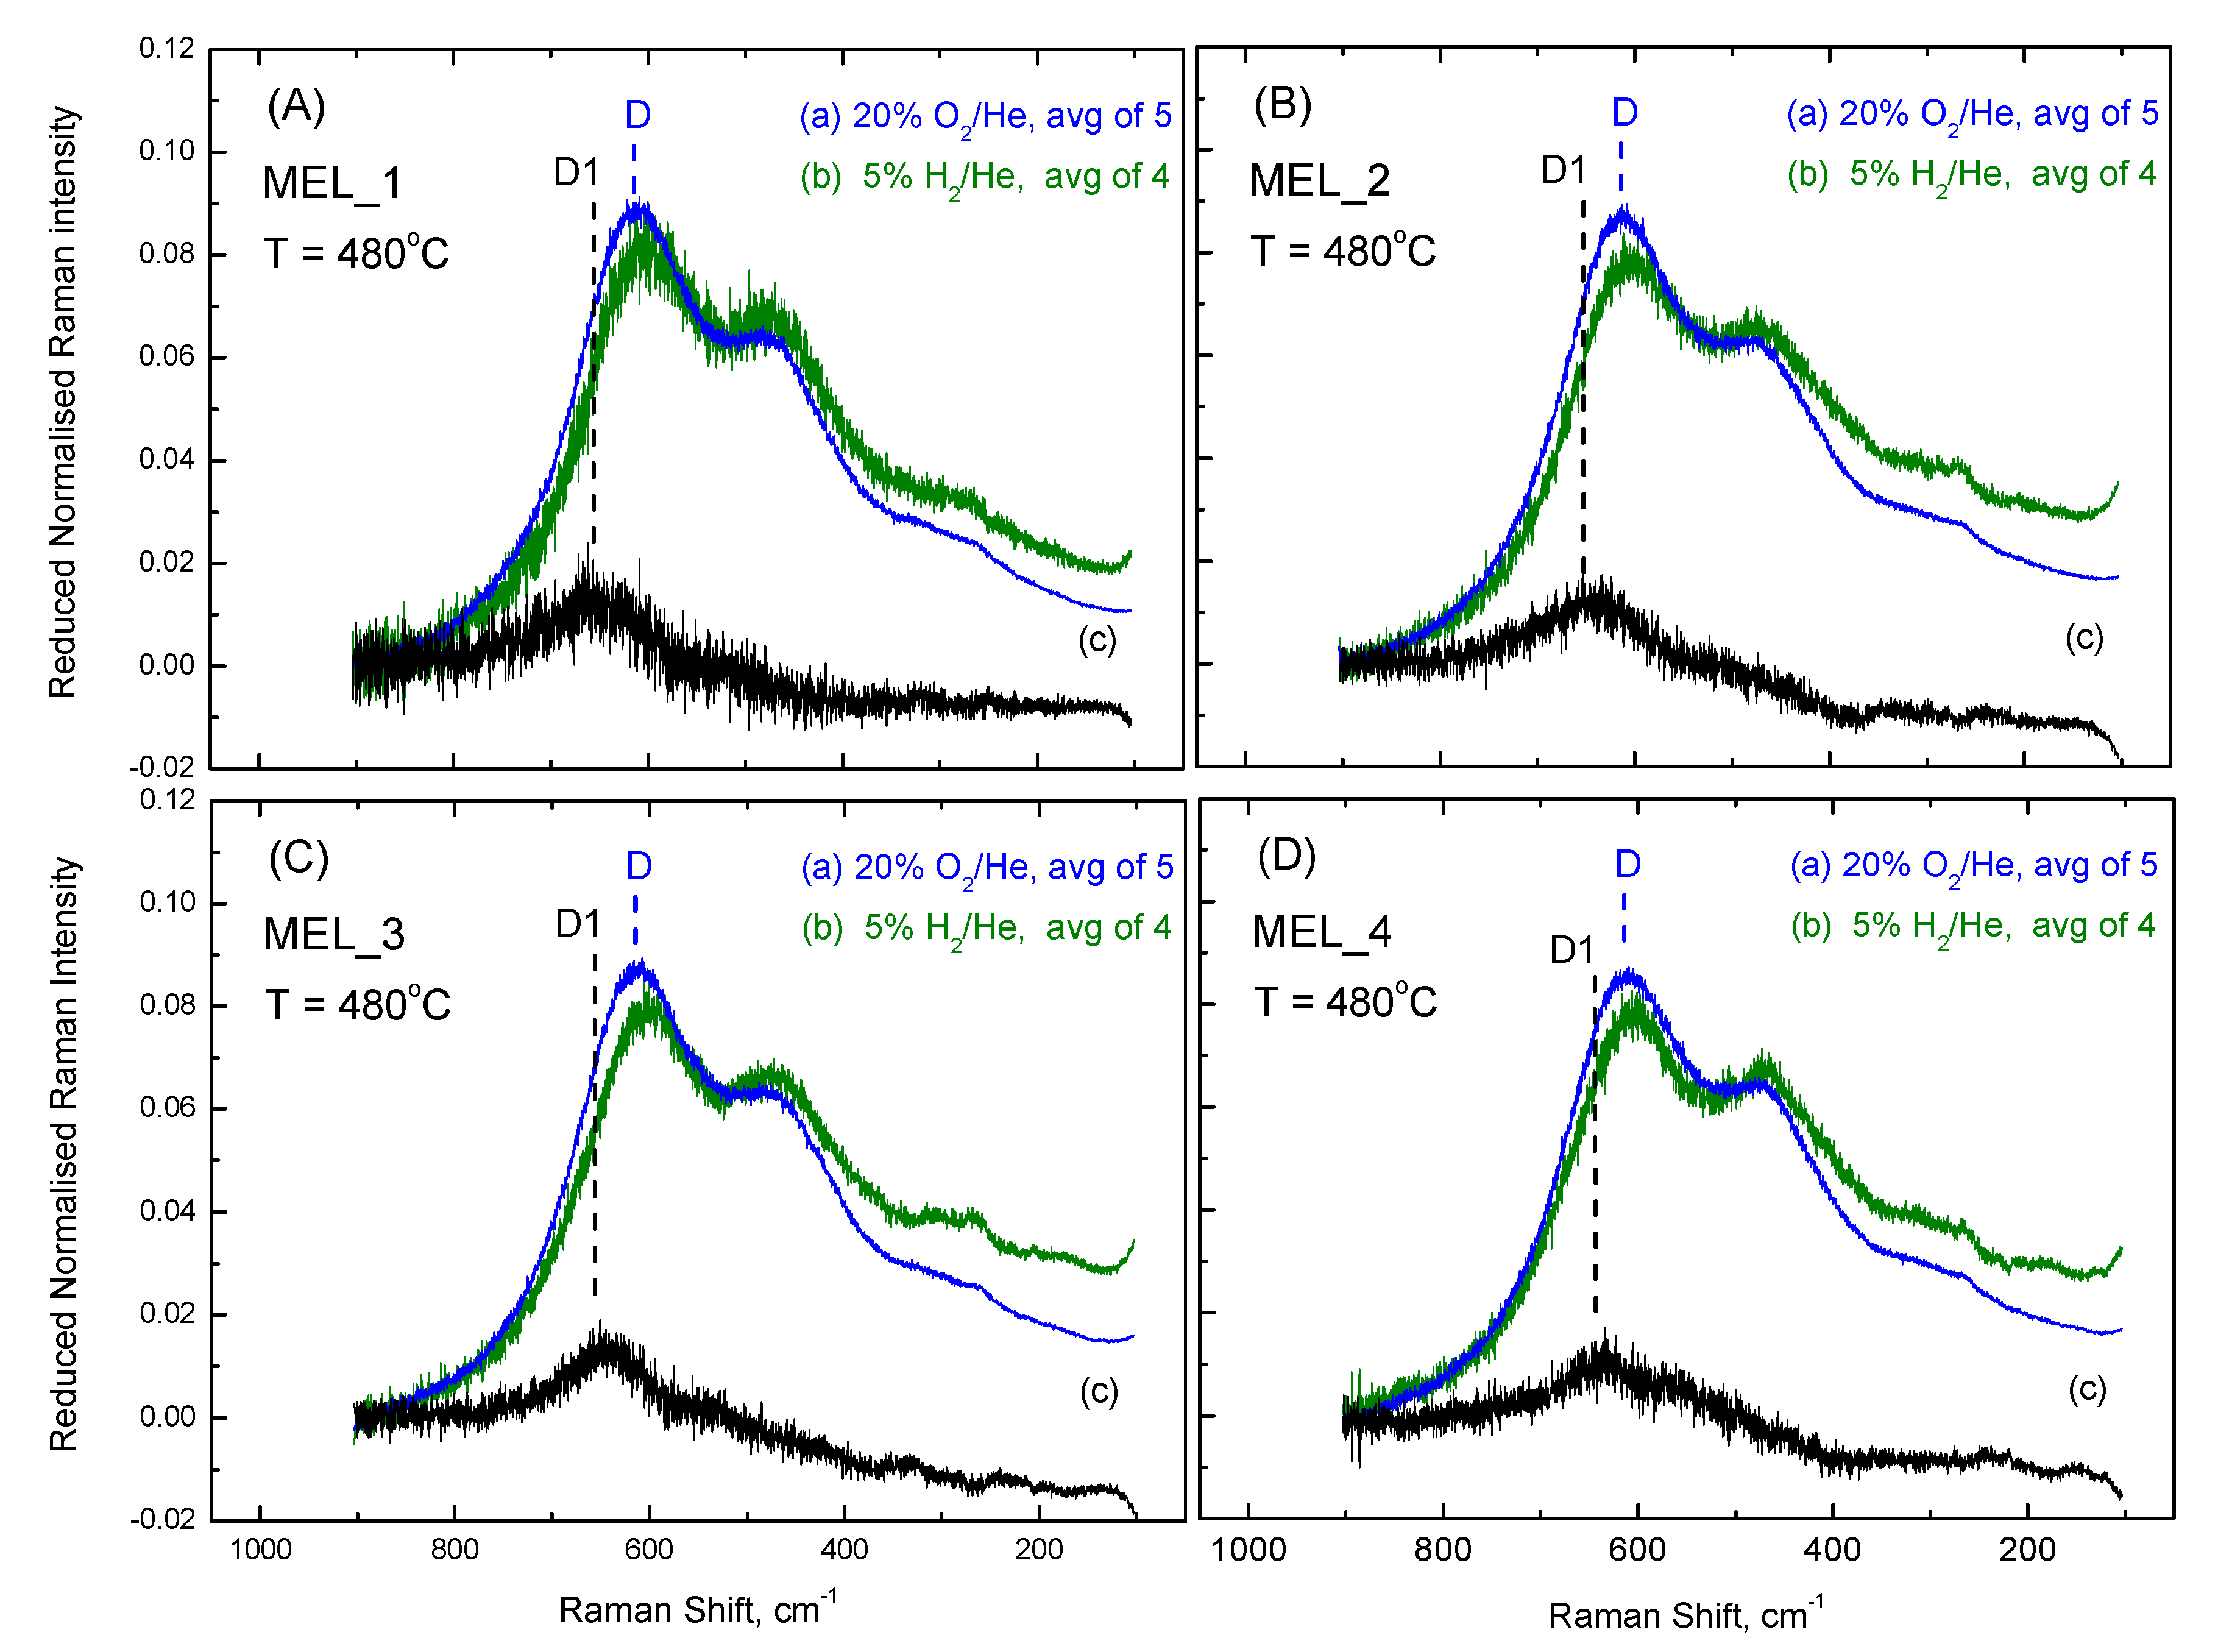
2.1. Temperature Evolution, Redox Cycling, and Structure Reinstatement

The anionic (oxygen) sublattice structure of CexZr1−xO2−δ mixed oxides is subject to reversible temperature-dependent evolution. Recently, for the first time, we used in situ Raman spectroscopy to capture pertinent temperature-dependent snapshots of Raman spectra reflecting the corresponding structural conformation at each temperature for CexZr1−xO2−δ mixed oxides made by the citrate sol-gel and urea-coprecipitation methods [10]. The evolution of the sequential in situ Raman spectra obtained under oxidizing conditions at 50, 200, 450, and 50 °C were interpreted in terms of O atom relocations within the lattice [10]. Oxygen atom mobility within the bulk and oxygen atom relocations between sites take place on account of slightly diversified minima in lattice energy by means e.g., of a widely accepted mechanism proposed by Mamontov et al. [22]. According to this mechanism, lattice deformations caused by heterocationic exchange (Zr4+→Ce4+) mobilize O atoms located in the interior of tetrahedral cationic sites to the (ideally) vacant interior of octahedral cationic sites, thus generating O vacancies at their start points that are, however, self-charge-balanced from the migrated O atoms that occupy the interior of the octahedral interstitial sites [10,22]. Moreover, switching the gas atmosphere surrounding the material from oxidizing (i.e., 20% O2/He) to reducing (i.e., 5% H2/He) conditions results in O atom withdrawal and partial emptying of the material matrix in terms of oxygen that can be delivered under the applied conditions. In situ switching of the Raman reactor gas atmosphere back to oxidizing conditions results in a complete reinstatement of the anionic sublattice structure of the materials in their reference oxidized state [10,18].
Figure 1 shows the evolution of the in situ reduced (see Section 3.2.3) and normalized Raman spectra obtained for the MEL_1 sample material at different temperatures and gas atmospheres in the sequence: (a) 20% O2/He at 50 °C (the std. dev. of five successive recordings is shown)→(b) 20% O2/He at 275 °C→(c) 20% O2/He at 480 °C→(d) 5% H2/He at 480 °C→(d′) 20% O2/He at 480 °C (spectrum not shown for clarity)→(e) 20% O2/He at 50 °C.
The spectra in Figure 1 show that in situ normalized and “reduced” Raman spectra enabled the temperature dependent evolution of the anionic sublattice structure of the CexZr1−xO2−δ-based mixed oxides to be perceived by focusing only on vibrational and structural effects (i.e., disentangled from temperature effects) and for identifying the release/refill of oxygen as being of significance at the studied temperature and gas atmosphere conditions. Pertinent discussions addressing the temperature dependent and gas atmosphere-dependent evolutions of the in situ Raman spectra can be found elsewhere [10,18,19].
Figure 1 demonstrates the sensitivity of the in situ Raman spectroscopy in capturing the evolution of the anionic (oxygen) sublattice structure of the studied materials. Sequential exposure to increasing temperature under flowing 20% O2/He(g) at steady state (e.g., 50 °C (trace(a))→275 °C (trace (b))→480 °C (trace (c)) reveals (in accordance with the unprecedented first pertinent report [10]) a gradual change of the relative intensities of the two main bands. Briefly, the main observations comprise the following: (i) the intrinsic Raman intensities were, as expected, lowered with increasing temperature under stable oxidizing atmosphere; (ii) the high wavenumber band at ca. 610 cm−1, which is commonly addressed as the D band [10,23,24] (known to comprise two components, D1 and D2 [10,24]), maintains an intensity that, with increasing temperature, stays relatively higher when compared to its counterpart the ~470 cm−1 band. Mobility and diffusion of oxygen within the material lattice is activated with increasing temperature, thereby facilitating O atom relocations [22], resulting in the above changes of the relative intensities of the two main bands [10]. Furthermore, under reducing conditions of flowing 5% H2/He(g) at 450 °C (trace (d)), a selective attenuation of the high frequency component of band D (D1 component) takes place, thereby implying O delivery [10,18]. Notably, by cycling back to oxidizing conditions at 480 °C and cooling to 50 °C (trace (e)) the features of the in situ Raman spectrum are fully reinstated. Hence, Figure 1 also highlights the ability of Raman spectroscopy for determining the extent of similarity that would be considered as adequate for identifying “identical” sublattice structures and/or discerning subtle differences using the protocol described above (Section 3.2.4) as described below (Section 2.2 and Section 2.3).

2.2. Assessing Anionic Sublattice Structures of CexZr1−xO2−δ-Based Materials as “Identical”

Different specimens of the same material (e.g., MEL_1) are expected to give rise to identical in situ Raman spectra under identical experimental conditions. Hence, ideally, the difference of the spectra obtained under the same conditions for each specimen should be equal to “zero”. However, the noise that is inherent to each measurement causes slight departures from “zero” when attempting to produce the difference spectra. Slower scans with larger accumulation times certainly tend to improve the approach to “zero” difference between spectra obtained under identical conditions for different specimens of the same sample (i.e., different pellets of MEL_1). Therefore, one needs to establish a protocol of measurements that would set the basis for a good compromise between a high S/N ratio of the measurements and the time required for the measurements (see Section 3.2.2).
Figure 2 shows the in situ Raman spectra obtained for two specimens of sample MEL_1 under flowing 20% O2/He at 50 °C after exposure at 450 °C for 30 min (see Section 3.2.2). Five recordings were averaged for each specimen (the duration of each recording was ca. 2 h) and the absolute difference of traces (a) and (b) (see Section 3.2.4) is shown with the blue trace in Figure 2c. The integral under trace (c) in the 365–900 cm−1 region had a value of 0.44 in the intrinsic reduced normalized intensity scale (Section 3.2.3):
abs ( M E L _ 1 - M E L _ 1 r e p ) 50   ° C , O 2 = 0.44
The calculation of the integral under trace (c) was confined in the 365–900 cm−1 wavenumber range for two reasons: first, this is the region where the bands of main structural relevance were located, and second, to not let slight differences arising from stray light in the low frequency range (originating from the irradiation geometry) contribute to the value of the difference.
Notably, averaging more measurements (e.g., eight measurements) did not lower the 0.44 value significantly. As expected, since traces (a) and (b) pertained to different pellets of the same sample, trace (c) (i.e., the absolute difference of (a) and (b)) is featureless, thereby highlighting the accuracy and the precision of spectra (a) and (b). The standard error of the measurement at the highest peak position (i.e., 607 cm−1) was 0.1197 ± 0.0012.
Figure 3 shows the corresponding comparison between the in situ Raman spectra obtained for the two specimens of sample MEL_1 under flowing 20% O2/He at 480 °C. Likewise, five recordings were averaged for each specimen (each recording’s duration was ca. 2 h and 20 min) and the absolute difference of traces (a) and (b) is shown with the blue trace in Figure 3c with the calculated value of 0.61 for the integral under trace (c). Trace (c) (i.e., the absolute difference of (a) and (b)) was, as expected, featureless, as in Figure 2. The standard error of the measurement at the highest peak position (i.e., 612 cm−1) was 0.0900 ± 0.0012.
The S/N ratio of the in situ Raman spectra recorded at 480 °C was lower compared to the counterpart spectra at 50 °C, hence the “self-difference” had a slightly higher value (0.61 compared to 0.44).

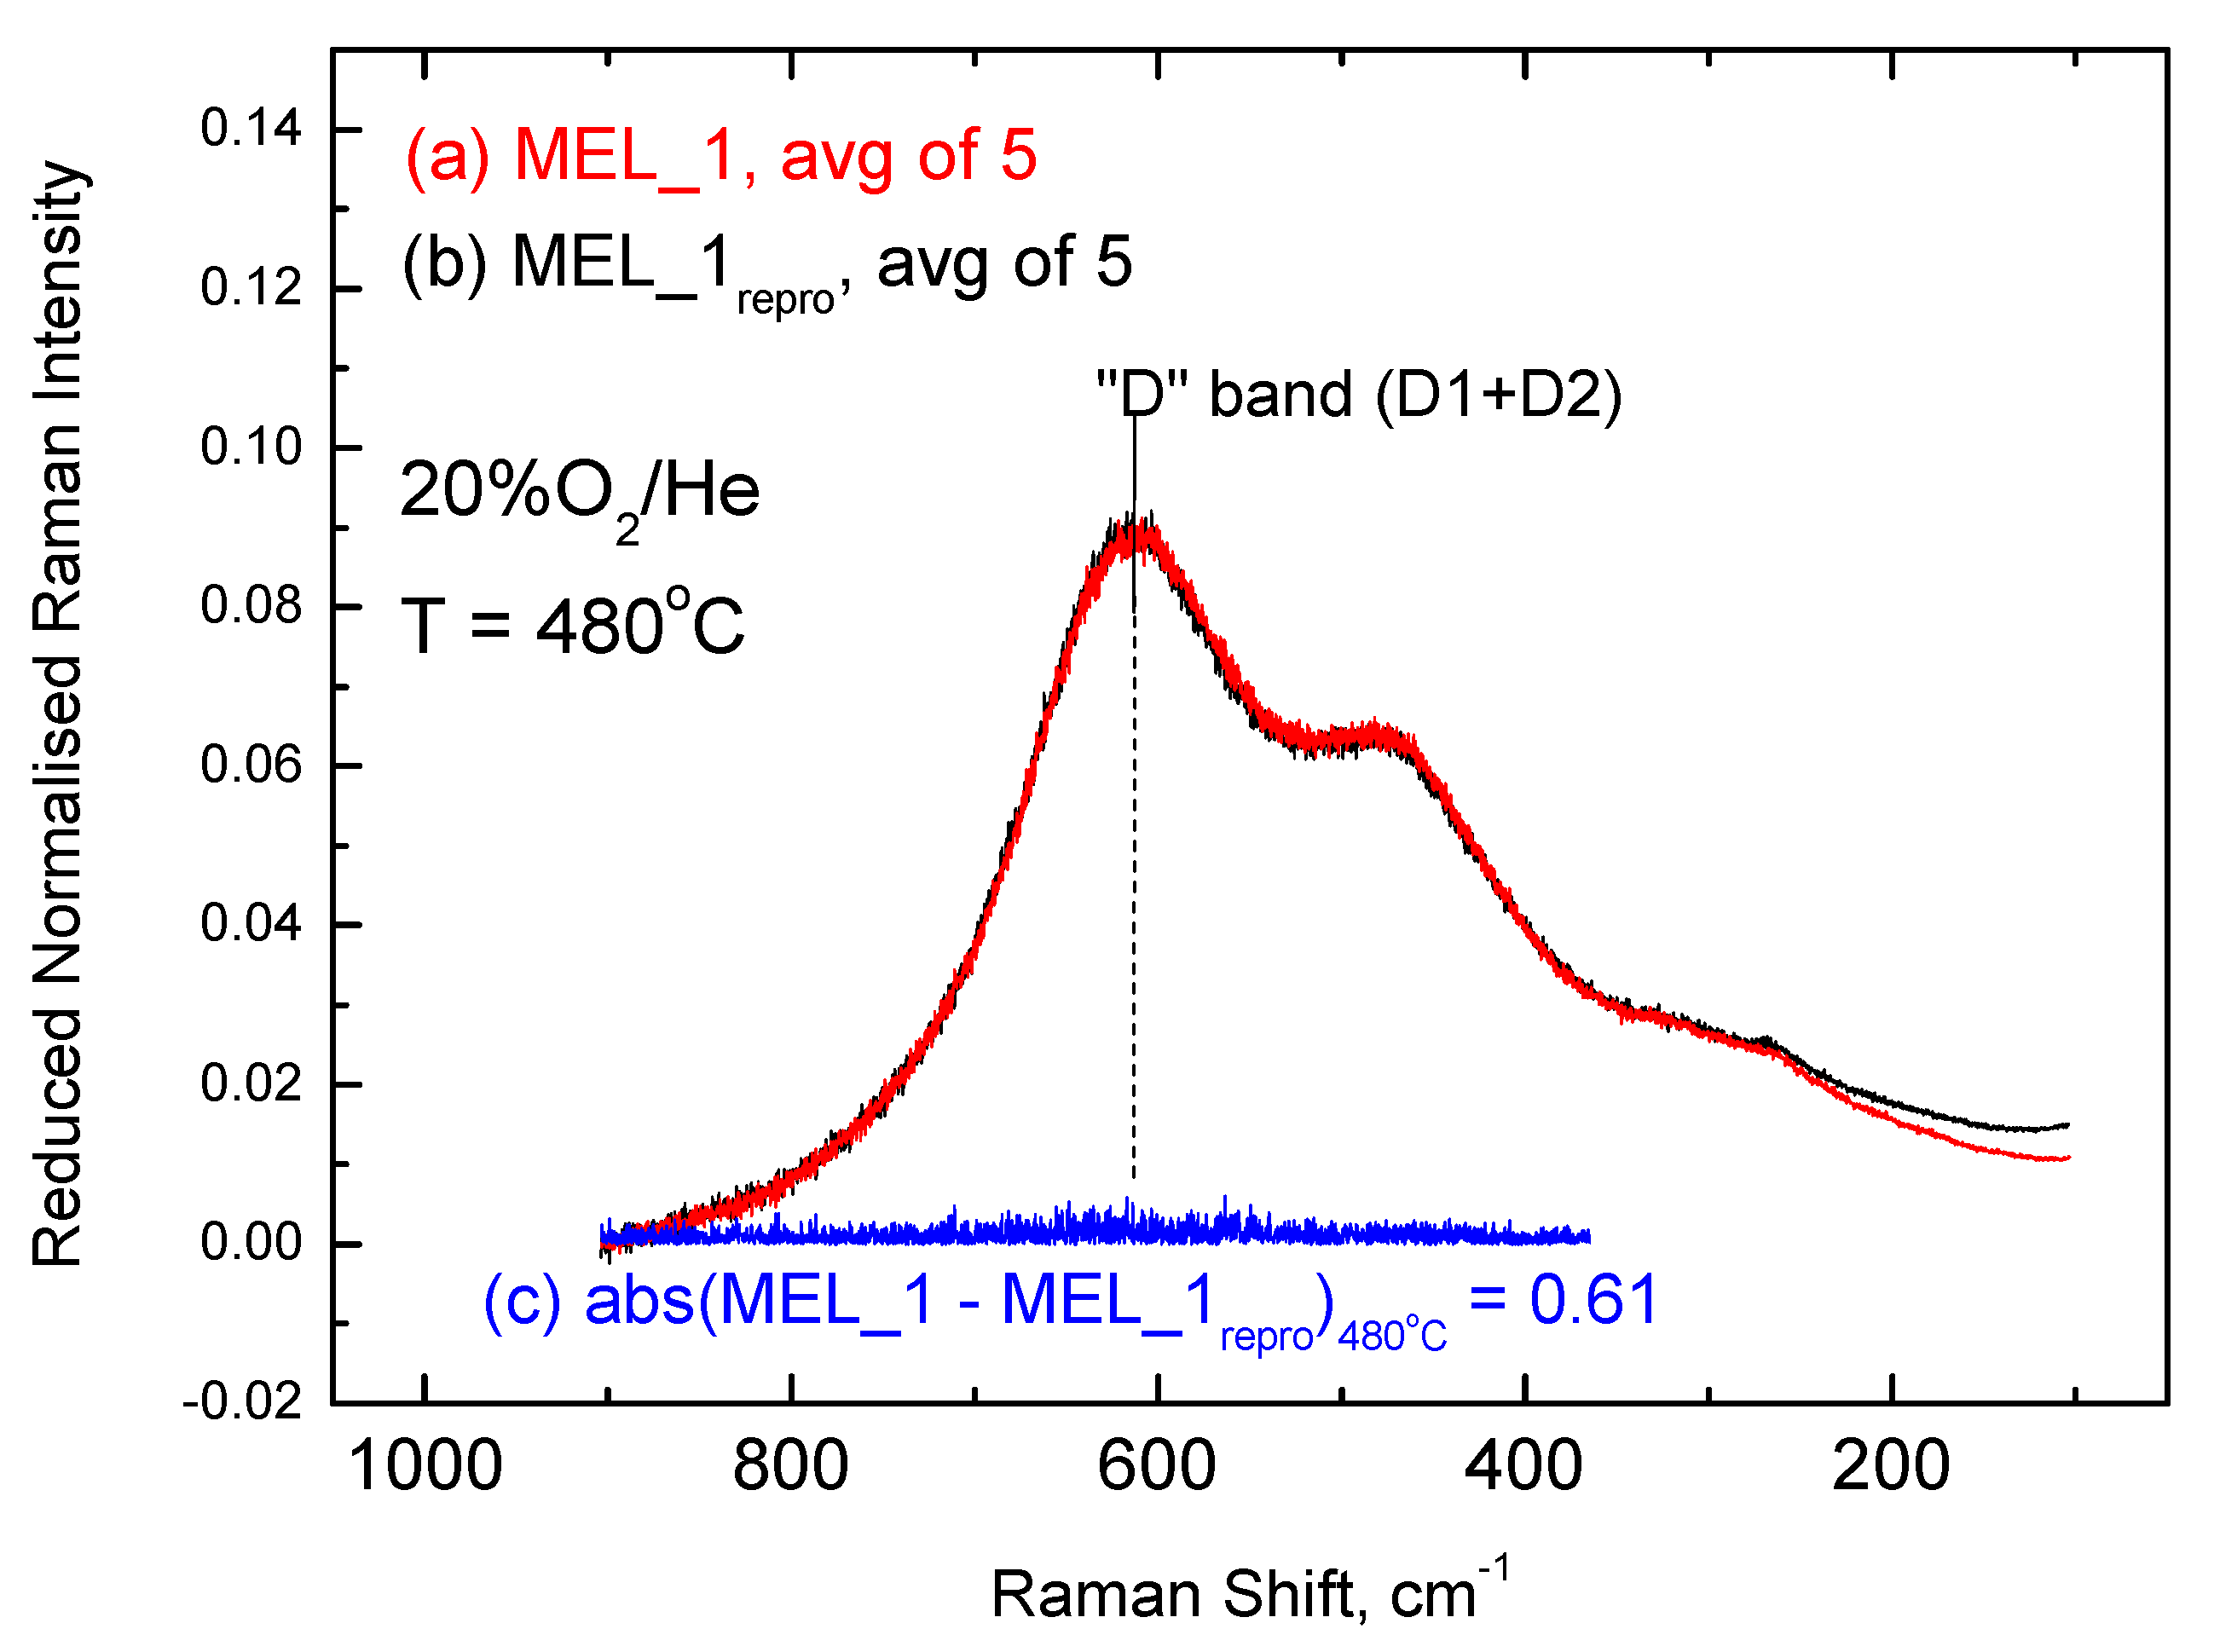
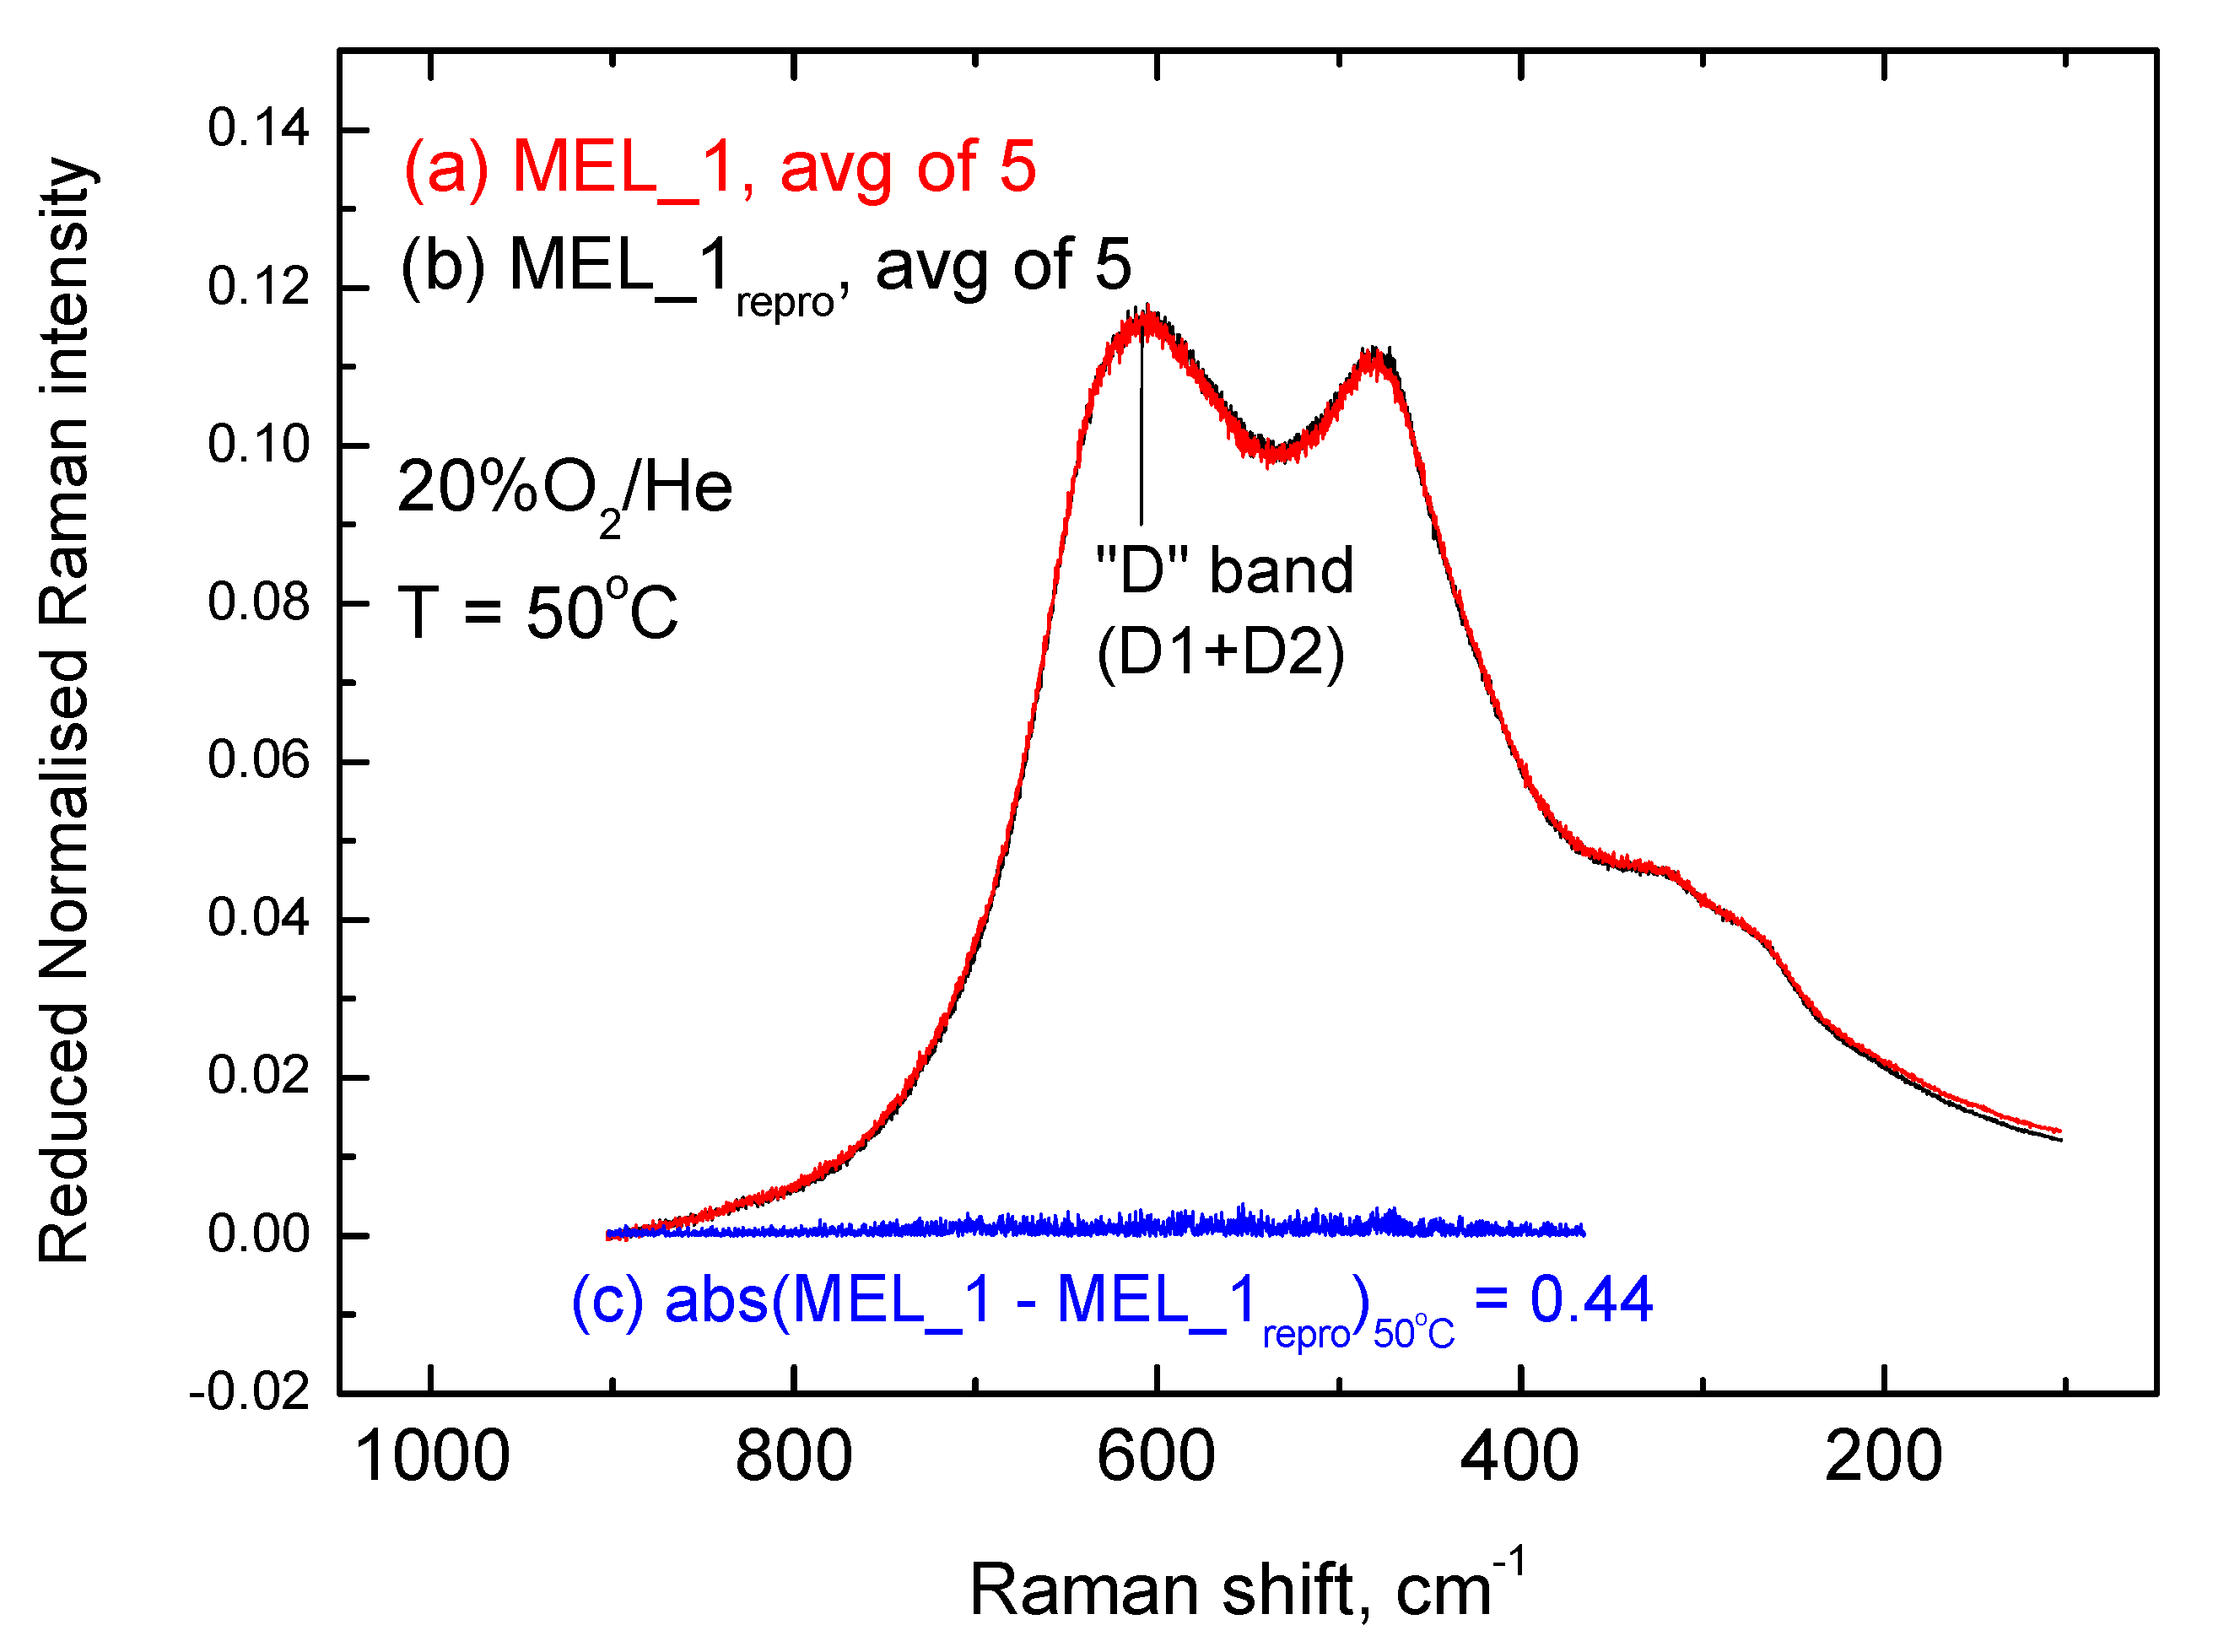
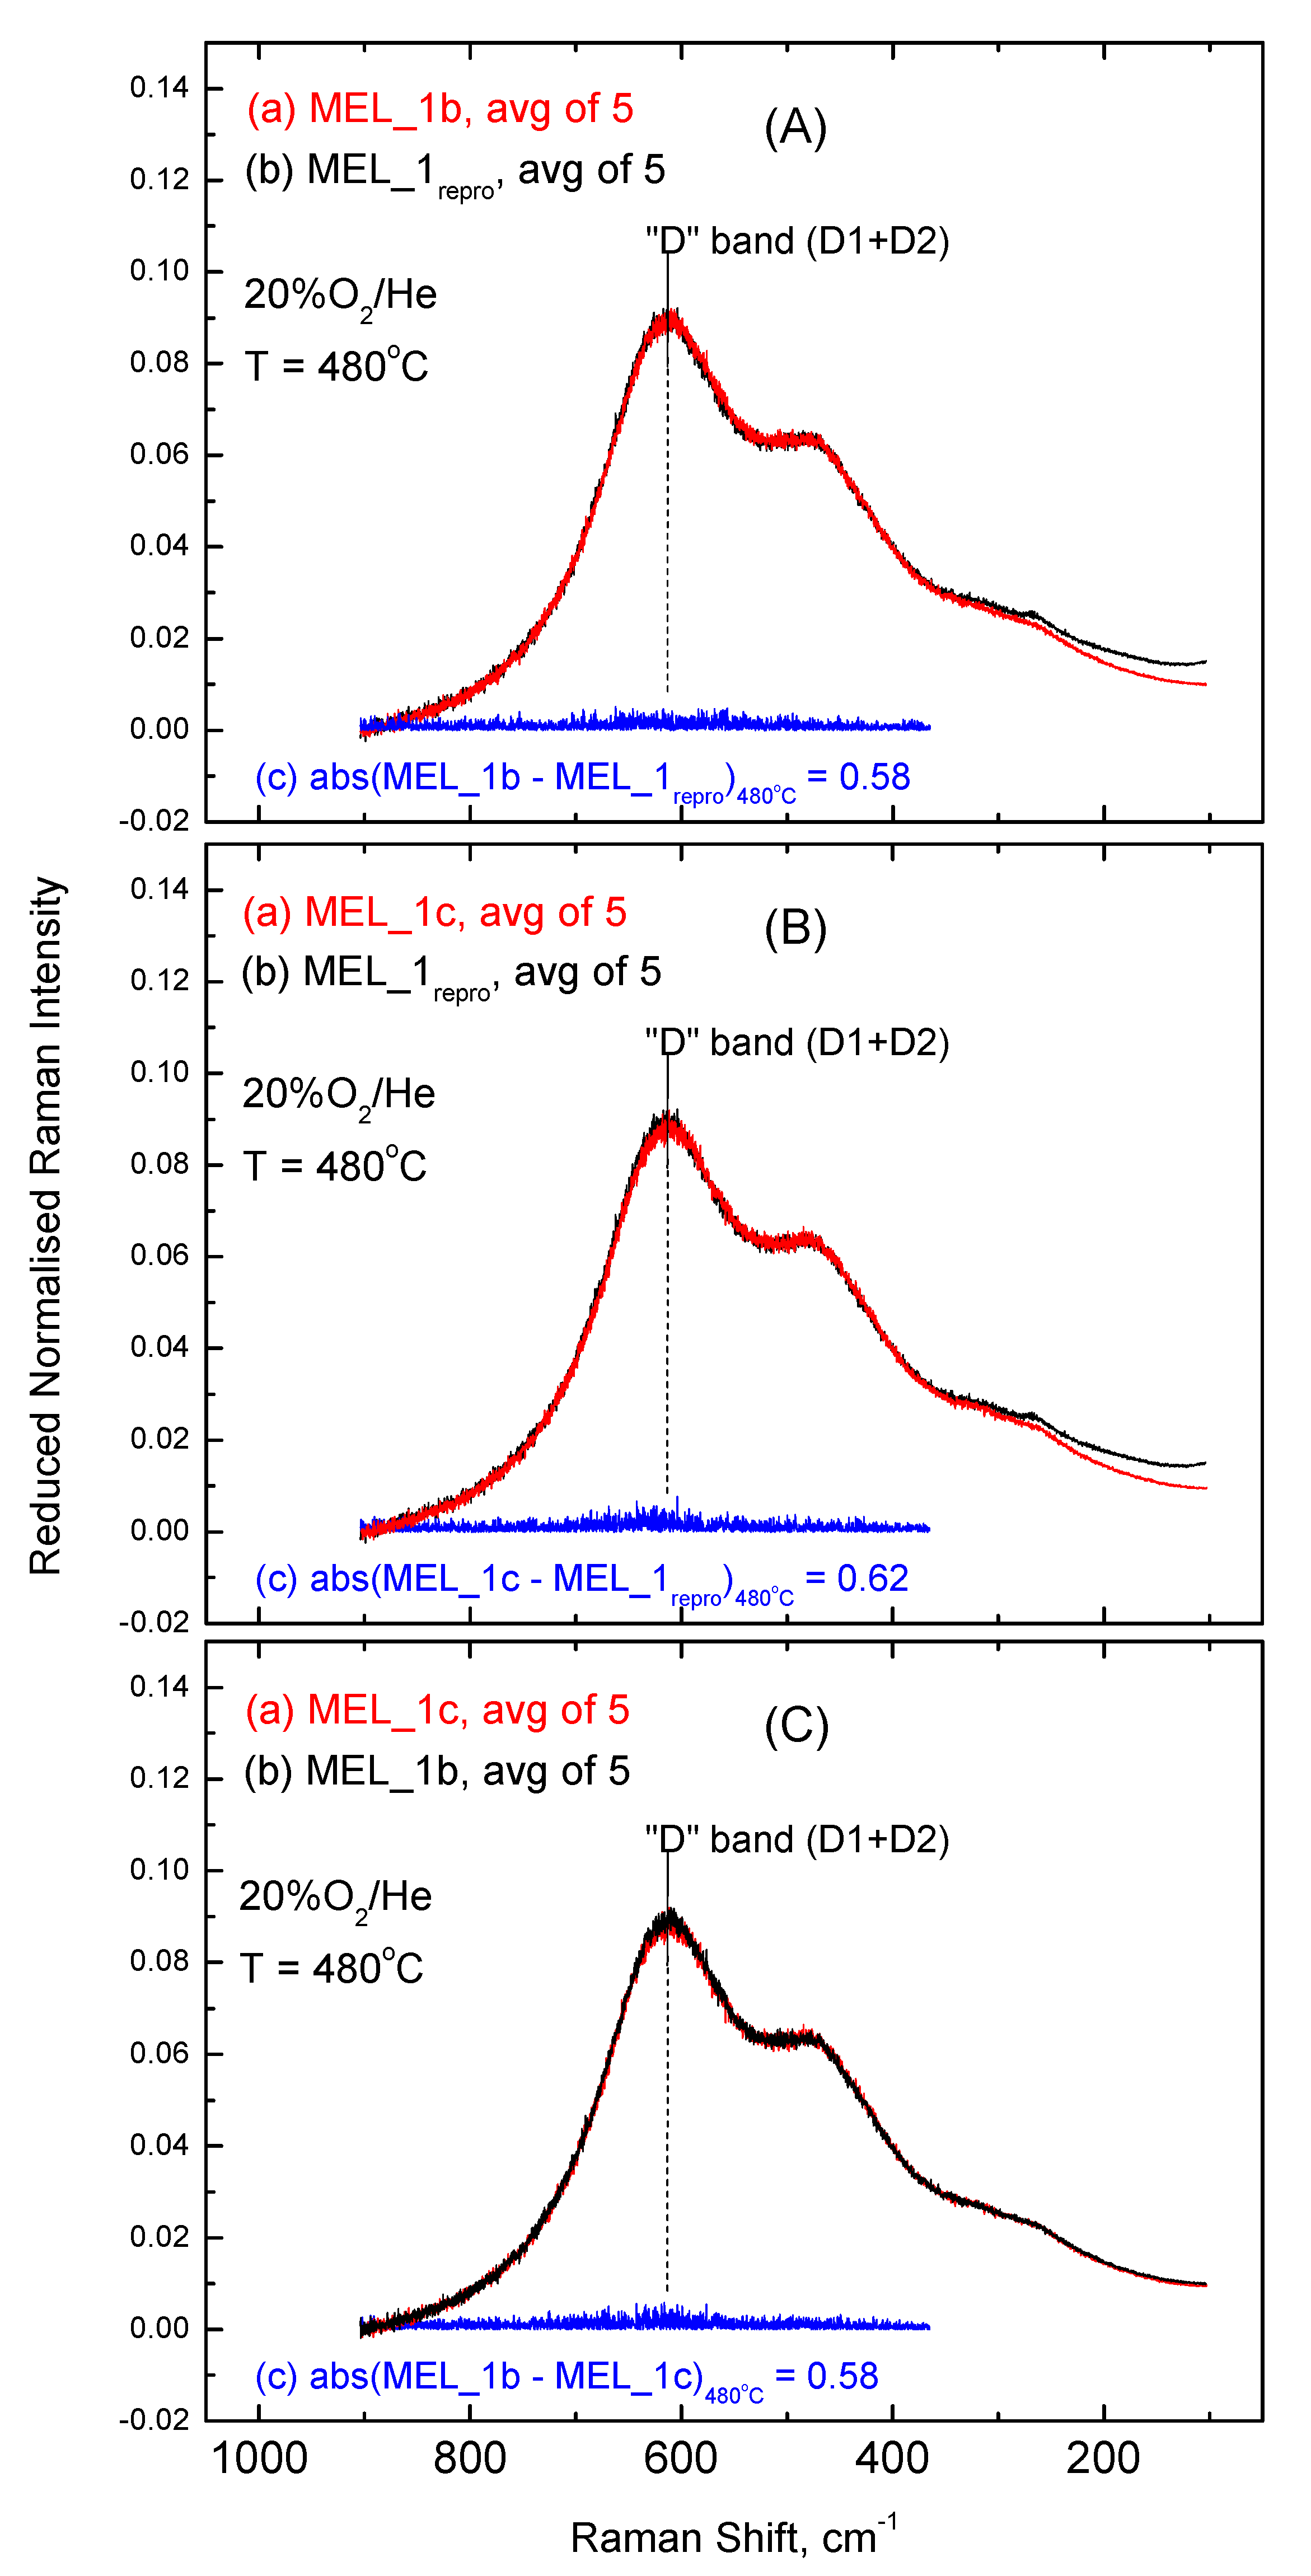
2.3. Inter-Batch Comparisons for Sample MEL_1 at 480 °C under 20% O2/He Gas Atmosphere

When comparing different specimens of the same material under a certain set of conditions (e.g., 20% O2/He at 480 °C), it is of utmost importance to address the issue of eventual inter-batch variations in the anionic lattice structure of the materials (i.e., to determine the extent of applicability for the ascertained “identity” expressed by the 0.61 value for the integral pertaining to the “self-difference” for sample MEL_1 (Figure 3). To this end, MEL_1 samples from two additional different industrial-scale lots (denoted MEL_1b and MEL_1c) were subjected to the same test, and the results for the mutual comparison of spectra and for differences of spectra pertaining to the MEL_1 materials are compiled in Figure 4. It turns out that the absolute differences of the superimposed identical spectra corresponded to integrals of 0.58, 0.62, and 0.58, where a perfect inter-batch reproducibility was evidenced (compared to the 0.61 value obtained for the integral of the intra-batch comparison, Figure 3). Therefore, industrial scale production of the material following the same preparation method resulted in “identical” spectra, quantitatively expressed by the average value of 0.60 determined from the set of partial results shown in Figure 3 and Figure 4 (0.61, 0.58, 0.62, 0.58):
abs ( M E L _ 1 - M E L _ 1 r e p ) 480   ° C , O 2 = 0.60
Hence, it turns out that the extent of the difference in the anionic sublattice structure amongst materials prepared by slightly varied protocols (e.g., MEL_1 vs. MEL_i (i = 2, 3, 4), see Section 3.1) can be evaluated by assessing the departures of the absolute spectra differences from the 0.44 and 0.60 integral values at 50 °C and 480 °C (both under 20% O2/He), respectively.

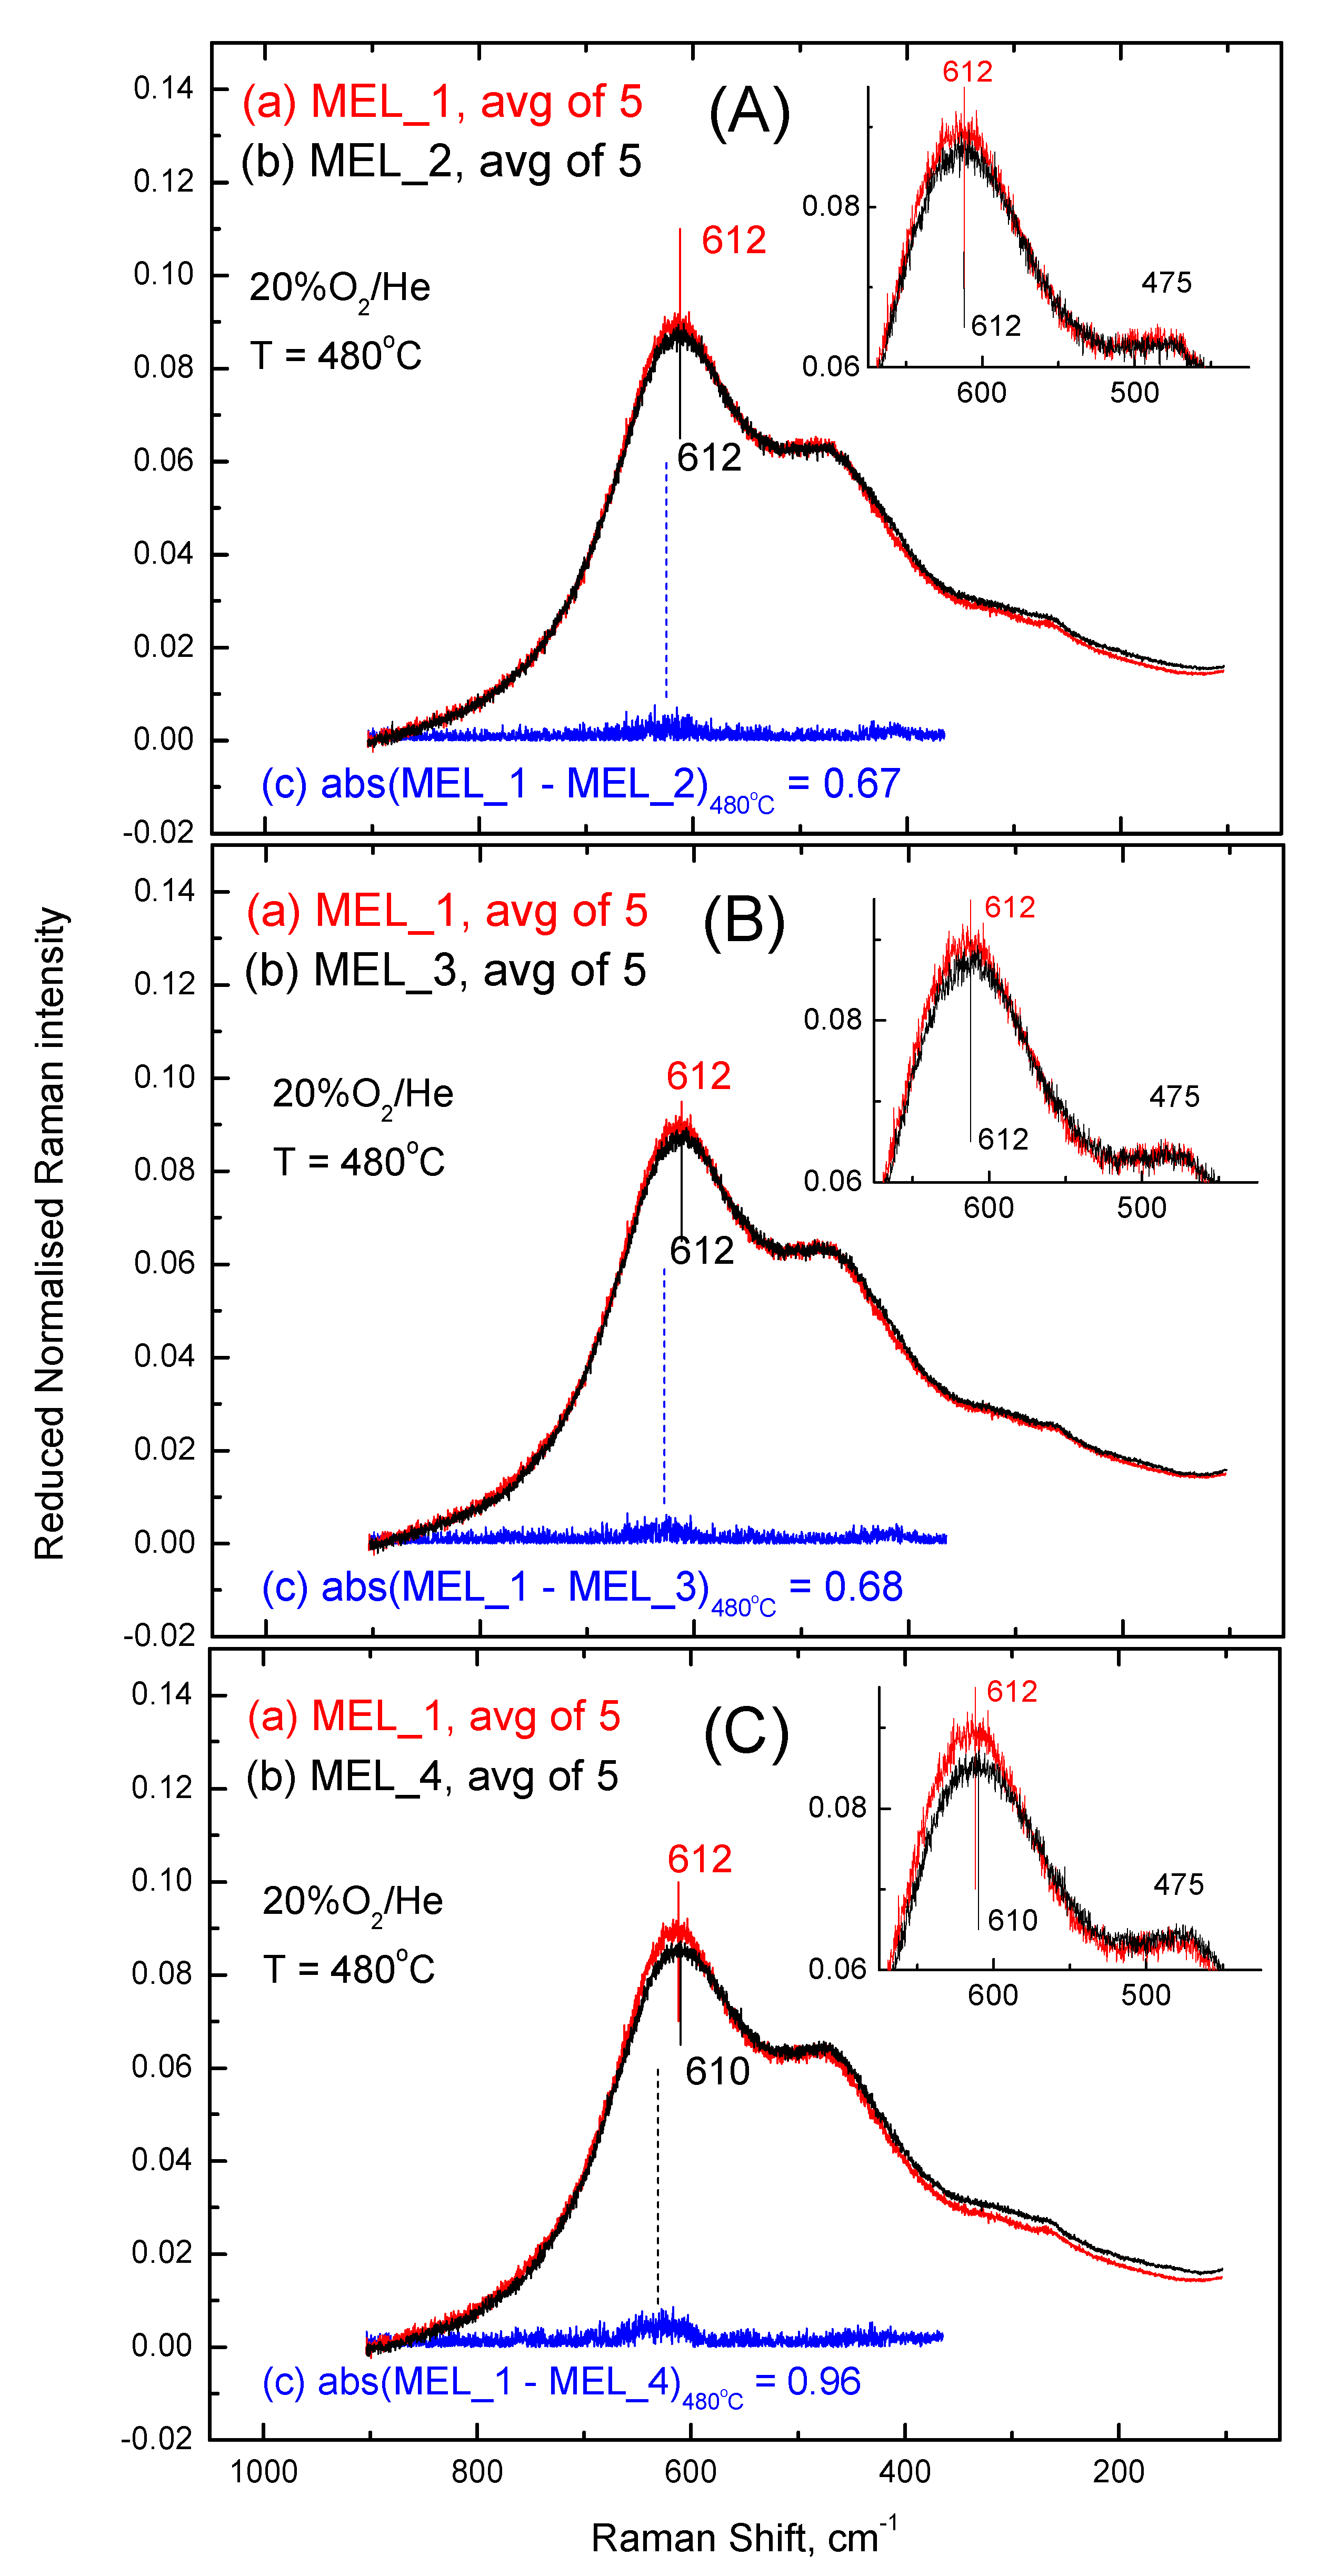
2.4. Comparisons of Anionic Sublattice Structures amongst CexZr1−xO2−δ-Based Materials under O2 Gas Atmosphere at 480 °C and 50 °C

Figure 5 shows the reduced and normalized in situ Raman spectra obtained for samples MEL_i (i = 1–4) under flowing 20% O2/He gas at 480 °C. Since all materials had identical at% composition and were prepared following the same large-scale industrial procedure by slightly varying only one synthesis parameter of the aqueous chemistry (see Section 3.1), the spectra were seemingly identical. Hence, one of the materials (MEL_1) was chosen as the reference and the averaged spectrum obtained for each one of the MEL_i (i = 2–4) solids (based on five recordings, each one with ca. 2 h and 20 min duration) was plotted individually against the counterpart averaged spectrum obtained for MEL_1. The absolute differences determined in each case are shown with the blue traces marked by (c) in panels Figure 5A–C. Moreover, the value of the integral under the absolute difference trace that quantifies the difference is noted in each panel. The insets focus on the 420–680 cm−1 range, where the main strongest Raman bands of structural relevance are featured (Section 2.5).
It is evident that subtle differences amongst the anionic sublattice structure of the examined materials can indeed be discerned. This was manifested in the difference spectra by the appearance of a band feature located at ca. 610 cm−1 where the D band is located, and by the departure of the values obtained for the integrals of the difference spectra (0.67, 0.68, and 0.96 in Figure 5A–C) from the 0.60 average “self-difference” value (see Figure 3 and Figure 4) pertaining to the reference MEL_1 sample. Hence, it turns out that only materials made following the exact preparation procedure with identical synthesis parameters can give rise to “identical” Raman spectra. Notably, the larger (among the observed differences) 0.96 value pertaining to the MEL_1 vs. MEL_4 difference resulted from a commensurately larger variation in the variable parameter of the chemical synthesis route (i.e., the SO42−/Zr4+ ratio that is involved in the coprecipitation step, see Section 3.1).
Figure S1 (Supplementary Materials) shows the respective set of comparisons using spectra obtained at 50 °C under flowing 20% O2/He, following 1 h exposure at 450 °C under the same gas atmosphere.
Table 1 compiles the results obtained using the protocol for data handling and sample comparison described in Section 3.2.3 and Section 3.2.4. Results pertaining to the absolute difference (AD), net absolute difference (NAD) and relative net absolute difference (RNAD) are listed in Table 1.

2.5. Differences in Raman Spectra and Structural Implications

The bands observed in the in situ Raman spectra shown in Figure 5 and Figure S1 were, as expected, suggestive of a t structure for the materials’ phase, which was in agreement with previously presented arguments [10,11,17]. While pure ceria has a fluorite-type cubic structure, c, with an exceptionally simple vibrational structure featuring one single Raman mode (F2g), mixed CexZr1−xO2−δ oxides of intermediate compositions exhibit tetragonal distortions, resulting in six vibrational modes, as previewed by group theory classifications for a tetragonal phase symmetry. Among the tetragonal phases, the so-called t phase displays equal values for its a and c lattice parameters [8,11,24] and prevails in the CexZr1−xO2 system for 0.65 < x < 0.90, but upon decrease of the crystal size and heterovalent doping (RE3+→M4+, M = Ce, Zr; RE = La, Y, Nd), the range of stability of phase t can be extended to a much lower x value than the one expected for large crystals. For the t phase, due to its lack of tetragonality (c/a = 1.0), some of the bands become degenerate and only four bands are detected [11,16,17]. It should be noted that since the cations in the t phase maintain the same matrix positions as in the c cubic phase, it is not trivial to discern the t and c phases by XRD [14,25,26]. The broadness of the main bands at ca. 480 and 610 cm−1 account for the extensive heterocationic (Ce4+→Zr4+) and heterovalent (M4+→RE3+) exchanges leading to lattice deformation, which in turn gives rise to diverse local structures, a rich defect topology, and O atom displacements (e.g., from “ideal” sites to interstitial sites [22]), thereby justifying the observed bands’ broadness. The t phase provides a very good balance of inter alia structural stability, functionality (e.g., oxygen mobility, etc.) and small particle size [9].
We have previously demonstrated [10,18] that the so-called defect (D) Raman band at ca. 610 cm−1 due to M–O modes where the O atoms are in defect sites [10,23,24], is constituted of at least two components (denoted as D1 and D2, [10]), of which the high wavenumber component D1 has been assigned to M–O modes involving O atoms that can be delivered under the applied reducing conditions of 5% H2/He at 480 °C [10,18].
Hence, it turns out that the subtle (but, as shown, experimentally significant) differences observed amongst the studied commercial samples depicted in Figure 5 (and Figure S1) primarily pertain to differences in the respective D bands (at ca. 610 cm−1) (i.e., to variations in the topology involving such O atoms in defect sites and labile O atoms of the material’s lattice). Small variations in the SO42−/Zr4+ ratio in the aqueous chemistry stage of the preparation (see Section 3.1) play a decisive role in the coprecipitation step of cerium–zirconium hydroxides [21], leading to slightly varied defect and vacancy topologies (revealed by the D band) in a manner that in situ Raman spectroscopy is able to capture, in contrast to XRD, which assesses the studied materials as isostructural [14,25,26]. The observed differences in the vacancy and defect topologies is of direct functional relevance, as demonstrated in [20], which was concerned with the differences in transient kinetic rates and characteristics of the 16O/18O exchange via bulk diffusion for the same industrial ceria–zirconia based oxides studied (MEL_1–MEL_4) and the possible origin of the functional (transient kinetic rates) differences from subtle differences in the anionic (oxygen) sub-lattice structure with special emphasis in defects and O vacancies.
In order to further strengthen the above finding, we addressed the redox behavior of the CexZr1−xO2−δ-based examined samples in Figure 6, which shows the effect of switching the gas atmosphere between 20% O2/He and 5% H2/He at 480 °C. Thus, after adequate exposure to attain the steadystate (see Experimental, Section 3.2.2), the in situ Raman spectra were recorded and compiled in Figure 6. The blue trace (marked by (a)) corresponds in each case to the average of five slow-scanning recordings (2 h and 20 min each) at 480 °C under flowing 20% O2/He; the dark green trace (marked by (b)) corresponds to the average of four slow scanning recordings (2 h and 40 min each) at 480 °C under flowing 5% H2/He. Finally, the black trace shows the “O2–H2” difference (marked by (c) in each panel).
As also justified previously in [10], when reducing conditions are applied by flowing 5% H2/He, O atoms are selectively delivered and withdrawn from M–O sites that under oxidizing conditions (20% O2/He) give rise to the high wavenumber D1 component. Hence, in steady state in situ Raman spectra under reducing 5% H2/He gas, the D band is attenuated selectively at its high wavenumber D1 component side and the remainder of the D band (dark green traces (b)) is narrowed from its high wavenumber side. Therefore, the main feature of the difference spectrum (O2–H2) is the fingerprint of the delivered O atoms at the wavenumber of the D1 component, which lies at the high frequency tail side of the D band. Such O atoms are involved in M–O sites, giving rise to the D1 component of the D band under oxidizing conditions and are withdrawn and released under reducing conditions.
In all panels shown in Figure 6, the difference spectra provide the fingerprint of the oxygen that is being delivered in each case. Notably, the spectra obtained under the 20% O2/He and 5% H2/He gas atmospheres that were used to produce the average spectra displayed in Figure 6 were recorded in alternate order by allowing adequate time to attain the steady state (Section 3.2.2) and the spectral features characteristic for each case (band positions and relative intensities) were always fully reinstated.

3. Experimental Methods and Protocols

3.1. Preparation of Materials

The process described in EP1444036 [21] was used for the synthesis of the samples by Luxfer MEL Technologies. The process comprises precipitating a zirconium–cerium mixed hydroxide from an aqueous solution by means of the addition of alkali in the presence of sulfate anions [21]. The sulfate anion, which is introduced in the form of a pertinent compound to an aqueous solution of zirconium salt for the purpose of modifying the precipitation process, is added at a specific proprietary SO42−/Zr4+ ratio with a view to sufficiently modify and control the precipitation step. Four samples (denoted as MEL_1 to MEL_4) with identical chemical composition (40% CeO2, 50% ZrO2 plus traces of HfO2, 4% Nd2O3, 4% La2O3, and 2% Y2O3 on wt% basis) were prepared on a full commercial scale following the EP1444036 route, in which the SO42−/Zr4+ ratio of the wet chemistry differed in increments much less than unity for each sample. The post-preparation processing (i.e., drying and calcination) was identical for all samples. The calcination was performed at 850 °C for 4 h under static air.

3.2. Protocol for In Situ Raman Analysis

3.2.1. General Remarks

The Raman spectra were excited using the 491.5 nm line of a DPSS laser (Cobolt, Sweden) operated at a power level of 20 mW on the sample; the incident beam was slightly defocused by a cylindrical lens to reduce sample irradiance. The scattered light was collected at a 90° in a horizontal scattering plane, analyzed by a 0.85 m Spex 1403 double monochromator and detected by a −20 °C cooled RCA photomultiplier coupled with Labspec software. After recording each spectrum, the eventual drift of the monochromator’s gratings was checked (and corrected) with the aid of a Ne lamp.
Typically, 130–160 mg of each sample were pressed to a wafer. Prior to Raman analysis, each pelletized sample was thermally treated ex situ at 800 °C for 2 h under static air in a muffle furnace in order to bring each sample into a common starting reference state where the hydroxides and/or carbonates that eventually form during sample exposure to the atmosphere were eliminated. The sample was then quickly taken out of the furnace and mounted on the sample holder of a homemade in situ Raman optical cell/reactor, described previously in [27] and treated in situ under flowing (30 cm3/min) 20% O2/He at 450 °C. In order to check/exclude the (unlikely) occurrence of carbonates (CO32−), the recording of the Raman spectra was also extended in the region covering the main band due to carbonate (CO32−) and/or one of the main bands due to carbonato species (1000–1100 cm−1). Notably, the spectral region pertaining to the Raman bands of the oxygen sub-lattice (i.e., 130–900 cm−1) that is relevant for comparing the bulk structural properties of mixed metal oxide solids at the molecular level did not overlap with bands that could originate from the (unlikely) occurrence of surface and/or subsurface hydroxyls. In a separate temperature programmed desorption (TPD) experiment using mass spectrometry (MS), 30 mg of the MEL sample was placed in a quartz micro-reactor and heated in Ar gas flow to 800 °C (30 °C/min). A CO2-TPD trace in the 300–750 °C range was recorded (decomposition of carbonates/bicarbonates to CO2 (g)) as was a H2O-TPD trace (400–750 °C). The sample after this treatment was treated in a 20% O2/He gas mixture at 800 °C for 2 h. During the latter treatment, neither CO2 nor H2O signals were recorded in the MS.

3.2.2. Recording Sequence and Procedures

Each pelletized sample was first treated in situ under 20% O2/He (30 cm3/min) at 450 °C for 2 h and subsequently cooled to 50 °C under a flowing 20% O2/He gas mixture. Once the sample was cooled, Raman spectra were recorded at 50 °C under flowing 20% O2/He by scanning the 150–900 cm−1 region. Recording was repeated five times at a signal accumulation time of 1 s per point ( τ = 1   s ) at increments of 0.25 cm−1 in order to produce an average Raman spectrum. Each sample was then heated in situ (under flowing 20% O2/He) to 275 °C, further treated isothermally for 30 min and subsequently the Raman spectrum was recorded at 275 °C under flowing 20% O2/He. The sample was then heated in situ (under flowing 20% O2/He) to 480 °C and further treated isothermally for 30 min; subsequently, the spectra were recorded at 480 °C under flowing 20% O2/He. The gas flow was then switched to 5% H2/He at the same temperature (480 °C) and the sample was treated for 2 h in situ under flowing 5% H2/He at 480 °C; subsequently, the spectra were recorded at 480 °C under flowing 5% H2/He. It should be noted here that in order to ascertain that a steady state had been achieved under each set of conditions, before structuring the protocol under description, the spectra were recorded twice to confirm the reproducibility at each steady state in each case. The in situ treatments and recording of spectra at 480 °C under oxygen and hydrogen containing gas were repeated on an alternate basis three times in order to produce an average Raman spectrum in each set of conditions with an improved signal-to-noise (S/N) ratio. Due to the inherently lower S/N ratio exhibited by the Raman spectra of the studied materials at elevated temperatures, the spectra at 480 °C were recorded with longer signal accumulation times ( τ = 1.2 1.3   s ) in order for the S/N ratio of the average spectra obtained under flowing 20% O2/He at 50 °C and 480 °C to become commensurate. The lowering of the S/N ratio at elevated temperatures under flowing 20% O2/He is caused by a gradual darkening of the sample color (i.e., from pale yellow to dark yellow). This creates a “path length” effect, which is taken care of through the normalization procedure (see below). Notably, under reducing conditions of flowing 5% H2/He, the sample color became dark green, thereby even further lowering the S/N ratio.
For each sample, after recording the last spectrum under 5% H2/He gas flow at 480 °C, the gas flow was switched to 20% O2/He (480 °C) and the sample was then treated for 30 min in situ under flowing 20% O2/He at 480 °C before a final (fifth) Raman spectrum was recorded under flowing 20% O2/He at 480 °C. Subsequently, the sample was cooled under flowing 20% O2/He to 50 °C and the Raman spectrum was again recorded under flowing 20% O2/He at 50 °C. Thus, an assessment of the temperature evolution of the anionic structure and of the extent of the anionic structure reinstatement after the redox cycling was made for all the samples studied.
The reproducibility of the Raman results was checked by repeating all steps of the above described sequence (i.e., both at 50 °C and 480 °C) on a separately prepared different pellet of sample MEL_1 (chosen as the reference), and furthermore by irradiating a different spot of the pellet before each spectrum recording.
To investigate whether small variations/differences in the anionic sublattice structures among the different samples were significant, specimens from three different industrial lots (made using the same manufacturing conditions with absolutely identical synthesis parameters) of sample MEL_1 were tested by recording in situ Raman spectra under flowing 20% O2/He at 480 °C (i.e., by obtaining a set of five spectra and producing an average spectrum for each specimen of MEL_1 by using the aforementioned signal accumulation times). In addition, a different pellet of sample MEL_1 from one of the three industrial lots was further subjected to measurements at the same conditions (i.e., under flowing 20% O2/He at 480 °C, in order to obtain an independent set of data and compare the reproducibility of one sample with the inter-batch comparison.

3.2.3. Data Handling

Normalized spectra were used for comparing the structural properties of the samples. The procedure is described in Figure S2 (Supplementary Materials). First, the background of each spectrum was zeroed by subtracting a rectangle, thereby zeroing the counts of the high wavenumber tail of the each spectrum. Subsequently, the whole spectrum was divided by the area under the spectrum trace in the 375–900 cm−1 wavenumber range that features the main Raman bands of structural relevance. Normalization is necessary to eliminate the effect of varying “path length” caused by differences in the absorption of incident and scattered light from colored samples.
When comparing spectra with a view to discern subtle differences in the structural properties of materials (e.g., Ce1−xZrxO2-based solids), it is of utmost importance to focus on inherent structural/vibrational effects and disentangle them from temperature-induced effects (e.g., depopulation of ground state, Boltzmann distribution, etc.). Removal of the temperature effect can be achieved by the so-called “reduction” of the normalized spectra [10,28], resulting (due to the boson-like statistical description followed by phonons) in the following expression for the reduced Stokes Raman intensity:
I R S ( ν ˜ ) = ν ˜ ( ν ˜ 0 ν ˜ ) 4 · [ 1 e x p ( h c ν ˜ k Β T ) 1 ] 1 · Ι Μ S ( ν ˜ )
where Ι Μ S ( ν ˜ ) is the normalized measured Stokes Raman intensity at wavenumber ν ˜ ; ν ˜ 0 denotes the laser wavenumber; and h, c, and k Β denote the Planck constant, the velocity of light, and the Boltzmann constant, respectively. Figure S2 (Supplementary Materials) demonstrates the transformation of the temperature dependent in situ Raman spectra obtained for sample MEL_1 from their raw form, where nearly no interpretation can take place, to the “reduced” and normalized forms used to compile Figure 1).

3.2.4. Protocol for Sample Comparisons

In order to illustrate the ability of in situ Raman spectroscopy under flowing 20% O2/He to capture the effect of temperature on the anionic sublattice structure [10] of the studied Ce1−xZrxO2−δ-based solids, comparisons between samples are shown at two temperatures (i.e., at 480 °C and 50 °C). Sample MEL_1 was used as the reference for the comparisons. Reduced (see Section 3.2.3) normalized averaged spectra obtained for sample MEL_1 were compared with corresponding spectra obtained under the same conditions for samples MEL_2–MEL_4. Notably, in order to quantify the differences, the absolute value of the difference spectra was produced in each case and the corresponding integral of the absolute difference was calculated. To this end, it is necessary to also examine the pertinent absolute value of the difference between two independent sets of measurements performed for the reference sample MEL_1 under each set of conditions (i.e., at 480 °C and 50 °C, both under 20% O2/He) obtained from two different pellets of sample MEL_1.
For each average spectrum obtained for sample MEL_i (i = 2, 3, 4) the absolute difference (AD) of the integrated area from the corresponding integrated area of the average spectrum obtained for sample MEL_1 was calculated as follows:
A D 480   ° C = a b s ( MEL _ 1 MEL _ i ) 480   ° C
and   A D 50   ° C = a b s ( MEL _ 1 MEL _ i ) 50   ° C
The accuracy and precision of each measurement set is reflected by the absolute difference between the integrated areas of averaged spectra obtained for two independent sets of spectral data pertaining to the reference sample MEL_1. Thus, the Net Absolute Difference (NAD) can be calculated in each case as:
N A D 480   ° C = a b s ( MEL _ 1 MEL _ i ) 480   ° C a b s ( MEL _ 1 MEL _ 1 r e p r o ) 480   ° C
N A D 50   ° C = a b s ( MEL _ 1 MEL _ i ) 50   ° C a b s ( MEL _ 1 MEL _ 1 r e p r o ) 50   ° C
Moreover, the NADs obtained at 480 °C and 50 °C can be streamlined by dividing each one with the average integral of the MEL_1 spectra (i.e., a v g   ( M E L _ 1   i n t e g r a l ) 480   ° C and a v g   ( M E L _ 1   i n t e g r a l ) 50   ° C , respectively. Thus, the relative net absolute differences (RNAD) can be derived as follows:
R N A D 480   ° C = a b s ( MEL _ 1 MEL _ i ) 480   ° C a b s ( MEL _ 1 MEL _ 1 r e p r o ) 480   ° C a v g ( M E L _ 1 i n t e g r a l ) 480   ° C
and
R N A D 50   ° C = a b s ( MEL _ 1 MEL _ i ) 50   ° C a b s ( MEL _ 1 MEL _ 1 r e p r o ) 50   ° C a v g ( M E L _ 1 i n t e g r a l ) 50   ° C
The values determined for a b s ( MEL _ 1 MEL _ 1 r e p r o ) at 480 °C and 50 °C used in Equations (4)–(7) and the average integrals a v g ( M E L _ 1   i n t e g r a l ) at 480 °C and 50 °C used in Equations (6) and (7) are compiled in Table 1.

4. Conclusions

A carefully structured protocol of measurements using in situ Raman spectroscopy under well-controlled conditions enables subtle differences in the defect and vacancy topologies of the anionic sublattice structure to be discerned among rare earth-doped CexZr1−xO2−δ-based OSC commercial solids prepared on a large scale. A slight variation of one of the synthesis parameters of the aqueous chemistry during preparation of the (RE)CexZr1−xO2−δ solids, namely the SO42−/Zr4+ ratio that is important for controlling the coprecipitation step of cerium–zirconium hydroxide, results in a consistent manner to corresponding variations in the topology of defects and of O atom location within the material matrix that can be captured after following the proposed protocol of in situ Raman measurements. The observed differences pertain to slight variations of the so-called D band (at ca. 610 cm−1), which is very sensitive in O atom position and relocations in defect and/or vacancy sites. The redox conditions used as part of the measurements’ protocol are adequate to activate oxygen release and refill of the studied materials, thereby highlighting the functional relevance of the O atoms, of which the positions in defect and vacancy sites is diversified as a result of the slight variation of one single parameter of the synthesis route.
It is evident that if the industrial scale procedures followed to prepare two lots of CexZr1−xO2−δ-based materials are identical, then based on the proposed protocol of Raman measurements, one can confirm that the structural configuration and defect topology of the resulting solids are identical. Conversely, if the Raman spectra obtained following the protocol of measurements for two solids are identical, very strong evidence is obtained suggesting that the respective preparation procedures are identical. Hence, the proposed protocol can be used as a tool for proving or disproving eventual infringement of Intellectual Property Rights (IPR) pertaining to patented procedures for the commercial production of mixed metal oxide materials.

Supplementary Materials

The following are available online at https://www.mdpi.com/2073-4344/10/4/462/s1, Figure S1: Comparative plots of reduced and normalized in situ Raman spectra obtained under 20% O2/He at 50 °C. (A) MEL_2 vs. MEL_1; (B) MEL_3 vs. MEL_1; (C) MEL_4 vs. MEL_1. Traces (a) pertain to MEL_1; traces (b) pertain to MEL_i (i = 2, 3, 4) as indicated in each panel. Traces (a) and (b) are averages of five recordings. Τraces (c) with blue color in panels (A), (B), and (C) show the absolute difference of traces (a) and (b) under comparison in each case. Recording parameters, see Figure 1 caption, Figure S2 (14 panels): A detailed outline of the raw Raman data handling procedures. The spectrum normalization and “reduction” procedures are demonstrated for the contents of Figure 1.

Author Contributions

Conceptualization, D.H., H.S., and S.B.; Data curation, C.A. and S.B.; Formal analysis, C.A. and S.B.; Funding acquisition, H.S. and S.B.; Investigation, D.H., H.S., and S.B.; Methodology, D.H., H.S., S.B., and A.M.E.; Project administration, H.S. and S.B.; Supervision, S.B.; Validation, S.B.; Writing—original draft, S.B.; Writing—review & editing, S.B. and A.M.E. All authors have read and agreed to the published version of the manuscript.

Funding

This research received no external funding.

Acknowledgments

This study was supported by the project “Materials and Processes for Energy and Environment Applications” (MIS 5002556), which was implemented under the “Action for the Strategic Development on the Research and Technological Sector”, funded by the Operational Program “Competitiveness, Entrepreneurship and Innovation” (NSRF 2014–2020) and co-financed by Greece and the European Union (European Regional Development Fund).

Conflicts of Interest

The authors declare no conflicts of interest.

References

  1. Trovarelli, A.; de Leitenberg, C.; Boaro, M.; Dolcetti, G. The Utilization of ceria in industrial catalysis. Catal. Today 1999, 50, 353–367. [Google Scholar] [CrossRef]
  2. Efstathiou, A.M.; Christou, S.Y. Investigation of the oxygen storage and release kinetics of model and commercial three-way catalytic materials by transient techniques. In Catalysis by Ceria and Related Materials, 2nd ed.; Trovarelli, A., Fornasiero, P., Eds.; Imperial College Press: London, UK, 2013; pp. 139–221. [Google Scholar]
  3. Fu, Q.; Saltsburg, H.; Flytzani-Stephanopoulos, M. Active non-metallic Au and Pt species on ceria-based water-gas shift catalysts. Science 2003, 301, 935–938. [Google Scholar] [CrossRef]
  4. Steele, B.C.H.; Heizel, A. Materials for fuel-cell technologies. Nature 2001, 414, 345–352. [Google Scholar] [CrossRef]
  5. Heck, R.M.; Farrauto, R.J. Catalytic Air Pollution Control: Commercial Technology; John Wiley & Sons: New York, NY, USA, 1995. [Google Scholar]
  6. Di Monte, R.; Kaspar, J. Heterogeneous environmental catalysis–a gentle art: CeO2-ZrO2 mixed oxides as a case history. Catal. Today 2005, 100, 27–35. [Google Scholar] [CrossRef]
  7. Martinez-Arias, A.; Fernandez-Garcia, M.; Belver, C.; Conesa, J.C.; Soria, J. EPR study on oxygen handling properties of ceria, zirconia, and Zr-Ce(1:1) mixed oxide samples. Catal. Lett. 2000, 65, 197–204. [Google Scholar] [CrossRef]
  8. Fornasiero, P.; Balducci, G.; Di Monte, R.; Kaspar, J.; Sergo, V.; Gubitosa, G.; Ferrero, A.; Grazianni, M. Modification of the redox behavior of CeO2 induced by structural doping with ZrO2. J. Catal. 1996, 164, 173–183. [Google Scholar] [CrossRef]
  9. Fernandes-Garcia, M.; Martinez- Arias, A.; Hungria, A.B.; Iglesias-Juez, A.; Conesa, J.C.; Otero, C.; Soria, J. Thermal behavior of (Ce,Zr)Ox/Al2O3 complex oxides prepared by a microemulsion method. Phys. Chem. Chem. Phys. 2002, 4, 2473–2481. [Google Scholar] [CrossRef]
  10. Andriopoulou, C.; Trimpalis, A.; Petallidou, K.C.; Sgoura, A.; Efstathiou, A.M.; Boghosian, S. Structural and redox properties of Ce1-XZrxO2-δ and Ce0.8Zr0.15RE0.05O2-δ (RE: La, Nd, Pr, Y) solids studied by high temperature in situ Raman spectroscopy. J. Phys. Chem. C 2017, 121, 7931–7943. [Google Scholar] [CrossRef]
  11. Yashima, M.; Arashi, H.; Kakihana, M.; Yoshimura, M. Raman scattering study of cubic-tetragonal phase transition in Zr1-xCexO2 solid solution. J. Am. Ceram. Soc. 1994, 77, 1067–1071. [Google Scholar] [CrossRef]
  12. Yashima, M.; Sasaki, S.; Yamaguchi, Y.; Kakihana, M.; Yoshimura, M.; Mori, T. Internal distortion in ZrO2-CeO2 solid solutions: Neutron and high-resolution synchrotron X-ray diffraction study. Appl. Phys. Lett. 1998, 72, 182–184. [Google Scholar] [CrossRef]
  13. Mamontov, E.; Brezny, R.; Koranne, M.; Egami, T. Nanoscale heterogeneities and oxygen storage capacity of Ce0.5Zr0.5O2. J. Phys. Chem. B 2003, 107, 13007–13014. [Google Scholar] [CrossRef]
  14. Zhang, F.; Chen, C.-H.; Hanson, J.C.; Robinson, R.D.; Herman, I.P.; Chan, S.W. Phases in ceria-zirconia binary oxide (1-x)CeO2-xZrO2 nanoparticles: The effect of particle size. J. Am. Ceram. Soc. 2006, 89, 1028–1036. [Google Scholar] [CrossRef]
  15. Kaspar, J.; Fornasiero, P.; Graziani, M. Use of CeO2-based oxides in the three-way catalysis. Catal. Today 1999, 50, 285–298. [Google Scholar] [CrossRef]
  16. Si, R.; Zhang, Y.-W.; Li, S.-J.; Lin, B.-X.; Yan, C.-H. Urea-based hydrothermally derived homogeneous nanostructured Ce1-xZrxO2 (x=0–0.8) solid solutions: A strong correlation between oxygen storage capacity and lattice strain. J. Phys. Chem. B 2004, 108, 12481–12488. [Google Scholar] [CrossRef]
  17. Si, R.; Zhang, Y.-W.; Wang, L.-M.; Li, S.-J.; Lin, B.-X.; Chu, W.-S.; Wu, Z.-Y.; Yan, C.-H. Enhanced thermal stability and oxygen storage capacity for CexZr1-xO2 (x=0.4–0.6) solid solutions by hydrothermally homogeneous doping of trivalent rare earths. J. Phys. Chem. B 2007, 111, 787–794. [Google Scholar]
  18. Ilieva, L.; Petrova, P.; Pantaleo, G.; Zanella, R.; Liotta, L.F.; Georgiev, V.; Boghosian, S.; Kaszkur, Z.; Venezia, A.M.; Tabakova, T. Gold catalysts supported on Y-modified ceria for CO-free hydrogen production via PROX. Appl. Catal. B Environ. 2016, 188, 154–168. [Google Scholar] [CrossRef]
  19. Lykaki, M.; Pachatouridou, E.; Carabineiro, S.A.C.; Iliopoulou, E.; Andriopoulou, C.; Kallithrakas-Kontos, N.; Boghosian, S.; Konsolakis, M. Ceria nanoparticles shape effects on the structural defects and surface chemistry: Implications in CO oxidation by CuO/Ceria Oxides. Appl. Catal. B Environ. 2018, 230, 18–28. [Google Scholar] [CrossRef]
  20. Vasiliades, M.A.; Harris, D.; Stephenson, H.; Boghosian, S.; Efstathiou, A.M. A novel analysis of transient isothermal 18O isotopic Exchange on commercial CexZr1-xO2-based materials. Top. Catal. 2019, 62, 219–226. [Google Scholar] [CrossRef]
  21. Takao, Y.; Norman, C.; Edwards, G. Process for Preparing Zirconium-Cerium-Based Mixed Oxides. U.S. Patent 7,431,910, 7 October 2008. [Google Scholar]
  22. Mamontov, E.; Egami, T.; Brezny, R.; Koranne, M.; Tyagi, S. Lattice defects and oxygen storage capacity of nanocrystalline ceria and ceria-zirconia. J. Phys. Chem. B 2000, 104, 11110–11116. [Google Scholar] [CrossRef]
  23. Wu, Z.; Li, M.; Howe, J.; Meyer, H.M.; Overbury, S.H. Probing defect sites on CeO2 nanocrystals with well-defined strface planes by Raman spectroscopy and O2 absorption. Langmuir 2010, 26, 16595–16606. [Google Scholar] [CrossRef]
  24. Taniguchi, T.; Watanabe, T.; Sugiyama, N.; Subramani, A.K.; Wagata, H.; Matsushita, N.; Yoshimura, M. Identifying defects in ceria-based nanocrystals by UV resonance Raman spectroscopy. J. Phys. Chem. C 2009, 113, 19789–19793. [Google Scholar] [CrossRef]
  25. Yashima, M.; Morimoto, K.; Ishizawa, N.; Yoshimura, M. Zirconia-ceria solid solution synthesis and the temperature-time-trasformation diagram for the 1:1 composition. J. Am. Ceram. Soc. 1993, 76, 1745–1750. [Google Scholar] [CrossRef]
  26. Martinez-Arias, A.; Fernandez-Garcia, M.; Ballesteros, V.; Salamanca, L.N.; Conesa, J.C.; Otero, C.; Soria, J. Characterization of high surface area Zr-Ce (1:1) mixed oxide prepared by the microemulsion method. Langmuir 1999, 15, 4796–4802. [Google Scholar] [CrossRef]
  27. Tsilomelekis, G.; Boghosian, S. On the configuration of MoOx sites on alumina, zirconia, titania and silica. Vibrational properties, molecular structure and vibrational isotope effects. Catal. Sci. Technol. 2013, 3, 1869–1888. [Google Scholar] [CrossRef]
  28. Tsilomelekis, G.; Panagiotou, G.D.; Stathi, P.; Kalampounias, A.G.; Bourikas, K.; Kordulis, C.; Deligiannakis, Y.; Boghosian, S.; Lycourghiotis, A. Molybdena Deposited on Titania by Equilibrium Deposition Filtration: Evolution of the Structural Configuration of Oxo-Molybdenum (VI) Sites with Temperature. Phys. Chem. Chem. Phys. 2016, 18, 23980–23989. [Google Scholar] [CrossRef]
Figure 1. Evolution of in situ reduced and normalized sequential Raman spectra obtained for the MEL_1 material at (a) 50 °C under 20% O2/He after 2 h treatment at 450 °C, showing the standard deviation of five sequential recordings; (b) 275 °C under 20% O2/He; (c) 480 °C under 20% O2/He; (d) 480 °C under 5% H2/He; and (e) reinstatement at 50 °C under 20% O2/He after 30 min treatment at 480 °C. Laser wavelength, λ0 = 491.5 nm; laser power, w = 15 mW; spectral slit width, ssw = 6 cm−1, time constant, τ = 1.0–1.3 s (see Section 3.2.2).
Catalysts 10 00462 g001
Figure 2. Reduced and normalized in situ Raman spectra obtained for two specimens of the same lot of the MEL_1 material under 20% O2/He at 50 °C after 2 h treatment at 450 °C. (a) Average of five sequential recordings for MEL_1; (b) average of five sequential recordings for MEL_1repro; (c) absolute difference of traces (a) and (b). The 0.44 value corresponds to the integral under trace (c). Recording parameters, see Figure 1 caption.
Catalysts 10 00462 g002
Figure 3. Reduced and normalized in situ Raman spectra obtained for two specimens of the same lot of the MEL_1 material under 20% O2/He at 480 °C. (a) Average of five sequential recordings for MEL_1; (b) average of five sequential recordings for MEL_1repro; (c) absolute difference of traces (a) and (b). The 0.61 value corresponds to the integral under trace (c). Recording parameters, see Figure 1 caption.
Catalysts 10 00462 g003
Figure 4. Inter-batch comparison of reduced and normalized in situ Raman spectra obtained for specimens of MEL_1 material from three different industrial lots under 20% O2/He at 480 °C. (A) MEL_1 vs. MEL_1b; (B) MEL_1 vs. MEL_1c; (C) MEL_1b vs. MEL_1c. All traces shown are the averages of five recordings. Traces (c) with blue color in panels (AC) show the absolute difference of the spectra under comparison in each case. The 0.58, 0.62, and 0.58 values correspond to the integrals under each trace (c).
Catalysts 10 00462 g004
Figure 5. Comparative plots of reduced and normalized in situ Raman spectra obtained under 20% O2/He at 480 °C. (A) MEL_2 vs. MEL_1; (B) MEL_3 vs. MEL_1; (C) MEL_4 vs. MEL_1. Traces (a) pertain to MEL_1; traces (b) pertain to MEL_i (i = 2, 3, 4) as indicated in each panel. Traces (a) and (b) are the averages of five recordings. Τraces (c) with blue color in panels (AC) show the absolute difference of traces (a) and (b) under comparison in each case and the 0.67, 0.68, and 0.96 values correspond to the integrals under each trace (c). Recording parameters, see Figure 1 caption.
Catalysts 10 00462 g005
Figure 6. Sequential reduced and normalized in situ Raman spectra obtained at 480 °C for (A) MEL_1; (B) MEL_2; (C) MEL_3; and (D) MEL_4. Traces (a) are the averages of five recordings under flowing 20% O2/He; traces (b) are the averages of four recordings under flowing 5% H2/He. Spectra under oxidizing and reducing gas atmosphere are recorded on alternate order. Traces (c) were obtained in each case after subtracting trace (b) obtained under H2 gas from the corresponding trace (a) obtained under O2 gas. Recording parameters, see Figure 1 caption.
Catalysts 10 00462 g006
Table 1. (A) Integrated absolute differences (AD), net absolute differences (NAD), and relative net absolute differences (RNAD) amongst the commercial rare earth doped CexZr1-xO2-δ-based MEL_i (i = 1–4) solid materials based on their respective in situ Raman spectra obtained under 20% O2/He gas atmosphere at temperatures of 480 and 50 °C. Reference experimental data pertaining to sample MEL_1 were used for calculating the NAD and RNAD (see Section 3.2.4). (B) Reference experimental data pertaining to sample MEL_1 used for calculating the NAD and RNAD (see Section 3.2.4):
(A)
abs(MEL_1–MEL_i)480 °C50 °C
Integrated Absolute DifferencesIntegrated Absolute Difference (AD)Net Absolute Difference (NAD)Relative Net Absolute Difference (RNAD)Integrated Absolute Difference (AD)Net Absolute Difference (NAD)Relative Net Absolute Difference (RNAD)
abs(MEL_2–MEL_1)0.670.07 (1)0.0030 (2)0.520.08 (3)0.0025 (4)
abs(MEL_3–MEL_1)0.680.080.00350.510.070.0022
abs(MEL_4–MEL_1)0.960.360.01550.690.250.0078
(B)
(a) abs ( MEL _ 1 - MEL _ 1 rep ) 480   ° C , O 2 = 0.60
(b) abs ( MEL _ 1 - MEL _ 1 rep ) 50   ° C , O 2 = 0.44
(c) avg ( Integral ) MEL _ 1 ,   480   ° C , O 2 = 23.21
(d) avg ( Integral ) MEL _ 1 ,   50   ° C , O 2 = 31.90
(1)–(4) Calculation examples:
(1) 
N A D 480 ° C , O 2 = abs ( MEL _ 2 MEL _ 1 ) 480 ° C , O 2 abs ( MEL _ 1 MEL _ 1 rep ) 480 ° C , O 2 = 0.67 0.60 = 0.07
(2) 
  R N A D 480 ° C , O 2 = abs ( MEL _ 2 MEL _ 1 ) 480 ° C , O 2 abs ( MEL _ 1 MEL _ 1 rep ) 480 ° C , O 2 avg ( Integral ) MEL _ 1 , 480 ° C , O 2 = 0.67 0.60 23.21 = 0.0030  
(3) 
N A D 50 ° C , O 2 = abs ( MEL _ 2 MEL _ 1 ) 50 ° C , O 2 abs ( MEL _ 1 MEL _ 1 rep ) 50 ° C , O 2 = 0.52 0.44 = 0.08
(4) 
  R N A D 50 ° C , O 2 = abs ( MEL _ 2 MEL _ 1 ) 50 ° C , O 2 abs ( MEL _ 1 MEL _ 1 rep ) 50 ° C , O 2 avg ( Integral ) MEL _ 1 , 50   ° C , O 2 = 0.52 0.44 31.90 = 0.0025

