Article

Adsorption and Photocatalytic Study of Phenol Using Composites of Activated Carbon Prepared from Onion Leaves (Allium fistulosum) and Metallic Oxides (ZnO and TiO2)

by
Diego Felipe Hernández-Barreto
1,
Jenny Paola Rodriguez-Estupiñán
1,*,
Juan Carlos Moreno-Piraján
1,*,
Rocío Sierra Ramírez
2 and
Liliana Giraldo
3
1
Facultad de Ciencias, Departamento de Química, Universidad de los Andes, Bogotá 111711, Colombia
2
Facultad de Ingeniería, Departamento de Ingeniería Química, Universidad de los Andes, Bogotá 111711, Colombia
3
Facultad de Ciencias, Departamento de Química, Universidad Nacional de Colombia, Bogotá 111711, Colombia
*
Authors to whom correspondence should be addressed.
Catalysts 2020, 10(5), 574; https://doi.org/10.3390/catal10050574
Submission received: 20 April 2020 / Revised: 11 May 2020 / Accepted: 13 May 2020 / Published: 20 May 2020
(This article belongs to the Special Issue Photocatalytic Degradation of Organic Wastes in Water)

Abstract

:
The aim of this study was to evaluate and compare the adsorption and photocatalytic activity of activated carbon-based photocatalysts. Titanium dioxide (TiO2) and zinc oxide (ZnO) were chosen as semiconductors to prepare composites with activated carbon by the wet impregnation method. Activated carbon was prepared using as starting material onion leaves (Allium fistulosum) and as activating agent phosphoric acid (H3PO4). Photooxidation and batch adsorption of phenol was studied to compare the efficiency of the materials prepared. The results showed that the composite AC–TiO2 has a greater photocatalytic activity and a better adsorption capacity compared to AC–ZnO composite.

1. Introduction

Colombia is a country characterized by its extensive agricultural activity. A very common and important vegetable in Colombian diet and cuisine is onion (Allium fistulosum). It is known as “cebolla junca” or “cebolla larga”, and it is principally produced in the Department of Boyacá. According to the National Administrative Department of Statistics (DANE), in 2014 more than 200 thousand tons were produced in Boyacá, which means around 70% of the total production in Colombia during that year [1]. In general, the plant is composed of roots, stem and leaves, but only the stem is used for cooking. Consequently, the leaves and roots are discarded, generating big amounts of waste, since they represent 25–30% of the weight of the plant. That means that these residues have a waste-to-product potential that must be exploited. One way to take advantage of that potential is to use it as a precursor of carbonaceous materials such as activated carbon.
Activated carbons (AC) are versatile materials that are widely studied due to their striking characteristics such as high surface areas, high adsorption potential, specific surface properties, thermal stability, mechanical and electrical properties, low acid/base reactivity, and controllable pore structure [2]. Another important characteristic is that they are usually obtained from wastes that come from different sources. Lignocellulosic biomass such as fruit shell [3], seeds [4], leaves [5], bagasse [6], peels [7], and other forestry and agricultural byproducts [8] are the most common raw materials for activated carbon preparation. However, there are other starting materials that have been studied like tire rubber [9], animal bones [10], and different types of coal [11]. Two processes are commonly used to prepare AC, namely physical and chemical activation, the latter being the method that allows better porosity [12]. In physical activation, the raw material is gasified by an oxidant atmosphere at high temperature and pressure, while in chemical activation, the precursor is impregnated with a chemical agent (e.g., H3PO4, ZnCl2, KOH), followed by activation at medium-high temperatures [13]. AC are mainly used as adsorbent in water treatment, in gas separation–purification processes [14], and in energy storage [15].
In resent research, the application of AC mainly as support material for heterogeneous catalysis has been reported [16,17,18]. Due to its high surface area, it enhances dispersion and minimizes sintering of catalysts, resulting in higher catalytic efficiencies. Photocatalysis is a photoinduced reaction in which a semiconductor (catalyst) is irradiated with UV–Vis light to produce reactive oxygen species (ROS) that can oxidize other molecules [19]. Therefore, this type of catalysis has attracted widespread attention due to its potential to degrade water pollutants. One of the most popular photocatalysts is titanium dioxide (TiO2), which is categorized as a n-type semiconductor [20]. In addition, zinc oxide (ZnO) is also a very common semiconductor used in photocatalysis. Both materials have important characteristics such as high stability, low cost, non-toxicity, similar band gap, and high photocatalytic activity [21]. However, there are some drawbacks to using these materials, such as high recombination rates of electron–hole pairs, and the difficulty in recovery from water after treatment, due to its small particle size (25–30 nm) [22]. As a consequence, recent research has focused on new methodologies to solve this problem, synthesizing composites with materials like graphene [23,24], metal–organic frameworks [25,26], hydroxyapatite [27,28] and activated carbon [29,30]. Some studies have shown that a remarkable synergy is achieved between adsorption and photocatalysis in water pollutant removal [31].
Another new carbon-based material is graphene and its derivatives. Graphene is directly related to graphite in that graphite is composed of many graphene layers. The term “graphene” is normally used for single layer materials, but also for graphene with a few layers. Both are carbon allotropes, characterized by an hexagonal lattice arrangement, composed of sp2 hybridized carbon atoms [32]. This implies that carbon atoms are connected to each other by σ bonds formed by electrons in valence orbitals (2s, 2px, and 2py) [33]. This material exhibits novel properties, such as huge specific surface area, high mechanical strength, thermal conductivity, and excellent electronic properties [34]. The interesting electronic properties of graphene can be attributed to the fourth valence electron of carbon atoms, which is in the 2pz orbital. This orbital is oriented perpendicular to σ bonds, and it can overlap with other 2pz orbitals of neighboring atoms, resulting in delocalized π and π* bands [33]. As for the applications of graphene, it is widely used as a supercapacitor [35], in photo and optoelectronic devices [36], in wastewater treatment [37], in gas storage [38], and in photocatalysis [24], among others. Some graphene modifications and derivatives have been synthetized to improve its performance in different fields. For example, graphitic carbon nitride (g-C3N4) has been used as an efficient photocatalyst for hydrogen production and other environmental applications [39,40] due to its low cost, environmental nontoxic precursors, narrow band gap, and chemical and thermal stability.
Considering the waste-to-product potential of onion leaves, activated carbon was prepared using this lignocellulosic biomass as starting material. The AC was then used to obtain composites with TiO2 and ZnO (AC–TiO2 and AC–ZnO, respectively) by the wet impregnation method. Adsorption and photocatalytic activity were studied and compared, evaluating phenol removal and photooxidation in aqueous media. In addition, a bibliography review was made to compare the results obtained with those obtained by other authors that use graphene and its derivatives as adsorbent and photocatalyst for phenol removal.

2. Results and Discussion

2.1. Characterization of Materials

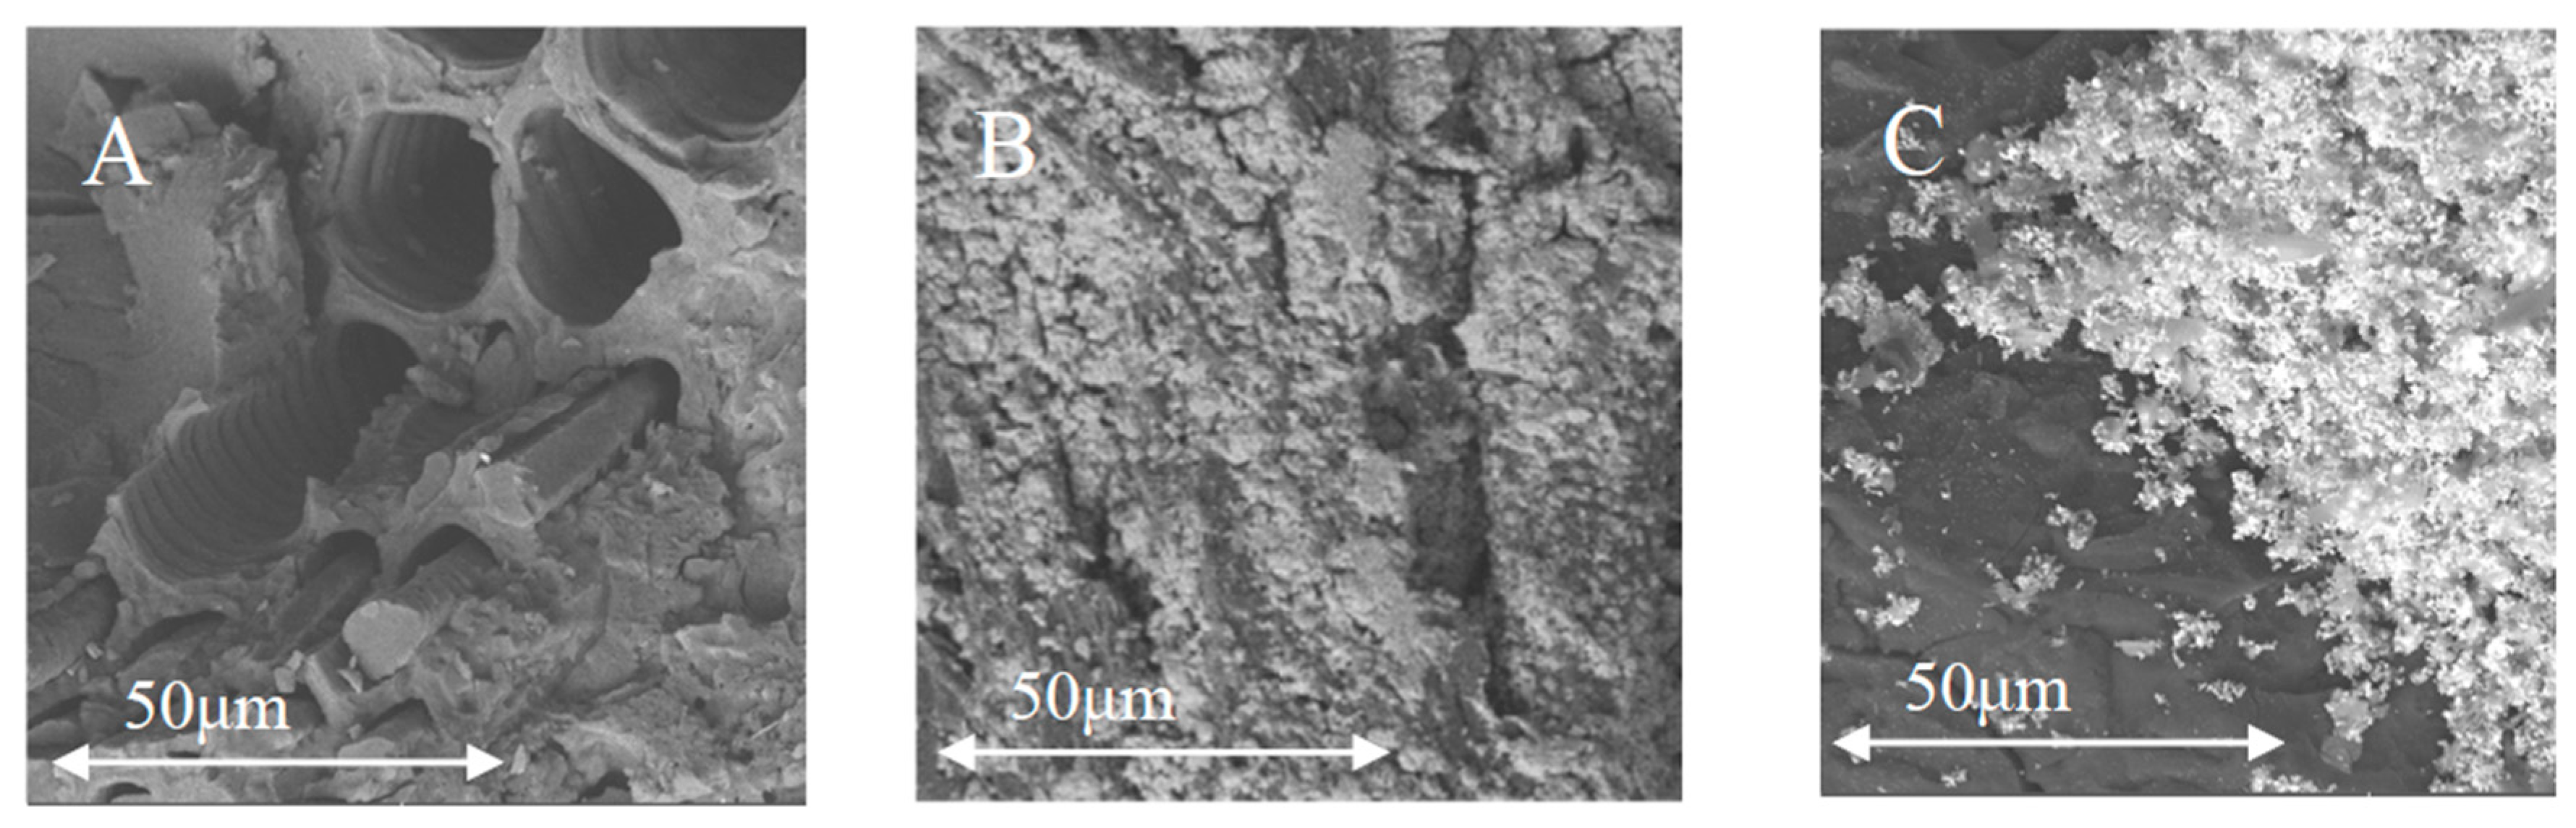
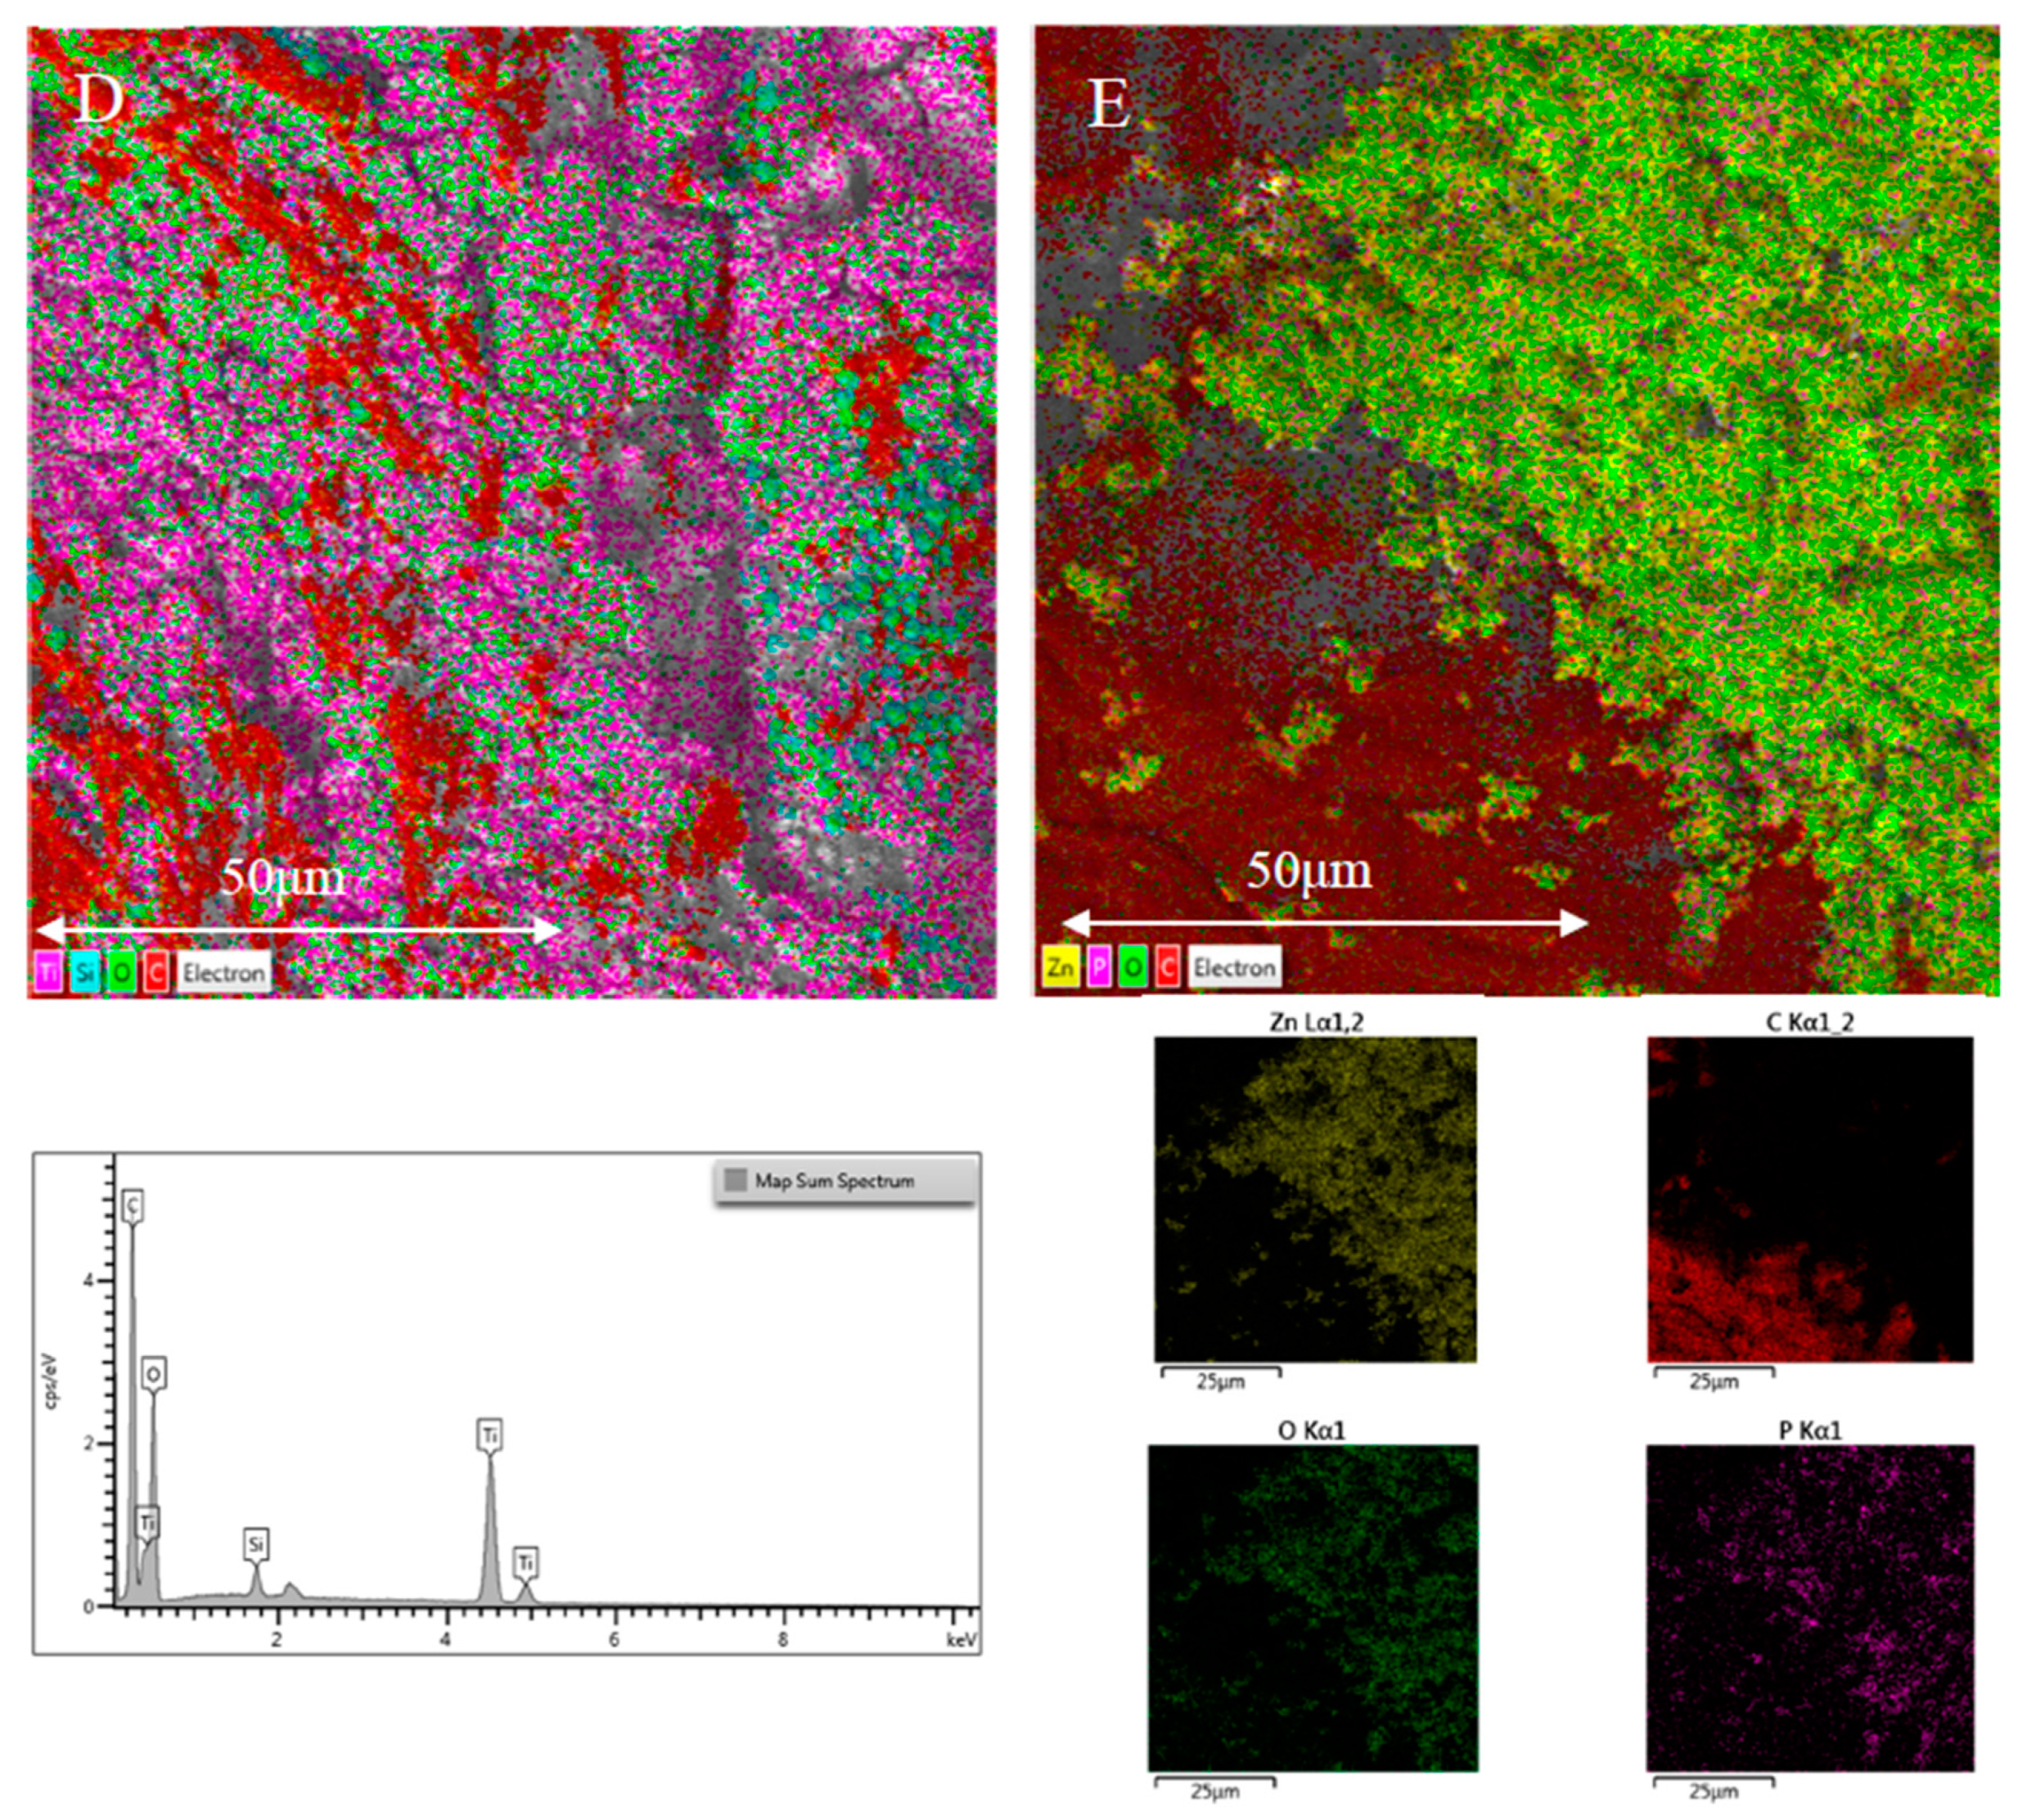
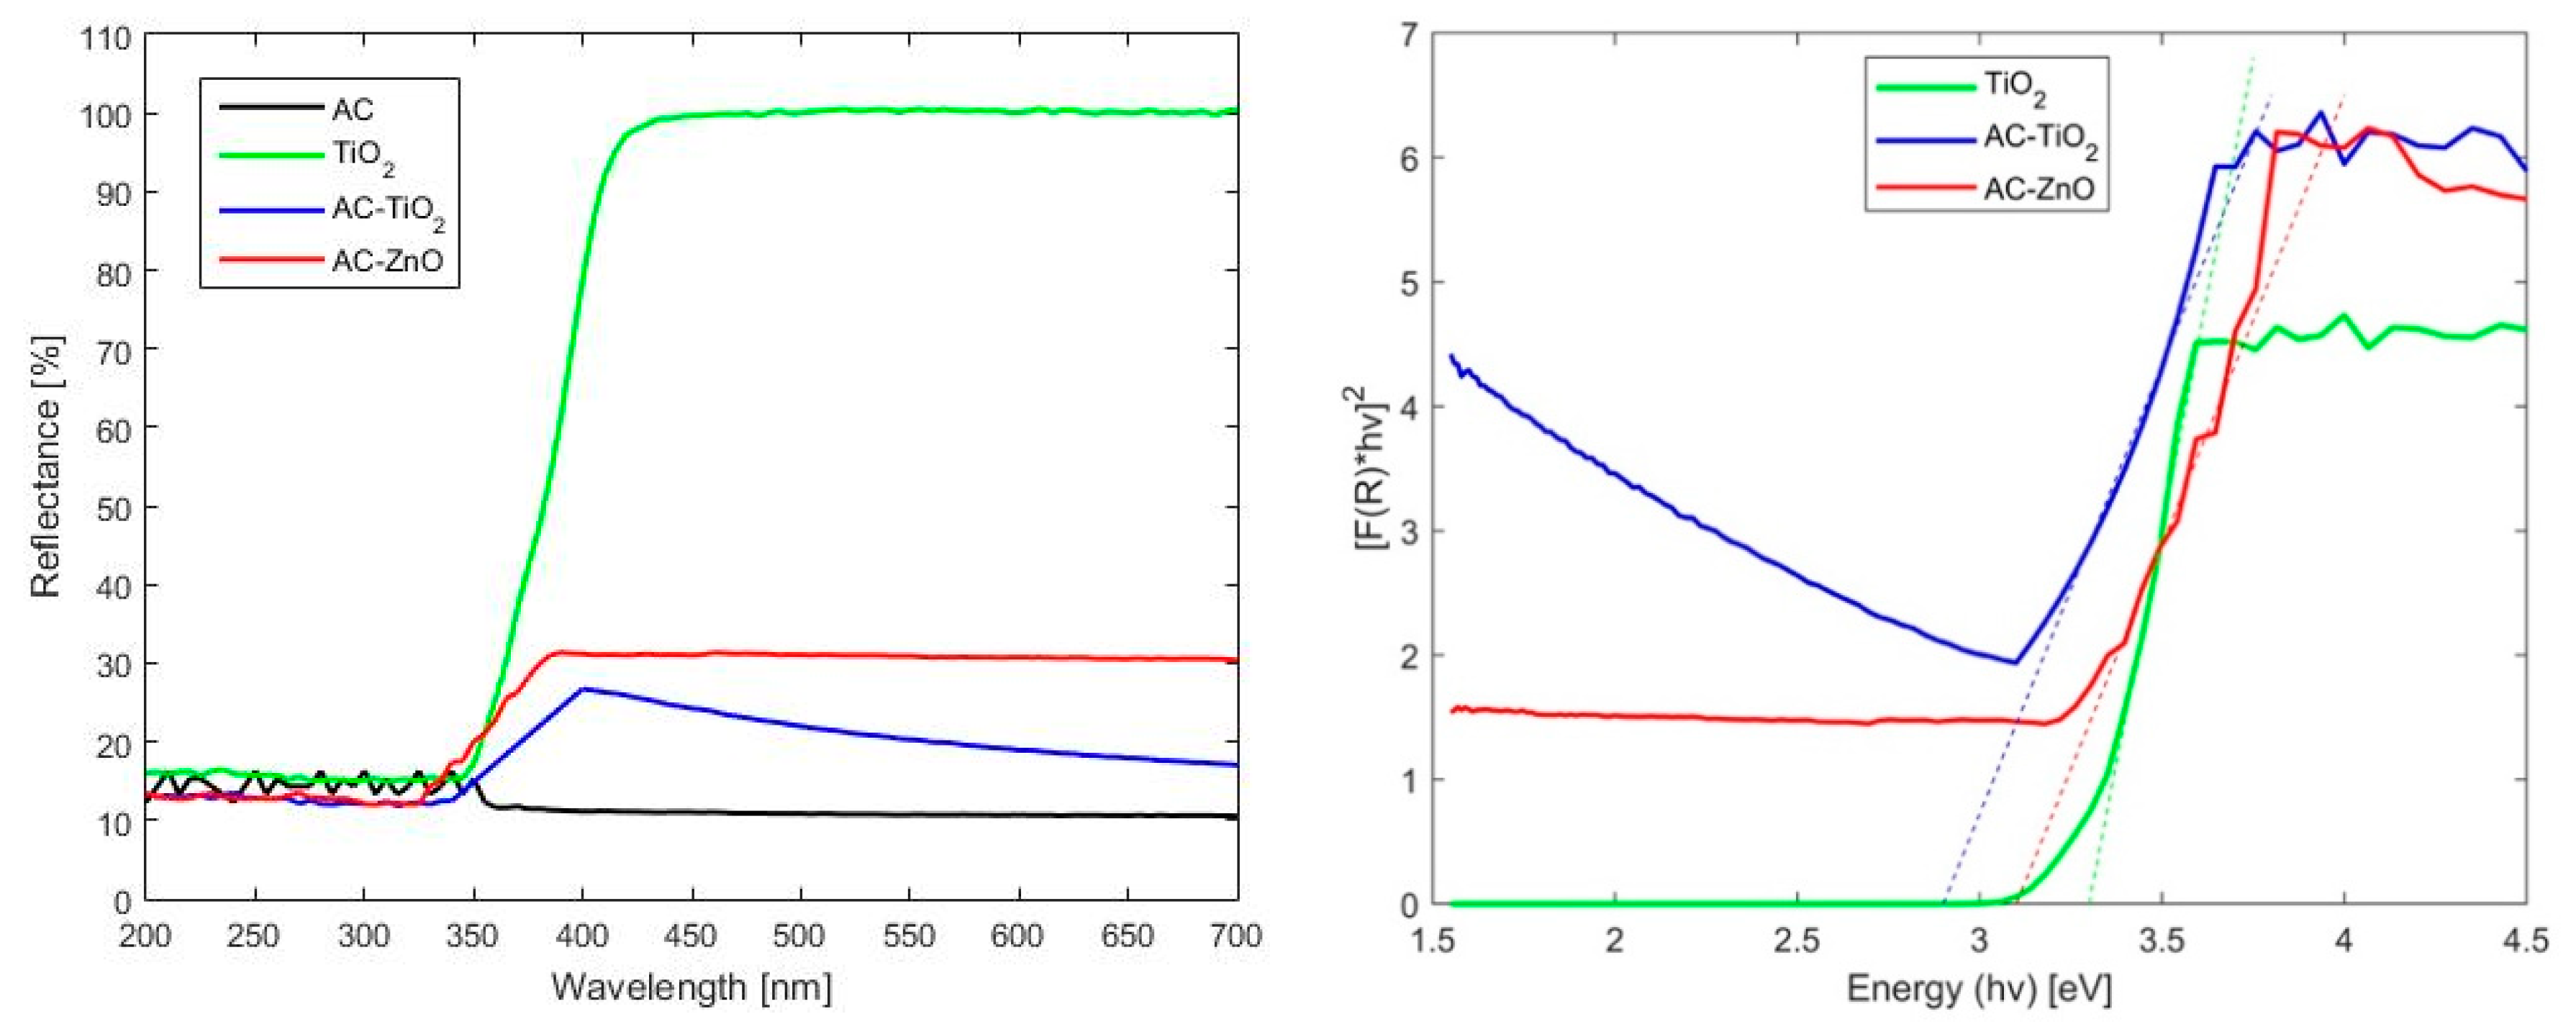
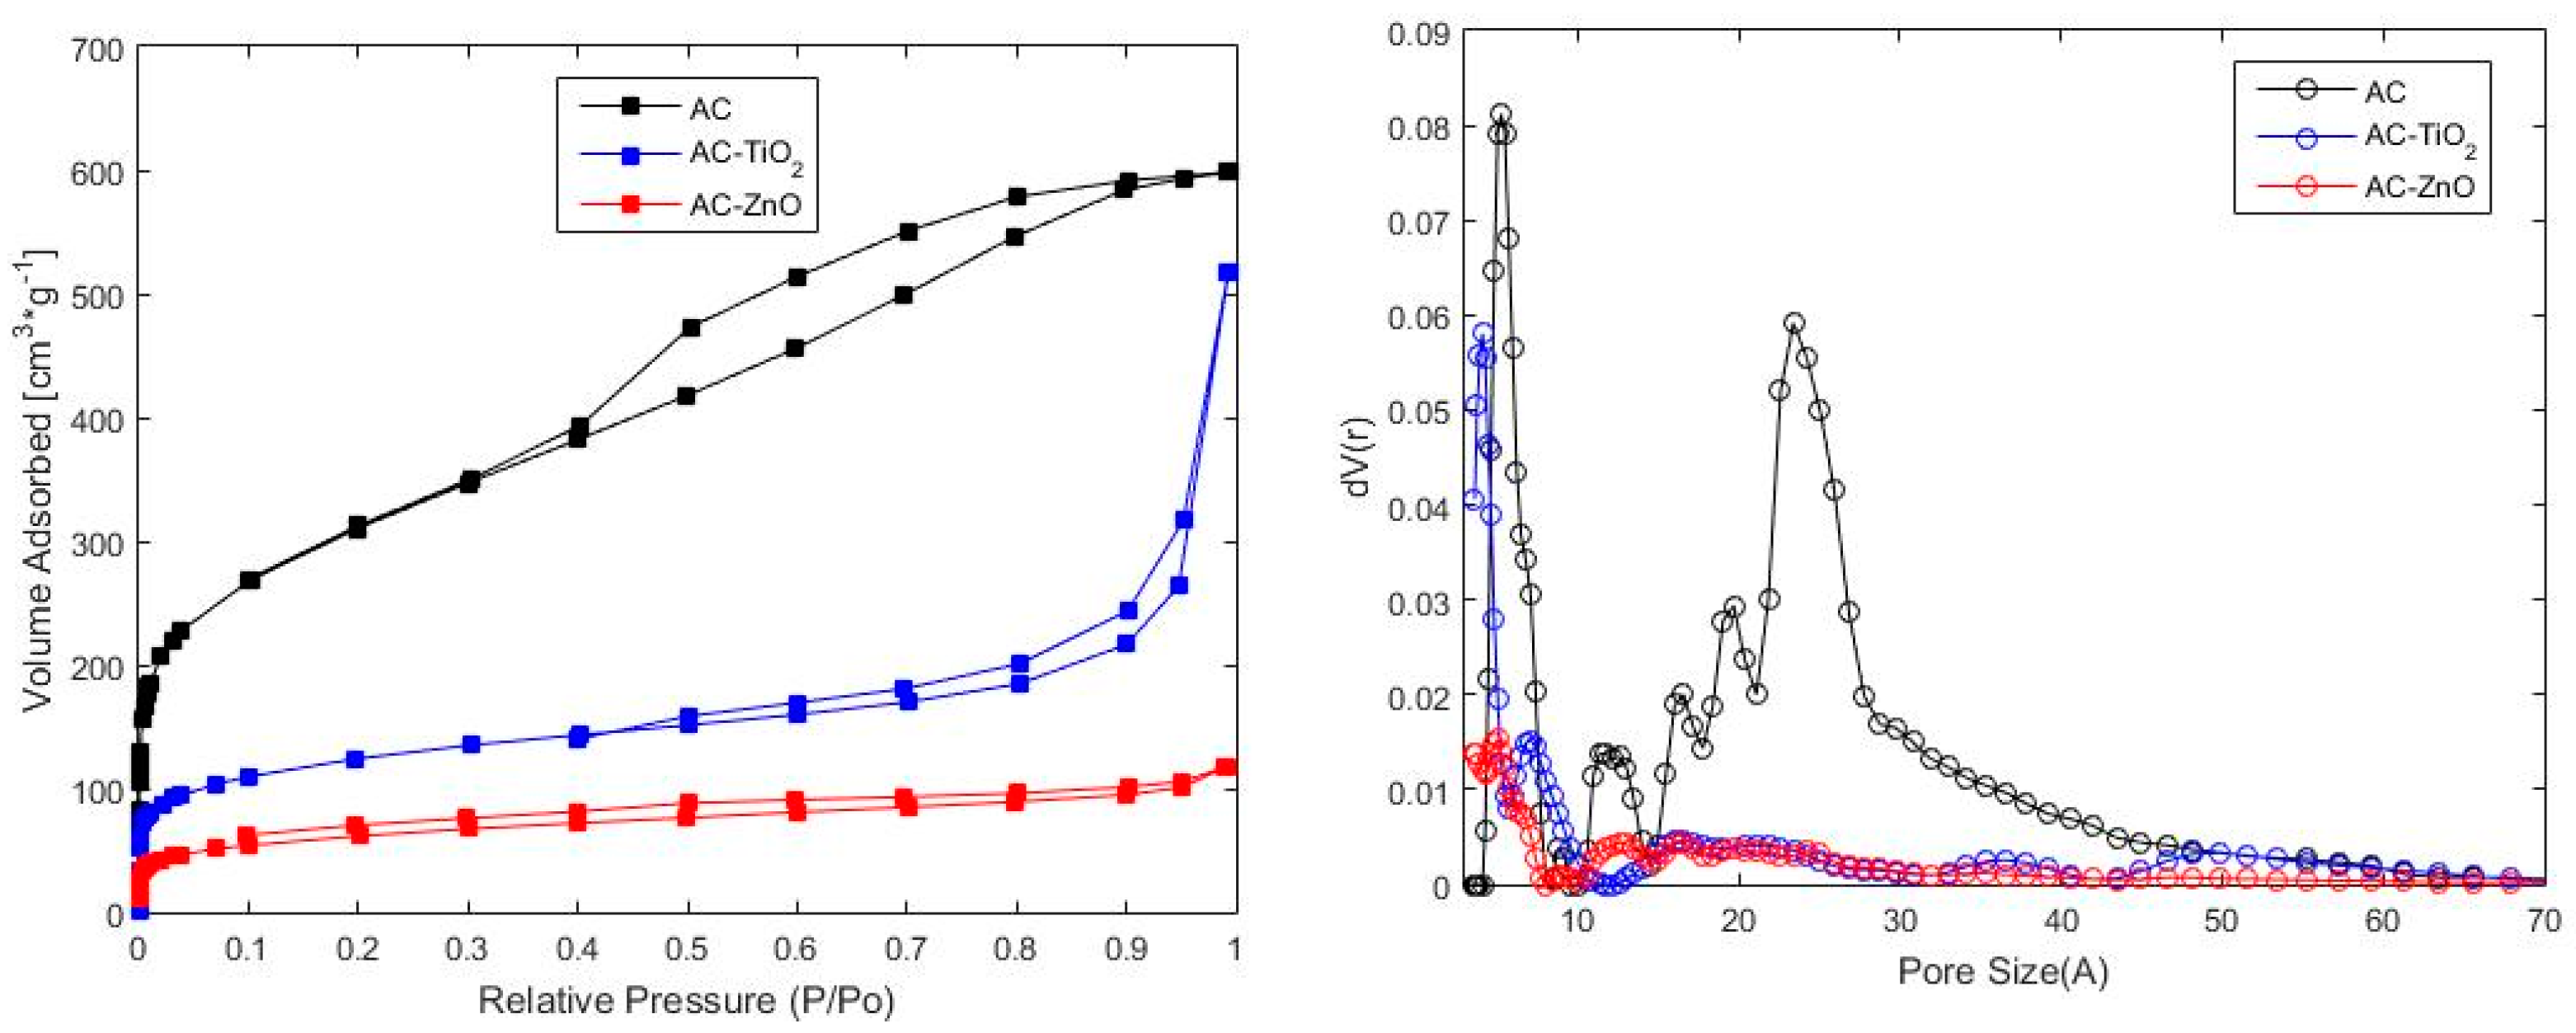
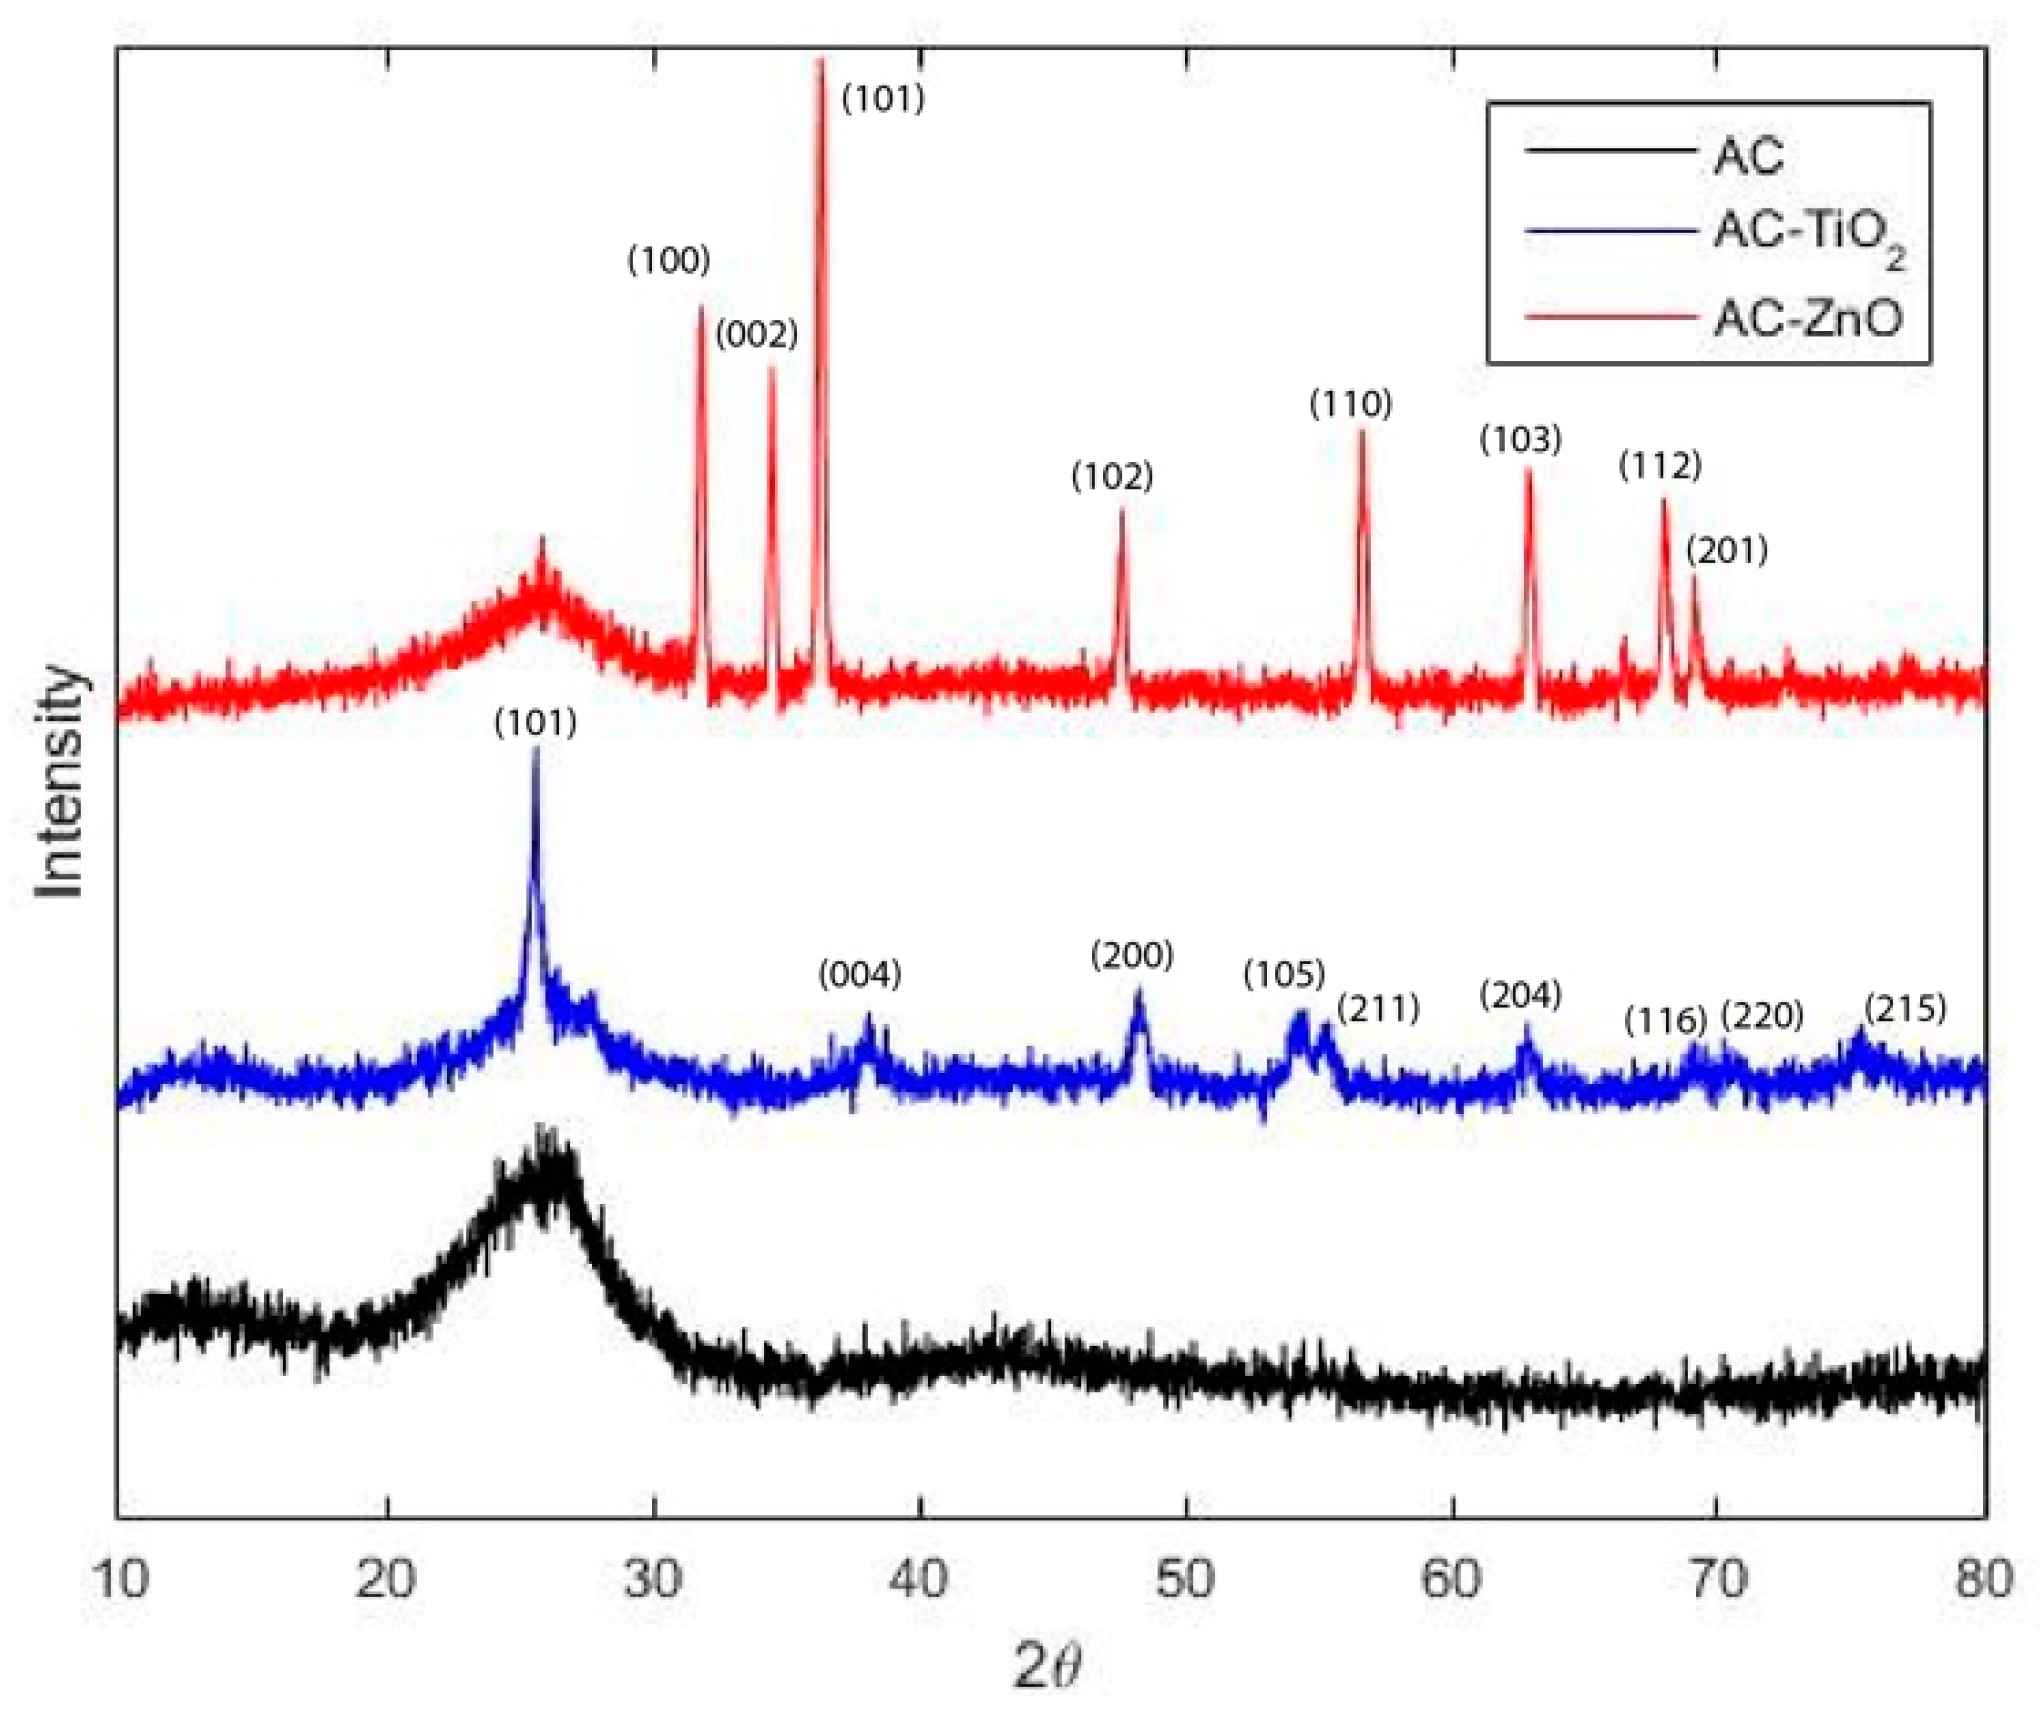
2.1.1. Physical Characterization

Nitrogen physisorption isotherms (77 K) of the three materials (AC, AC–TiO2, and AC–ZnO) are presented in Figure 1. As can be seen, the AC isotherm showed a hysteresis loop so it could be classified as a type IVa isotherm. According to IUPAC [41], this indicates the presence of capillary condensation and thus, mesoporosity in the carbon structure. As it could be observed, composite isotherms presented a different shape and were classified as Type II isotherms. Changes in the shape of the isotherms reflected changes in textural and structural properties of the AC after TiO2 and ZnO incorporation. Loss of the hysteresis loop is notorious and is due to mesoporous filling with metal oxides after impregnation. To study textural and structural characteristics of the solids, mathematical models were applied to raw adsorption data, such as Brunauer–Emmet–Teller (BET) and quenched solid density functional theory (QSDFT).
The pore size distribution (PSD) of each material is presented in Figure 1. PSDs were obtained by the QSDFT method assuming slit–cylindrical pore geometry. Mesoporosity was contained in AC (20–50 Å) and it also presented a microporous structure, mainly between 5 and 15 Å. Meanwhile, composites presented mostly micropores (<20 Å) and a few mesopores, indicating that mesopores in pristine AC were filled by metallic oxides, leaving only a microporous structure that was also partially occupied. In addition, a decrease in BET specific surface area and pore volume (Table 1) showed that, in fact, there was pore filling in the carbon structure. According to these results, it is possible to predict that the AC will present a higher adsorption capacity.
In Figure 2, powder X-ray diffraction (PXRD) results are presented. There was no presence of diffraction peaks in the AC diffractogram due to its amorphous structure. However, a thick band appeared between 22 and 30°, distinctive of the graphite turbostratic structure present in AC [42]. Conversely, diffractions peaks appeared in AC–TiO2 and AC–ZnO diffractograms as a result of the crystalline structure of the semiconductors impregnated over the AC surface. Diffraction peaks obtained were in agreement with those reported in the literature for anatase–rutile and wurtzite, which are the most stable and common crystalline phases of TiO2 and ZnO, respectively [43,44,45]. It is important to point out that the raw titanium dioxide used had a molar anatase:rutile ratio of 1.7:0.3, which means that diffraction peaks of both crystalline phases were present in the diffractogram. For example, planes like (1 0 1), (0 0 4), (2 0 0), (1 0 5), (2 1 1), and (2 0 4) corresponded to the anatase phase, while (2 0 0), (2 2 0), (1 1 6), and (2 1 5) were ascribed to rutile [20,46]. In addition, photocatalytic activity is commonly attributed to anatase, hence the interest in using TiO2 rich in this crystalline phase. On the other hand, the hexagonal wurtzite crystal phase presented peaks at 2θ = 31.8°, 34.3°, 36.5°, 47.3°, 56.5°, 62.8°, 68.3°, and 69.8°, which were indexed with their crystalline planes, respectively, according to the literature [21,47].
SEM micrographs are presented in Figure 3. A macropore channel network was observed in the AC structure (Figure 3A). In contrast, there was no presence of those channels in either of the composites, owing to metallic oxide deposition over the AC surface. It was possible to see some white and greyish zones in the composites micrographs, indicating surface heterogenicity (Figure 3B,C). The clearer regions corresponded to atoms with higher atomic number, since they scattered more electrons back towards the detector (BSE). In addition, the elements present in each one of the surfaces were identified carrying out an EDS mapping (Figure 3D,E). As expected, zinc and titanium atoms were found specifically in the brighter regions of the micrographs, proving that heavier atoms (Zn, Ti) scattered more electrons than the lighter ones. This was confirmed by EDS mapping and a map sum spectrum of each composite, in which the presence of each metal (Ti and Zn) was detected in each composite, respectively.

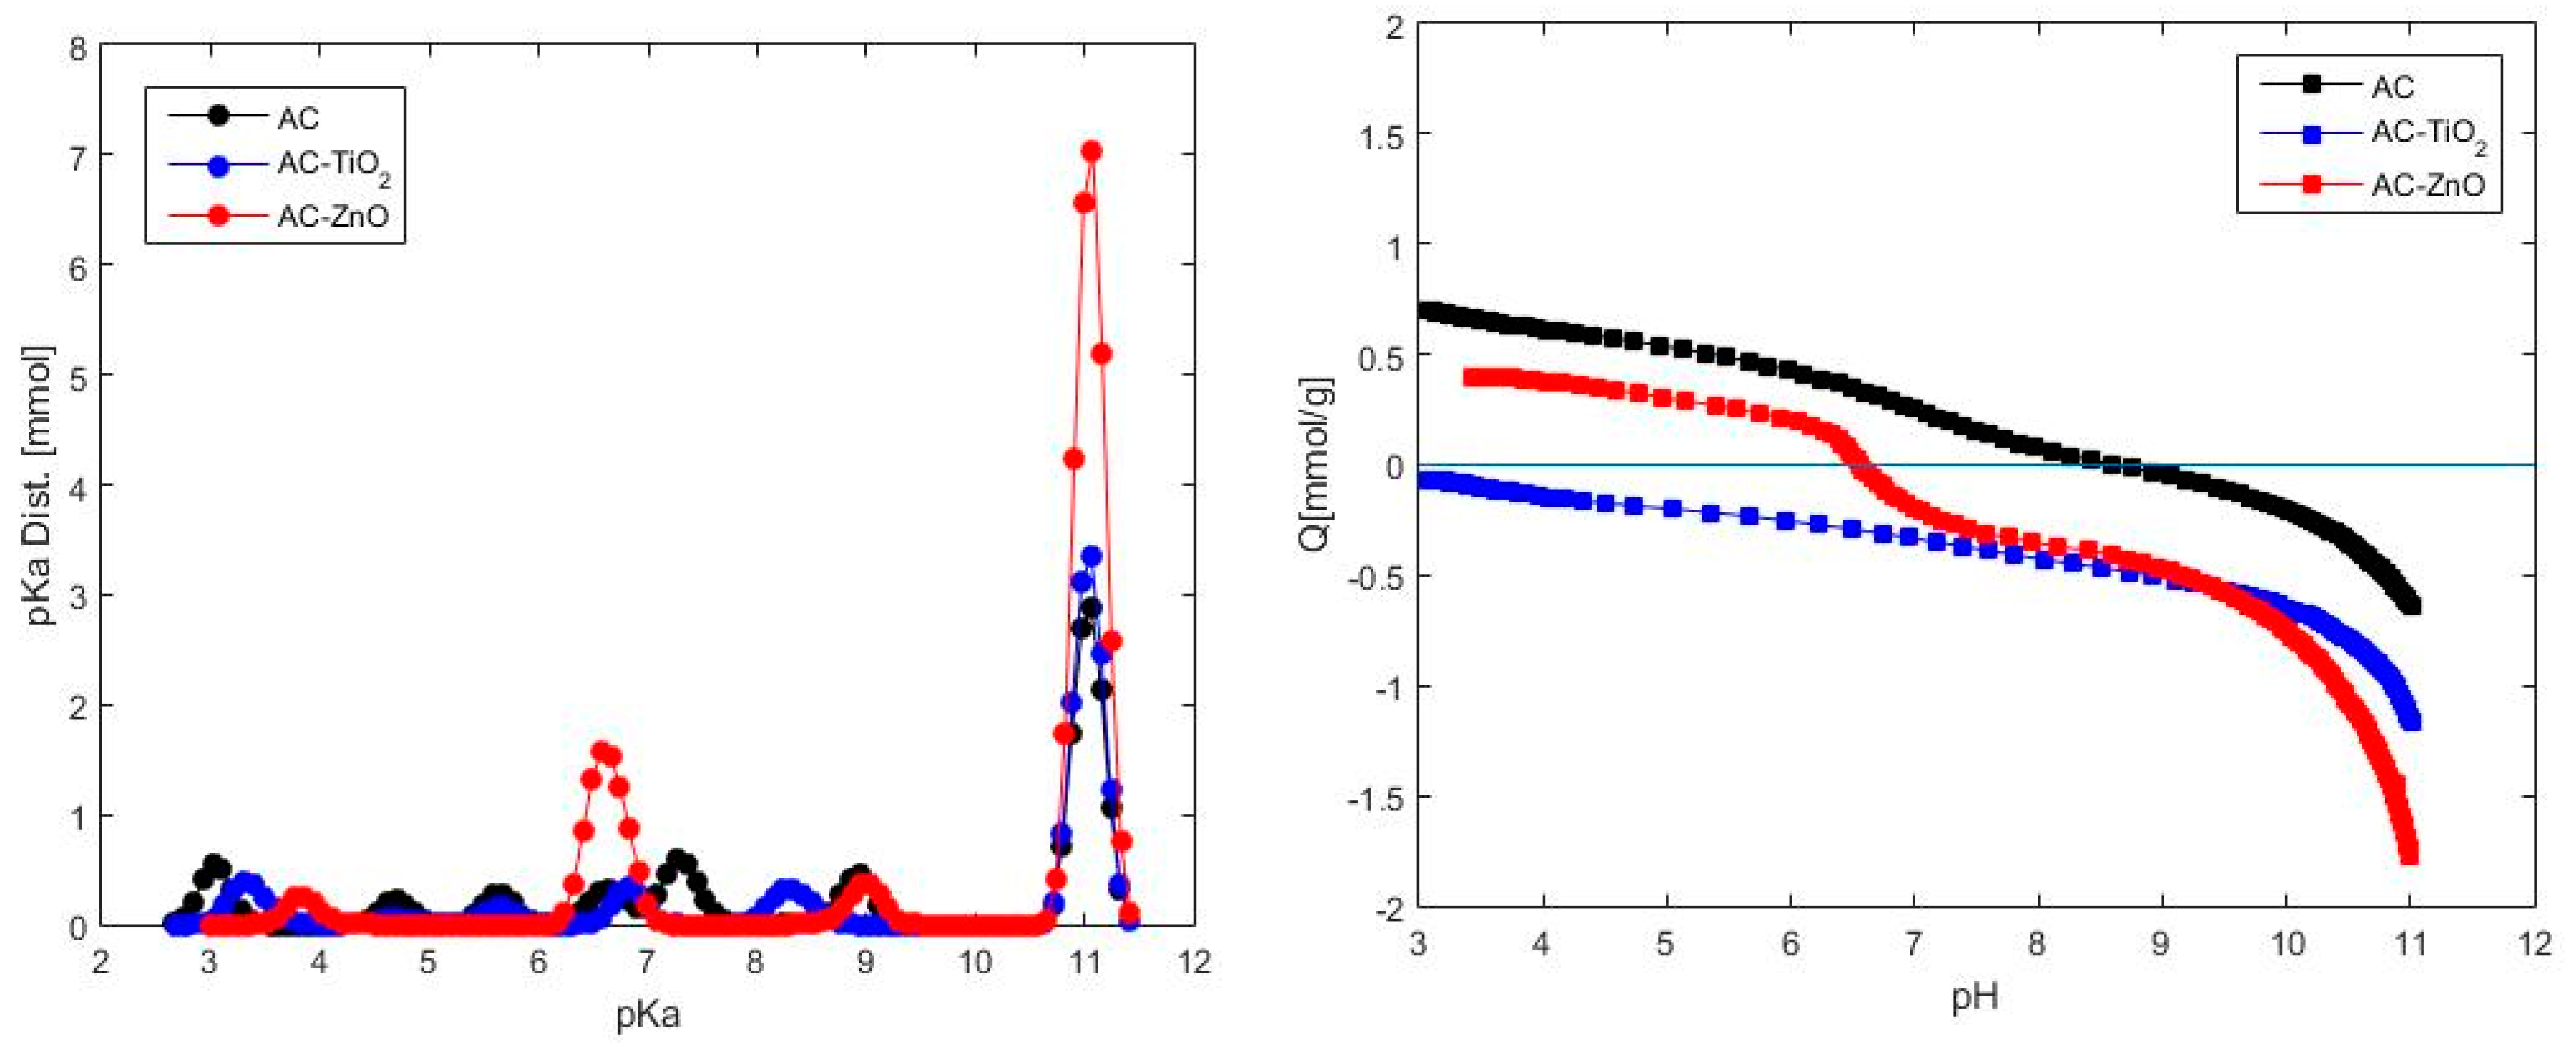
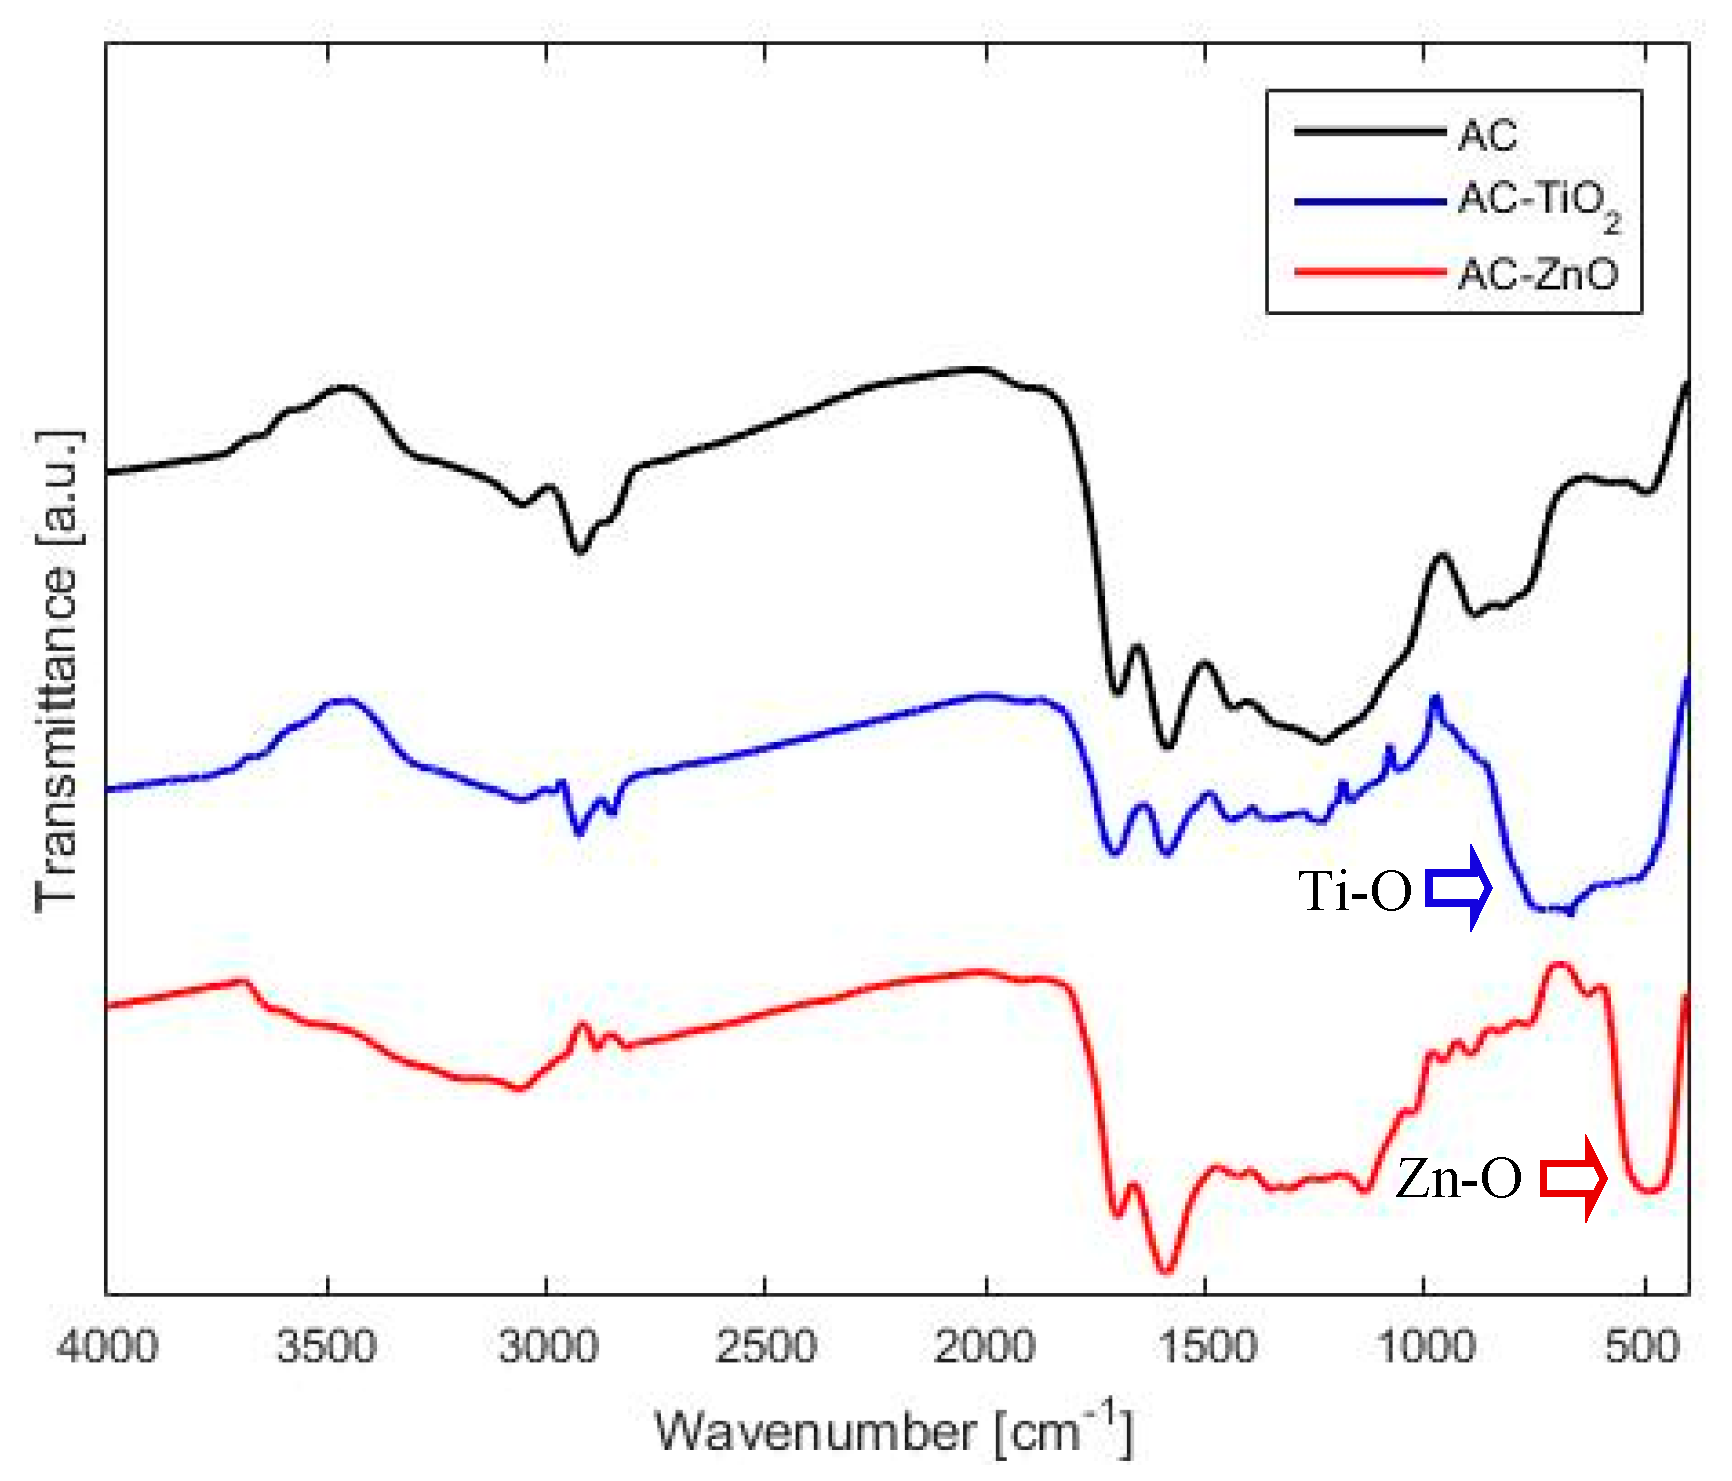
2.1.2. Chemical Characterization

Chemical surface characterization was accomplished using techniques of Fourier-transformed infrared spectroscopy (FT-IR), potentiometric titration, and UV–Vis diffuse reflectance spectroscopy (DRS). IR spectra (Figure 4) showed hydroxyl stretching mode (2900–3500 cm−1), carbonyl (1700 cm−1), aromatics (C = C) (1590 cm−1) bonds vibrations and hydroxyl bending mode (1000–1500 cm−1), which are functional surface groups normally present in AC [48]. The same bands appeared in the other spectra, but they differed in the fingerprint region, in which it was possible to identify the vibrational modes of metal–oxygen bonds. Those vibrations corresponded to bands at 650 cm−1 (Ti-O) and 500 cm−1 (Zn-O), respectively [49,50].
In addition, potentiometric titrations were carried out changing the pH between 3 and 11. Figure 5 shows the pKa distribution of the functional surface groups presented in the solids and also displays the proton bindings curves.
Potentiometric titrations allowed us to evaluate the acid–base behavior of the surface functional groups on the solids. Owing to surface heterogenicity of most activated carbons, acid dissociation constants (Ka) depended directly on neighboring groups. In this case, AC and AC–TiO2 presented two types of carboxylic groups, since they have two different pKa contributions when pKa is lower than 5. Lactones and acid anhydride groups were designated to pKa range between 6 and 8, while the weaker acidic groups (pKa > 9) corresponded to phenolic and carbonyl groups [51]. It is important to highlight that the metal oxides used were amphoteric and therefore they contributed to pKa distribution (i.e., pKa = 7 and 11). In accordance with the pKa distribution curves, it was possible to determine that AC–ZnO was the solid with more acidic surface groups. However, the proton binding curve showed that AC–TiO2 was the material with stronger acidic character because in the whole pH range its functional surface groups were deprotonated [52]. In contrast, AC functional groups were protonated until solution pH was around 9. This behavior could be attributed to the amphoteric nature of the metal oxides [53].
On the other hand, UV–Vis diffuse reflectance spectroscopy was used to study photoactivity of each one of the materials. The spectra are presented in Figure 6, including a raw TiO2 spectrum for comparison. Owing to its black color, AC absorbs UV–Vis light in the whole range (200–700 nm) unlike TiO2 that reflects light above 350 nm. Composites spectra have the same behavior of TiO2, but with a lower reflectance as a result of the carbonaceous matrix absorption. Semiconductors such as ZnO and TiO2 have an optical band gap that is equal to the threshold for photons to be absorbed. When a photon is absorbed, an electron from the valence band is promoted to the conduction band, generating a hole–electron pair with redox potential. From DRS spectra, the band gap could be obtained by applying the Kubelka–Munk function and using Tauc’s plot [54]. Figure 6 also shows the Tauc plot considering a direct semiconductor. In each plot, a linear region appeared between 3 and 4 eV. According to the theory, an extrapolation of the linear region (same slope) gives the band gap, which is determined by the value in which the line passes through the x axis. That means that the band gap was equal to 2.9 and 3.1 eV for the composites AC–TiO2 and AC–ZnO, respectively. It is worth noting that there was a decrease in the calculated bandgap compared to the net TiO2, possibly due to the influence of the activated carbon surface. AC is a black material, so it absorbs light, influencing the band gap of the composite. Additionally, surface functional groups can induce a shift in the absorption spectra, changing the band gap value. This is in agreement with the results obtained by other authors using similar dark materials [55,56,57,58].

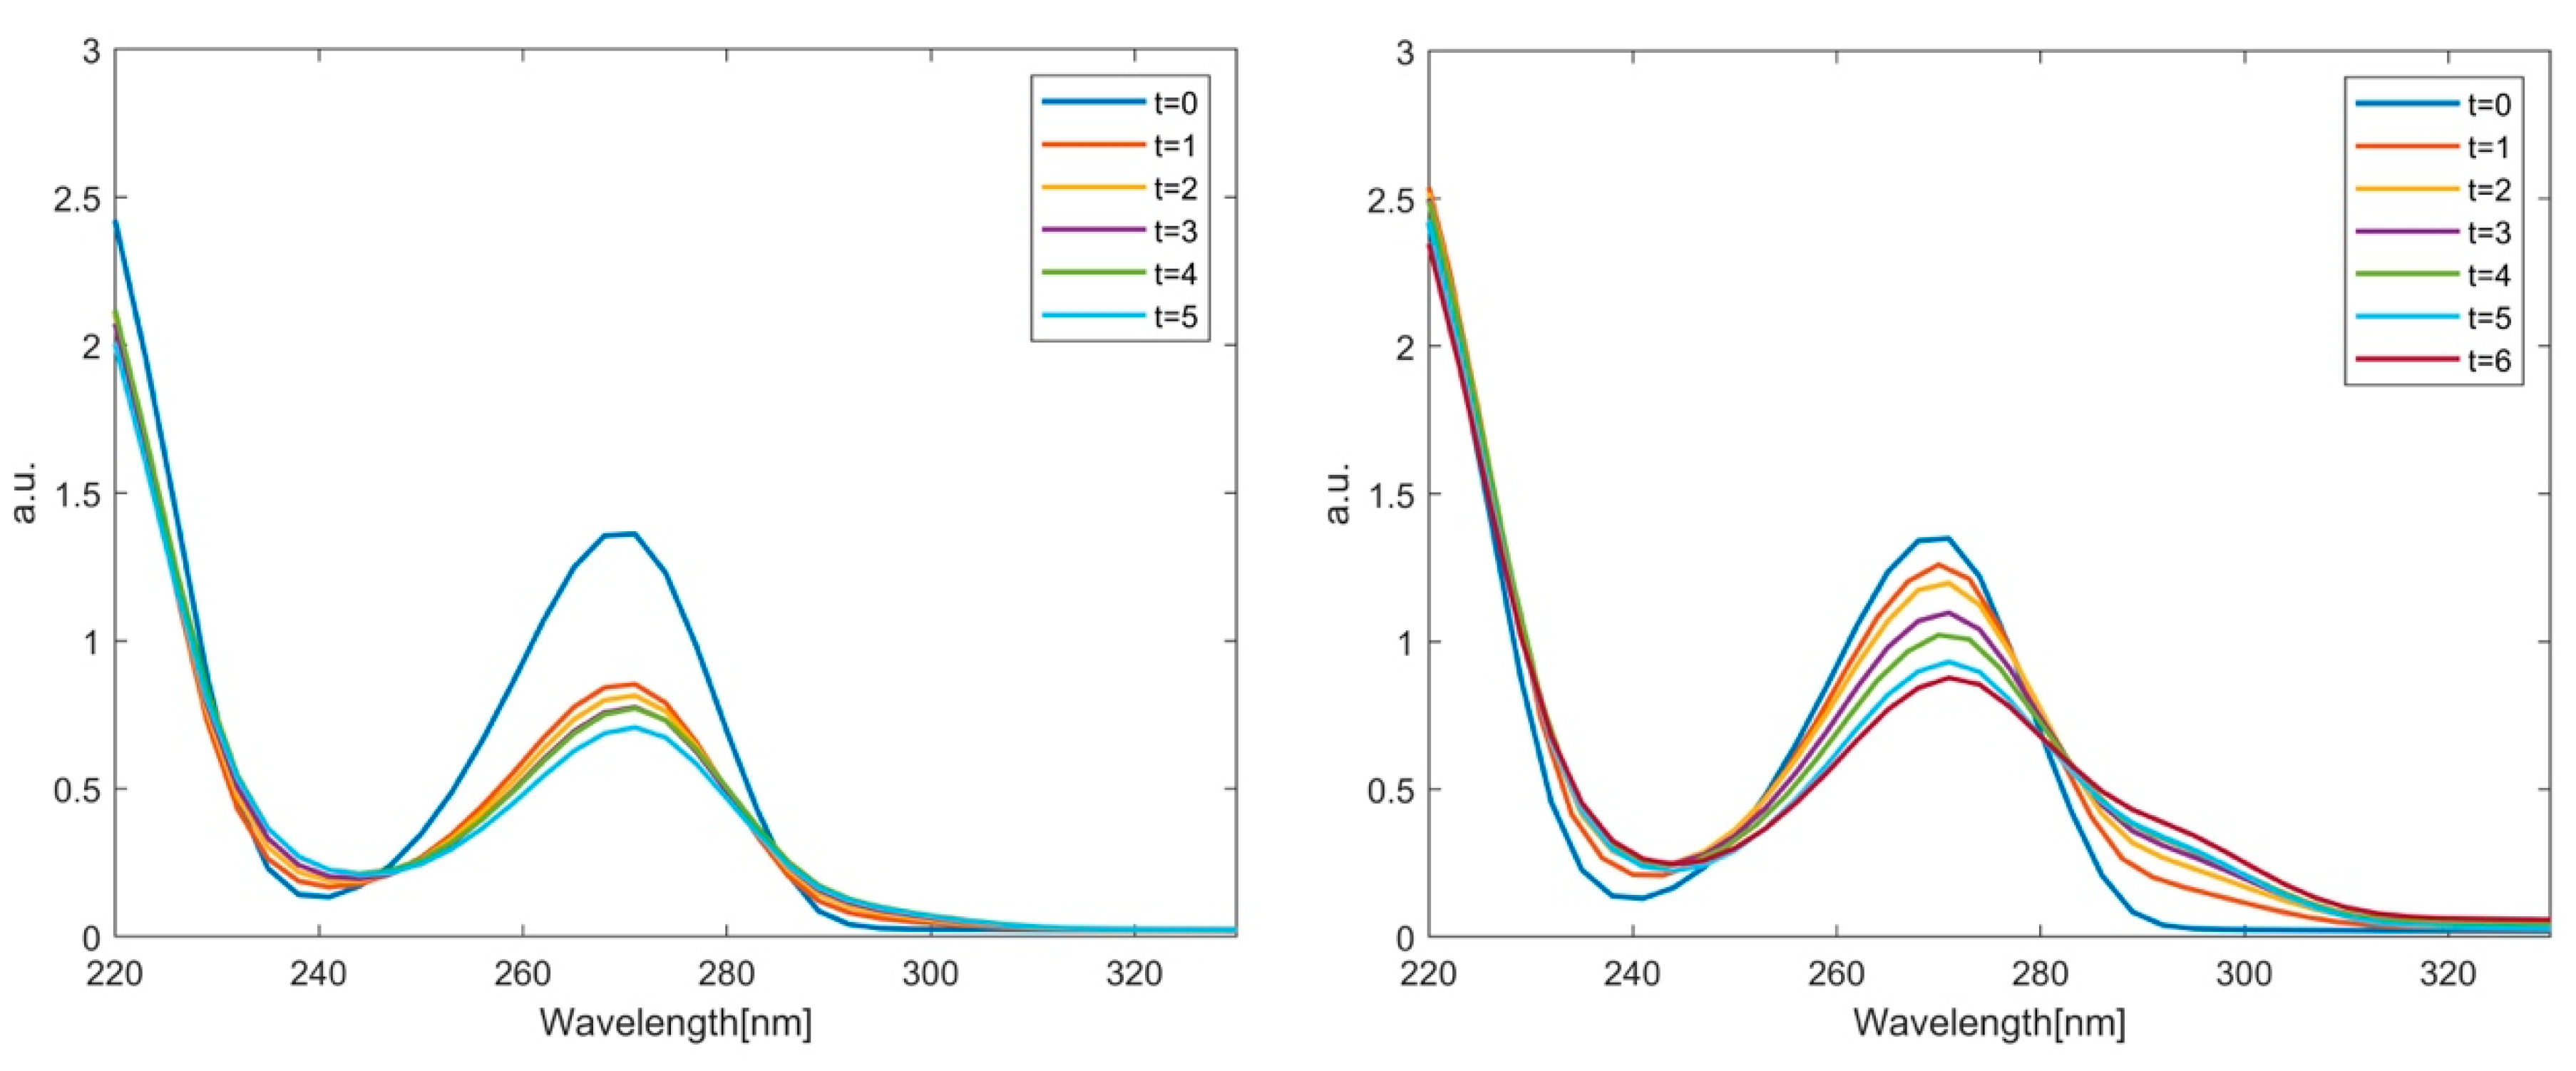
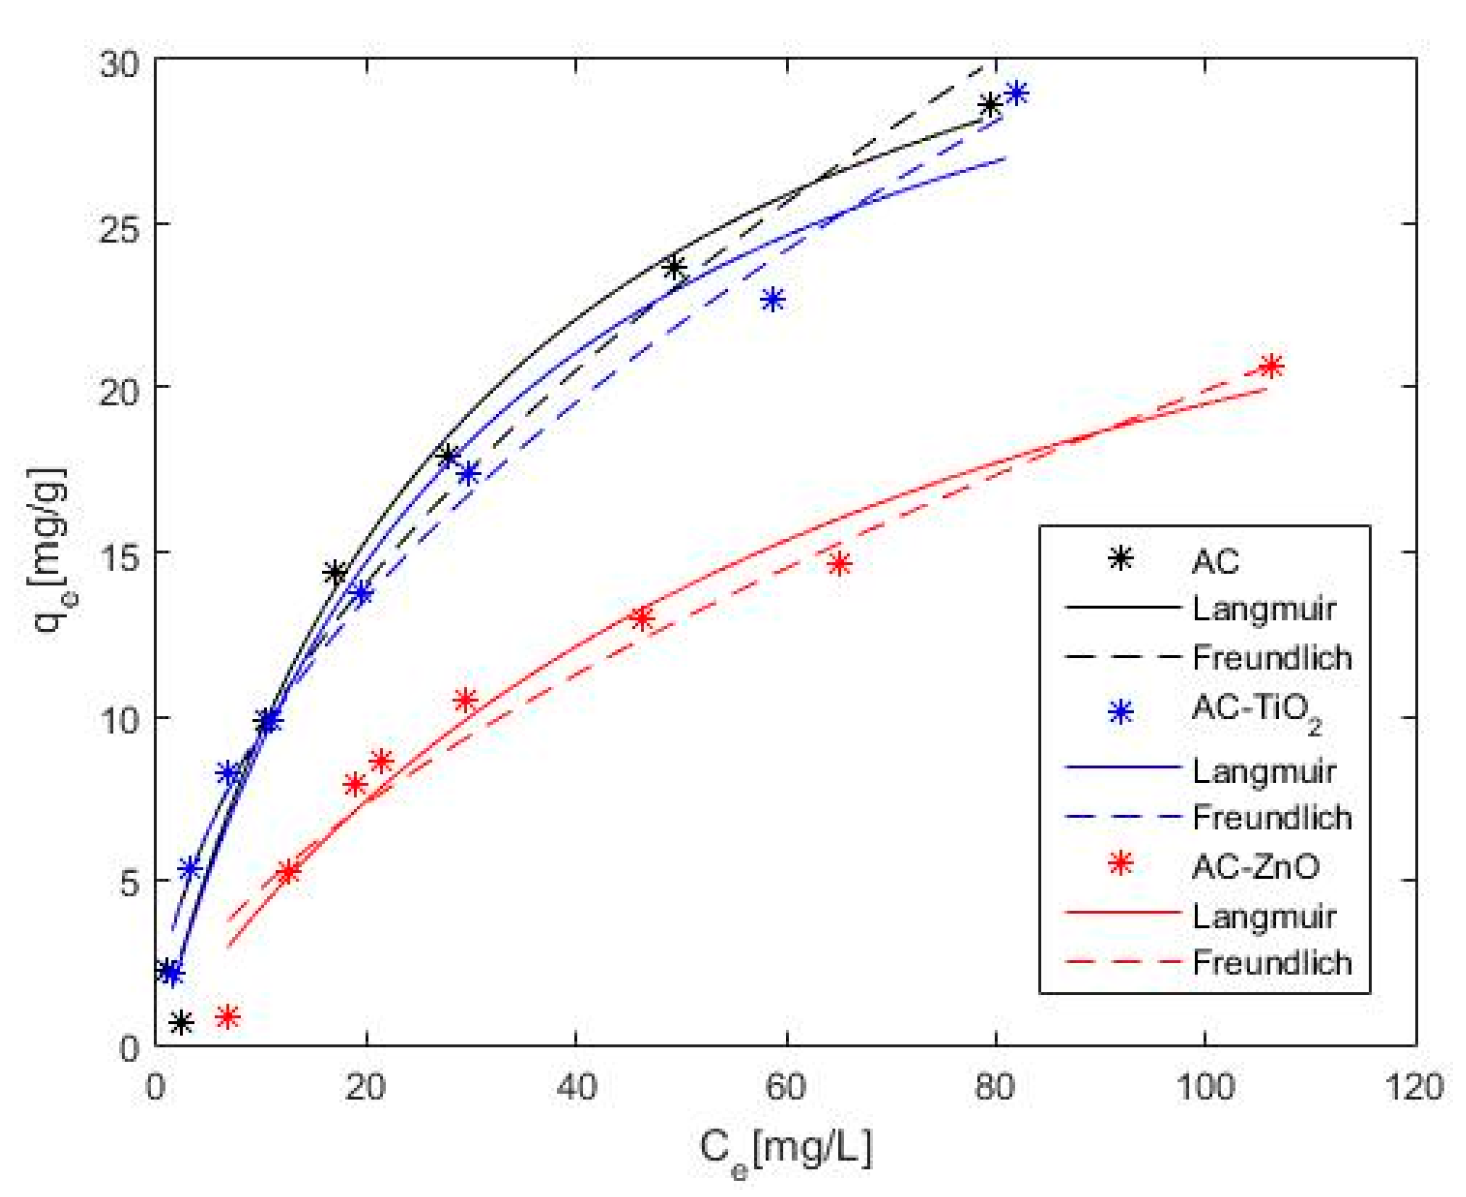
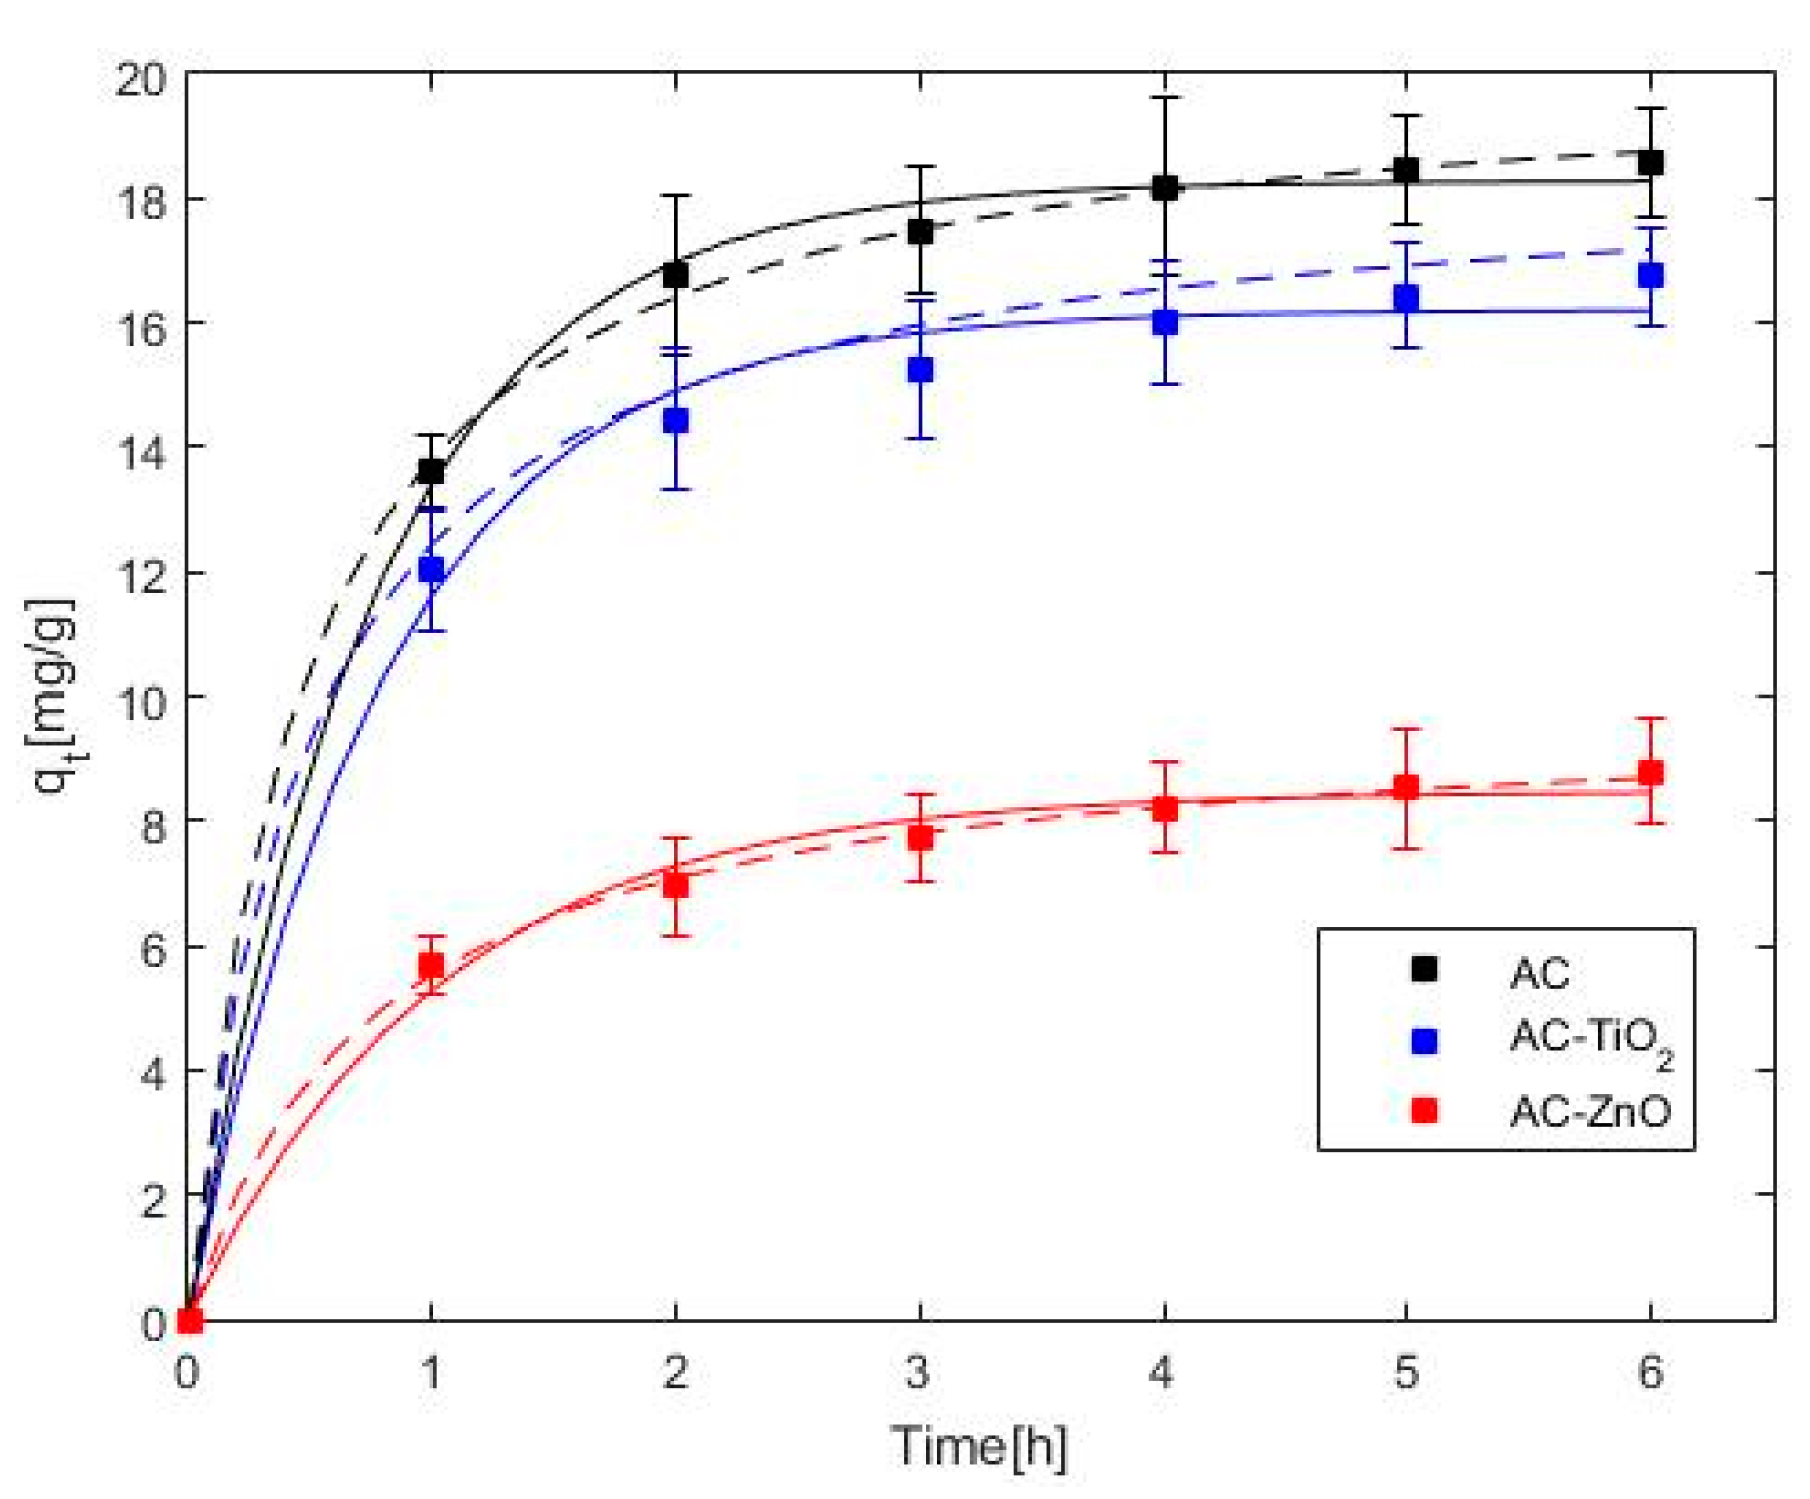
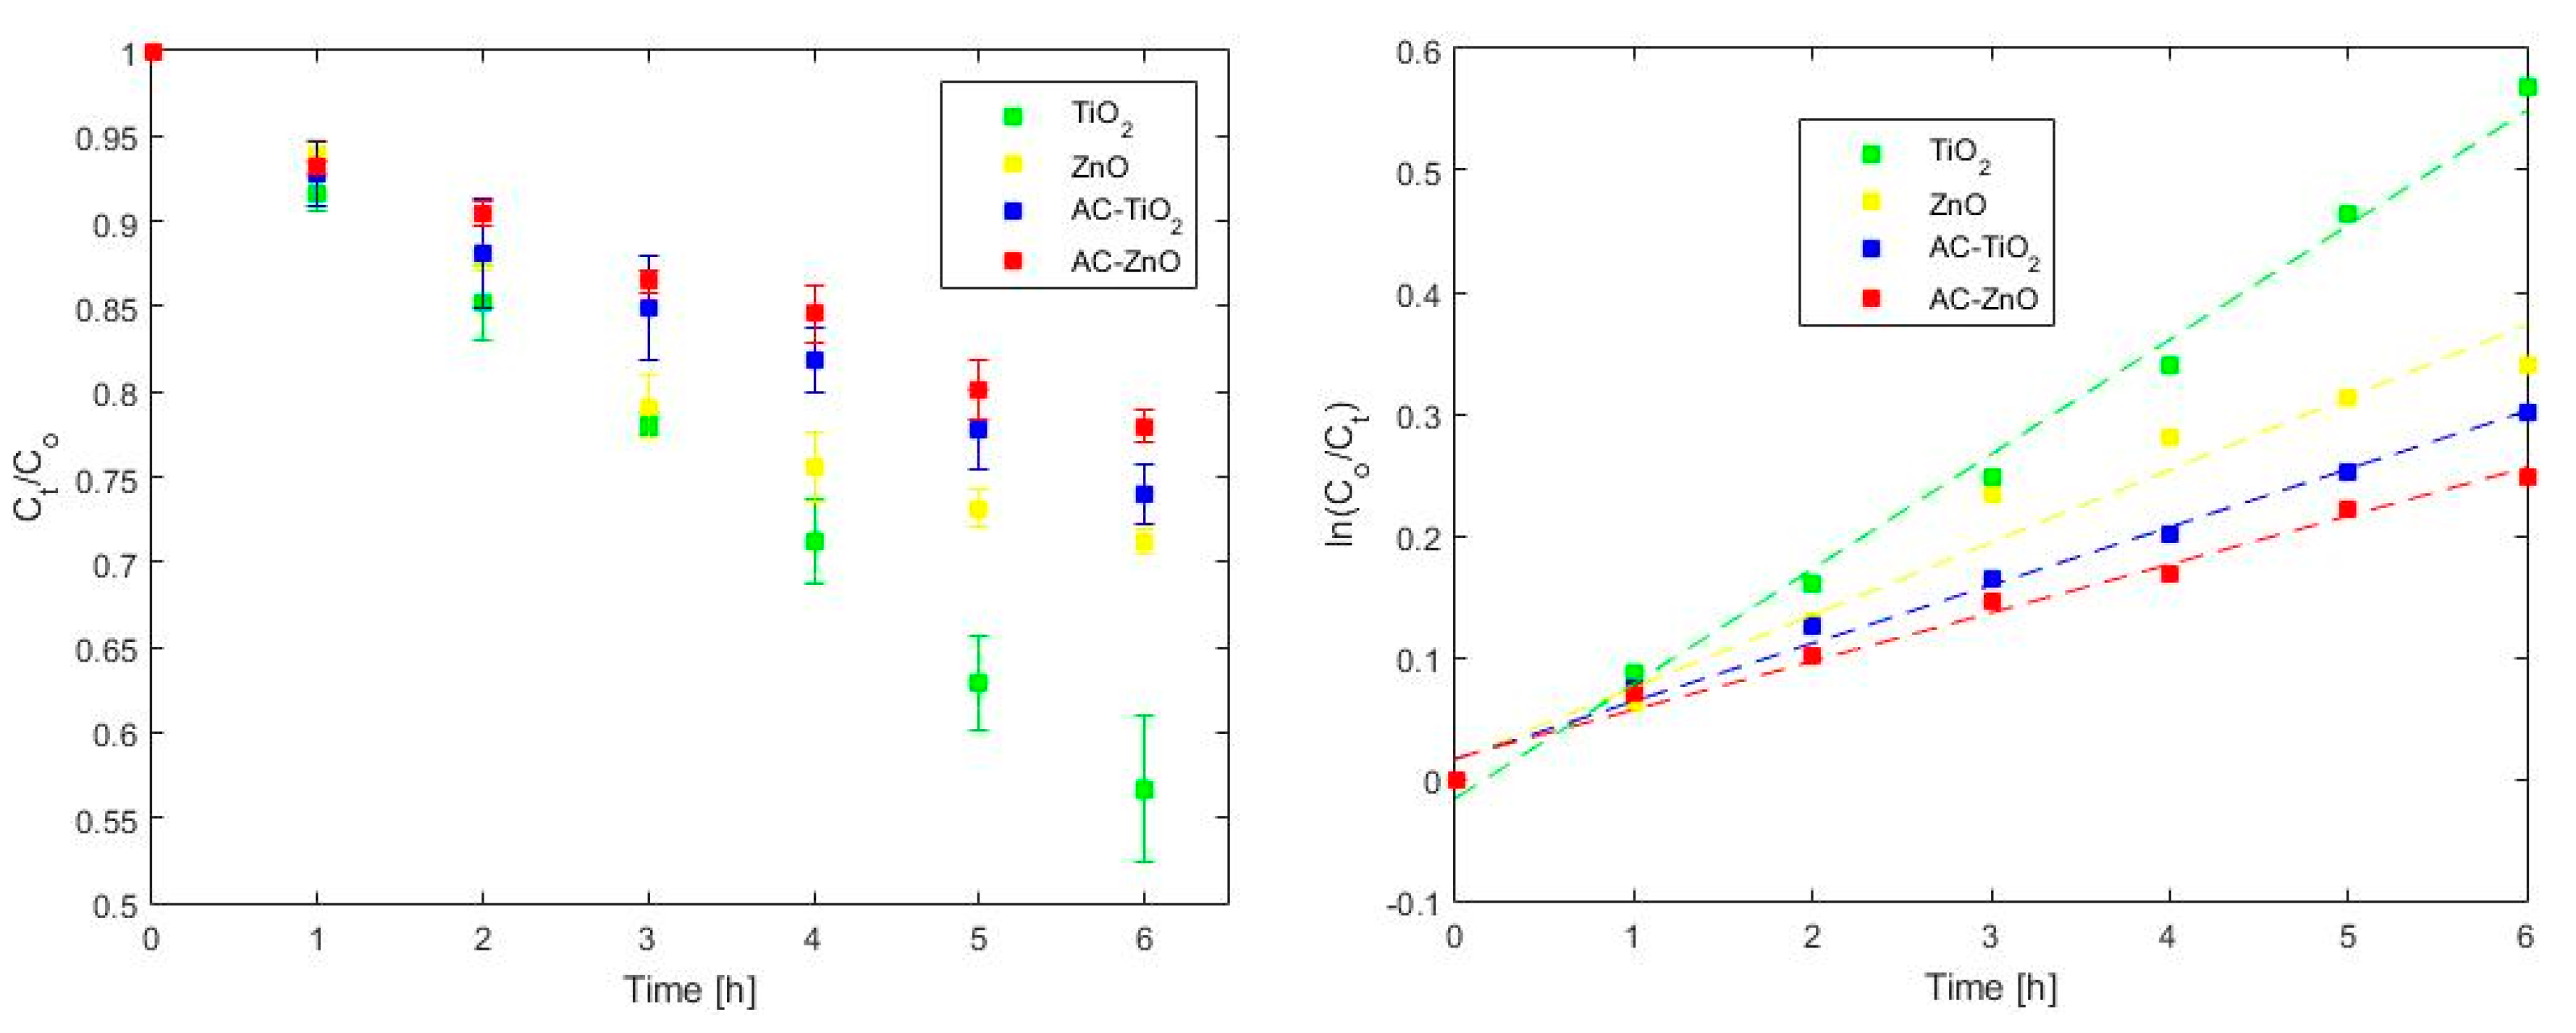
2.2. Phenol Adsorption and Photocatalysis

Adsorption isotherms were used to study the relationship between equilibrium concentrations of an adsorbate over an adsorbent (qe) and in the residual solution (Ce). Langmuir and Freundlich isotherm models were applied to fit the experimental data obtained when adsorption–desorption equilibrium was reached. In Table 2 all parameters of each model are presented, and in Figure 7 the isotherms and experimental data are plotted.
Considering that non-linear regressions (NLR) were applied to identify the model that best fits to the adsorption curves, the standard deviation were used. Langmuir was the model with the best fitting for AC and AC–ZnO. It was possible to compare both parameters given by the Langmuir isotherm. The parameter qm represents the monolayer maximum adsorption capacity, indicating that pristine AC could adsorb a higher amount of phenol, and in contrast, AC–ZnO presented the lowest adsorption capacity. This could be directly related to the BET surface area, since activated carbon presented the highest surface area and AC–ZnO the lowest one. On the other hand, the Langmuir constant KL is an equilibrium constant that represents the adsorbate–adsorbent affinity. This means that because KL was smaller in AC–ZnO, phenol presented a better affinity to the pristine AC surface. With respect to AC–TiO2, the Freundlich isotherm fit better with this experimental data. Originally, this model was proposed as an empirical equation, but it could be derived from a theorical footing. The principal assumption of this model is related to surface heterogeneity. In this case, surface topography was organized patch wise and sites with the same adsorption energies were grouped in each patch. The parameters KF and n are associated with adsorption capacity and surface heterogeneity, respectively. In this case, the solid AC–ZnO was the one with the lower KF and thus the lower adsorption capacity. The parameter 1/n implied that all solids had an heterogeneous surface, due to 1/n being closer to unity than to zero [59].
Adsorption kinetics are used to describe the effects of contact time on the adsorption rate. Pseudo-first (PFO) and pseudo-second order (PSO) models were used to study adsorption kinetics, using NLR to calculate each one of the parameters. In Figure 8, experimental and fitted data are displayed. According to the standard deviation (Table 3), the PSO model adjusted better kinetic data for the three solids. From this model, the parameter qe was calculated, and it was equal to the amount of solute adsorbed per gram of adsorbent. As expected, AC–ZnO presented the lowest qe value since it had the smallest value of qm (Langmuir isotherm) and BET surface area. In contrast, the rate constant k2 was slightly greater for AC–ZnO, which means a faster rate of adsorption in this solid. Typically, the PSO model describes chemisorption processes rather than physisorption, suggesting that electron exchange takes place during the adsorption process [60].
On the other hand, photocatalytic activity was studied by Langmuir–Hinshelwood first order kinetic model. To clarify, phenol photolysis was negligible under the experimental conditions used here. In Figure 9, the results of photocatalytic degradation are displayed, using as comparison the neat oxides (TiO2 and ZnO). Linear regression was employed to calculate the parameters of the Langmuir–Hinshelwood model, and the results are plotted in Figure 9. In relation to the first-order rate constants, it was determined that higher photocatalytic activity was achieved by the AC–TiO2 composite, because its kapp was greater (0.0477 h−1) than that for AC–ZnO (0.0398 h−1). This trend was also evidenced when neat oxide photoactivity was studied, indicating a better photocatalytic performance of titanium dioxide over zinc oxide. An important parameter known as quantum yield (ϕ(R)λ) was used to compare between photocatalyst and photocatalytic systems. This parameter is calculated by dividing the number of products formed or reactants lost with the number of photons efficiently absorbed by the photocatalyst. However, in heterogeneous photocatalysis, it is difficult to obtain precisely the value of absorbed photons due to phenomena such as scattering and reflection of light. One possible approximation is the use of the apparent quantum yield, which uses the photons irradiated instead of photons absorbed [61]. In this case, the apparent quantum yield for AC–TiO2 was 0.14 and for AC–ZnO it was 0.11. These are low values because the irradiated photons were higher than those actually absorbed by the photocatalysts. For that reason, some authors such as Horst Kisch recommended that for liquid/solid photocatalysis, optimal reaction rates should be measured to properly compare between photocatalysis systems [62,63].
Figure 10 corresponds to UV–Vis spectra of phenol at different times for the systems with TiO2 and AC–TiO2; they show the effect of adsorption of phenol over the AC surface, and then the progress of photocatalysis. Additionally, it was possible to observe that the signal at 290 nm in the spectrum with TiO2 did not appear in the other spectrum. This could possibly be related to the adsorption of the by-products of phenol photodegradation over the available surface of AC.
In order to compare the results with other carbon-based materials, a bibliography review was made. In 2018, Hepsiba Catherine et al. [64] synthetized graphene oxide from graphite flakes using the Hummers method. They reported a material with a low specific BET surface area (0.727 m2/g) and phenol maximum adsorption capacity (qm) of 29.25 mg/g. They concluded that the adsorption was dominated principally by van der Waals forces and π–π interactions; however, they also reported that hydrogen bonds were also presented due to the oxygen surface functional groups. On the other hand, Weixue Wang and collaborators [65] in 2019 reported to have obtained nanoporous 3D-graphene oxide through a simple sugar-blowing route and post-oxidation. They reported a phenol qm of 135.6 mg/g and a BET surface area of 974.8 m2/g. Graphenic materials have also been employed in heterogeneous photocatalysis. For example, Marta Pedrosa et al. [66] prepared graphene oxide (GO) from graphite comparing the Hummers’ and the Brodie’s methods. They concluded that GO prepared by Brodie’s method is a successful way to obtain undoped metal-free photocatalyst for phenol photodegradation. Another study made by Chun-Chein Fu and collaborators [67] was about the synthesis of graphene oxide–titania composite by the hydrothermal method. They used this material both as an adsorbent and as a photocatalyst for phenol degradation. Their results show that the composite had a qm of 23.7 mg/g and excellent photocatalytic activity toward phenol. They concluded that the improved photoactivity could be attributed to the available adsorption sites and the low recombination rate of electron–hole pairs due to the composite’s structure.

3. Materials and Methods

3.1. Activated Carbon Preparation

First, onion leaves were washed with enough water to remove dust and dirt. Then, the onions were dry in a home oven at 80 °C for 15 h. Chemical activation was used with phosphoric acid as an activation agent (See its characteristics in Table 4). A solution of 40% of phosphoric acid was prepared and mixed with the dry leaves, with an impregnation ratio of 20 mL of acid solution per gram of dry material and for 24 h of soaking time. The mixture was then dehydrated in an oven at 80 °C. The dried sample was pyrolyzed in a tubular furnace (Thermolyne 79,300), with a heating velocity of 1.5 °C·min−1 until the maximum temperature of 450 °C was reached; it was left at this temperature for two hours. Finally, the AC was washed multiple times with hot and cold distilled water, until a neutral pH was reached.

3.2. Composites Preparation

The wet impregnation method was used for preparation of composites. First, 30 mL of an ethanolic suspension of AC was prepared by sonication. Then, each metal oxide (MO) was added using a mass ratio of 10:1.5 (AC:MO), with vigorous and continuous stirring for two hours. Solvent was removed under reduced pressure, and finally composites were washed with distilled water multiple times.

3.3. Characterization

3.3.1. Physical Characterization

Textural properties were determined by N2 physisorption isotherms at −196 °C in a semi-automatic Autorsorb IQ2 sorptometer (Quantachrome Instruments). BET and QSDFT models were applied to determine specific surface area, half pore width, and pore size distribution.
Powder X-ray diffraction (PXRD) was performed by Rigaku Miniflex diffractometer, with a radiation source of Cu (Kα). The diffraction angle (2θ) was varied from 10° to 90°.
Scanning electron microscopy (SEM) and energy dispersive spectroscopy (EDS) was performed using a JSM 6490-LV JEOL microscope equipped with SE and BSE detectors.

3.3.2. Chemical Characterization

The surface chemistry of the samples was analyzed using Fourier-transform infrared spectroscopy, performed using a Thermo Scientific Nicolet Nexus spectrometer (Thermofisher, Boston, MA, USA) equipped with a diffuse reflectance cell. Spectra were recorded varying the wavenumber between 450 and 4000 cm−1. In addition, potentiometric titration was performed using a Titroline Alpha plus (Schott Instruments) automatic titrator. A solution of NaCl 0.01 M (50 mL) was used to suspend 100 mg of each material. HCl 0.1 M was used to adjust the initial pH to 3. A solution of NaOH (0.1 M) was titrated until the final pH was equal to 11.
Photoactivity of the composites was studied by UV–Vis diffuse reflectance spectroscopy using a UV–Vis Agilent Technologies Cary 100 spectrophotometer. The composites used had a particle size between 200 and 500 μm, and around 3 g of each one was placed in the DRS cell. To estimate the band gap energy of each material, a DRS integrating sphere was used, with a white standard of barium sulfate. Data was processed by applying the Kubelka–Munk equation.

3.4. Adsorption Study

A phenol stock solution (1000 ppm) was prepared by weighing 1.0 g of phenol and diluting it in 1.0 L of distilled water. Adsorption isotherms were made by using 10 mL of phenol solutions with different concentrations (5–200 ppm) and a dosage of each composite and AC of 1 g/L at 295 K and neutral pH. After adsorption–desorption equilibrium was achieved, the solid was filtered with PTFE of 0.22 μm, and the phenol concentration (in solution) was analyzed by UV/Vis spectrophotometry at 270 nm. The data was studied and modeled by Langmuir and Freundlich isotherms.
q e = q m K L C e 1 + K L C e
q e = K F C e 1 n
q = ( C 0 C ) V m
where qe is the equilibrium concentration of phenol over the adsorbent (mg/g), Ce is the phenol equilibrium concentration in the liquid phase (mg/L), KL is the Langmuir constant (g/mg), and KF and n are Freundlich adsorption parameters. Equation (3) is the definition of the solid phase concentration (adsorbate–adsorbent), where V is the volume of the solution while m is the mass of the adsorbent.
Adsorption kinetics were studied in a 250 mL batch reactor using an initial concentration of phenol of 100 mg/g and a solid dosage of 1 g/L at 295 K and neutral pH. Samples were taken every 60 min for 7 h, and phenol concentration was followed by UV–Vis spectrophotometry. Results were modeled by PFO and PSO models (Equations (4) and (5)).
q = q e ( 1 e k 1 t )
q = k 2 q e 2 t 1 + k 2 q e t
where t is time (h) and k1 and k2 are the rate constant for PFO (h−1) and PSO (g/mg∗h), respectively.

3.5. Photocatalysis

Photocatalytic activity was studied in a 250 mL batch photo-reactor made of Pyrex and covered with an aluminum sheet, using an initial concentration of phenol of 100 mg/g and a solid dosage of 1 g/L at 295 K and neutral pH. The mixture was maintained for one hour in the dark to ensure adsorption–desorption equilibrium. Then, a UV lamp [68] with a power of 9 W, a photon flux of 9.37 × 10¹⁵ photons cm−2·min−1, and a wavelength of 356 nm was turned on to begin photodegradation. Samples were taken every 60 min for 7 h, and phenol concentration (in solution) was followed by UV–Vis spectrophotometry at 270 nm. Results were modeled using the Langmuir–Hinshelwood first order kinetic model.
r p h e n o l = d C d t = k a p p C
where kapp is the rate constant of degradation (h−1), and r is the rate of degradation of phenol (mg/L∗h).

4. Conclusions

Adsorption and photocatalytic activity of activated carbon and composites with metallic oxides (TiO2 and ZnO) were studied in the present work. Characterization studies confirmed that AC presents mesoporosity that is lost with the incorporation of metal oxides. There is a mesoporous filling by TiO2 and ZnO nanoparticles, leaving only some microporosity in their structure. This is strongly reflected in a decrease in BET surface area from 1100 m2/g to 440 and 218 m2/g. According to SEM–EDS results, there is a surface heterogeneity in the composites due to non-homogeneous distribution of the oxides over the AC surface. Functional surface groups of AC were characterized as carboxylic, lactonic, anhydride, and principally weak acidic groups such as phenolic. Surface acidity was increased with the oxide’s incorporation due to its amphoteric nature. The optical band gap was calculated to study their photoelectrical properties, and we obtained a decrease in the band gap compared to pristine TiO2.
The maximum adsorption capacity (qm) obtained from Langmuir isotherm was, in decreasing order, AC > AC–TiO2 > AC–ZnO. This is directly related with the surface area of each solid. The adsorption kinetics follows the pseudo-second order model, which describes chemisorption over physisorption. Despite the higher adsorption capacity of AC–TiO2 over AC–ZnO, adsorption was faster for AC–ZnO. First order rate constant was higher for AC–TiO2 than for AC–ZnO, indicating a better photocatalytic activity.

Author Contributions

D.F.H.-B. and J.P.R.-E. conceived and designed the experiments; D.F.H.-B. and J.P.R.-E. performed the experiments; D.F.H.-B., J.P.R.-E., J.C.M.-P., and R.S.R. analyzed the data; D.F.H.-B., J.P.R.-E., J.C.M.-P., and R.S.R. wrote the paper; D.F.H.-B., J.P.R.-E., J.C.M.-P., L.G., and R.S.R. critically revised the manuscript. All authors have read and agreed to the published version of the manuscript.

Funding

This research received no external funding.

Acknowledgments

The authors thank the framework agreement between the Universidad de Los Andes and the Universidad Nacional de Colombia-Sede Bogotá and the act of agreement established between the Chemistry Departments of both universities. The authors thank the “Fondo de apoyo Financiero para Doctorados” from Universidad de los Andes. Finally, the authors wish to express their gratitude to the Ministry of Science and Technology of Colombia (Minciencias) and its Call 811-2018 “Postdoctoral stay program for Colciencias training beneficiaries in SNCTeI entities”. Additionally, the Juan Carlos Moreno-Piraján also appreciate the grant for the funding of research programs for Associate Professors, Full Professors, and Emeritus Professors announced by the Faculty of Sciences of the Universidad de los Andes (Colombia), 01-20-2020, 20-01-2022, according to the project INV-2019-84-1786.

Conflicts of Interest

The authors declare no conflict of interest.

References

  1. Departamento Administrativo Nacional de Estadisticas (DANE). Boletín Mensual Insumos y Factores Asociados a la Producción Agropecuaria; Departamento Administrativo Nacional de Estadisticas: Bogotá, Colombia, 2013; Volume 17.
  2. Üner, O.; Bayrak, Y. The effect of carbonization temperature, carbonization time and impregnation ratio on the properties of activated carbon produced from Arundo donax. Microporous Mesoporous Mater. 2018, 268, 225–234. [Google Scholar] [CrossRef]
  3. Mohammed, A.A.; Chen, C.; Zhu, Z. Low-cost, high-performance supercapacitor based on activated carbon electrode materials derived from baobab fruit shells. J. Colloid Interface Sci. 2019, 538, 308–319. [Google Scholar] [CrossRef] [PubMed]
  4. Raj, F.R.M.S.; Boopathi, G.; Jaya, N.V.; Kalpana, D.; Pandurangan, A. N, S codoped activated mesoporous carbon derived from the Datura metel seed pod as active electrodes for supercapacitors. Diam. Relat. Mater. 2020, 102, 107687. [Google Scholar] [CrossRef]
  5. Hoang, V.C.; Dinh, K.N.; Gomes, V.G. Hybrid Ni/NiO composite with N-doped activated carbon from waste cauliflower leaves: A sustainable bifunctional electrocatalyst for efficient water splitting. Carbon N. Y. 2020, 157, 515–524. [Google Scholar] [CrossRef]
  6. Guo, Y.; Tan, C.; Sun, J.; Li, W.; Zhang, J.; Zhao, C. Porous activated carbons derived from waste sugarcane bagasse for CO2 adsorption. Chem. Eng. J. 2020, 381, 122736. [Google Scholar] [CrossRef]
  7. Lu, W.; Cao, X.; Hao, L.; Zhou, Y.; Wang, Y. Activated carbon derived from pitaya peel for supercapacitor applications with high capacitance performance. Mater. Lett. 2020, 264, 127339. [Google Scholar] [CrossRef]
  8. Nourmoradi, H.; Moghadam, K.F.; Jafari, A.; Kamarehie, B. Removal of acetaminophen and ibuprofen from aqueous solutions by activated carbon derived from Quercus Brantii (Oak) acorn as a low-cost biosorbent. J. Environ. Chem. Eng. 2018, 6, 6807–6815. [Google Scholar] [CrossRef]
  9. Mashile, G.P.; Mpupa, A.; Nqombolo, A.; Dimpe, K.M.; Nomngongo, P.N. Recyclable magnetic waste tyre activated carbon-chitosan composite as an effective adsorbent rapid and simultaneous removal of methylparaben and propylparaben from aqueous solution and wastewater. J. Water Process Eng. 2020, 33, 101011. [Google Scholar] [CrossRef]
  10. Iriarte-Velasco, U.; Sierra, I.; Zudaire, L.; Ayastuy, J.L. Preparation of a porous biochar from the acid activation of pork bones. Food Bioprod. Process. 2016, 98, 341–353. [Google Scholar] [CrossRef]
  11. Matos, J.; Fierro, V.; Montaña, R.; Rivero, E.; De Yuso, A.M.; Zhao, W.; Celzard, A. High surface area microporous carbons as photoreactors for the catalytic photodegradation of methylene blue under UV-vis irradiation. Appl. Catal. A Gen. 2016, 517, 1–11. [Google Scholar] [CrossRef]
  12. Kwiatkowski, M.; Broniek, E. An analysis of the porous structure of activated carbons obtained from hazelnut shells by various physical and chemical methods of activation. Colloids Surf. A Physicochem. Eng. Asp. 2017, 529, 443–453. [Google Scholar] [CrossRef]
  13. Zhang, L.; Pan, J.; Liu, L.; Song, K.; Wang, Q. Combined physical and chemical activation of sludge-based adsorbent enhances Cr(VI) removal from wastewater. J. Clean. Prod. 2019, 238, 117904. [Google Scholar] [CrossRef]
  14. Zhang, P.; Wang, J.; Fan, W.; Zhong, Y.; Zhang, Y.; Deng, Q.; Zeng, Z.; Deng, S. Ultramicroporous carbons with extremely narrow pore size distribution via in-situ ionic activation for efficient gas-mixture separation. Chem. Eng. J. 2019, 375, 121931. [Google Scholar] [CrossRef]
  15. Il Kim, Y.; Lee, Y.J.; Yoo, J.; Kim, J.-H. High-capacitance activated bio-carbons with controlled pore size distribution for sustainable energy storage. J. Power Sources 2019, 438, 226969. [Google Scholar] [CrossRef]
  16. Wang, Y.; Liu, M.; Zhao, X.; Cao, D.; Guo, T.; Yang, B. Insights into heterogeneous catalysis of peroxymonosulfate activation by boron-doped ordered mesoporous carbon. Carbon N. Y. 2018, 135, 238–247. [Google Scholar] [CrossRef]
  17. Zhang, G.; Li, Z.; Zheng, H.; Fu, T.; Ju, Y.; Wang, Y. Influence of the surface oxygenated groups of activated carbon on preparation of a nano Cu/AC catalyst and heterogeneous catalysis in the oxidative carbonylation of methanol. Appl. Catal. B Environ. 2015, 179, 95–105. [Google Scholar] [CrossRef]
  18. Matos, I.; Bernardo, M.; Fonseca, I. Porous carbon: A versatile material for catalysis. Catal. Today 2017, 285, 194–203. [Google Scholar] [CrossRef]
  19. Augugliaro, V.; Palmisano, G.; Palmisano, L.; Soria, J. Heterogeneous Photocatalysis and Catalysis. Heterog. Photocatal. 2019, 1, 1–24. [Google Scholar]
  20. Ismael, M. Enhanced photocatalytic hydrogen production and degradation of organic pollutants from Fe (III) doped TiO2 nanoparticles. J. Environ. Chem. Eng. 2020, 8, 103676. [Google Scholar] [CrossRef]
  21. Ismael, M. The photocatalytic performance of the ZnO/g-C3N4 composite photocatalyst toward degradation of organic pollutants and its inactivity toward hydrogen evolution: The influence of light irradiation and charge transfer. Chem. Phys. Lett. 2020, 739, 136992. [Google Scholar] [CrossRef]
  22. Augugliaro, V.; Palmisano, G.; Palmisano, L.; Soria, J. Chapter 1—Heterogeneous Photocatalysis and Catalysis: An Overview of Their Distinctive Features. In Heterogeneous Photocatalysis; Marcì, G., Palmisano, L., Eds.; Elsevier: Amsterdam, The Netherlands, 2019; pp. 1–24. ISBN 978-0-444-64015-4. [Google Scholar]
  23. Sadeghian, Z.; Hadidi, M.R.; Salehzadeh, D.; Nemati, A. Hydrophobic octadecylamine-functionalized graphene/TiO2 hybrid coating for corrosion protection of copper bipolar plates in simulated proton exchange membrane fuel cell environment. Int. J. Hydrog. Energy 2020. [Google Scholar] [CrossRef]
  24. Rouzafzay, F.; Shidpour, R.; Al-Abri, M.Z.M.; Qaderi, F.; Ahmadi, A.; Myint, M.T.Z. Graphene@ZnO nanocompound for short-time water treatment under sun-simulated irradiation: Effect of shear exfoliation of graphene using kitchen blender on photocatalytic degradation. J. Alloy. Compd. 2020, 829, 154614. [Google Scholar] [CrossRef]
  25. Cui, W.; Bai, H.; Shang, J.; Wang, F.; Xu, D.; Ding, J.; Fan, W.; Shi, W. Organic-inorganic hybrid-photoanode built from NiFe-MOF and TiO2 for efficient PEC water splitting. Electrochim. Acta 2020, 2012, 136383. [Google Scholar] [CrossRef]
  26. Cui, W.; Kang, X.; Zhang, X.; Cui, X. Gel-like ZnO/Zr-MOF(bpy) nanocomposite for highly efficient adsorption of Rhodamine B dye from aqueous solution. J. Phys. Chem. Solids 2019, 134, 165–175. [Google Scholar] [CrossRef]
  27. El Bekkali, C.; Bouyarmane, H.; El Karbane, M.; Masse, S.; Saoiabi, A.; Coradin, T.; Laghzizil, A. Zinc oxide-hydroxyapatite nanocomposite photocatalysts for the degradation of ciprofloxacin and ofloxacin antibiotics. Colloids Surf. A Physicochem. Eng. Asp. 2018, 539, 364–370. [Google Scholar] [CrossRef] [Green Version]
  28. Chong, R.; Fan, Y.; Du, Y.; Liu, L.; Chang, Z.; Li, D. Hydroxyapatite decorated TiO2 as efficient photocatalyst for selective reduction of CO2 with H2O into CH4. Int. J. Hydrog. Energy 2018, 43, 22329–22339. [Google Scholar] [CrossRef]
  29. Ali, S.; Li, Z.; Chen, S.; Zada, A.; Khan, I.; Khan, I.; Ali, W.; Shaheen, S.; Qu, Y.; Jing, L. Synthesis of activated carbon-supported TiO2-based nano-photocatalysts with well recycling for efficiently degrading high-concentration pollutants. Catal. Today 2019, 335, 557–564. [Google Scholar] [CrossRef]
  30. Muthirulan, P.; Meenakshisundararam, M.; Kannan, N. Beneficial role of ZnO photocatalyst supported with porous activated carbon for the mineralization of alizarin cyanin green dye in aqueous solution. J. Adv. Res. 2013, 4, 479–484. [Google Scholar] [CrossRef] [Green Version]
  31. Nguyen, C.H.; Tran, H.N.; Fu, C.-C.; Lu, Y.-T.; Juang, R.-S. Roles of adsorption and photocatalysis in removing organic pollutants from water by activated carbon–supported titania composites: Kinetic aspects. J. Taiwan Inst. Chem. Eng. 2020. [Google Scholar] [CrossRef]
  32. Schäffel, F. The Atomic Structure of Graphene and Its Few-layer Counterparts. In Graphene; Elsevier: Amsterdam, The Netherlands, 2013; Volume 25, pp. 5–59. [Google Scholar]
  33. Warner, J.H.; Schäffel, F.; Bachmatiuk, A.; Rümmeli, M.H. Properties of Graphene. Graphene 2013, 25, 61–127. [Google Scholar]
  34. Varghese, S.S.; Lonkar, S.; Singh, K.K.; Swaminathan, S.; Abdala, A. Recent advances in graphene based gas sensors. Sens. Actuators B Chem. 2015, 218, 160–183. [Google Scholar] [CrossRef]
  35. Korkmaz, S.; Kariper, A. Graphene and graphene oxide based aerogels: Synthesis, characteristics and supercapacitor applications. J. Energy Storage 2020, 27, 101038. [Google Scholar] [CrossRef]
  36. Wang, J.; Song, J.; Mu, X.; Sun, M. Optoelectronic and Photoelectric Properties and Applications of Graphene-Based Nanostructures. Mater. Today Phys. 2020, 13, 100196. [Google Scholar] [CrossRef]
  37. Zhu, W.; Lin, Y.; Kang, W.; Quan, H.; Zhang, Y.; Chang, M.; Wang, K.; Zhang, M.; Zhang, W.; Li, Z.; et al. An aerogel adsorbent with bio-inspired interfacial adhesion between graphene and MoS2 sheets for water treatment. Appl. Surf. Sci. 2020, 512, 145717. [Google Scholar] [CrossRef]
  38. Gadipelli, S.; Guo, Z.X. Graphene-based materials: Synthesis and gas sorption, storage and separation. Prog. Mater. Sci. 2015, 69, 1–60. [Google Scholar] [CrossRef] [Green Version]
  39. Ismael, M.; Wu, Y.; Taffa, D.H.; Bottke, P.; Wark, M. Graphitic carbon nitride synthesized by simple pyrolysis: Role of precursor in photocatalytic hydrogen production. New J. Chem. 2019, 43, 6909–6920. [Google Scholar] [CrossRef]
  40. Ismael, M.; Wu, Y. A mini-review on the synthesis and structural modification of g-C3N4-based materials, and their applications in solar energy conversion and environmental remediation. Sustain. Energy Fuels 2019, 3, 2907–2925. [Google Scholar] [CrossRef]
  41. Thommes, M.; Kaneko, K.; Neimark, A.V.; Olivier, J.P.; Rodriguez-Reinoso, F.; Rouquerol, J.; Sing, K.S.W. IUPAC Technical Report Physisorption of gases, with special reference to the evaluation of surface area and pore size distribution (IUPAC Technical Report). Pure Appl. Chem. 2015, 87, 1051–1069. [Google Scholar] [CrossRef] [Green Version]
  42. Manoj, B.; Kunjomana, A.G. Study of Stacking Structure of Amorphous Carbon by X-Ray Diffraction Technique. Int. J. Electrochem. Sci. 2012, 7, 3127–3134. [Google Scholar]
  43. Suphankij, S.; Mekprasart, W.; Pecharapa, W. Photocatalytic of N-doped TiO2 Nanofibers Prepared by Electrospinning. Energy Procedia 2013, 34, 751–756. [Google Scholar] [CrossRef] [Green Version]
  44. Ansari, F.; Ghaedi, M.; Taghdiri, M.; Asfaram, A. Application of ZnO nanorods loaded on activated carbon for ultrasonic assisted dyes removal: Experimental design and derivative spectrophotometry method. Ultrason. Sonochem. 2016, 33, 197–209. [Google Scholar] [CrossRef] [PubMed]
  45. Khatami, M.; Varma, R.S.; Zafarnia, N.; Yaghoobi, H.; Sarani, M.; Kumar, V.G. Applications of green synthesized Ag, ZnO and Ag/ZnO nanoparticles for making clinical antimicrobial wound-healing bandages. Sustain. Chem. Pharm. 2018, 10, 9–15. [Google Scholar] [CrossRef]
  46. Ding, L.; Yang, S.; Liang, Z.; Qian, X.; Chen, X.; Cui, H.; Tian, J. TiO2 nanobelts with anatase/rutile heterophase junctions for highly efficient photocatalytic overall water splitting. J. Colloid Interface Sci. 2020, 567, 181–189. [Google Scholar] [CrossRef] [PubMed]
  47. Caglar, Y.; Caglar, M.; Ilican, S. XRD, SEM, XPS studies of Sb doped ZnO films and electrical properties of its based Schottky diodes. Optik 2018, 164, 424–432. [Google Scholar] [CrossRef]
  48. El Mouchtari, E.M.; Daou, C.; Rafqah, S.; Najjar, F.; Anane, H.; Piram, A.; Hamade, A.; Briche, S.; Wong-Wah-Chung, P. TiO2 and activated carbon of Argania Spinosa tree nutshells composites for the adsorption photocatalysis removal of pharmaceuticals from aqueous solution. J. Photochem. Photobiol. A Chem. 2020, 388, 112183. [Google Scholar] [CrossRef]
  49. Omri, A.; Lambert, S.D.; Geens, J.; Bennour, F.; Benzina, M. Synthesis, Surface Characterization and Photocatalytic Activity of TiO2 Supported on Almond Shell Activated Carbon. J. Mater. Sci. Technol. 2014, 30, 894–902. [Google Scholar] [CrossRef]
  50. Ullattil, S.G.; Periyat, P.; Naufal, B.; Lazar, M.A. Self-Doped ZnO Microrods—High Temperature Stable Oxygen Deficient Platforms for Solar Photocatalysis. Ind. Eng. Chem. Res. 2016, 55, 6413–6421. [Google Scholar] [CrossRef]
  51. Gorgulho, H.F.; Mesquita, J.P.; Gonçalves, F.; Pereira, M.F.R.; Figueiredo, J.L. Characterization of the surface chemistry of carbon materials by potentiometric titrations and temperature-programmed desorption. Carbon N. Y. 2008, 46, 1544–1555. [Google Scholar] [CrossRef]
  52. Bandosz, T.J.; Policicchio, A.; Florent, M.; Li, W.; Poon, P.S.; Matos, J. Solar light-driven photocatalytic degradation of phenol on S-doped nanoporous carbons: The role of functional groups in governing activity and selectivity. Carbon N. Y. 2020, 156, 10–23. [Google Scholar] [CrossRef]
  53. Szekeres, M.; Tombácz, E. Surface charge characterization of metal oxides by potentiometric acid-base titration, revisited theory and experiment. Colloids Surf. A Physicochem. Eng. Asp. 2012, 414, 302–313. [Google Scholar] [CrossRef] [Green Version]
  54. Nagamani, B.; Srinivasu, C. Physical parameters and structural analysis of titanium doped binary boro silicate glasses by spectroscopic techniques. Mater. Today Proc. 2019, 18, 2077–2083. [Google Scholar] [CrossRef]
  55. Apopei, P.; Orha, C.; Popescu, M.I.; Lazau, C.; Manea, F.; Catrinescu, C.; Teodosiu, C. Diclofenac removal from water by photocatalysis- assisted filtration using activated carbon modified with N-doped TiO2. Process Saf. Environ. Prot. 2020, 138, 324–336. [Google Scholar] [CrossRef]
  56. Varnagiris, S.; Medvids, A.; Lelis, M.; Milcius, D.; Antuzevics, A. Black carbon-doped TiO2 films: Synthesis, characterization and photocatalysis. J. Photochem. Photobiol. A Chem. 2019, 382, 111941. [Google Scholar] [CrossRef]
  57. Park, Y.; Kim, W.; Park, H.; Tachikawa, T.; Majima, T.; Choi, W. Carbon-doped TiO2 photocatalyst synthesized without using an external carbon precursor and the visible light activity. Appl. Catal. B Environ. 2009, 91, 355–361. [Google Scholar] [CrossRef]
  58. Wu, X.; Yin, S.; Dong, Q.; Guo, C.; Li, H.; Kimura, T.; Sato, T. Synthesis of high visible light active carbon doped TiO2 photocatalyst by a facile calcination assisted solvothermal method. Appl. Catal. B Environ. 2013, 142–143, 450–457. [Google Scholar] [CrossRef]
  59. Ayawei, N.; Ebelegi, A.N.; Wankasi, D. Modelling and Interpretation of Adsorption Isotherms. J. Chem. 2017, 2017, 3039817. [Google Scholar] [CrossRef]
  60. Heiba, H.F.; Taha, A.A.; Mostafa, A.R.; Mohamed, L.A.; Fahmy, M.A. Preparation and characterization of novel mesoporous chitin blended MoO3-montmorillonite nanocomposite for Cu(II) and Pb(II) immobilization. Int. J. Biol. Macromol. 2020, 152, 554–566. [Google Scholar] [CrossRef]
  61. Hoque, M.A.; Guzman, M.I. Photocatalytic activity: Experimental features to report in heterogeneous photocatalysis. Materials 2018, 11, 1990. [Google Scholar] [CrossRef] [Green Version]
  62. Kisch, H. On the problem of comparing rates or apparent quantum yields in heterogeneous photocatalysis. Angew. Chem. Int. Ed. 2010, 49, 9588–9589. [Google Scholar] [CrossRef]
  63. Kisch, H.; Bahnemann, D. Best Practice in Photocatalysis: Comparing Rates or Apparent Quantum Yields? J. Phys. Chem. Lett. 2015, 6, 1907–1910. [Google Scholar] [CrossRef]
  64. Catherine, H.N.; Ou, M.H.; Manu, B.; Shih, Y.H. Adsorption mechanism of emerging and conventional phenolic compounds on graphene oxide nanoflakes in water. Sci. Total Environ. 2018, 635, 629–638. [Google Scholar] [CrossRef] [PubMed]
  65. Wang, W.; Gong, Q.; Chen, Z.; Wang, W.D.; Huang, Q.; Song, S.; Chen, J.; Wang, X. Adsorption and competition investigation of phenolic compounds on the solid-liquid interface of three-dimensional foam-like graphene oxide. Chem. Eng. J. 2019, 378, 122085. [Google Scholar] [CrossRef]
  66. Pedrosa, M.; Da Silva, E.S.; Pastrana-Martínez, L.M.; Drazic, G.; Falaras, P.; Faria, J.L.; Figueiredo, J.L.; Silva, A.M.T. Hummers’ and Brodie’s graphene oxides as photocatalysts for phenol degradation. J. Colloid Interface Sci. 2020, 567, 243–255. [Google Scholar] [CrossRef] [PubMed]
  67. Fu, C.C.; Juang, R.S.; Huq, M.M.; Hsieh, C. Te Enhanced adsorption and photodegradation of phenol in aqueous suspensions of titania/graphene oxide composite catalysts. J. Taiwan Inst. Chem. Eng. 2016, 67, 338–345. [Google Scholar] [CrossRef]
  68. Murillo-Acevedo, Y.; Bernal-Sanchez, J.; Giraldo, L.; Sierra-Ramirez, R.; Moreno-Piraján, J.C. Initial Approximation to the Design and Construction of a Photocatalysis Reactor for Phenol Degradation with TiO2 Nanoparticles. Acs Omega 2019, 4, 19605–19613. [Google Scholar] [CrossRef] [Green Version]
Figure 1. From left to right, nitrogen isotherms (77 K) and pore size distribution (PSD) calculated using the density functional theory (DFT) method.
Catalysts 10 00574 g001
Figure 2. Powder X-ray diffraction (PXRD) patterns.
Catalysts 10 00574 g002
Figure 3. SEM micrographs taken with a working distance (WD) of 9.12 mm, accelerating voltage for electrons (HV) of 10 kV, and backscattering electron detector (BSE) of (A) AC, (B) AC–TiO2, and (C) AC–ZnO. EDS mapping and sum spectrum of (D) AC–TiO2 and (E) AC–ZnO.
Catalysts 10 00574 g003aCatalysts 10 00574 g003b
Figure 4. FT-IR spectra.
Catalysts 10 00574 g004
Figure 5. From left to right, pKa distribution and proton binding curves.
Catalysts 10 00574 g005
Figure 6. From left to right, DRS spectra and Tauc’s plot.
Catalysts 10 00574 g006
Figure 7. Adsorption isotherms of phenol at 298 K.
Catalysts 10 00574 g007
Figure 8. Adsorption kinetics of phenol. Dashed line (- -) is pseudo-first order (PFO) and solid line (-) is pseudo-second order (PSO) model.
Catalysts 10 00574 g008
Figure 9. From left to right, kinetics of phenol photodegradation and first-order linear regression of the kinetic data (initial concentration, 50 ppm; lamp power, 9 W; wavelength, 356 nm, 9.37 × 10¹⁵ photons cm−2·min−1; temperature, 295 K).
Catalysts 10 00574 g009
Figure 10. From left to right, UV–Vis spectra of phenol photodegradation over time for AC–TiO2 and TiO2.
Catalysts 10 00574 g010
Table 1. BET and Quenched Solid Density Functional Theory (QSDFT) parameters.
MaterialBETQSDFT
SBET (m2∗g−1)C (Energy Constant)Vpore (cm3∗g−1)Half Pore Width (Å)
AC1100203.10.8795.25
AC–TiO2440267.00.5574.09
AC–ZnO218253.80.1585.03
Table 2. Parameters calculated for Langmuir and Freundlich isotherm models.
ModelParameterACAC–TiO2AC–ZnO
Langmuirqm (mg∗g−1)39.3037.1832.87
KL (L∗mg−1)0.0320.0330.015
s (mg∗g−1)1.241.501.21
FreundlichKF2.722.831.13
1/n0.550.520.62
s (mg∗g−1)1.780.861.43
Table 3. Kinetic parameters of the model PFO and PSO.
ACAC–TiO2AC–ZnO
Pseudo-firstqe (mg·g−1)18.2716.208.48
k1 (h−1)1.321.260.98
s (mg·g−1)0.290.460.31
Pseudo-secondqe (mg·g−1)20.1818.069.80
k2 (g·mg−1h−1)0.110.110.13
s (mg·g−1)0.200.100.19
Table 4. Characteristics of the reagents and their respective CAS.
Metal Oxide (MO)CASMolecular Mass (g·mol−1)SupplierPurityCrystalline PhaseParticle Size (nm)
TiO213463-67-779.87Sigma-Aldrich99%Rutile–Anatase21
ZnO1314-13-281.39Sigma-Aldrich99%Wurtzite50

