Article

Selective Production of Acetic Acid via Catalytic Fast Pyrolysis of Hexoses over Potassium Salts

MOE (Ministry of Education) Key Laboratory of Bio-Based Material Science and Technology (Material Science and Engineering College), Northeast Forestry University, Harbin 150040, China
*
Author to whom correspondence should be addressed.
Catalysts 2020, 10(5), 502; https://doi.org/10.3390/catal10050502
Submission received: 31 March 2020 / Revised: 29 April 2020 / Accepted: 29 April 2020 / Published: 2 May 2020
(This article belongs to the Special Issue Catalytic Fast Pyrolysis II)

Abstract

:
Glucose and fructose are widely available and renewable resources. They were used to prepare acetic acid (AA) under the catalysis of potassium acetate (KAc) by thermogravimetric analysis (TGA) and pyrolysis coupled with gas chromatography and mass spectrometry (Py-GC/MS). The TGA result showed that the KAc addition lowered the glucose’s thermal decomposition temperatures (about 30 °C for initial decomposition temperature and 40 °C for maximum mass loss rate temperature), implying its promotion of glucose’s decomposition. The Py-GC/MS tests illustrated that the KAc addition significantly altered the composition and distribution of hexose pyrolysis products. The maximum yield of AA was 52.1% for the in situ catalytic pyrolysis of glucose/KAc (1:0.25 wt/wt) mixtures at 350 °C for 30 s. Under the same conditions, the AA yield obtained from fructose was 48% and it increased with the increasing amount of KAc. When the ratio reached to 1:1, the yield was 53.6%. In comparison, a study of in situ and on-line catalytic methods showed that KAc can not only catalyze the primary cracking of glucose, but also catalyze the cracking of a secondary pyrolysis stream. KAc plays roles in both physical heat transfer and chemical catalysis.

1. Introduction

Acetic acid (AA) is a widely used bulk chemical in industrial production, with an annual output exceeding 10 million tons [1,2]. Generally, AA is consumed to produce acetic anhydride, vinyl acetate monomer [3], cellulose acetate [4] and calcium magnesium acetate which is called low corrosive and environmentally friendly deicer [5,6,7]. It can be used as a green solvent for the production of pure terephthalic acid in the food industry [8].
There are several processes for AA production, such as microbial fermentation, methanol carbonylation, hydrocarbons (ethylene, acetaldehyde, butane and naphtha) oxidation, synthesis gas preparation, methyl formate isomerization, hydrothermal oxidation and pyrolysis. Microbial fermentation was the earliest method for producing AA, and is still used in the food industry today. The traditional raw material in microbial fermentation is mono-saccharide [9]. Today, attempts have been made to reduce the cost by using materials such as lignocellulose. However, due to the complicated composition, the yield of direct conversion via fermentation is low. To solve this problem, pretreatment operations are necessary [10,11]. Besides, the separation of downstream products is difficult, leading to multiple dilemmas in the fermentation process. Methanol carbonylation and oxidation of hydrocarbons are currently the dominant industrial processes [8]. The BP–Monsanto Cativa process, employing noble metals as catalysts, significantly increased the AA proportion [12]. However, there exist some shortages like limited catalyst solubility and the tremendous loss of precipitated noble metals. Moreover, methanol is produced from non-renewable syngas [13,14,15]. Ethylene oxidation has by-products [16] such as acetaldehyde and CO2, and the recovery of the unreacted ethylene is difficult. Besides, ethylene escaping into the air will cause environmental pollution. The current long-established industrial AA production methods including microbial fermentation and methanol carbonylation have their own insurmountable shortcomings, especially the increasingly prominent problems concerning resources and the environment, so researchers have begun to explore new methods.
Jin Fangming’s team [5,7,17,18,19,20] proposed a one-pot and one-pot two-step hydrothermal reaction method using biomass resources such as kitchen garbage to prepare AA, and remarkable achievements have been obtained. Among them, the improved one-pot two-step process got a considerable yield of AA. Due to the unique properties of high temperature water, hydrothermal reaction is considered to be a promising process for the preparation of AA, but it is relatively complex and time consuming. Rapid pyrolysis is an important method for the thermochemical conversion of biomass-derived materials [21,22]. Biomass selective pyrolysis to get high-value products is the cutting-edge technology for the high-value utilization of biomass and has broad market prospects and excellent economic and social benefits. Gas chromatography and mass spectrometry coupled with the pyrolysis technique (Py-GC/MS) is a powerful and widely diffused analytic tool for the study of biomass [23,24,25,26]. Studies have clearly shown that alkali metal salts have a significant impact on the thermal decomposition behavior of biomass [27,28,29]. Nowakowski et al. [30] studied the effect of potassium acetate (KAc) on the pyrolysis behavior of cellulose. They found that KAc promoted the formation of low molecular weight compounds.
In the present work, a simple approach to produce AA via the catalytic fast pyrolysis of glucose and fructose with KAc was proposed. The influence of the catalyst on the thermogravimetric behavior of glucose was studied. The efficiency of the on-line and in situ catalysis was compared. The effects of the reaction parameters were investigated, including the catalyst dosage and the heating time on the selectivity of AA.

2. Results and Discussion

2.1. TGA Results

The thermogravimetric analysis (TGA) and differential thermogravimetric (DTG) profiles of glucose, KAc and a glucose/KAc mixture (1:0.25) obtained at a heating rate of 40 °C/min are shown in Figure 1. In addition, the corresponding pyrolysis parameters such as the initial decomposition temperature (Ti), the maximum mass loss rate temperature (Tmax) and the residual mass (in %) at 350 °C of the studied samples are given in Table 1. The addition of the KAc to the glucose made the thermogravimetric (TG) and DTG profiles shift to the lower temperature region. Both the glucose and the KAc DTG curves had a distinct peak corresponding to the decomposition and no dehydration peaks indicated that the material were not damp again after overnight drying. Two distinct peaks appeared on the DTG curve of the mixture. The peak in the 100 °C to 250 °C interval was assigned to the decomposition of glucose, which appeared to move toward lower temperatures, indicating that the presence of KAc lowered the decomposition temperature of glucose. The mass losses of the mixture between 400 °C–550 °C might be attributed to the formation and release of acetone by KAc decomposition, which could be seen from the varying pyrolysis behavior and product distributions for the in situ pyrolysis at 350 °C and 600 °C (with and without KAc), respectively.
For further understanding the influence of the addition of catalysts on glucose pyrolysis characteristics, some characteristic parameters were calculated and are presented in Table 1. The initial decomposition temperature of glucose was 188 °C, the maximum mass loss rate temperature was 220 °C and the residual mass at 350 °C was 32% in the absence of a catalyst. The catalysts used herein (KAc, NaAc and K2CO3) decomposed slightly or hardly at 350 °C (Table 1). This was consistent with previous studies [29,31]. Both the Ti and Tmax temperatures of the samples lowered after the catalyst addition. Ti decreased about 30 °C, while the decrease of Tmax was approximately 40 °C. It’s worth mentioning that the Tmax decrease is mainly attributed to the glucose thermal decomposition and is almost independent from the catalyst used (Table 1). The thermogravimetric analysis of glucose and the mixtures showed that KAc, NaAc and K2CO3 affected the glucose decomposition characteristics, making it easier to be broken down.

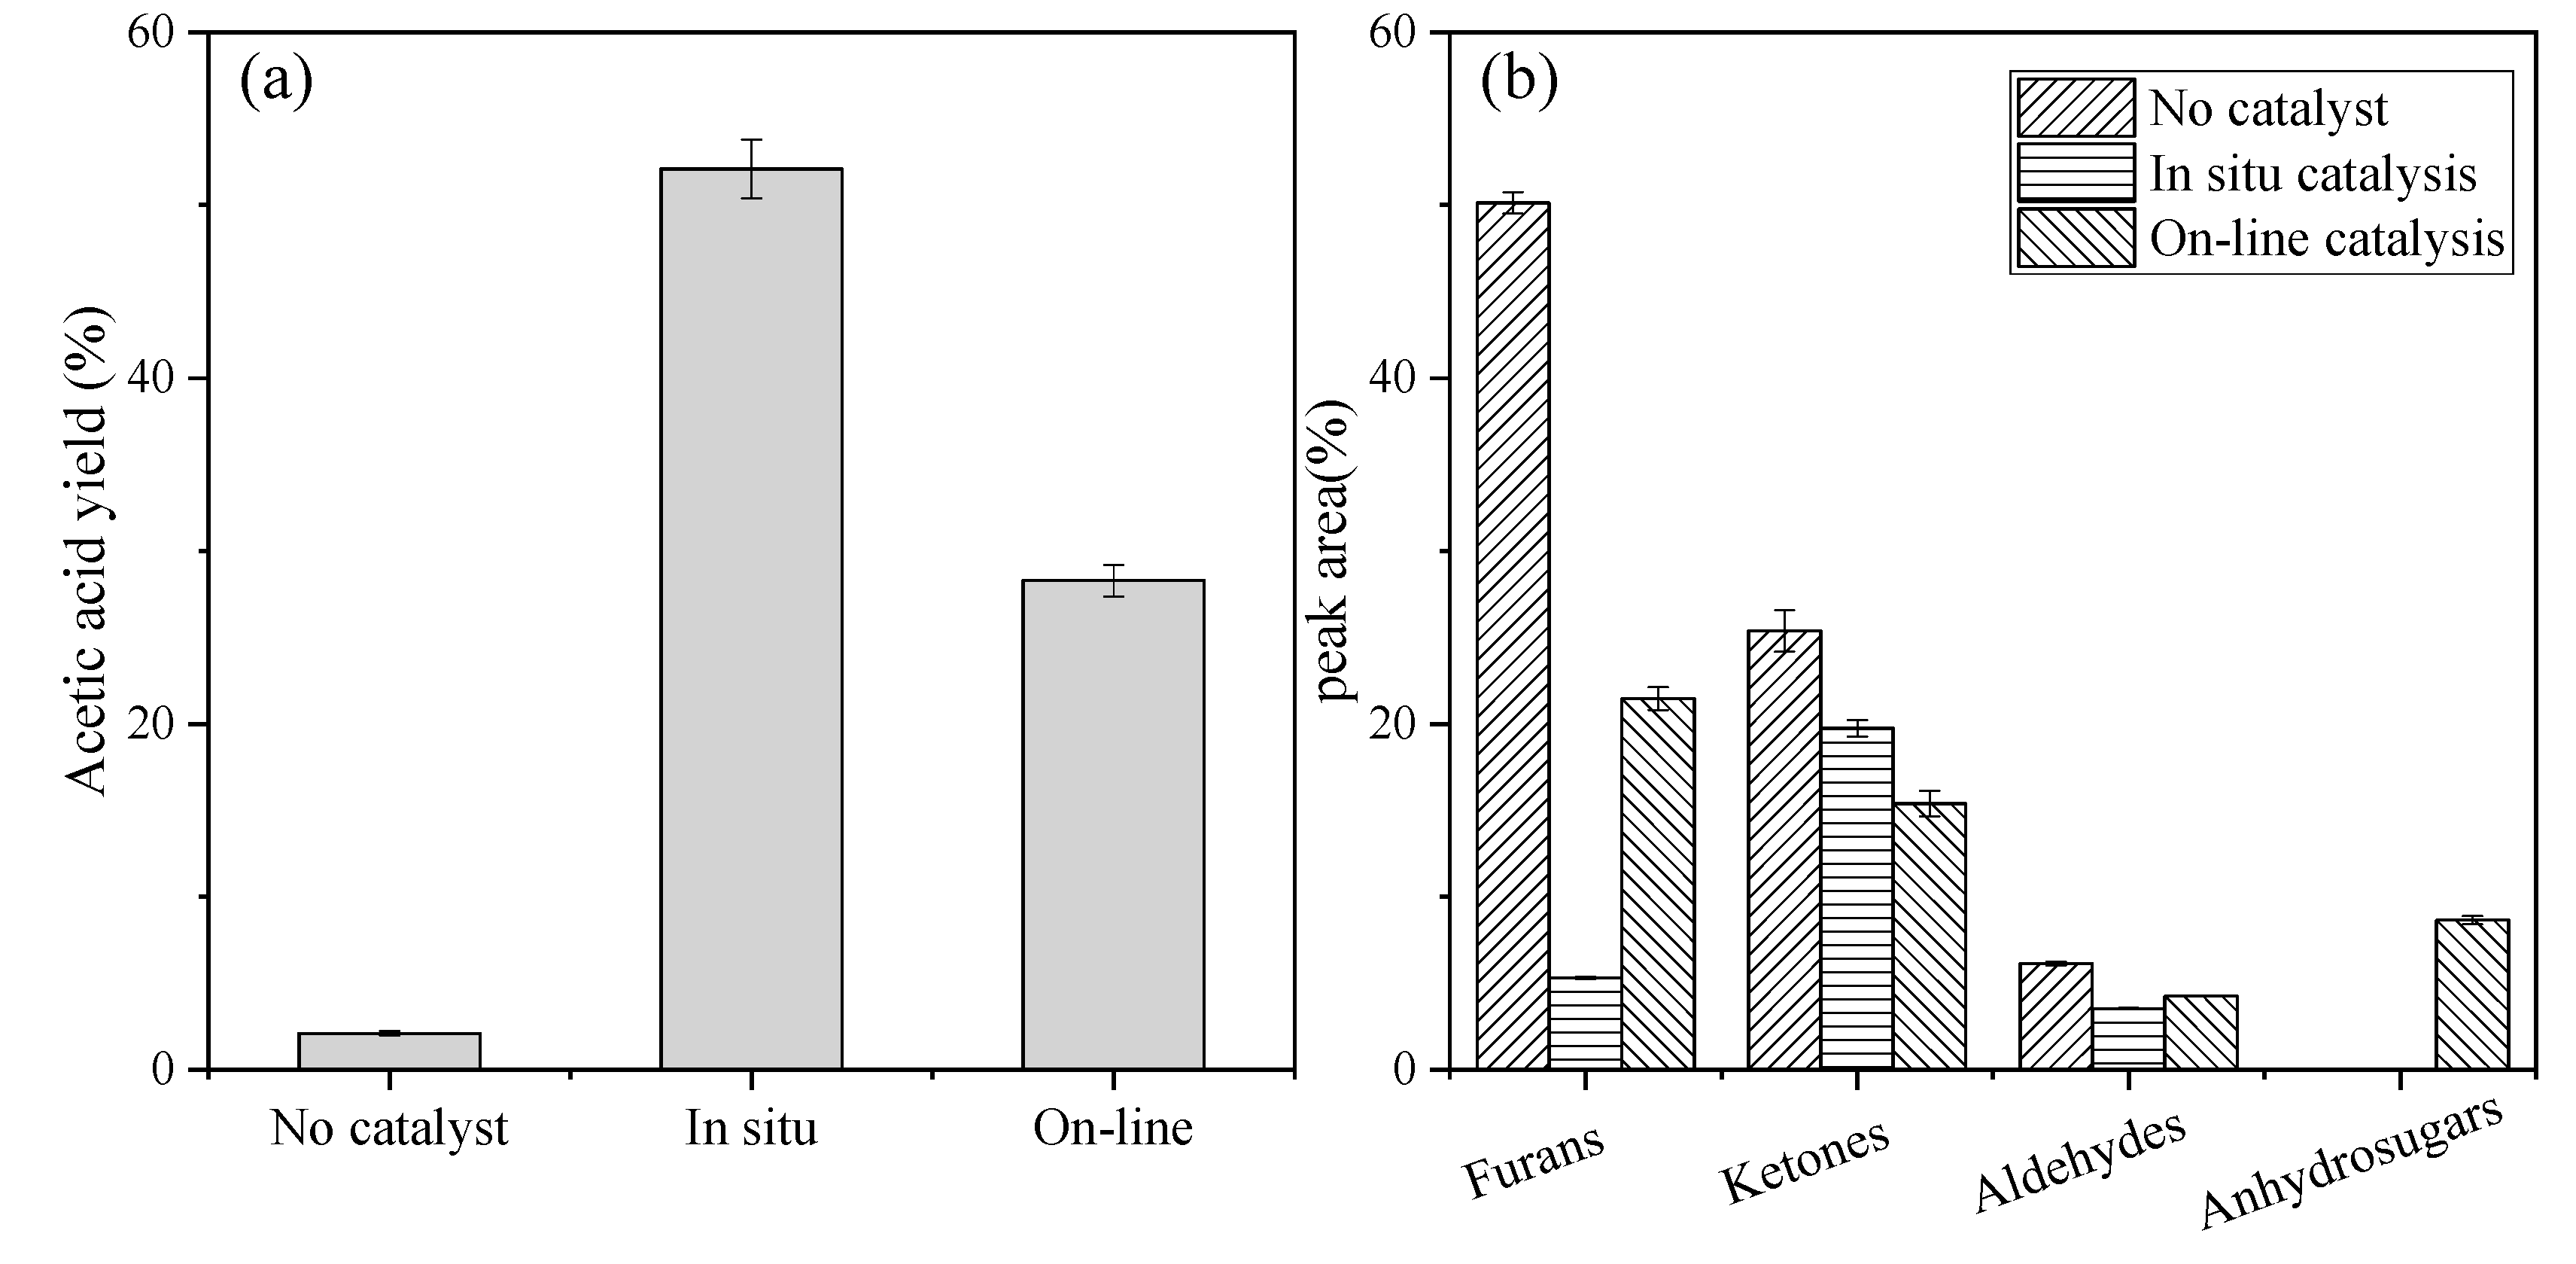
2.2. Effect of Catalytic Methods

For the in situ catalysis, glucose was uniformly mixed with KAc, fully ground and then pyrolyzed. For the on-line catalysis, glucose was separated from the catalyst by quartz wool pyrolysis and the glucose was pyrolyzed as such with a continuous transfer of the volatile pyrolysis products through the bed of KAc. In both methods, the mass ratio of glucose to KAc was 1:0.25 and the pyrolysis temperature was set at 350 °C for 30 s. The pyrolysis of glucose without catalyst was carried out under the same conditions for comparison. The identified products were divided into five groups, including AA, aldehydes, ketones, anhydrosugars and furans (Figure 2).
The main products of the pure glucose pyrolysis were furans. Their contents were about half of all the detected gaseous products. This is consistent with the literature report [32]. However, AA became the dominant product in both in situ and on-line catalysis processes. The AA contents (peak area %) were 60.8% and 33.1% in these two methods, respectively. During the pyrolysis process, KAc played roles in the both physical heat transfer and chemical catalysis. First, at a pyrolysis temperature (350 °C) higher than its melting point (292 °C), KAc melted into a liquid state. This phase transformation from solid to liquid was beneficial to both the mass transfer and heat transfer of the reaction system. It would further homogenize the system temperature and simplify the pyrolysis reactions to a certain extent. Second, alkali metal ions can promote the decomposition of glucosidic units by a heterolytic mechanism and favor its direct depolymerization and fragmentation into low molecular weight components like acetic acid, formic acid, glyoxal, hydroxyl-acetaldehyde and hydroxyl-propanone [30]. Both of the above functions of KAc existed in the in situ catalysis process, while in the on-line catalysis process KAc mainly played a catalytic role. Owing to this, compared to the on-line catalysis, the AA formation in the in situ catalysis was further enhanced and very small amounts of furans were detected. The amount of furans formed in on-line catalysis was higher than that of the in situ catalysis, but lower than that of the glucose pyrolysis without a catalyst. This indicated that KAc can catalyze the secondary decomposition of pyrolysis vapor (mainly furans) to form AA, especially in the in situ catalysis, where a better contact between the glucose and the catalyst effectively promoted the cleavage of the furan derivatives to form large amounts of AA.
The typical glucose pyrolysis products formed in the in situ catalysis and the on-line catalysis are comparatively presented in Table 2. In absence of the catalyst, the product had the highest furfural content, followed by 5-HMF, acetone and hydroxyl-acetaldehyde. The AA yield of glucose pyrolysis without catalyst was 2.09% after quantification, echoing the previous research results that only trace AA was formed during the pyrolysis of cellulose and glucose [33,34,35]. A small amount of furan derivatives was produced in the in situ catalysis, and no anhydrosugars, hydroxyacetaldehyde, acetone or 3-methyl-1,2-cyclopentanedione were detected. The yield of AA was 52.1% after quantification and the conversion of glucose was 72%. The major furan compounds identified in the on-line catalysis included 2-furanmethanol, 5-methyl-2-furancarboxaldehyde, 2,5-dimethyl-4-hydroxyl-3(2H)-furanone, 3-methyl-furan, furfural and 2,5-furandicarboxaldehyde. Furfural was the most abundant with a peak area percentage of 12.1%. The comparative analysis shows that the KAc addition significantly changed the composition and distribution of the glucose pyrolysis products, especially by promoting the AA formation while inhibiting the production of furans.

2.3. Effect of Pyrolysis Time

In order to understand the effect of the different heating times on the glucose pyrolysis product composition and distribution, the products were divided into AA, furans, ketones, aldehydes, anhydrosugars and esters (Figure 3).
Figure 3a reflects the effect of the different heating times on the yield of AA, the maximum occurring at 30 s. The yield decreased at 60 s, showing that the extended heating time promoted the conversion of glucose into other products. At 10 s, the pyrolysis was insufficient and the actual pyrolysis temperature was lower than the set value in rapid pyrolysis [36], resulting in the lowest AA yield. Figure 3b shows the percentage of the peak area of other products at different heating times and the ketones content was always the highest. No anhydrosugar was detected at 30 s. The maximum anhydrosugar yield was obtained at 10 s and anhydrosugar was also produced at 60 s. From this, it was speculated that lowering the reaction temperature during the pyrolysis of glucose by KAc was beneficial for the formation of anhydrosugar, and the effect of prolonging the heating time needs further confirmation.
The peak area percentage of the typical pyrolysis products of glucose and KAc mixture (1:0.25 wt/wt) at different heating times is shown in Table 3. For a reaction time programmed to 10 s, 5-HMF was the major furan compound and especially levoglucosan, with a peak area which counted for 15.7%, had an absolute advantage. Extending the reaction time to 60 s induced changes in the composition of the pyrolysis products. The three most abundant substances in the products were methylglyoxal, 1-hydroxyl-2-propanone and furfural. At a moderate reaction time of 30 s, 2-furanmethanol, butyrolactone, 2,3-pentanone and AA were the major pyrolysis products while levoglucosan was found in minor amounts.

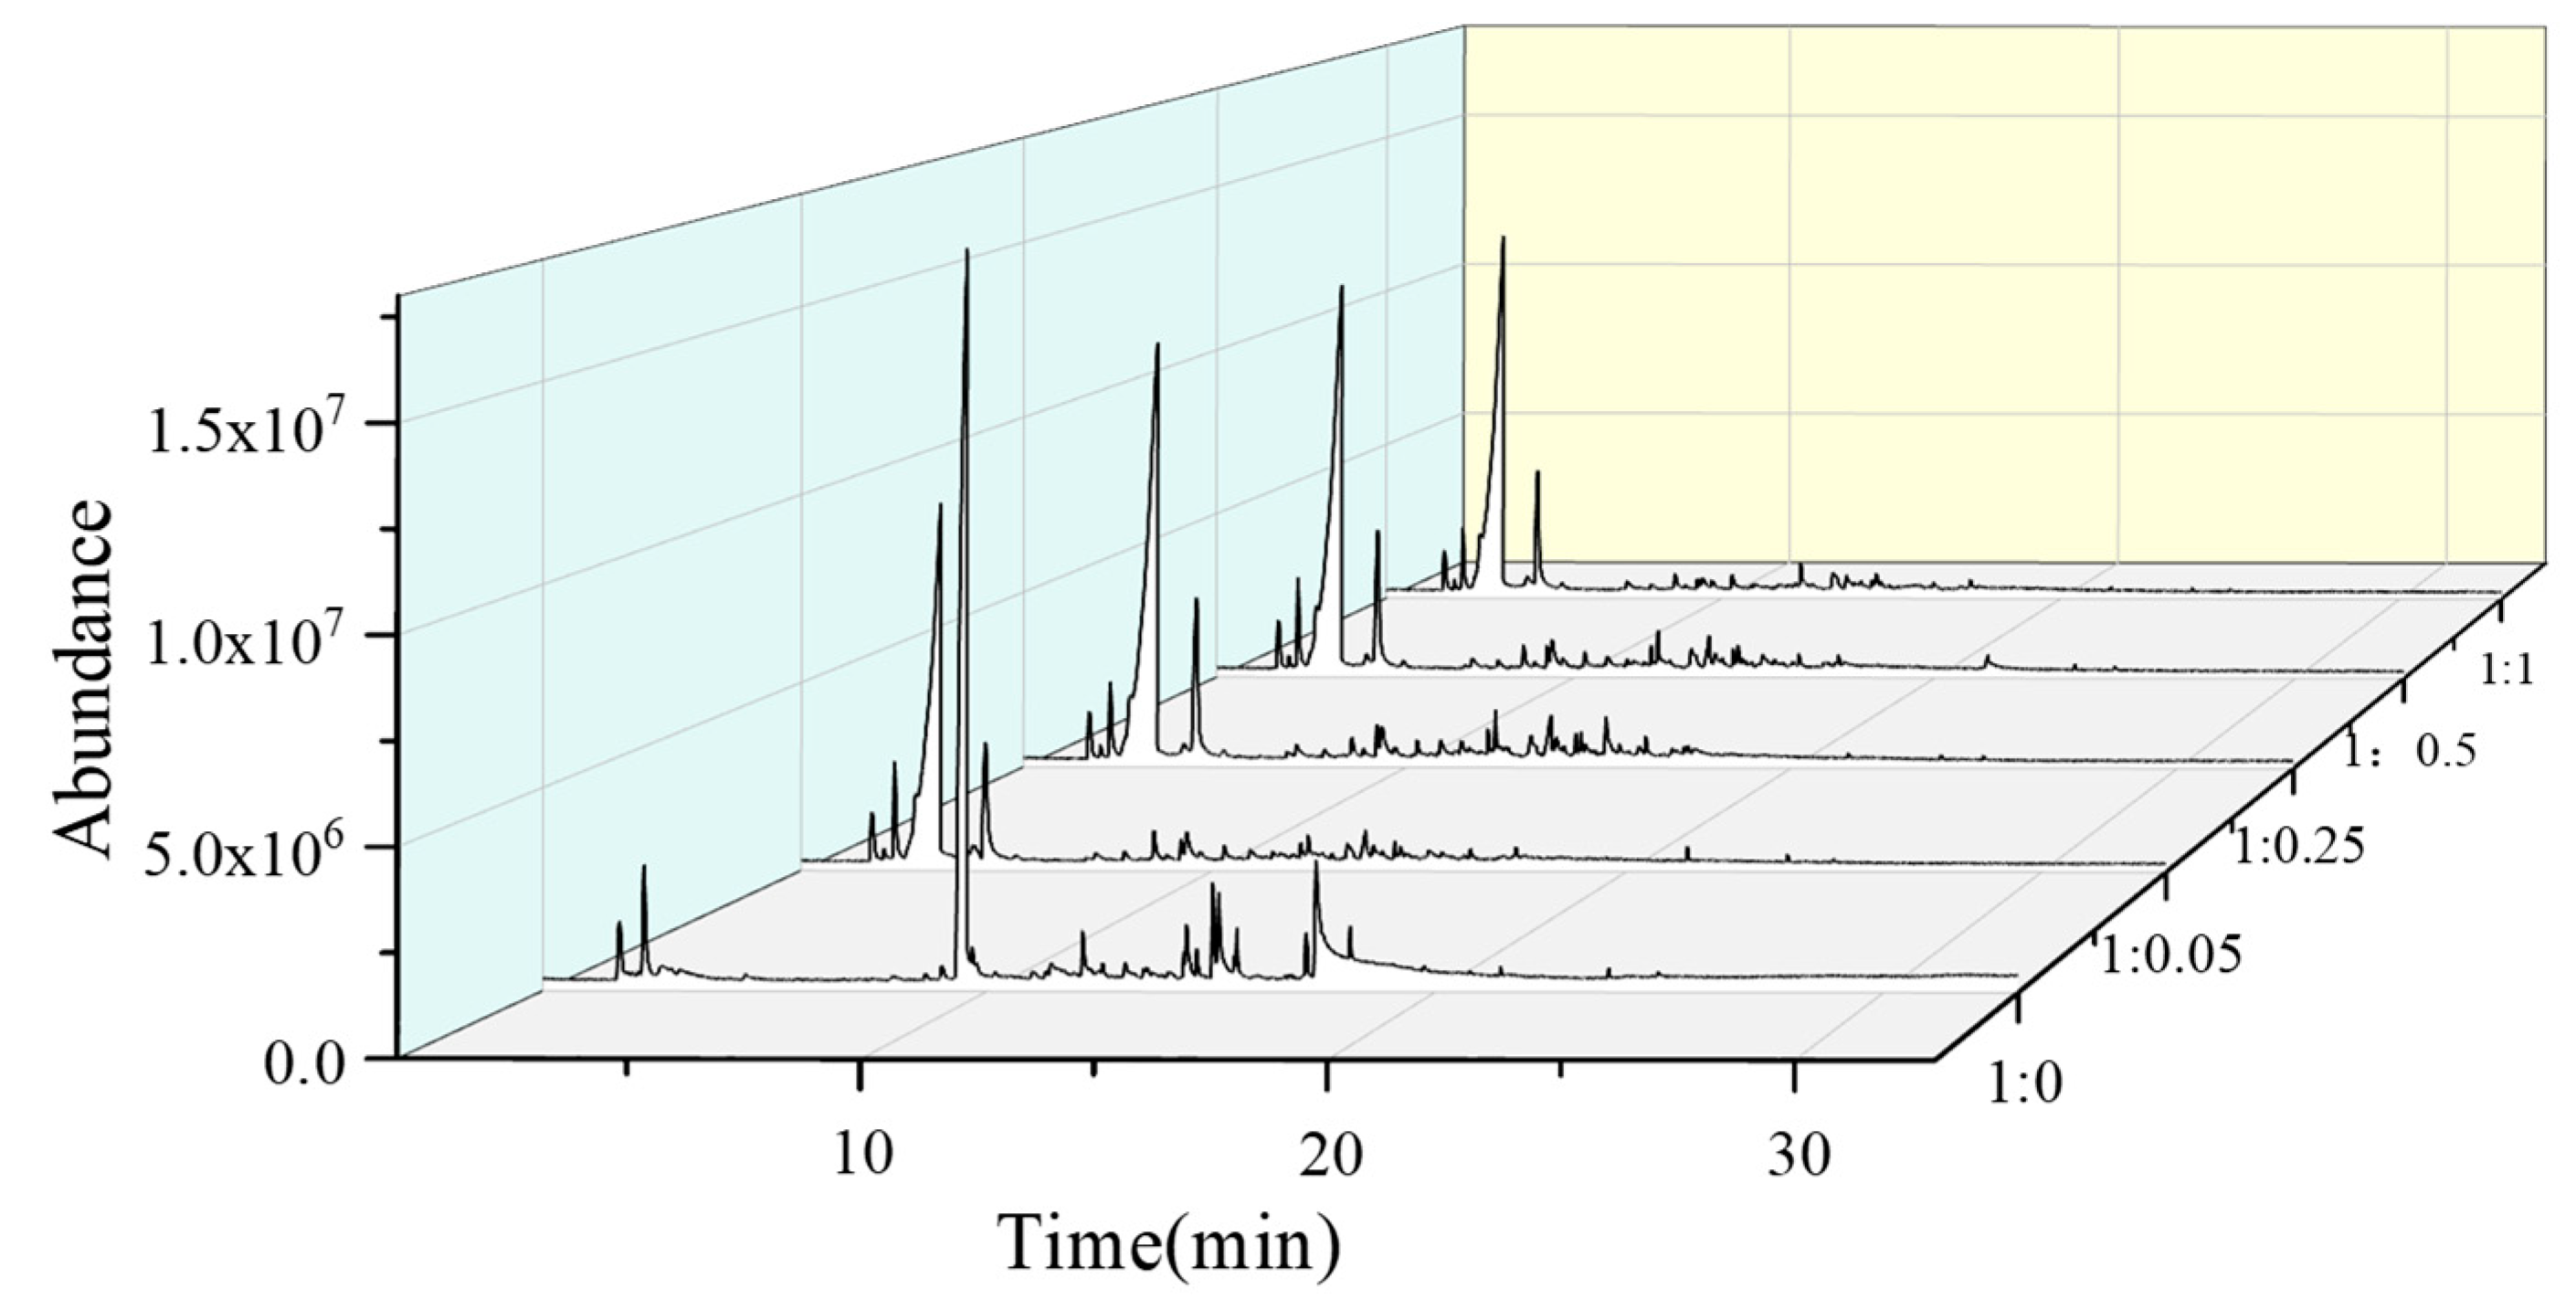
2.4. Effect of the Catalyst Dosage

The effect of the KAc dosage on the composition and distribution of pyrolysis products was investigated. The pyrograms were obtained by Py-GC/MS as shown in Figure 4. The addition of KAc significantly altered the total ion chromatogram of the glucose pyrolysis products, making AA in the identified products an absolute superior product. According to the TGA, the KAc decomposition occurred at about 400 °C. However, due to the high sensitivity of the gas chromatography and mass spectrometry (GC/MS) instrument, trace AA was detected at 350 °C, and the peak area was much lower than CO2, which did not conflict with the TG results. The major pyrolysis product of KAc at 600 °C was acetone (70.34 area %) and only 1.1% AA was identified. This result was similar to those of literature studies where acetone was formed as the main product from the thermal decomposition of acetates [37,38]. The product composition was simplified as the KAc content increased. This effect was optimal when the mass ratio was 1:0.25. The addition of K2CO3 also changed the composition and distribution of the glucose pyrolysis products, resulting in a decrease in the furan species and an increase in the AA content.
The typical products detected and the peak areas (%) by the different KAc amounts for catalyzing glucose pyrolysis are shown in Table 4. When the mass ratio was 1:0.05, the AA content increased sharply at the sacrifice of furans. At 1:0.25, the yield was rising to a maximum. When increasing KAc dosage, the AA yield showed a downward trend. It is speculated that the excessive KAc content prolonged the heat conduction process [39], resulting in the actual pyrolysis temperature of glucose being lower than the set value and the temperature was the key parameter at that time. The addition of KAc resulted in a decrease in the proportion of furans. When the mass ratio was 1:0.25 and 1:0.5, furfural was not detected. Furan was not found for the glucose/KAc ratio 1:0.1 and 5-HMF decreased from 15.9% (in absence of a catalyst, Table 4) to less than 3%. No acetone or hydroxyl-acetaldehyde were detected after the addition of the catalyst. The contents of 2,3-pentanedione, 1-hydroxyl-2-propanone and methylglyoxal showed a significant increase relative to the absence of a catalyst.
Figure 5a shows the yield of AA after adding the different KAc dosages. Adding KAc to the glucose, even a very small amount, greatly affected the products distribution. Figure 5b shows the peak area percentage for several types of products except for AA. The contents of ketones and furans in the pyrolysis products of glucose were higher, which accounted for about 40% of the gaseous products in total. When increasing the amount of catalyst, although the content of furans fluctuated, the overall trend was still downward.

2.5. Effect of Anions and Cations

The effects of anions and cations on the composition and distribution of the pyrolysis products were investigated using Py-GC/MS at a pyrolysis temperature of 350 °C for a heating time of 30 s and a mass ratio of glucose to catalyst of 1:0.25 (Table 5). The results showed that a relatively high yield of AA was obtained for each of the catalyzed conditions, which was quantified to 18.7%~52.1%. In order to clearly show the differences in the products’ compositions, they were divided into five groups, including aldehydes, ketones, furans, esters and AA.
KAc, NaAc and K2CO3 all promoted the pyrolysis of glucose to produce AA (Table 5). When KAc was used as the catalyst, the AA yield was the highest and the yields for the other four classes of products were lower when catalyzed by two other catalysts. NaAc had a similar catalytic effect and the conversion of glucose was 73%. After the catalyst was added, the furans content was reduced to less than 20%, and the anhydroglucoses were negligible. The quantitative yield of AA was 18.7% when K2CO3 was used as the catalyst and the most abundant products were ketones and furan derivatives, which accounted for more than half of the total product content. It indicated that acetate played a greater role in the production of AA from glucose than carbonate. Carbonate can promote the formation of ketones.
The typical products and the peak area percentages of the glucose pyrolysis products when catalyzed by acetates or carbonate are listed in Table 6. It can be seen that anions have an important influence on the composition and distribution of the product. Under the same reaction conditions, when KAc was used as the catalyst, the quantitative yield of AA sharply increased from 2.09% to 52.1%. However, the quantitative yield in the case of K2CO3 as the catalyst was only 18.7%. When acetate was used as the catalyst, acetone and furfural were not detected in the pyrolysis product, and the content of 5-HMF decreased significantly. Compared to the pyrolysis of glucose without catalysts, the addition of K2CO3 resulted in less formation of furfural, 2,3-pentanedione and butyrolactone but in more methylglyoxal, 1-hydroxyl-2-propanone and 5-HMF formation. In the in situ pyrolysis of fructose with potassium acetate as the catalyst, K2CO3 was much weaker than KAc and both cations and anions affected the formation of AA.

2.6. Potassium Acetate Catalyzed Fructose

The Py-GC/MS chromatograms of the pyrolysis of fructose catalyzed by the different amounts of KAc were plotted as a three-dimensional display (3-D) (Figure 6).
It can be clearly seen from the chromatograms in Figure 6 that the composition of the pyrolysis products was less complex for fructose when compared to the glucose pyrolysis. Furfural was the most abundant product for the fructose pyrolysis, which was in line with the findings of Mattonai et al. [40]. After adding KAc, the content of AA and 1-hydroxy-2-propanone in the products increased sharply, and the furfural decreased or even disappeared.
Table 7 shows the identified products and peak area percentages obtained by the pyrolysis of fructose without catalyst and after the addition of different dosages of KAc. The addition of KAc increased the variety of the products. The content of furfural in the products decreased from 58.4% to about 2% after adding KAc and there was a great decline in the content of 2,3-dihydro-3,5-dihydroxy-6-methyl-4H-pyran-4-one. The furyl hydroxymethyl ketone, 2,5-furancarboxaldehyde, 5-acetoxymethyl-2-furaldehyde, 5-hydroxymethyl-2-furaldehyde and 1,2,6-hexanetriol were not found in the pyrolysis products. No AA was detected without the addition of a catalyst. Even a small amount of KAc caused a significant increase in the AA yield. By adding KAc, the second richest product was 1-hydroxy-2-propanone, accounting for nearly 10% and the contents of acetic anhydride and formic anhydride were also significantly increased. Then, we added KAc to pure furfural and after pyrolysis only the furfural was detected, confirming that AA was from fructose and not from furfural.

3. Materials and Methods

3.1. Chemicals

Glucose, fructose, potassium acetate (KAc), sodium acetate (NaAc) and potassium carbonate (K2CO3) were purchased from Tianjin Zhiyuan Chemical Reagent Co. Ltd. (Tianjin, China). All chemicals were oven-dried at 103 °C overnight before use. In situ catalysis: the dried glucose and KAc solid powder were directly mixed and ground, then loaded into the quartz tube. On-line catalysis: glucose and KAc were layered in the quartz tube of the pyrolyzer, therefore, KAc could only catalyze the secondary reaction of the volatile vapors derived from the primary pyrolysis reaction of glucose.

3.2. TGA Analysis

The thermal decomposition of glucose in the absence and presence of a catalyst (KAc, NaAc or K2CO3), respectively, was performed on a thermogravimetric analyzer (TGA, NETZSCH-TG209F1, NETZSCH-Gerätebau GmbH, Waldkraiburg, Germany). The ratio of glucose to catalyst was 1/0.25 (wt/wt). All the sample dosages were 4.0 mg. The program temperature was raised to 700 °C from room temperature at 40 °C/min under an atmosphere of 99.99% nitrogen with a flow of 20 mL/min.

3.3. Py-GC/MS Analysis

The pyrolysis process was carried out on a CDS 5200 pyrolyzer (CDS Analytical, Inc. Oxford, PA, USA). The catalytic pyrolysis of glucose was conducted in two approaches (in situ or on-line cataysis). The thermal probe initial temperature was set to 40 °C and then the temperature was raised to a final temperature at a rate of 20 °C/min for several times. The pyrolysis stream generated by the thermal decomposition of the sample first left the tube and was collected by a cold trap. Then, the resulting mixture adsorbed in the cold trap was desorbed and passed through a probe into an Agilent 6890N gas chromatograph (GC, Santa Clara, CA, USA) for separation and detection on an Agilent 5973i mass spectrometer (MS, Santa Clara, CA, USA). The separation of volatile pyrolysis products was achieved using an Agilent DB-17ms capillary column (30 m × 0.25 mm × 0.25 μm film thickness). The split ratio was 10:1 and the helium carrier gas flow rate was 1 mL/min. The injector temperature was maintained at 250 °C and the transfer line temperature was 285 °C. Temperature program: the initial stage was 40 °C for 5 min, then increased to 230 °C at a heating rate of 5 °C/min, held for 5 min, finally raised to 280 °C at a heating rate of 10 °C/min and held for 5 min at this final temperature. The mass spectrometer operated in Electron Impact Ionization Source (EI) mode at 70 eV with a scan range of 20 to 550 amu. The ion source temperature was set to 230 °C. Peak identification was performed according to the National Institute of Standards and Technology (NIST)mass spectrometry library and related literature. The peak area percent was determined quantitatively based on the peak area. The experiment was run in parallel three times and averaged.

3.4. Quantitative and Qualitative Analysis

Considering its high volatility, AA was calibrated with reference to the method of Patwardhan et al. [32]. First, a standard curve was established by directly passing a series of known-amount AA (0 to 0.25 mg) to the GC/MS. Then, the test AA yields (ranging from 0 to 0.21 mg) were calculated based on the standard curve. Other products’ yields were expressed by peak area percentages based on the linear relationship between the peak area and the content although the response factor can give a significant effect on the absolute concentration of each product.

4. Conclusions

Potassium acetate-catalyzed pyrolysis of hexoses (glucose and fructose) was systemically studied by TGA and Py-GC/MS. Various catalysts like NaAc, K2CO3 were also studied for comparison. The addition of KAc not only significantly altered the glucose degradation behavior and lowered the Ti and Tmax temperatures, but also changed the composition and distribution of the hexose pyrolysis products. Specifically, KAc promoted the formation of acetic acid while inhibiting the formation of the intermediate products such as furans (furfural, 5-HMF), making acetic acid the dominant pyrolysis product of hexoses. The pyrolysis time, catalyst dosage and catalyst type all affected the pyrolysis products’ compositions and distributions to some extent. Compared with on-line catalysis, a better contact between the glucose and catalyst existed in the in situ catalysis, which promoted the AA formation more effectively. It can be concluded that KAc plays a key role in both physical heat transfer and chemical catalysis although its specific mechanism needs further study.

Author Contributions

Z.Z. conceived and designed the study, reviewed and edited the manuscript; W.K. performed the experiments and wrote the paper. All authors have read and agreed to the published version of the manuscript.

Funding

This work was supported by National Natural Science Foundation of China (Grant No. 31890773 and 31670570).

Acknowledgments

This material is based upon work performed at the MOE Key Laboratory of Bio-based Material Science and Technology at Northeast Forestry University.

Conflicts of Interest

The authors declare no conflict of interest.

References

  1. IJmker, H.M.; Gramblicka, M.; Kersten, S.R.A.; van der Ham, A.G.J.; Schuur, B. Acetic acid extraction from aqueous solutions using fatty acids. Sep. Purif. Technol. 2014, 125, 256–263. [Google Scholar] [CrossRef]
  2. Feng, Y.; Yin, H.; Wang, A.; Xue, W. Selectively catalytic oxidation of 1,2-propanediol to lactic, formic, and acetic acids over Ag nanoparticles under mild reaction conditions. J. Catal. 2015, 326, 26–37. [Google Scholar] [CrossRef]
  3. Budiman, A.W.; Nam, J.S.; Park, J.H.; Mukti, R.I.; Chang, T.S.; Bae, J.W.; Choi, M.J. Review of Acetic Acid Synthesis from Various Feedstocks Through Different Catalytic Processes. Catal. Surv. Asia 2016, 20, 173–193. [Google Scholar] [CrossRef]
  4. Ganster, J.; Fink, H.P. Cellulose and cellulose acetate. In Bio-Based Plastics: Materials and Applications, 1st ed.; Kabasci, S., Ed.; Wiley: West Sussex, UK, 2014; pp. 35–62. [Google Scholar]
  5. Jin, F.; Kishita, A.; Moriya, T.; Enomoto, H.; Sato, N. A New Process for Producing Ca/Mg Acetate Deicer with Ca/Mg Waste and Acetic Acid Produced by Wet Oxidation of Organic Waste. Chem. Lett. 2002, 31, 88–89. [Google Scholar] [CrossRef]
  6. Huo, Z.; Fang, Y.; Yao, G.; Zeng, X.; Ren, D.; Jin, F. Improved two-step hydrothermal process for acetic acid production from carbohydrate biomass. J. Energy Chem. 2015, 24, 207–212. [Google Scholar] [CrossRef]
  7. Jin, F.; Zhang, G.; Jin, Y.; Watanabe, Y.; Kishita, A.; Enomoto, H. A new process for producing calcium acetate from vegetable wastes for use as an environmentally friendly deicer. Bioresour. Technol. 2010, 101, 7299–7306. [Google Scholar] [CrossRef]
  8. Yoneda, N.; Kusano, S.; Yasui, M.; Pujado, P.; Wilcher, S. Recent advances in processes and catalysts for the production of acetic acid. Appl. Catal. A Gen. 2001, 221, 253–265. [Google Scholar] [CrossRef]
  9. Bhatia, S.K.; Yang, Y.-H. Microbial production of volatile fatty acids: Current status and future perspectives. Rev. Environ. Sci. Bio/Technol. 2017, 16, 327–345. [Google Scholar] [CrossRef]
  10. Bhatia, S.K.; Lee, B.-R.; Sathiyanarayanan, G.; Song, H.-S.; Kim, J.; Jeon, J.-M.; Kim, J.-H.; Park, S.-H.; Yu, J.-H.; Park, K.; et al. Medium engineering for enhanced production of undecylprodigiosin antibiotic in Streptomyces coelicolor using oil palm biomass hydrolysate as a carbon source. Bioresour. Technol. 2016, 217, 141–149. [Google Scholar] [CrossRef]
  11. Bhatia, S.K.; Lee, B.R.; Sathiyanarayanan, G.; Song, H.S. Biomass-derived molecules modulate the behavior ofStreptomyces coelicolorfor antibiotic production. Biotech 2016, 6, 223–231. [Google Scholar]
  12. Sunley, G.J.; Watson, D.J. High productivity methanol carbonylation catalysis using iridium: The Cativa™ process for the manufacture of acetic acid. Catal. Today 2000, 58, 293–307. [Google Scholar] [CrossRef]
  13. Kochloefl, K. Development of Industrial Solid Catalysts. Chem. Eng. Technol. 2001, 24, 229–234. [Google Scholar] [CrossRef]
  14. Fielder, E.; Grossmann, G.; Burkhard, K.D.; Weiss, G.; Witte, C. Methanol. Economic analysis. Int. J. Hydrogen Energy 2005, 30, 769–842. [Google Scholar]
  15. Mahfud, F.H.; Van Geel, F.P.; Venderbosch, R.; Heeres, H.J. Acetic Acid Recovery from Fast Pyrolysis Oil. An Exploratory Study on Liquid-Liquid Reactive Extraction using Aliphatic Tertiary Amines. Sep. Sci. Technol. 2008, 43, 3056–3074. [Google Scholar] [CrossRef] [Green Version]
  16. Chu, W.; Ooka, Y.; Kamiya, Y.; Okuhara, T. Reaction path for oxidation of ethylene to acetic acid over Pd/WO3–ZrO2 in the presence of water. Catal. Lett. 2005, 101, 225–228. [Google Scholar] [CrossRef]
  17. Jin, F.; Zhou, Z.; Kishita, A.; Enomoto, H.; Kishida, H.; Moriya, T. A New Hydrothermal Process for Producing Acetic Acid from Biomass Waste. Chem. Eng. Res. Des. 2007, 85, 201–206. [Google Scholar] [CrossRef]
  18. Jin, F.; Enomoto, H. Hydrothermal conversion of biomass wastes into resources. Prog. Nat. Sci. 2005, 15, 14–22. [Google Scholar] [CrossRef]
  19. Jin, F.; Zhou, Z.; Moriya, T.; Kishida, H.; Higashijima, H.; Enomoto, H. Controlling Hydrothermal Reaction Pathways to Improve Acetic Acid Production from Carbohydrate Biomass. Environ. Sci. Technol. 2005, 39, 1893–1902. [Google Scholar] [CrossRef]
  20. Vasiliu, M.; Guynn, K.; Dixon, D.A. Prediction of the Thermodynamic Properties of Key Products and Intermediates from Biomass. J. Phys. Chem. C 2011, 115, 15686–15702. [Google Scholar] [CrossRef]
  21. Dong, C.Q.; Zhang, Z.F.; Lu, Q.; Yang, Y.P. Characteristics and mechanism study of analytical fast pyrolysis of poplar wood. Energy Convers. Manag. 2012, 57, 49–59. [Google Scholar] [CrossRef]
  22. Garlapalli, R.K.; Wirth, B.; Reza, M.T. Pyrolysis of hydrochar from digestate: Effect of hydrothermal carbonization and pyrolysis temperatures on pyrochar formation. Bioresour. Technol. 2016, 220, 168–174. [Google Scholar] [CrossRef] [PubMed]
  23. Kabir, G.; Hameed, B. Recent progress on catalytic pyrolysis of lignocellulosic biomass to high-grade bio-oil and bio-chemicals. Renew. Sustain. Energy Rev. 2017, 70, 945–967. [Google Scholar] [CrossRef]
  24. Mettler, M.S.; Vlachos, D.G.; Dauenhauer, P.J. Top ten fundamental challenges of biomass pyrolysis for biofuels. Energy Environ. Sci. 2012, 5, 7797–7809. [Google Scholar] [CrossRef]
  25. Akalın, M.K.; Karagöz, S.; Akalin, M.K. Analytical pyrolysis of biomass using gas chromatography coupled to mass spectrometry. TrAC Trends Anal. Chem. 2014, 61, 11–16. [Google Scholar] [CrossRef]
  26. Galletti, G.C.; Bocchini, P. Pyrolysis/gas chromatography/mass spectrometry of lignocellulose. Rapid Commun. Mass Spectrom. 1995, 9, 815–826. [Google Scholar] [CrossRef] [PubMed]
  27. Nowakowski, D.; Jones, J.M.; Brydson, R.; Ross, A. Potassium catalysis in the pyrolysis behaviour of short rotation willow coppice. Fuel 2007, 86, 2389–2402. [Google Scholar] [CrossRef]
  28. Fahmi, R.; Bridgwater, T.; Darvell, L.; Jones, J.; Yates, N.; Thain, S.; Donnison, I. The effect of alkali metals on combustion and pyrolysis of Lolium and Festuca grasses, switchgrass and willow. Fuel 2007, 86, 1560–1569. [Google Scholar] [CrossRef]
  29. Shimada, N.; Kawamoto, H.; Saka, S. Different action of alkali/alkaline earth metal chlorides on cellulose pyrolysis. J. Anal. Appl. Pyrolysis 2008, 81, 80–87. [Google Scholar] [CrossRef] [Green Version]
  30. Nowakowski, D.; Jones, J.M. Uncatalysed and potassium-catalysed pyrolysis of the cell-wall constituents of biomass and their model compounds. J. Anal. Appl. Pyrolysis 2008, 83, 12–25. [Google Scholar] [CrossRef]
  31. Wang, J.; Zhang, M.; Chen, M.; Min, F.; Zhang, S.; Ren, Z.; Yan, Y. Catalytic effects of six inorganic compounds on pyrolysis of three kinds of biomass. Thermochim. Acta 2006, 444, 110–114. [Google Scholar] [CrossRef]
  32. Patwardhan, P.R.; Satrio, J.A.; Brown, R.; Shanks, B.H. Product distribution from fast pyrolysis of glucose-based carbohydrates. J. Anal. Appl. Pyrolysis 2009, 86, 323–330. [Google Scholar] [CrossRef]
  33. Fabbri, D.; Chiavari, G.; Prati, S.; Vassura, I.; Vangelista, M. Gas chromatography/mass spectrometric characterisation of pyrolysis/silylation products of glucose and cellulose. Rapid Commun. Mass Spectrom. 2002, 16, 2349–2355. [Google Scholar] [CrossRef]
  34. Carlson, T.R.; Jae, J.; Lin, Y.-C.; Tompsett, G.A.; Huber, G. Catalytic fast pyrolysis of glucose with HZSM-5: The combined homogeneous and heterogeneous reactions. J. Catal. 2010, 270, 110–124. [Google Scholar] [CrossRef]
  35. Lu, Q.; Yang, X.-C.; Dong, C.-Q.; Zhang, Z.-F.; Zhang, X.; Zhu, X. Influence of pyrolysis temperature and time on the cellulose fast pyrolysis products: Analytical Py-GC/MS study. J. Anal. Appl. Pyrolysis 2011, 92, 430–438. [Google Scholar] [CrossRef]
  36. Srinivasan, V.; Adhikari, S.; Chattanathan, S.A.; Park, S. Catalytic Pyrolysis of Torrefied Biomass for Hydrocarbons Production. Energy Fuels 2012, 26, 7347–7353. [Google Scholar] [CrossRef]
  37. Judd, M.D.; Plunkett, B.A.; Pope, M.I. The thermal decomposition of calcium, sodium, silver and copper(II) acetates. J. Therm. Anal. Calorim. 1974, 6, 555–563. [Google Scholar] [CrossRef]
  38. Afzal, M.; Butt, P.K.; Ahmad, H. Kinetics of thermal decomposition of metal acetates. J. Therm. Anal. Calorim. 1991, 37, 1015–1023. [Google Scholar] [CrossRef]
  39. Shuping, Z.; Yulong, W.; Mingde, Y.; Chun, L.; Junmao, T. Pyrolysis characteristics and kinetics of the marine microalgae Dunaliella tertiolecta using thermogravimetric analyzer. Bioresour. Technol. 2010, 101, 359–365. [Google Scholar] [CrossRef]
  40. Mattonai, M.; Ribechini, E. A comparison of fast and reactive pyrolysis with in situ derivatisation of fructose, inulin and Jerusalem artichoke (Helianthus tuberosus). Anal. Chim. Acta 2018, 1017, 66–74. [Google Scholar] [CrossRef]
Figure 1. Thermogravimetric (TG) and differential thermogravimetric (DTG) profiles from the thermal decomposition of glucose, potassium acetate (KAc) and their (1:0.25 wt/wt) mixture at a heating rate of 40 °C /min.
Catalysts 10 00502 g001
Figure 2. Comparison of the acetic acid (AA) yields (a) and product distributions (b) of the glucose pyrolysis with (both in situ catalysis and on-line catalysis) and without a catalyst at 350 °C for 30 s.
Catalysts 10 00502 g002
Figure 3. Comparison of the AA yields (a) and the product distributions (b) of the glucose in situ catalytic pyrolysis with a glucose/KAc ratio of 1:0.25 at 350 °C for 10 s, 30 s and 60 s.
Catalysts 10 00502 g003
Figure 4. Pyrolysis coupled with gas chromatography and mass spectrometry (Py-GC/MS) total ion chromatograms of glucose, the glucose/KAc mixtures with different ratios (1:0.05, 1:0.1, 1:0.125, 1:0.25,1:0.5), the glucose/K2CO3 mixtures (1:0.25) at 350 °C, and KAc at 350 °C and 600 °C.
Catalysts 10 00502 g004
Figure 5. Comparison of the AA yields (a) and the product distributions (b) of the glucose in situ catalytic pyrolysis with a varying glucose/KAc ratio at 350 °C for 30 s.
Catalysts 10 00502 g005
Figure 6. Py-GC/MS total ion chromatograms of fructose and the fructose/KAc mixtures with different ratios (1:0.05, 1:0.25, 1:0.5, 1:1) at 350 °C for 30 s.
Catalysts 10 00502 g006
Table 1. Characteristics of the thermogravimetric curves.
SamplesTi a (°C)Tmax b (°C)Residue c (%)
Glucose18822032
GLU-KAc d15817828
GLU-NaAc d15917927
GLU-K2CO3 d15217130
KAc44948597
NaAc46450399
K2CO3--100
a initial degradation temperature at 1% mass loss; b the maximum mass loss rate temperature; c residual mass (in %) of glucose determined at 350 °C; d the ratio of glucose and catalyst is 1:0.25.
Table 2. Peak area % of the typical glucose pyrolysis products formed at 350 °C with (in situ and on-line) and without KAc.
ProductsPeak Area (%)
No CatalystIn SituOn-Line
Acetic acid2.44 ± 0.0360.83 ± 0.2133.06 ± 0.02
Aldehydes
Methylglyoxal-3.06 ± 0.054.26 ± 0.17
Hydroxyl-acetaldehyde5.28 ± 0.27--
Ketones
Acetone7.88 ± 0.34-4.13 ± 0.21
1-Hydroxyl-2-propanone0.61 ± 0.017.50 ± 0.048.55 ± 0.03
3-Methyl-1,2-cyclopentanedione0.71 ± 0.32-2.59 ± 0.11
2,3-Dihydro-3,5-dihydroxyl-6-methyl-4H-pyran-4-one0.41 ± 0.000.85 ± 0.04-
Furans
Furan1.38 ± 0.21-1.79 ± 0.33
Furfural24.3 ± 0.09-12.1 ± 0.14
3-Methyl-furan--1.39 ± 0.57
2-Furanmethanol-1.09 ± 0.081.57 ± 0.19
5-Methyl-2-furancarboxaldehyde1.63 ± 0.020.32 ± 0.011.4 ± 0.24
2,5-Furandicarboxaldehyde--2.26 ± 0.31
5-Hydroxymethyl-2-furancarboxaldehyde (5-HMF)15.93 ± 0.171.18 ± 0.290.63 ± 0.01
2,5-Dimethyl-4-hydroxyl-3(2H)-furanone0.63 ± 0.231.39 ± 0.151.54 ± 0.22
Anhydrosugars
Levoglucosan--1.35 ± 0.34
1,4:3,6-Dianhydro-α-d-glucopyranose--7.3 ± 0.02
“-” refers to “not detected”.
Table 3. The peak areas (%) of the typical products derived from the glucose in situ catalytic pyrolysis with a glucose/KAc ratio of 1:0.25 at 350 °C for 10 s, 30 s and 60 s.
ProductsTime (s)
10 s30 s60 s
Acetic acid 47.79 ± 01960.83 ± 0.2153.82 ± 0.03
Methylglyoxal3.11 ± 0.273.06 ± 0.054.48 ± 0.24
1-Hydroxyl-2-propanone7.10 ± 0.317.50 ± 0.049.14 ± 0.17
Furfural0.61 ± 0.15-2.7 ± 0.04
2-Furanmethanol-1.09 ± 0.08-
2,5-Dimethyl-4-hydroxyl-3(2H)-furanone0.55 ± 0.021.39 ± 0.151.44 ± 0.08
5-Hydroxymethyl-2-furancarboxaldehyde (5-HMF)5.40 ± 0.471.18 ± 0.290.49 ± 0.42
Butyrolactone0.81 ± 0.331.74 ± 0.04-
3-Ethyl-2-hydroxyl-2-cyclopenten-1-one0.63 ± 0.111.04 ± 0.161.29 ± 0.34
2,3-Pentanedione1.30 ± 0.012.23 ± 0.011.69 ± 0.17
Propanoic acid, 2-oxo-, methyl ester1.19 ± 0.210.55 ± 0.112.18 ± 0.24
Levoglucosan15.68 ± 0.39-3.60 ± 0.44
“-” refers to “not detected”.
Table 4. Peak area (%) of the typical products derived from the glucose in situ catalytic pyrolysis at 350 °C with the different glucose/KAc ratios.
ProductsPeak Area (%) (Glucose/KAc)
1:0.051:0.11:0.1251:0.251:0.5
Acetic acid34.22 ± 0.0337.24 ± 0.2945.83 ± 0.1160.83 ± 0.2156.25 ± 0.03
Furans
Furan0.27 ± 0.10----
Furfural7.79 ± 0.275.34 ± 0.322.84 ± 0.01--
2-Furanmethanol1.41 ± 0.311.2 ± 0.190.87 ± 0.041.09 ± 0.080.52 ± 0.31
2,4-Dihydroxyl-2,5-dimethyl-3(2H)-furan-3-one0.82 ± 0.140.57 ± 0.130.38 ± 0.140.39 ± 0.01-
3-Furanmethanol1.47 ± 0.121.3 ± 0.081.2 ± 0.330.58 ± 0.050.75 ± 0.07
5-Methyl-2-furancarboxaldehyde1.58 ± 0.331.34 ± 0.020.83 ± 0.040.32 ± 0.010.53 ± 0.13
2(5H)-Furanone0.87 ± 0.410.74 ± 0.110.61 ± 0.26-0.46 ± 0.05
2,5-Dimethyl-4-hydroxyl-
3(2H)-furanone
2.13 ± 0.012.37 ± 0.372.00 ± 0.111.39 ± 0.151.41 ± 0.24
5-Acetyldihydro-2(3H)-furanone0.35 ± 0.000.57 ± 0.150.35 ± 0.170.38 ± 0.020.39 ± 0.06
5-Hydroxymethyl-2-
furancarboxaldehyde
0.52 ± 0.255.49 ± 0.290.98 ± 0.091.18 ± 0.292.19 ± 0.22
Ketones
2-Pentanone--5.58 ± 0.37--
2,3-Pentanedione1.46 ± 0.222.05 ± 0.111.11 ± 0.212.23 ± 0.012.15 ± 0.11
1-Hydroxyl-2-propanone7.76 ± 0.137.04 ± 0.2710.49 ± 0.057.5 ± 0.048.34 ± 0.24
3-Hydroxyl-2-butanone0.41 ± 0.210.37 ± 0.010.4 ± 0.010.57 ± 0.150.49 ± 0.21
2-Cyclopenten-1-one1.00 ± 0.140.67 ± 0.110.73 ± 0.080.59 ± 0.110.58 ± 0.09
1-Acetyloxyl-2-propanone0.7 ± 0.010.65 ± 0.090.84 ± 0.390.56 ± 0.010.74 ± 0.04
2-Cyclopentene-1,4-dione2.16 ± 0.281.87 ± 0.071.40 ± 0.010.27 ± 0.070.99 ± 0.01
2-Cyclohexen-1-one0.63 ± 0.260.49 ± 0.150.60 ± 0.030.41 ± 0.120.49 ± 0.00
1,3-Dihydroxyacetone dimer0.27 ± 0.380.26 ± 0.010.34 ± 0.250.25 ± 0.000.29 ± 0.01
Butyrolactone0.77 ± 0.020.73 ± 0.251.11 ± 0.121.74 ± 0.040.94 ± 0.33
3-Methyl-1,2-cyclopentanedione1.84 ± 0.131.02 ± 0.241.77 ± 0.231.90 ± 0.081.88 ± 0.05
2-Hydroxyl-gamma-butyrolactone-0.66 ± 0.010.69 ± 0.021.03 ± 0.061.57 ± 0.02
3-Ethyl-2-hydroxyl-2-cyclopenten-1-one-0.46 ± 0.190.89 ± 0.051.04 ± 0.161.02 ± 0.14
2,3-Dihydro-3,5-dihydroxyl-6-methyl-4H-pyran-4-one1.4 ± 0.052.19 ± 0.230.9 ± 0.150.85 ± 0.041.07 ± 0.13
Aldehydes
Methylgloxal7.44 ± 0.286.27 ± 0.014.87 ± 0.273.06 ± 0.053.94 ± 0.18
2-Butenal0.81 ± 0.220.83 ± 0.24---
3-Methyl-butanal0.57 ± 0.060.39 ± 0.160.72 ± 0.010.47 ± 0.020.59 ± 0.16
Esters
2-Propenoic acid, 2-hydroxyethyl ester1.10 ± 0.070.86 ± 0.010.50 ± 0.160.19 ± 0.010.22 ± 0.01
Acetic acid, methyl ester0.76 ± 0.010.64 ± 0.130.69 ± 0.040.33 ± 0.310.48 ± 0.02
Propanoic acid, 2-oxo-, methyl ester1.86 ± 0.121.56 ± 0.111.76 ± 0.030.55 ± 0.111.15 ± 0.09
“-” refers to “not detected”.
Table 5. Peak area % of the typical products obtained from the glucose in situ catalytic pyrolysis with KAc, NaAc, K2CO3 and without catalyst at 350 °C for 30 s.
GroupPeak area (%)
No CatalystKAcNaAcK2CO3
Acetic acid2.44 ± 0.0360.83 ± 0.2150.31 ± 0.1421.85 ± 0.06
Aldehydes6.14 ± 0.213.53 ± 0.414.19 ± 0.237.78 ± 0.03
Ketones25.37 ± 0.3419.74 ± 0.2226.69 ± 0.1933.7 ± 0.23
Furans50.13 ± 0.355.31 ± 0.197.24 ± 0.3216.94 ± 0.35
Esters6.97 ± 0.191.27 ± 0.072.42 ± 0.443.45 ± 0.18
Table 6. Typical products distributions obtained from the glucose in situ catalytic pyrolysis over KAc, NaAc or K2CO3 at 350 °C for 30 s.
ProductsPeak Area (%)
NaAcKAcK2CO3
Acetic acid50.31 ± 0.1460.83 ± 0.2121.85 ± 0.06
Methylglyoxal3.69 ± 0.013.06 ± 0.056.14 ± 0.22
Acetone--7.18 ± 0.14
1-Hydroxyl-2-propanone9.14 ± 0.227.5 ± 0.0411.63 ± 0.03
Furfural--2.75 ± 0.02
3-Methyl-1,2-cyclopentanedione1.43 ± 0.011.9 ± 0.082.18 ± 0.09
5-Methyl-2-furancarboxaldehyde0.48 ± 0.010.32 ± 0.011.22 ± 0.33
2,3-Dihydro-3,5-dihydroxyl-6-methyl-4H-pyran-4-one3.02 ± 0.140.85 ± 0.042.75 ± 0.19
2-Furanmethanol2.29 ± 0.171.09 ± 0.081.79 ± 0.22
2,5-Dimethyl-4-hydroxyl-3(2H)-furanone1.61 ± 0.181.39 ± 0.152.79 ± 0.01
5-Hydroxymethyl-2-furancarboxaldehyde1.31 ± 0.001.18 ± 0.294.50 ± 0.25
Butyrolactone0.93 ± 0.021.74 ± 0.040.94 ± 0.42
3-Ethyl-2-hydroxyl-2-cyclopenten-1-one0.46 ± 0.091.04 ± 0.160.56 ± 0.29
2,3-Pentanedione0.68 ± 0.112.23 ± 0.010.96 ± 0.17
“-” refers to “not detected”.
Table 7. Peak area (%) of the typical products derived from the fructose in situ catalytic pyrolysis at 350 °C with the different fructose /KAc ratios.
ProductsPeak Area (%) (Fructose/KAc)
1:01:0.051:0.251:0.51:1
Isobutane4.41 ± 0.034.16 ± 0.242.79 ± 0.153.27 ± 0.292.82 ± 0.06
Acetic acid, anhydride with formic acid0.52 ± 0.335.47 ± 0.324.33 ± 0.214.53 ± 0.015.47 ± 0.01
Acetic acid-54.99 ± 0.3355.96 ± 0.1357.25 ± 0.1862.64 ± 0.57
2,3-Pentanedione-2.01 ± 0.111.36 ± 0.130.81 ± 0.141.83 ± 0.31
1-Hydroxyl-2-propanone-8.46 ± 0.219.69 ± 0.238.73 ± 0.249.32 ± 0.43
Propanoic acid, 2-oxo-, methyl ester-1.49 ± 0.220.88 ± 0.011.09 ± 0.070.98 ± 0.15
1,3-Cyclopentanedione-0.70 ± 0.010.82 ± 0.040.68 ± 0.270.43 ± 0.04
Furfural58.43 ± 0.122.09 ± 0.232.03 ± 0.141.91 ± 0.241.07 ± 0.22
1-Acetyloxy- 2-propanone-0.71 ± 0.050.57 ± 0.210.68 ± 0.21.00 ± 0.06
2-Cyclopentene-1,4-dione0.97 ± 0.030.96 ± 0.210.99 ± 0.060.74 ± 0.020.44 ± 0.30
Butyrolactone-1.10 ± 0.211.13 ± 0.251.28 ± 0.071.57 ± 0.04
3-Methyl-1,2-cyclopentanedione, -1.34 ± 0.341.33 ± 0.211.62 ± 0.091.67 ± 0.12
2,5-Dimethyl-4-hydroxyl-3(2H)-furanone-1.73 ± 0.231.9 ± 0.251.59 ± 0.011.02 ± 0.01
2-Hydroxyl-γ-butyrolactone-1.01 ± 0.341.06 ± 0.110.89 ± 0260.48 ± 0.16
Furyl hydroxymethyl ketone2.65 ± 0.26----
2,5-Furandicarboxaldehyde2.56 ± 0.43----
2,3-Dihydro-3,5-dihydroxy-6-methyl-4H-pyran-4-one4.36 ± 0.140.95 ± 0.111.92 ± 0.051.03 ± 0.19-
1,2,6-Hexanetriol1.77 ± 0.31----
5-Acetoxymethyl-2-furaldehyde1.44 ± 0.24-----
5-Hydroxymethyl-2-furancarboxaldehyde11.85 ± 0.09----
“-” refers to “not detected”.

