Article

Combining Exsolution and Infiltration for Redox, Low Temperature CH4 Conversion to Syngas

School of Engineering, Newcastle University, Merz Court, Newcastle upon Tyne NE1 7RU, UK
*
Author to whom correspondence should be addressed.
Current address: Chemical & Process Engineering, University of Strathclyde, Glasgow, G1 1XL, UK.
Catalysts 2020, 10(5), 468; https://doi.org/10.3390/catal10050468
Submission received: 7 April 2020 / Revised: 21 April 2020 / Accepted: 23 April 2020 / Published: 25 April 2020
(This article belongs to the Special Issue Nanomaterials in Catalysis Applications)

Abstract

:
Exsolution of surface and bulk nanoparticles in perovskites has been recently employed in chemical looping methane partial oxidation because of the emergent materials’ properties such as oxygen capacity, redox stability, durability, coke resistance and enhanced activity. Here we attempt to further lower the temperature of methane conversion by complementing exsolution with infiltration. We prepare an endo/exo-particle system using exsolution and infiltrate it with minimal amount of Rh (0.1 wt%) in order to functionalize the surface and induce low temperature activity. We achieve a temperature decrease by almost 220 °C and an increase of the activity up to 40%. We also show that the initial microstructure of the perovskite plays a key role in controlling nanoparticle anchorage and carbon deposition. Our results demonstrate that microstructure tuning and surface functionalization are important aspects to consider when designing materials for redox cycling applications.

1. Introduction

Chemical looping (CL), originally implemented in the steam-iron process, was initially employed for hydrogen production via the water gas shift reaction [1]. CL has recently received a lot of attention due to benefits related to inherent product separation that result in more efficient and safer processes [2,3,4]. However, material requirements for CL processes have proven to be quite complex especially when applied for hydrocarbon conversion, e.g., methane. Material design needs to take into account both bulk transport properties and surface catalytic activity [5,6,7]. Thus, high oxygen capacity, high oxygen exchange ability, redox activity and stability are required. At the same time, surface activity and selectivity towards the conversion of methane to syngas [8], preferably at low temperatures, are essential.
Exsolution has been recently employed in chemical looping applications, specifically in chemical looping methane partial oxidation (CLPO), because of the emergent materials’ properties that arise from this particular synthesis method [9,10,11,12,13], like coke resistance, redox stability and enhanced activity [14,15,16,17]. We have recently proven that by evolving the exsolution concept, we can design systems that have both particles on the surface (exo-particles) and in the bulk (endo-particles) [18]. In these systems the exo-particles activate methane, the endo-particles act as oxygen reservoirs and the perovskite matrix mediates oxygen transfer between the two. At the same time the endo-particles strain the perovskite enhancing oxygen exchange and the perovskite strains the particle enhancing activity. This method provides solutions to more than one of the abovementioned requirements, demonstrating high oxygen capacity and exchange abilities, redox stability and durability over 150 cycles, while at the same time they prove to be highly active, selective and coke free at 600 °C when employed for CLPO.
While the temperature of 600 °C is still relatively low compared to other CLPO studies reported before (typically at 900 °C), it would be beneficial to further lower process temperature. This would help alleviate thermal and redox stress inflicted on the material, improving long term durability, but could also address a longstanding goal in catalysis for lowering operation temperatures. To lower this temperature, one would have to enhance surface reactivity and, at the same time, increase the oxygen transport through the bulk. One way to achieve this is to incorporate noble metals into eno/exo-particle systems because of their ability to activate methane at very low temperatures and their capability of increasing the extraction of oxygen from the bulk of oxides [19,20,21]. Nevertheless, the extension of the exsolution of noble metals on the surface of perovskite oxides is still limited [22].
Here we combine the concepts of exsolution and infiltration to address the challenges of CLPO (Figure 1). We prepare a non-noble metal endo/exo-particle system by exsolution, with exsolved Ni particles on the surface and throughout the bulk, and subsequently infiltrate it with minimal amount of Rh (0.1 wt%) in order to functionalize the surface and induce low temperature activity. We combine the stability and control resulting from exsolution with the ease and flexibility of the infiltration method. Through this combined approach, we succeed in lowering the methane activation temperature by almost 220 °C and in increasing the conversion up to 40%. However, at the same time, we observe that infiltration changes the surface morphology of the materials, in a manner that appears to pose negative impact on their long-term durability.

2. Results and Discussion

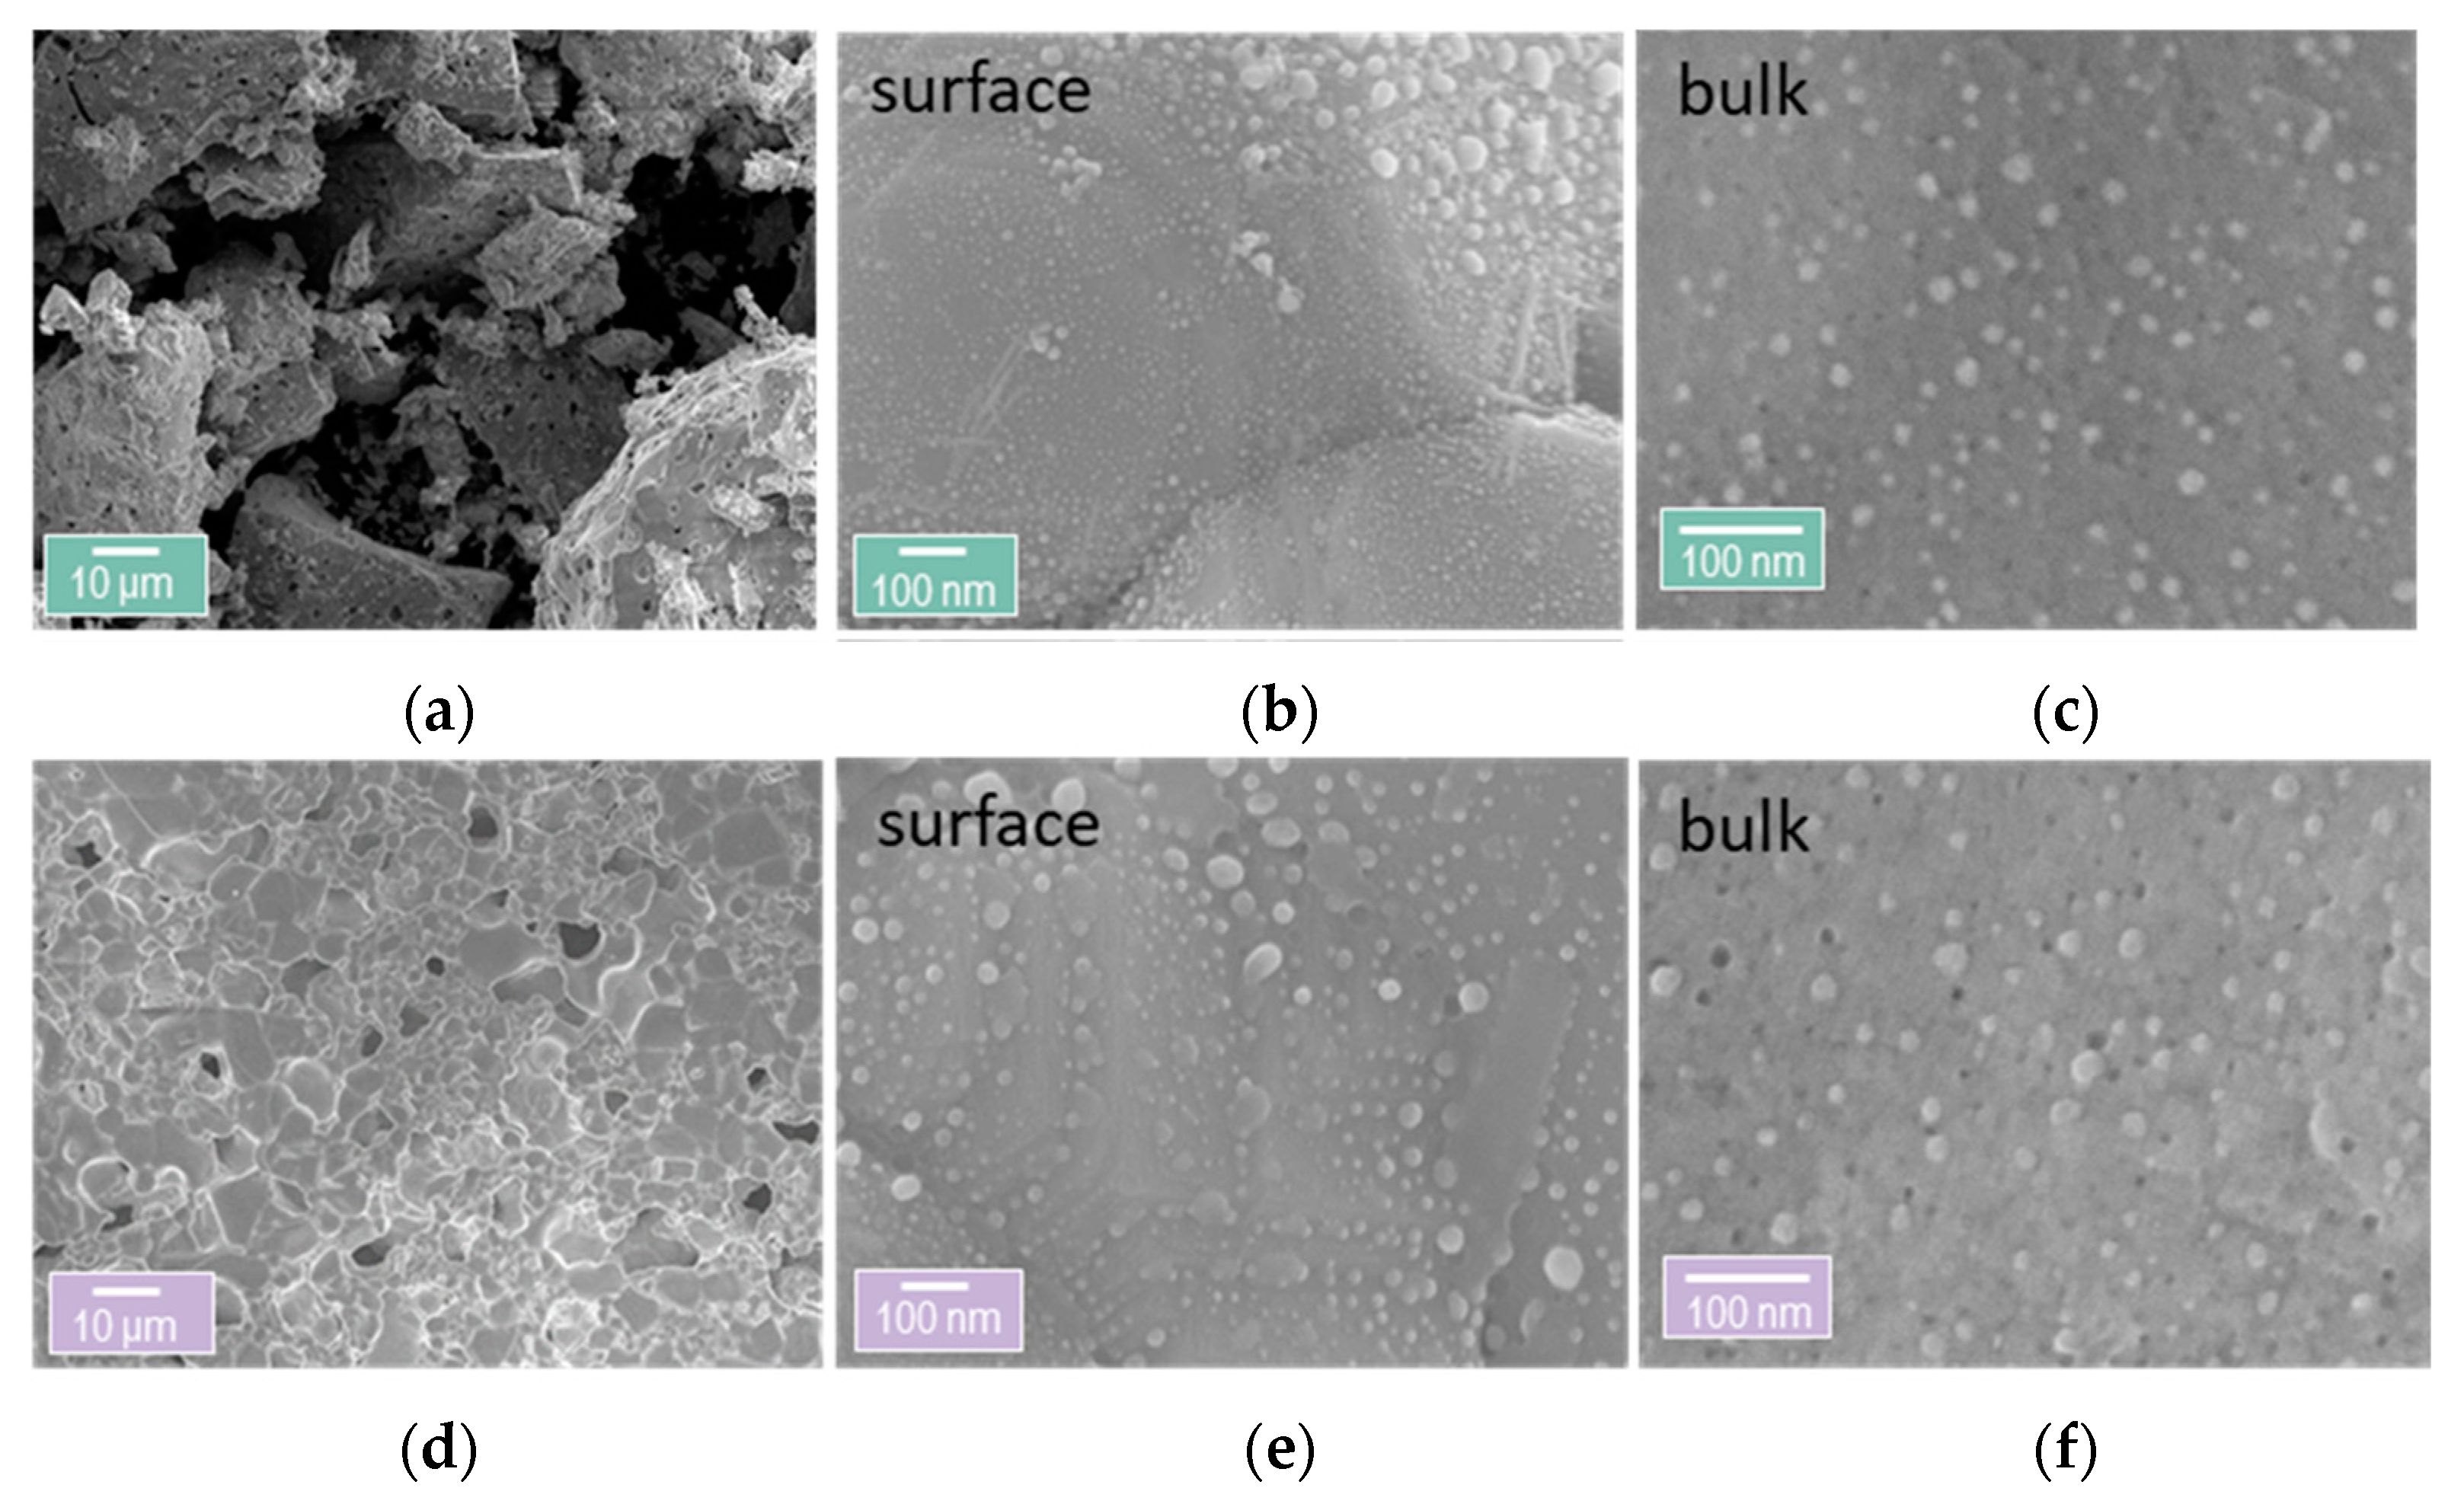
2.1. Microstructural Design of Perovskite System for Redox Methane Conversion

In order to prepare an exsolved system that contains both surface (exo) and bulk (endo) particles we chose La0.8Ce0.1Ni0.4Ti0.6O3 based on the design principles reported before [18]. The XRD pattern and corresponding Rietveld analysis of the as-prepared material are shown in Figure 2a. The analysis shows good agreement between experimental and calculated data (wR value of 9%) and indicates a single-phase perovskite with a Pnma crystal structure (Figure 2b).
To study the influence of the microstructure on exsolution and activity, we prepared this material in three different variations (Figure 3a–c): two powders with similar particle size between 60–80 μm but with different relative density (dr), of 90% (coarse powder, cP) and 50% (fine powder, fP), as well as a pellet with a dr~60% (pP). fP was prepared by ball milling at 400 rpm for 1 h, pressing into a pellet, crushing in a mortar and pestle and then sieving in order to obtain a particle size of 60–80 μm. In order to prepare the cP, the as-prepared material was only crushed and sieved manually in order to obtain particles of the order of 60–80 μm. Lastly, in order to create the pP, the abovementioned ball milled powder was mixed with 10 wt.% glassy carbon which served as a pore former and was then sintered at 1400 °C for 4 h. Decreased density would enable stability during cycling by better accommodating chemical expansion and contraction of the material under redox cycling. In addition, a small grain size would also promote the formation of exsolved Ni exo-particles since this would create more surface available to exsolve from. These are of great importance because they are likely to dictate oxygen capacity, reactivity and stability against coking and agglomeration. All the above are expected to be greatly influenced by the microstructure of the materials [14,22].
Figure 3d–f show the micrographs of the obtained microstructures. From Figure 3d it apparent that the fP displays a very rough, porous surface with very small crystallites, as would be expected following a ball milling process. This is also confirmed by the general broadness of the peaks in the XRD pattern, as exemplified in the inset of the figure for the 110 peak. The cP displays much smoother surfaces, with some visibly larger pores within the perovskite grains. Additionally, it displays larger grains and seemingly a slightly higher degree of crystallinity as compared to the fP, as observed from the corresponding XRD data. The pP displays a microstructure with similarly smooth surfaces, even larger pores, more extensively grown grains, and even higher degree of crystallinity.
In order to exsolve the exo/endo-particles, we reduced the samples at 1000 °C (10 h) and we label them henceforth with an -Ni suffix, indicating the presence of such particles, i.e., fP-Ni, cP-Ni, pP-Ni. Figure 4 reveals the microstructure and nanostructure of these materials. It is evident that indeed porosity and grain size hugely affect the exsolution process and hence the exsolved particle characteristics, i.e., size and population. While the cP-Ni shows very high particle density with about 90 particles/μm2 the fP-Ni and pP-Ni seem to be quite similar with about 25 particles/μm2. As far as particle size is concerned, the fP-Ni and the pP-Ni have bigger particle size as compared to the cP-Ni, 50 vs. 30 nm respectively (Figure 4c). Evidently, the nanoparticles formed in the pP and the cP-Ni are characteristic of exsolved materials, having grown on grain surfaces, as opposed to grain boundaries or at what appears to be interparticle junctions, as seems to be the case for fP-Ni. The above characteristics are probably a manifestation of surface A-site enrichment as has been demonstrated before for these structures [23].
In order to assess the capacity and reducibility of the materials, we oxidised the exsolved systems and then subjected them to a temperature programmed reduction (HTPR) (5% H2/He). This reveals that the total capacity of all three materials is very similar (Figure 4e) and corresponds to about 0.37 molO/molP. On the contrary, the HTPR profiles (Figure 4d) are quite different. Here, the pP-Ni and cP-Ni seem to have very similar behaviour, displaying at two major peaks, the first one potentially corresponding to the surface particles which for both samples is at about 375 °C and the second one to the bulk particles. This second peak is moved to higher temperatures for the pP-Ni, (650 °C versus the 580 °C for the cP-Ni) indicating that the bulk particles might be more difficult to access under testing conditions. Comparing the fP-Ni and the cP-Ni reveals that the ease of reduction is the same, with bulk and surface particle peaks corresponding to the same temperature, with the fP having a lot more surface particles, as expected, and less bulk, as indicated by the ratio between those two corresponding peaks.

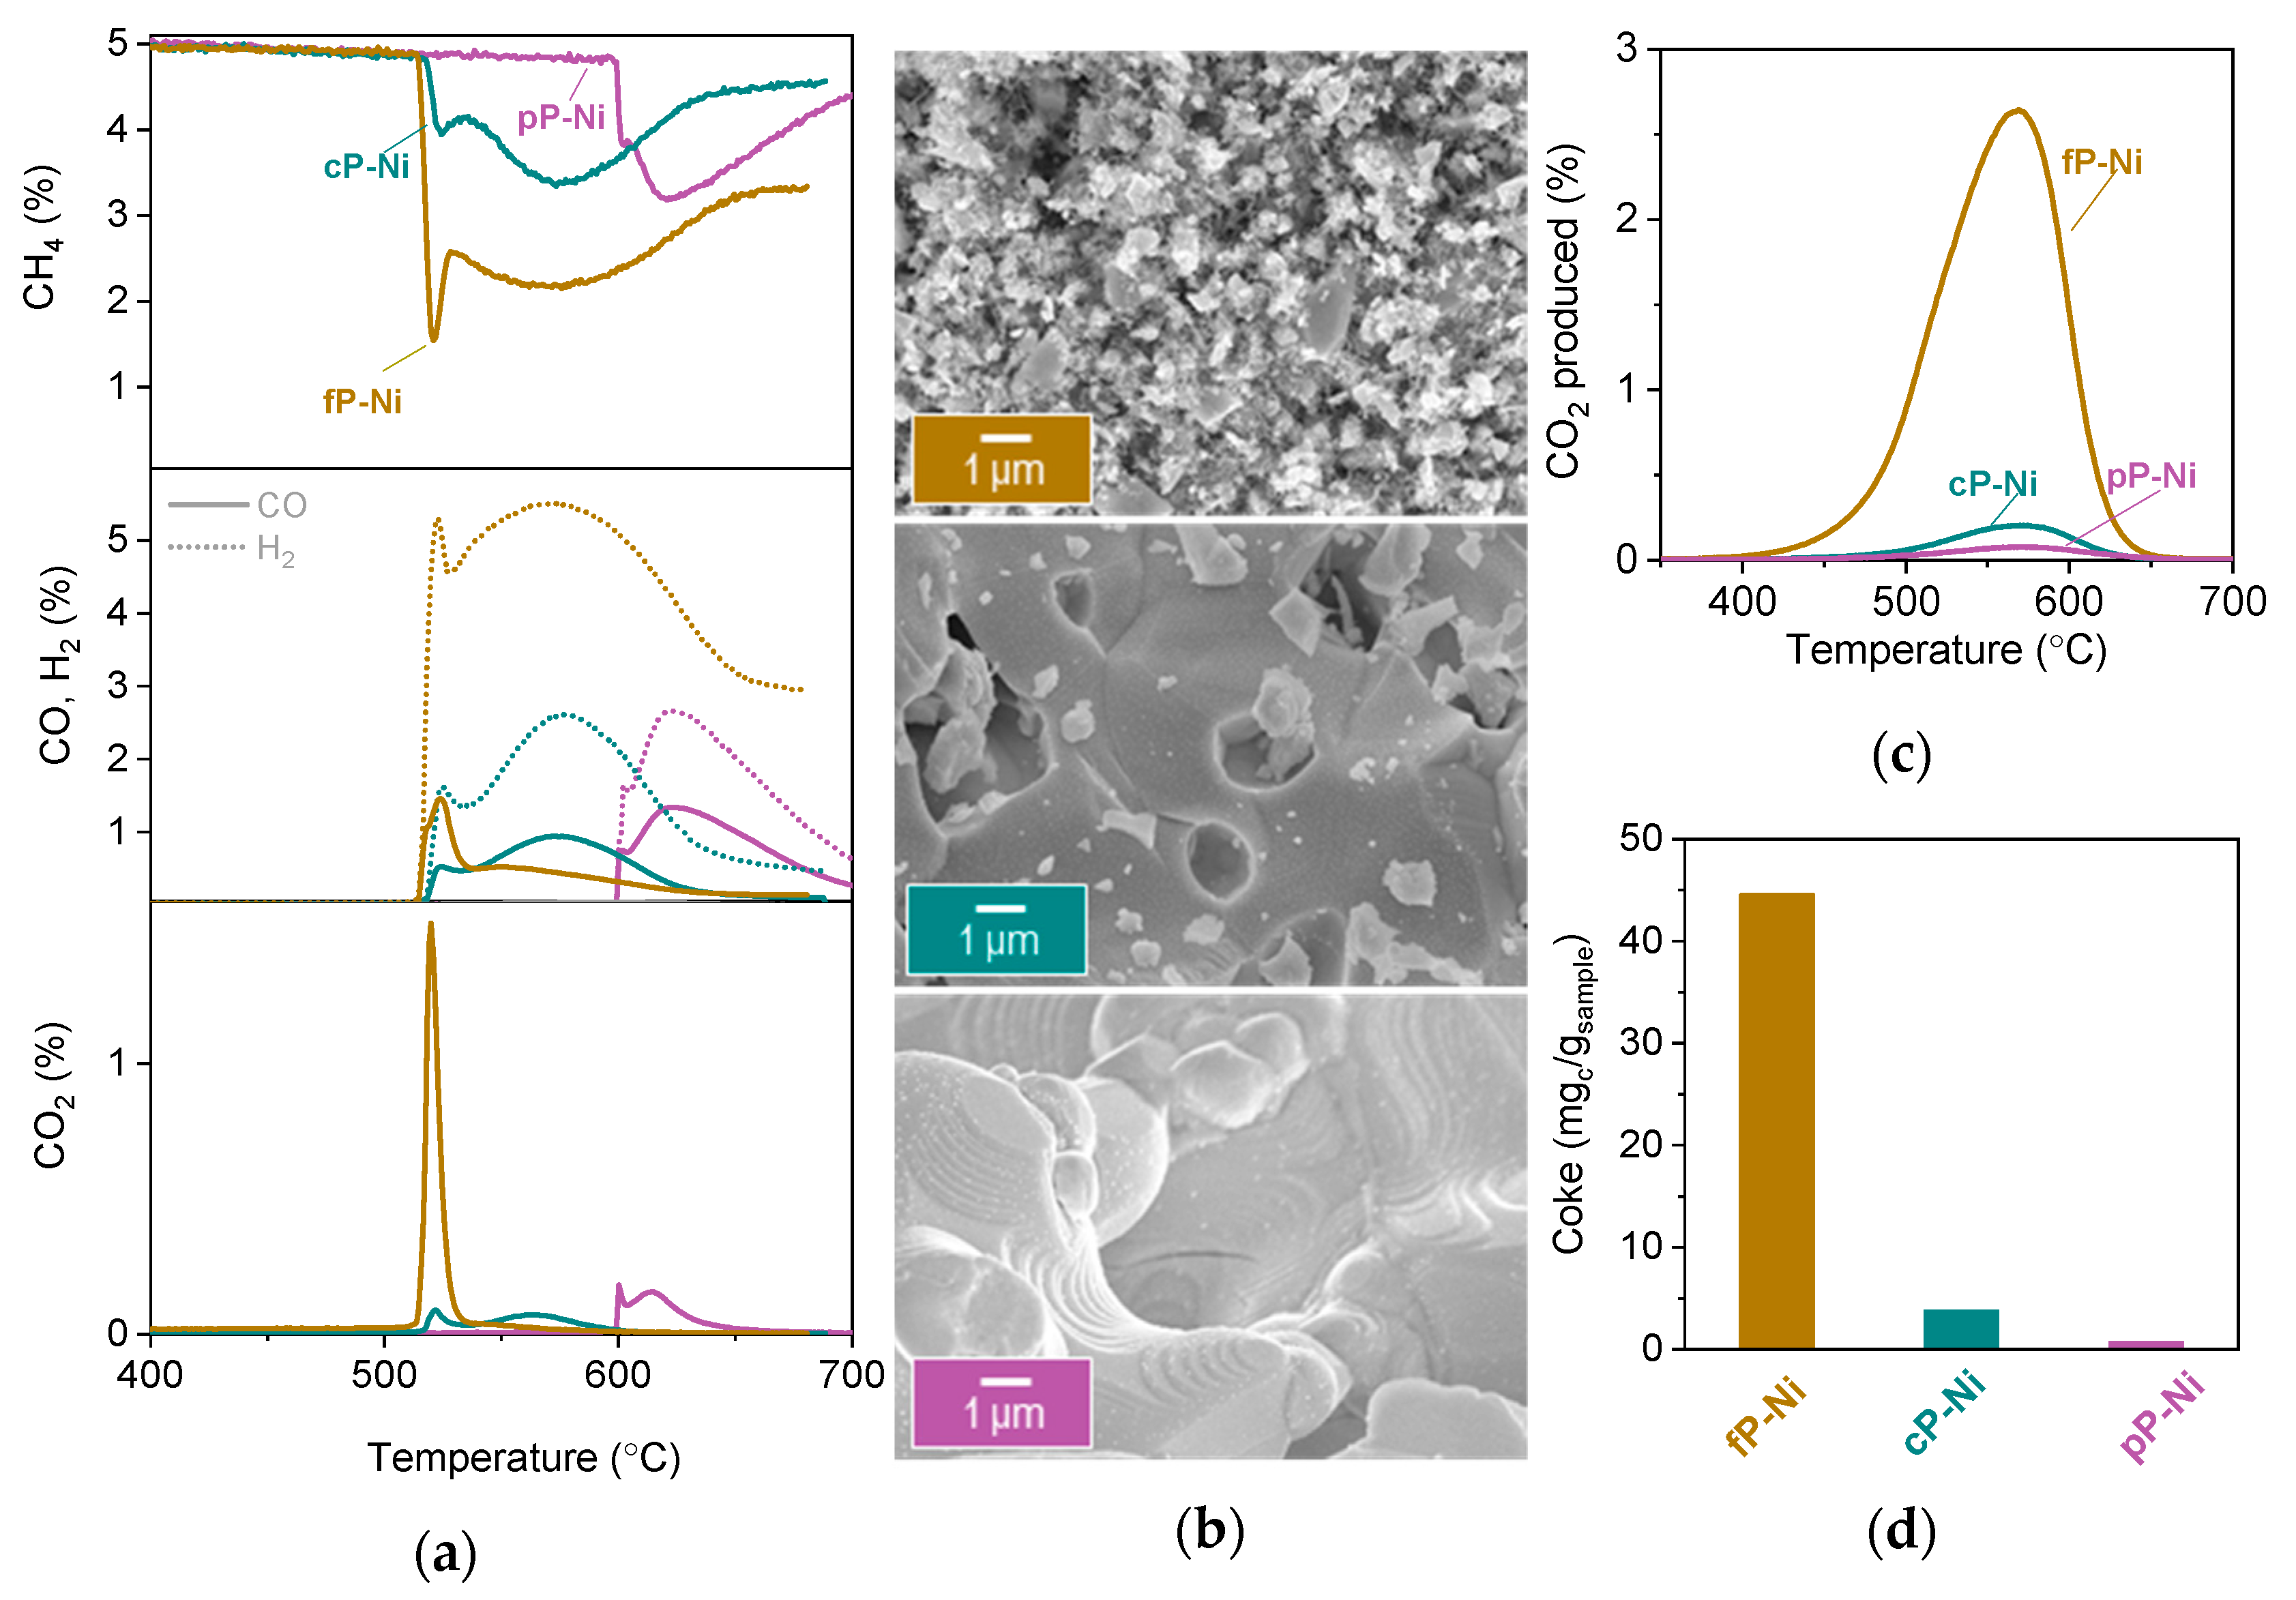
2.2. Probing the Effect of Microstructure on the Reactivity of the Exo/endo Particle System

In order to evaluate the effect of the different microstructures on their ability to activate methane we monitored methane conversion and selectivity as a function of temperature (MTPR) (Figure 5). All three samples display a CH4 activation profile characteristic of exo/edo-exsolved materials (Figure 5a) consisting of a sharp and a broad peak, corresponding to the exo- and endo-particles, respectively, with the perovskite matrix mediating O transfer between them. Activity towards methane conversion can be correlated directly to the corresponding HTPR profiles. The activity of the pP-Ni is moved to higher temperatures (about 80 °C) just as expected from the previous H2 reduction profile, while the two powders have exactly the same activation temperature. However, the fine powder seems to have a lot more coke deposited on the surface, as implied by the high H2/COx ratio. For the coarse powder and the pellet, that ratio is almost 2/1 for H2/CO, indicating highly active materials with minimal losses to side reactions (CO2 or C) (Figure 4a).
The microstructure analysis after testing via SEM (Figure 5b) proves that indeed carbon nanotubes can be spotted all over the surface of the fP-Ni. The high amount of coke could be due to various reason, such as increased roughness of the surface caused by ball milling or, most likely, due to weaker particle-substrate interaction in this particular sample. This might be a result of the particles having grown on grain boundaries, which are usually known to be less stable and hence more susceptible to carbon deposition as compared with their counterparts grown on grain surfaces. Indeed, both the pP-Ni and the cP-Ni show no sign of carbon deposition (Figure 4b) and also display all of the exo-particles still socketed as initially, before testing.
Temperature programmed oxidation after testing (TPO) verifies that the samples display similar stability of carbon on the surface, evident by the gasification temperature (Figure 5c), but the amount is almost negligible for the cP-Ni and the pP-Ni (Figure 5c,d). It is worth noting that even though the fP-Ni seems to have an abundance of carbonaceous deposits on the surface, it still achieves about a two-fold decrease in coking as compared to impregnated samples reported in the literature for these applications [14].

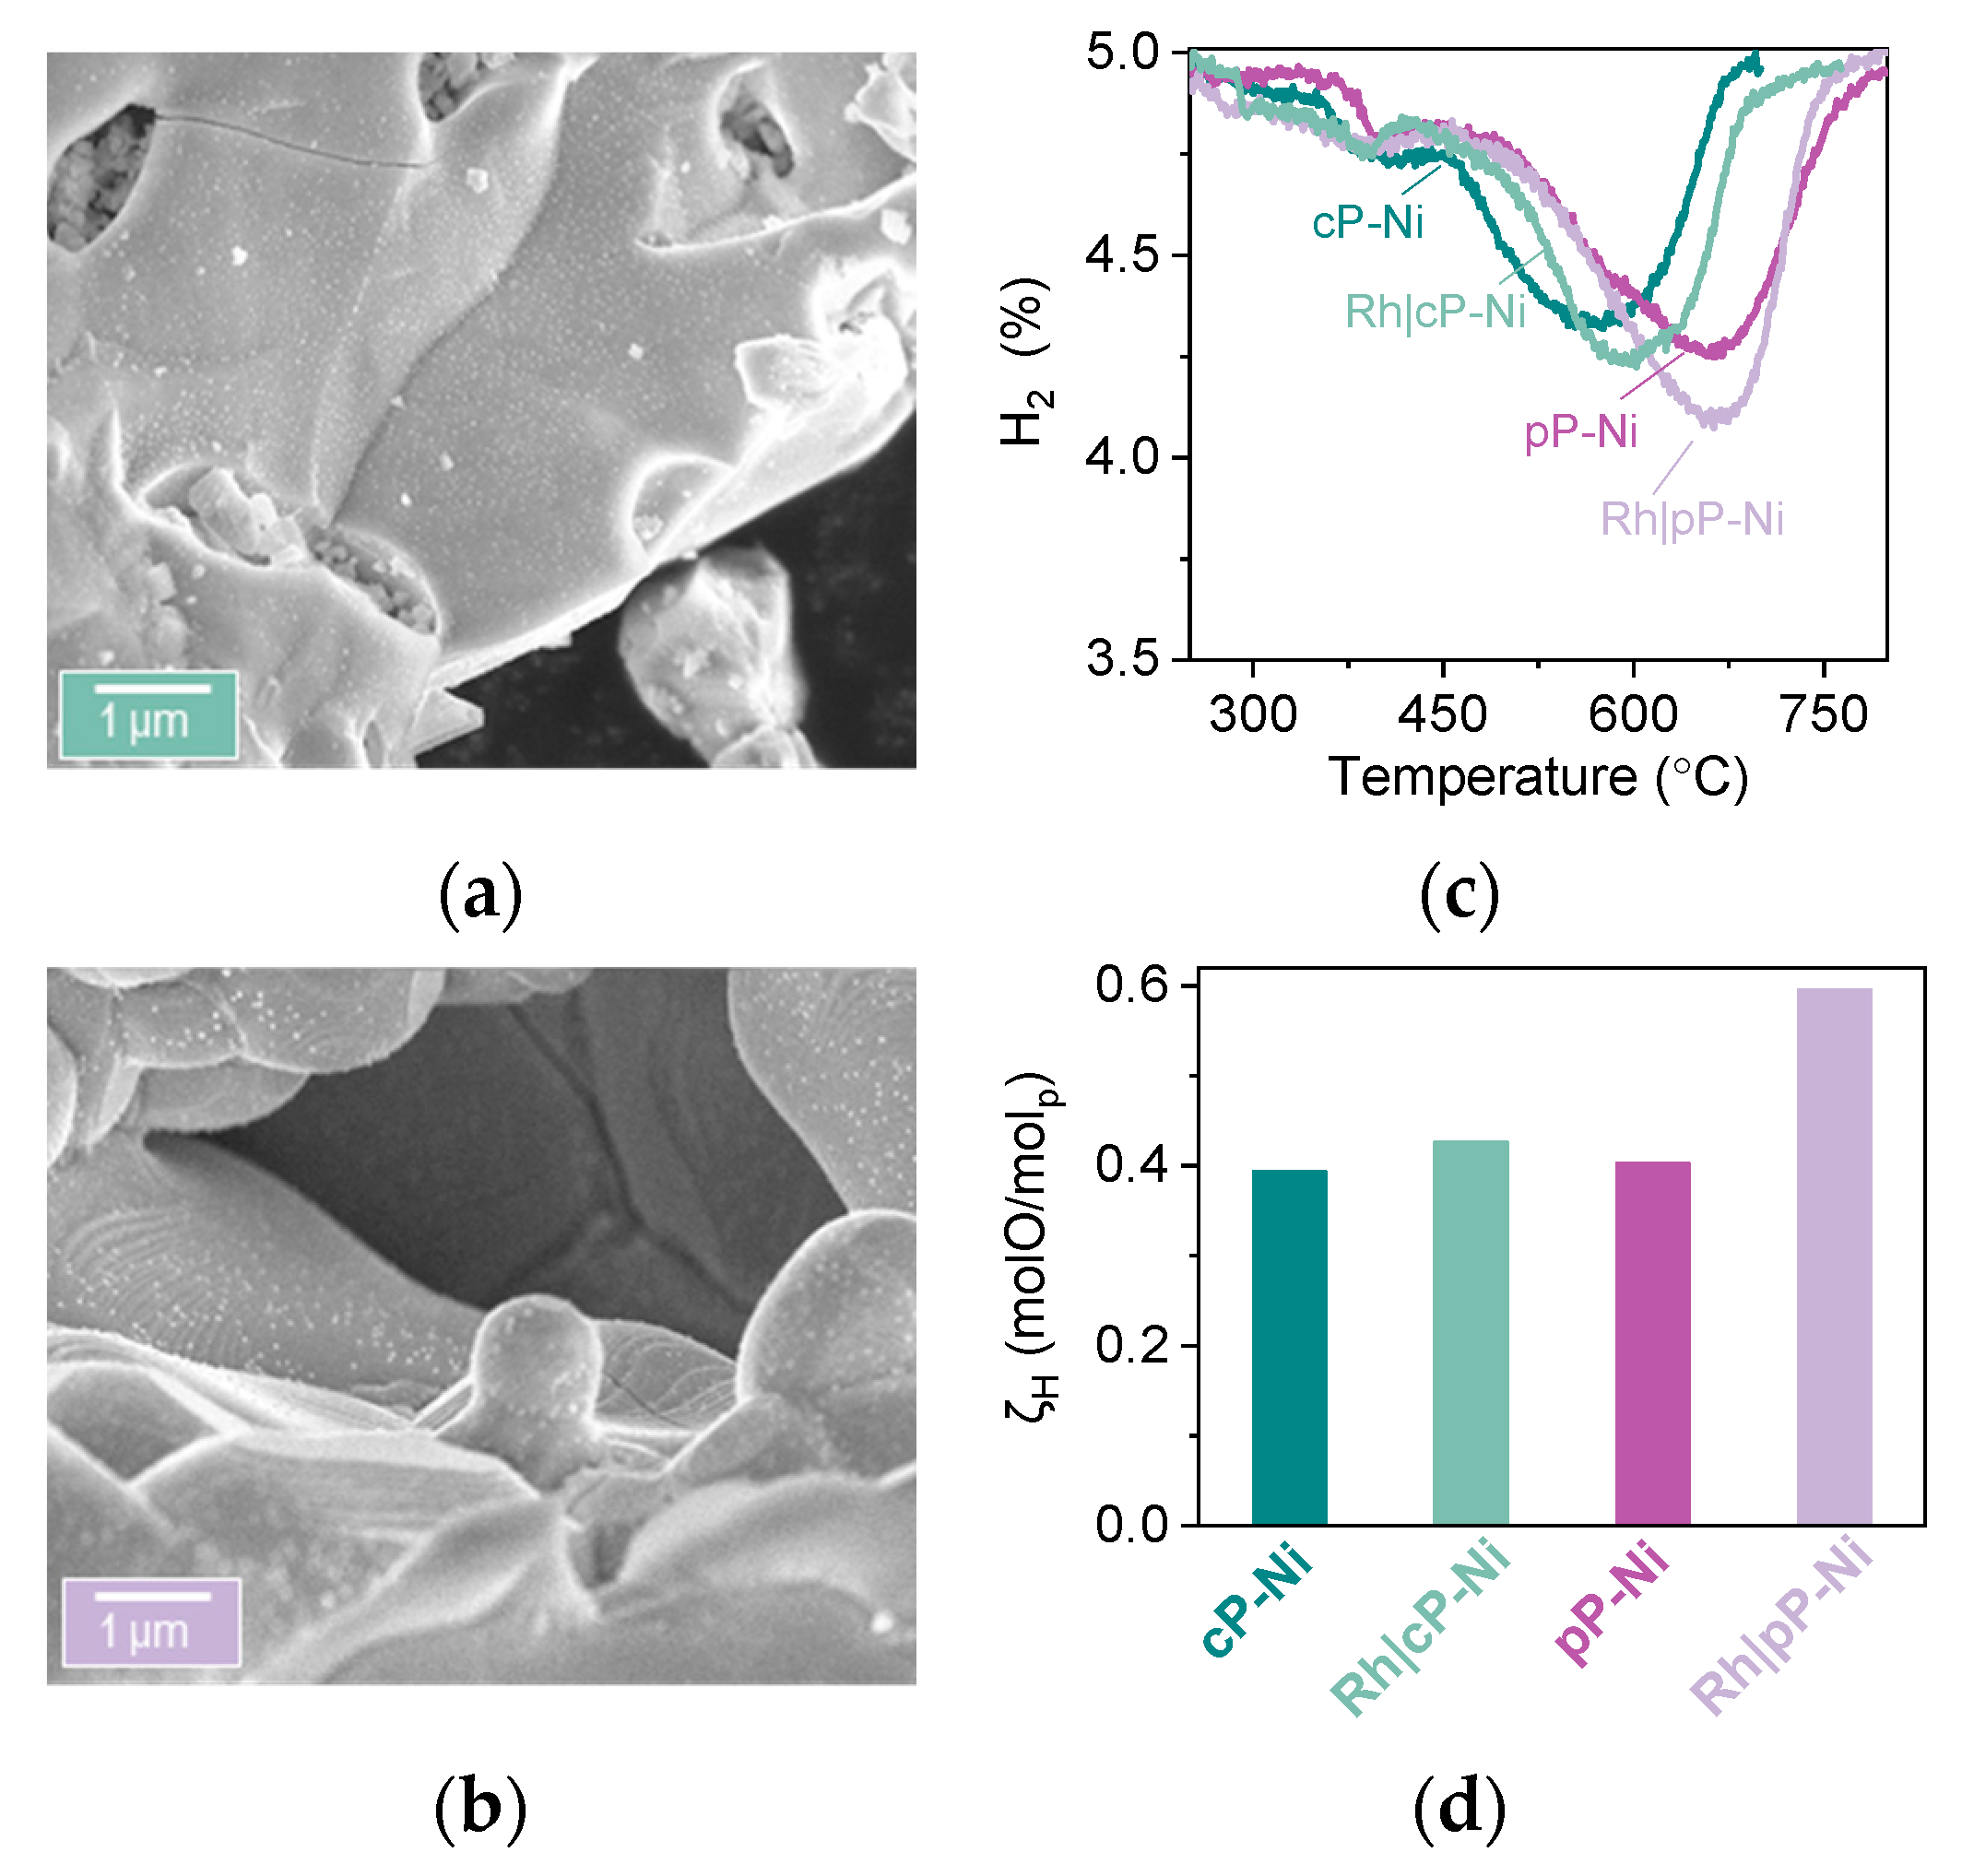
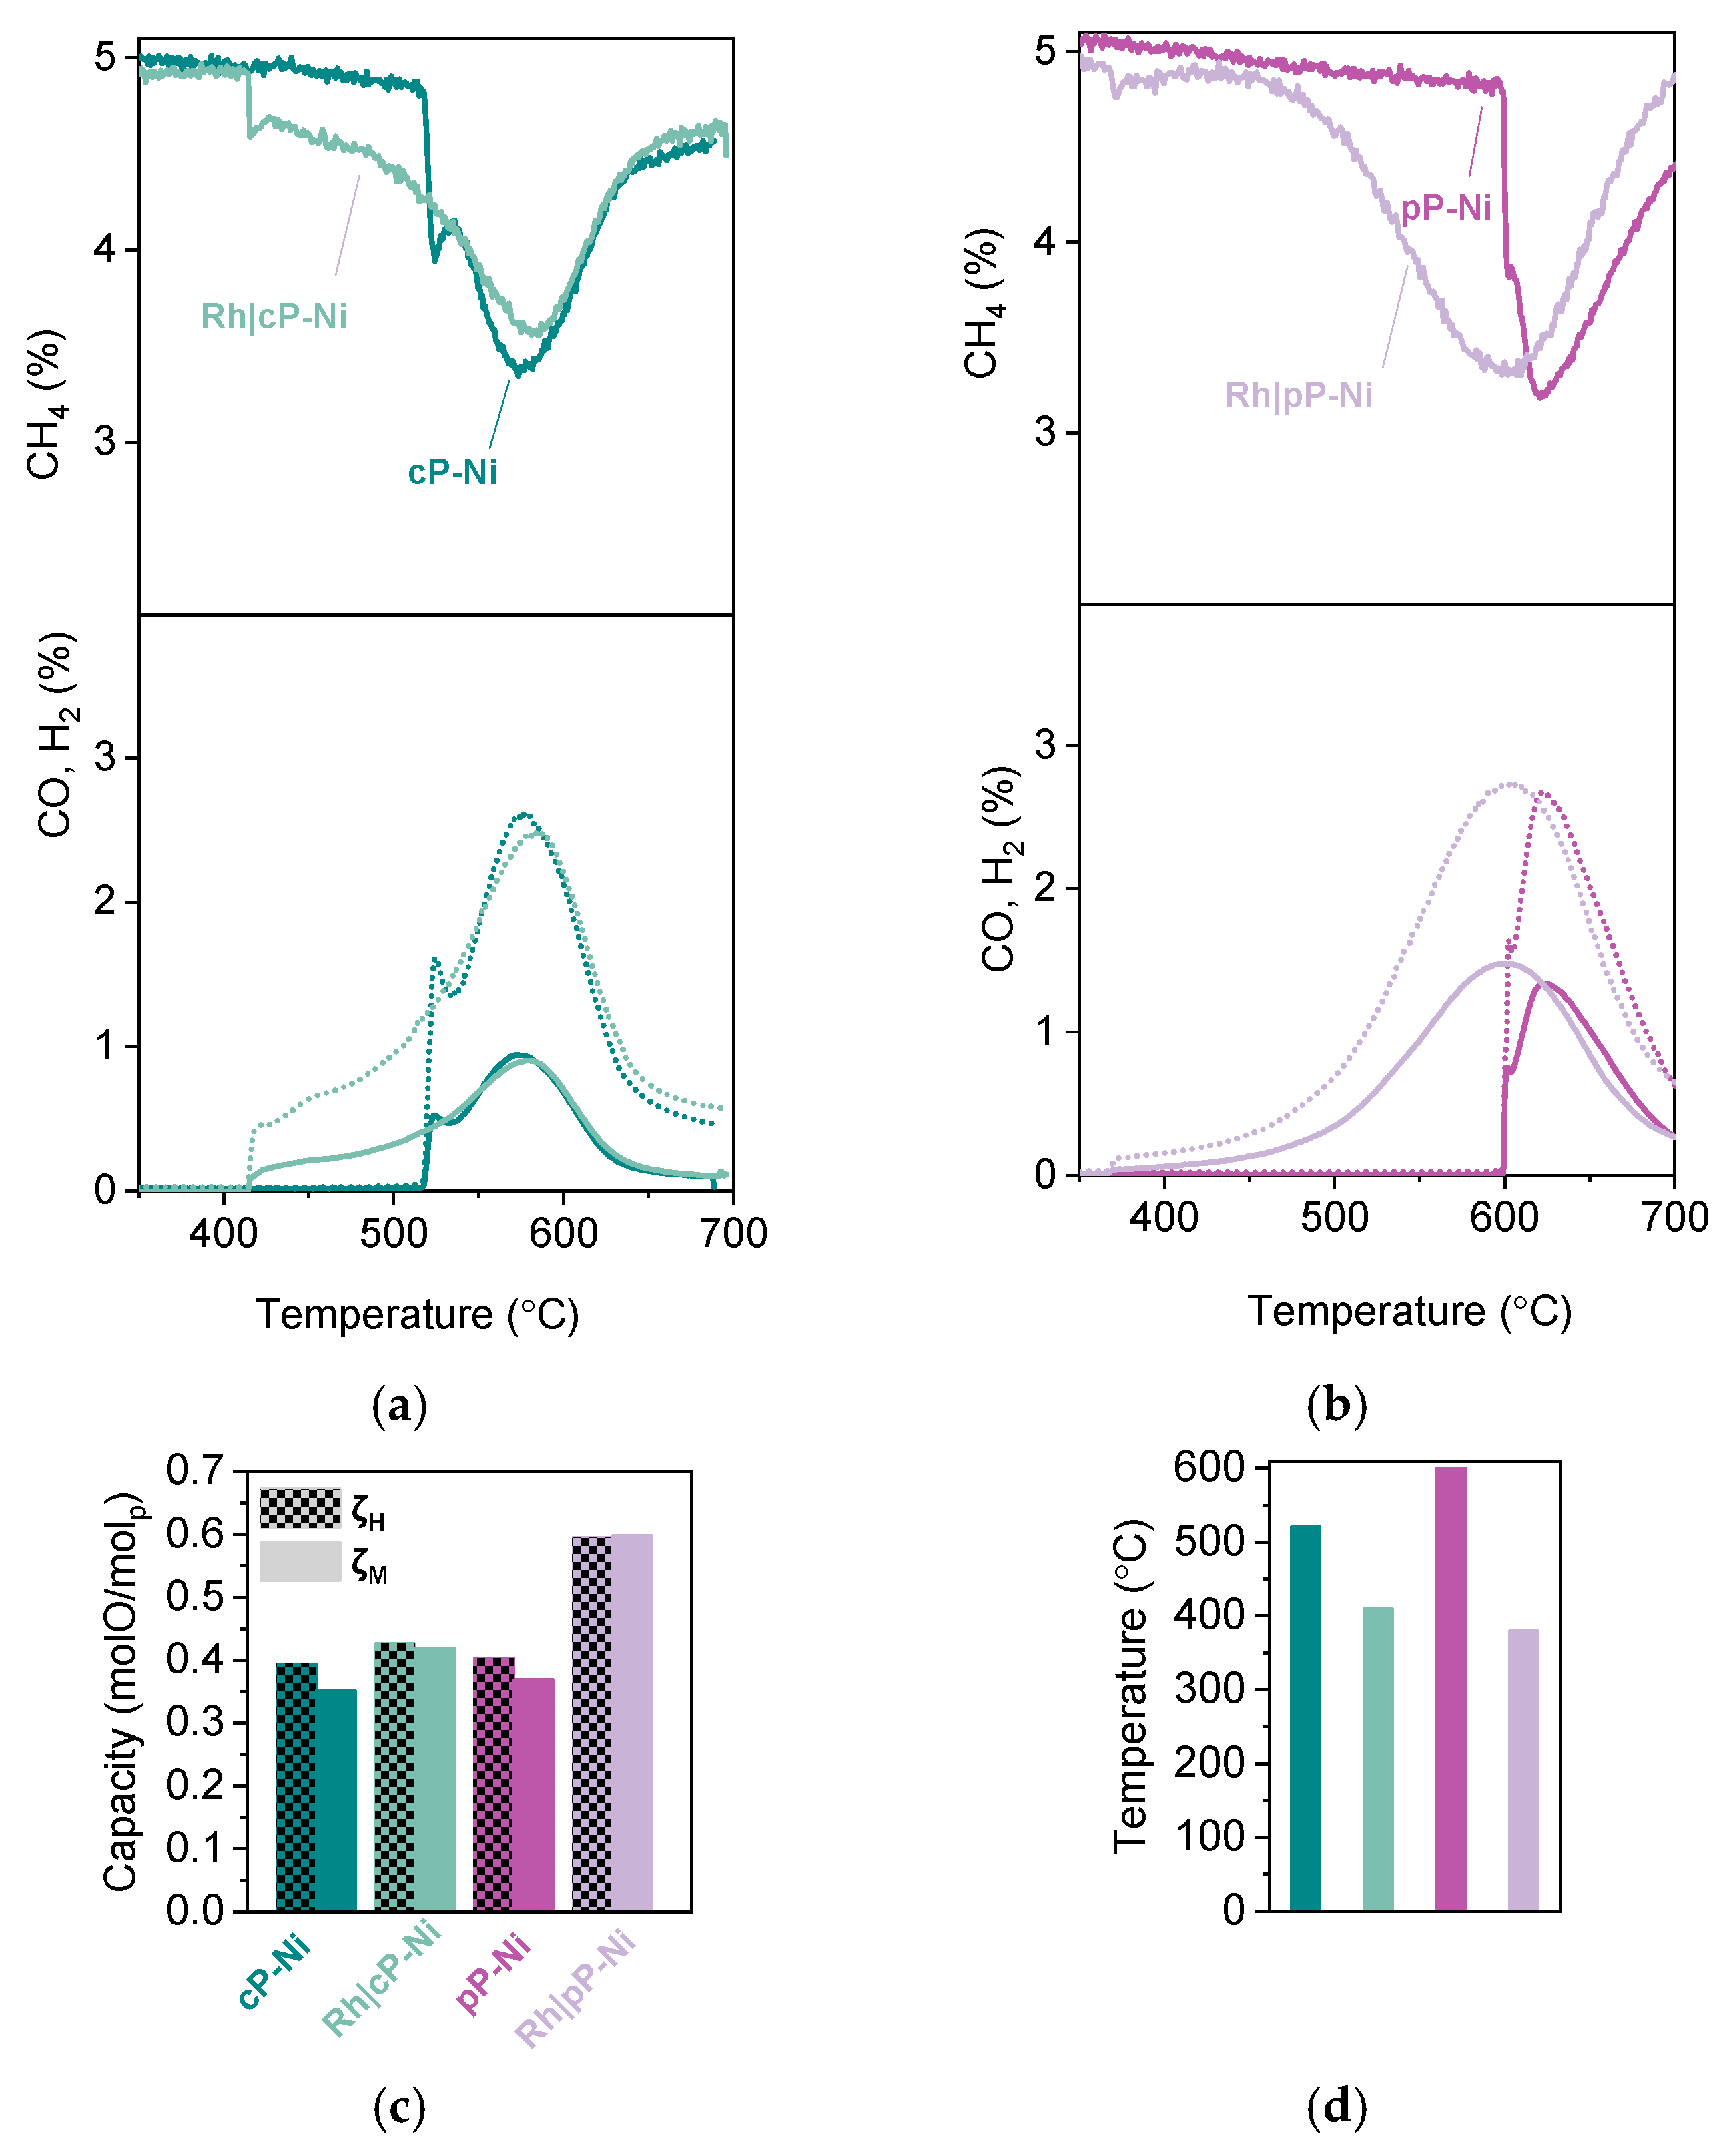
2.3. Functionalization of the Surface Aiming to Access Low Temperature Activity

Using the microstructures that produce the more selective, stable and coke free materials (cP-Ni and pP-Ni), we decided to use a complementary strategy in order to functionalise the surface of these exo/endo-particle systems, aiming at low temperature methane conversion. We did so by infiltrating very small amounts of noble metals because of their ability to increase the effective oxygen capacity and exchange of supports, and herein, we chose Rh as it is readily reducible and highly effective for methane conversion [24,25,26,27,28,29]. After the perovskites had been reduced, 0.1 wt.% of Rh was infiltrated, and as such, they were already decorated with exsolved particles both on the surface and in the bulk. We reflect the Rh addition also in the labels of the infiltrated samples, as Rh|cP-Ni and Rh|pP-Ni.
Microstructural analysis using SEM indicates very good dispersion and homogeneous distribution of both metallic Ni and Rh on the surface of the perovskites (Figure 6a,b). Although Rh and Ni particles are seemingly distinguishable due to different size on the surface of the oxide, we cannot exclude the formation of core (Ni)-shell (Rh) particles where a very thin layer of Rh encapsulates Ni particles. In the corresponding HTPR profiles one extra peak for both infiltrated samples can be observed, as compared to the non-impregnated ones, at about 300 °C, which corresponds to the Rh phase that is now present on the surface of these materials (Figure 6c). This is not surprising since Rh particles are smaller than nickel ones, and noble metal oxides are known to reduce much easier than most transition metal oxides, both factors known to result in much lower reduction temperatures. The other reducible phases seem to remain unaltered as far as temperature is concerned, however, it is noticeable that both infiltrated samples display an increase in oxygen capacity as compared to their pristine counterparts (Figure 6d), and this effect is especially pronounced in the Rh|pP-Ni where the oxygen capacity of the material increases by about 30%.
In order to probe the effect of the addition of the surface Rh nanoparticles, we carried out MTPR, where it became obvious that the activity of both powder and pellet is increased. In particular, methane conversion increased by about 15% for the Rh|cP-Ni and by 40% for the Rh|pP-Ni. Additionally, 20% and 65% respectively of that achieved methane conversion shifted to lower temperatures. This is in accordance with the literature where Rh addition on the perovskites surface has been shown to increase the concentration of CHx species and thus accelerate the extraction of oxygen, resulting in an enhanced O2− conduction through the bulk of the redox catalyst. It may also be a result of oxygen spillover phenomena where the oxygen extracted from the support can migrate to the noble metal, i.e., Rh [30,31]. However, it is notable that the abovementioned increase in the activity of the materials can be achieved by using such a small amount of noble metals [32]. Both samples are equally selective, reaching almost a 2:1 H2 to CO ratio (Figure 7a,b). What is quite interesting is that if we compare the oxygen capacity calculated using HTPR and MTPR, we notice that the Rh infiltrated samples are able to access all the capacity, as calculated using HTPR experiments, when they are reduced by methane, while for the non-infiltrated samples, there is about 10% of that total capacity that cannot be accessed under testing conditions (Figure 7c). The Rh|pP-Ni here seems to have the most dramatic improvement when infiltrated since the methane activation temperature has been lowered by almost 220 °C, reaching 380 °C, when initially methane got activated at 600 °C (Figure 7b,d).
TPO experiments after testing indicate that samples generally display a very minimal amount of carbon deposition and generally of the same kind (Figure 7e,f), as revealed by the profiles of the CO2 curves. By comparison, the pellet samples still have less coke than the powder samples, without the Rh having any sort of positive effect on the matter, perhaps because of the amount of carbon already being minimal.
Examination of the microstructure of the materials after the testing and the oxidation experiments reveals that the materials seem to be intact and that there are no cracks on the samples or sintering of the grains of the perovskite (Figure 8a,d). A closer look on the nanostructure, however, indicates that the infiltration had a detrimental effect on the surface of the samples (Figure 8b,e). Some of the exsolved Ni particles seem to have lost their anchorage to the support, while there is some roughness and texture on the surface as compared to the surface of the non-infiltrated samples (Figure 8b,e and Figure 5b). In contrast, the bulk of both materials remains intact (Figure 8c,f) with all particles anchored and with no signs of coalescence.

3. Materials and Methods

3.1. Sample Preparation

Perovskite oxide powders (La0.8Ce0.1Ni0.4Ti0.6O3) were prepared using a modified solid-state synthesis where high purity precursors were used, including La2O3, TiO2, CeO2 and Ni(NO3)2 * 6H2O, in the appropriate stoichiometric ratios. Certain oxides and carbonates were dried at different temperatures (TiO2 and CeO2—300 °C and La2O3—800 °C). The mixture was calcined at 1000 °C for 12 h to decompose the carbonates and start forming the perovskite phase. The calcined powder was then pressed into pellets and fired at 1400 °C for 15 h to form the perovskite phase. The synthesis process was described in detail previously [10]. The as-prepared samples were then processed to produce materials with three different microstructures, coarse powder, fine powder and porous pellet.
For the coarse powder, the as-prepared samples were crushed and sieved manually to a 60–80 μm size. In order to make the fine powder, the as-prepared powder was ball milled for 1 h under 450 rpm. Lastly, to make the porous pellets, glassy carbon was used as a pore-former. The ball milled La0.8Ce0.1Ni0.4Ti0.6O3 powder was mixed in with the pore-former in a 90/10 ratio, and then both were pressed in a pellet form before sintering at 1400 °C for 4 h.
To exsolve particles both on the surface and in the bulk, all the above mentioned samples were reduced in a controlled atmosphere furnace at 1000 °C for 10 h, under continuous flow of 5% H2/He (25 mL min−1) with heating and cooling rates of 5 °C min−1.
For the preparation of infiltrated samples, the reduced coarse powder (cP-Ni) and the reduced pellet (pP-Ni) were used as supports. For the powder, the support was dispersed in a dilute aqueous solution of Rh nitrate under continuous stirring followed by water evaporation and drying at 90 °C overnight. For the pellet, the support was infiltrated by the diluted Rh nitrate solution dropwise on a heating plate and then was dried at 90 °C overnight.
Oxidation for all the above samples was carried out in air at 600 °C for 1 h with heating and cooling rates of 5 °C min−1. This was done after the reduction step for the initial materials (xP-Ni) with different microstructures and after the overnight drying for the infiltrated samples (Rh|xP-Ni).

3.2. X-ray Diffraction

The phase purity and crystal structure of the prepared perovskites was confirmed using room temperature XRD with a PANalytical X’Pert Pro Multipurpose X-ray diffractometer operated in reflection mode.
Rietveld refinement analysis was carried out using GSAS II. The following parameters were gradually unlocked and refined: background (shifted Chebyshev polynomial, 3–6 terms), peak shape, unit cell parameters, atomic coordinates, site occupancies, thermal displacement parameters and microstrain.

3.3. Electron Microscopy

High-resolution secondary electron images were obtained using a FEI Helios Nanolab 600 scanning electron microscope (SEM).

Image Analysis

Particle size distributions were calculated based on pixel contrast from SEM micrographs by using a custom made routine in Mathematica, based on a procedure described previously [9].

3.4. Reactor Set-up

This reactor set up consists of a quartz tube (with a fixed frit of porosity 3) with an outer diameter of 9 and internal diameter of 6 mm. The quartz tube is held in a vertical furnace, forming a fixed-bed reactor. Manual mass flow controllers were used to regulate the flow through the bed and a pressure gauge was used to monitor any pressure changes during operation. The temperature was measured in the catalyst bed using a K-type thermocouple.
Depending on the experiment, CH4, O2, H2, CO and CO2 were continuously monitored (at m/z = 15 (CH4), 32 (O2), 2 (H2), 28 (CO) and 44 (CO2)) using a mass spectrometer (Hiden HAS-301-1291) through a heated capillary line. Calibration gases, CH4, O2, H2, CO and CO2, all 5% in a balance of He and He as a zero gas, were periodically fed into the mass spectrometer (Hiden, QGA) to obtain calibration factors, cracking factors (for CO2 into CO) and the background current. Calibrations with all calibration gases and the zero gas were performed before and after each experiment. The corrected mass to charge ratio current for all gases was a calibration factor multiplied by the difference between the recorded signal and the background signal, minus any cracking signal from other species on that particular mass to charge ratio channel.

3.4.1. Temperature Programmed Reduction

A known amount of catalyst (approximately 150 mg) was introduced in the reactor and was purged in situ with He at room temperature (RT). The temperature was increased from RT to 700 °C or to 800 °C, at a rate of 10 °C min−1, under a constant flow of reducing gas mixture of 5% CH4/He or H2/He (50 mL min−1) at atmospheric pressure, experiments referred to as methane temperature programmed reduction (MTPR) or hydrogen temperature programmed reduction (HTPR). The signals of CH4, O2, H2, CO and CO2 were continuously monitored using a mass spectrometer (Hiden HAS-301-1291). The signals were integrated to calculate the total amount of gases produced and consumed.

3.4.2. Temperature Programmed Oxidation

Temperature programmed oxidation (TPO) was performed to measure the carbon deposition after methane conversion experiments. At the end of each TPR experiment, a weighted amount of the used catalyst (~150 mg) was employed in the experiment. The temperature was increased from RT to 700 °C at a rate of 10 °C min−1, under a constant flow of oxidizing gas mixture of 5% O2/He (50 mL min−1) at atmospheric pressure. The signals of O2, CO and CO2 were continuously monitored using an MS spectrometer (Hiden HAS-301-1291). To calculate the total amount of carbonaceous deposits, the CO2 signals were integrated as there were no traces of CO detected in any of the experiments.

3.5. Calculations

For the calculation of conversion, selectivity, carbon deposition and capacity, the following values were calculated.
N C O = M ( y C O ) o u t l e t n d t
N C O 2 = M ( y C O 2 ) o u t l e t n d t
N C = O ( y C O 2 ) o u t l e t n d t
N H 2 = H ( y H 2 ) o u t l e t n d t
N C H 4 = M ( y C H 4 ) o u t l e t n d t
where the letter under the integral denotes the reduction step (M for MTPR or H for HTPR) or the oxidation step (O for TPO). y C O ,   y C O 2 ,   y H 2 ,   y C H 4 are the mole fractions of CO, CO2, H2 and CH4 at the outlet of the reactor,   N C O and N C O 2 are the total moles of CO and CO2 produced, respectively, during the reduction step, and N H 2 and N C H 4 are the total moles of unreacted H2 and CH4 (measured at the outlet of the reactor). n is the total molar flow rate corresponding to each experiment, and m is the mass of sample
Conversion (%) was calculated using the following equation.
X C H 4 = N C O + N C O 2 + N C N C O + N C O 2 + N C + N C H 4 · 100
Carbon deposition (mgcarbon/gsample) was calculated by the integration of the curve of CO2 after TPO experiments. CO was completely absent meaning that the oxidation of the carbon lead only to total combustion products.
c = M C m N C
M C is the molar mass of carbon.
Oxygen capacity (mol O/mol of perovskite) was calculated by
ζ M = ( 2 N C O 2 + N C O ) · M P m
ζ H = ( 2 N H 2 ) · M P m
where ζ M and ζ H correspond to the oxygen capacity (expressed as moles of O per moles of perovskite) calculated from MTPR and HTPR, respectively. M P is the molar mass of the perovskite, m is the sample weight used in the respective experiments.
Relative density dr was calculated by
d r = m p d t π r 2 h p 10 4
where mp is the mass, rp is the radius, hp is the thickness of the sintered pellet, and d t is the theoretical density that each material would have if the pellet was dense.
d t = M p N a a p 3
where Mp is the molar mass of the perovskite, and Na is the Avogadro’s number.

4. Conclusions

In this work we demonstrate the effect of the microstructure upon the exsolution process as well as on the activity of the exsolved exo/endo-particle systems. We also attempt to further functionalise the surface of those systems in order to drive methane conversion to lower temperatures. We do this by combining the exsolution method and infiltration, and we deposit small quantities (0.1 wt%) of Rh nanoparticles on the surface of the materials. We achieve a considerable increase in the total capacity of the perovskites and a decrease of the activation temperature.
The materials created here contain a large fraction of Ni nanoparticles embedded in the bulk of the perovskite matrix, which makes the ideal high-oxygen capacity materials for chemical looping, while at the same time, Ni nanoparticles are also exsolved on the surface in order to be able to activate CH4. By tuning in the microstructure of these systems we show that oxygen capacity and not particle size characteristics mainly governs the activity during a redox process; however, grain boundaries and surface roughness can have a detrimental effect on the anchorage of the particles and consequently to their durability.
By infiltrating the surface of the materials with Rh, we manage to access low temperature activity, up to 220 °C lower than the non-infiltrated sample, while increasing their activity by 40% when referring to pellet samples. Analysis of the samples using SEM after testing demonstrates, however, that the infiltration of Rh has negatively affected the surface of the perovskites although the microstructure and bulk remain intact.
The microstructure tuning and surface functionalization demonstrated here are important aspects to consider when designing materials for redox cycling applications such as chemical looping methane partial oxidation, thermochemical solar to fuels conversion or three-way catalysts [33].

Author Contributions

Conceptualization, data acquisition and analysis, K.K. and D.N.; methodology, K.K., D.N. and I.S.M; funding and supervision I.S.M; manuscript drafting, K.K. and D.N with comments from I.S.M. All authors have read and agree to the published version of the manuscript.

Funding

This research was funded by the EPSRC via grants EP/P007767/1, EP/P024807/1 and EP/R023921/1. Metcalfe’s position was supported by the Royal Academy of Engineering under the Chairs in Emerging Technologies scheme.

Conflicts of Interest

The authors declare no conflict of interest.

Data Availability

The data supporting this publication is available at doi:10.25405/data.ncl.12090822.

References

  1. Yang, J.; Cai, N.; Li, Z. Hydrogen Production from the Steam−Iron Process with Direct Reduction of Iron Oxide by Chemical Looping Combustion of Coal Char. Energy Fuels 2008, 22, 2570–2579. [Google Scholar] [CrossRef]
  2. Metcalfe, I.S.; Ray, B.; Dejoie, C.; Hu, W.; de Leeuwe, C.; Dueso, C.; García-García, F.R.; Mak, C.-M.; Papaioannou, E.I.; Thompson, C.R.; et al. Overcoming chemical equilibrium limitations using a thermodynamically reversible chemical reactor. Nat. Chem. 2019, 11, 638. [Google Scholar] [CrossRef] [PubMed] [Green Version]
  3. Adiya, Z.I.S.; Dupont, V.; Mahmud, T. Steam reforming of shale gas in a packed bed reactor with and without chemical looping using nickel based oxygen carrier. Int. J. Hydrogen Energy 2018, 43, 6904–6917. [Google Scholar] [CrossRef]
  4. Pujara, M.; Sheth, M.; Rachchh, N.; Bhoraniya, R.; Harichandan, A.B. Chemical Looping Reforming (CLR) System for H2 Production—A Review. In Proceedings of the Renewable Energy and Climate Change; Deb, D., Dixit, A., Chandra, L., Eds.; Springer: Singapore, 2020; pp. 267–276. [Google Scholar]
  5. Ipsakis, D.; Heracleous, E.; Silvester, L.; Bukur, D.B.; Lemonidou, A.A. Reaction-based kinetic model for the reduction of supported NiO oxygen transfer materials by CH4. Catal. Today 2019. [Google Scholar] [CrossRef]
  6. Zeng, L.; Cheng, Z.; Fan, J.A.; Fan, L.-S.; Gong, J. Metal oxide redox chemistry for chemical looping processes. Nat. Rev. Chem. 2018, 2, 349–364. [Google Scholar] [CrossRef]
  7. Hu, J.; Galvita, V.; Poelman, H.; Marin, G. Advanced Chemical Looping Materials for CO2 Utilization: A Review. Materials 2018, 11, 1187. [Google Scholar] [CrossRef] [Green Version]
  8. Buelens, L.C.; Galvita, V.V.; Poelman, H.; Detavernier, C.; Marin, G.B. Super-dry reforming of methane intensifies CO2 utilization via Le Chateliers principle. Science 2016, 354, 449–452. [Google Scholar] [CrossRef]
  9. Neagu, D.; Papaioannou, E.I.; Ramli, W.K.W.; Miller, D.N.; Murdoch, B.J.; Ménard, H.; Umar, A.; Barlow, A.J.; Cumpson, P.J.; Irvine, J.T.S.; et al. Demonstration of chemistry at a point through restructuring and catalytic activation at anchored nanoparticles. Nat. Commun. 2017, 8, 1855. [Google Scholar] [CrossRef] [Green Version]
  10. Neagu, D.; Oh, T.-S.; Miller, D.N.; Ménard, H.; Bukhari, S.M.; Gamble, S.R.; Gorte, R.J.; Vohs, J.M.; Irvine, J.T.S. Nano-socketed nickel particles with enhanced coking resistance grown in situ by redox exsolution. Nat. Commun. 2015, 6, 8120. [Google Scholar] [CrossRef] [Green Version]
  11. Neagu, D.; Kyriakou, V.; Roiban, I.-L.; Aouine, M.; Tang, C.; Caravaca, A.; Kousi, K.; Schreur-Piet, I.; Metcalfe, I.S.; Vernoux, P.; et al. In Situ Observation of Nanoparticle Exsolution from Perovskite Oxides: From Atomic Scale Mechanistic Insight to Nanostructure Tailoring. ACS Nano 2019, 13, 12996–13005. [Google Scholar] [CrossRef]
  12. Papaioannou, E.I.; Neagu, D.; Ramli, W.K.W.; Irvine, J.T.S.; Metcalfe, I.S. Sulfur-Tolerant, Exsolved Fe–Ni Alloy Nanoparticles for CO Oxidation. Top. Catal. 2018. [Google Scholar] [CrossRef] [Green Version]
  13. Komarala, E.P.; Komissarov, I.; Rosen, B.A. Effect of Fe and Mn Substitution in LaNiO3 on Exsolution, Activity, and Stability for Methane Dry Reforming. Catalysts 2020, 10, 27. [Google Scholar] [CrossRef] [Green Version]
  14. Otto, S.-K.; Kousi, K.; Neagu, D.; Bekris, L.; Janek, J.; Metcalfe, I.S. Exsolved Nickel Nanoparticles Acting as Oxygen Storage Reservoirs and Active Sites for Redox CH4 Conversion. ACS Appl. Energy Mater. 2019, 2, 7288–7298. [Google Scholar] [CrossRef]
  15. Hosseini, D.; Donat, F.; Abdala, P.M.; Kim, S.M.; Kierzkowska, A.M.; Müller, C.R. Reversible Exsolution of Dopant Improves the Performance of Ca2Fe2O5 for Chemical Looping Hydrogen Production. ACS Appl. Mater. Interfaces 2019. [Google Scholar] [CrossRef]
  16. Zeng, D.; Qiu, Y.; Peng, S.; Chen, C.; Zeng, J.; Zhang, S.; Xiao, R. Enhanced hydrogen production performance through controllable redox exsolution within CoFeAlOx spinel oxygen carrier materials. J. Mater. Chem. A 2018, 6, 11306–11316. [Google Scholar] [CrossRef]
  17. Lindenthal, L.; Rameshan, R.; Summerer, H.; Ruh, T.; Popovic, J.; Nenning, A.; Löffler, S.; Opitz, A.K.; Blaha, P.; Rameshan, C. Modifying the Surface Structure of Perovskite-Based Catalysts by Nanoparticle Exsolution. Catalysts 2020, 10, 268. [Google Scholar] [CrossRef] [Green Version]
  18. Kousi, K.; Neagu, D.; Bekris, L.; Papaioannou, E.I.; Metcalfe, I.S. Endogenous Nanoparticles Strain Perovskite Host Lattice Providing Oxygen Capacity and Driving Oxygen Exchange and CH4 Conversion to Syngas. Angew. Chem. Int. Ed. 2020, 59, 2510–2519. [Google Scholar] [CrossRef]
  19. Wan Abu Bakar, W.A.; Ali, R.; Mohammad, N.S. The effect of noble metals on catalytic methanation reaction over supported Mn/Ni oxide based catalysts. Arab. J. Chem. 2015, 8, 632–643. [Google Scholar] [CrossRef] [Green Version]
  20. Hou, Z.; Yashima, T. Small amounts of Rh-promoted Ni catalysts for methane reforming with CO2. Catal. Lett. 2003, 89, 193–197. [Google Scholar] [CrossRef]
  21. Zhu, X.; Imtiaz, Q.; Donat, F.; Müller, C.R.; Li, F. Chemical looping beyond combustion—A perspective. Energy Environ. Sci. 2020, 13, 772–804. [Google Scholar] [CrossRef] [Green Version]
  22. Tang, C.; Kousi, K.; Neagu, D.; Portolés, J.; Papaioannou, E.I.; Metcalfe, I.S. Towards efficient use of noble metals via exsolution exemplified for CO oxidation. Nanoscale 2019, 11, 16935–16944. [Google Scholar] [CrossRef] [PubMed]
  23. Neagu, D.; Tsekouras, G.; Miller, D.N.; Ménard, H.; Irvine, J.T.S. In situ growth of nanoparticles through control of non-stoichiometry. Nat. Chem. 2013, 5, 916–923. [Google Scholar] [CrossRef] [PubMed] [Green Version]
  24. Shafiefarhood, A.; Zhang, J.; Neal, L.M.; Li, F. Rh-promoted mixed oxides for “low-temperature” methane partial oxidation in the absence of gaseous oxidants. J. Mater. Chem. A 2017, 5, 11930–11939. [Google Scholar] [CrossRef]
  25. Palcheva, R.; Olsbye, U.; Palcut, M.; Rauwel, P.; Tyuliev, G.; Velinov, N.; Fjellvåg, H.H. Rh promoted La0.75Sr0.25(Fe0.8Co0.2)1−xGaxO3-δ perovskite catalysts: Characterization and catalytic performance for methane partial oxidation to synthesis gas. Appl. Surf. Sci. 2015, 357, 45–54. [Google Scholar] [CrossRef]
  26. Hou, Z.; Chen, P.; Fang, H.; Zheng, X.; Yashima, T. Production of synthesis gas via methane reforming with CO2 on noble metals and small amount of noble-(Rh-) promoted Ni catalysts. Int. J. Hydrogen Energy 2006, 31, 555–561. [Google Scholar] [CrossRef]
  27. Wu, J.C.S.; Chou, H.-C. Bimetallic Rh–Ni/BN catalyst for methane reforming with CO2. Chem. Eng. J. 2009, 148, 539–545. [Google Scholar] [CrossRef]
  28. Yentekakis, I.V.; Goula, G.; Hatzisymeon, M.; Betsi-Argyropoulou, I.; Botzolaki, G.; Kousi, K.; Kondarides, D.I.; Taylor, M.J.; Parlett, C.M.A.; Osatiashtiani, A.; et al. Effect of support oxygen storage capacity on the catalytic performance of Rh nanoparticles for CO2 reforming of methane. Appl. Catal. B Environ. 2019, 243, 490–501. [Google Scholar] [CrossRef] [Green Version]
  29. Kyriakou, V.; Neagu, D.; Zafeiropoulos, G.; Sharma, R.K.; Tang, C.; Kousi, K.; Metcalfe, I.S.; van de Sanden, M.C.M.; Tsampas, M.N. Symmetrical Exsolution of Rh Nanoparticles in Solid Oxide Cells for Efficient Syngas Production from Greenhouse Gases. ACS Catal. 2019. [Google Scholar] [CrossRef]
  30. Vayssilov, G.N.; Lykhach, Y.; Migani, A.; Staudt, T.; Petrova, G.P.; Tsud, N.; Skála, T.; Bruix, A.; Illas, F.; Prince, K.C.; et al. Support nanostructure boosts oxygen transfer to catalytically active platinum nanoparticles. Nat. Mater. 2011, 10, 310–315. [Google Scholar] [CrossRef]
  31. Varga, E.; Pusztai, P.; Óvári, L.; Oszkó, A.; Erdőhelyi, A.; Papp, C.; Steinrück, H.-P.; Kónya, Z.; Kiss, J. Probing the interaction of Rh, Co and bimetallic Rh–Co nanoparticles with the CeO2 support: Catalytic materials for alternative energy generation. Phys. Chem. Chem. Phys. 2015, 17, 27154–27166. [Google Scholar] [CrossRef] [Green Version]
  32. Ferencz, Z.; Erdőhelyi, A.; Baán, K.; Oszkó, A.; Óvári, L.; Kónya, Z.; Papp, C.; Steinrück, H.-P.; Kiss, J. Effects of Support and Rh Additive on Co-Based Catalysts in the Ethanol Steam Reforming Reaction. ACS Catal. 2014, 4, 1205–1218. [Google Scholar] [CrossRef] [Green Version]
  33. Zhu, X.; Li, K.; Neal, L.; Li, F. Perovskites as Geo-inspired Oxygen Storage Materials for Chemical Looping and Three-Way Catalysis: A Perspective. ACS Catal. 2018, 8, 8213–8236. [Google Scholar] [CrossRef]
Figure 1. Functionalizing the surface of endo/exo-particle systems to lower methane activation temperature.
Catalysts 10 00468 g001
Figure 2. Preparing a single-phase perovskite capable of exsolving exo- and endo-particles. (a) Rietveld refinement (wR 9%) of the room-temperature XRD pattern of the La0.8Ce0.1Ni0.4Ti0.6O3 perovskite after sintering at 1400 °C for 15 h. (b) Crystal structure corresponding to the perovskite obtained by refinement (space group Pnma, a = 5.54067 Å, b = 5.52939 Å, c = 7.818 Å).
Catalysts 10 00468 g002
Figure 3. Creating perovskites with different microstructures. (ac) Illustration of the three different microstructures. Microstructure (SEM) of the La0.8Ce0.1Ni0.4Ti0.6O3 perovskite after micromanipulation to create different microstructures as (d) fine powder (fP) (e) coarse powder (cP) (f) pellet (pP) with inserts of the XRD pattern of the main perovskite peak.
Catalysts 10 00468 g003
Figure 4. Exsolving from samples with different microstructures. (a) Microstructure (SEM) analysis of the fine powder (fP), the coarse powder (cP) and the pellet (pP) after reduction at 1000 C for 10 h. Inserts of XRD patterns of the samples after reduction indicating with ● the main perovskite peak at ~32°, with ◾ the La2TiO5 phase [18] at ~27° and with * the Ni metal peak at ~44°. (b) Nanostructure (SEM) analysis of the fP, cP and the pP after reduction at 1000 C for 10 h. (c) Particle size analysis and population for the samples. (d) Temperature programmed reduction (HTPR) and (e)H) calculated oxygen capacity from experiment in (d).
Catalysts 10 00468 g004
Figure 5. Activity of the exsolved perovskites with different microstructures. (a) Methane conversion to CO, CO2 and H2 observed for all the samples. (b) Microstructure (SEM) analysis of the samples after experiment described in (a). (c) CO2 produced during oxidation of the samples after MTPR testing in (a) and (d) the calculated coke for the experiment described in (c).
Catalysts 10 00468 g005
Figure 6. Infiltrating exsolved samples with Rh. Microstructure (SEM) analysis of the impregnated (a) coarse powder (Rh|cP-Ni) and (b) pellet (Rh|pP-Ni) after reduction (HTPR experiments). (c) Temperature programmed reduction (HTPR) and (d) (ζH) calculated oxygen capacity from experiment described in (d).
Catalysts 10 00468 g006
Figure 7. Activity of the Rh infiltrated exsolved perovskites. (a) Methane conversion to CO and H2 observed for the coarse powder samples. (b) Methane conversion to CO and H2 observed for the pellet samples. (c) Capacity of the samples in molO/molp derived from MTPR and HTPR. (d) Comparison of activation temperature achieved by the samples in (a) and (b). (e). CO2 produced during oxidation of the samples after MTPR testing and (f) the calculated coke for the experiment described in (e).
Catalysts 10 00468 g007aCatalysts 10 00468 g007b
Figure 8. Micro- and nanostructure of the Rh infiltrated exsolved perovskites. (a) Overview of the microstructure of the infiltrated coarse powder Rh|cP-Ni. (b) Nanostructure of the surface of Rh|cP-Ni. (c) Nanostructure of the bulk of Rh|cP-Ni. (d) Overview of the microstructure of the infiltrated pellet Rh|pP-Ni. (e) Nanostructure of the surface of Rh|pP-Ni. (f) Nanostructure of the bulk of Rh|pP-Ni.
Catalysts 10 00468 g008

