Abstract
This Note aims at clarifying the alternative mechanisms of carbon formation from gases at temperatures above 550 °C. Both the growth of carbon nanotubes (CNTs) by a hybrid route, and of graphene layers deposition by a pyrolytic route are analyzed: the transition had no influence in apparent kinetics, but the carbon structure was totally different. The transition temperature from hybrid to pyrolytic growth varies with the gas pressure: higher temperature transition was possible using lower active gas pressures. The rate-determining step concept is essential to understanding the behavior. In catalytic and hybrid carbon formation, the slower step controls and determines kinetics. In the pyrolytic region, the faster step dominates, and carbon bulk diffusion is blocked: layers of graphene cover the external catalyst surface. It is easier to optimize CNTs growth (rate, shape, properties) knowing the details of the alternative mechanisms operating.
1. Introduction
Carbon formation from C-containing gases has been studied in some detail by many researchers from 1950–1970. Palmer and Cullis summarize the seven mechanisms proposed up to 1965 [1]. Early studies of carbon formation from gases provide useful kinetic information [2,3]. Diffusion of gases or atoms in solids was extensively studied in the period 1920–1940. Barrer summarizes this new branch of science in a book that includes theoretical and experimental results discussed in detail [4]. The alternative expressions proposed for the diffusion processes, since 1922, are also listed (Table 76 of the book). Fick’s law can be used to relate the diffusive flux to the concentration assuming the steady state:
where J is the flux, D is the observed diffusivity and dC/dx is the concentration gradient.
Kinetic studies followed [5,6,7,8,9,10]. Tesner et al. observed a maximum (volcano shape type) at ca. 600 °C for carbon formation from C2H2 [11]. Lobo and Trimm—using a microbalance, transmission electron microscopy (TEM), scanning electron microscopy (SEM) and X-ray diffraction (XRD)—studied in detail the kinetics of carbon formation with C2H2 and low olefins [12,13], followed by other authors [14,15]. After Ijima’s success in preparing highly perfect multiwall CNTs [16], the production of nanotubes by arc and laser vaporization became common. A discussion of the apparatus, techniques and proposed mechanisms is available in several textbooks, namely Saito et al. [17] (chapter 5) and Harris [18] (chapter 2). Several recent reviews are listed in Table 1 [19,20,21,22,23]. However, details of the kinetic behavior and alternative mechanisms operating require clarification. The aim of this Note is to offer a simple perspective of the alternative routes and the reasons for the mechanistic transition.

Table 1.
Recent review articles of carbon formation above 550 °C.
2. Kinetic Routes, Alternative Growth Mechanisms
In a recent review, three kinetic routes for chemical vapor deposition (CVD) were distinguished: catalytic, hybrid and pyrolytic [24]. The volcano shape Arrhenius plot, found at lower temperatures (400–650 °C), has been clarified, based on a survey of kinetic studies [25]. Understanding the mechanisms at higher temperatures requires a similar detailed analysis of the kinetic behavior. Both CNTs growth and carpet growth kinetics were analyzed. The need for kinetic studies to evaluate the rates under steady-state regime was emphasized, checking linearity in the weight versus time register, to consistently determine activation energies and using alternative reaction pressures, to determine the reaction order [26]. In a microbalance with transparent silica tubes, the formation of pyrolytic carbon on the walls, shows when the pyrolytic carbon formation route prevails. A reliable and detailed Arrhenius plot is perhaps the best way to follow the changes of route caused by changes in temperature or pressure.
In recent times, steady-state kinetics has been replaced by scanning temperature experiments – useful to get an indication about the catalyst active ranges but lacking essential kinetic details. In addition, the Raman spectroscopy is especially useful, but it runs at low temperatures, not at reaction temperatures of interest in carbon formation. Thus, the active phases operating may not be detected.
The three alternative kinetic routes observed are listed in Table 2. In Figure 1a, the interaction of gas with a metal catalyst surface is schematized. For catalytic carbon formation (route I), only Ni, Fe and Co are active. In route II, numerous transition and noble metals are active. Carbon C2/C3 particles impinge on the external catalyst surface, diffuse through the bulk of the catalyst and grow CNTs at the growth region, where nucleation initially took place. Figure 1b shows a typical Arrhenius plot observed over the full temperature range (300–1200 °C).
Table 2.
Summary of the three different routes of graphene formation from hydrocarbons over different temperature/pressure ranges [24].
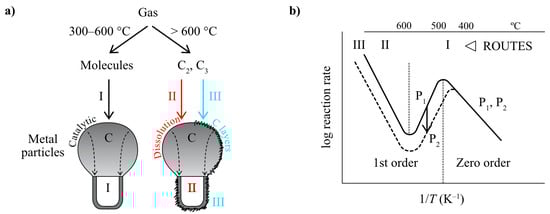
Figure 1.
(a) Three kinetic routes key points: I—Surface catalysis; II—C dissolution; III—C layers; (b) Typical Arrhenius plots observed experimentally with Ni, Co and Fe over a wide T range.
The prevalence of the various kinetic routes operating can be briefly summarized:
Route (I) Catalytic kinetic route (Fe, Co, Ni). Catalytic surface reaction forms carbon atoms that easily dissolve in the catalyst (interstitial diffusion operates) but can also nucleate in a more prone metal surface (Ex: (111) crystal facet) and grow. The carbon concentration during growth inside the metal particle is low and therefore, further graphene nucleation does not occur.
Route (II) At higher temperatures (~550 °C) the gas decomposes and C2/C3 carbon particles impinge on the catalyst surface, dissolve, diffuse, nucleating graphene on the more selective regions—growing in a way similar to route I, as long as bulk C diffusion is the rate determining step.
Route (III) At higher temperatures, when the impingement of carbon particles is faster than carbon bulk diffusion—which depends on the carbon formation gas pressure—the catalyst surface gets covered with graphene forming layers. Route II no longer operates, and route III prevails. Successive graphene layers cover the surface, either being it a plane or a CNT. To understand the details of the mechanism operating, it is necessary to recognize which alternative rate determining step is controlling. In addition, it is important to know the solid-state phases of the two sides of the catalyst particles, present under reaction conditions. This information cannot be obtained by Raman spectroscopy (carried out at low temperature). In situ X-ray diffraction is a convenient alternative, among others.
A simplified scheme of the alternative routes was proposed by Figueiredo and co-workers [27] and used by Ashik et al. [21]. However, the alternative routes may include alternative rate-determining steps, which must be considered, so that the operating conditions and carbon growth mode and shape are well understood. In fact, the original finding of alternative reaction regions by Lobo and Trimm [12], apparently showed three regions in the Arrhenius plot, which do not correspond to the three alternative mechanisms operating (Figure 1). The volcano shape region covers a single mechanism, with two alternative rate-determining steps. The high temperature region includes two totally different mechanisms, but the typical Arrhenius plots show a continuous linear dependence, as shown in Figure 2: a sort of a “mystery”, explained below. The Arrhenius plots shown correspond to typical results obtained from detailed isothermal microbalance studies reaching steady-state carbon deposition (linearity) in the 70’s and 80’s (about 300 or more). Those results were always inserted in an Arrhenius plot scale to evidence the activation energy. The Arrhenius plots are based in successive insertion of points corresponding to many steady-state rates of carbon formation measurements using a vacuum microbalance, as shown in Figure 3 and also in a recent short review [24].
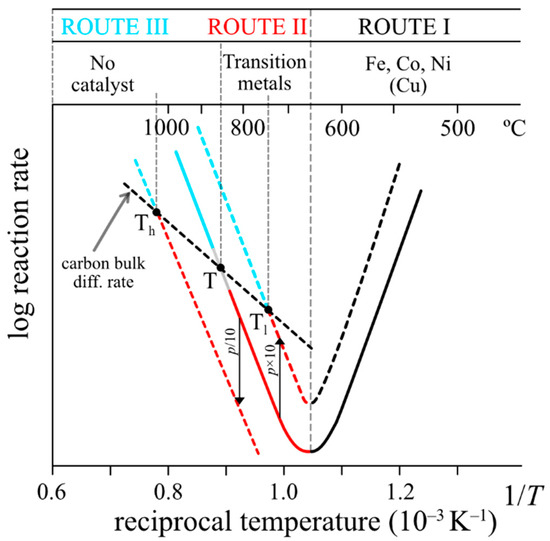
Figure 2.
Typical Arrhenius plot: carbon formation mechanisms at high temperature. Below ~850 °C (point temperature), the rate is controlled by the slower pyrolytic carbon deposition step (the carbon bulk diffusion step is faster) and carbon nanotubes (CNTs) can grow. The catalyst external surface remains clean. Above ~850 °C, the same step is faster. Pyrolytic carbon deposition on the surfaces prevails and carbon bulk diffusion is not possible: carbon layers cover the surface. However, using lower gas pressures (ex: P/10) CNTs growth can operate at higher temperatures (Th >T) and faster rates.
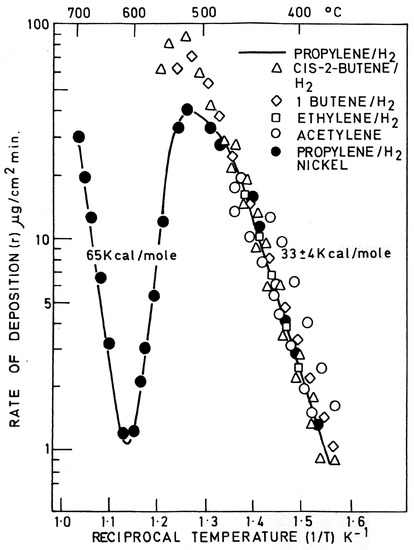
Figure 3.
Kinetic curves for the rate of decomposition of carbon against 1/T for hydrocarbons shown (adapted from reference [13]).
3. Mechanism above ~550 °C: Transition from Hybrid to Pyrolytic Growth
The kinetics of carbon formation above ~550 °C is quite different from the catalytic route observed at lower temperatures. Figure 2 shows the type of Arrhenius plot experimentally observed.
In region RII, the mechanism involves two steps, but the C2–C3 particles impingement step is slower than the following carbon bulk diffusion step. The catalyst surface remains “dynamically clean” during reaction. But, in region RIII, the C2–C3 impingement step is faster than the following carbon bulk diffusion step. Coverage of the surface by carbon layers prevails. In fact, deposition of carbon particles formed in the gas phase prevails everywhere, including the reactor walls. The transition point between the two routes is shown (point T at ~ 750 °C). The observed carbon deposition rate is 1st order. There is an important factor in this process: the transition temperature from hybrid route to pyrolytic route changes with operating pressure: to a lower temperature (Tl ~ 650 °C) using a higher pressure or to a higher temperature (Th ~ 950 °C) using a lower pressure, as shown in Figure 2. As reminded in that figure, the catalysts active in the hybrid route are not just Fe, Co, Ni and Cu. Most transition metals and noble metals are active. Initial surface catalysis is not required—and is, in fact, inactive due to extremely low gas adsorption. The transition from hybrid to pyrolytic carbon growth may be gradual and take place slightly below the point T in Figure 2 or slightly above. The coverage of the catalyst surface by C2/C3 particles is random and rearrangements in the initial graphene layer may take some time.
Figueiredo et al. studied CH4 ⇌ C+2H2 formation using Ni–Cu as a catalyst. The hybrid mode prevailed up to 600 °C. The surface coverage by the prevalence of a pyrolytic mode occurred at 700 °C (in 2 h) and at 900 °C in ~1 h. [28]. The CH4 low-pressure (CH4/N2 = 0.1) favored a higher temperature transition. The structure of the graphene formed was quite different in different temperature ranges. The same authors studied the catalytic decomposition of CH4 into hydrogen and carbon, using La2O3 doped Ni and Ni–Cu [29], following the studies of Lazaro et al. [30]. The structure of the formed carbon structures was better at 600 °C than at 700 °C.
Saito and al. [6] mentioned two “schools of thought” for the operating mechanism: 1st) “assumes that the nanotubes are always caped and that the growth mechanism involves a C2 absorption process that is assisted by the pentagonal defects on the caps”; 2nd) “assumes that the nanotubes are open during the growth process and that carbon atoms are added at the open ends of the nanotubes”.
We believe that a solid-state behavior at nano level is now well evidenced. Carbon diffusion through transition metals is interstitial with an exponential dependence from temperature:
where D is the diffusivity and D0 is the pre-exponential factor (diffusivity limit level).
When the flux is constant, the first Fick’s law, mentioned earlier, applies.
In growth processes, the steady-state (growth) is reached after an initial period during which solid-state transitions may occur [25]. Linearity in a weigh versus time register is observed.
There is an important difference between reactions following catalytic route I or following hybrid route II. In the first case, there is gas decomposition surface catalysis (Ni, Co, Fe particles). However, in the hybrid route, the carbon C2/C3 particles are formed in the gas phase by pyrolysis, impinge on a catalyst surface and diffuse through the nanoparticle to an opposed surface (Figure 1). Several transition and noble metals are active is this case: the role of the catalyst is just to catalyze graphene nucleation and growth, not to decompose a reactant gas.
4. HT Deposition: Lower Active Gas Pressure, Faster CNTs Growth Rates
To avoid pyrolytic carbon coverage of the catalyst surface, this process must be the (slower) rate-determining step. Carbon atoms bulk diffusion and CNTs growth must be faster. Low pressure of the active gas is the key.
Emmeneger et al. found that the production of CNTs from C2H2/N2 gas mixture using Fe/Fe3C nanoparticles (10–40 nm diameter) gave better results and faster rates at higher temperatures (650 °C), with just 1.2% C2H2 and 98.8% N2 [31]. This confirms the details of the mechanism described above (Figure 2). Gadelle also found faster rates of carbon deposition at 550 °C using CO/H2 mixtures with lower CO and higher H2 concentrations [32].
Rao et al., in 1998, used ferrocene or nickelocene and benzene to produce CNTs at 900–1100 °C [33]. To optimize carbon growth, they used C2H2 and cobaltocene at a flow rate 50 sccm merging in a total flow rate of 1000 (950 sccm of Ar+H2). The prevalence of catalytic/hybrid growth mechanism at such a high temperature is assured. Guellati et al. also optimized CNTs production with ferrocene–toluene flow rate of 0.33 mL/min and 1.5 L/min of Ar with 0.1 L/min H2 [34]. Barreiro et al. also optimized single walled CNTs formation in the range 650–900 °C with a high flow of the carrier gas (2000 sccm) [35]. Eres et al. tested 12 different C source gases to optimize single wall CNTs production. Using a gas mixture of 2% C2H2, 10% H2 and 88% He, they were able to obtain CNTs growth with temperatures of surface impingement up to 740 °C. [36]. Latorre et al. (2010) studied C formation from CH4 using 5% CH4, 2% H2 and 93% N2. They found that CNTs formation went to a maximum at 750 °C [37]. Valiente et al. used 10% C2H2 and 90% He to grow CNTs on an iron-based catalyst up to 600–700 °C [38].
Hence, in the high temperature carbon growth processes, we can obtain faster CNTs growth (route II) and avoid catalyst encapsulation using low active gas pressures.
The carbon layers formation under a pyrolytic regime (route III) has been studied by many authors, as stated in the Introduction. A study of the effect of either H2 or N2 being used in the carrier gas has been recently published [39].
5. Conclusions
Both thermodynamics and kinetics are important to understand a reaction mechanism, but the faster route prevails, even when it is not the most thermodynamically favorable. Evidence of which mechanism is prevailing is well shown by isothermal kinetic studies.
Most carbon formation reactions from gases follow essentially one of three alternative routes: catalytic, pyrolytic or hybrid. The transition from hybrid to pyrolytic route varies with active gas pressure (not total gas pressure). At lower active gas pressures, the transition takes place at higher temperatures.
This may be of interest to get faster or better CNTs growth via the hybrid route. Using arc and laser vaporization, the local operating conditions may be difficult to establish.
The hybrid route prevails when the carbon bulk diffusion through the metal catalyst nanoparticle is not the rate-determining step. The C2/C3 species dissolve quickly, avoiding formation of a graphene coverage on the surface: Using low pressures, faster rates are possible.
The pyrolytic route prevails when a faster C deposition rate covers the catalyst surface and so inhibits the 2nd step to operate.
Author Contributions
L.S.L. performed the literature search and wrote the paper. S.A.C.C. revised and edited the manuscript. All authors have read and agreed to the published version of the manuscript.
Funding
This work was supported by the Associate Laboratory for Green Chemistry—LAQV which is financed by national funds from FCT/MCTES (UIDB/50006/2020).
Acknowledgments
The authors thank Victor Teodoro for help with the drawings.
Conflicts of Interest
The authors declare no conflict of interest.
References
- Palmer, H.B.; Cullis, C.L. The Formation of Carbon from Gases. In Chemistry and Physics of Carbon; Dekker: New York, NY, USA, 1965; Volume 1, pp. 265–325. [Google Scholar]
- Kotlensky, W.V. Deposition of Pyrolytic Carbon in Porous Solids. In Chemistry and Physics of Carbon; Marcel Dekker, Inc.: New York, NY, USA, 1973; Volume 9, pp. 173–262. [Google Scholar]
- Bokros, J.C. Deposition, Structure and Properties of Pyrolytic Carbons. In Chemistry and Physics of Carbon; Dekker: New York, NY, USA, 1969; Volume 5. [Google Scholar]
- Barrer, R.M. Diffusion in and through Solids; Cambridge Univ. Press: Cambridge, UK, 1941. [Google Scholar]
- Walker, P.L.; Rusinko, F.; Austin, I.G. Gas Reactions of Carbon. In Advances in Catalysis; Academic Press: Cambridge, MA, USA, 1959; Volume 11, pp. 133–221. [Google Scholar]
- Slysh, R.S.; Kinney, C.R. Some kinetics of the carbonization of benzene, acetylene and diacetylene at 1200 degree. J. Phys. Chem. 1961, 65, 1044. [Google Scholar] [CrossRef]
- Ford, A.R. Deposition, Structure and Properties of Pyrolytic Carbons. Engineer 1967, 224, 444. [Google Scholar]
- Fischback, D.B. Effect of Substrate Structure on Deposition of Evaporated Carbon. J. Mater. Sci. 1968, 3, 559–561. [Google Scholar] [CrossRef][Green Version]
- Presland, A.E.B.; Walker, P.L. Growth of single-crystal graphite by pyrolysis of acetylene over metals. Carbon 1969, 7, 1–4. [Google Scholar] [CrossRef]
- Khan, M.S.; Crynes, B.L. Survey of Recent Methane Pyrolysis Literature. Ind. Eng. Chem. 1970, 62, 54–59. [Google Scholar] [CrossRef]
- Tesner, P.A.; Robonovich, E.Y.; Rafalkes, I.S.; Arefieva, E.F. Formation of Carbon Fibers from Acetylene. Carbon 1970, 8, 435–442. [Google Scholar] [CrossRef]
- Lobo, L.S.; Trimm, D.L. Complex temperature dependencies of the rate of carbon deposition on nickel. Nat. Phys. Sci. 1971, 234, 15–16. [Google Scholar] [CrossRef]
- Lobo, L.S.; Trimm, D.L. Studies of Carbon Formation on Metals Using a Vacuum Microbalance. In Progress in Vacuum Microbalance Techniques; Heyden & Son: London, UK, 1972; Volume 2. [Google Scholar]
- Baker, R.T.; Barber, M.A.; Harris, P.S.; Feates, F.S.; Waite, R.J. Nucleation and Growth of C Deposits from Ni Catalyzed Decomposition of C2H2. J. Catal. 1972, 26, 51–62. [Google Scholar] [CrossRef]
- Nielsen, J.R.; Trimm, D.L. Mechanism of Carbon Formation on Nickel-Containing Catalysts. J. Catal. 1977, 48, 155–165. [Google Scholar]
- Iijima, S. Helical microtubules of graphitic carbon. Nature 1991, 354, 56–58. [Google Scholar] [CrossRef]
- Saito, R.; Dresselhause, G.; Dresselhause, M.S. Physical Properties of Carbon Nanotubes; Imperial College Press: London, UK, 1998. [Google Scholar]
- Harris, P.J.F. Carbon Nanotube Science; Cambridge University Press: Cambridge, UK, 2009. [Google Scholar]
- Shaikjee, A.; Coville, N.J. The role of the hydrocarbon source on the growth of carbon materials. Carbon 2012, 50, 3376–3398. [Google Scholar] [CrossRef]
- Fau, G.; Gascoin, N.; Steelant, J. Hydrocarbon pyrolysis with a methane focus: A review on the catalytic effect and the coke production. J. Anal. Appl. Pyrol. 2014, 108, 1–11. [Google Scholar] [CrossRef]
- Ashik, U.P.M.; Wan Daud, W.M.A.; Abas, H.F. Production of greenhouse gas free hydrogen by thermocatalytic decomposition of methane—A review. Renew. Sustain. Energy Rev. 2015, 44, 221–256. [Google Scholar] [CrossRef]
- Ashik, U.P.M.; Wan Daud, W.M.A.; Hyashi, J.-I. A review on CH4 transformation to H2 and nanocarbon. Renew. Sustain. Energy Rev. 2017, 76, 743–767. [Google Scholar] [CrossRef]
- Janas, D. Towards monochiral carbon nanotubes: A review of progress in the sorting of single-walled CNTs. Mater. Chem. Front. 2018, 2, 36–73. [Google Scholar] [CrossRef]
- Lobo, L.S. Mechanism of Catalytic CNTs Growth in 400–650 °C Range: Explaining Volcano Shape Arrhenius Plot and Catalytic Synergism Using both Pt (or Pd) and Ni, Co or Fe. C J. Carbon Res. 2019, 5, 42. [Google Scholar] [CrossRef]
- Lobo, L.S. Catalytic carbon formation: Clarifying the alternative kinetic routes and defining a kinetic linearity for sustained growth concept. Reac. Kinet. Mech. Cat. 2016, 118, 393–414. [Google Scholar] [CrossRef]
- Lobo, L.S. Nucleation and growth of carbon nanotubes and nanofibers: Mechanism and catalytic geometry control. Carbon 2017, 114, 411–417. [Google Scholar] [CrossRef]
- Cunha, A.F.; Orfão, J.J.M.; Figueiredo, J.L. Catalytic decomposition of methane on Raney-type catalysts. Appl. Catal. A 2008, 348, 103–112. [Google Scholar] [CrossRef]
- Figueiredo, J.L.; Orfão, J.J.M.; Cunha, A.F. H2 production via CH4 decomposition on Raney-type catalysts. Int. J. Hydrogen Energy 2010, 35, 9795–9980. [Google Scholar] [CrossRef]
- Ferreira, V.J.; Tavares, P.; Figueiredo, J.L.; Faria, J.L. Ce-Doped La2O3 based catalyst for the oxidative coupling of methane. Catal. Commun. 2013, 42, 50–53. [Google Scholar] [CrossRef]
- Lázaro, M.J.; Pinilla, J.L.; Suelves, I.; Moliner, R. Study of the deactivation mechanism of carbon blacks used in methane decomposition. Int. J. Hydrogen Energy 2008, 33, 4104–4111. [Google Scholar] [CrossRef]
- Emmenegger, C.; Bonard, J.M.; Mauron, P.; Sudan, P.; Lepora, A.; Grobety, B.; Züttel, A.; Schlapbach, L. Synthesis of carbon nanotubes over Fe catalyst on aluminium and suggested growth mechanism. Carbon 2003, 41, 539–547. [Google Scholar] [CrossRef]
- Herreyre, S.; Gadelle, P. Effect of H2 on the morphology of C deposited from the catalytic disproportionation of CO. Carbon 1995, 33, 234–237. [Google Scholar] [CrossRef]
- Rao, C.N.R.; Govindaraj, A.; Sen, R.; Satishkumar, B.C. Synthesis of MW and SW nanotubes, aligned-nanotube bundles and nanorods by employing organometallic precursors. Mat. Res. Innovat. 1998, 2, 128–141. [Google Scholar] [CrossRef]
- Guellati, O.; Bégin, D.; Antoni, F.; Moldovan, S.; Guerioune, M.; Pham-Huu, C. CNTs’ array growth using the floting catalyst-CVD method over different substrates and H2 supply. Mater. Sci. Eng. B 2018, 231, 11–17. [Google Scholar] [CrossRef]
- Barreiro, A.; Hampel, S.; Rümmeli, M.H.; Kramberger, C.; Grüneis, A.; Biedermann, K.; Leonhardt, A.; Gemming, T.; Büchner, B.; Bachtold, A.; et al. Thermal decomposition of Ferrocene as a Method for Production of SWCNTs without Additional Carbon Sources. J. Phys. Chem. B 2006, 110, 20973–20977. [Google Scholar] [CrossRef]
- Eres, G.; Kinkhabwala, A.A.; Cui, H.; Geohegan, D.B.; Puretzky, A.A.; Lowndes, D.H. Molecular Beam-Controlled Nucleation and Growth of Vertically Aligned SWCNTs arrays. J. Phys. Chem. B 2005, 109, 16684–16694. [Google Scholar] [CrossRef]
- Latorre, N.; Romeo, E.; Villacampa, J.I.; Cazana, F.; Royo, C.; Monzon, A. Kinetics of CNTs growth on a Ni-Mg-Al catalyst by CCVD of methane: Influence of catalyst deactivation. Catal. Today 2010, 154, 217–223. [Google Scholar] [CrossRef]
- Valiente, A.M.; Lopez, P.N.; Ramos, I.R.; Ruiz, A.G.; Li, C.; Xin, Q. In situ study of CNT formation by C2H2 decomposition on an iron-based catalyst. Carbon 2000, 38, 2003–2006. [Google Scholar] [CrossRef]
- Shi, Y.; Wang, Y.; Ren, Y.; Wan, Y. Effect of Gas Atmosphere in the Heating Stage on Limiting Nucleation of Graphene on Cu Foils by Low Pressure CVD. Cryst. Res. Technol. 2020. [Google Scholar] [CrossRef]
© 2020 by the authors. Licensee MDPI, Basel, Switzerland. This article is an open access article distributed under the terms and conditions of the Creative Commons Attribution (CC BY) license (http://creativecommons.org/licenses/by/4.0/).