Abstract
In this work, single-crystalline large-scale LaCO3OH nanoprism morphologies were synthesized by controlling La and Ca molar ratio and the hydrothermal reaction conditions. The nanoprism morphologies of LaCO3OH were unique in nature with a sharp corner and smooth surfaces. The hydrothermal reaction was carried out in the absence of organic additives or templates and (NH4)2CO3 was used as a precipitation agent. The molar ratio of La:Ca was varied over the following values (the sample shorthand is given in parentheses): 75:25 mol% (LC-1), 50:50 mol% (LC-2), and 25:75 mol% (LC-3). Phase-pure LaCO3OH nanoprisms formed at a La:Ca molar ratio of 75:25 mol% without any assistance of catalysts or template. The photoluminescence (PL) properties of the as-synthesized powders showed one broad emission band centered at 394 nm after excitation of the pure LC-3 LaCO3OH nanoprisms at λ = 280 nm. The PL intensities were decreased in the order of LC-1 < LC-2< LC-3. The LC-1 and LC-2 samples had almost the same PL intensities probably due to their unique and smooth particle morphology. The calcination result of three samples treated for two hours at 800 °C, shows a reduction in NO activities over highly distributed CaO comprising La2O3. Further, under the presence of H2O and O2 vapor, CaO comprising La2O3 catalysts shows higher stability for the reduction of NO with CH4.
1. Introduction
Significant efforts have been applied toward synthesizing nanomaterials with well-defined sizes and shapes using novel synthetic methodologies. The chemical and physical properties of nanomaterials are highly interconnected with the crystal type and phase. Geometrical factors (i.e., morphology, size, dimensionality, and composition) have a tremendous effect on a nanomaterial’s properties. The chemical and physical properties of a nanomaterial may be tuned to the requirements of the desired application by controlling the geometrical factors. Rare earth (RE) nanomaterials are in high demand in the field of modern electronics as well as across the chemical and material sciences. Their promising potential extends to catalysts [1], up-conversion materials [2], high-quality phosphors [3], biological labels [4], and magnetic materials [5].
Unique optical characteristics and abundant emission colors may be obtained from RE ion-doped luminescent materials. These materials have been used to develop display and phosphor applications. The unique intra-4f transitions of RE produce sharp emission bands [6]. In this case, the ligand field is less active because the outer 5s and 5p orbitals shield the 4f orbitals. Further, due to higher chemical stability and appropriate crystal structure Y2O3, YBO3, and YVO4 materials were commonly used as compared to other RE-doped luminescent materials [7]. However, for specific applications, La is the best choice as La is plentiful, and La2O3 is much cheaper than Y2O3. Despite its abundance, La-based materials have not been extensively studied. The luminescence intensity of La has been enhanced by doping or mixing trivalent RE metallic ions into a host lattice. Alternatively, the ions at the divalent metal ion sites may be substituted, for example, with Ca2+ ions [8]. These approaches have increased the luminescence intensity of the La materials. The luminous intensity may be tuned through careful selection of alkaline metal ions mixed with the RE composite material. Alkaline metal ions act as flux agents to decrease the reaction temperature and as a sensitizing agent to balance the charge in the structure. Lanthanum oxides and lanthanum oxycarbonates are suitable phosphor host materials because lanthanum oxycarbonates are stable in the presence of H2O and CO2. Oxycarbonate structures are analogous to lanthanum sesquioxide structures [9]. La ion-based RE compounds can assume a variety of morphologies, including spherical La2(CO3)3, nanowire LaPO4, and triangular nanoplates or flakes of LaF3 [10]. Relatively few studies have explored the preparation of novel morphologies in rare-earth hydroxycarbonates, particularly among the lanthanum hydroxycarbonates (LaCO3OH). Xiaoyang et al. synthesized LaCO3OH via an ethylenediaminetetraacetic acid-assisted hydrothermal method to form double-deck-like microhexagrams. They also fabricated a diversity of morphologies, including microspheres, apple-like nanostructures, nanowires, spiky balls, layer-by-layer self-assembled nanoplates, and triangular hearts [11]. LaCO3OH may be synthesized by a reaction of lanthanum (III) chloride and trifluoroacetic acid or sodium carbonate [12]. La(OH)CO3 nanomaterials have been synthesized via a hydrothermal method involving La2O3 and a glycine additive that facilitates the formation of new hierarchical layer-by-layer self-assembled one-dimensional (1D) nanostructures [13]. LaCO3OH hierarchical nanostructures with a uniform apple-like morphology have been prepared using a hydrothermal method involving a gelatin starting material in conjunction with a structure-directing agent [14]. The volume ratio of an ionic liquid (1,1,3,3-tetramethylguanidinium lactate) to water in a solvothermal process has been tuned to synthesize LaCO3OH with a nanowire morphology [15]. Recently, LaCO3OH microspheres were synthesized using a hydrothermal method involving La(NO3)·6H2O, and Ca nitrate salt at lower temperature [16]. Fei et al. also prepared LaCO3OH triangular nanoplates using La(CH3COO)2·H2O and ethylene glycol [17]. Guogang et al. developed microcrystals of LaCO3OH using a hydrothermal method without templates to obtain an orthorhombic phase [18]. Bao et al. synthesized LaCO3OH using a facile hydrothermal method, however, the product was phase-pure orthorhombic LaCO3OH with a mixture of rod and spherical particles morphology [19]. At higher temperatures, it was noticed that the orthorhombic structure of LaCO3OH is less stable as compared to the hexagonal structures [20]. Moreover, LaCO3OH with phase-pure hydrocarbonates structure had scarcely studied in the open literature. This was due to difficulty in synthesizing LaCO3OH with organic additives and templates that arises due to the complicate reaction mechanism, undesirable by-products, and higher production costs.
Several approaches have explored the development of more convenient synthetic methods for fabricating crystals in a controlled shape to enhance their performances. Hydrothermal methods are common in industrial processes because they are rapid, enable large-scale production, and have low processing costs [21]. These processes allow excellent control over the reaction conditions and product morphologies. A variety of inorganic materials having diverse architectures and controllable morphologies may be fabricated using a solution-based hydrothermal treatment [22].
Among toxic gasses, the concentration of nitrogen oxides (NOx = NO + NO2) is growing due to the enormous increase in fossil fuel consuming vehicles, industries and urban development [23]. As a consequence, there have been serious environmental issues, such as increases in air pollutants, smog and global temperature increment. Among different air pollutant NOx is the most hazardous pollutant and prolong exposure can cause breathing difficulties, coughing, and cyanosis. Further, NOx becomes more toxic under the presence of solar radiation and produces toxic ozone by photochemical reaction. This causes toxic acid rain which creates problems in the atmosphere, humans, soil, rivers, and crops [24]. Therefore, to reduce NOx, several investigators tried zeolite catalysts as a selective catalytic reduction (SCR). However, due to the instability of zeolite catalysts in the presence of H2O vapor, this becomes an obsolete choice as exhaust gases mainly contain H2O vapor [25]. Further, the performance of three-way catalysts in the reduction of NOx also found insufficient under the condition of the oxygen-rich environment [25]. Therefore, chemicals such as n-octane hydrocarbons, propane, ethylene, and propylene, were recently getting attention in NO reduction under the presence of O2 [26,27]. Also, chemicals like methane having strong C-H bonding can be used as de-NOx catalysts. The only issue with methane as a reduction agent is that it works at higher temperatures. It was thought that this sort of catalytic mechanism is responsible for the methane oxidative coupling [28]. In addition, the exact NO reduction mechanism with CH4 in the presence of O2 over metal oxide leftover unsolved. The catalytic activities under the presence of O2 were performed by Fokema and Ying [29] for the oxides, i.e., Y2O3, Sc2O3, and La2O3 with CH4. Among the catalysts tested, La2O3 performed extremely well, and the presence of oxygen with CH4 is almost comparable in catalytic activity compared to that of Co-ZSM5. Moreover, it is found that different activities reported for La2O3, Sr/La2O3, and CaO are similar or greater. Recently, in the presence of oxygen with CH4, Fliatoura et al. recorded NO reduction of La2O3–CaO mixed oxides and pure CaO [30,31]. Anastasiadou et al. studied that Ca2+ system doped with La2O3 significantly increases the NO reduction with CH4 compared to pure La2O3 and CaO alone in the presence of O2 [32]. After doping CaO into La3+ ions, the same phenomenon was observed too. We reported Ca–Sm–Sn–Ni–O based oxides powders with mixed phases for NO reduction with CH4, C2H4, and C3H6 in the presence of O2 [33]. The performance of single-phase metal oxide ousted that of mixed-phase with other benefits of minimizing NO reduction time [34]. The co-precipitation method was used to prepare those mentioned above La2O3–CaO mixed oxides and CaO alone. But due to the large grain size, the surface area of the mixed oxide sample was very low. This co-precipitation synthesis process results in non-homogeneous particle distribution with the rough morphology of mixed oxide powders [35]. Hydrothermally synthesized powders, on the other hand, were having homogenous agglomerates, light in weight, low-temperature synthesis process, and high purity [36]. The above discussion highlights the fact that a simple template-free synthetic method would be highly attractive for increasing the purity and yield of specific morphologies. Template-free methods are simple because they involve a one-step effective solution-phase route to fabricating novel inorganic materials without assistance from other reagents. To the best of our knowledge, LaCO3OH samples with a nanoprism-like structure have not yet been fabricated via a facile hydrothermal method without the assistance of additives. We examined the PL properties of the as-prepared samples at room temperature. Additionally, CaO containing La2O3 and LaCO3OH powders were synthesized hydrothermally and heat-treated at 800 °C. Further, under the presence of H2O vapor and oxygen, the reduction pattern of NO was analyzed by using hydrocarbons.
2. Results and Discussion
A flowchart for a fast understanding of the entire research work that has been accomplished in the present work is given below Scheme 1.
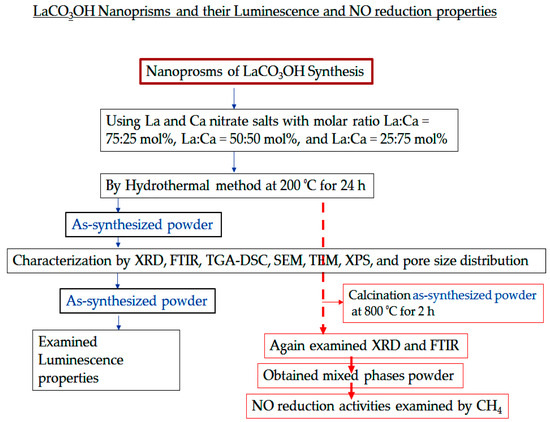
Scheme 1.
A flowchart of the entire research work that has been accomplished in the present work.
The X-ray diffraction patterns of synthesized samples (a) LC-1, (b) LC-2, and (c) LC-3 was shown in Figure 1. Figure 1a reveals that LC-3 was composed of a mixture of Ca(OH)2, CaCO3, and La(OH)3, indicating that phase-pure hexagonal LaCO3OH could not be formed at a La:Ca molar ratio of 25:75 mol%.
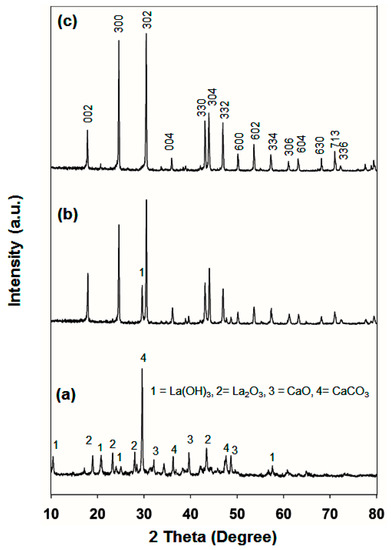
Figure 1.
X-ray diffraction (XRD) patterns of (a) LC-1, (b) LC-2, and (c) LC-3 samples prepared by the hydrothermal process at 200 °C, for 24 h at pH 8.5.
The LC-2 sample (Figure 1b) displayed an X-ray diffraction (XRD) pattern very similar to that of the phase-pure LaCO3OH, however, a La(OH)3 peak appeared at 30°, corresponding to the JCPDS 36-1481 La(OH)3 reference peak. As illustrated in Figure 1c, all product peaks can be indexed to the pure hexagonal phase of LaCO3OH, corresponding to the reference peaks of JCPDS no. 26-0815, with lattice constants a = b = 1.262 nm and c = 1.003 nm.
No other peaks were observed due to Ca, La, or their oxides or hydroxides. It seems that a high purity of the as-synthesized product was obtained. Zhang et al. [16] found a similar XRD pattern for the hexagonal LaCO3OH. Phase-pure LaCO3OH (sample LC-3) was obtained using a La:Ca molar ratio of 75:25 mol%. By obtaining the synthesis method, well-crystallized LaCO3OH crystals could be easily obtained as revealed from the XRD pattern. These outcomes also suggested that Ca2+ ions partially substituted La3+ host lattice sites, confirming the results reported by Lee et al. [37]. The absence of CaO in the phase-pure LaCO3OH may be due to high CaO dispersion and restriction the growth of Cao crystal. Those samples were Au-coated and then analyzed under field emission scanning electron microscopy (FESEM). Figure 2a displays the LC-1 FESEM images.
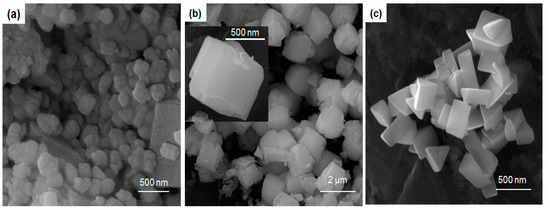
Figure 2.
Field emission scanning electron microscopy (FESEM) representations of the samples (a) LC-1, (b) LC-2, and (c) LC-3. The inset in (b) shows a high-magnification image of the sample LC-2.
The nanoparticles were slightly spherical in structure and appeared to be slightly melted and affix to one another. The nanoprisms were hexagonal-shaped hierarchical assembled by building blocks (see the inset in Figure 2b) and exhibits perfect smooth prism surface like morphology. Each particle resembled a hexagonal ice-piece. The LaCO3OH (sample LC-3) FESEM images revealed a geometric basket full of triangular prisms (Figure 2c). Zhang et al. described a mechanism underlying the synthesis of LaCO3OH under conditions that promoted a fast overall growth rate. This mechanism predicted anisotropic growth [16]. The addition of Ca2+ ions may enhance anisotropic growth. Triangular LaCO3OH nanoprisms with smooth surfaces and sharp corners were revealed by TEM imaging, as shown in Figure 3.
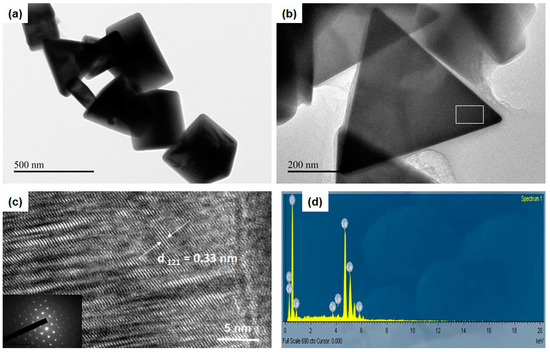
Figure 3.
(a) TEM image of the LC-3 sample, its (b) high-magnification TEM image, and (c) the corresponding high-resolution transmission electron microscopy (HRTEM) image and selected area electron diffraction (SAED) pattern (inset in Figure 3b) obtained from the head region of a triangle. (d) EDS spectrum of an LC-3 nanoprism.
The morphology was characterized as a three-sided triangular nanoprism. Some particles were polyhedral in morphology, with a triangular base and three faces joining the corresponding sides.
Figure 3c represents images of the LC-3 sample obtained from high-resolution transmission electron microscopy (HRTEM), which revealed lattice fringes of long-range. Further, Figure 3b represents the nanoprism pattern obtained from the selected area electron diffraction (SAED). The diffraction points corresponding to the (0000), (20), (20), (30 ), and (20) planes of the hexagonal LaCO3OH. As shown in Figure 3c, the d-spacing of hexagonal LaCO3OH suggested the (3030) and (0330) planes with a calculated interplanar spacing of 0.33 ± 0.004 nm. As was evident from the EDS spectrum, the substance was composed of La, C, and O (Figure 3d), indicating that the products contained no additional elements.
The mechanistic underlying the nanoprism growth of LaCO3OH was explored by collecting TGA and DSC measurements (Figure 4) from the three samples under an inert argon atmosphere.
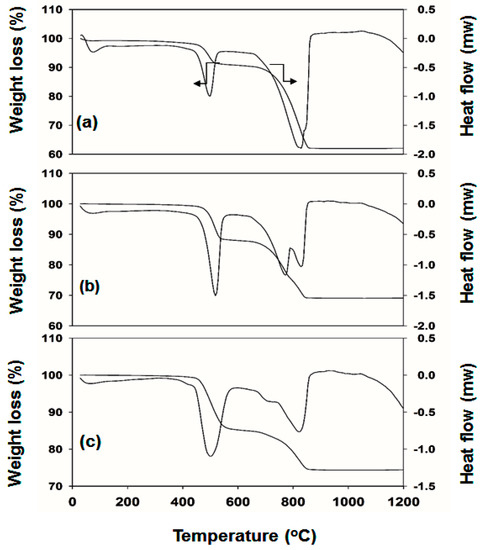
Figure 4.
TGA/DSC profiles obtained from the (a) LC-1, (b) LC-2, and (c) LC-3 as-synthesized products. TGA/DSC curves obtained at a heating rate of 10 °C min−1 in air.
Figure 4 depicts the representative TGA/DSC profiles of the samples LC-1, 2, and 3, collected after hydrothermal treatment at 200 °C for 24 h. Only the LC-1 sample displayed a slight weight loss immediately after the start of the experiment, possibly due to the removal of physically absorbed water. The TGA results indicated that the weight loss occurred in two steps during the thermolysis of the samples. Weight losses of 8%, 11%, and 15% were observed for the LC-1, LC-2, and LC-3 samples over the temperature range of 580–770 °C, accompanied by a well-defined endothermic peak at 504 °C. The first weight losses above 400 °C and 600 °C were attributed to the decomposition of LaCO3OH and the formation of La2O2CO3, CO2, and H2O. The second significant weight losses for the LC-1, LC-2, and LC-3 samples were 30%, 20%, and 12% in the temperature range 775–850 °C, as presented in Figure 4a–c. The associated endothermic peak revealed a shoulder at 850 °C for the LC-1 sample (Figure 4a). Two endothermic peaks were observed in the LC-2 sample (Figure 4b) at 780–810 °C. The LC-3 sample displayed a shoulder and a sharp endothermic peak at 775–820 °C for the second weight loss and an endothermic signature was attributed to the transformation of LaCO3OH to La2O2CO3. The weight loss processes were characterized by rates that followed the trend LC-3 < LC-2 < LC- 1. The weight-loss behavior revealed the formation of a rigid crystallite. The weight loss of LC-3 was quite low, particularly at the second step, compared to the corresponding values of LC-1 and LC-2, indicating that LC-3 was highly stable, even at high temperatures. The TGA–DSC curves of the LaCO3OH sample (Figure 4) revealed that LC-2 and LC-3 were thermostable below 450 °C. Vilas et al. reported a three-step weight loss for the LaCO3OH superstructure [38]. The first weight loss was attributed to the loss of loosely absorbed water however, we did not observe this weight loss in our fabricated nanoprisms, particularly in the LC-3 sample.
The samples of as-synthesized FTIR spectra, i.e., (a) LC-1, (b) LC-2, and (c) LC-3 are presented in Figure 5.

Figure 5.
Samples of as-synthesized FTIR spectra (a) LC-1, (b) LC-2, and (c) LC-3.
Under the presence of structural H2O and OH groups on nanomaterials low absorption peaks of size 3476 and 3616 cm−1 were observed. The other intense peaks at 1495–1436 cm−1 were attributed to the carbonate v3 mode and the weak peaks at 1086–872, 843, and 776–705 cm−1 were assigned to the carbonate ion modes v1, v2, and v4 respectively [39]. At the 683 cm−1 peak, a weak feature was observed due to water molecules’ bending vibrations mode −δOH. Further, except for the 1000 cm−1 below the peak, other FTIR spectra peak were similar. The LC-3 (Figure 3c) spectrum certified the case that the nanoprisms were made out of La(CO3)OH. A similar IR pattern for a hexagonal LaCO3OH sample was reported by Zhang et al. [16]. Figure 5a represents an LC-1 sample having weak five peaks below 1000 cm−1. For the LC-1 sample, the very weak band was observed at 846 cm−1 with no absorption peak at 683 cm−1. Only the sample spectrum of LC-3 shows a weak band at 2360 cm−1, due to carbon dioxide deformation mode at characteristic bands. The XPS examinations characterized the oxidation states and composition surfaces. The XPS spectra of LC-3 samples were presented in Figure 6, represent impurity carbons species, O, Ca, and La at the surface of LC-3 with no other elements deposition.
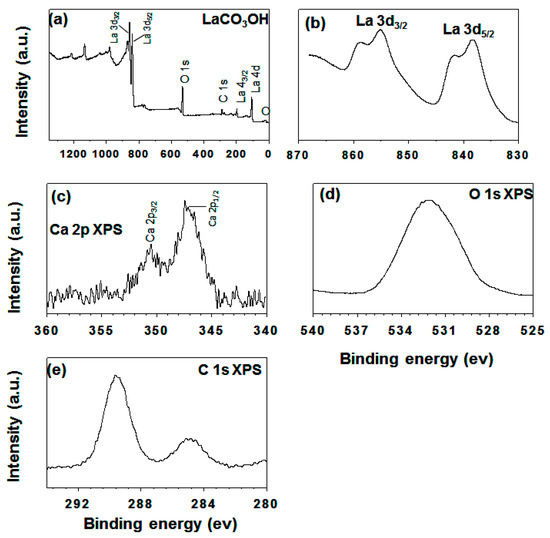
Figure 6.
Typical as-synthesized LC-3 XPS spectra: (a) survey spectrum, (b) region La 3d; (c) region Ca 2p, (d) region O 1s, and (e) region C 1.
These outcomes match well with the EDS results. As presented in Figure 6b the main peak occurred at 838.8 and 855.3 eV, which corresponds to the 3d0, 4f1 configuration of La 3d5/2 and La 3d3/2 with shake-up peaks (the 3d04f1 configuration). These peaks presented the oxidation state of La(III). For the sample of LC-3, two broad peaks were seen at 351 and 347 eV in the region of Ca 2p, showing the presence of Ca in the compound of LaCO3OH. This investigation, hence, uncovered another synthetic method dependent on modulating La and Ca molar proportion for the LaCO3OH nanoprism structure fabrication in its pure phase. In the previously prepared sample, O 1s XPS peak of broad nature corresponds to oxygen lattice was appeared at 531.5 eV [40]. As presented in Figure 6e, the C 1s spectrum having two peaks at 284.60 eV and 289.6 eV were designated to carbon and carbonate contamination, respectively. While at 289.60 eV, C 1s electron binding energy was given to the C–O peak. The percentage of atomic ratio calculated using the XPS experiment (Table 1) is very important. It plays crucial role in deciding the real catalytic reaction mechanism.

Table 1.
Atomic ratios in three samples using XPS study.
Figure 7 shows the pore structures of LC samples with molar ratios of: (a) 25:75, (b) 50:50, and (c) 75:25, which were obtained by determining their N2 adsorption–desorption isotherms. The pores range from large mesopores to macropores because there is a marked leap in the high P/P0 range (0.8–1.0) in the isotherms of all samples. The presence of slit-like pores is suggested by the type of isotherm, which is characteristic of adsorption on a layered solid. The surface areas were found to be 5.15, 2.45, and 3.75 m2/g for the samples in Figure 7a–c, respectively, which indicates that the surface area is high when the La content is low. The nanoparticles with a spherical structure have higher surface areas. The surface area plays a crucial role in catalytic process, as defined in the section below.
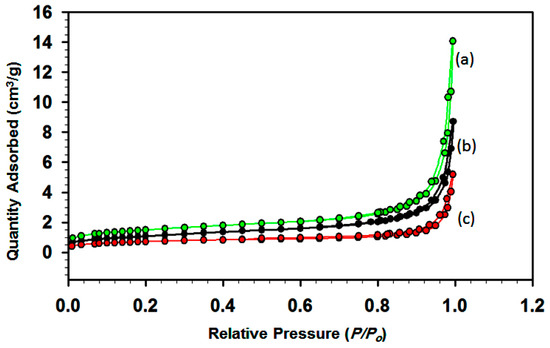
Figure 7.
N2 isothermic adsorption–desorption of as-synthesized samples: (a) LC-1, (b) LC-2, and (c) LC-3.
The La3+ has vacant 4f shell, but still responsible for rare-earth ions fluorescence due to the transitions of the interior electron. Therefore, for the LaCO3OH powder, no f–f transitions were attainable [41]. Thus, the present study provides a broad emission band obtained from the LaCO3OH nanoprisms La:Ca of 75:25 at 399. The morphology of LaCO3OH (LC-3) had a rectangular and triangular shape with a smooth surface. Upon 280 nm excitation, the sample LC-3 showed high PL intensity, corresponding to deep-level or self-trapped exciton (STE) luminescence [Figure 8] using the filter.
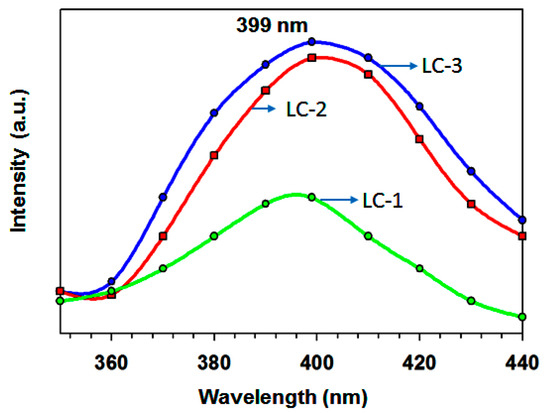
Figure 8.
Photoluminescence spectra (excited by λex = 280) of (a) LC-1, (b) LC-2 and (c) LC-3 samples at room temperature.
Moreover, samples with La:Ca of 50:50 exhibited comparable PL activity. Based on such analogous performance, it seems reasonable to infer that the activity is dictated by distinct shape, size, and better crystallinity rather than the amount of lanthanum. As shown in Figure 2, the morphology of three samples was different from each other. The sample with La:Ca of 50:50 had a hexagonal-shaped hierarchical structure, and all the particle sizes were of an almost similar size. The PL intensities were reduced in the sequence of LC-1 < LC-2 < LC-3. The similar photoluminescence (PL) properties were observed by Zhang et al. [16] in microspheres of LaCO3OH by providing excitation at 438 nm. Several free electrons and holes were generated by Lattice irradiation while electron-hole pairs were directly formed from STEs. The STEs diffusion generates the luminescence spectrum through nonradiative recombination. Further work is needed to explore the PL mechanism in LaCO3OH nanoprisms. The sample with La:Ca of 25:75 had agglomerated particles, and the sizes were quite smaller. The development of methods for fabricating rare and novel LaCO3OH morphologies is necessary for achieving the size- and shape-dependent luminescence properties needed for practical applications.
NOx Reduction by CH4
The demand for methane as a de-NOx catalyst for high-temperature applications is increasing considerably due to easy availability and low cost. It is important to note that methane activations happen at a higher temperature. Thus, X-ray diffraction, FESEM image analysis, and NO reduction testing were performed over all as-synthesized samples after heat treatment (800 °C for 2 h). Figure 9a′–c′, displays the X-ray diffraction patterns of calcined (800 °C for 2 h) samples of LC-1, LC-2, and LC-3. The results obtained for LC-1, LC-2, and LC-3 were shown in Figure 9a′–c′ respectively, had peaks due to CaO and La2O3 for the three samples. For La(OH)3, three peaks were observed in sample in Figure 9 (LC-1-(a′)).
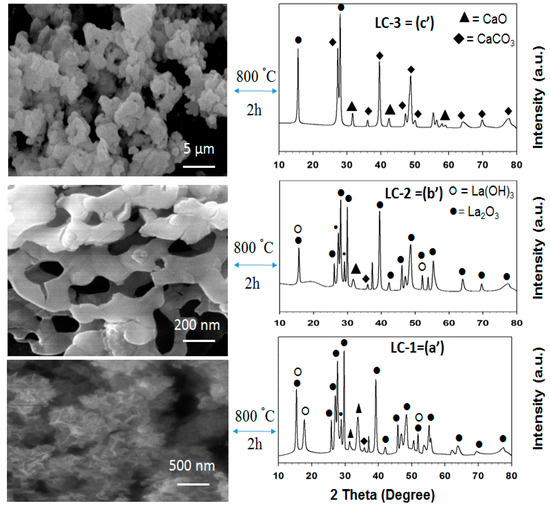
Figure 9.
FESEM images of calcined samples (800 °C for 2 h) LC-1 (denoted as a′), LC-2 (denoted as b′), and LC-3 (denoted as c′) and XRD patterns for the same samples.
Furthermore, elaborating Figure 9a′ suggested that only one peak of CaCO3 was visible and remaining peaks were of La2O3, La(OH)3, and CaO. It was also found from Figure 9a′,b′ that almost all the peaks follow same pattern. The detection of the La(OH)3 peak was observed after calcination for two hours, and at 800 °C, this was due to La2O3 hygroscopic nature. Xie et al. studied the effect of relative air humidity during the refrigeration process of LaCO3OH. They also observed the impact of humidity over the LaCO3OH sample, which was synthesized using the hydrothermal process using glycine and La2O3 as the starting material [42]. Costa et al. suggested that crystalline stages of CaO, La2O3, CaCO3, Ca(OH)2, and La2O2CO3 after heat treatment for two hours and at 800 °C [31]. It is important to note that as many research groups [31,32] suggested the most active phases for reduction of nitrogen oxide with methane were La2O3 and CaO. We did not obtain phase-pure La2O3 for the three samples after calcination. All of the peaks are due to a combination of La2O3, CaO, and CaCO3, phases as presented in Figure 9a′–c′. The FESEM images of the calcined samples display a very different kind of morphology compared to as-synthesized samples, as seen in Figure 9. The size of the particles was decreased and showed cotton type morphology (Figure 9a′). In the case of Figure 9c′, agglomerated particles were formed. The NO reduction of calcined (Figure 9a′–c′) powders with CH4 were presented in Figure 10. In Figure 10, calcined samples of LC-1, LC-2, and LC-3 represent the same meaning of Figure 9a′–c′.
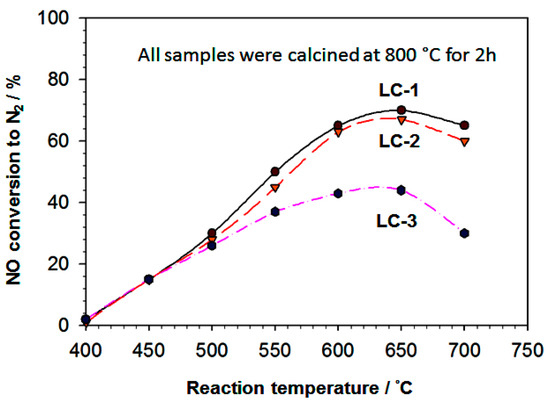
Figure 10.
The catalytic activities of LC-1 (referred to as a′), LC-2 (referred to as b′), and LC-3 (referred to as c′) calcined powdered samples with NO reduction as a function of temperature of the reaction. The reactions were performed with a feed containing 1000 ppm NO, 2000 ppm CH4, and diluted 5% O2 in He, and 0.18 g of the catalyst and a GHSV (gas hour space speed) of 20,000 h1.
NO reduction activity was started at 400 °C and increased gradually with maximum activity ranges between 600–660 °C. For LC-1 sample highest NO conversation activity was recorded, which was 70% in the 600–670 °C temperature range. Further increment in temperature, i.e., beyond 660 °C, caused decreases in NO conversion activity for all samples. The LC-1 sample showed the highest NO reduction activity probably due to its higher oxidation rate by oxygen other than these catalysts, which is a hydrocarbon-consuming side-reaction. The catalytic performances of LC-1 and LC-2 catalysts were found to be more superior as compared to LC-3, catalysts are most likely due to the presence of CaO containing the La2O3 phases in both catalysts. The high catalytic activity of the LC-1 sample was observed due to the high surface area, presence of La and Ca mixed active phases, presence of high La and Ca atomic ratio, and cotton-like morphology, which might help absorption and decomposition. Anastasiadou et al. reported that La2O3–Ca2+ mixed oxides system enhanced the NO reduction with CH4 compared to pure La2O3 and CaO alone in the presence of O2. Table 1 shows the presence of La2O3 and CaO in the LC-1 and LC-2 samples (as-synthesized samples) was quite high, which might play a crucial role in higher NO reduction.
Moreover, after calcination process for two hours and 800 °C, the LC-2 sample showed a highly porous structure. For the reduction of NO with methane, methyl radical production was significantly affected. Nonetheless the exact reaction mechanism of NO reduction with CH4 remains unknown in the presence of O2 over metal oxide [28]. The NO reduction activities were decreased for the LC-3 sample. The low activity of LC-3 calcined sample was attributed to the undefined structure of the agglomerated morphology (Figure 9), low surface area and very low Ca content and very high C content in the LC-3 sample (Table 1). Currently, our research area is focusing on solving this issue mentioned above.
The quantity of N2O in the sample depends upon the conversation rate of NO as well as the N2O decomposition to N2. It was previously [27] observed that Ca/La2O3 catalyst produces the negligible quantity of N2O, which was intermediate during NO with the CH4 reduction process. The N2O decomposition rate over the LC-1 catalyst was much larger than the NO reduction rate, causing a low N2O concentration in the reaction products. A minimal amount of N2O was produced in the reduction of NO with O2/He and CH4/O2/He in the presence of CaO alone, and NO2 was not detected [27]. The activities of the catalyst were reduced severely in presence of water vapor [43]. At 700 °C, the average catalytic activity of Co/ZSM-5’s is relatively lower than La2O3’s [27,44]. In the presence of 5% H2O vapor and O2 [31], CaO alone is stable. The sample of calcined LC-1 was checked for fifty hours under the presence of 2% water vapor and found that maximum durability was achieved at 500 °C. Further, it was found that by shutting off the supply of H2O vapor NO conversion can be improved and this effect can be completely reversible. The nitrogen oxide conversion reduces only by 8%, under hydrothermal conditions, within 50 h, drastic changes were not observed. The ability to withstand the presence of H2O vapor is attributed to its ability to replace the carbonaceous surface materials accumulated on the catalytically active sites [44,45,46]. The high catalytic activity, as described above, is most likely due to the presence of the mostly La2O3 phase and strongly scattered CaO or doped into La2O3 phases. These stages may assume an essential job in delivering a higher activity of the catalyst, particularly within the presence of H2O. Wang et al. likewise announced that the expansion of CaO, as well as La2O3, improved the stability altogether because of the suppression of carbon deposition [47]. CaO reacts with CO2 readily produces various types of surface carbonate products, as well as bulk CaCO3. The stable species of adsorbed carbonate was formed as the product of carbon dioxide reaction which lowers the nitrogen oxide reduction rate. The catalytic efficiency found in this study with high resistance to H2O is most likely due to the absence of phases of CaCO3 and Ca(OH)2, which are mainly species that produce carbon.
3. Materials and Methods
3.1. Chemicals
This research used La(NO3)·6H2O and Ca(NO3)3·4H2O for the preparation of LaCO3OH compound. T La salt and ethyl alcohol were purchased from Sigma-Aldrich Co. St. Louis, MO, USA. Conversely, the Ca salt was bought from Fluka (Buchs, Switzerland) and (NH4)2CO3 from Merck (Darmstadt, Germany).
3.2. Hydrothermal Method
During nanoprism synthesis, La:Ca = 25:75 (LC-1), La:Ca = 50:50 (LC-2), and La:Ca = 75:25 (LC-3), the raw materials used were appropriate amounts of La(NO3)·6H2O and Ca(NO3)3·4H2O. The starting salts were dissolved in deionized water. For the co-precipitation of metal ions a sufficient volume of (NH4)2CO3 solid powders has been applied. The solution’s pH was kept at 8.5, and the solutions were mixed briskly for 12 h. The solution was then transferred into an internal plastic container of 500 cm3 which was put in a steel vessel. The vessel’s mouth was closed, where the hydrothermal reaction proceeded at 200 °C for over 24 h. The resulting powders were three times washed with alcohol and deionized water and dried at 110 °C. Those powders are classified as “as-synthesized” samples here.
3.3. Analysis
This study conducted X-ray diffraction (XRD) analysis using a Bruker D8 Advance diffractometer device (Bruker AXS Analytical X-ray Systems GmbH, Berlin, Germany). The operating voltage and current of the diffractometer device are 40 kV and 40 mA, respectively, that uses Cu Kα radiation (λ = 1.5405 Å) and monochromator graphite. The samples were examined at a scanning velocity of 2 min−1 over the 2h 10–80° range. Using the KBr pellet technique, it collected Fourier transform infrared (FT-IR) spectra at a Bruker FT-IR spectrometer (Bruker AXS Analytical X-ray Systems GmbH, Berlin, Germany). Field emission scanning electron microscopy (FESEM: TESCAN LYRA3, Brno, Czech Republic) determined the sizes and the morphologies of the products. The images were collected at 10 kV acceleration voltage. The energy dispersive X-ray spectra (EDS) was captured using an Oxford Instruments X-mass detector fitted with a Lyra3 TESCAN FESEM, JEOL USA Inc. Peabody, MA, USA). To acquire the TEM images, a transmission electron microscope (JEOL Inc., JEM 2011, Peabody, MA, USA) with a 4k × 4k CCD camera (Ultra Scan 400SP, Gatan) working at 200 kV. To evaluate samples the specific surface area and pore diameter and volume, a NOVA-1200 device (JEOL USA Inc. Peabody, MA, USA) was used. A Tristar II 3020 system was employed to measure the BET surface area.
The powders were evacuated for three hours at 200 °C, whereas the catalysts N2 adsorption isotherms were acquired in liquid N2 (−196 °C). Barrett–Joyner–Halenda (BJH) formula was used to get the pore size distribution. About 10 mg samples were used to perform TGA, using a Shimadzu thermal analyzer, Tokyo, Japan (TA-50). This research maintained a heating rate of 10 °C/min from room temperature to 600 °C under dry nitrogen. A spectrofluorometer (FluorologFL3-iHR, HORIBA Jobin Yvon, France) was used to conduct measurements of photoluminescence (PL). The X-ray photoelectron spectroscopy (XPS) (ESCALAB-250, Thermo-VG Scientific, Waltham, Peabody MA, USA), with Al-Kα radiation (1486.6 eV) was used to investigate the chemical compositions of the samples. Ambient temperature and 5 × 10⁻¹⁰ mbar pressure were maintained when taking XPS spectra in a specimen chamber.
3.4. Measuring Catalytic Activity
A Pyrex glass tubular reactor that has a 12 mm internal diameter was used for catalytic output experiments. The samples were retained in the reactor among glass wool plugs. The gas flow rate was controlled by a mass flow controller, and the total flow rate was determined by an electronic 4-channel constant value. A PC temperature controller increased the temperature of the furnace at a linear heating rate of 10 Kmin−1 (approximately). The complete system was activated before the performance tests, where the temperature was raised from 200 to 800 °C under real feed conditions. During the cooling process from 700 to 200 °C in a step of 60 °C, the system was stabilized for 40 min at each selected temperature level, and data were recorded. Ten percent of H2O vapor was inserted with a micro-pump into the gas mixture during the H2O vapor test. The catalytic activity was measured in a flow gas containing 1000–2000 ppm NO, 5% O2, and 2%–10% diluted H2O in He; catalyst weight 0.18 g; GHSV (gas hour space speed): 2000 h−1.
Gas chromatography and a molecular sieve were used at intervals of 20 min for the study of the effluent gas. An experiment was performed using an empty catalyst testing station to flow the original feed to verify that no NOx reduction occurred in the absence of a catalyst. This study determined the NO and hydrocarbon conversion based on hydrocarbons intake in order to obtain the NO reduction percentage. The conversion of NO and the conversion of hydrocarbons to COx (CO + CO2) was calculated using the following expressions. N2O production had been negligible. The percentage error should be less than 2% in the measurement results.
The 3rd bracket denotes the feed concentration whereas [NO]in and [CH4]in are the initial concentrations of NO and CH4, respectively. The final concentrations (after testing) of N2 and CO2 are denoted by [N2] and [CO2], respectively.
4. Conclusions
Without the assistance of organic additives or templates, a novel LaCO3OH nanoprism synthesis route was developed. The large-scale production of phase-pure hexagonal LaCO3OH nanoprisms was achieved using a hydrothermal method. The nanoprisms were distinctive and homogeneous, with smooth surfaces and sharp corners. No irregular nanoparticles were observed in the integrated nanoprism microstructure. This new synthesis route represents a novel and general approach to the synthesis of rare-earth compounds with a variety of morphologies and properties. The advantages of favoring the scaling-up of nanoprisms are the simplicity of the hydrothermal process, its cheapness, and the availability of raw materials. Such materials could be useful in the field of color displays and could provide new opportunities for morphology-dependent luminescence properties systematic evaluation. LaCO3OH showed an excellent photoluminescence property at room temperature. Diverse morphologies and emitting colors may potentially be fabricated using a rare-earth activator ion mixed with Ca2+ nanomaterials. Moreover, for the reduction of NO by methane, high catalytic activity was shown by Cao containing La2O3 catalysts. This catalyst also shows higher stability in the presence of higher space velocity. The as-synthesized nanoprisms were characterized by powder X-ray diffraction, FT-IR spectroscopy, TEM, FESEM, energy-dispersive X-ray analysis, and X-ray photoelectron spectroscopy.
Author Contributions
M.H.Z. conceived the idea and wrote the manuscript. M.M.R. (Mohammad Mizanur Rahman) and K.O.M. performed the sample preparation, characterization and measurement of PCMs. M.M.R. (Mohammad Mominur Rahman) discussed and analyzed the results. M.S., M.H.Z., and M.M.R. (Mohammad Mominur Rahman) revised the manuscript. F.K and A.A. checked English, K.O.M. and M.A.R did some experimental work. M.H.Z. supervised the whole research work. All authors have read and agreed to the published version of the manuscript.
Funding
This research was funded by [the Deanship of Scientific Research (DSR) at King Fahd University of Petroleum & Minerals (KFUPM)] grant number [IN-171036].
Acknowledgments
The author would like to acknowledge the support provided by the Deanship of Scientific Research (DSR) at King Fahd University of Petroleum & Minerals (KFUPM) by funding this work through the project Number: IN-171036. The author also would like to acknowledge the support provided by the King Abdullah City for Atomic and Renewable Energy (K.A.CARE).
Conflicts of Interest
The authors declare no conflict of interest.
References
- Lyuba, I.; Giuseppe, P.; Ivan, I.; Radka, N.K.; Anna, M.V.; Donka, A. NO reduction by CO over gold based on ceria, doped by rare earth metals. Catal. Today 2008, 139, 168–173. [Google Scholar]
- Mai, H.X.; Zhang, Y.W.; Si, R.; Yan, Z.G.; Sun, L.D.; You, L.P.; Yan, C.H. High-quality sodium rare-earth fluoride nanocrystals: Controlled synthesis and optical properties. J. Am. Chem. Soc. 2006, 128, 6426–6436. [Google Scholar] [CrossRef]
- Wang, X.; Zhuang, J.; Peng, Q.; Li, Y.D. Liquid–solid–solution synthesis of biomedical hydroxyapatite nanorods. Inorg. Chem. 2006, 45, 2031–2034. [Google Scholar] [CrossRef]
- Lu, H.; Yi, G.; Zhao, S.; Chen, D.; Guo, L.H.; Cheng, J. Synthesis and characterization of multi-functional nanoparticles possessing magnetic, up-conversion fluorescence and bio-affinity properties. J. Mater. Chem. 2004, 14, 1336–1341. [Google Scholar] [CrossRef]
- Yi, G.S.; Lu, H.C.; Zhao, S.Y.; Ge, Y.; Yang, W.J.; Chen, D.P.; Guo, L.H. Synthesis, characterization and biological application of size-controlled nanocrystalline NaYF4:Yb, Er infrared-to-visible up-conversion phosphors. Nano Lett. 2004, 4, 2191. [Google Scholar] [CrossRef]
- Grabmaier, B.C. Luminescent Materials; Chapters 4 and 5; Springer: Berlin, Germany, 1994. [Google Scholar]
- Hou, Z.; Yang, P.; Li, C.; Wang, L.; Lian, H.; Quan, Z.; Lin, J. Preparation and luminescence properties of YVO4: Ln and Y(V, P)O4:Ln (Ln = Eu3+, Sm3+, Dy3+) nanofibers and microbelts by sol−gel/electrospinning process. Chem. Mater. 2008, 20, 6686–6696. [Google Scholar] [CrossRef]
- Liu, J.; Lian, H.; Shi, C. Improved optical photoluminescence by charge compensation in the phosphor system CaMoO4: Eu3+. Opt. Mater. 2007, 29, 1591–1594. [Google Scholar] [CrossRef]
- Niu, H.; Min, Q.; Tao, Z.; Song, J.; Mao, C.; Zhang, S.; Chen, Q. One-pot facile synthesis and optical properties of porous La2O2CO3 hollow microspheres. J. Alloys Compd. 2011, 509, 744–747. [Google Scholar] [CrossRef]
- Zhang, Y.W.; Sun, X.; Si, R.; You, L.P.; Yan, C.H. Single-crystalline and monodisperse LaF3 triangular nanoplates from a single-source precursor. J. Am. Chem. Soc. 2005, 127, 3260–3261. [Google Scholar] [CrossRef]
- Yang, X.; Zhai, Z.; Xu, L.; Li, M.; Zhang, Y.; Hou, W. LaCO3OH microstructures with tunable morphologies: EDTA-assisted hydrothermal synthesis, formation mechanism and adsorption properties. RSC Adv. 2013, 3, 3907–3916. [Google Scholar] [CrossRef]
- Nagashima, K.; Wakita, H.; Mochizuki, A. The synthesis of crystalline rare earth carbonates. Bull. Chem. Soc. Jpn. 1973, 46, 152–156. [Google Scholar] [CrossRef]
- Xie, J.; Wu, Q.; Zhang, D.; Ding, Y. Biomolecular-induced synthesis of self-assembled hierarchical La(OH)CO3 one-dimensional nanostructures and its morphology-held conversion toward La2O3 and La(OH)3. Cryst. Growth Des. 2009, 9, 3889–3897. [Google Scholar] [CrossRef]
- Zhong, S.L.; Zhang, L.F.; Jiang, J.W.; Lv, Y.H.; Xu, R.; Xu, A.W.; Wang, S.P. Gelatin-mediated hydrothermal synthesis of apple-like LaCO3OH hierarchical nanostructures and tunable white-light emission. Cryst. Eng. Commun. 2011, 13, 4151–4160. [Google Scholar] [CrossRef]
- Li, Z.; Zhang, J.; Du, J.; Gao, H.; Gao, Y.; Mu, T.; Han, B. Synthesis of LaCO3OH nanowires via a solvothermal process in the mixture of water and room-temperature ionic liquid. Mater. Lett. 2005, 59, 963–965. [Google Scholar] [CrossRef]
- Zahir, M.H. Method for Making LaCO3OH Nanoparticles from Aqueous Salt Solutions. U.S. Patent 10,512,900, 24 December 2019. [Google Scholar]
- Wang, F.; Li, Y.; Liang, S.; Min, J.; Chen, Z.; Cai, Y.; Fu, X.; Jiang, X. Preparation and photoluminescence properties of uniform LaCO3OH triangular nanoplates. Mater. Lett. 2015, 148, 114–117. [Google Scholar] [CrossRef]
- Li, G.; Peng, C.; Zhang, C.; Xu, Z.; Shang, M.; Yang, D.; Kang, X.; Wang, W.; Li, C.; Cheng, Z.; et al. Eu3+/Tb3+-Doped La2O2CO3/La2O3 nano/microcrystals with multiform morphologies: Facile synthesis, growth mechanism, and luminescence properties. Inorg. Chem. 2010, 49, 10522–10535. [Google Scholar] [CrossRef]
- Pan, B.; Xie, Q.; Wang, H.; Zhu, J.; Zhang, Y.; Su, W.; Wang, X. Synthesis and photocatalytic hydrogen production of a novel photocatalyst LaCO3OH. J. Mater. Chem. A 2013, 1, 6629–6634. [Google Scholar] [CrossRef]
- Cui, M.Y.; He, J.X.; Lu, N.P.; Zheng, Y.Y.; Dong, W.J.; Tang, W.H.; Chen, B.Y.; Li, C.R. Morphology and size control of cerium carbonate hydroxide and ceria micro/nanostructures by hydrothermal technology. Mater. Chem. Phys. 2010, 121, 314–319. [Google Scholar] [CrossRef]
- Byrappa, K.; Adschiri, T. Hydrothermal technology for nanotechnology. Prog. Cryst. Growth Charact. Mater. 2007, 53, 117–166. [Google Scholar] [CrossRef]
- Zahir, M.H. Low Temperature Hydrothermal Method for the Preparation of LaCO3OH Nanoparticles. U.S. Patent 10,322,409, 18 June 2019. [Google Scholar]
- Jong, B.L.; Jiho, S.; Nak, H.A.; Iljeong, H.S.; Bong, H. Selective catalytic reduction of NO with CH4 over cobalt-exchanged cage-based, small-pore zeolites with different framework structures. Appl. Catal. B Environ. 2020, 267, 118710. [Google Scholar]
- Zhijun, S.; Jun, X.; Sheng, S.; Mengxia, Q.; Jun, X. Formation and reduction of NO from the oxidation of NH3/CH4 with high concentration of H2O. Fuel 2019, 2471, 19–25. [Google Scholar]
- Hongyan, Z.; Lin, L.; Ning, L.; Aiqin, W.; Tao, Z. In situ FT-IR investigation on the selective catalytic reduction of NO with CH4 over Pd/sulfated alumina catalyst. Appl. Catal. B Environ. 2011, 1102, 171–177. [Google Scholar]
- Zhiming, L.; Jiming, H.; Lixin, F.; Junhua, L.; Xiangyu, C. Advances in catalytic removal of NOx under lean-burn conditions. Chin. Sci. Bull. 2004, 49, 2231–2241. [Google Scholar]
- Vannice, M.A.; Walters, A.B.; Zhang, X. The kinetics of NOx decomposition and NO reduction by CH4 over La2O3 and Sr/La2O3. J. Catal. 1996, 159, 119–126. [Google Scholar] [CrossRef]
- Davies, J.W.; Green, N.J.B.; Pilling, M.J.J. Association reaction of CH3 and NO: Evidence for the involvement of the triplet surface. Chem. Soc. Faraday Trans. 1991, 87, 2317–2324. [Google Scholar] [CrossRef]
- Fokema, M.D.; Ying, J.Y. The selective catalytic reduction of nitric oxide with methane over scandium oxide, yttrium oxide and lanthanum oxide. Appl. Catal. B Environ. 1998, 18, 71–77. [Google Scholar] [CrossRef]
- Fliatoura, K.D.; Verykios, X.E.; Costa, C.N.; Efstathiou, A.M. Selective catalytic reduction of nitric oxide by methane in the presence of oxygen over CaO catalyst. J. Catal. 1999, 183, 323–335. [Google Scholar] [CrossRef]
- Costa, C.N.; Anastasiadou, T.; Efstathiou, A.M. The selective catalytic reduction of nitric oxide with methane over La2O3-CaO Systems: Synergistic effects and surface reactivity studies of NO, CH4, O2, and CO2 by transient techniques. J. Catal. 2000, 194, 250–265. [Google Scholar] [CrossRef]
- Anastasiadou, T.; Loukatzikou, L.A.; Costa, C.N.; Efstathiou, A.M. Understanding the synergistic catalytic effect between La2O3 and CaO for the CH4 Lean, De-NOx reaction: Kinetic and mechanistic studies. J. Phys. Chem. B 2005, 109, 13693–13703. [Google Scholar] [CrossRef]
- Zahir, M.H.; Suzuki, T.; Fujishiro, Y.; Awano, M. Hydrothermal synthesis of Sr–Ce–Sn–Mn–O mixed oxidic/stannate pyrochlore and its catalytic performance for NO reduction. Mater. Chem. Phys. 2009, 116, 273–278. [Google Scholar] [CrossRef]
- Zahir, M.H.; Suzuki, T.; Fujishiro, Y.; Awano, M. Synthesis and Characterization of Sm3+ doped Y(OH)3 and Y2O3 nanowires by a hydrothermal process and its catalytic activity. J. Alloys Compd. 2009, 476, 335–340. [Google Scholar] [CrossRef]
- Aguilar, R.G.; Valenzuela, M.; Salas, P.; Armendariz, H.; Bosch, P.; Toro, G.D. Hydrogen interactions and catalytic properties of platinum-tin supported on zinc aluminate. Appl. Catal. A 1995, 127, 65–75. [Google Scholar] [CrossRef]
- Dawson, W.J. Hydrothermal synthesis of advanced ceramic powders. Am. Ceram. Soc. Bull. 1988, 67, 1673–1678. [Google Scholar]
- Lee, H.V.; Juan, J.C.; Taufiq-Yap, Y.H. Preparation and application of binary acid-base CaO–La2O3 catalyst for biodiesel production. Renew. Energy 2015, 74, 124–132. [Google Scholar] [CrossRef]
- Pol, V.G.; Thiyagarajan, P.; Calderon Moreno, M.P. Solvent-free fabrication of rare LaCO3OH luminescent superstructures. Inorg. Chem. 2009, 48, 6417–6424. [Google Scholar] [CrossRef] [PubMed]
- Wang, M.; Huang, Q.L.; Hong, J.M.; Chen, X.T.; Xue, Z.L. Selective synthesis and characterization of nanocrystalline EuF3 with orthorhombic and hexagonal structures. Cryst. Growth Des. 2006, 6, 1972–1974. [Google Scholar] [CrossRef]
- Li, Z.J.; Shen, X.Q.; Feng, X.; Wang, P.Y.; Wu, Z.S. Non-isothermal kinetics studies on the thermal decomposition of zinc hydroxide carbonate. Thermochim. Acta 2005, 438, 102–106. [Google Scholar] [CrossRef]
- Li, J.Y. Luminescent Materials of Rare Earths and Their Applications; Chemical Industry: Beijing, China, 2003; p. 8. [Google Scholar]
- Xia, T.; Li, Q.; Liu, X.; Meng, J.; Cao, X. Morphology-controllable synthesis and characterization of single-crystal molybdenum trioxide. J. Phys. Chem. B 2006, 110, 2006–2012. [Google Scholar] [CrossRef]
- Hongyan, Z.; Ning, L.; Lin, L.; Aiqin, W.; Xiaodong, W.; Tao, Z. Selective catalytic reduction of NO with CH4 over In–Fe/sulfated zirconia catalysts. Catal. Lett. 2011, 141, 1491. [Google Scholar]
- Shi, C.; Walters, A.B.; Vannice, M.A. NO reduction by CH4 in the presence of O2 over La2O3 supported on Al2O3. Appl. Catal. B 1997, 14, 175–188. [Google Scholar] [CrossRef]
- Zahir, M.H. Influences of heat treatment and DeNOx performance of cordierite honeycombs washcoated with spinel catalysts. Mater. Chem. Phys. 2011, 130, 1038–1045. [Google Scholar] [CrossRef]
- Zahir, M.H.; Matsuda, K.; Katayama, S.; Awano, M. Hydrothermal synthesis of new compounds with the pyrochiore structure and its application to nitric oxide abatement. J. Ceram. Soc. Jpn. 2002, 110, 963–969. [Google Scholar] [CrossRef][Green Version]
- Wang, J.; Yu, H.; Zhen, M.; Shenghu, Z. Enhanced stability of CaO and/or La2O3 promoted Pd/Al2O3 egg-shell catalysts in partial oxidation of methane to syngas. Molecules 2013, 18, 8289–8297. [Google Scholar] [CrossRef]
© 2020 by the authors. Licensee MDPI, Basel, Switzerland. This article is an open access article distributed under the terms and conditions of the Creative Commons Attribution (CC BY) license (http://creativecommons.org/licenses/by/4.0/).