Next Article in Journal
Impregnation of CaO from Eggshell Waste with Magnetite as a Solid Catalyst (Fe3O4/CaO) for Transesterification of Palm Oil Off-Grade
Next Article in Special Issue
Nickel Phosphide Electrocatalysts for Hydrogen Evolution Reaction
Previous Article in Journal
The Natural Product Lepidiline A as an N-Heterocyclic Carbene Ligand Precursor in Complexes of the Type [Ir(cod)(NHC)PPh3)]X: Synthesis, Characterisation, and Application in Hydrogen Isotope Exchange Catalysis
Previous Article in Special Issue
Perovskites in the Energy Grid and CO2 Conversion: Current Context and Future Directions
 
 
Retraction published on 16 March 2022, see Catalysts 2022, 12(3), 336.
Article

Experimental Study of CO2 Conversion into Methanol by Synthesized Photocatalyst (ZnFe2O4/TiO2) Using Visible Light as an Energy Source

1
Engineer Distribution, Department of Health, Safety and Environment, Sui Northern Gas Pipelines Limited (SNGPL), Islamabad 46000, Pakistan
2
The Joint Graduate School of Energy and Environment, King Mongkut’s University of Technology Thonburi, KMUTT, Bangkok 10140, Thailand
3
Department of Engineering and Chemical Sciences, Karlstad University, 65188 Karlstad, Sweden
4
School of Chemical and Materials Engineering, National University of Sciences and Technology, Islamabad 44000, Pakistan
*
Author to whom correspondence should be addressed.
Catalysts 2020, 10(2), 163; https://doi.org/10.3390/catal10020163
Submission received: 12 December 2019 / Revised: 11 January 2020 / Accepted: 14 January 2020 / Published: 1 February 2020 / Retracted: 16 March 2022
(This article belongs to the Special Issue Catalysis for Energy Production)

Abstract

:
Ozone layer depletion is a serious threat due to the extensive release of greenhouse gases. The emission of carbon dioxide (CO2) from fossil fuel combustion is a major reason for global warming. Energy demands and climate change are coupled with each other. CO2is a major gas contributing to global warming; hence, the conversion of CO2 into useful products such as methanol, formic acid, formaldehyde, etc., under visible light is an attractive topic. Challenges associated with the current research include synthesizing a photocatalyst that is driven by visible light with a narrow band gap range between 2.5 and 3.0 eV, the separation of a mixed end product, and the two to three times faster recombination rate of an electron–hole pair compared with separation over yield. The purpose of the current research is to convert CO2 into useful fuel i.e., methanol; the current study focuses on the photocatalytic reduction of CO2into a useful product. This research is based on the profound analysis of published work, which allows the selection of appropriate methods and material for this research. In this study, zinc ferrite (ZnFe2O4) is synthesized via the modified sol–gel method and coupled with titanium dioxide (TiO2). Thereafter, the catalyst is characterized by Fourier transform infrared (FTIR), FE-SEM, UV–Vis, and XRD characterization techniques. UV–Vis illustrates that the synthesized catalyst has a low band gap and utilizes a major portion of visible light irradiation. The XRD pattern was confirmed by the formation of the desired catalyst. FE-SEM illustrated that the size of the catalyst ranges from 50 to 500 nm and BET analysis determined the surface area, which was 2.213 and 6.453 m2/g for ZnFe2O4 and ZnFe2O4/TiO2, respectively. The continuous gas flow photoreactor was used to study the activity of the synthesized catalyst, while titanium dioxide (TiO2) has been coupled with zinc ferrite (ZnFe2O4) under visible light in order to obtain the maximum yield of methanol as a single product and simultaneously avoid the conversion of CO2 into multiple products. The performance of ZnFe2O4/TiO2was mainly assessed through methanol yield with a variable amount of TiO2 over ZnFe2O4 (1:1, 1:2, 2:1, 1:3, and 3:1). The synthesized catalyst recycling ability has been tested up to five cycles. Finally, we concluded that the optimum conditions for maximum yield were found to be a calcination temperature of ZnFe2O4at 900 °C, and optimum yield was at a 1:1 w/w coupling ratio of ZnFe2O4/TiO2. It was observed that due to the enhancement in the electron–hole pair lifetime, the methanol yield at 141.22 μmol/gcat·h over ZnFe2O4/TiO2was found to be 7% higher than the earlier reported data.

1. Introduction

Depletion of the ozone layer is not only a serious threat due to the extensive release of greenhouse gases; the emission of CO2is also a major reason for global warming. Current global demand for energy is almost 17 TW (Terawatt) and is forecasted to be doubled in upcoming years [1]. The climate change committee i.e., the IGP (Intergovernmental Panel), recommends that emissions of CO2 must be reduced by up to half of the total 85% reduction target by 2050 [2]. Reports of the Kyoto Protocol revealed that the countries under the Kyoto Protocol produce 22.5% less CO2 compared to production back in 1990. The carbon capture and storage techniques (CCS) are highly uneconomical for medium and small plants, and that is a major drawback [3].
For the effective conversion of CO2 into useful products such as methane, methanol, formic acid, etc., many researchers/scientists suggested different techniques from electrochemical cell to thermal decomposition. Thus, electrochemical cells have a superior advantage over thermal decomposition due to sustainable energy utilization i.e., visible light/sunlight, etc.
There are several processes where CO2 can be converted into market useful products; CO2 can be captured by using following techniques: (a) before the combustion capturing of CO2, (b) in-process capturing by adjusting the oxygen–fuel ratio, and (c) after combustion capturing of CO2. Considering all of the said techniques, the most researched and discussed option is post combustion CO2 capturing and conversion. Many catalytic/photocatalytic materials have been utilized for the conversion of CO2into useful products i.e., TiO2/SB (SB/Antimony) used for the conversion of carbon dioxide into CH3OH, Ag Br/CNT (CNT, or carbon nanotubes) used for the conversion of carbon dioxide into CH3OH and C2H5OH, CdSe/Pt/TiO2 used for CH4, CH3OH, etc. Factors such as photo corrosion resistance, valance and conduction band positions, accessibility, cost, surface area, ease of availability, etc. are the most important factors in the selection of photocatalysts, in which our selected photocatalyst i.e.,ZnFe2O4/TiO2 is ahead of the other visible light-induced photocatalysts. The most viable catalyst is ZnFe2O4/TiO2 in terms of valance and conduction band position, resistance toward corrosion, cheap cost, and stability; all of these above-mentioned factors make this photocatalyst most suitable for conversion within a visible range and maximum yield of the specific product i.e., methanol.
Different products can be obtained through the reduction of CO2, as shown in Table 1. Despite the market demanding products from the CO2 reduction reactions, still much work needs to be done in this field.
The utilization of value-added products from CO2conversion such as methanol seems to be a most promising technique to reduce the effect of major greenhouse gases (CO2) on the atmosphere. The photocatalytic reduction of CO2 depends upon the hydrogen produced during water splitting, because water is the most common reductant used for this reaction. During the reduction reaction, more than one product obtained formaldehyde or formic acid. The photocatalytic splitting of water is a simple process because only two products are obtained by this reaction: hydrogen and oxygen. On the other hand, the photocatalytic reduction of CO2 is a complex reaction because more than one product is obtained during the reaction, and still, no full complete explanation for the product selectivity is available. Researchers found that during the reduction of CO2, the first product that was formed was formic acid, which converts into formaldehyde, and the formaldehyde finally converts into methanol. However, on the other hand, some studies indicated that product selectivity can be controlled by the position of the conduction band of the photocatalyst. Other products can also be produced during the reaction such as formaldehyde, hydrogen, ethanol, and CO, but they are not detected in this study.
The purpose of the current research is to convert CO2 into useful fuel i.e., methanol. For this objective to be achieved, we first synthesize the ZnFe2O4/TiO2 photocatalyst, and afterwards characterize a ZnFe2O4/TiO2heterojunction photocatalyst to check whether our desired specified catalyst has been synthesized or not. Then, we evaluate the activity of the prepared photocatalyst for CO2conversion into methanol under visible light (initially, a tungsten bulb is used, but we aim to get conversion through sunlight/renewable energy). Starting from the energy of +805 kJ/mol is required for the bond breakage of chemically stable CO2 due to its carbon–oxygen bonds. A carbon-free energy source such as solar light can be used for this purpose under the presence of a photocatalyst. The photocatalysis process continues only if there is suitable photon energy of light UV/visible light. Research works in the literature reported that the obtained yield and selectivity of the product was very low in CO2 photocatalysis under visible light [7]. The conversion of carbon into useful fuel required a sustainable amount of hydrogen i.e., some suitable source of hydrogen such as H2 and H2O, etc. The cheapest and most easily available source is water. During the photocatalysis of CO2with water, water splitting also competes with CO2 reduction reaction because water splitting is much simpler than CO2reduction. This is because the splitting of water into H2 and O2 is a two-electron process, but CO2conversion into methanol required six electrons and six protons [8]. Moreover, the position of the conduction band plays an important role for CO2 conversion into the desired product. Different types of photocatalysts were prepared and tested by various research groups in the last few decades for the conversion of CO2into methanol such as metal oxides, layered double hydroxides and metal ferrite [9,10]. ZnFe2O4 works under visible light due to its smaller band gap and transferred electrons to TiO2 because it is a p-type semiconductor and TiO2 is n-type based; based on the previous study, that the ZnFe2O4 coupled with TiO2 can be synthesized as an efficient visible light drove the photocatalyst for CO2 reduction. However, TiO2 is identified as one of the best photocatalysts due to its cost and stability [3]. The major problem in TiO2 is its large band gap of approximately 3.2 eV [11]. The large band gap of TiO2 makes it a UV–Vis-driven photocatalyst.
In order to obtain the high selectivity of a given product and the maximum yield of the desired product, water and CO2 used as raw feed, oxidation also has the same importance as CO2. Both components are stable, and their bond breakage is possible by using a carbon-free sustainable source of energy as a solar light in the presence of a photocatalyst. The maximum Faradaic efficiency of hydrocarbons was observed at −1.9 V with 40.3%; similarly, hydrogen formation could be depressed to 34.7%. During the reduction of CO2 with water, the most favorable reaction is water reduction instead of CO2 due to this huge difference in their reduction potential. This problem of water reduction instead of CO2 can be solved by the oxidation of water instead of reduction. For water oxidation, the photocatalyst must have a valence band edge that is more positive than water oxidation, which is +0.82 eV. The most common reaction that happened during the reduction of CO2 with water at 7pH is tabulated below in Table 2.
The most common problem associated with photocatalysis by these catalysts is the conversion of CO2 to more than one product [12]. Thus the reaction mechanism, the effect of the amount of catalyst loading, the influence of calcination temperature, and the effect of the recycled catalyst during photoactivity are investigated thoroughly.

2. Results

2.1. Characterization

The following characterization techniques have been used on order to confirm the exact formation of the desired photocatalyst, but these techniques have been limited to some extent, as our main focus is to study the experimental effects of the different parameters.

2.1.1. FTIR (Fourier Transform Infrared Spectroscopy)

A Shimadzu spectrometer in the range of 4000–450 cm−1used for recording the FTIR spectra. The catalyst was in powdered form, and the formation of ZnFe2O4 was confirmed by using FTIR data as a preliminary result. The FTIR spectra recorded using a spectrometer in the range of 4000–450 cm−1, which is comparable to previously reported results [13]. The catalyst was in powdered form, and the formation of ZnFe2O4 was confirmed i.e., the spectrum band at 592.5 cm−1 and 487.3 cm−1 represents Zn2+ and Fe3+ ions, as shown in Figure 1. Moreover, the FTIR spectrum of ZnFe2O4 - TiO2 exhibits peaks having main characteristics of TiO2 at 487.3 cm−1 and ZnFe2O4 at 592.5 cm−1. In the same way, the band at 1488.6 cm−1 points toward the sample containing a slight amount of water. The band at 1253.1 cm−1 is an indication of the presence of nitrates. The presence of water is mainly due to the modified method of synthesis; nitrates were present because the synthesis starts from the nitrates of metals. The last peaks at 2401.7 cm−1 and 3248.8 cm−1 indicate the presence of CO2 that was absorbed into the catalyst synthesized from the environment. Some peaks can be witnessed, which are major and show good agreement with those of ZnFe2O4–TiO2 nanocomposites, ensuring that the presence of functional groups on the surface of ZnFe2O4–TiO2 are due to octane residues, as evident in Figure 1.

2.1.2. UV–Vis Spectroscopy

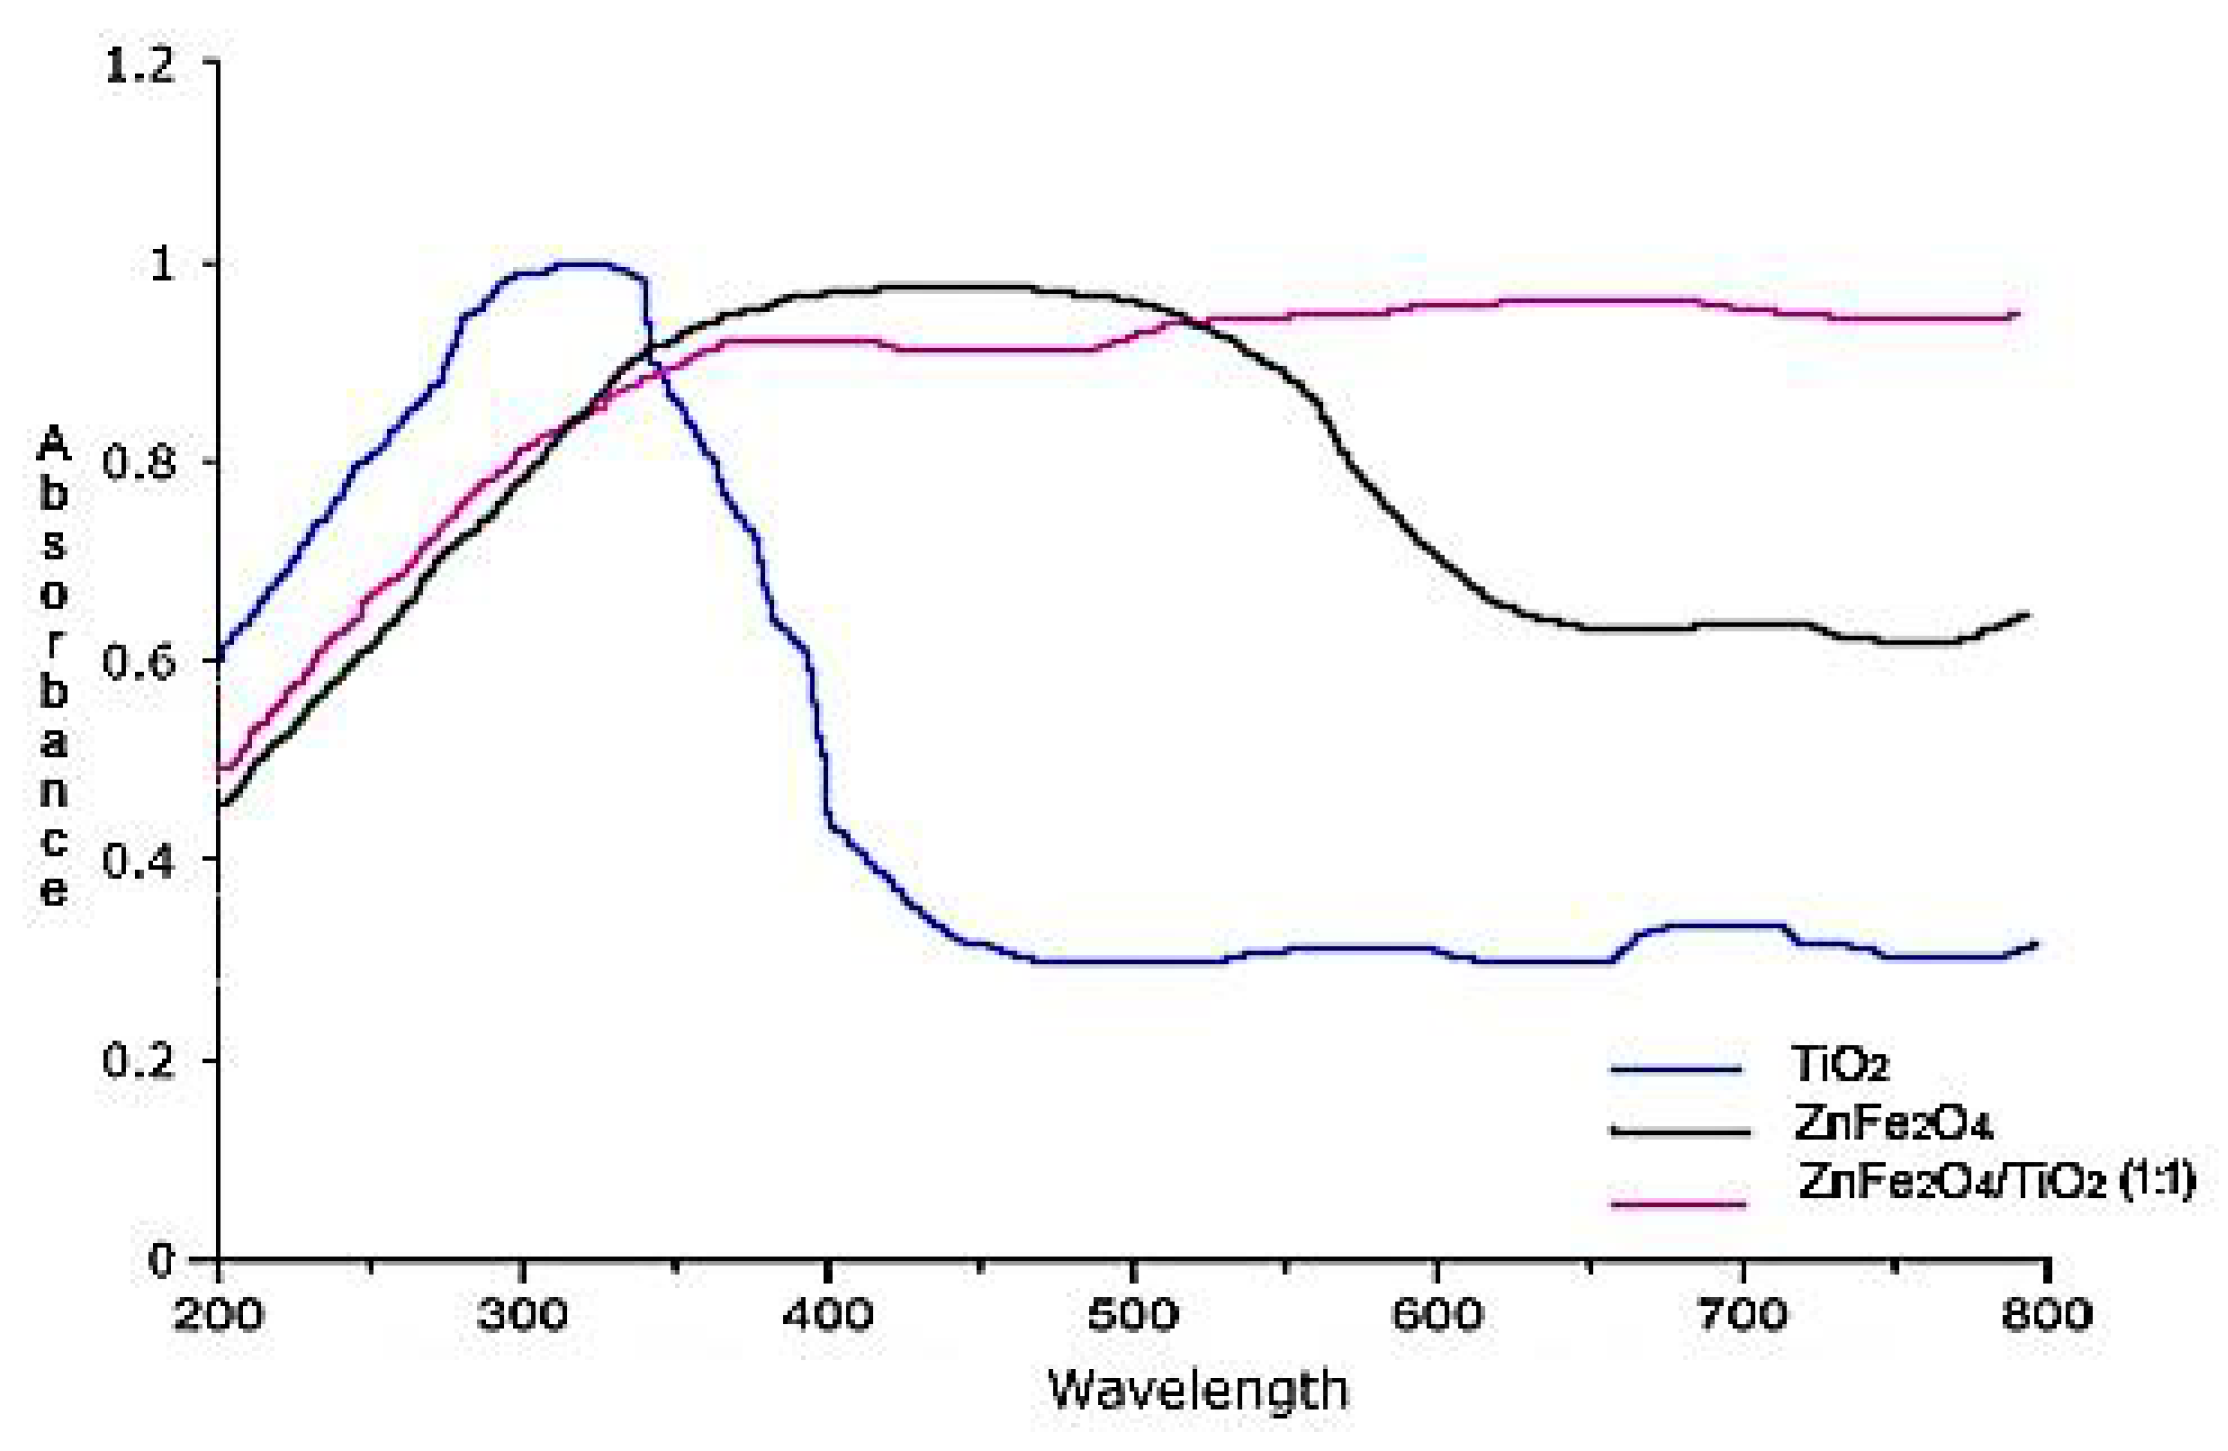
The UV–Vis spectroscopy of synthesized catalysts ZnFe2O4/TiO2, ZnFe2O4, and TiO2 was done at a wavelength range of 200–800 nm. This absorption spectrum of the catalyst revealed that the synthesized catalyst is the product of visible light active range of the catalyst. A wavelength of 200–800 nm has been used for studying the UV–Vis spectroscopy of the synthesized catalysts ZnFe2O4/TiO2(1:1), ZnFe2O4, and TiO2. The absorption spectrum of the synthesized catalyst revealed that it is a visible light active photocatalyst; the UV–Vis spectra of synthesized ZnFe2O4, TiO2, and ZnFe2O4 coupled with TiO2 in different w/w ratios in the wavelength range of 200–800 nm is shown in Figure 2. ZnFe2O4 shows a good absorbance pattern from 400–800 nm, which reveals that it is an excellent photocatalyst [14]. TiO2 illustrates absorbance only from 200 to 400 nm, which concludes that it is a UV active photocatalyst. When ZnFe2O4 is coupled with TiO2 in a 1:1 weight/weight ratio, it clarifies visible light region maximum absorbance from 400 to 800 nm. The absorbance pattern of the remaining two ratios is also illustrated in Figure 2. Moreover, another two ratios also display absorbance under visible light region, but the absorbance is comparatively lower than a 1:1 ratio. These three ratios show transparency above 516 nm, 442 nm, and 427 nm, which indicates that all three ratios have shifted the band gap of commercialized TiO2 from an ultraviolet region to visible light. The most suitable ratio that covers the majority of the visible light region is 1:1. The coupling of a low band gap ZnFe2O4 with TiO2 reduces the band gap, and the proper ratio of both semiconductors is 1:1. This ratio efficiently minimizes the band gap of coupled semiconductors and absorbs a maximum portion of visible light. TiO2 shows an absorbance pattern only under the UV region. After extrapolation, a line has been produced that shows the photon energy axis and produces the semiconductor band gap.
The band gaps of TiO2, ZnFe2O4, and ZnFe2O4coupled with TiO2 (1:1) are 3.15, 1.86, and 2.79 eV, respectively. ZnFe2O4 shows maximum absorbance at 624 nm and is well matched with previously reported results. The coupling of ZnFe2O4 with TiO2 in a proper ratio shifts the band gap of TiO2 from the UV region to the visible region and is used efficiently for the reduction of CO2 into methanol under visible light irradiation.

2.1.3. FE-SEM Analysis

The possible accumulation and morphologies due to the tiny crystallites contact of synthesized catalysts were determined by using FE-SEM (field emission electron scanning electron microscope). This technique also pointed out the particle size of the synthesized catalyst. The magnification was done from 10 to 150. The following results shows that the ZnFe2O4:TiO2 nanocomposites are regularly shaped nanoparticles. The ZnFe2O4 synthesized formed well-defined crystalline irregular spherical shapes with particle sizes in the range of 200–400 nm (Figure 3a,b). The anatase TiO2 is also observed to be more homogeneous with high crystallinity. The particle size of TiO2 nanoparticles is found to be in the range of 50–300 nm (Figure 3c,d). However, the ZnFe2O4/TiO2was attributed to the magnetic property of ZnFeI2O4 particles. It is observed that the ZnFe2O4/TiO2 heterojunction with a (1:1) ratio shows high homogeneity and porosity (Figure 3e,f). It is observed that a hydrothermally developed ZnFe2O4:TiO2 (1:1) heterojunction followed by annealing at 500 °C instigates higher homogeneity in the photocatalyst. The corresponding elements of the heterojunction such as Ti, O, Zn, and Fe show better homogeneity in the structure, while post annealing may promote the interfacial contact between ZnFe2O4 and TiO2 nanostructures (Figure 3). Moreover, an interface/boundary is witnessed between two nanoparticles, indicating the presence of a heterojunction between ZnFe2O4 and TiO2 which can further enable the charge transfer more freely to expressively reduce electron–hole pairs recombination in addition to enhancing the visible light-driven photocatalytic activity of ZnFe2O4:TiO2 nanocomposites. It illustrates the importance of the development of a heterojunction by hydrothermal modification followed by post-sintering treatment.

2.1.4. XRD Spectra

The synthesized catalyst is characterized by XRD for the identification of crystallinity. CuKα (1.542Å) radiation is used. The XRD scan range is 10–80°, the accelerating potential was 40 KVA, and the scan step size was 0.02°. The XRD pattern of ZnFeI2O4, TiO2, and ZnFe2O4/TiO2 (1:1 w/w ratio) is shown in Figure 4. The XRD pattern of TiO2 illustrates that it is available in anatase phase and all the peaks are well matched. ZnFeI2O4peaks prove that it is in the spinel phase. No peak shift or extra peak are observed after coupling, which means that no impurity is induced into it after the coupling of both semiconductors, and the pure catalyst retained its previous phase. The crystalline sizes of ZnFe2O4, TiO2, and ZnFe2O4:TiO2 (1:1) are 44.8, 65.2, and 46.9 nm.

2.2. Conversion of CO2 into Methanol Using Photocatalyst

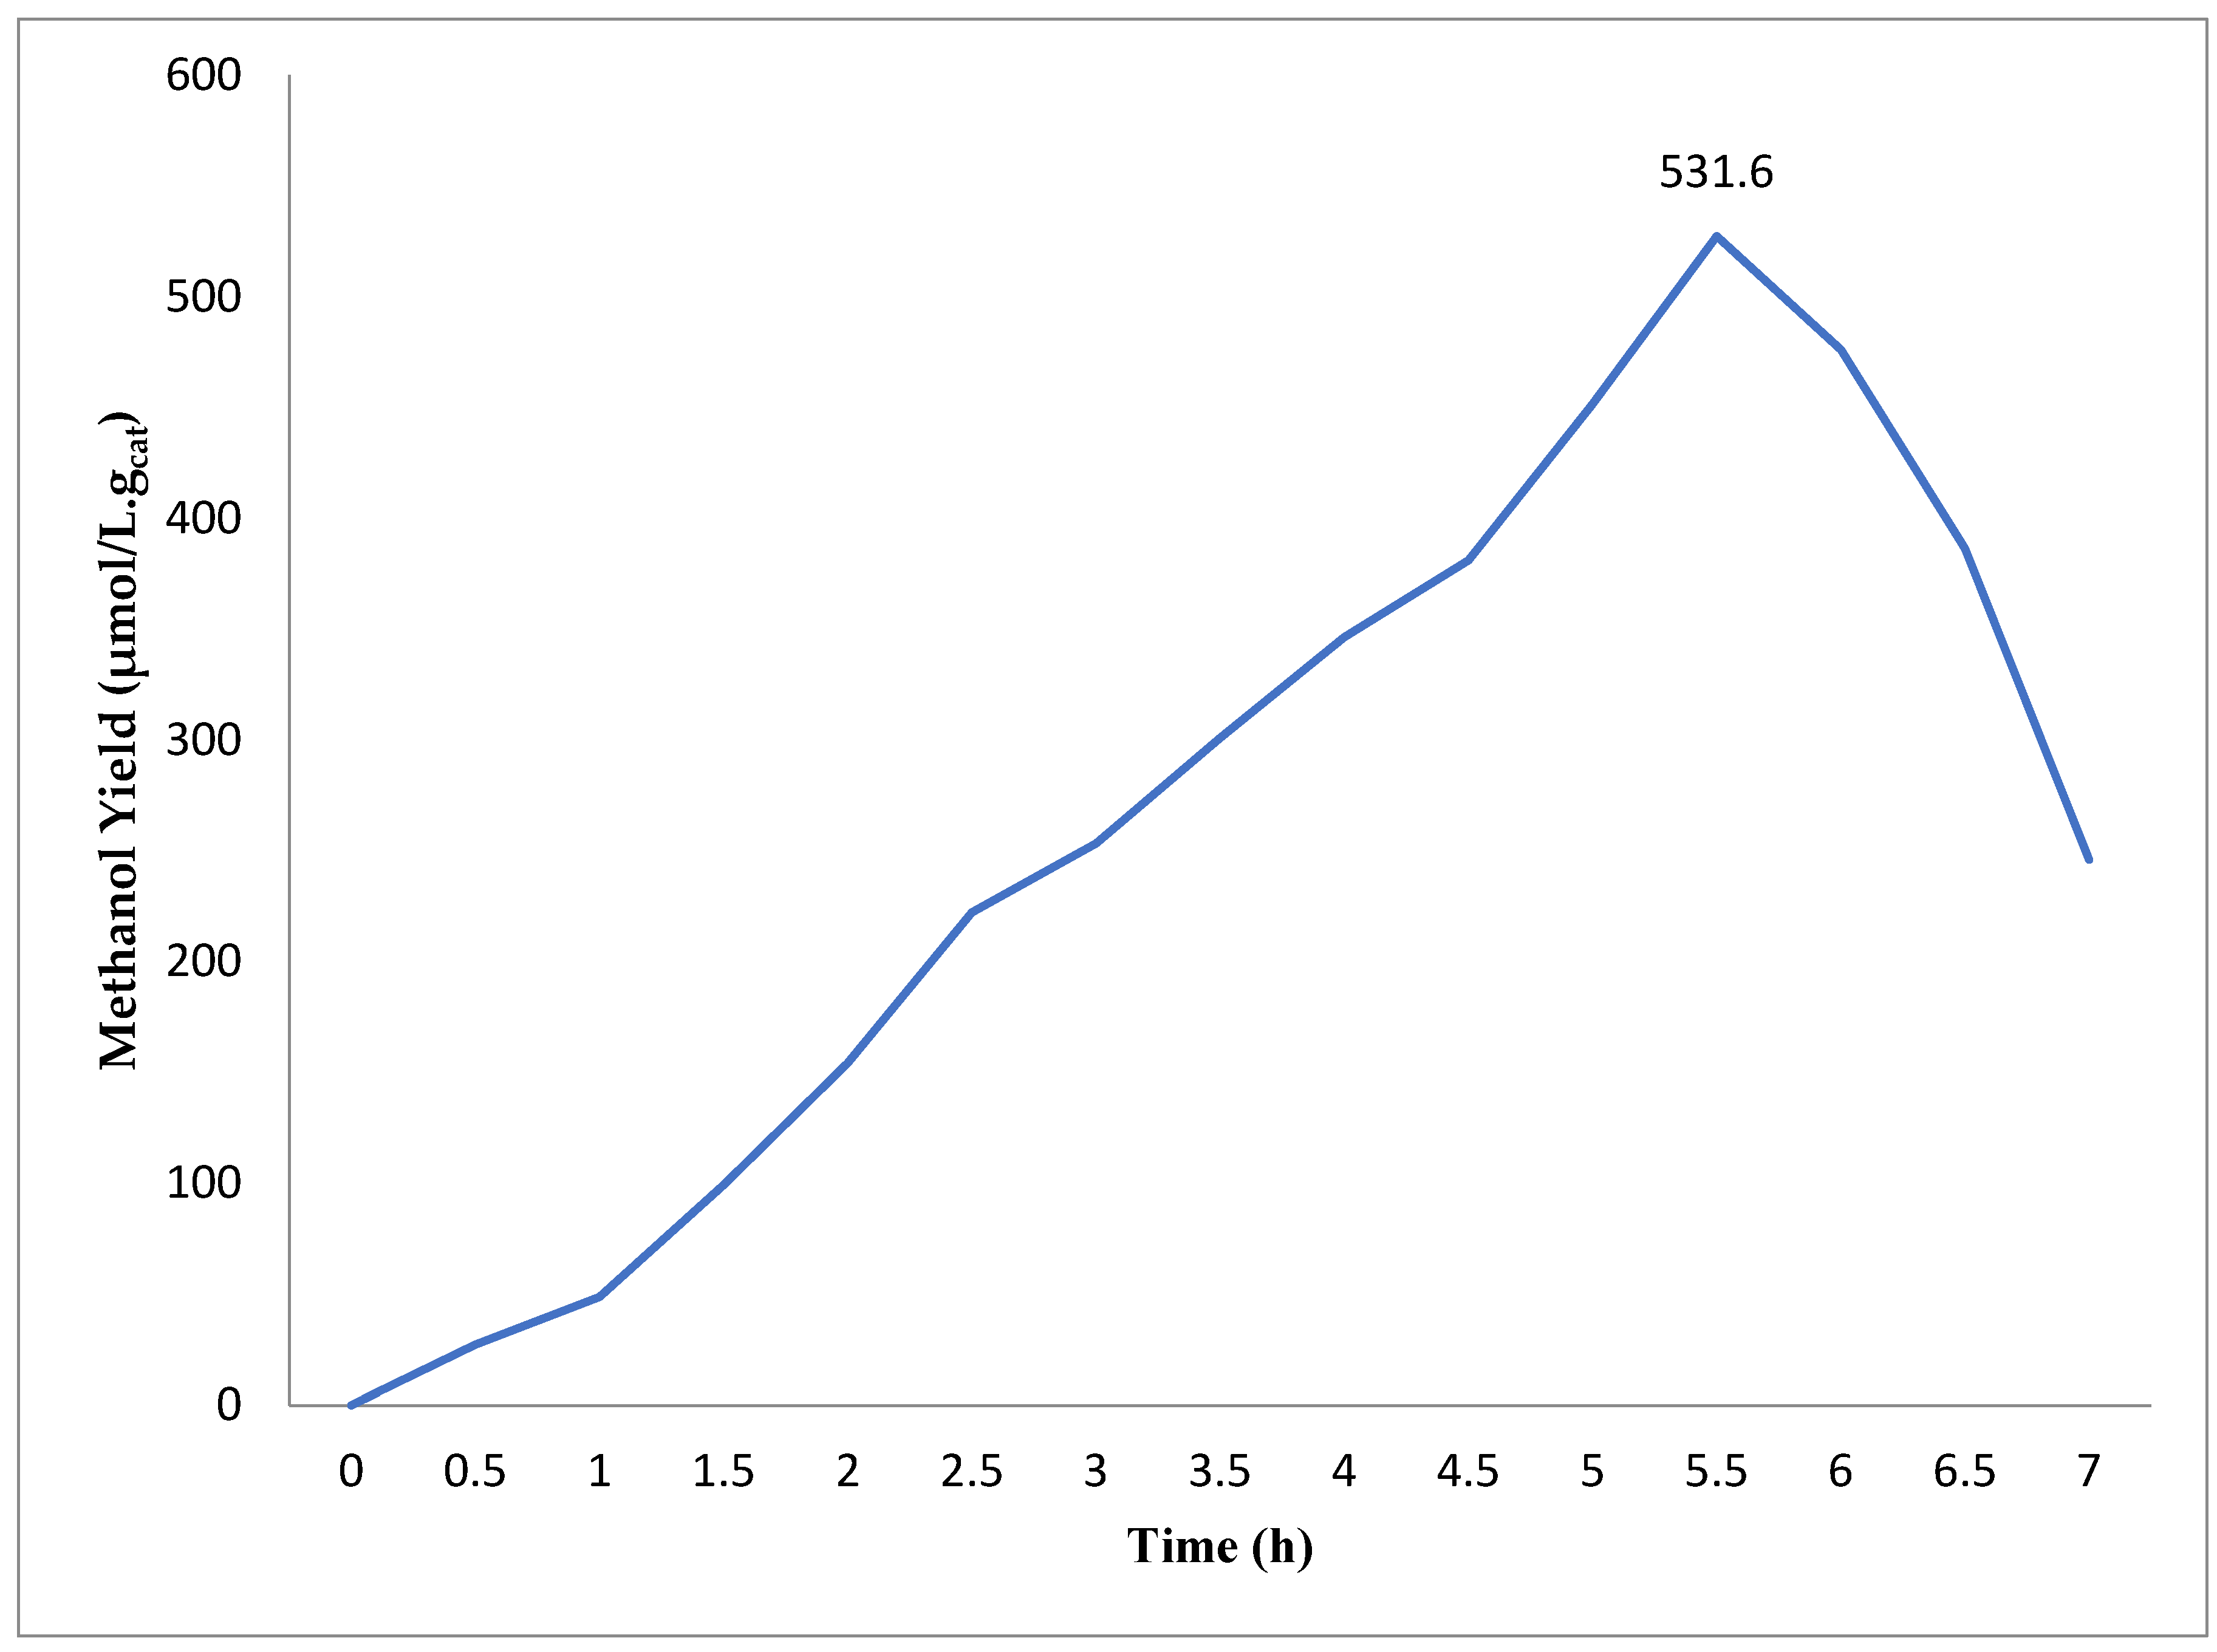
Approximately 7 h has been taken in order to study the photocatalytic conversion of CO2 into methanol by using ZnFe2O4/TiO2 photocatalysts. The ratio used here is the one that gives the maximum yield of methanol, i.e., ZnFe2O4/TiO2 (1:1 w/w); moreover, 7 h has been taken by considering previous research and literature [2,15]. The experimental results reveal that methanol is a major product in liquid, while the photoactivity of metal ferrite decreases, which is a clear indication of the exhaust of active sites due to photo corrosion. The other catalysts such as metal, non-metal, or S-S doped TiO2 or other than TiO2 also show the deactivation after 7 h. Hence, a 7 h irradiation time was chosen based on the previous work. In a current study, the catalyst has shown deactivation after 5.5 h. The highest yield is obtained after 5.5 h, which is 531.6 μmol/L·gcat, but after that, the yield of methanol decreases, which is due to the conversion of CO2 into other products or the occurrence of a backward reaction [16,17].
The Figure 5 indicates that the yield is increasing with a continuous passage of time, but after 5.5 h, the yield declines suddenly. Methanol oxidation occurred instead of water oxidation, which is one of the major reasons for yield diminution [17]. Similarly, as Figure 5 indicates, after of visible light irradiation, the photoactivity of metal ferrites reaches its high point, indicating that all the active sites are exhausted [18].

2.3. Effect of Different Coupling Ratios of ZnFe2O4 with TiO2

A different coupling ratio effect has been studied and finally plotted on the graph as shown in Figure 6, which reveals that ZnFe2O4/TiO2 in a 1:1 w/w ratio produces a higher yield. This has also been evident from the FTIR analysis when 1:1 coupling shows maximum absorbance, too. Other coupling ratios have also been tested i.e., ZnFe2O4 is coupled with TiO2 in a 1:2 ratio, while the yield of methanol is decreased upto 30% as compared to a 1:1 ratio. In the case of a 1:2 ratio, it can be suggested that the majority of the catalyst is TiO2, which can work only under UV light such that only a small portion ofZnFe2O4is sensitized to TiO2. This is the main reason behind the yield depression. Similarly, when ZnFe2O4 is coupled with TiO2 in a 2:1 ratio, then the yield is much less. Correspondingly, the yield for the ratios of 1:3 and 3:1 has also been so minimal that it has also vanished. We can say the optimum methanol yield in comparison with the 1:1 ratio is 702.11μmol/gcat, and the yield is decreased up to 30% by using a 1:2 ratio. Up to 70% less methanol is obtained when a 2:1 ratio is used. Moreover, the yield has drastically decreased i.e., by 86.9% and 87.3% for 1:3 and 3:1, respectively.

2.4. Variable Calcination Temperature of ZnFe2O4 Effects

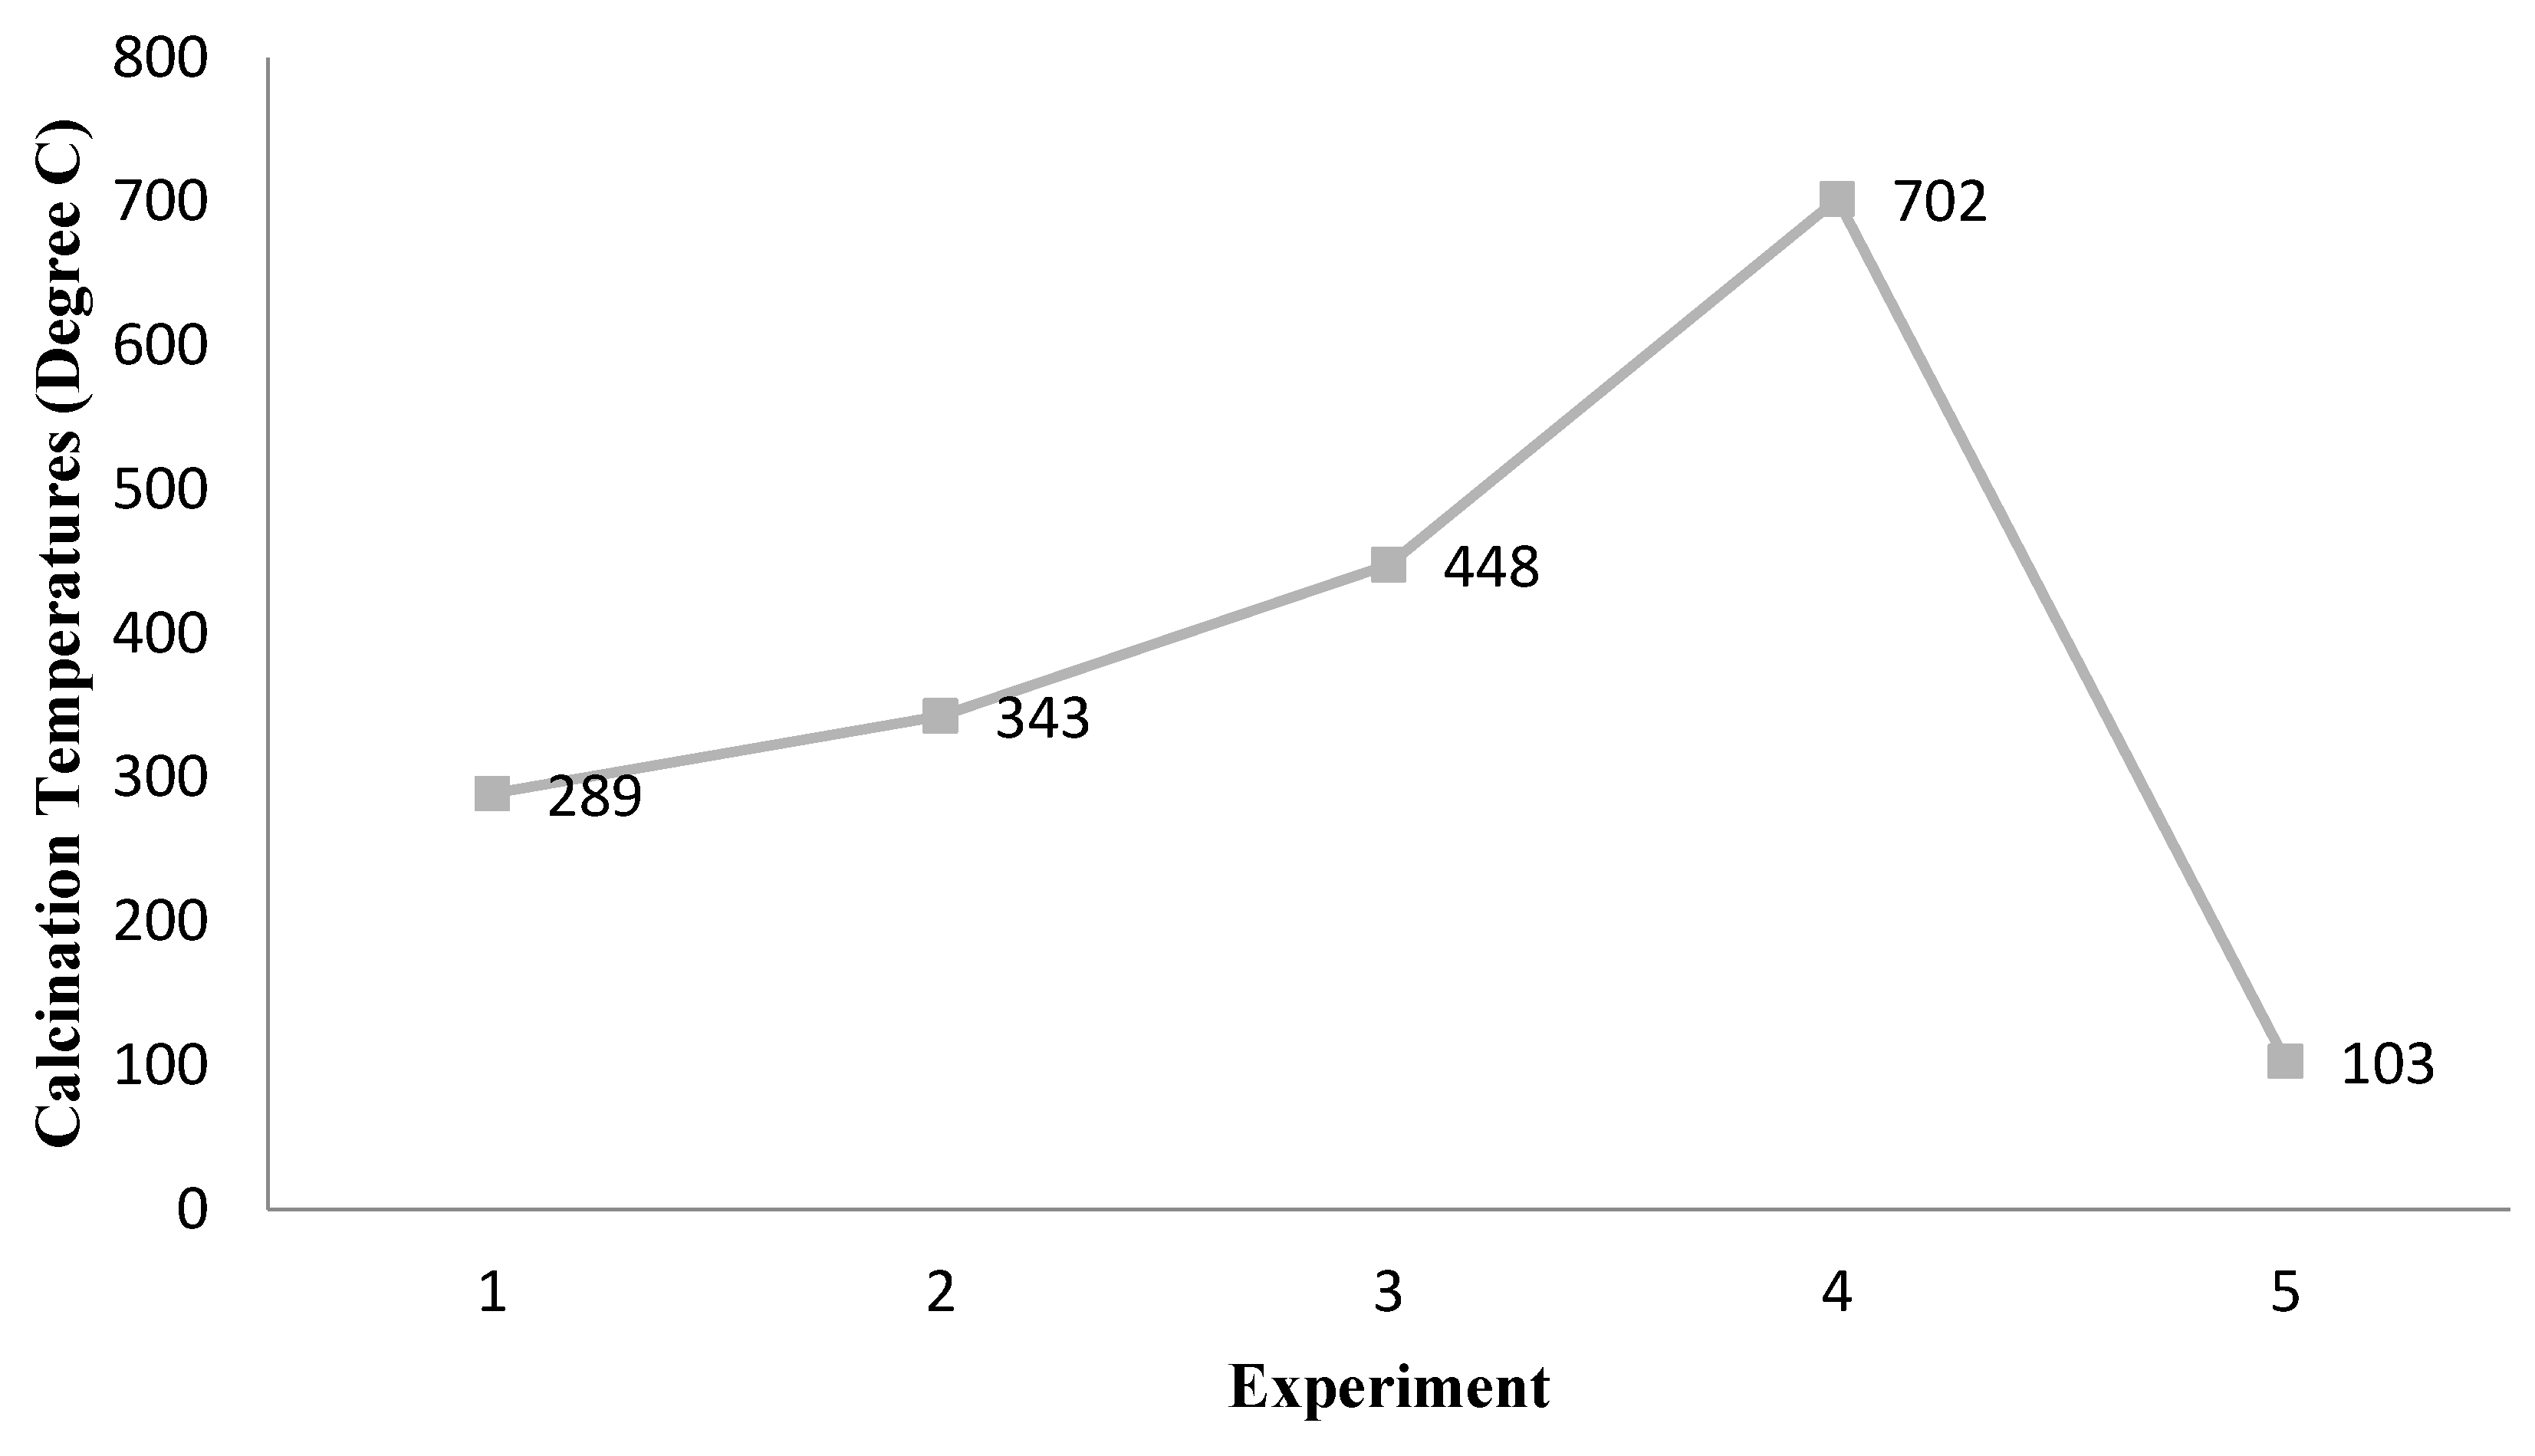
For synthesized photocatalysts calcined at different temperatures, the effect of different calcination temperatures on the methanol yield is illustrated in Figure 7. The catalyst was exposed under visible light irradiations for 5.5 h to check the photoactivity. The trend reveals that the amount of methanol is directly proportional to calcination temperature from 600 to 1000 °C. However, a sudden decrease in yield is observed when the calcination temperature is increased from 900 to 1000 °C. The increase in methanol yield with the increase in calcination temperature from 700 to 900 °C is due to the removal of all the impurities and volatile matters. The methanol yield obtained at 900 °C calcination temperature is 51% higher in comparison to a catalyst calcined at 700 °C and 36% greater than the catalyst calcined at 800 °C. Moreover, as the calcination temperature raise from 900to 1000 °C, an 85% decline in the yield is achieved in comparison with 900 °C calcination temperature. It is recommended that at >900 °C, the ZnFe2O4obtains impurities and the majority of active sites are deactivated, which results in a sudden dispersion in yield. As the temperature increases, the peak intensity increases and negligible peaks become clearer such that the crystallinity and shape of the crystals change [19,20].

2.5. Effect of Different Catalyst Loading Ratios

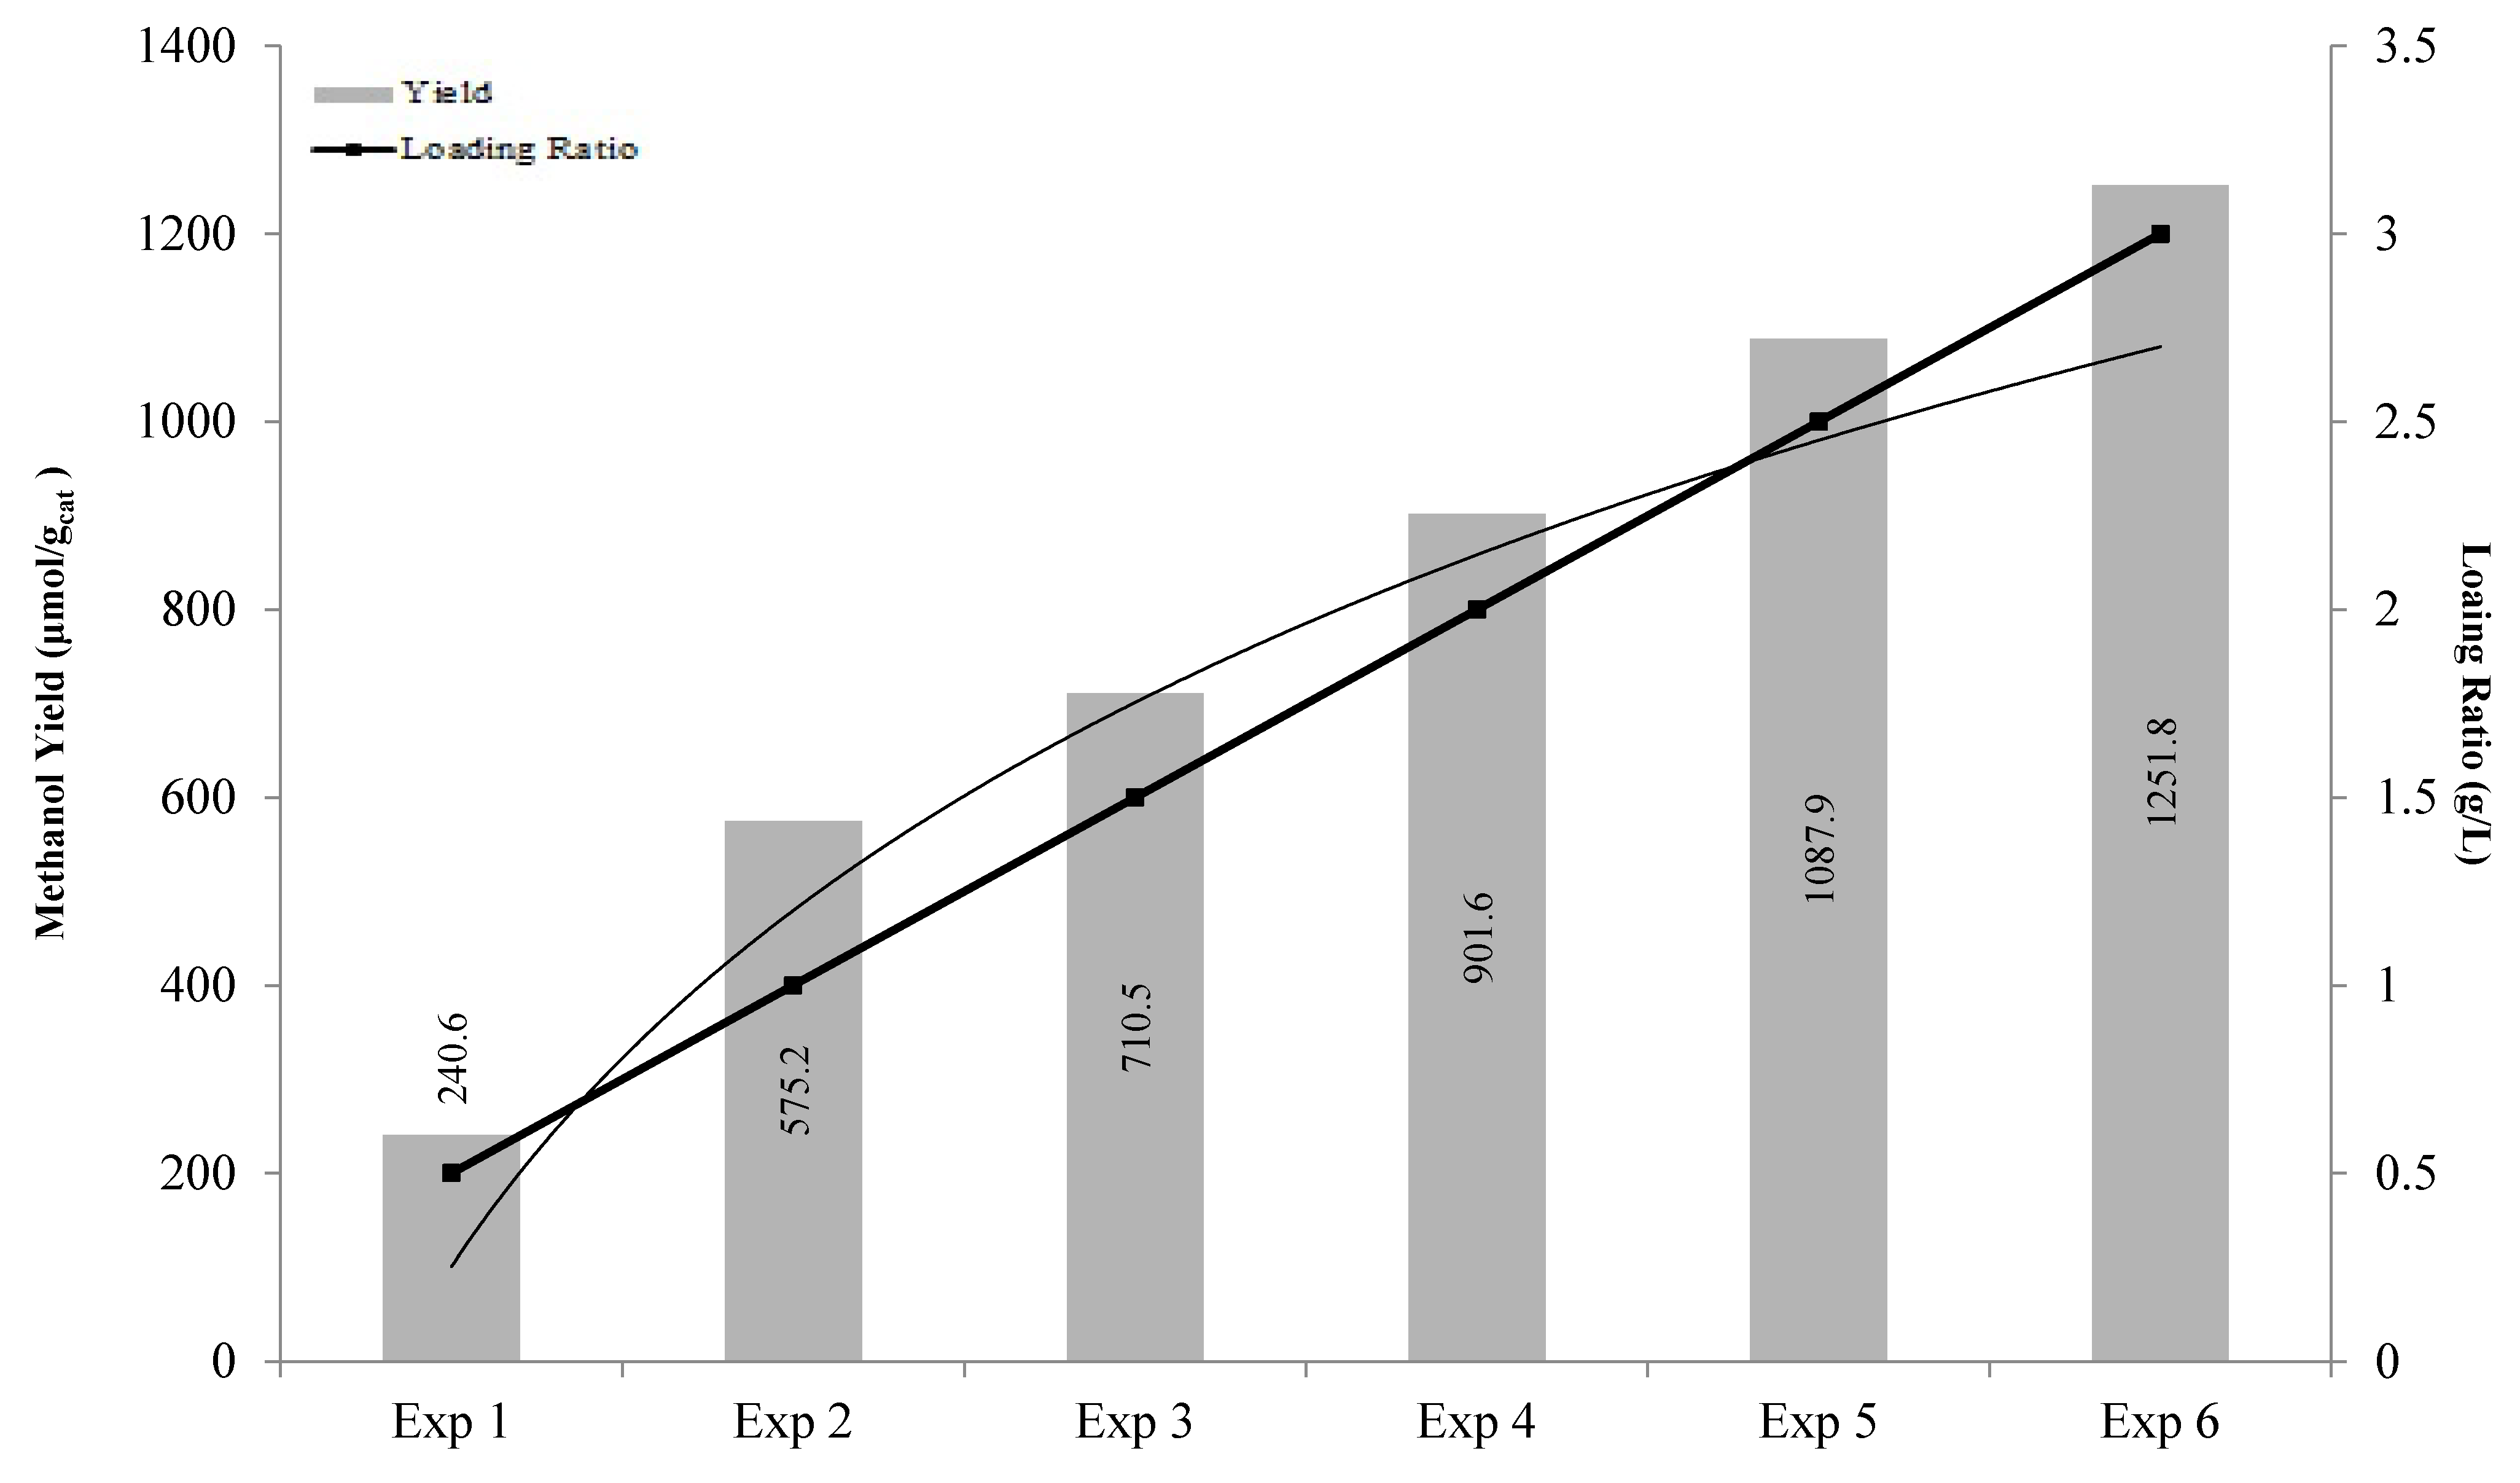
To understand the effect of catalyst loading on the reduction of CO2 into methanol, different loading ratios were used ranging from 0.5 to 3 g/L, and the results are represented in Figure 8. It is apparent that the amount of methanol (μmol/L) increases as the amount of loaded catalyst increases from 0.5 to 3 gm/L.
Table 3 will further clarify that at which loading ratio quantity, Methanol yield will be optimum etc.
The trend in Figure 8 shows an incremental increase; however, it is not exactly proportional to the amount of the catalyst loading ratio. The yield of methanol is 240.60 μmol/gcat by using 0.5 g/L catalyst. As the amount of catalyst is increased from 1 to 2 g/L, the amount of methanol should be doubled theoretically. However, only 36.2% higher methanol is obtained by using 2 g/L and vice versa. Moreover, the ratio percentage shows that the maximum yield is at 1 g/L, i.e., at 2 g/L, it must be double or near to that, but in the original, it is much lesser than that of 1 g/L, and the reverse is true until 3 g/L. Thus, at 1 g/L, the yield is 57.5%; at 2 g/L, the yield is 45.8%; and at 3 g/L, the yield is 41.7%. So, the optimum loading ratio is 1g/L, as the maximum yield has been obtained as per the loading ratio.

2.6. Effect of Catalyst Recycling

The catalyst has been recycled five times, and experimentation afterwards shows the trend of the recycling effect, as illustrated in Figure 9. After the first run, the whole solution present in a reactor including the catalyst was centrifuged at 1700 rpm for 18 min, and the catalyst was separated during the centrifuged process. The obtained catalyst was dried in an oven for 14 h at 120 °C. It is observed that activity of the catalyst decreases almost up to 55% during the second run. During the third run, a further decrease in the yield is observed, but this is not a straight-line depression in yield. For further standing, calculations of the trend of the decrease in the fourth and fifth run of the catalyst have also been done, which show that the yield has exponentially dropped by the fifth time run. It can be suggested that after 5.5 h, all the active sites are deactivated, and after recycling again and again, only a few sites are able to become active. It can be concluded that the catalyst is not useable again efficiently. Secondly, it is not possible to separate all the catalysts; however, the major portion is separated effectively. The deficiency of the catalyst is fulfilled by adding a fresh catalyst. The results clearly indicate that the catalyst can be effectively used only for one run. The metal ferrites do not work efficiently after recycling, because photo corrosion is a basic problem associated with this class [21,22].
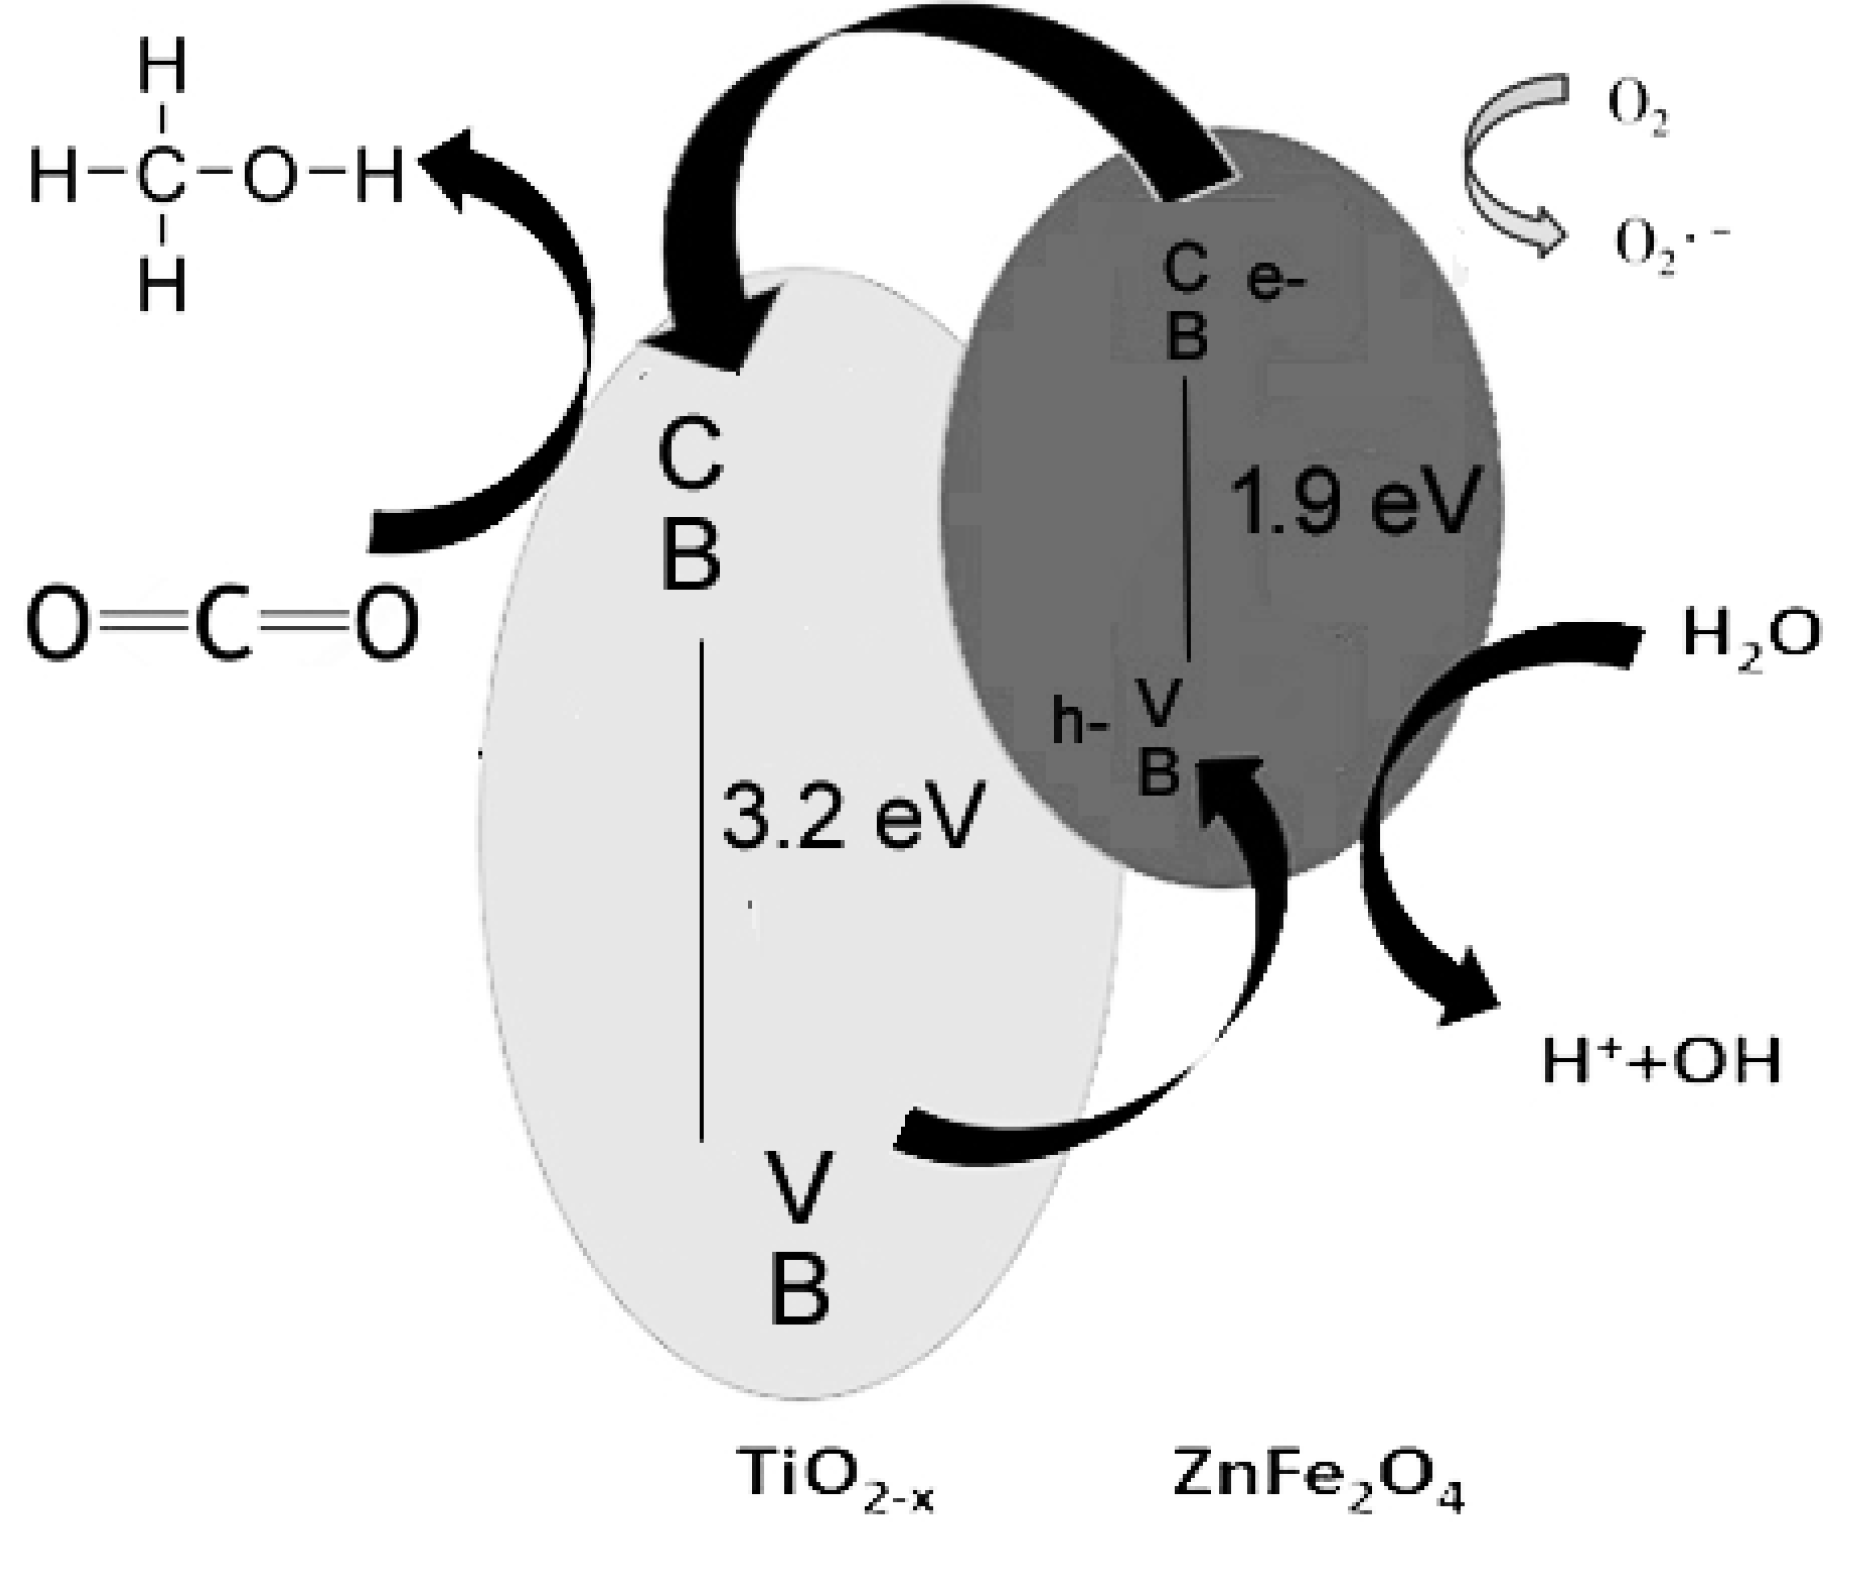
Thus, it can be said that a similar trend has been observed in the current study. Methanol production via a CO2 reduction mechanism through a ZnFe2O4/TiO2 photocatalyst is illustrated in Figure 10.
It can be clearly understood from the yield experiment that after 5.5 h, the active sites become deactivated and after recycling, only just a few sites become active; thus, the main sites remain deactivated. Finally, it can be concluded that the catalyst is non-usable again and again effectively and efficiently. Thus, we can conclude from the said findings that the catalyst could only be used once efficiently. Moreover, the ferrites of metal did not work efficiently after recycling, the reason behind which could be the photo corrosion, etc.

2.7. Proposed Reaction Mechanism

In Figure 10, a reaction mechanism of the carbon conversion into methanol has been proposed, the pH was 6.2 during the experimentation such that CO2 could not only exist as dissolved CO2 but also in the form of HCO3. The most abundant form of CO2 at this pH is the dissolved CO2 and HCO3.
[H+] = [OH] + [HCO3] + [2CO32−]
The coefficient 2 in above expression indicates that 2 moles of H+ are required for the conversion of CO32− into HCO3, which is considered as a reference level. The pH during the reaction was maintained at 6.2, which is acidic, such that all the bicarbonates that can be produced in CO2 and water mixture can be neglected.
The conversion of CO2occurs on this surface of TiO2 and water oxidizes on the surface of ZnFe2O4 because holes are transferred from TiO2 to ZnFe2O4 due to the position of its valence band.
The CB (Conduction Band) position of ZnFe2O4 is more negative than the CB of TiO2, and its position is also close to the reduction potential of CO2 into methanol. So, under the presence of visible light irradiation, the excited electrons are transferred from the VB (Valance Band) of ZnFe2O4 to the CB of ZnFe2O4. These excited electrons are easily transferred to TiO2 because of the formation of a heterojunction between these two semiconductors. Secondly, TiO2 is also available in the Ti3+ state, which is more active than the Ti4+ state. Therefore, the efficiency also increases due to this reason. During the photoexcitation process, the holes are also generated that are transferred to the VB of ZnFe2O4, as illustrated in Figure 10. The heterostructure increases the e- and h+ separation time. Therefore, the recombination rate of e- and h+ is very slow, which is very suitable for photocatalytic reactions. The conversion of CO2 occurs on this surface of TiO2, and water oxidizes on the surface of ZnFe2O4 because holes are transferred from TiO2 to ZnFe2O4 due to the position of its valence band. The yield of methanol is slightly higher than the recently reported results, which are 651μmol/gcat. The increase in yield is suggested due to the proper alignment of ZnFe2O4 with TiO2. Moreover, the constant temperature during the reaction and higher intensity of light are other reasons to get a higher yield.

2.8. Comparison with Previous Results

As TiO2 cannot be used only for visible light because it has a higher band gap and its electron–hole pair recombination is much faster than the reduction, another catalyst must be added in order to make it a visible light-induced photocatalyst; some previously used photocatalyst results have also been shown with the current research in the following Table 4.
The above table shows that the current research shows a maximum yield of 141.22 μmol/gcat·h of methanol as compared to other catalysts using the same source of light i.e., a 500-W tungsten Bulb.
Photocatalyst used for the conversion of carbon dioxide into useful fuel with enhanced yield by using visible light could be a most important technique of current era because it can give us Carbon reduction with a fuel. Moreover selective product could be achieved by controlling conduction band position as illustrated by previous research [23,24]. Researchers also suggest that maximum yield still couldn’t be achieved due to the reason of formation of other products like formaldehyde, formic acid as well as backward reaction [25].

3. Materials and Method

3.1. Synthesis Procedure

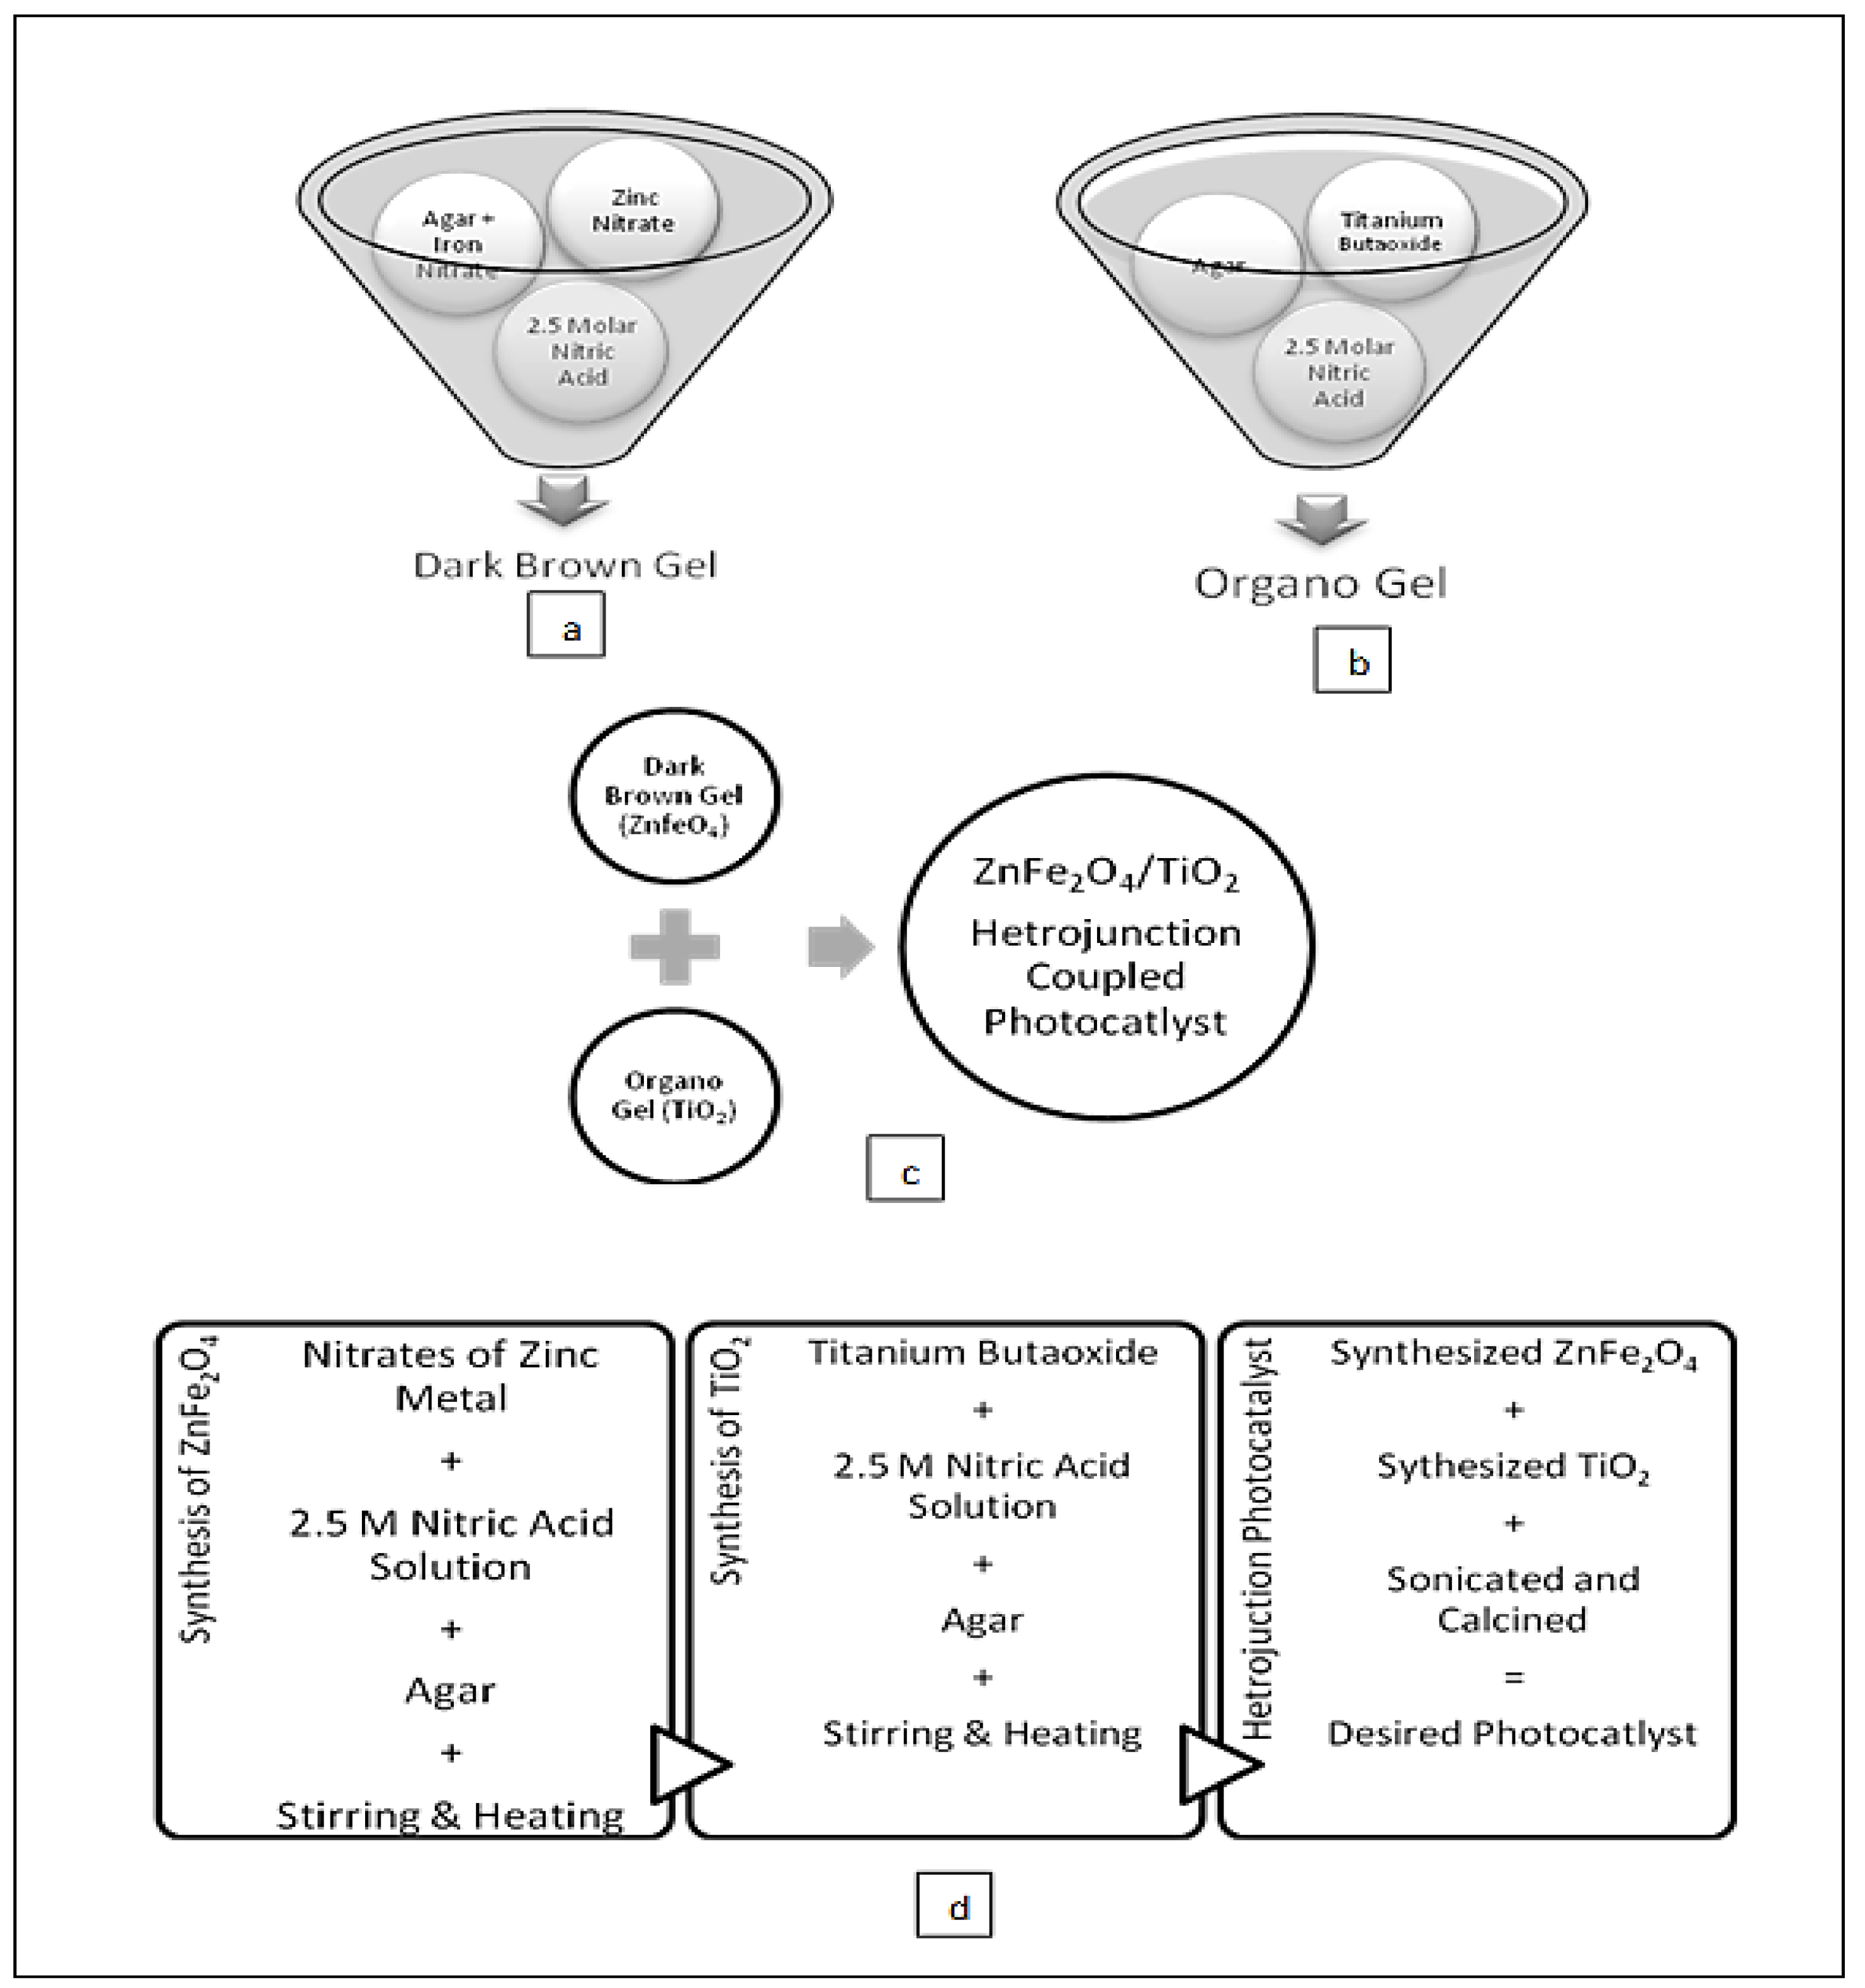
Altered process conditions were used to synthesized the ZnFe2O4/TiO2photocatlyst for which initially Zinc nitrate, Zn(NO3)2·4H2O, and iron nitrate Fe(NO3)3·9H2O were dissolved in 2.5 M of HNO3 and nutrient agar solution, at continuous stirring and heating continuously until a brown–blackish gel was formed. A similar procedure was followed with TiO2, which was dissolved in 2.5 M of HNO3 and nutrient agar solution, stirred, and heated continuously until an orange gel was formed. Then, to form the desired band gap, the photocatlyst ZnFe2O4/TiO2 was sonicated and calcined at different temperatures for approximately 4.5 h in the presence of N2 gas. Figure 11 explains the steps involved in the synthesis of the photocatalyst.

3.2. Electron and Hole Pair Formation

The following equations represent concepts of electron and hole pair formation.
Photocatalyst + h+ + e
h+ + e→ Heat
Eg→Ec − Eυ
where
  • Eg = band gap energy;
  • Ec = energy of the conduction band; and
  • Ev = energy of the valance band.
The photocatalyst when exposed under light irradiation produced the excited electrons and holes, as shown in Equation (1). The electrons start recombining with each other if no absorbed species are present, as shown in Equation (2). This indicates that electron and hole pairs can combine with each other without taking part in oxidation and reduction reactions. As a result, reaction heat is released. If electron and hole pairs have enough energy, they move toward the surface and take part in the reaction. The electron and hole pairs can also be formed on the catalyst surface and produce unproductive heat. Equation (3) represents the band gap calculations as a difference between the valence band and conduction band. The activity of the catalyst depends upon the arrangement of the reaction medium, the absorption capacity of chemicals on the semiconductor’s surface, the type of semiconductor and its morphology, and the capacity of the catalyst to absorb UV–Vis light irradiation. Surface improvement and reducing the band gap of a photocatalyst are two major factors.
Methanol production via a CO2 reduction mechanism through a ZnFe2O4/TiO2 photocatalyst is described as shown in Equations (4)–(8). pH has been maintained around 5.9–6.2 such that CO2 could not only exist as dissolved CO2 but also in the form of HCO3. The most abundant form of CO2 at the said pH is dissolved CO2 and HCO3. The proton balance for this is shown by Equation (4).
[H+] = [OH] + [HCO3] + 2 [CO32−]
The coefficient 2 in Equation (4) indicates that 2 moles of H+ are required for the conversion of CO32− into HCO3 and is considered as a reference level.
The pH of the reaction and during the whole reaction was kept and maintained at around 5.9–6.2, which are acidic values such that all the bicarbonates that can be produced in CO2 and water mixture can be deserted.
So, it results in another relation as expressed by Equation (5).
[H+]→[HCO3]
Potassium hydroxide was used to increase the absorbance of CO2 into water, so the proton balance is shown as per Equation (6).
[HCO3] + [H+]→[OH] + [CO32−]
The pH of the solution was very close to a neutral value, so the [H+] and [OH] can be ignored easily.
So, it results in another relation as expressed by Equation (7).
[HCO3] = [CO32−]
The conversion of CO2 occurs when the reduction reaction on the surface of the synthesized catalyst is done as per Equation (8).
CO2 + 6H+ + 6e→CH3OH + H2O
The reduction potential of CO2 into methanol falls between the conduction band and valance band of ZnFe2O4/TiO2, which means that the coupled semiconductor can reduce CO2 into methanol. The band gap of ZnFe2O4 is lower, that is, 1.9 eV; hence, it works under visible light irradiation in comparison with TiO2, which has a band gap of approximately 3.2 eV.

3.3. Experimental Setup and Operating Conditions

An experimental setup includes a continuous flow reactor followed by a 500 Watt Xenon lamp, which is used as a visible light/radiation source. NaNO2 (2 M) solution was used to cut the UV light. First of all, 0.1 M sodium sulfite, potassium hydroxide, and 0.1 M sodium sulfide were added in 500 mL of distilled water. In the next step, CO2 fizzed from the solution in the reactor for 1 h to assure that O2 (dissolved) is approaching toward elimination and the pH of the solution is maintained at 6.2. Moreover, the catalyst should be mixed to the solution, making the concentration of catalyst 1 g/L. Afterwards, the photoreaction started as soon as the 500-watt bulb was switched on. The reactor temperature was maintained at 25 °C with the help of a chiller during the reaction. The CO2 continuously flowed through the solution during irradiation. Three liquid samples were collected and analyzed in GC-FID for product detection. The photocatalytic reaction was carried out for 6 h. The experimental results of the methanol yield have been confirmed by repeating it three times, and the average yield was taken.
Methanol was analyzed by GC-FID, and a DB-WAX 123-7033 column was used for the detection of methanol. Helium gas was introduced as the shipper gas, and the flow rate was 35 cm/s. The oven temperature was adjusted at 40 °C, and inlet temperature was fixed at 200 °C. The split ratio was 1:50 and the FID temperature was 300 °C. Nitrogen gas was used as the makeup with a flow rate of 30 mL/min at the FID detector. The yield was calculated by using the following equation.
Y = (C × W/V)
  • Y = yield
  • C = methanol concentration, μmol/L
  • V = volume, L
  • W = mass of catalyst, g

4. Conclusions

The primary object of the research was to synthesize a photocatalyst (ZnFe2O4/TiO2) as a visible light-induced photocatalyst for the conversion of CO2into methanol under visible light irradiation. ZnFe2O4andZnFe2O4/TiO2heterojunction photocatalysts were synthesized and used for the reduction of CO2into methanol. The most optimized catalyst loading amount was 1g/L to get a maximum yield of methanol. The maximum yield observed was 141.22 μmol/gcat·h. The prominent feature of this study is to analyze the effect of different parameters on the methanol yield such as the effect of calcination temperature, the intensity of light, the catalyst loading ratio, the effect of different coupling ratios, and the effect of recycling the catalyst. However, as the pH of the reaction solution was maintained at 5.9–6.2; hence, the pH and the most dominant species were 2 and HCO3. The reported yield of methanol obtained by ZnFe2O4/TiO2 is quite better because of e and HIhaving a slow recombination rate due to the formation of the heterojunction. A 7% increase in the yield indicates that the coupling of ZnFe2O4 with a TiO2 increases the photocatalytic activity. The coupling of ZnFe2O4/TiO2 resulted in a new band gap and made it visible light-responsive. Moreover, the maximum yield has been obtained at a calcination temperature of 900 °C and the coupling ratio is 1:1 w/w. Hence, after considering all the essential parameters, the results indicate that coupling of ZnFe2O4 with TiO2 is effectively enhanced under visible light irradiation. Thus, the following recommendations still need to be considered for future studies.

5. Recommendations

There are some suggestions for the future studies on the synthesis of ZnFe2O4 and ZnFe2O4/TiO2 for the reduction of CO2 into methanol or some other photocatalytic applications. Despite the fact that ZnFeI2O4 is a visible light-induced catalyst and forms a heterojunction with TiO2, which proved itself a very suitable technique for CO2 reduction, other metal ferrites should also be tested.
Photoreactors of different types should be designed and tested in order to identify the most suitable photoreactor.

Author Contributions

Authors contributed a lot and despite of the busy schedule, gather as when required basis to discuss the conceptualization of the said research. N.M. and M.S. wrote the manuscript, investigate and validate the results. N.M. and U.S. performed data analysis and data curation. S.R.N. supervised, editing and review the work and in cooperation with N.M. performed project administration. All authors have read and agreed to the published version of the manuscript.

Funding

This research received no external funding.

Conflicts of Interest

The authors declare no conflict of interest.

References

  1. Moniz, S.J.A.; Shevlin, S.A.; Martin, D.J.; Guo, Z.-X.; Tang, J. Visible-light driven heterojunction photocatalysts for water splitting–acritical review. Energy Environ. Sci. 2015, 8, 722–765. [Google Scholar] [CrossRef]
  2. Su, M.; He, C.; Sharma, V.K.; AsiAbou, M.; Xia, D.; Li, X.Z.; Deng, H.; Xiong, Y. Mesoporous zinc ferrite: Synthesis, characterization, and photocatalytic activity with H2O2/visible light. J. Hazard. Mater. 2012, 211, 88–111. [Google Scholar] [CrossRef] [PubMed]
  3. Ola, O.; Maroto-Valer, M.M. Review of material design and reactor engineering on TiO2 photocatalysis for CO2 reduction. J. Photochem. Photobiol. C Photochem. Rev. 2015, 24, 13–49. [Google Scholar] [CrossRef] [Green Version]
  4. Tan, C. CO2 utilization. Ind. Mater. 2013, 316, 79–98. [Google Scholar]
  5. AbdelDayem, H.M.; AbdelDayem, S.S.; Hassan, S.A. Selective methanol oxidation to hydrogen over Ag/ZnO catalysts doped with mono-and bi-rare earth oxides. Ind. Eng. Chem. Res. 2014, 53, 19872–19899. [Google Scholar] [CrossRef]
  6. Heffer, P.; Prud’homme, M. Fertilizer outlook 2013–2017. In Proceedings of the 81st International Fertilizer Industry Association Conference, Chicago, IL, USA, 20–22 May 2013; pp. 7–9. [Google Scholar]
  7. Casbeer, E.; Sharma, V.K.; Li, X. Synthesis and photocatalytic activity of ferrites under visible light: A review. Sep. Purif. Technol. 2012, 87, 1–17. [Google Scholar] [CrossRef]
  8. Karamian, R.; Ghasemlou, F. Total phenolic content, antioxidant and antibacterial activities of three Verbascum species from Iran. J. Med. Plants By-Prod. 2013, 1, 42–56. [Google Scholar]
  9. Kawamura, S.; Egami, H.; Sodeoka, M. Amino tri-fluoro methylation of olefins via cyclic amine formation: Mechanistic study and application to synthesis of trifluoro methylated pyrrolidines. J. Am. Chem. Soc. 2015, 137, 4859–4878. [Google Scholar] [CrossRef]
  10. Matsumoto, Y.; Kim, K.; Bogenhagen, D.F. Proliferating cell nuclear antigen-dependent abasic site repair in Xenopus laevis oocytes: An alternative pathway of base excision DNA repair. Mol. Cell. Biol. 1994, 14, 6175–6199. [Google Scholar] [CrossRef] [Green Version]
  11. Tahir, M.; Amin, N.S. Advances in visible light responsive titanium oxide based photocatalysts for CO2 conversion to hydrocarbon fuels. Energy Convers. Manag. 2013, 76, 192–217. [Google Scholar] [CrossRef]
  12. Uddin, M.N.; Afrin, R.; Uddin, M.J.; Md. Uddin, M.J.; Alam, A.H.M.K.; Rahman, A.A.; Sadik, G. Vanda roxburghii chloroform extract as a potential source of polyphenols with antioxidant and cholinesterase inhibitory activities: Identification of a strong phenolic antioxidant. BMC Complementary Altern. Med. 2015, 15, 192. [Google Scholar] [CrossRef] [PubMed] [Green Version]
  13. Rekhila, G.; Bessekhouad, Y.; Trari, M. Visible light hydrogen production on the novel ferrite NiFe2O4. Int. J. Hydrog. Energy 2013, 38, 6331–6348. [Google Scholar] [CrossRef]
  14. Moualkia, H.; Rekhila, G.; Izerrouken, M.; Mahdjoub, A.; Trari, M. Influence of the film thickness on the photovoltaic properties of chemically deposited CdS thin films: Application to the photodegradation of orange. Mater. Sci. Semicond. Process. 2014, 21, 181–197. [Google Scholar] [CrossRef]
  15. Li, H.; Lei, Y.; Huang, Y.; Fang, Y.; Xu, Y.; Zhu, X.; Li, X. Photocatalytic reduction of carbon dioxide to methanol by Cu2O/SiCN an ocrystallite under visible light irradiation. J. Nat. Gas. Chem. 2011, 20, 142–151. [Google Scholar]
  16. Ghosh, A.; Mangalvedhe, N.; Ratasuk, R.; Mondal, B.; Cudak, M.; Visotsky, E.; Thomas, T.A.; Andrews, J.G.; Xia, P.; Jo, H.S.; et al. Heterogeneous cellular networks: From theory to practice. IEEE Commun. Mag. 2012, 50, 52–67. [Google Scholar] [CrossRef]
  17. Hao, F.; Lakshman, T.V.; Sarit, M.; Song, H. Providing Cloud-Based Services Using Dynamic Network Virtualization. U.S. Patent No. 9,210,065, 22 June 2015. [Google Scholar]
  18. Kezzim, A.; Nasrallah, N.; Abdi, A.; Trari, M. Visible light induced hydrogen on the novel hetero-system CuFe2O4/TiO2. Energy Convers. Manag. 2011, 52, 2798–2810. [Google Scholar] [CrossRef]
  19. Elias, D.C.; Nair, R.R.; Mohiuddin, T.M.; Morozov, S.V.; Blake, P.; Halsall, M.P.; Ferrari, A.C.; Boukhvalov, D.W.; Katsnelson, M.I.; Geim, A.K.; et al. Control of graphene’s properties by reversible hydrogenation: Evidence for graphane. Science 2009, 323, 605–618. [Google Scholar] [CrossRef] [Green Version]
  20. Kim, M.; Choi, J.-S.; Toops, T.J.; Jeong, E.-S. Coating SiO2 support with TiO2 or ZrO2 and effects on structure and CO oxidation performance of Pt catalysts. Catalysts 2013, 3, 81–108. [Google Scholar] [CrossRef] [Green Version]
  21. Islam, M.A.; Woon, C.W.; Ethiraj, B.; Cheng, C.K.; Yousuf, A.; Khan, M.M.R. Ultrasound driven biofilm removal for stable power generation in microbial fuel cell. Energy Fuels 2016, 31, 962–979. [Google Scholar] [CrossRef]
  22. Li, X.; Liu, A.; Chu, D.; Zhang, C.; Du, Y.; Huang, J.; Yang, P. High performance of manganese porphyrin sensitized type CuFe2O4 photocathode for solar water splitting to produce hydrogen in a tandem photoelectrochemical cell. Catalysts 2018, 8, 109. [Google Scholar]
  23. Akhter, P.; Farkhondehfal, M.A.; Hernández, S.; Hussain, M.; Fina, A.; Saracco, G.; Khan, A.U.; Russo, N. Environmental issues regarding CO2 and recent strategies for alternative fuels through photocatalytic reduction with titania-based materials. J. Environ. Chem. Eng. 2016, 4, 3933–3951. [Google Scholar] [CrossRef]
  24. Lv, M.; Liu, H. Photocatalytic property and structural stability of CuAl-based layered double hydroxides. J. Solid State Chem. 2015, 227, 229–241. [Google Scholar] [CrossRef]
  25. Xia, S.; Meng, Y.; Zhou, X.; Xue, J.; Pan, G.; Ni, Z. Ti/ZnO–Fe2O3 composite: Synthesis, characterization and application as a highly efficient photo-electron catalyst for methanol from CO2 reduction. Appl. Catal. B Environ. 2016, 187, 119–136. [Google Scholar] [CrossRef]
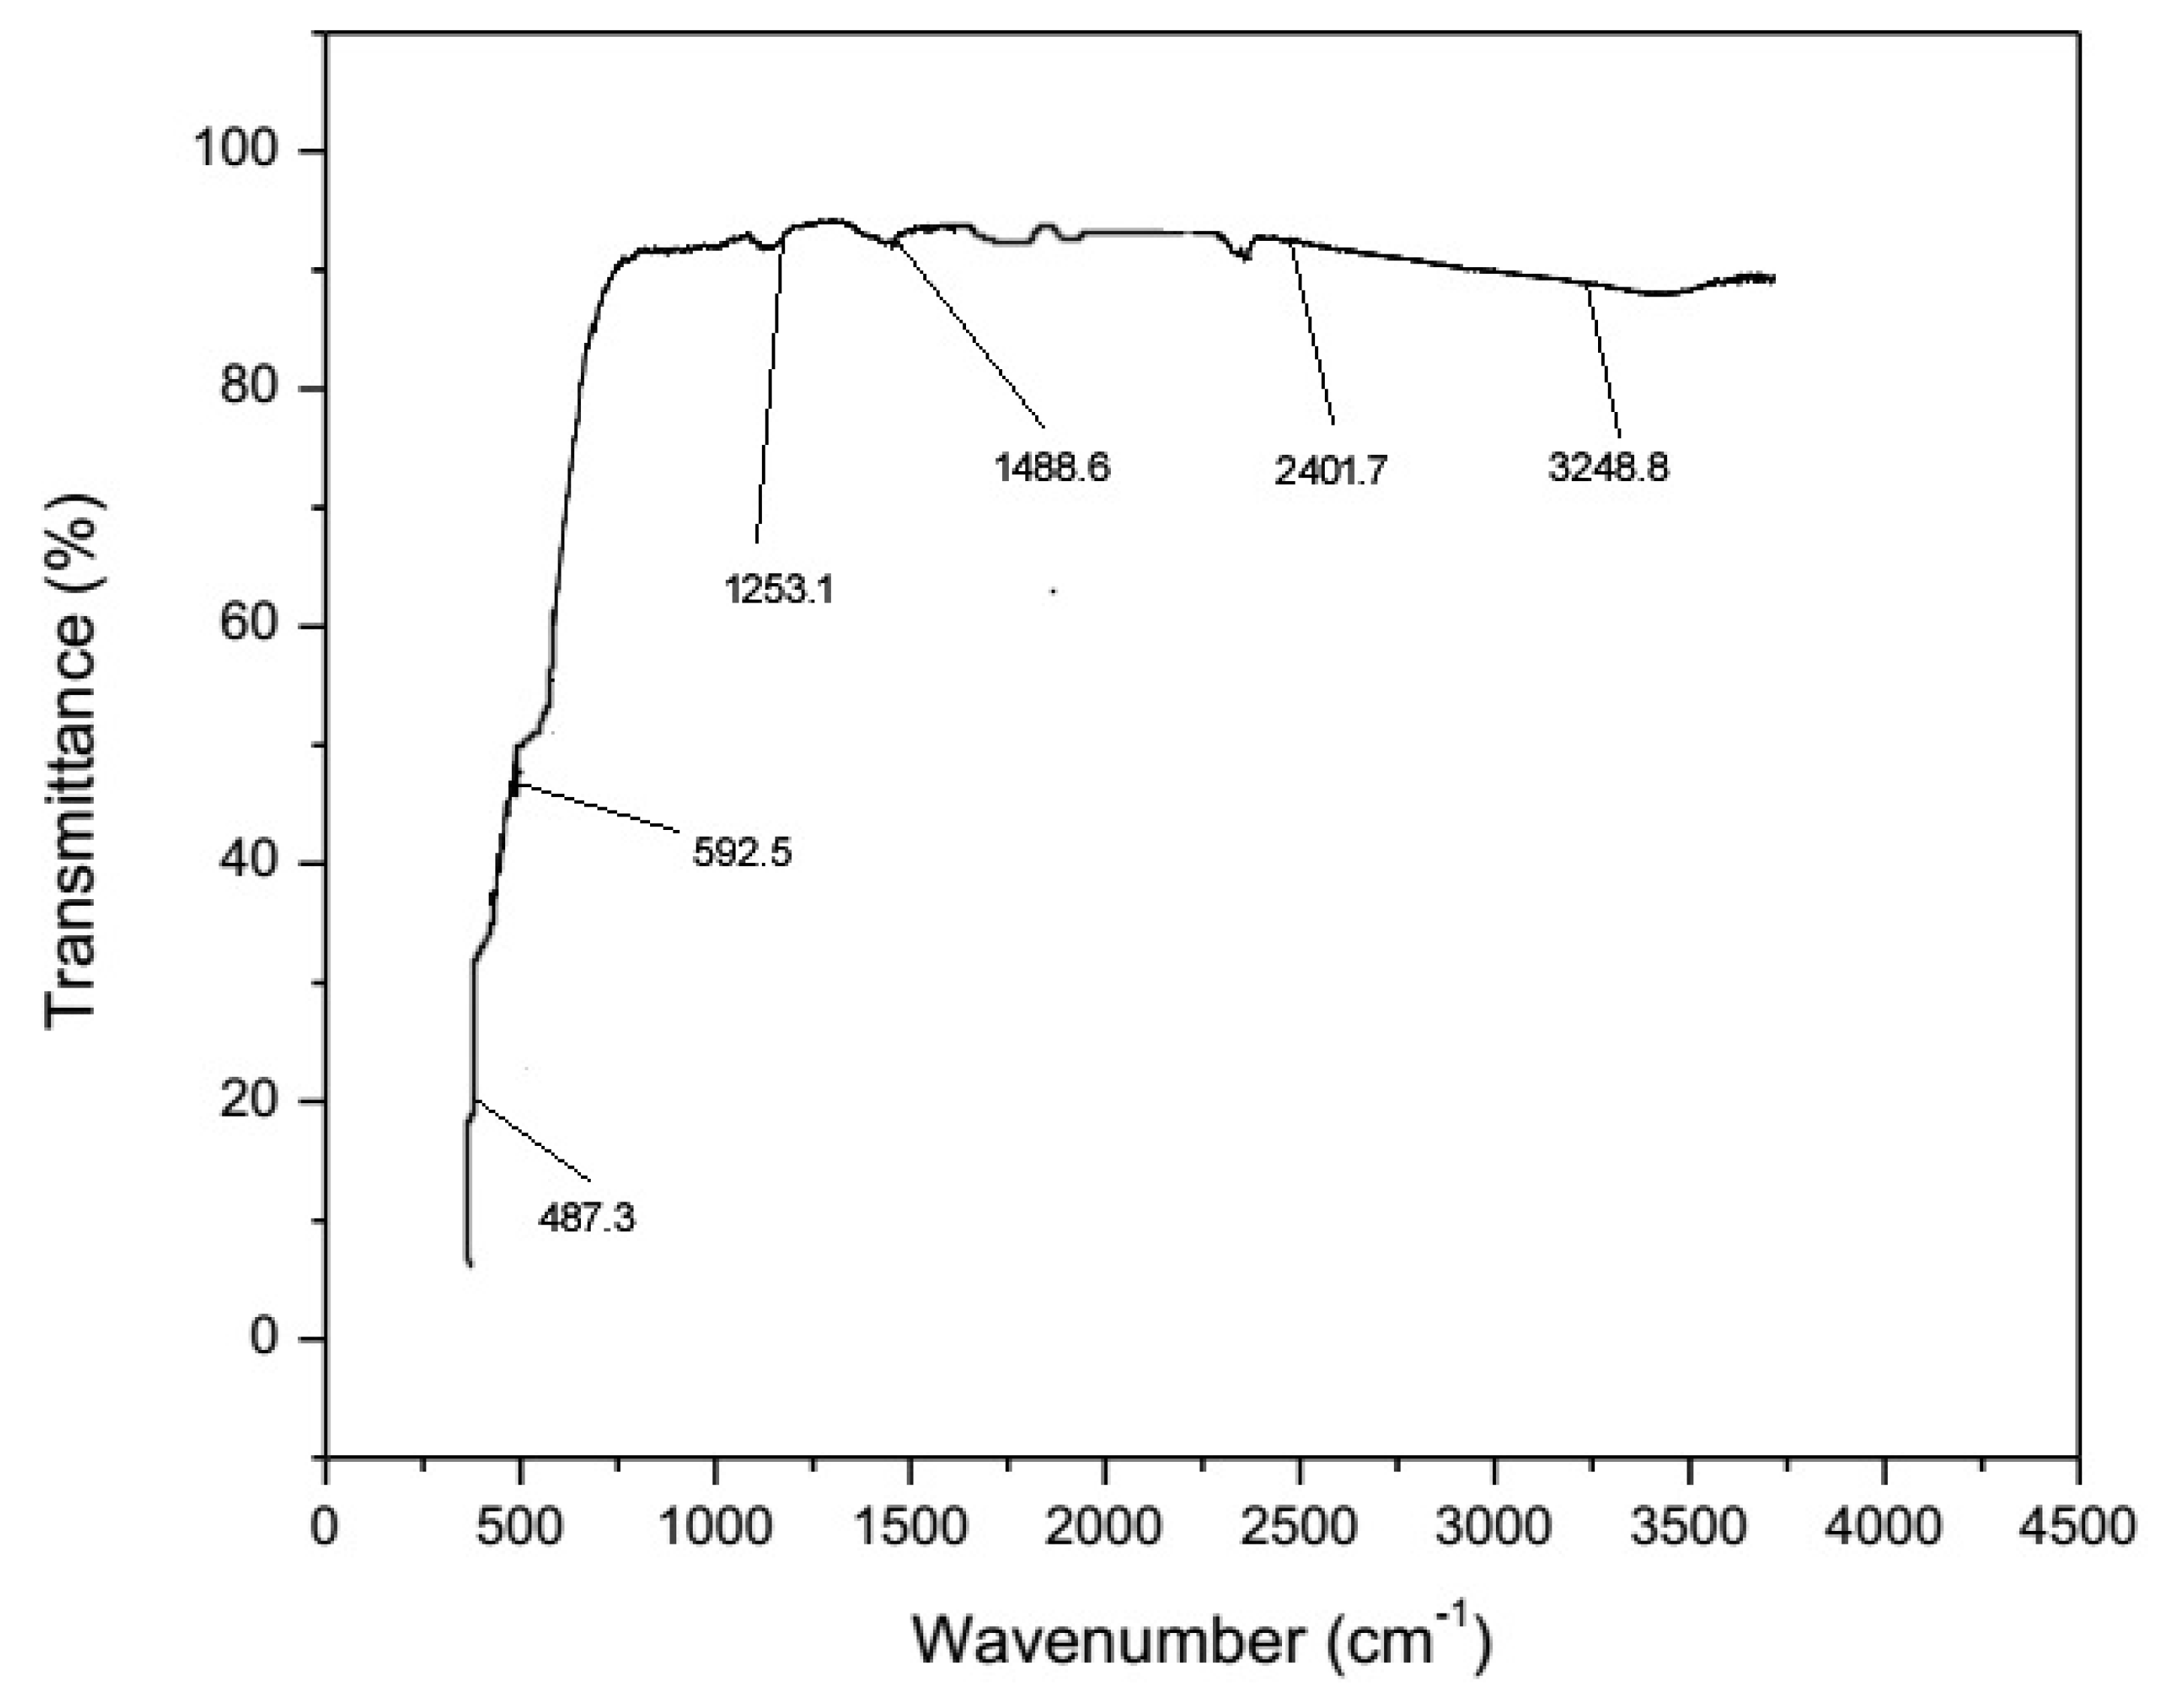
Figure 1. Fourier transform infrared (FTIR) analysis of the ZnFe2O4/TiO2photocatalyst performed on 4000–450 cm−1 range spectrophotometer.
Catalysts 10 00163 g001
Figure 2. UV–Vis spectra of the synthesized photocatalyst; the wavelength set was 200–800 nm.
Catalysts 10 00163 g002
Figure 3. Images (a,b) ZnFe2O4, (c,d), and (e,f) ZnFe2O4:TiO2 (1:1).
Catalysts 10 00163 g003
Figure 4. XRD spectra (a) TiO2, (b) ZnFeI2O4, and (c) ZnFeI2O4:TiO2 (1:1).
Catalysts 10 00163 g004
Figure 5. The activity of theZnFe2O4/TiO2 (1:1 w/w) photocatalyst.
Catalysts 10 00163 g005
Figure 6. Effect of different coupling ratios on methanol yield.
Catalysts 10 00163 g006
Figure 7. Effect of calcination temperature on yield.
Catalysts 10 00163 g007
Figure 8. Effect of different catalyst loading ratios on the yield of methanol.
Catalysts 10 00163 g008
Figure 9. Effect of recycling a catalyst on the yield of methanol.
Catalysts 10 00163 g009
Figure 10. Proposed reaction mechanism.
Catalysts 10 00163 g010
Figure 11. (a) Steps involved in synthesis of zinc ferrite, (b) steps involved in synthesis of titanium dioxide, (c) coupling of zinc ferrite and titanium dioxide, (d) detailed steps involved in synthesis of the photocatalyst.
Catalysts 10 00163 g011
Table 1. CO2 reduction and market sales potential of different products formed by CO2 conversion.
ProductPotential of CO2Reduction (ton CO2/ton of Product)Market Scale (per Year)References
Global Demand (million ton, MT)Market Value (billion $)
Dimethyl ether (DME)1.96.33.2[4]
Dimethyl carbonate (DMC)1.470.24280---
Polycarbonate0.53.614.4[4]
Methanol1.387536[5]
Urea0.735-0.75198.459.5[6]
Table 2. Thermodynamic potential of CO2 into different products.
Sr. No.ReactionThermodynamic Potential V vs. NHE (Normal Hydrogen Electrode)
V vs. NHEReference
1CO2+ e→ CO2−1.9[3]
2CO2+ 2H+→ HCOOH−0.61[11]
32H++ e→ H2−0.41[3]
Table 3. Methanol yield with respect to loading ratios.
ExperimentsLoading Ratio (g/L)Methanol Yield (μmol/gcat)
10.5240.6
21575.2
31.5710.5
42901.6
52.51087.9
631251.8
Table 4. Comparison with previous results.
PhotocatalystRate of Methanol Formation (μmol/gcat·h)Solvent/ElectrolyteLight SourceReference
ZnFe2O4/TiO2141.22Na2S, Na2SO3, KOH in Water500 W Xenon LampThis Study
15% Bi2S3/CdS122.6NaOH and Na2S in Water500 W Xenon Lamp[23]
CeF3/TiO280Water500 W Xenon Lamp[14]
Cu2O/SiC39NaOH and Na2SO3 in Water500 W Xenon Lamp[16]