Article

Acid Properties of GO and Reduced GO as Determined by Microcalorimetry, FTIR, and Kinetics of Cellulose Hydrolysis-Hydrogenolysis

1
Institut de Recherche sur la Catalyse et L’environnement de Lyon, CNRS, Lyon1, 2 Avenue Albert Einstein, 69626 Villeurbanne, France
2
Key Laboratory for Petrochemical and Refinery Technologies, 2 rue Pham Ngu Lao, Hanoi, Vietnam
*
Authors to whom correspondence should be addressed.
Catalysts 2020, 10(12), 1393; https://doi.org/10.3390/catal10121393
Submission received: 6 November 2020 / Revised: 24 November 2020 / Accepted: 27 November 2020 / Published: 30 November 2020

Abstract

:
Graphene oxide addresses increasing interests as a solid acid catalyst working in water for carbohydrate conversion. If there is a general agreement to correlate its unique catalytic performances to its ability to adsorb sugars, the origin of its acidity remains controversial. In this article, we study the acid strength of graphene oxide (GO) prepared by modified Hummers method and that of reduced GO by calorimetry of NH3 adsorption and by FTIR of pyridine adsorption. Very strong acid sites are detected on GO by calorimetry, while reduced graphene oxide (reGO) is not very acidic. The FTIR of pyridine adsorption shows the prevailing presence of Br∅nsted acid sites and a unique feature, the presence of pyridine coordinated by hydrogen bonds. This exceptionally strong Br∅nsted acidity is tentatively explained by the presence of graphene domains decorated by hydroxyl, carboxylic, or sulfonated groups within the GO sheet, resulting in a high mobility of the negative charges which makes the proton free and explains its strong acidity. Accordingly, only GO is active and selective for native cellulose hydrolysis, leading to 27% yield in glucose. Finally, we show that sugar alcohols cannot be formed directly from cellulose using GO combined with Pt/re-GO under hydrogen, explained by the reduction of oxygenated functions of GO. The instability of the functional groups of GO in a reducing atmosphere is the weak point of this peculiar solid acid.

1. Introduction

Today, the most environmentally short-term issue is mandatory CO2 emission reduction to limit global warming. One way to move towards carbon neutrality relies on the use of renewable carbon sources to produce liquid fuels for transportation or domestic uses or for chemical and material synthesis. Lignocellulosic biomass is abundant and nonedible, which makes it the best alternative to moving towards carbon neutrality thanks to its short carbon cycle conversely to fossil resources. Cellulose, the main component of lignocellulose, represents 35–50% depending on the type of biomass. Cellulose is made of linear chains of D-glucose linked by β-1-4 glycosidic bonds which are strongly associated by hydrogen bonds in cellulose micro-fibers. This is at the origin of cellulose crystallinity. The native cellulose contains highly crystalline domains and less ordered ones as well.
Cellulose is seen as a sugar reserve. Its robust hydrogen bond network makes it insoluble in most solvents and very resistant against depolymerization into glucose or other derived small molecules. Methods exist among biological and thermochemical processes, and both approaches are the subjects of considerable efforts of research. With the aim to selectively and rapidly depolymerize cellulose into glucose, the use of solid acid catalysts gathers the advantages of robustness, easy recovery, and absence of safety or corrosion issues, the conditions to pave the way towards cost effective and sustainable processes.
To date, carbon-based solid acids were reported as one of the most efficient catalytic systems for cellulose hydrolysis into glucose.
Porous acid materials obtained via acidification of active carbon or via partial carbonization of biomass and subsequent sulfonation were first reported for this application [1,2,3,4,5]. In earlier studies, in 2008, Onda et al. [1] reported that sulfonated activated carbon-converted selectively ball-milled cellulose at 150 °C with a high glucose yield of approximately 40%. The significant higher catalytic activity and selectivity of sulfonated activated carbon with regards to usual mineral solid acids (zeolites, sulfated zirconia, etc.) was ascribed to its hydrophobicity combined with the strong acidity of the SO3H group. In the same year, Hara et al. [2] investigated crystalline cellulose hydrolysis at low temperatures, 100 °C, with amorphous carbon prepared by sulfonation of partial carbonization of cellulose, leading to a material bearing various oxygenated groups: SO3H, COOH, and OH. In these soft hydrolysis conditions, only the carbon materials were able to hydrolyze the microcrystalline cellulose into soluble β1-4 glucans and glucose. Based on cellobiose and glucose adsorption experiments, the authors proposed that the specificity of this functionalized carbon material relies on its ability to interact strongly with β1-4 glucans and with the presence of hydrophobic graphene sheets which make SO3H groups water tolerant. Later on, in 2015, Sievers et al. [3] investigated active carbon chemically modified with H2O2 and sulfuric acid for cellulose hydrolysis. He concluded that, despite the relative weakness of the acid functionalized group, their impact on the β1-4 glucan adsorption would induce conformational changes assumed to be at the origin of the hydrolysis activity. Thereafter, the hydrolysis rate of oligosaccharides of different polymerizations (DPs) catalyzed by functionalized carbon materials was studied by Fukuoka et al. [5]. The detailed kinetic study revealed an enhanced hydrolysis rate of longer oligosaccharides explained by their higher affinity with the carbon material surface assumed to cause β1-4 glycosidic bond angle changes and to reduce the activation energy required for their cleavage. The authors concluded that this would justify the unique selectivity of the carbon materials for cellulose hydrolysis in glucose despite their low acidity. One can retain that these works agree on the role of favored β1-4 glucan adsorption on functionalized amorphous active carbon while the nature and the acid strength of the active sites remain less documented.
Recently, graphene oxide (GO) and sulfonated GO are objects of substantial interest for cellulose hydrolysis into glucose [6,7,8,9,10,11,12]. GO, obtained from graphite exfoliation/oxidation, is constituted of single or few flat nanolayers of 2D sheets constituted of sp2 hybridized carbons with in-plane and edge defects made of sp3 hybridized carbons. These defects in sp3 carbons gave rise to various oxygenated functional groups: OH, epoxy, and COOH. SO3H groups are also present when GO is prepared via Hummer’s method, which involves H2SO4 among the reactants [13,14]. These oxygenated groups expand the layer separation and are the origin of GO hydrophilicity, which makes it highly dispersed in water. The chemical nature of the functional groups is similar to those described previously on functionalized active carbons. GO is also reported to be highly active and selective for cellulose hydrolysis into glucose. Earlier studies from Zhang’s group, in 2014 [7], have shown that GO hydrolyzed cellulose to glucose up to 50% yield at 150 °C, after 24 h, using a quantitative catalyst/cellulose weight ratio. It was proposed that carboxylic and phenolic groups of the GO layered structure would act in synergy with the strong acid active sites, SO3H, for efficient activation of the β1-4 glycosidic bond. In 2014, Deng et al. [6] also found that GOs have superior activity compared to other conventional solid acids and even H2SO4 for cellobiose hydrolysis into glucose. They proposed that the GO sheets would work as enzyme-like activation with hydrophobic graphene sheet decorated with oxygenated groups capable of activating the reactants. Later on, in 2015, Yang et al. concluded the outstanding catalytic performances of reduced graphene oxide to hydrolyze crystalline Avicel celluloses in glucose, leading to 30% glucose yield after 6 h at 150 °C using a quantitative cellulose to catalyst weight ratio. A value twice higher that obtained with Amberlyst-15 while zeolites were inactive. The authors explained the activity of their graphene-based material by the catalytic action of the acidic –COOH and SO3H groups while the –OH groups participated in the adsorption of the β1-4 glucans and therefore made it possible to access cellulose to the solid catalyst active sites. Quite similar explanations were also proposed to explain the efficiency for cellulose hydrolysis in glucose over a GO-based material obtained from cellulose carbonization done in the presence of GO [10]. Note that only post-sulfonated carbon materials were active. The determining role of solid–solid contact for graphene-based catalyzed cellulose hydrolysis was recently highlighted by Huang et al. [11]. Adding N,N-dimethylacetamide resulted in improved dispersibility of a sulfonated GO and in high glucose yield of 45% after 8 h at 130 °C with an Avicel cellulose/catalyst weight ratio of 1. One can underline that all the cited studies dealing with GO-based catalysts underlined the unique role of the functionalized 2D carbon sheet in adsorbing soluble β 1-4 glucan and even cellulose. Again, one can remark that the nature and the acid strength of the active sites are not clearly addressed.
In the above reported publications, qualitative information on the chemical nature of the potential acid sites are provided by FTIR of GO in KBr pellets and/or by XPS. With regards to quantitative data, they are deduced from S chemical analysis and titrations after Na+ exchanges. Surprisingly, one can note the absence of data obtained from the usual methods based on the adsorption of probe basic molecules (pyridine/ammonia) monitored by FTIR or calorimetry to characterize the nature (Br∅nsted/Lewis), the strength, and the amount of acid sites. Indisputably, this would contribute to clarifying the role of oxygenated groups as effective acid sites with regards to their accepted role in β 1-4 glucan adsorption.
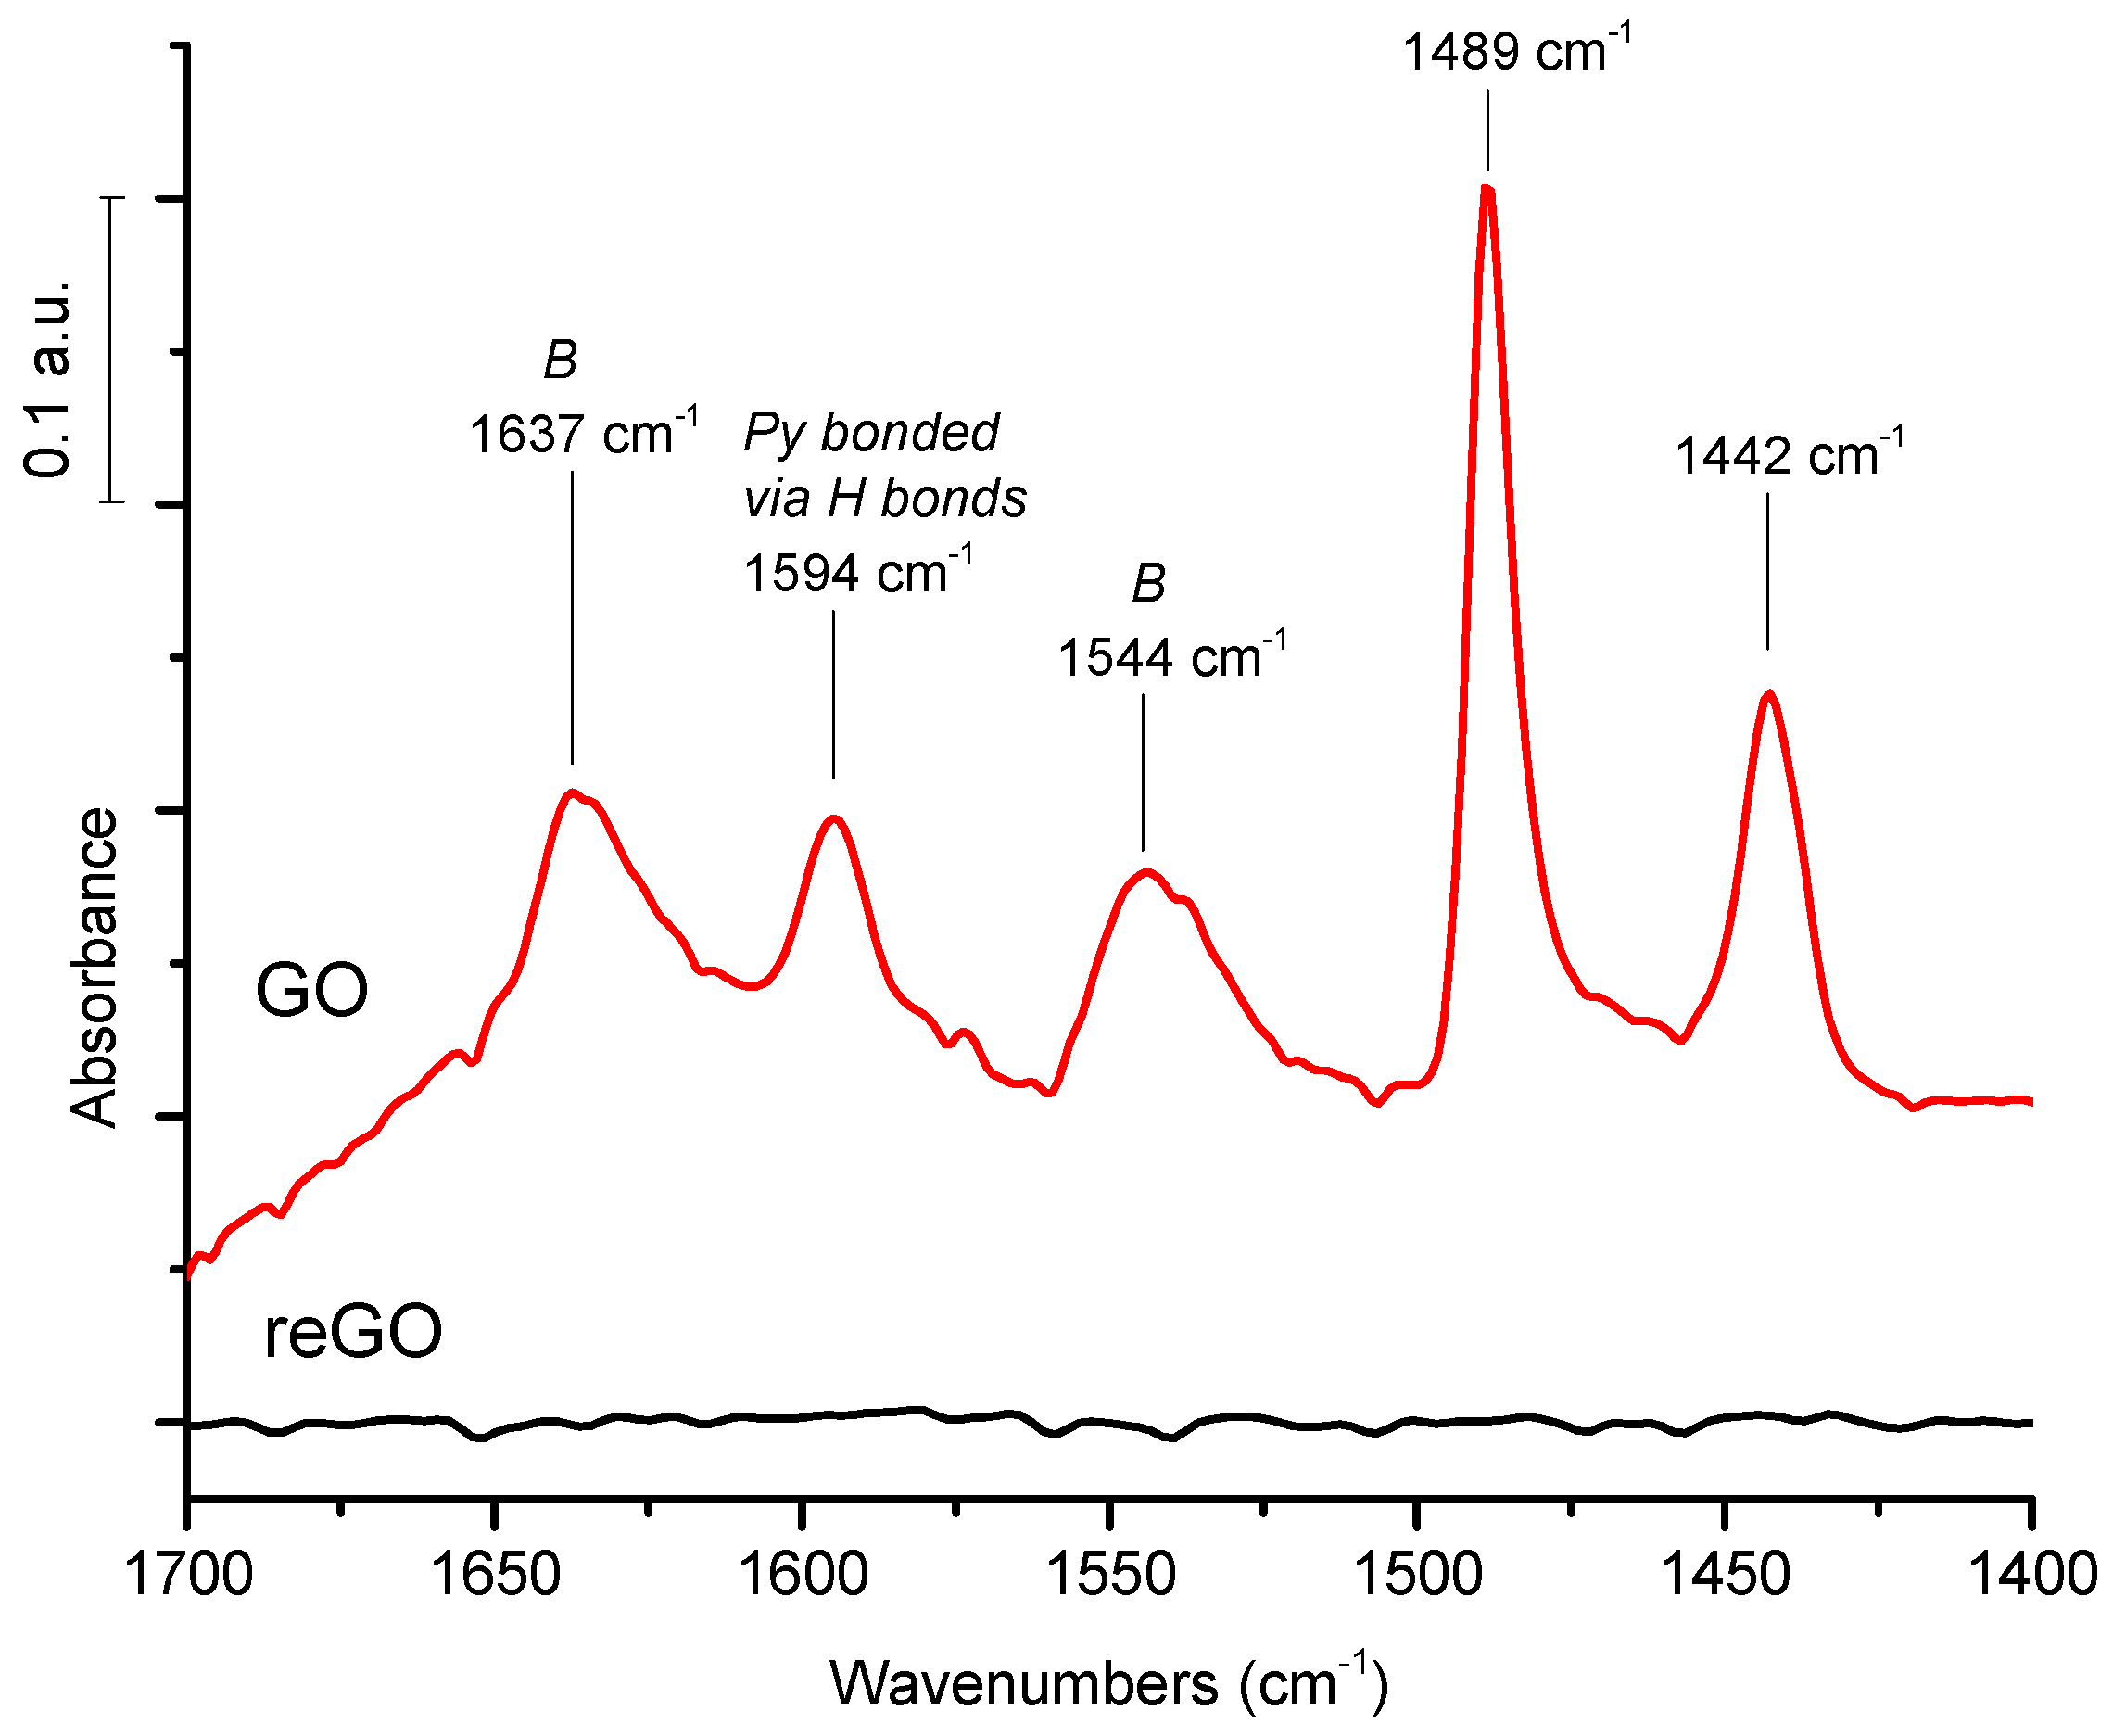
In this article, we measured the acid strength of graphene-based materials, GO prepared by Hummer’s method, and reduced GO prepared by calorimetry of NH3 adsorption. The nature of the acid sites is studied by FTIR of pyridine adsorption/desorption. In parallel, their catalytic performances for cellulose hydrolysis and hydrogenolysis using GO combined with Pt were evaluated. Very strong acid sites are probed on graphene oxides by calorimetry with heats of NH3 adsorption as high as 200 kJ/mole, while reduced graphene oxide has a very weak acid surface. The FTIR of pyridine adsorption shows the prevailing presence of Br∅nsted acid sites and a peculiar feature: the presence of pyridine coordinated by hydrogen bonds. This exceptionally strong Br∅nsted acidity is tentatively explained by the presence of graphene domains made of intact sp2 carbon decorated by hydroxyl, carboxylic, or sulfonated groups in the GO sheets, resulting in high mobility of the negative charges borne by the oxygenated groups within the graphene sheet of high conductivity, which makes the proton weakly retained, explaining its strong acidity. In parallel, we examined the catalytic activity of GO and reduced GO. In agreement with their acidic features, only GO is active and selective for native cellulose hydrolysis in glucose conversely to reduced GO. Finally, we failed to directly produce sugar alcohols from cellulose using a combination of GO with Pt/reduced GO under hydrogen pressure, explained by the reduction of oxygenated functions of GO which cancel out its acidic properties.

2. Results

2.1. Structure of As-Synthesized GO: XRD and Raman Spectroscopy

The XRD pattern of the as-synthesized material is typical of GO: the initial graphite precursor, exfoliated graphite, has a main diffraction peak at 26.5° (2θ) which corresponds to an interlayer spacing of 3.3 Å, while GO presents a diffraction peak at 10.7° (2θ), indicating enlarged interlayers of 8.3 Å, as expected upon oxidation (Figure S1). Similarly, the Raman spectrum of the as-synthesized GO is as expected, with the rise of the D peak at 1350 cm−1 upon oxidation of the graphite precursor in addition to the G band observed at 1598 cm−1 (Figure S2). Let us recall that the G band is ascribed to in-plane sp2 carbon vibrations while the D band is ascribed to defective sp3 carbons. The Raman spectra modification, the rise of the D band, and the broadening of the D and G bands might indicate that, upon oxidation, parallel to defective sp3 carbon creation, the sp2 domains might be reduced in size as previously suggested [11].

2.2. FTIR Study of the Functionnal Groups of GO and Reduced GO

FTIR spectrum of GO shows intense absorption in the νOH wavenumber range, 3000–3600 cm−1 together with other absorption bands between 800–1800 cm−1 (Figure 1). The vibrations observed between 3000–3600 cm−1 are characteristic of νOH vibrations of the material hydroxyl groups or the remaining adsorbed water molecules. The other broad absorption centered around 1200 cm−1 might involve vibrations ascribed to SO3H groups. The assignment of the two other thinner vibrations at 1778 cm−1 and 1583 cm−1 remains rather controversial in the literature: the former band around 1780 cm−1 was either ascribed to CO stretching of COOH groups [10,11] or to the bending mode of protonated water clusters [15], while the latter, observed here at 1583 cm−1 on the GO dehydrated 2 h at 150 °C, was attributed as well to νC=C ring vibrations or to adsorbed water molecules [16]. By contrast, the FTIR spectrum of reduced GO shows a strong reduction of the intensity of all the functional groups. Only the absorptions between 1000 and 1800 cm−1 are still detected (Figure 1).

2.3. Acidic Properties of GO and reGO Determined by Adsorption of Pyridine and Ammonia Monitored by FTIR and Calorimetry

The adsorption of pyridine followed by FTIR is the most reliable and usual method to differentiate the nature of acidic sites, Br∅nsted vs. lewis acid sites, from the vibration frequencies of the adsorbed pyridinium species.
Pyridine adsorption on GO pretreated at ambient T for 1 h and further vacuum treated for 1 h at ambient T resulted in the appearance of bands at 1544 cm−1 and 1637 cm−1 typical of pyridinium species vibrations indicating the presence of Br∅nsted acid sites (Figure 2). Bands due to pyridine coordinated to Lewis acid sites or physisorbed pyridine are observed at 1442 cm−1. The intense thin absorption band at 1489 cm−1 is common as well to Br∅nsted and Lewis acid sites. An additional band, observed at 1594 cm−1, can be ascribed to pyridine retained by hydrogen bonding [17]. Over reGO, investigated in the same conditions, one cannot detect pyridine species (Figure 2), in agreement with the low number of functional groups. However, one can remark that the technique used to investigate GO and reGO consists of grafting low amount of GO (reGO), <5 mg, on a Si plate. This might prevent the observation of weak absorption and might explain discrepancies with the calorimetry experiments (described later) done over approximately 100 mg of sample, which is by far more reliable.
In an attempt to eliminate physisorbed pyridine species and to check the presence of Lewis acid sites, pyridine adsorption is performed on GO treated under vacuum at 150 °C and further elimination of physisorbed pyridine species via a vacuum treatment at 150 °C for 0.5 h (Figure 3a). Under these conditions, a peculiar spectrum is observed, with a broad absorption band centered at 1580 cm−1 which can be ascribed to pyridine species retained by hydrogen bonding. Besides, the relative intensities of the two bands at 1435 cm−1 or at 1487 cm−1 are strongly reduced, suggesting the quasi absence of Lewis acidity. Quite similar features are observed when GO, first treated at ambient T, saturated with pyridine, and further vacuum treated at 150 °C (Figure 3b). A spectrum dominated by the broad vibration around 1587 cm−1, ascribed to H-bonded pyridine, is also observed. Again, reGO pretreated at 150 °C does not retain pyridine. To our knowledge, this study is the first to provide direct proof of the Br∅nsted acidity of GO by FTIR of Py adsorption in addition to the occurrence of pyridine species retained by hydrogen bonding. These latter species are the main ones after treatment under vacuum at 150 °C.
To provide a complete description of the acidity of GO and reGO, calorimetry of ammonia adsorption was performed in order to measure the acid strength via the measure of differential heat of ammonia adsorption. The calorimetric analyses were performed over Go and reGO vacuum treated at 150 °C (Figure 4).
The calorimetric curve obtained on GO provides two main pieces of information: (1) the presence of an extended quasi-plateau due to numerous acid sites, 1.1 mmol NH3/g, of homogeneous acid strength and (2) the value of the medium heat of ammonia adsorption at half NH3 coverage being very high, approximately 200 kJ/mol (Figure 4). This value is characteristic of acid sites of very high strength, similar to that measured on 12-tungstophosphoric acids (H3PW12O40 or Cs2HPW12O40), described as superacids [18,19]. One can observe that reduced GO presents, by far, a weaker acidic surface with few acid sites: approximately 0.1 mmol/g, characterized by differential heats of ammonia adsorption between 100 kJ/mol and 80 kJ/mol, the barrier value between chemisorption and physisorption. The calorimetric curve of reGO is in agreement with the FTIR spectra which show the quasi elimination of the functional groups upon reduction of GO. However, reGO has sites, approximately 0.4 mmol/g, capable of retaining NH3 by physisorption (with heat below 80 kJ/mol).
These complementary analyses, FTIR, and calorimetry of basic probe molecule adsorption have provided evidences of the Br∅nsted acidity of GO in addition to its ability to retain pyridine by hydrogen bonding while Lewis acid sites are almost absent. Moreover, calorimetric data bring evidence that the acid strength of GO is at the level of superacids. On the other hand, reduced GO, with few functional groups, has a low acidity but the reGO surface is shown by calorimetry to retain a significant amount of ammonia by physisorption.

2.4. Kinetic of Cellulose Hydrolysis-Hydrogenolysis Catalyzed by GO and ReGO

GO was first evaluated as an acid catalyst for the hydrolysis of cellulose at 190 °C under Ar atmosphere.
The evolution of the product yields with time, presented in Figure 5, shows the rapid and selective formation of glucose in high yield and selectivity, respectively, 27% and 57%, after 0.5 h of reaction. Rapidly, after 1.5 h, one can observe the increased formation of soluble polymers, which become the dominant fraction at the expense of small molecules detected by HPLC. This suggests that these soluble polymers are formed by condensation of small molecules, probably furanics. Indeed, it is observed that 5-(hydroxymethyl)furfural (5-HMF), levulinic acid, and formic acid are formed at the expense of glucose with progress of the reaction.
One can see also a decrease of the total soluble products for prolonged reaction time, probably due to formation of solid products.
These initial high yield and selectivity in glucose are among the best performances for a heterogeneous catalyst as reported in the introduction section. Glucose yields between 30% and 50% were previously reported using GO and cellulose in quantitative amounts and at lower T and/or longer reaction times [7,10,11]. Since it is always difficult to compare the data in this field because of the strong influence of the cellulose origin, its pretreatment and the catalyst/cellulose/solvent ratio, we compared the hydrolysis ability of GO to that of a water insoluble heteropolyacid, Cs2HPW12O40, which has a similar strong acid strength, characterized also by heat of NH3 adsorption of 200 kJ/mol [19].
The kinetic of cellulose hydrolysis, catalyzed by Cs2HPW12O40 (Figure S3), shows that the heteropolyacid is as active as GO for cellulose liquefaction. However, the heteropolyacid is by far less selective in glucose than GO, leading mainly to the formation of soluble polymers with a limited formation of small molecules. Similarly, a decrease of the total amount of liquefied products is observed with reaction time, which is also explained by the formation of solid products.
In agreement with the literature, these kinetic data underline the peculiar activity and selectivity of GO for cellulose hydrolysis into glucose which appears not only correlated to its high acid strength. It was previously suggested by many authors that soluble carbohydrates and even cellulose might be adsorbed preferentially on the GO sheet, which can cause β1-4 glycosidic bond angle changes, and makes its cleavage easier [6,10,11]. The observed high glucose yield from cellulose hydrolysis over GO by comparison to the heteropolyacid in addition to the unusual formation of pyridine retained by hydrogen bonding on the GO surface reinforces the hypothesis put forward concerning the beneficial role of the adsorption of solubilized carbohydrates by GO to ensure a high glucose yield. We can also propose that, thanks to the depolymerized sugar adsorption on the GO sheet, this might prevent their deeper transformation in polymers (Scheme 1).
By contrast to GO, reGO is not efficient in the transformation of cellulose under the same conditions, 190 °C and Ar atmosphere (Figure 6). The rate of cellulose liquefaction in the presence of reGO is slow with regards to GO and is comparable to the catalyst-free experiment (Figure S4). The main product is 5-HMF, for which formation is promoted by hot water alone in parallel to a progressive increase of the formation of soluble polymers, most likely derived from the 5-HMF and also catalyzed by hot water at 190 °C. The low reactivity of reGO with regards to GO can be correlated to the lack of acidity of reGO, a consequence to the quasi absence of functional groups.
In face of the excellent activity of GO to transform cellulose into glucose, we attempted to combine GO with Pt in order to promote the one pot cellulose transformation into sugar alcohol via intermediate glucose formation, which would also help to prevent the successive formation of soluble polymers.
It was not possible to disperse a Pt precursor and to perform a subsequent high-temperature reduction under hydrogen flow without proceeding to reduction of the functional groups of GO, which would result in acidity decrease. Thus, we chose to use a mixture of Pt/reGO and GO to perform the cellulose hydrolysis-hydrogenation under hydrogen atmosphere. The results presented in Figure 7, without sorbitol formation, are not the expected one. The main products are ethylene glycol (EG), propylene glycol (PG), dihydroxyacetone, and hexanedione, with a maximum yield of 8% for PG. This indicates that, under these conditions, the intrinsic acidity of GO is not maintained, accounting for probable reduction of the GO functional groups also under the reductive reaction conditions.

3. Materials and Methods

3.1. Materials

Sulfuric acid 95–97%, Potassium permanganate (≥99.0%), sodium nitrate (≥99.0%), hydrogen peroxide (30% in water), hydrochloric acid (37% in water), hydrazine hydrate (80% in water), H2PtCl6, 6H2O (99%), and ethylene glycol (99.8%) were purchased from Sigma-Aldrich. Expanded graphite, used as carbon source for graphene oxide, was purchased from SGL Group.
Commercial cellulose MN 301, at standard grade, 95% of fibers with lengths 2–20 μm, and average degree of polymerization 400–500 and used as model substrate for hydrolysis reaction, was purchased from Macherey-Nagel.

3.2. Graphene Oxide and Reduced Graphene Oxide Preparation

Graphene oxide was synthesized following the modified Hummers’ method [15]; 50 mL of sulfuric acid 95% was added to a mixture of 1 g expanded graphite and 0.5 g sodium nitrate under constant stirring at room temperature. After 1 h, the temperature of the solution was cooled to less than 20 °C by ice bath; then, 3 g KMnO4 was added gradually to the solution. The mixture was stirred at 35 °C for 2 h, followed by the slow addition of 50 mL of deionized (DI) water. After stirring at 90 °C for 2 h, 5 mL of H2O2 30% was added to the mixture to ensure completion of the reaction with KMnO4. The resulting mixture was washed with 100 mL HCl 3.7% once and with DI water using centrifugation until pH 7, followed by freeze drying. The result powder was graphene oxide.
Reduced graphene oxide (reGO) was achieved from the reduction of graphene oxide by using ethylene glycol; 0.3 g of GO was dispersed in 300 mL DI water by ultrasonication for 30 min to obtain homogeneous dispersion. Then, 150 mL of ethylene glycol was added into the solution and heated in an oil bath under reflux for 24 h. After the reaction, the obtained reGO was separated by filtration and washed three times with ethanol and DI water. reGO were dried at 60 °C for 24 h to remove water content.
Platinum dispersed on reduced graphene oxide (1% Pt/reGO) was achieved from a reduction of the platinum precursor and graphene oxide using ethylene glycol; 0.3 g of GO was dispersed in 300 mL DI water by ultrasonication for 30 min to obtain homogeneous dispersion before 3 mL of H2PtCl6 solution (1 mg Pt/mL) was added to obtain 1%Pt/reGO. Then, 150 mL of ethylene glycol was added into the solution and heated in oil bath under reflux for 24 h. After the reaction, the obtained 1% Pt/reGO was filtrated and washed three times with ethanol and DI water. Pt/reGO were dried at 60 °C for 24 h to remove water content.

3.3. Physicochemical Characterization of Catalysts

The FTIR spectra were recorded with a Brucker Vector 22 spectrometer in the absorption mode with a resolution of 2 cm−1. GO and reGO samples were dispersed in water and spread on an inert infrared transparent silicon holder. For pyridine adsorption monitored by FTIR, the GO and reGO samples were also dispersed on a silicon plate and placed in an IR cell equipped with CaF2 windows. The samples were treated at ambient temperature or at 150 °C under vacuum. Pyridine was adsorbed under saturation vapor pressure at ambient temperature and then desorbed at ambient temperature or at 150 °C in order to remove the physisorbed Py species.
The acidic strength and the number of acid sites of the catalyst were characterized by NH3 adsorption at 80 °C using a TianCalvet calorimeter. The samples were placed in the glass cell and pretreated at 150 °C for 3 h under secondary vacuum and then, placed into the calorimeter up to the stabilization of the temperature (80 °C, one night). After that, the sample was contacted with successive small doses of NH3 vapor while the differential enthalpies of NH3 adsorption were recorded.

3.4. Catalytic Tests

The reaction conditions are as follow: 1.6 g of native cellulose, 0.34 g or 0.68 g of catalysts and 65 mL of water were introduced in a 100 mL Paar Hastelloy autoclave equipped with a Rushton turbine under auto pressure at 190 °C. The autoclave was purged with He and heated. The starting time is the time when temperature reached 190 °C. After the period reaction time, 2 mL of samples was taken out for kinetic analysis. The samples were filtrated over polyvinylidene difluoride (PVDF) filter (0.45 μm). All products in liquid phase were analyzed by a HPLC-RID system using COREGEL 107H column.
The total mass of carbon in the liquid phase (solubility) was determined by a Shimadzu TOC-VSCH analyzer [17,18]:
Solubility   ( % ) = 100 × mg   C liquid   phase mg   C initial   cellulose
in which mg Cliquid phase: mg of carbon contents in liquid phase, obtained from the total soluble organic carbon (TOC) analysis, in mg of carbon and mg Cinitial cellulose: mg of carbon contents in the initial cellulose
The carbon yields of the products were calculated as the moles of the product i detected by HPLC and the initial glucosyl units in the initial cellulose, corrected by the number of carbon atoms:
Yield i   ( % ) = 100 × ( nC i 6 ) × ( n i nC glucose   unit )
in which nCi: number of carbon atoms in the product i; ni: number of moles of the product i determined by the HPLC analysis; and nglucosyl units: initial number of moles of glucosyl units in the cellulose sample = mcellulose/162.
The yield of soluble oligosaccharides and polymers (SP) was determined from subtraction from the solubility analyzed by TOC to the sum of products analyzed by HPLC:
yieldSP (%) = solubility (%) − Σyieldi (%)

4. Discussion and Conclusions

The catalytic results reported here confirm that GO acts as an excellent solid acid catalyst for cellulose hydrolysis into glucose. As recalled in the Introduction section, there is a general agreement to correlate the GO unique catalytic performances to its ability to adsorb carbohydrates but the origin of its acidity remains unclear. We believe that this article is a contribution which brings new insights into the origin of the acidity of GO. The specificity of GO prepared by Hummer’s method implies that sulfonated groups are present in the as-synthesized GO in addition to carboxylic and hydroxyl groups or lactones since sulfuric acid is one of the reactants used to oxidize the graphite precursor. In this paper, we disclose by calorimetry of NH3 adsorption the presence of very strong acid sites on GO with heat of NH3 adsorption as high as 200 kJ/mol, a value similar to that measured on heteropolyacids, H3PW12O40 or Cs2HPW12O40, reported as superacids [18,19]. It is clear that the acidity of GO is significantly higher than that developed by sulfonic groups borne by a classical carbonous matrix such as sulfonated acidic resins (Amberlyst-15) or usual sulfonated carbons characterized by the lower heat of ammonia adsorption of approximately 140 kJ/mol [15,20]. Besides, it is shown here that reGO has a weak acidic surface capable of retaining NH3 rather by physisorption than chemisorption. FTIR of pyridine adsorption shows the prevailing presence of Br∅nsted acid sites and a peculiar feature of GO, the presence of pyridine retained on the surface by hydrogen bonding. Since reGO is not capable of retaining pyridine species in good agreement with the calorimetric results and since the surface of reGO is shown by FTIR to be depleted from most of the functional groups, it seems reasonable to propose that the strong acidity of GO originated from a synergy between the 2D carbon sheet of GO and the oxygenated functional groups. We tentatively explain the exceptional strong Br∅nsted acidity of GO by drawing inspiration from what we know about the origin of the superacidity of heteropolyacids [21,22], i.e., the existence of negative charge delocalization on the surface of large Kegging anions which makes the protons weakly retained. By similitude, we propose that, within the GO sheet, graphene sp2 carbon domains decorated with hydroxyl, carboxylic, or sulfonated groups exist and result in high mobility of the negative charges of the functional groups within the graphene domain, which makes the protons free and explains their strong acidity (Scheme 2).
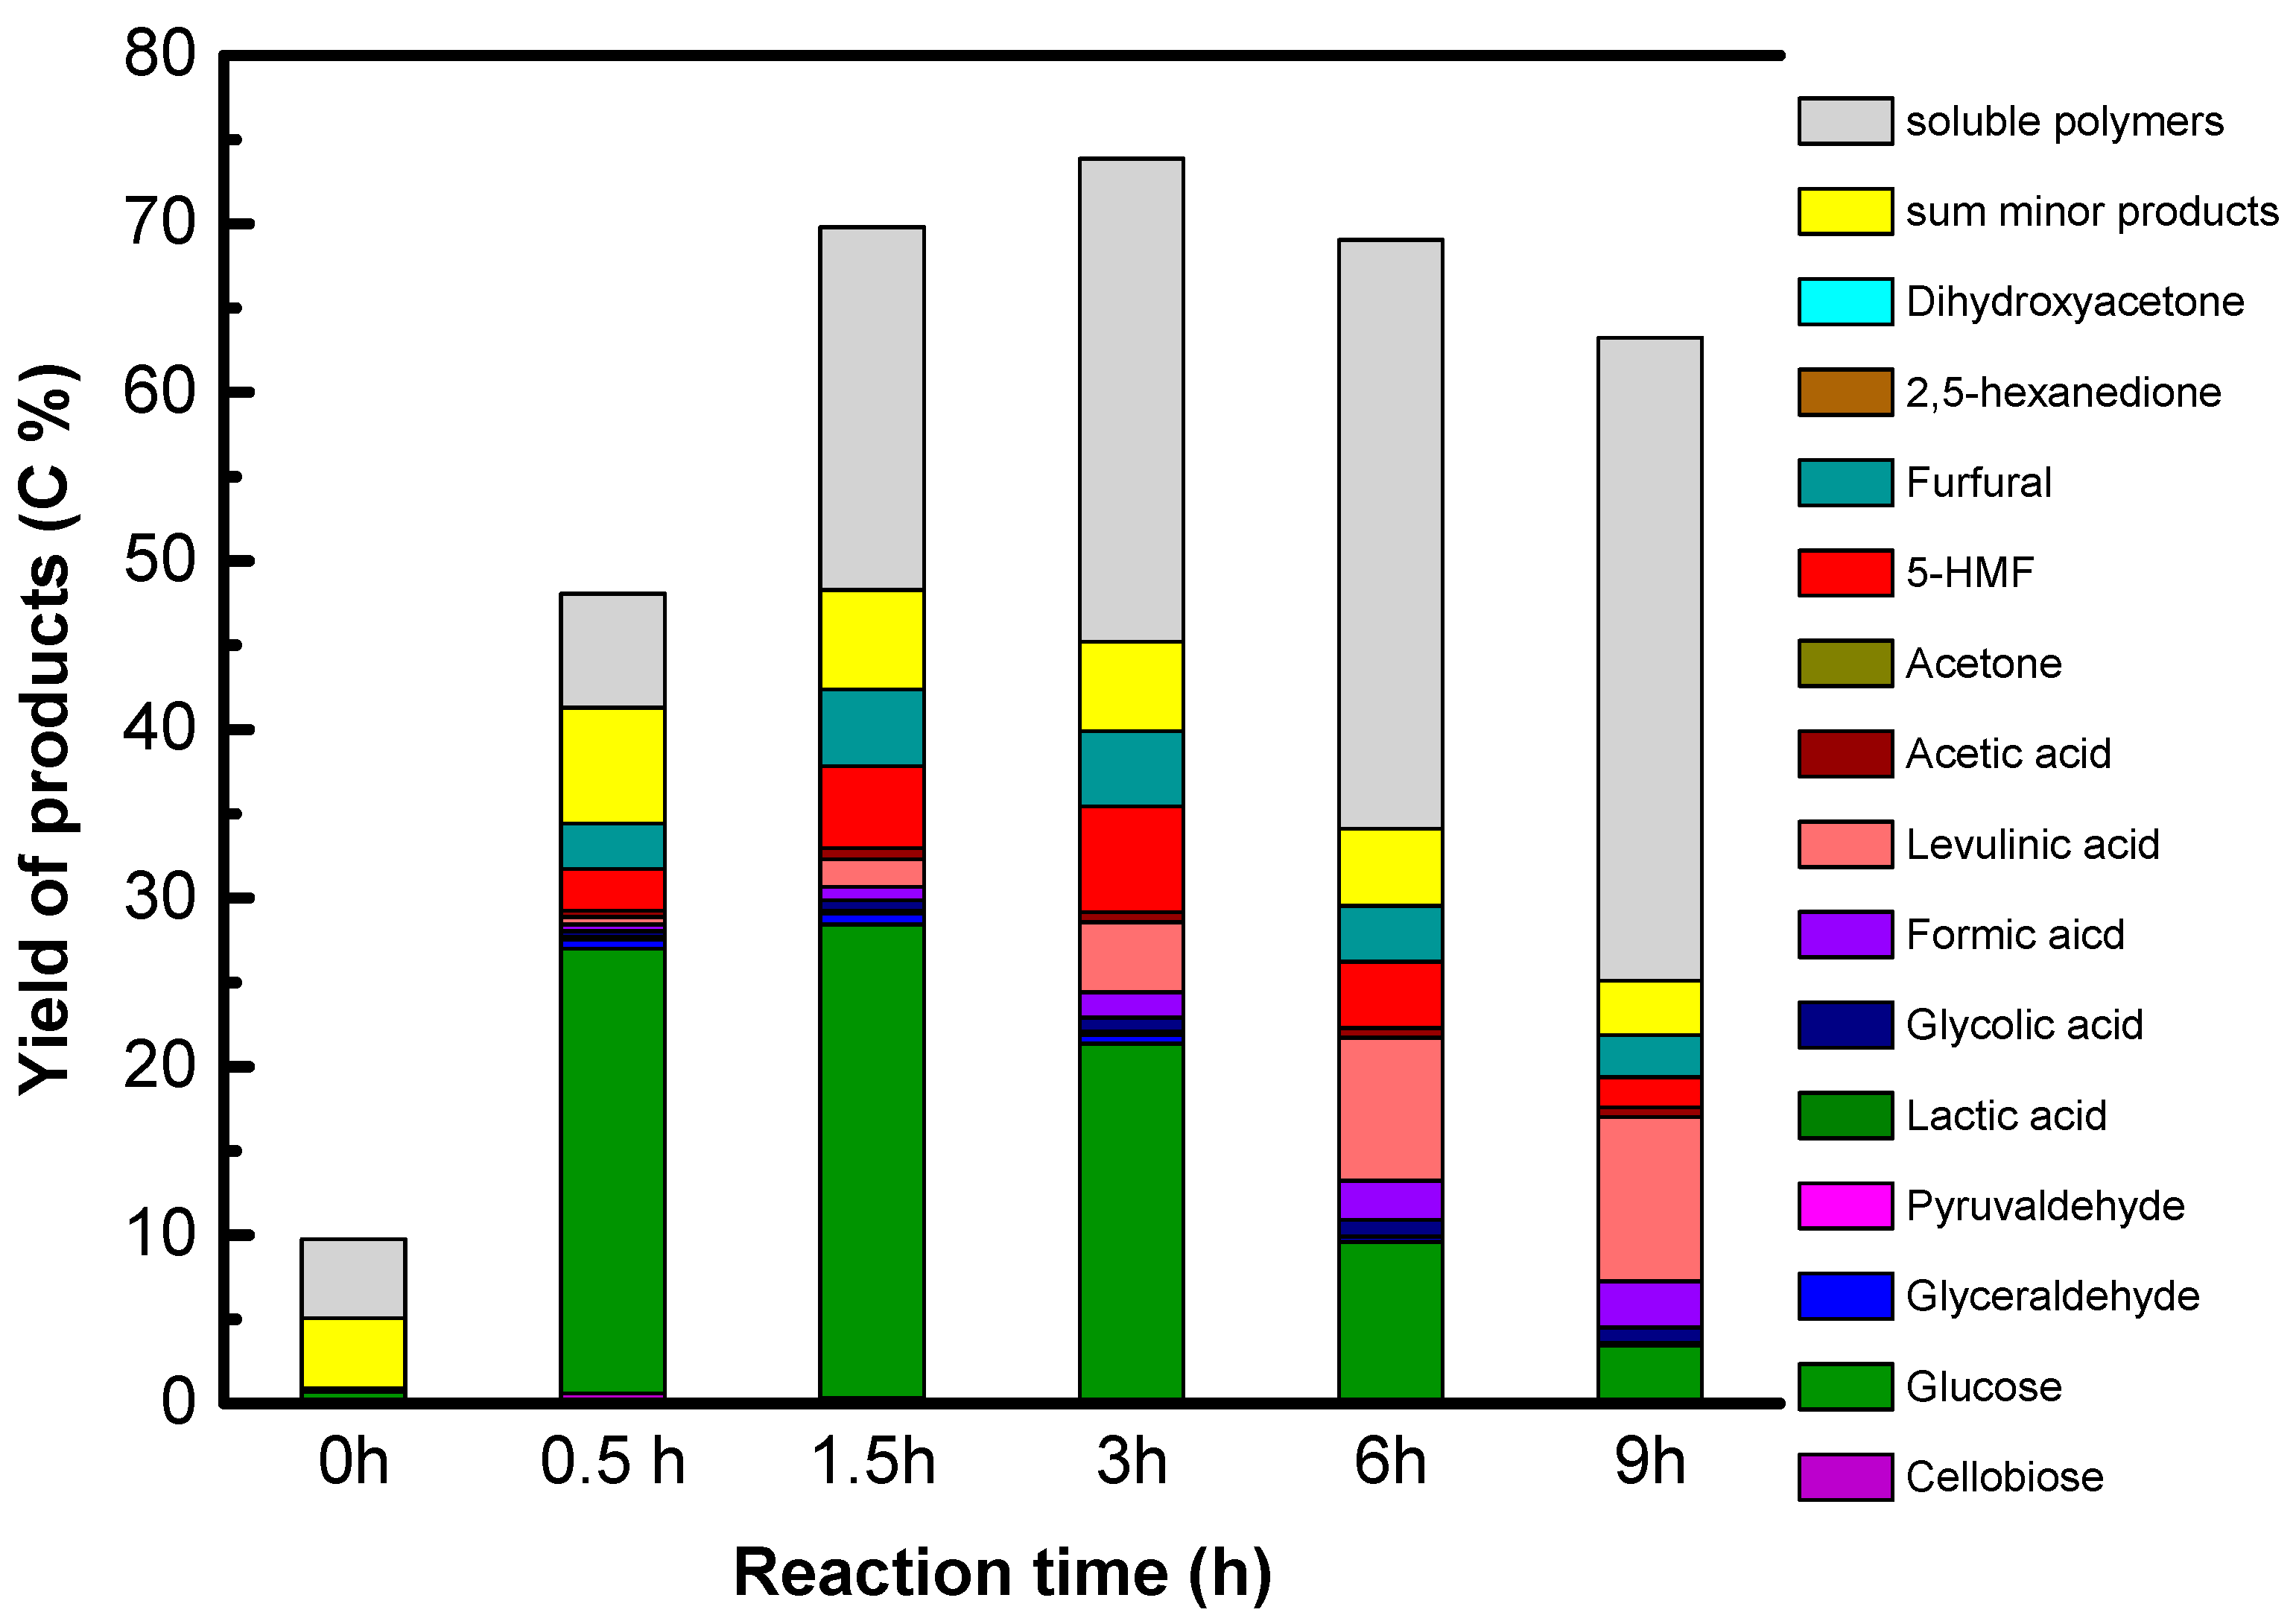
Accordingly, only GO is active and selective for native cellulose hydrolysis leading selectively to glucose in high yield, 27%. However, we show that sugar alcohols cannot be formed directly from cellulose using GO combined with a metallic function under hydrogen, explained by the reduction of the oxygenated functions of GO which are essential for GO acidity. The instability of the acid functions of GO in a reducing atmosphere is the weak point of this singular solid acid.

Supplementary Materials

The following are available online at https://www.mdpi.com/2073-4344/10/12/1393/s1. Figure S1: XRD patterns of (a) the exfoliated graphite precursor, (b) GO; Figure S2: Raman spectra of (a) exfoliated graphite precursor (b) GO; Figure S3: Kinetic of celllulose hydrolysis in liquid products catalyzed by Cs2HPW12O40. Reaction conditions: T = 190 °C, p~11at, mcatalyst = 0.68 g, mcellulose = 1.6 g, mwater = 65 g, Ar Atm; Figure S4: Kinetic of celllulose hydrolysis in liquid products in the absence of catalyst. Reaction conditions: T = 190 °C, p~11at, mcellulose = 1.6 g, mwater = 65 g, Ar Atm.

Author Contributions

Investigation, V.C.N. and S.K.; analysis training and supervision, A.D. and M.E.; writing—original draft preparation, N.E.; writing—review, V.C.N.; all supervision, T.T.H.V. and N.E.; funding acquisition, T.T.H.V. and N.E. All authors have read and agreed to the published version of the manuscript.

Funding

The authors gratefully acknowledge the financial supports from the Ministry of Industry and Trade (MOIT) in Vietnam through the contract No. 102.19 DT.BO/HD-KHCN.

Acknowledgments

The authors acknowledge the scientific and technical services of IRCELYON for their contributions.

Conflicts of Interest

The authors declare no conflict of interest.

References

  1. Onda, A.; Ochi, T.; Yanagisawa, K. Selective hydrolysis of cellulose into glucose over solid acid catalysts. Green Chem. 2008, 10, 1033. [Google Scholar] [CrossRef]
  2. Suganuma, S.; Nakajima, K.; Kitano, M.; Yamaguchi, D.; Kato, H.; Hayashi, S.; Hara, M. Hydrolysis of cellulose by amorphous carbon bearing SO3H, COOH, and OH groups. J. Am. Chem. Soc. 2008, 130, 12787. [Google Scholar] [CrossRef] [PubMed]
  3. Foo, G.S.; Sievers, C. Synergistic Effect between Defect Sites and Functional Groups on the Hydrolysis of Cellulose over Activated Carbon. ChemSusChem 2015. [Google Scholar] [CrossRef] [PubMed]
  4. Zhao, X.; Xu, J.; Wang, A.; Zhang, T. Porous carbon in catalytic transformation of cellulose. Chin. J. Catal. 2015, 36, 1419. [Google Scholar] [CrossRef]
  5. Chen, P.; Shrotri, A.; Fukuoka, A. Unraveling the hydrolysis of β-1,4-glycosidic bonds in cello-oligosaccharides over carbon catalysts. Catal. Sci. Technol. 2020, 10, 4593. [Google Scholar] [CrossRef]
  6. Wei, Z.; Yang, Y.; Hou, Y.; Liu, Y.; He, X.; Deng, S. A New Approach Towards Acid Catalysts with High Reactivity Based on Graphene Nanosheets. ChemCatChem 2014, 6, 2354. [Google Scholar] [CrossRef]
  7. Zhao, X.; Wang, J.; Chen, C.; Huang, Y.; Wang, A.; Zhang, T. Graphene oxide for cellulose hydrolysis: How it works as a highly active catalyst? Chem. Commun. 2014, 50, 3439. [Google Scholar] [CrossRef]
  8. Yang, Z.; Huang, R.; Qi, W.; Tong, L.; Su, R.; He, Z. Hydrolysis of cellulose by sulfonated magnetic reduced graphene oxide. Chem. Eng. J. 2015, 280, 90. [Google Scholar] [CrossRef]
  9. Das, V.K.; Shifrina, Z.B.; Bronstein, M. Graphene and graphene-like materials in biomass conversion: Paving the way to the future. J. Mater. Chem. 2017, 5, 25131. [Google Scholar] [CrossRef] [Green Version]
  10. Zhang, M.; Wu, M.; Liu, Q.; Wang, X.; Lv, T.; Jia, L. Graphene oxide mediated cellulose-derived carbon as a highly selective catalyst for the hydrolysis of cellulose to glucose. Appl. Catal. Gen. 2017, 543, 218. [Google Scholar] [CrossRef]
  11. Huang, L.; Ye, H.; Wang, S.; Li, Y.; Zhang, Y.; Ma, W.; Yu, W.; Zhou, Z. Enhanced hydrolysis of cellulose by highly dispersed sulfonated graphene oxide. BioResources 2018, 13, 8853. [Google Scholar] [CrossRef]
  12. Sudarsanam, P.; Zhong, R.; Van den Bosch, S.; Coman, S.M.; Parvulescu, V.I.; Sels, B.F. Functionalised heterogeneous catalysts for sustainable biomass valorisation. Chem. Soc. Rev. 2018, 47, 8349. [Google Scholar] [CrossRef] [PubMed] [Green Version]
  13. Hummers, W.S.; Offeman, R.E. Preparation of graphitic oxide. J. Am. Chem. Soc. 1958, 80, 1339. [Google Scholar] [CrossRef]
  14. Marcano, D.C.; Kosynkin, D.V.; Berlin, J.M.; Sinitskii, A.; Sun, Z.; Slesarev, A.; Alemany, L.B.; Lu, W.; Tour, J.M. Improved synthesis of graphene oxide. ACS Nano 2010, 4, 4806. [Google Scholar] [CrossRef] [PubMed]
  15. Nguyen, V.C.; Bui, N.Q.; Mascunan, P.; Vu, T.T.H.; Fongarland, P.; Essayem, N. Esterification of aqueous lactic acid solutions with ethanol using carbon solid acid catalysts: Amberlyst 15, sulfonated pyrolyzed wood and graphene oxide. Appl. Catal. Gen. 2018, 552, 184. [Google Scholar] [CrossRef]
  16. Szabo, T.; Berkesi, O.; Forgo, P.; Josepovits, K.; Sanakis, Y.; Petridis, D.; Dékany, I. Evolution of Surface Functional Groups in a Series of Progressively Oxidized Graphite Oxides. Chem. Mater. 2006, 18, 2740. [Google Scholar] [CrossRef]
  17. Pichat, P. “Contribution à L’étude de L’adsorption de L’ammoniac et de la Pyridine sur des Oxydes Isolants à L’aide de la Spectrocopie Infrarouge”. Ph.D. Thesis, University of Lyon, Lyon, France, 1966. [Google Scholar]
  18. Morin, P.; Hamd, B.; Sapaly, G.; Carneiro Rocha, M.G.; de Oliveira, P.G.; Gonzales, W.A.; Andrade sales, E.; Essayem, N. Transesterification of rapeseed oil with ethanol. I. Catalysis with homogeneous Keggin Heteropolyacids. App. Catal. Gen. 2007, 330, 69. [Google Scholar] [CrossRef]
  19. Hamad, B.; Lopes de Souza, R.O.; Sapaly, G.; Carneiro Rocha, M.G.; de Oliveira, P.G.; Gonzales, W.A.; Andrade Sales, E.; Essayem, N. Transesterification of Rapeseed Oil with ethanol over Heterogeneous Heteropolyacids. Catal. Commun. 2008, 10, 92. [Google Scholar] [CrossRef]
  20. Karaki, M.; Karout, A.; Toufaily, J.; Rataboul, F.; Essayem, N.; Lebeau, B. Synthesis and characterization of acid ordered mesoporous organosilica SBA-15: Application to the hydrolysis of cellobiose and insight into the stability of the acidic functions. J. Catal. 2013, 305, 204. [Google Scholar] [CrossRef]
  21. Okuhara, T.; Mizuno, N.; Misono, M. Catalytic Chemistry of heteropolycompounds. Adv. Catal. 1996, 41, 113. [Google Scholar]
  22. Essayem, N.; Hlmqvist, A.; Gayraud, P.Y.; Vedrine, J.C.; Taarit, Y.B. In situ FTIR studies of the protonic sites of H3PW12O40 and its acidic salts MxH3-xPW12O40. J. Catal. 2001, 197, 355. [Google Scholar] [CrossRef]
Figure 1. FTIR spectra of graphene oxide (GO) and reduced graphene oxide (reGO) vacuum treated at 150 °C for 2 h.
Catalysts 10 01393 g001
Figure 2. Pyridine adsorption on GO and reGO pretreated for 1 h at ambient T and further vacuum treatment at ambient T for 1 h.
Catalysts 10 01393 g002
Figure 3. (a) Pyridine adsorption on GO and reGO pretreated at 150 °C and further vacuum treatment at 150 °C for 0.5 h and (b) pyridine adsorption on GO pretreated at ambient T and further vacuum treatment at 150 °C for 0.5 h.
Catalysts 10 01393 g003
Figure 4. Calorimetry of NH3 adsorption on GO and reGO.
Catalysts 10 01393 g004
Figure 5. Kinetics of cellulose hydrolysis in liquid products catalyzed by GO. Reaction conditions: T = 190 °C, p~11at, mcatalyst = 0.68 g, mcellulose = 1.6 g, mwater = 65 g, and Ar Atm.
Catalysts 10 01393 g005
Scheme 1. H+ catalyzed cellulose conversion into glucose, 5-HMF, levulinic acid and formic acid with the formation of polymers as by-products.
Catalysts 10 01393 sch001
Figure 6. Kinetic of cellulose hydrolysis in liquid products catalyzed by reGO. Reaction conditions: T = 190 °C, p~11at, mcatalyst = 0.68 g, mcellulose = 1.6 g, mwater = 65 g, and Ar Atm.
Catalysts 10 01393 g006
Figure 7. Kinetic of cellulose hydrolysis-hydrogenation in liquid products catalyzed by a mixture of 1%Pt/reGO and GO (1/1) under hydrogen atmosphere. Reaction conditions: T = 190 °C, p H2 = 50 bar, mcatalyst = 0.68 g, mcellulose = 1.6 g, and mwater = 65 g.
Catalysts 10 01393 g007
Scheme 2. Proposed origin of GO strong acidity: graphene sp2 domain decorated with functional oxygenated groups with highly delocalized negative charges leading to weakly bonded protons, “free protons”.
Catalysts 10 01393 sch002
Publisher’s Note: MDPI stays neutral with regard to jurisdictional claims in published maps and institutional affiliations.

