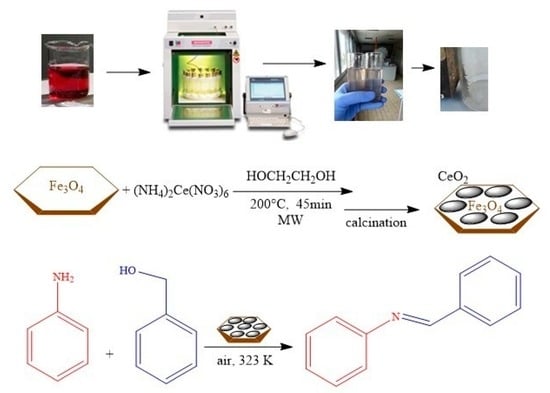
Microwave-Assisted Solvothermal Synthesis of Fe3O4/CeO2 Nanocomposites and Their Catalytic Activity in the Imine Formation from Benzyl Alcohol and Aniline

 ,
,  ,
,  , ,
, ,  and
and 
Abstract
1. Introduction
2. Results and Discussion
2.1. Synthesis of Magnetite/Ceria Nanocomposites
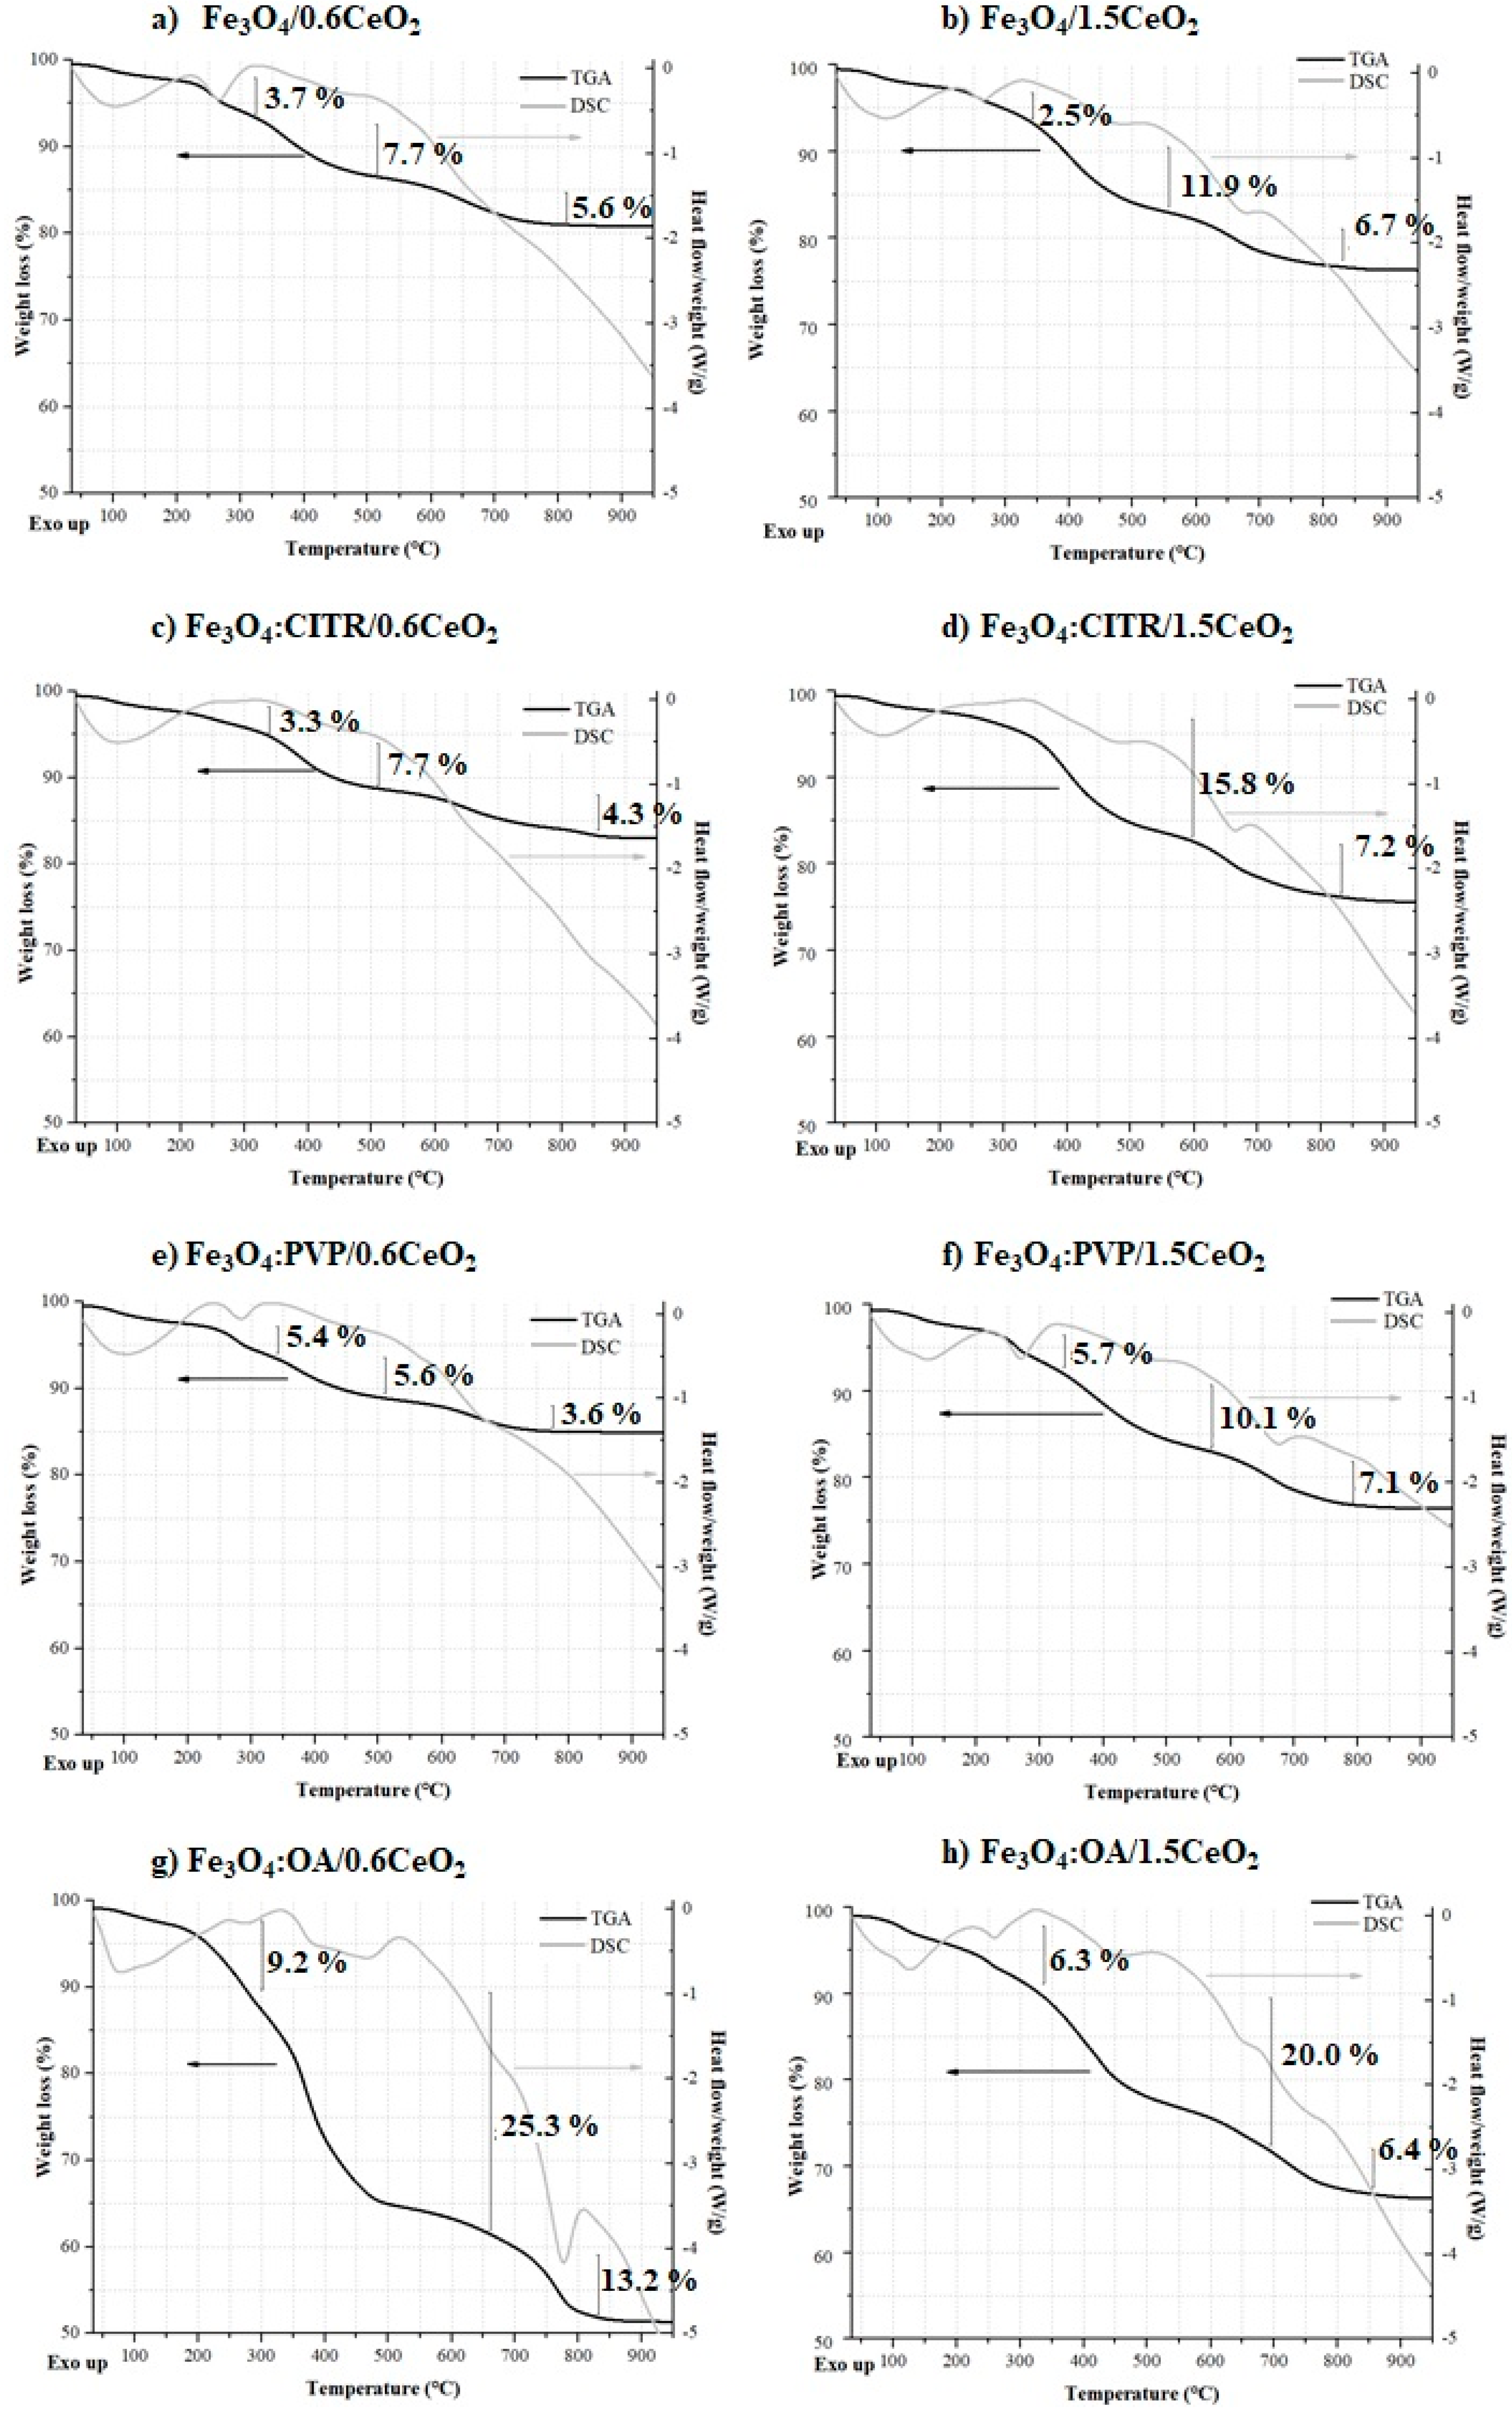
2.2. Thermogravimetric and Differential Scanning Calorimetry (TGA/DSC) Analyses
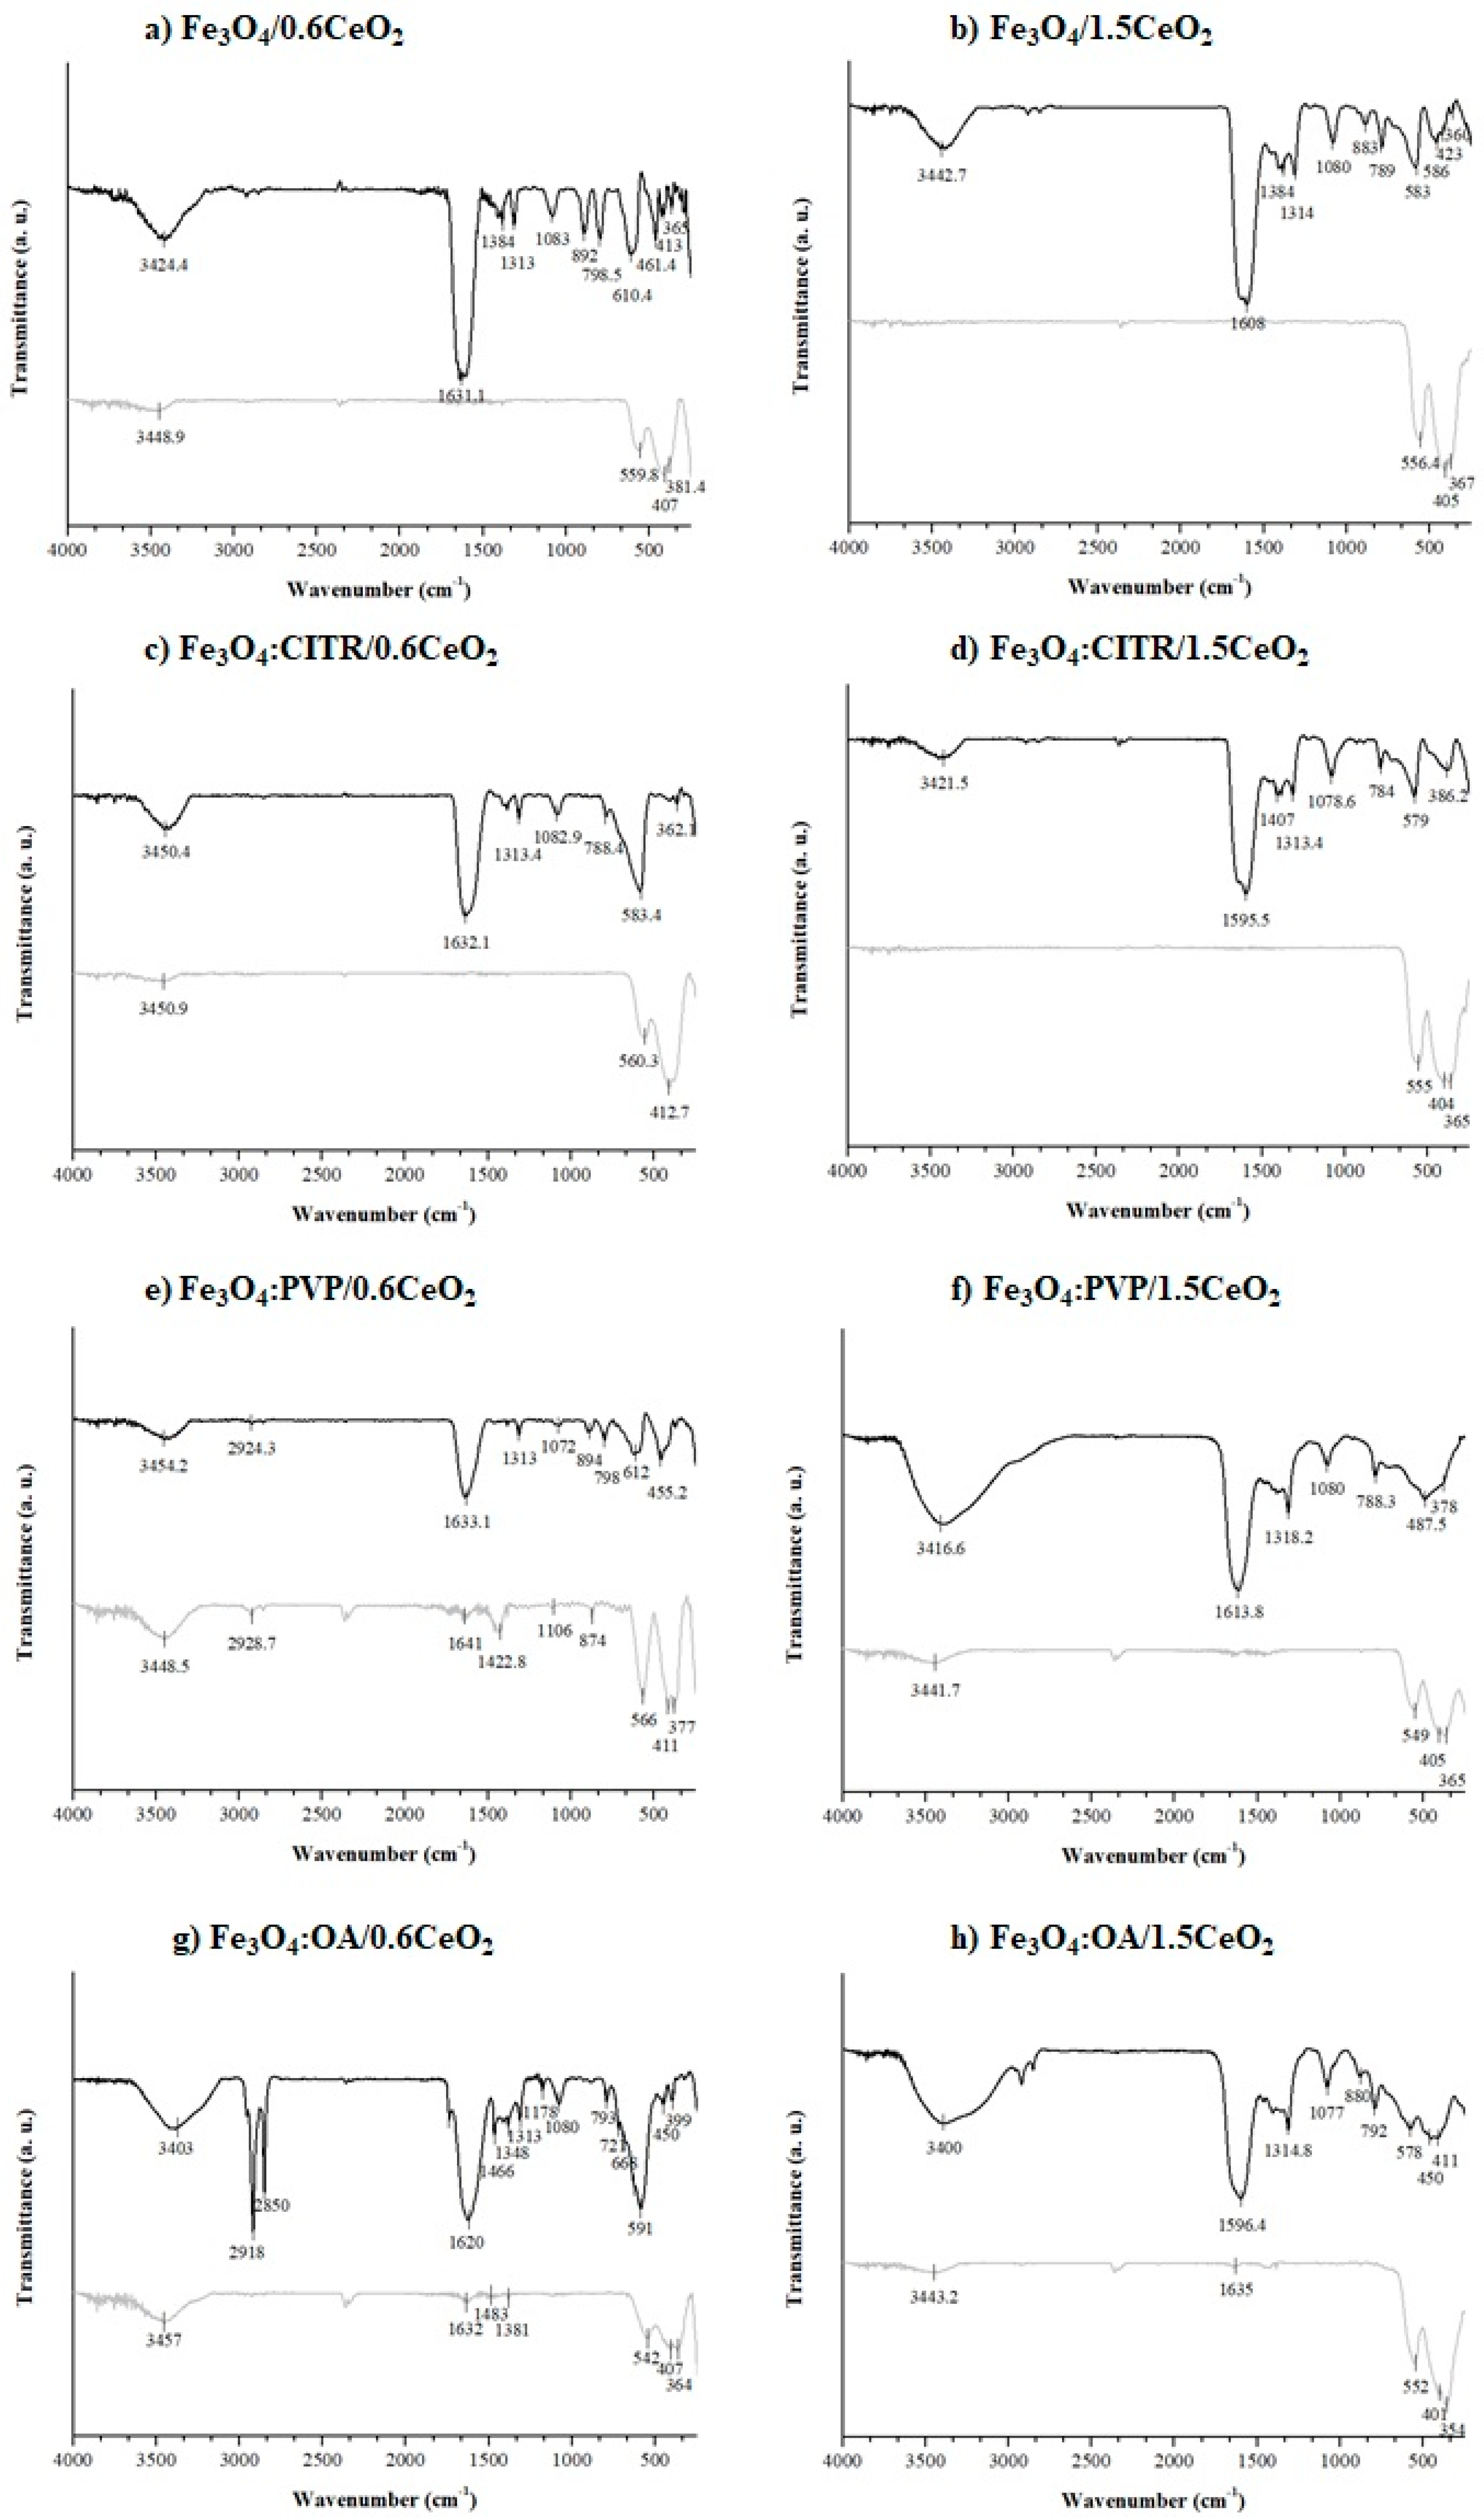
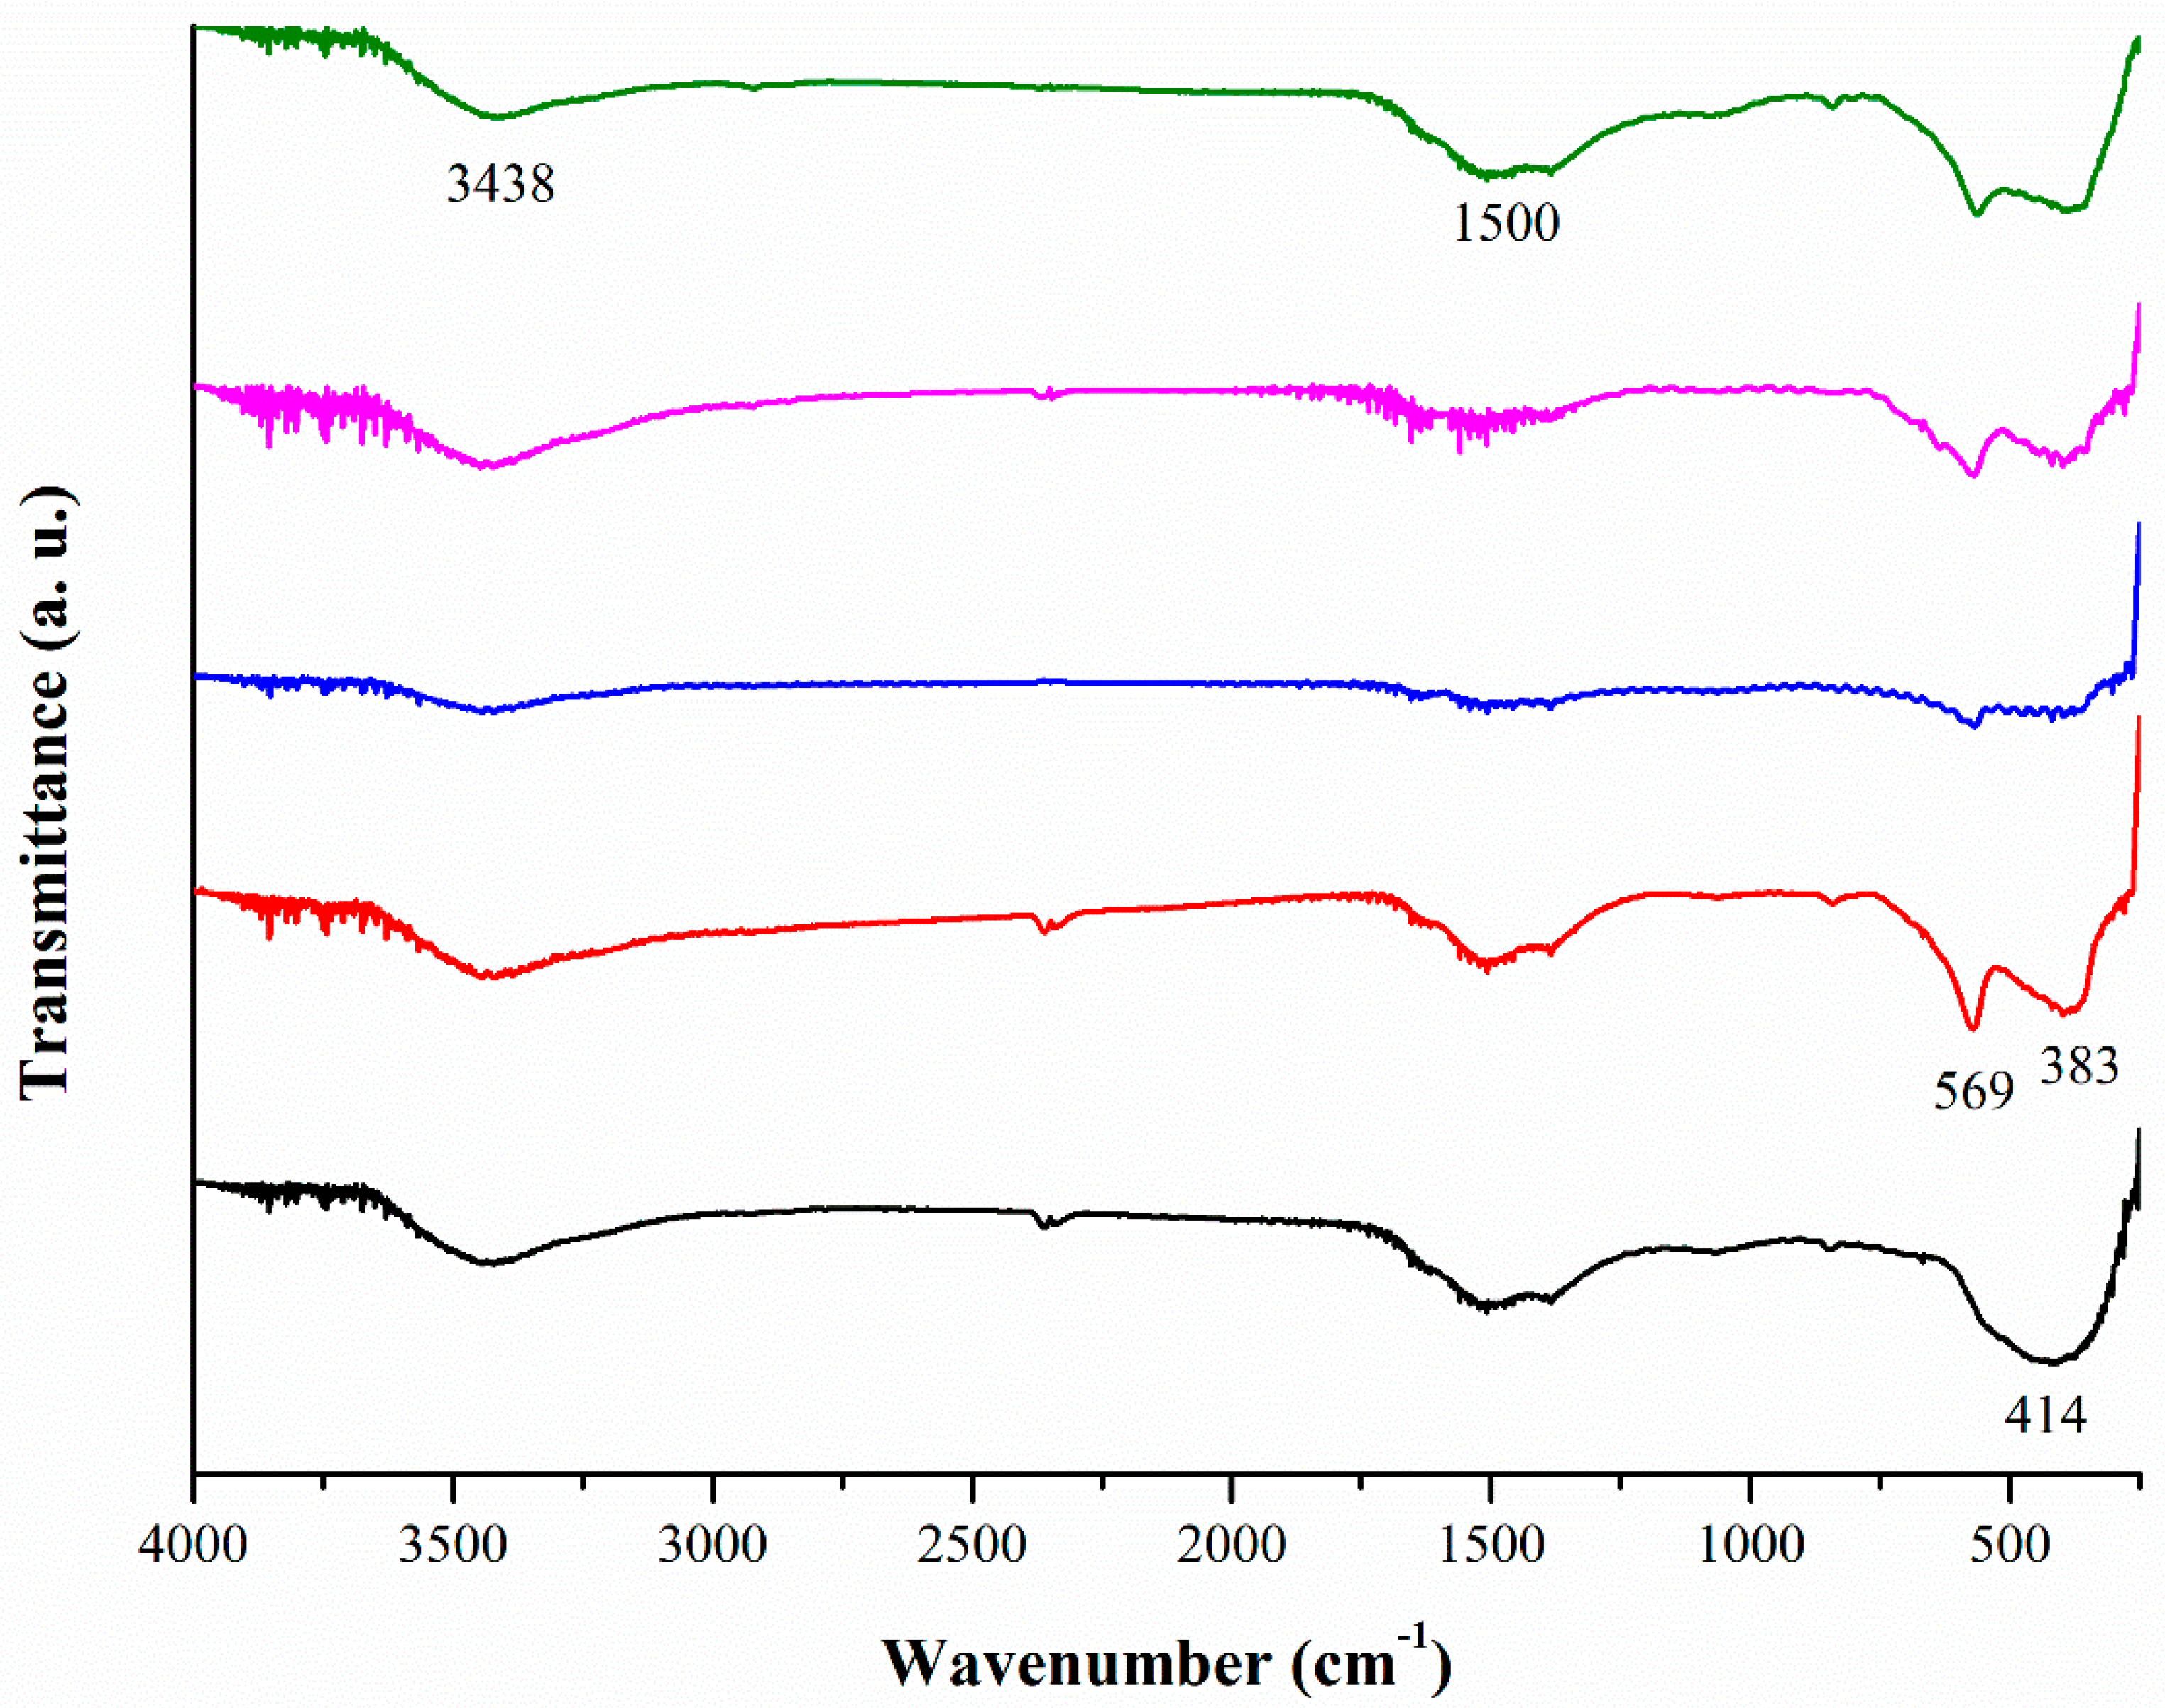
2.3. IR Analyses
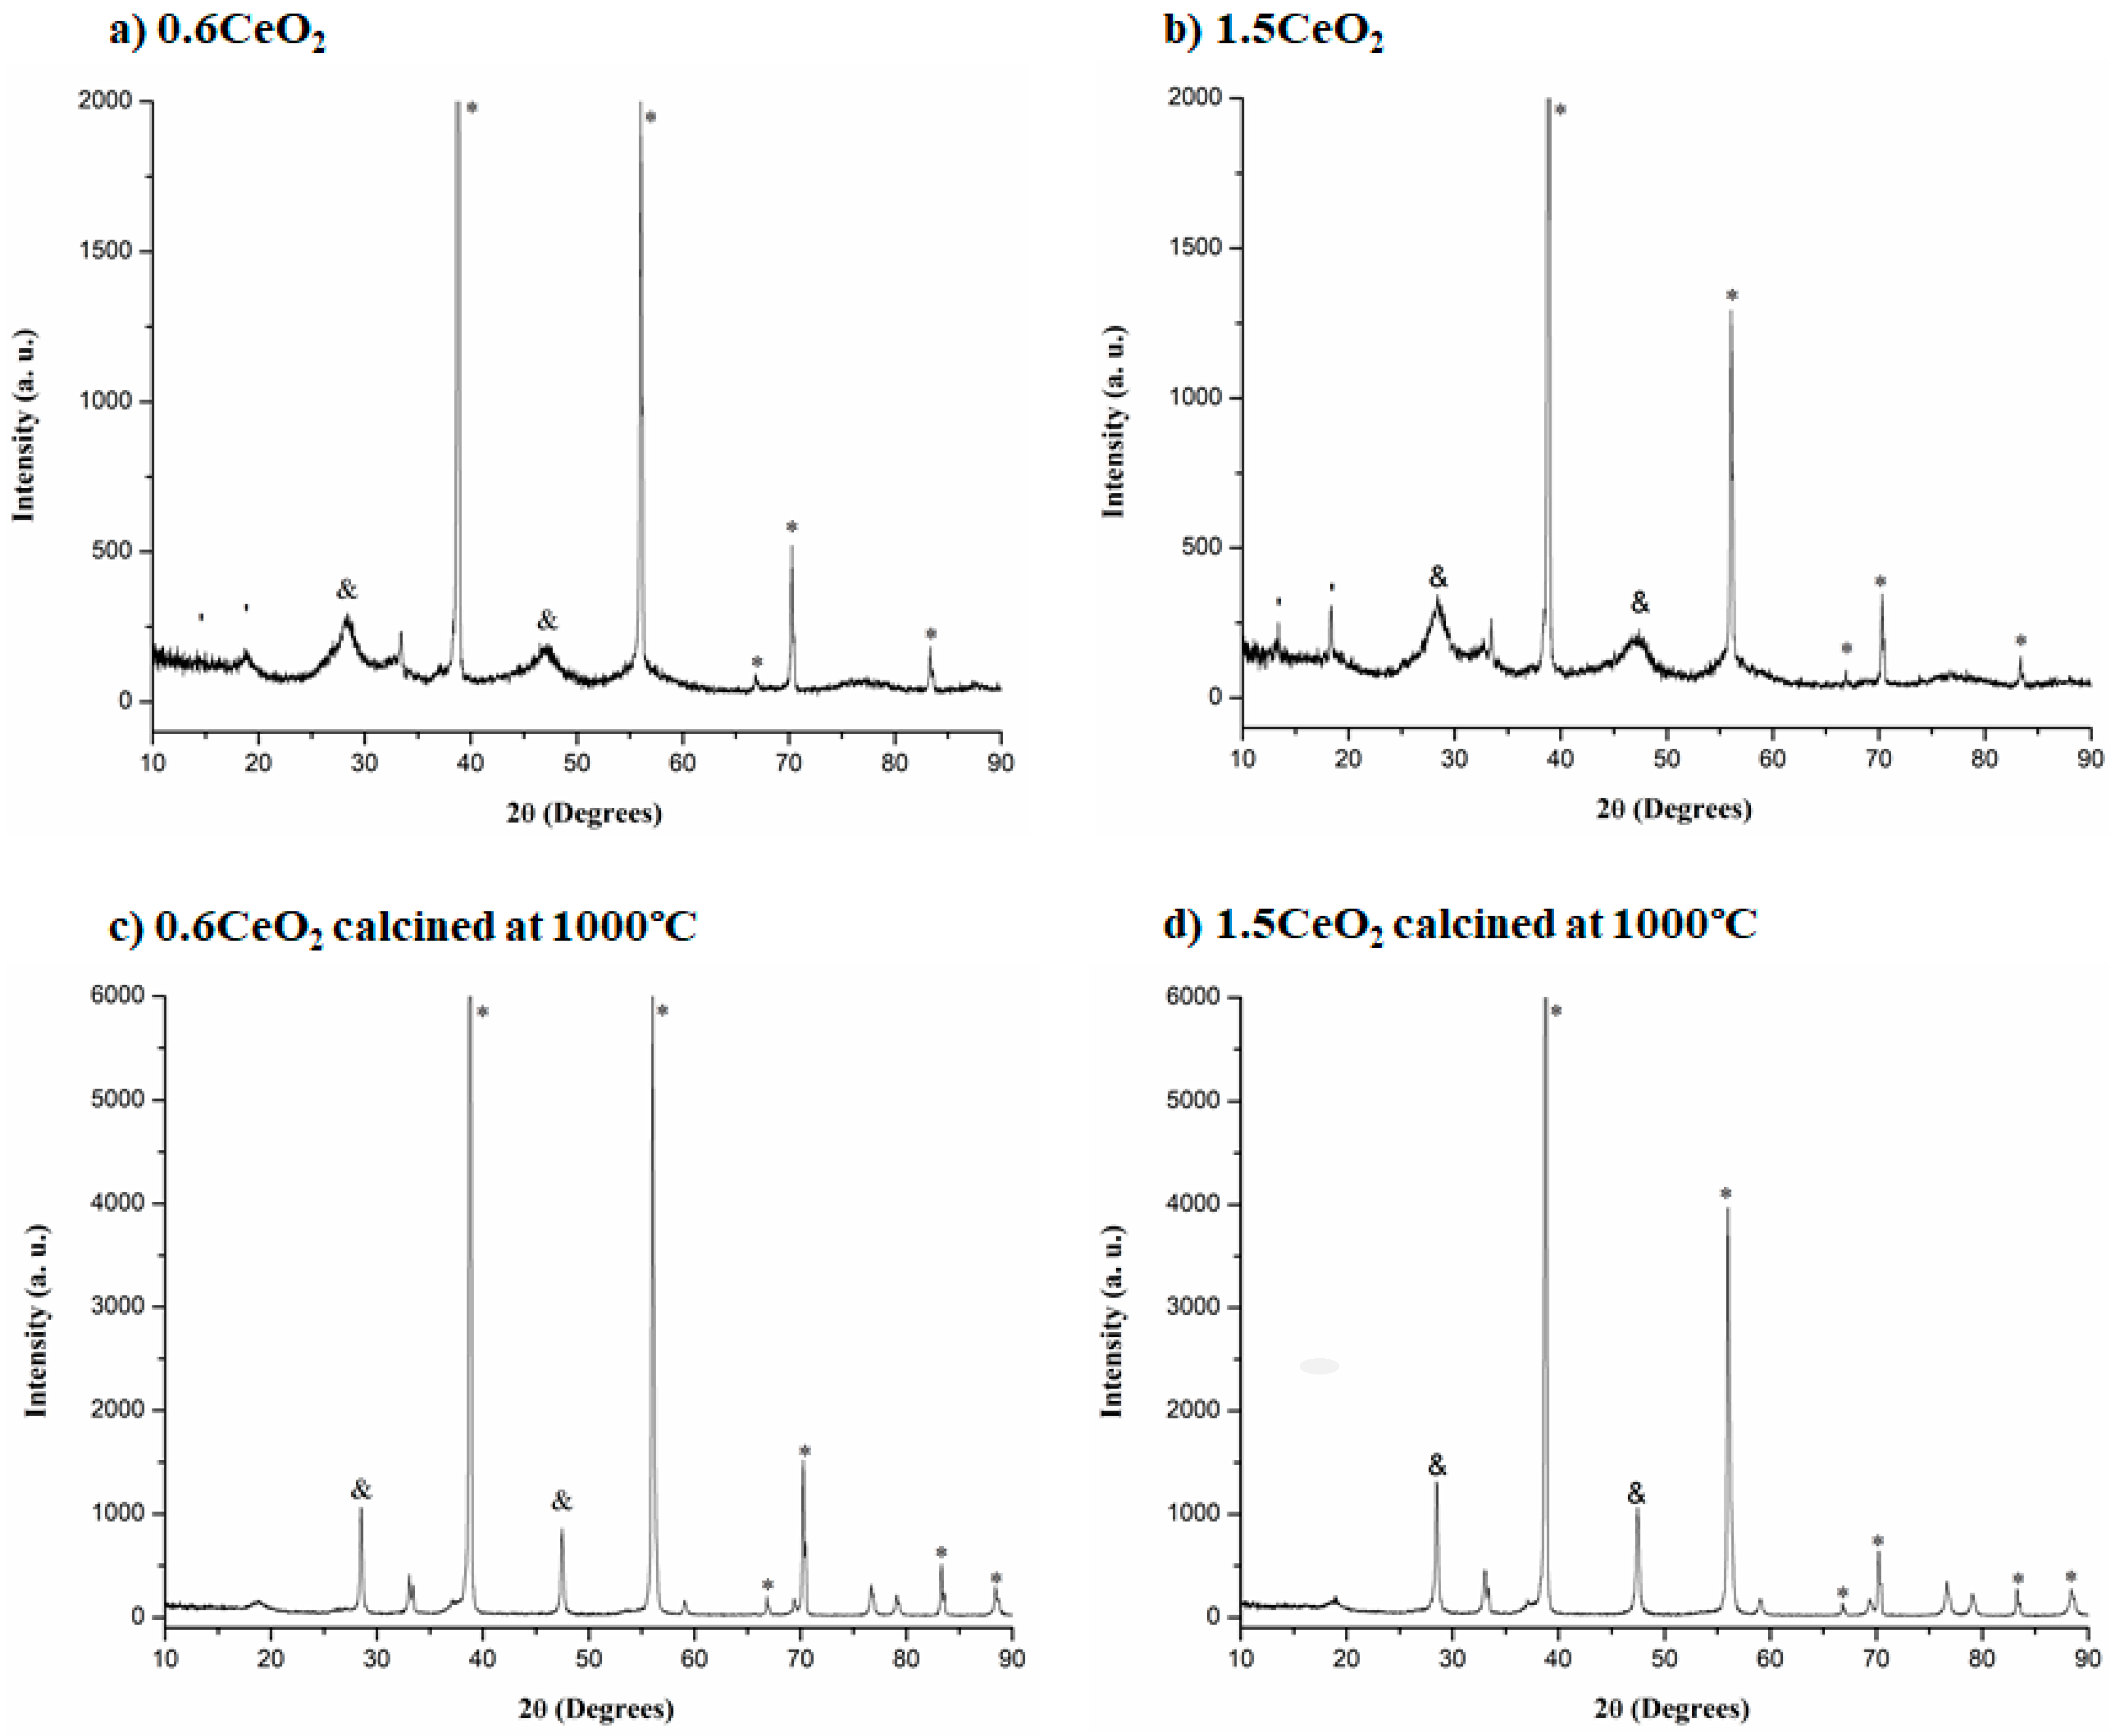
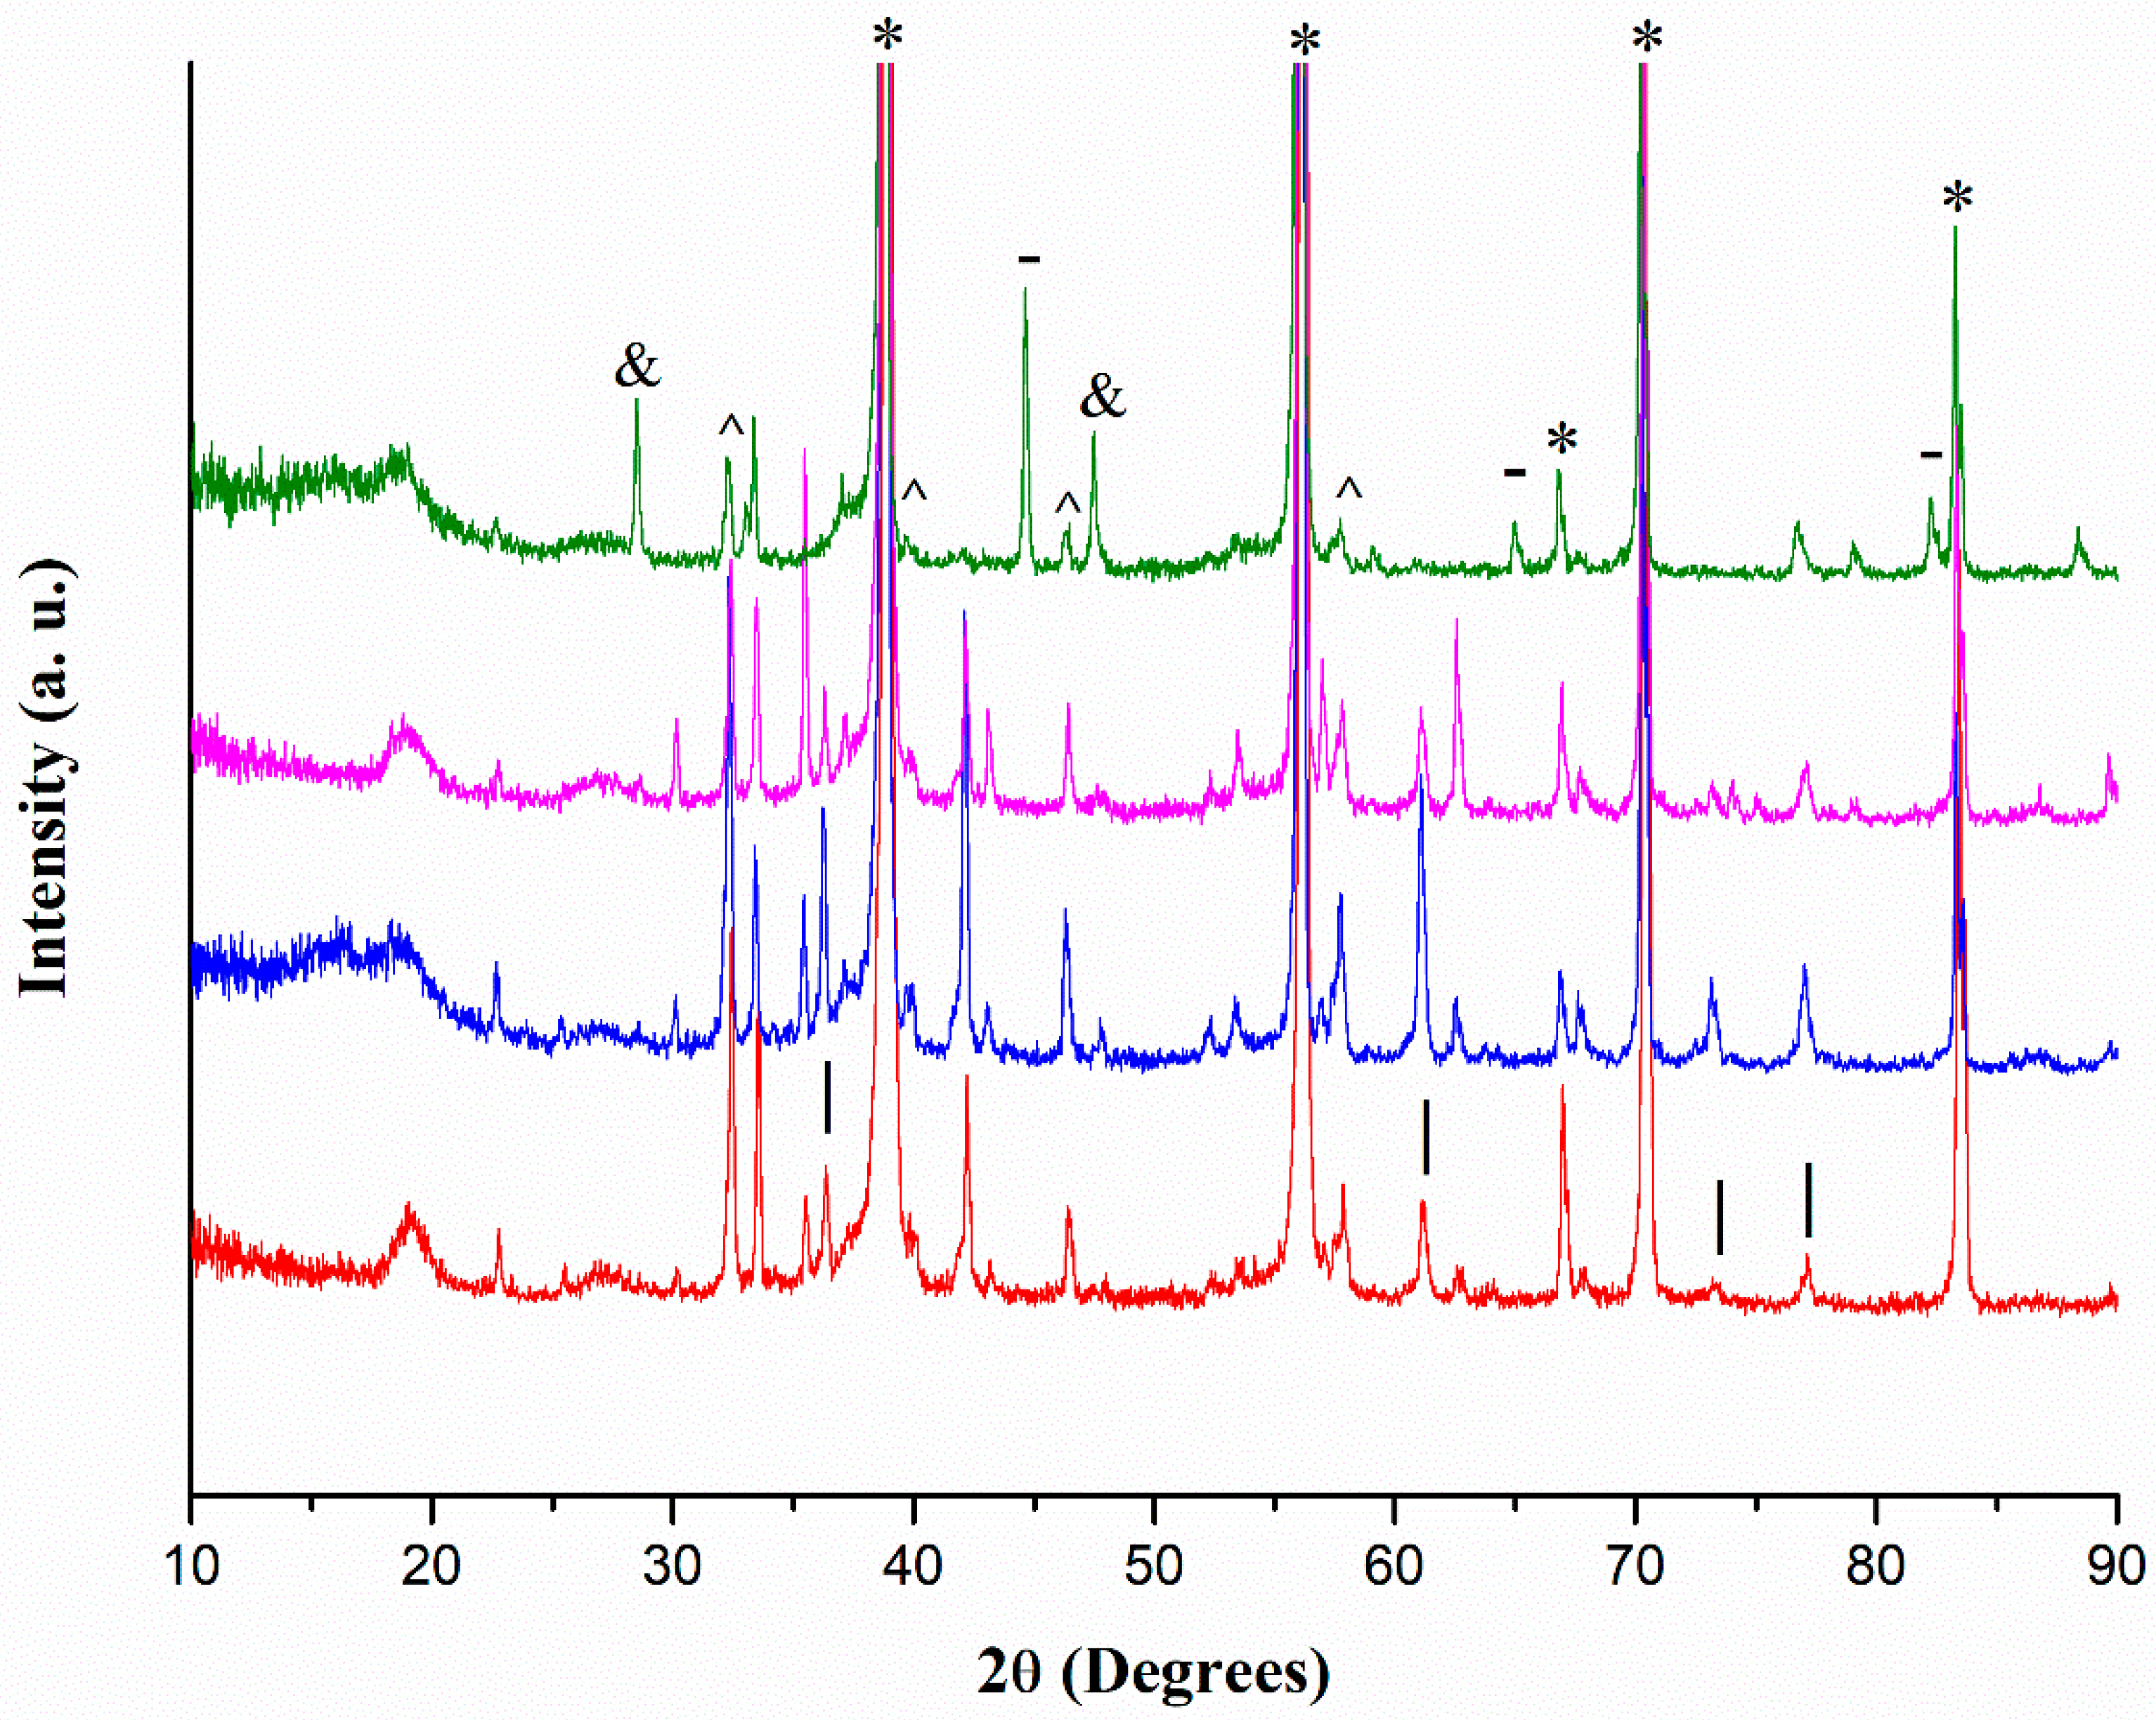
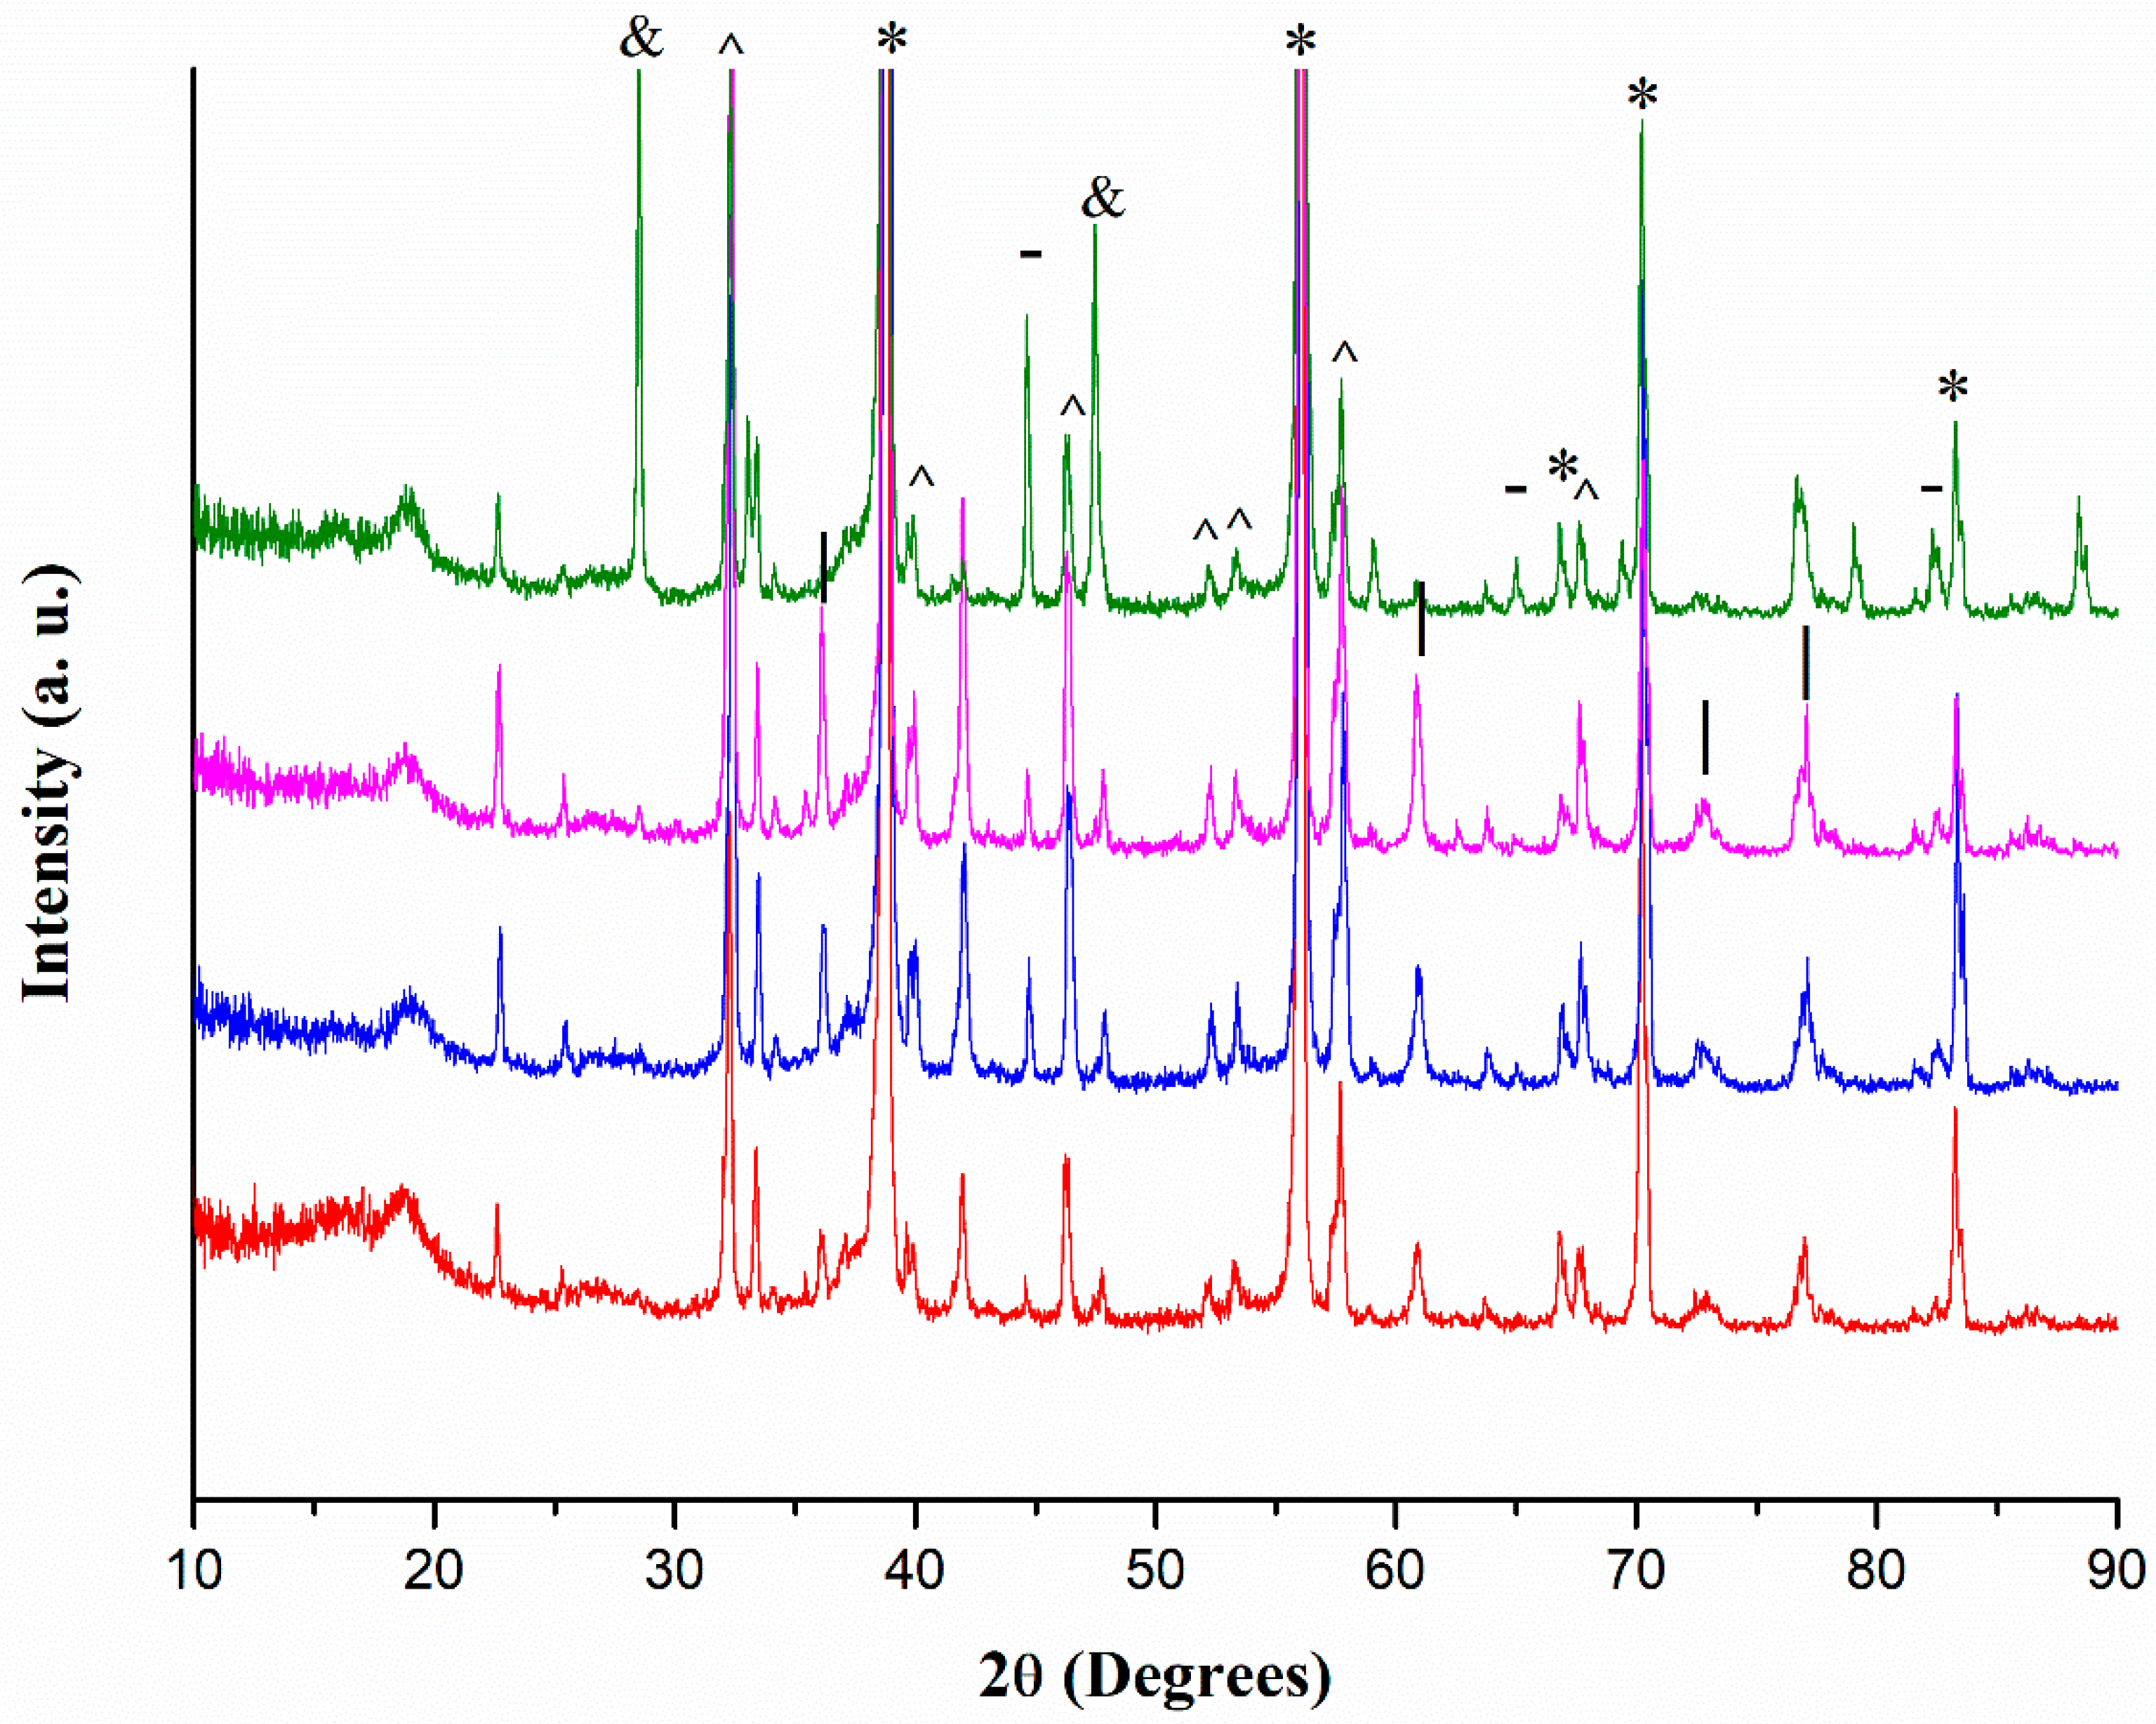
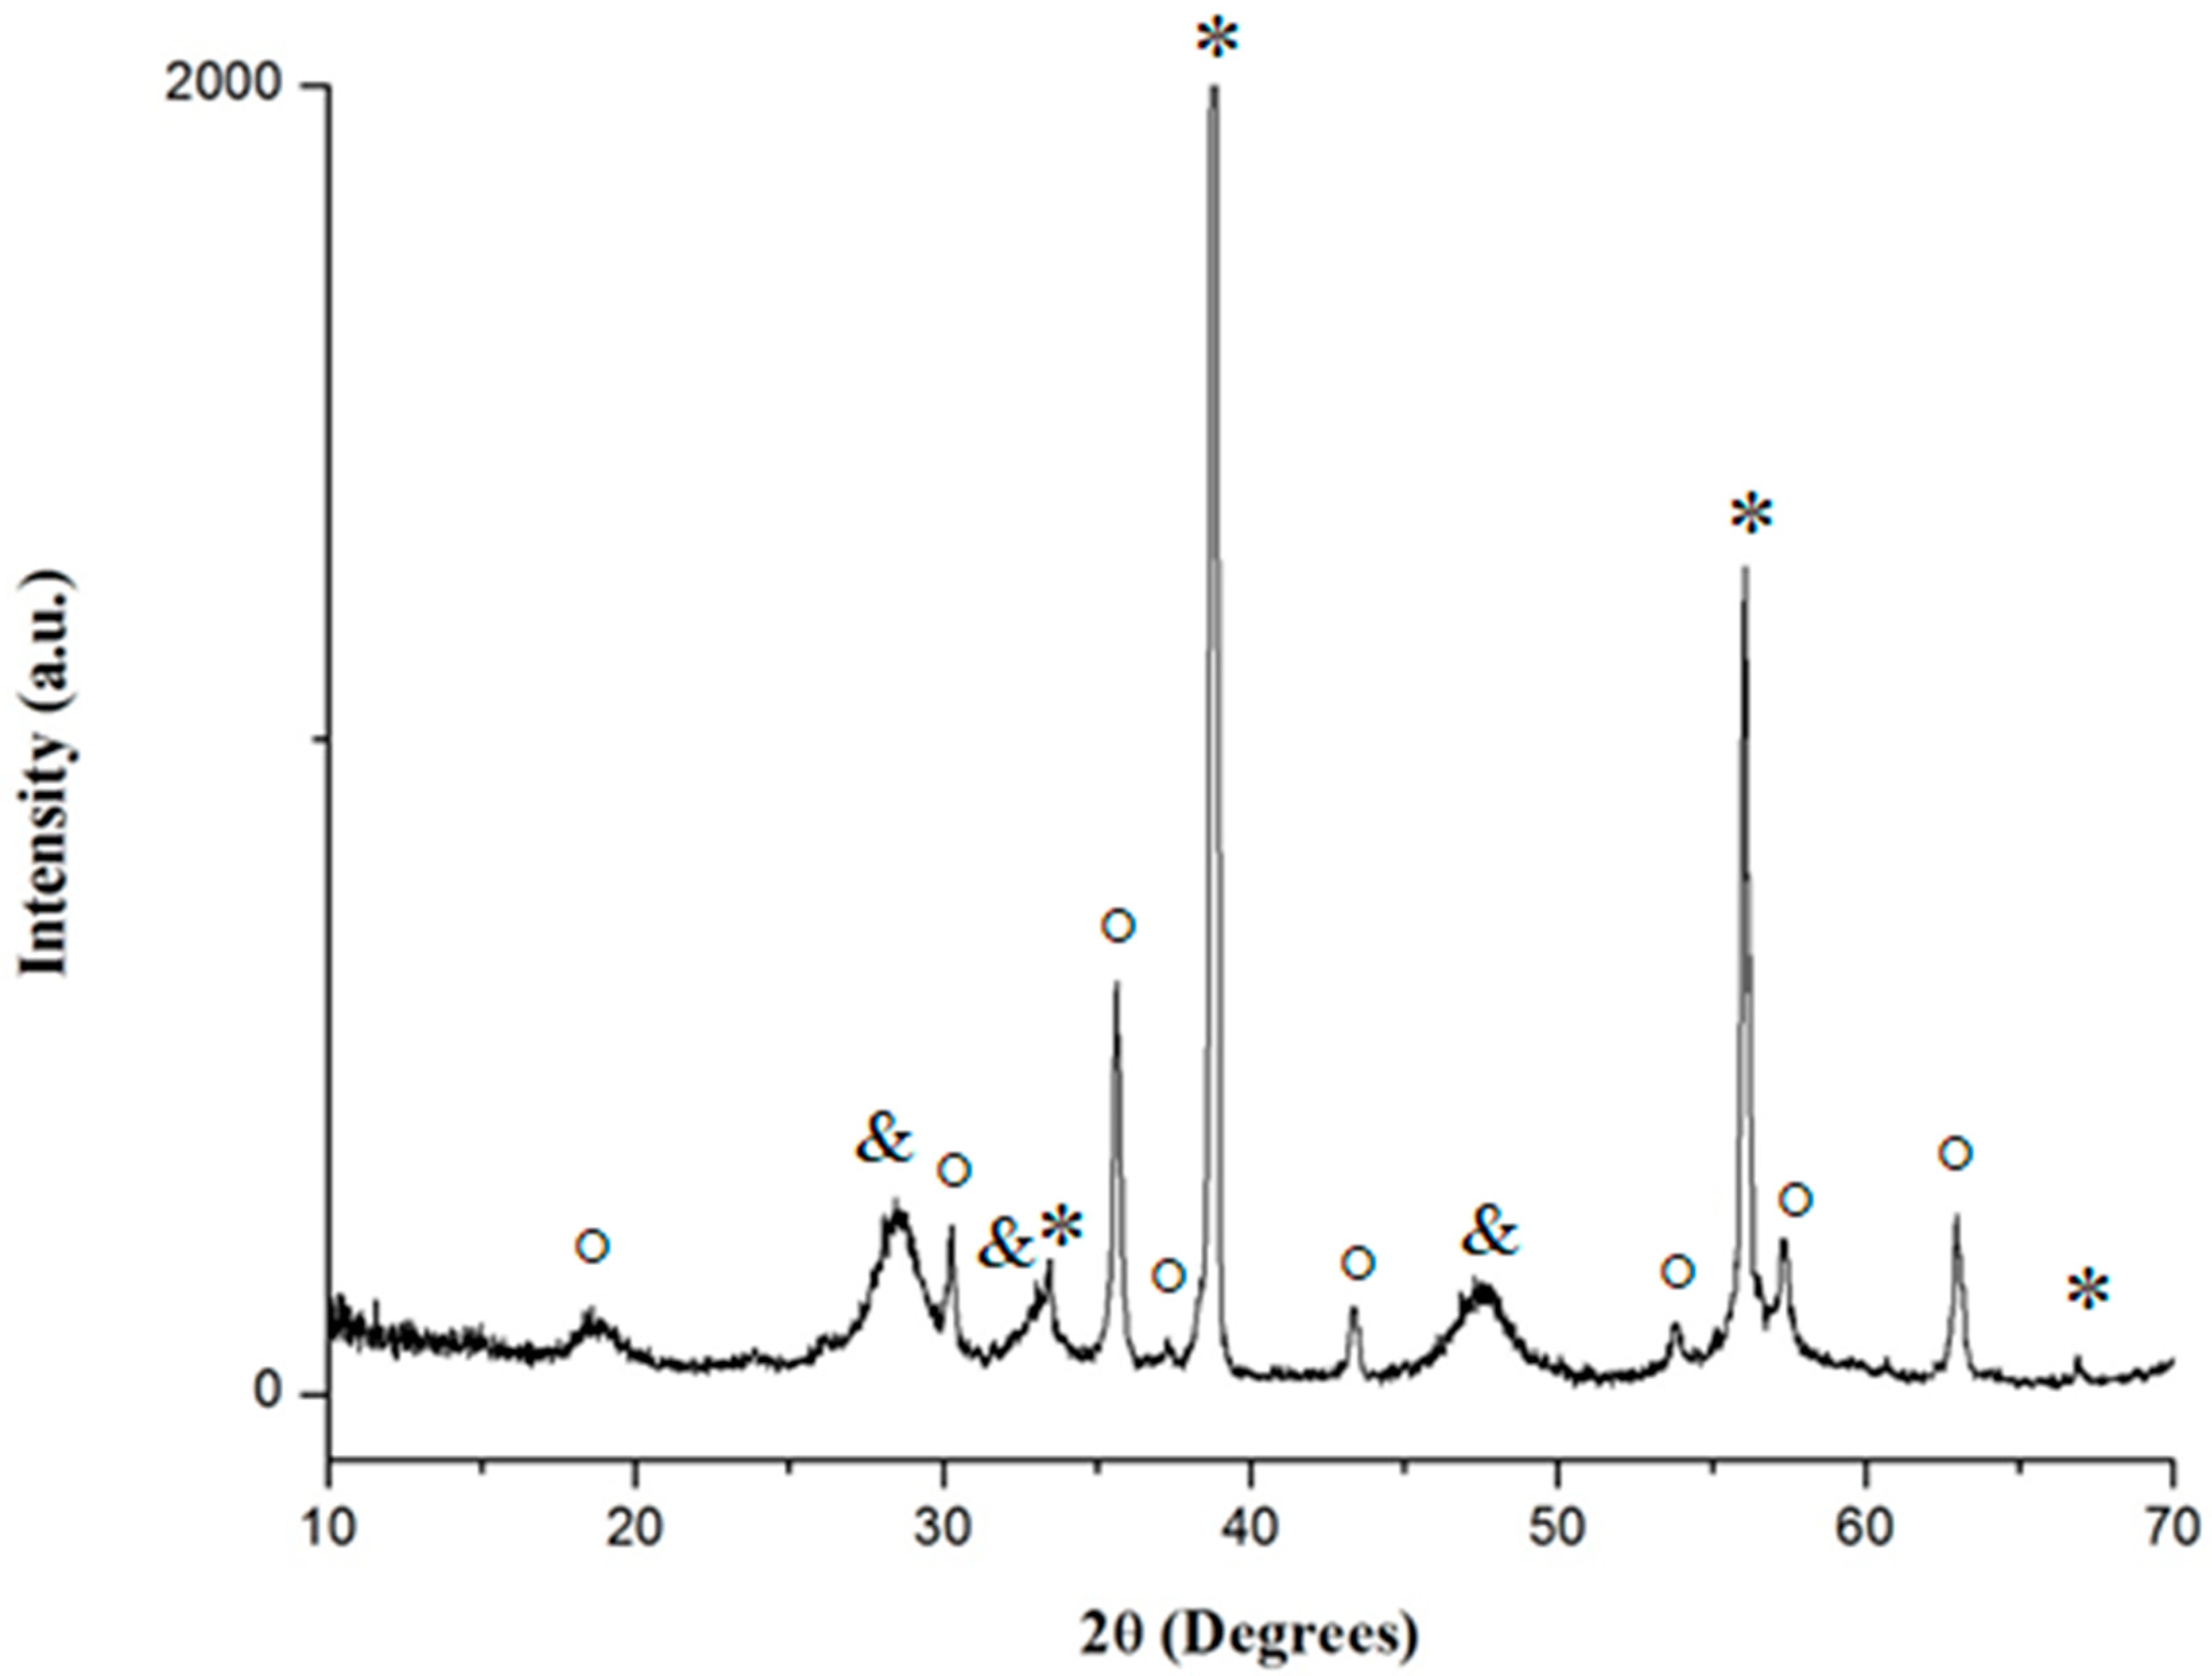
2.4. XRD Analyses
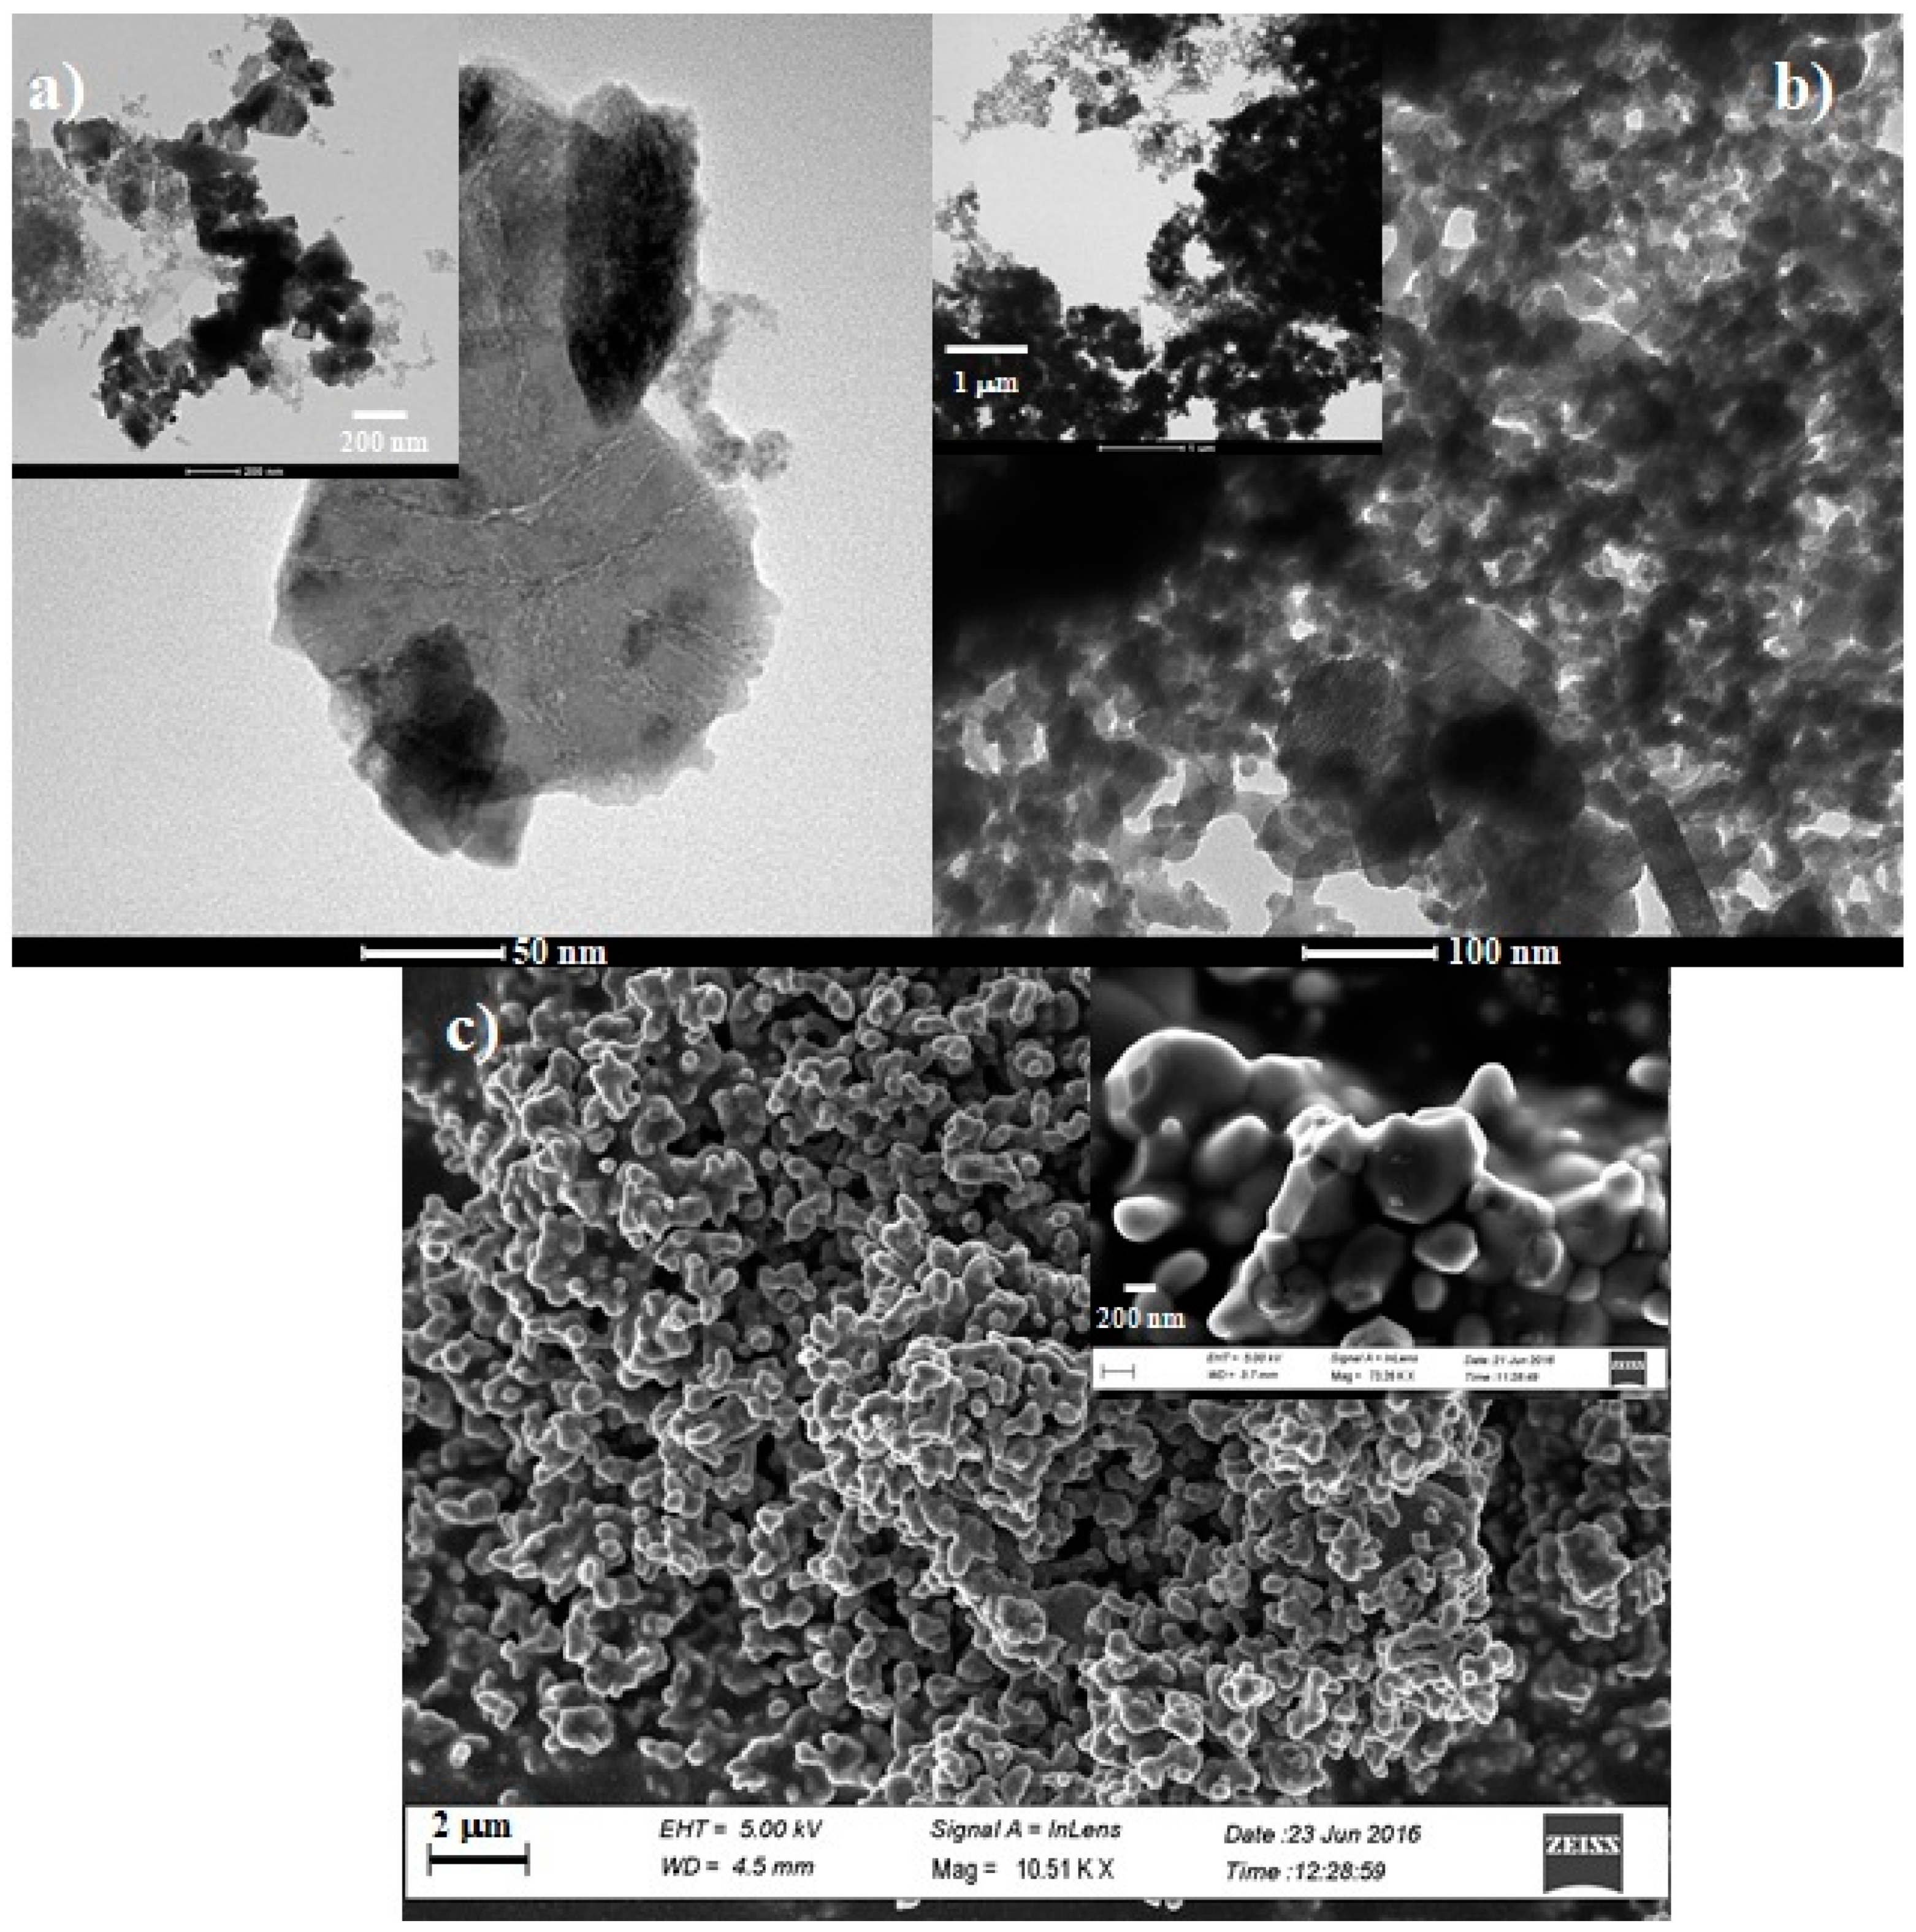
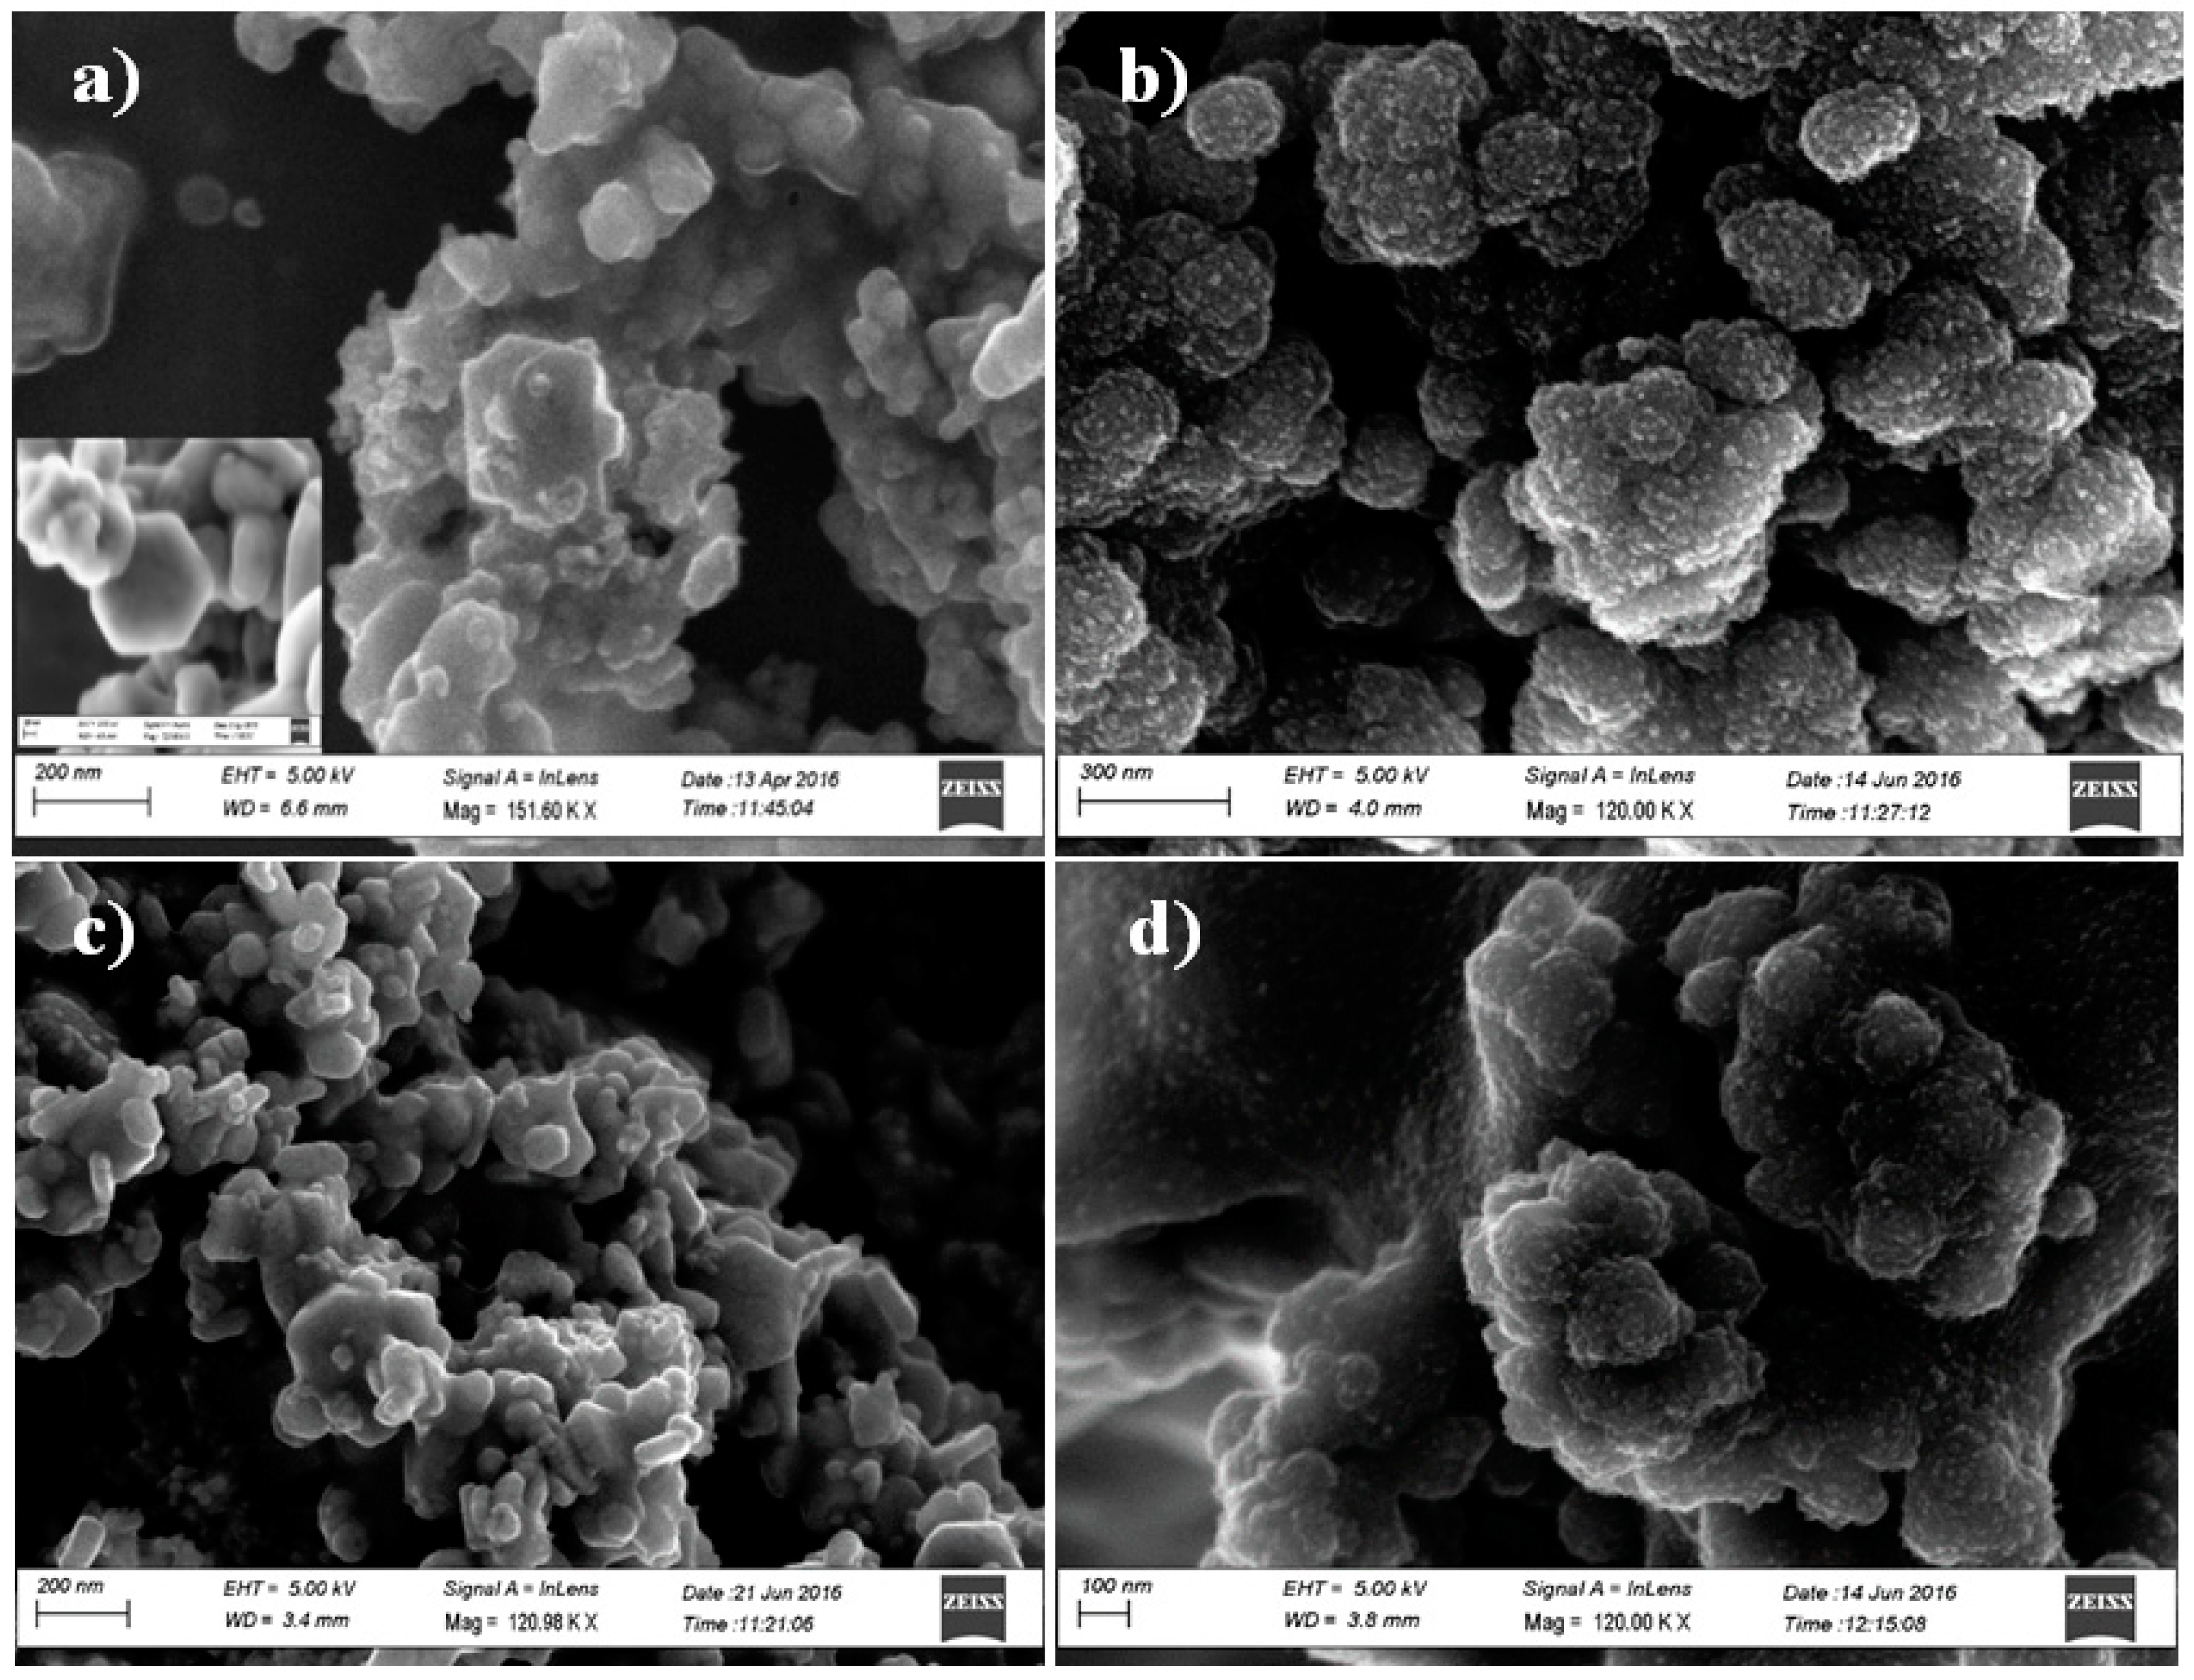
2.5. TEM Analyses
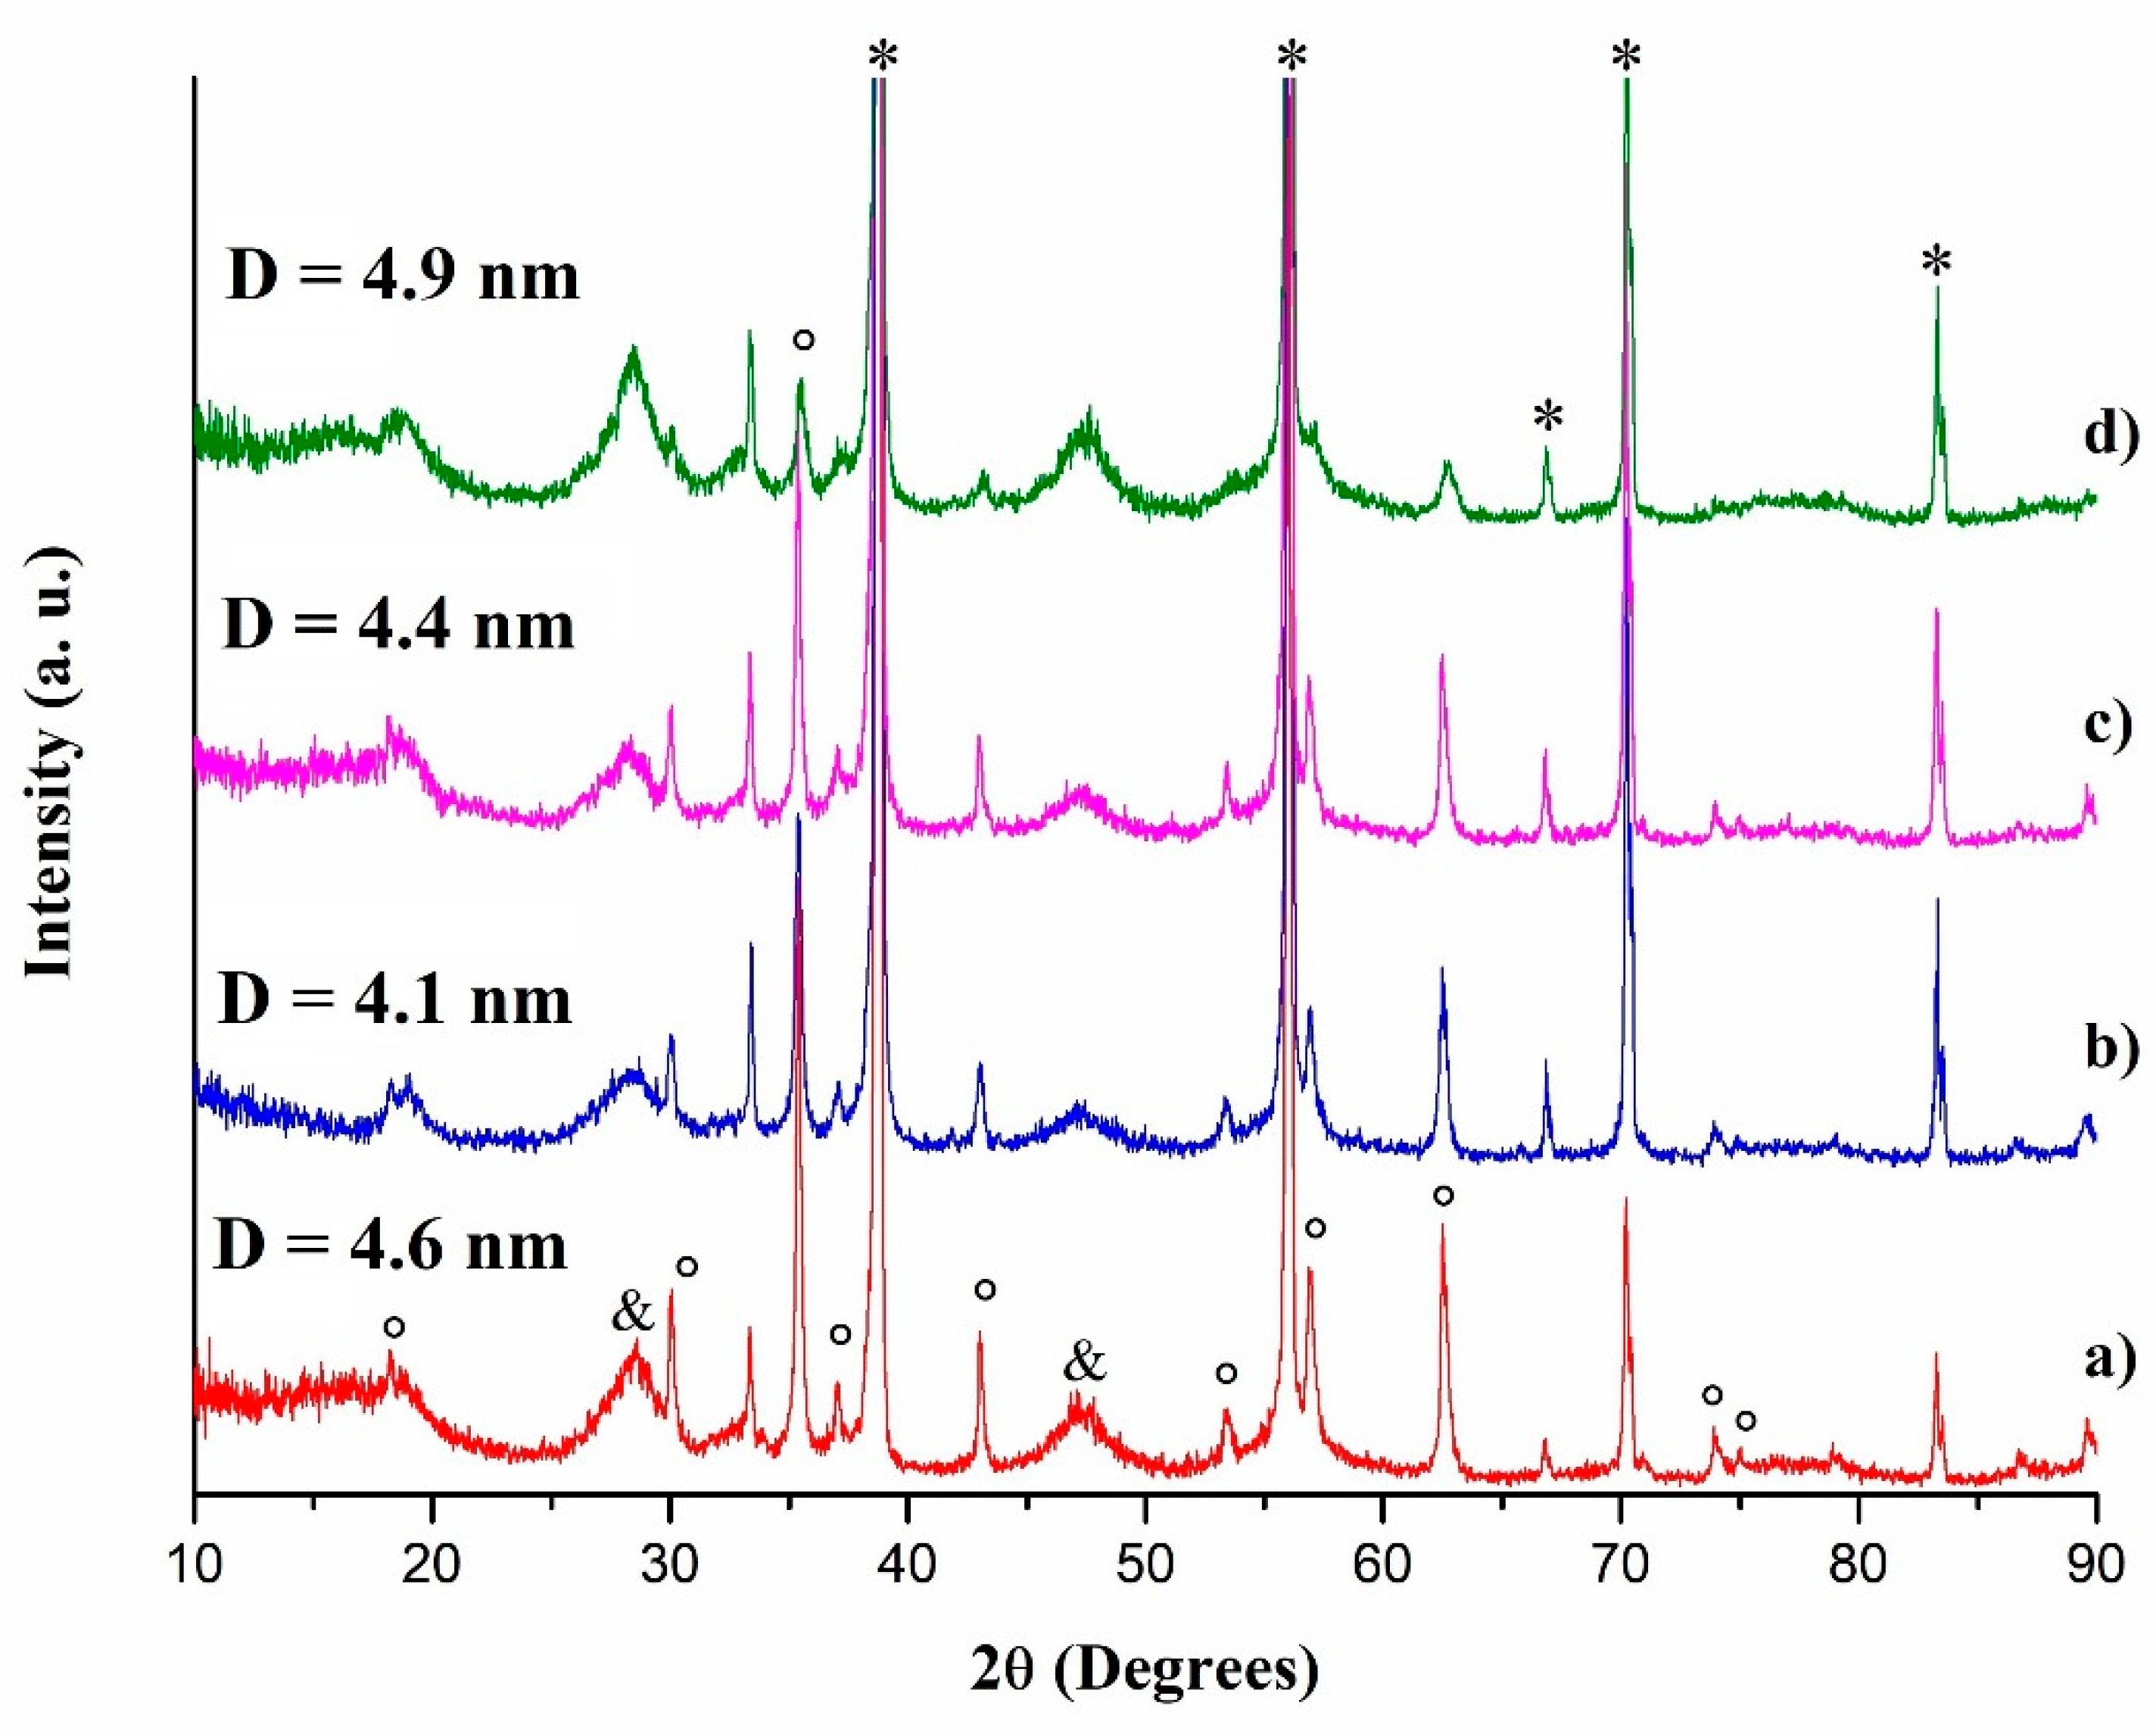
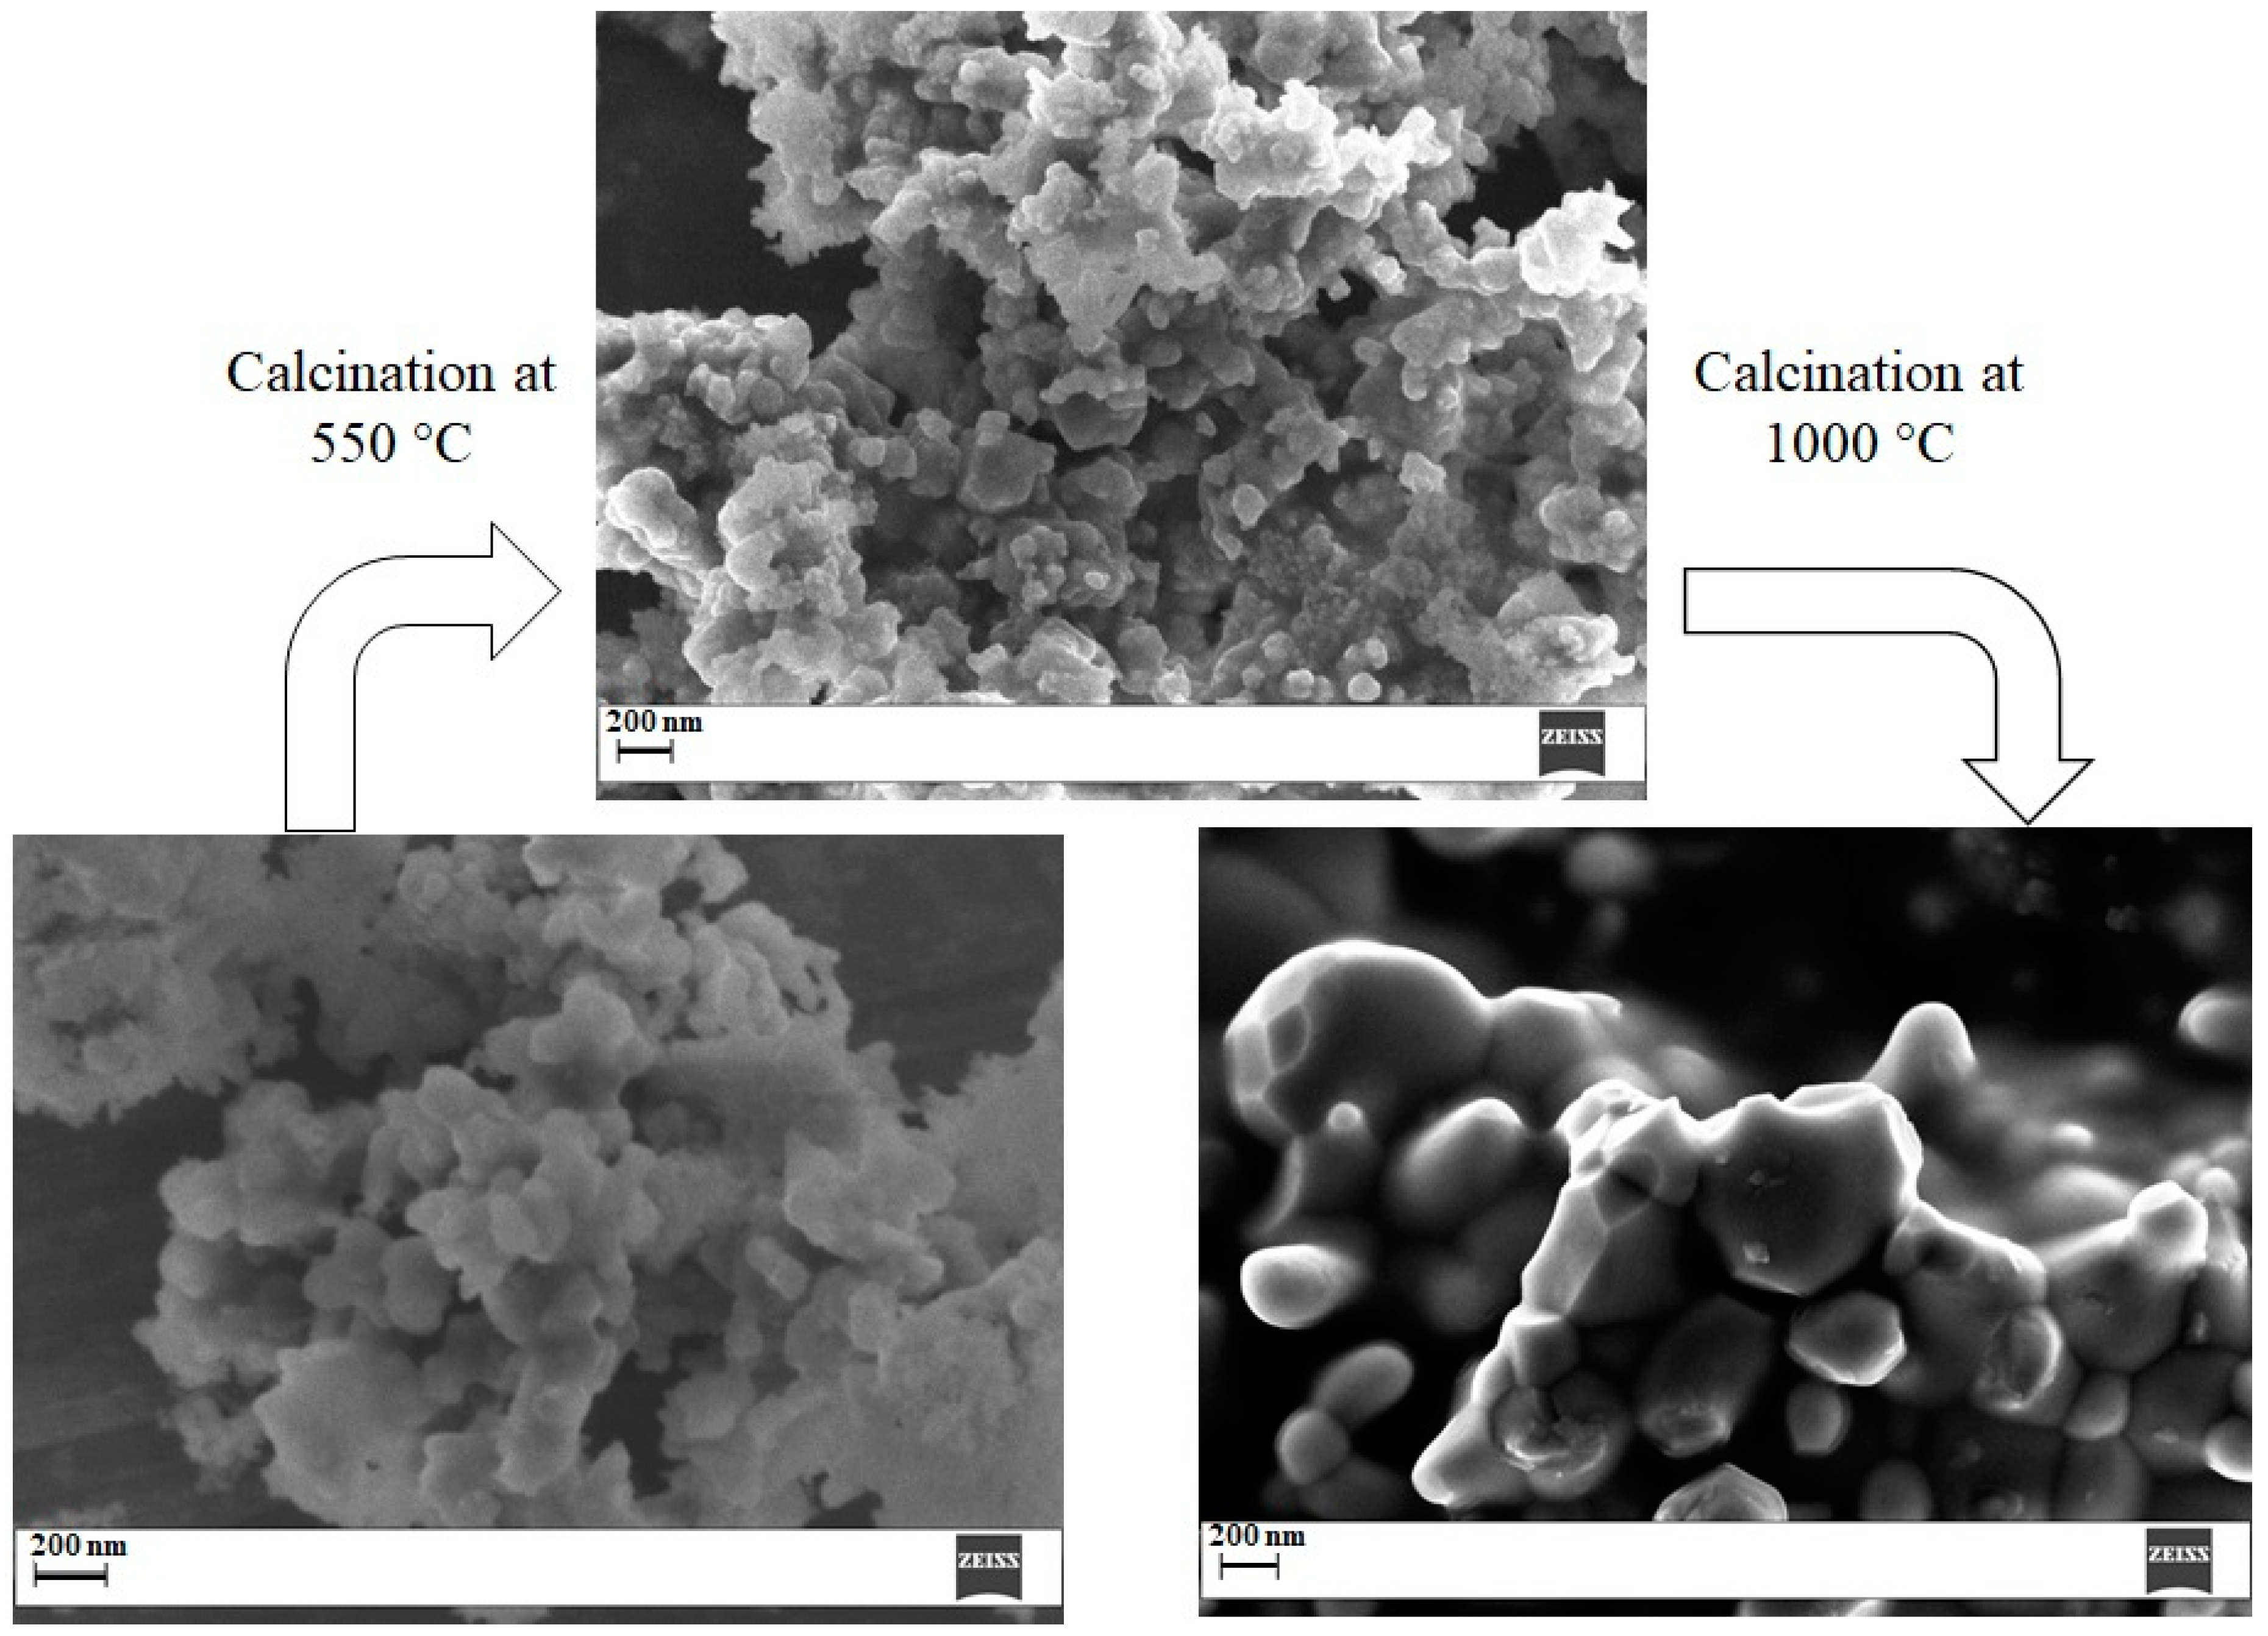
2.6. Calcination at 550 °C
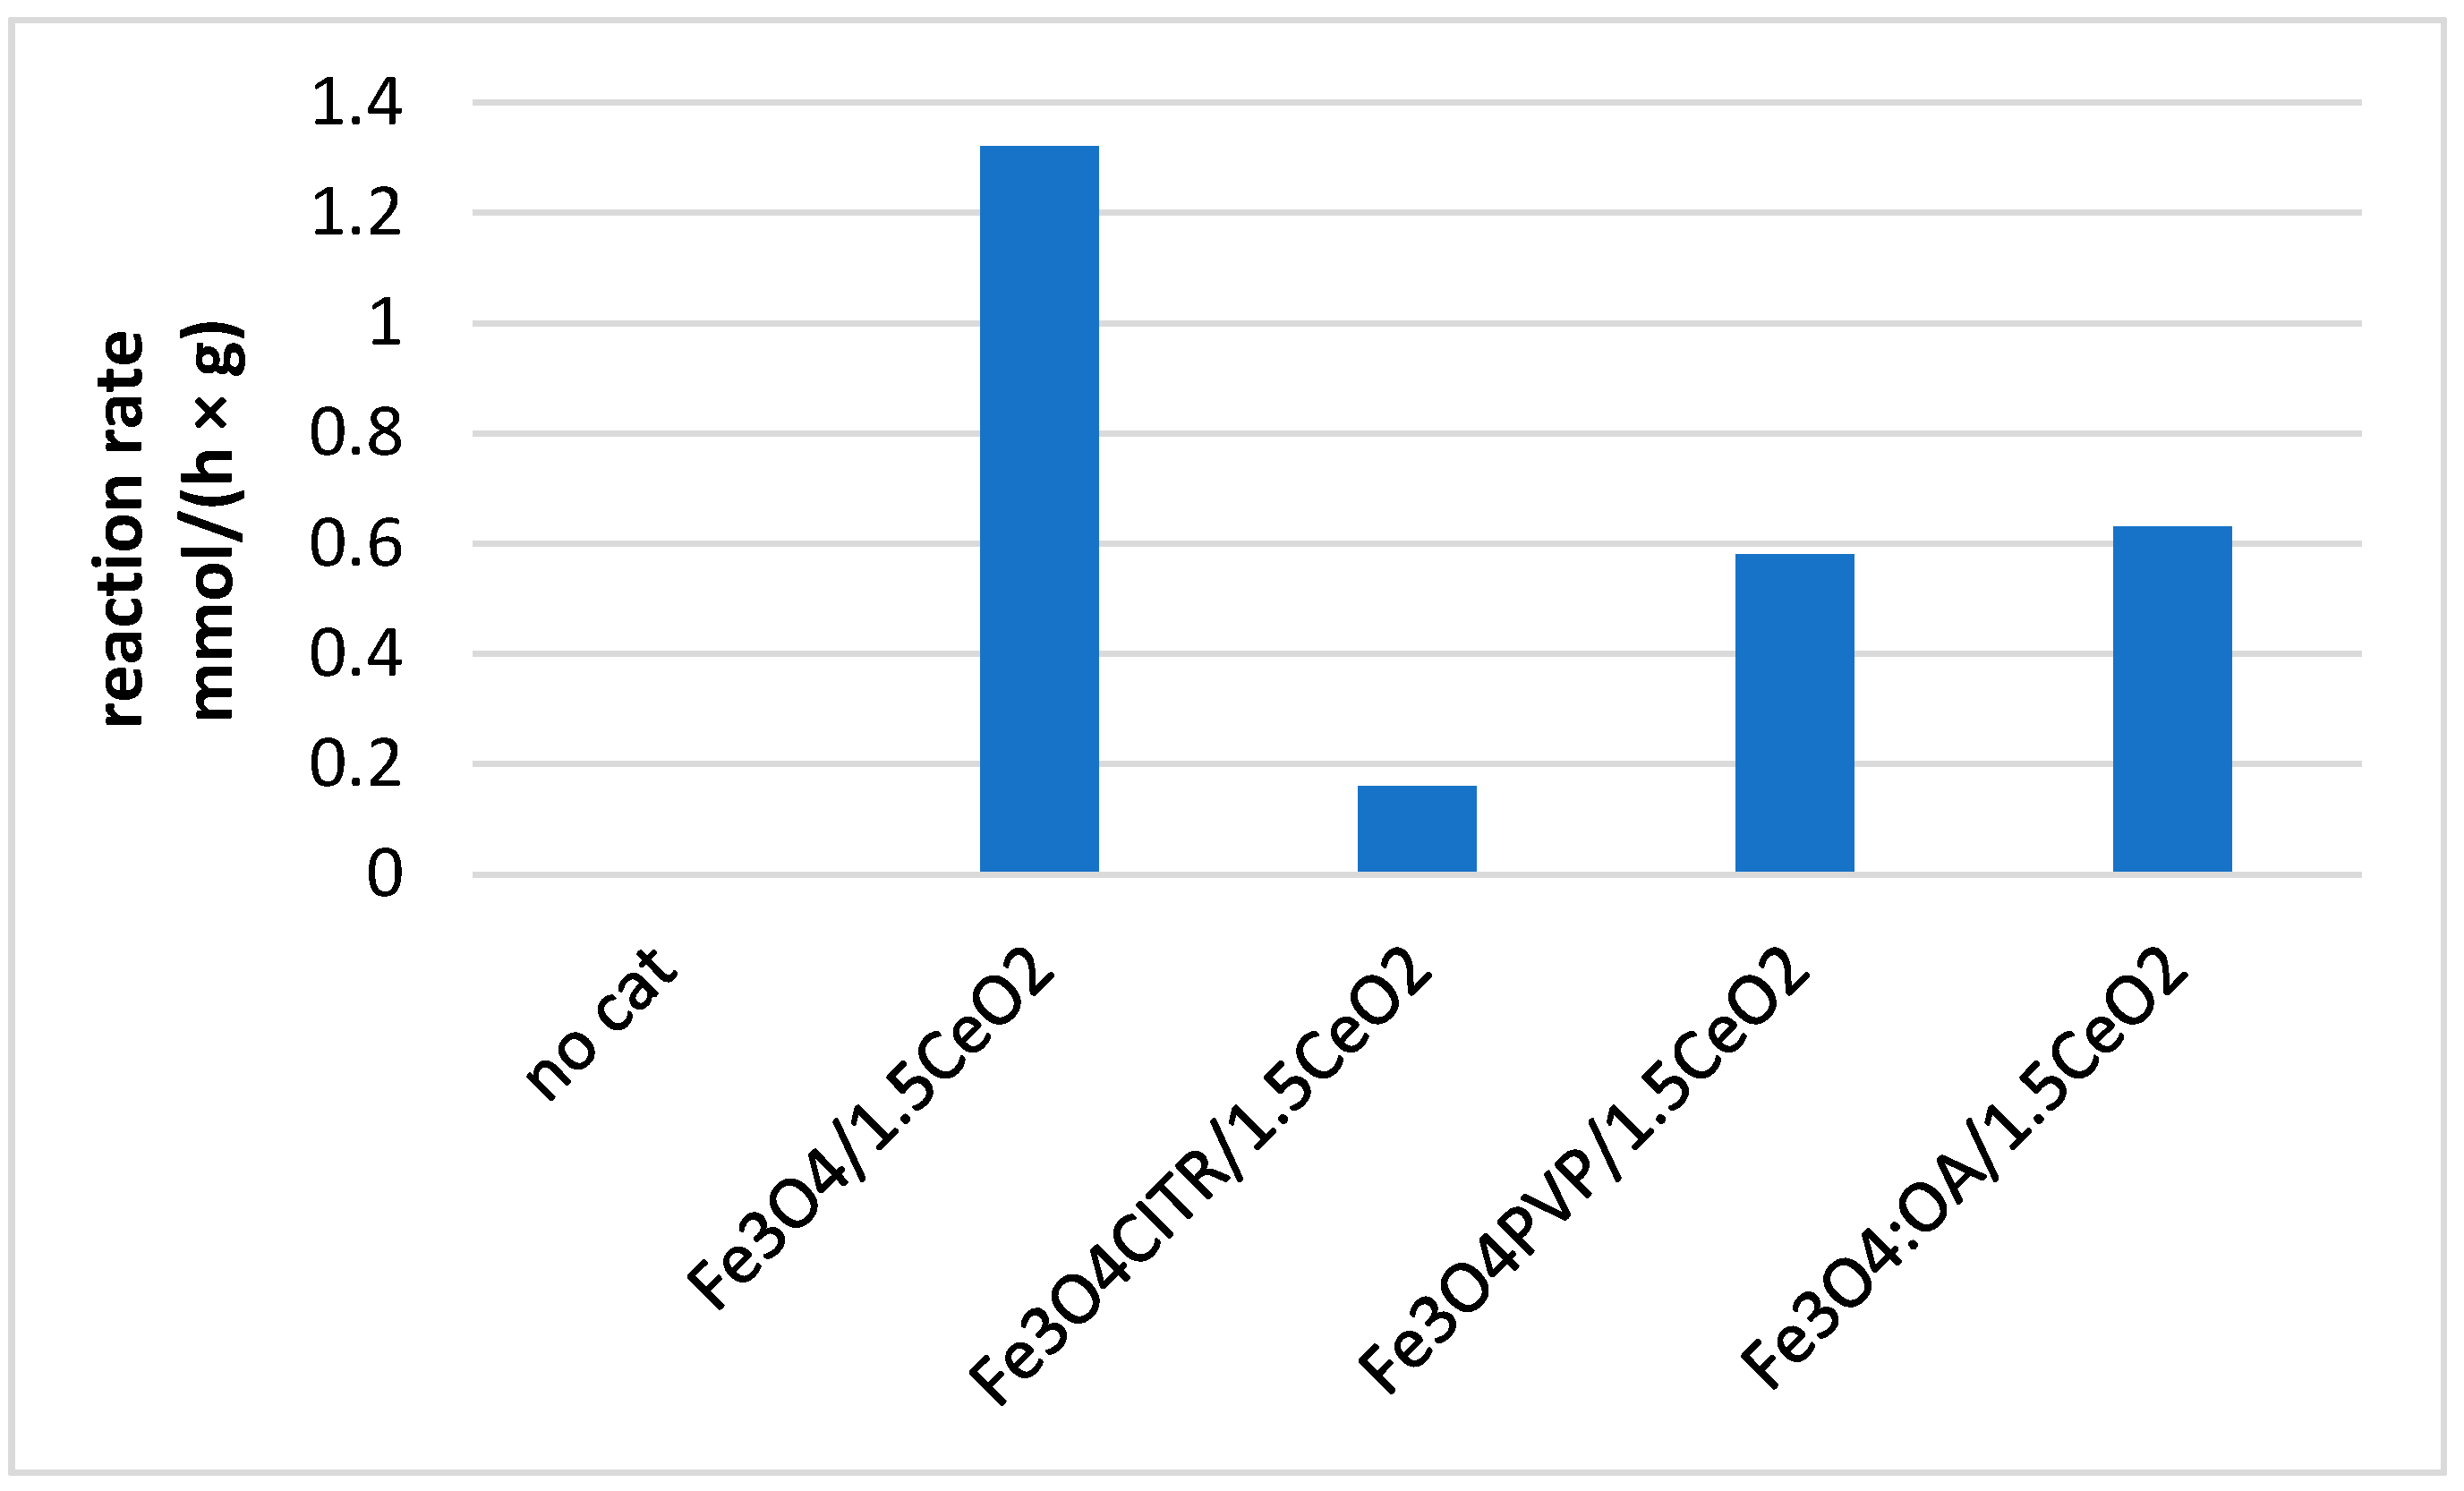
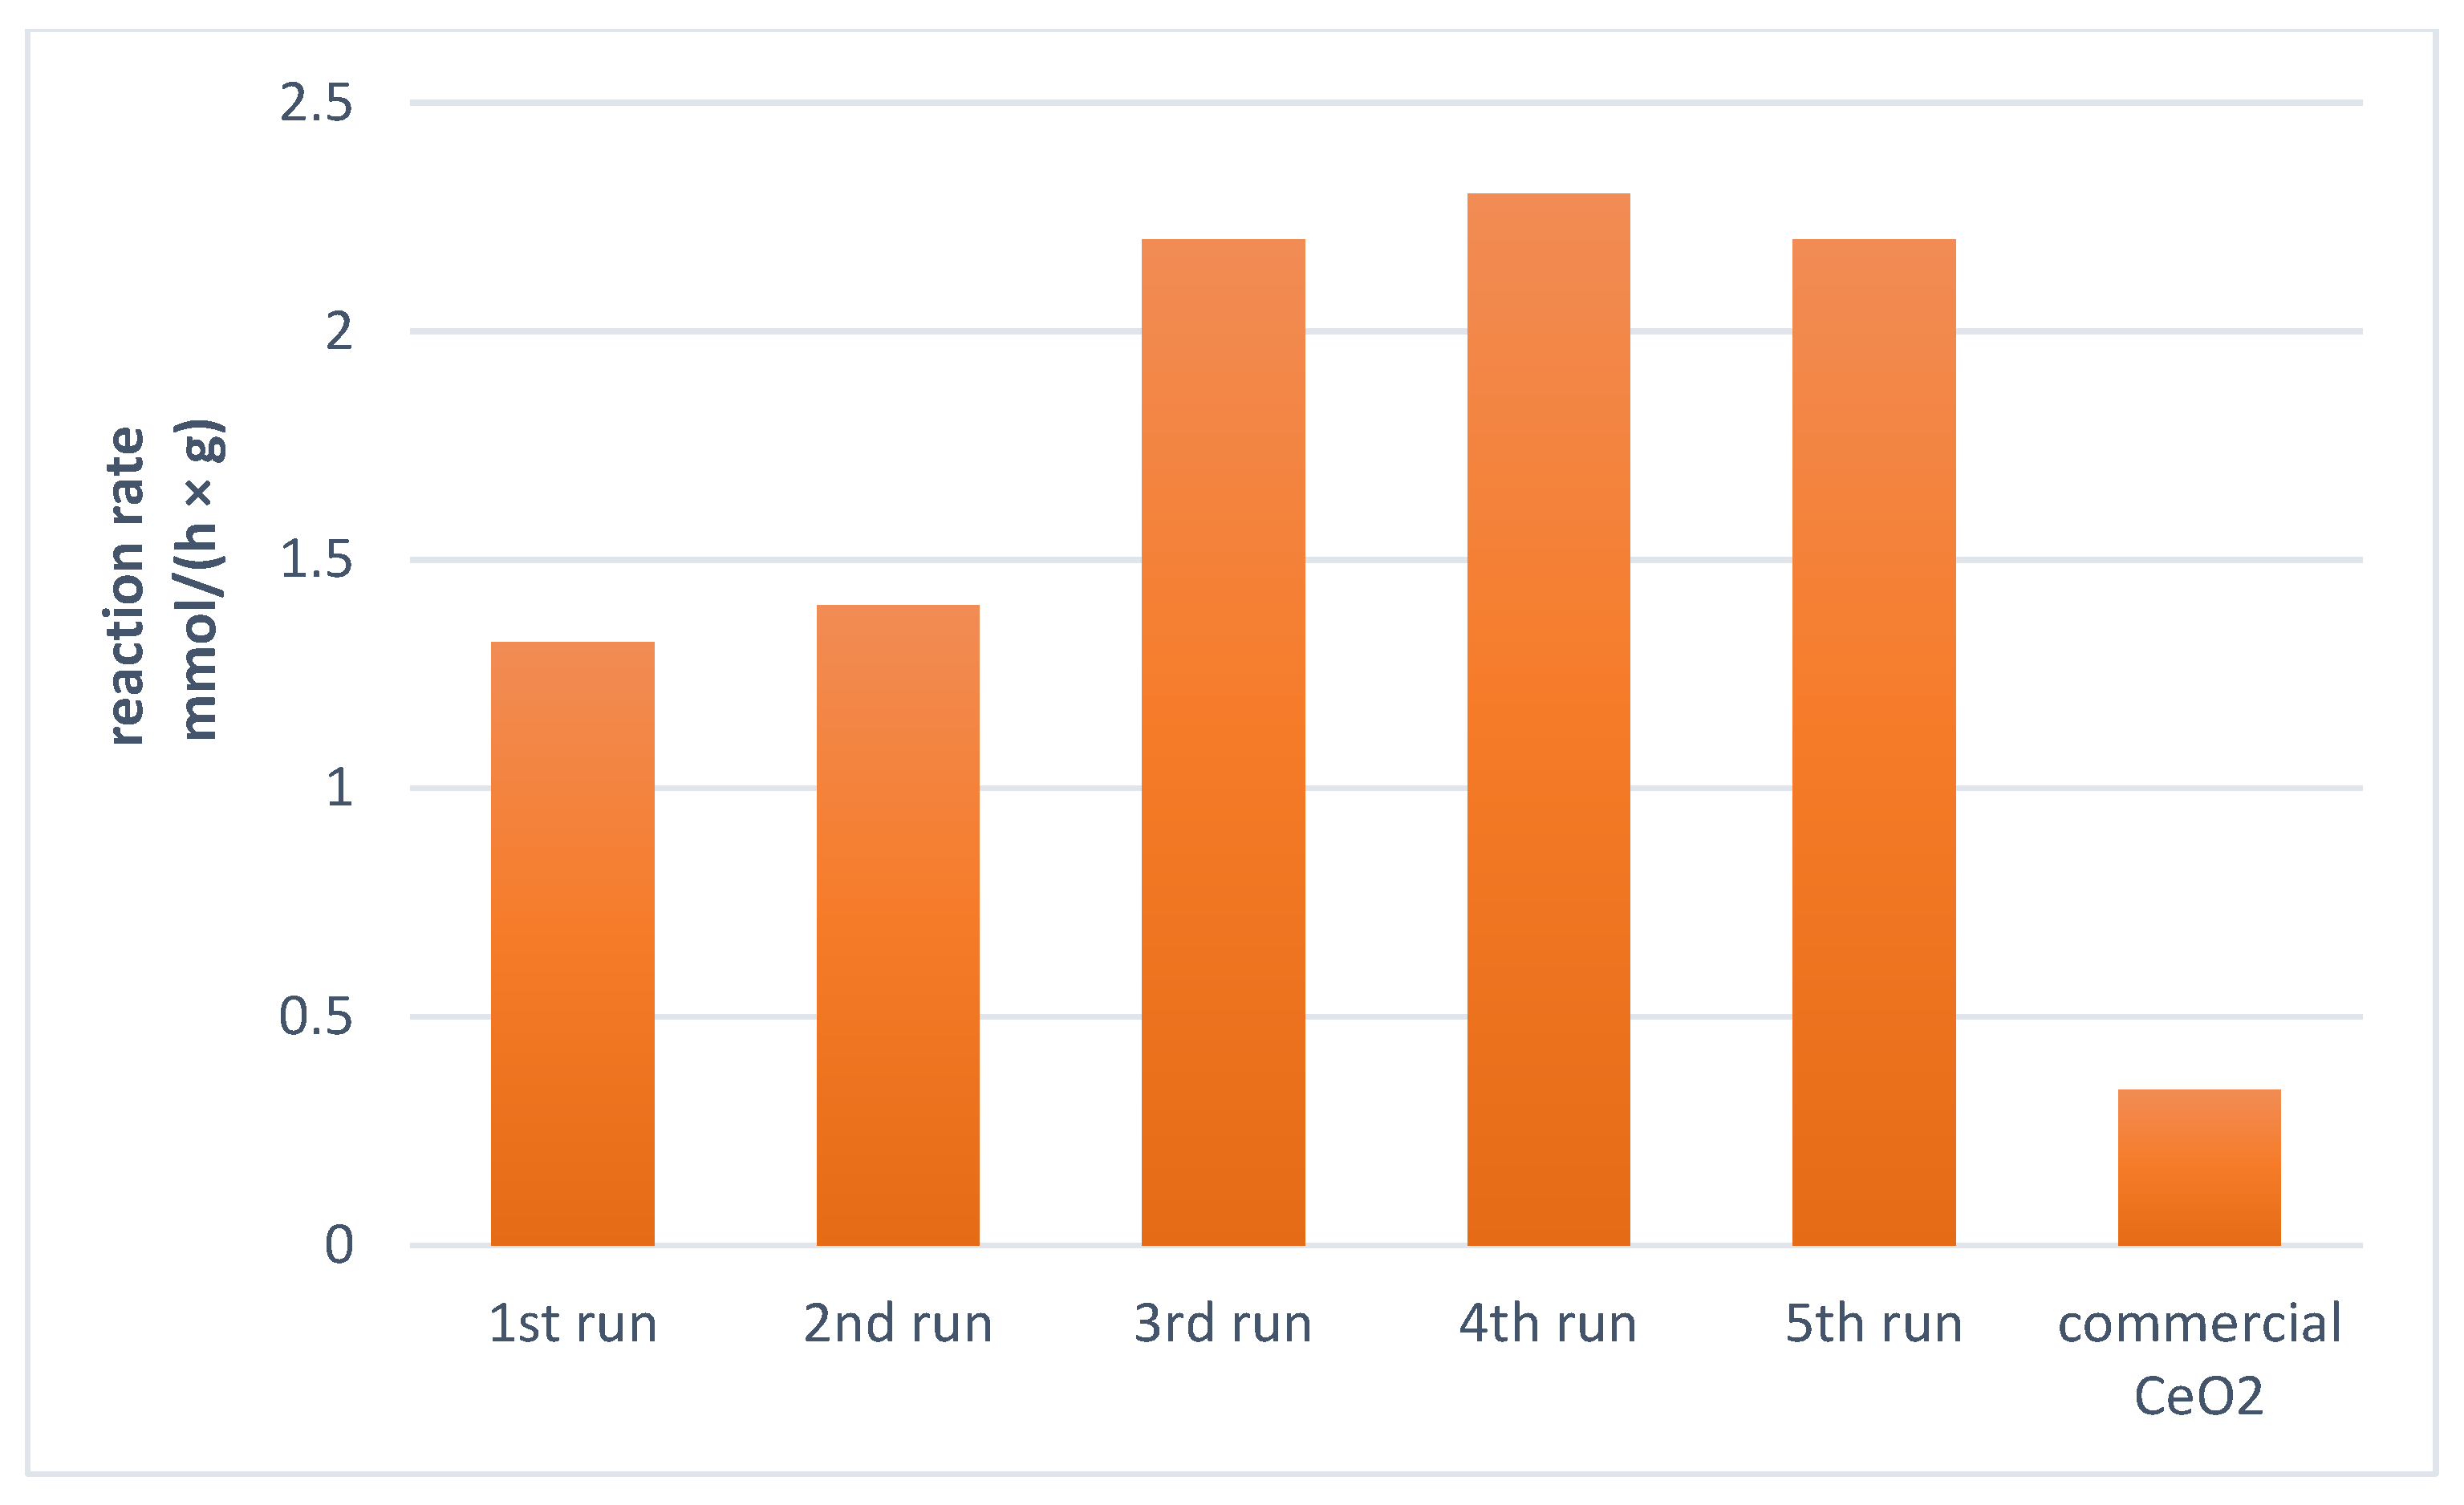
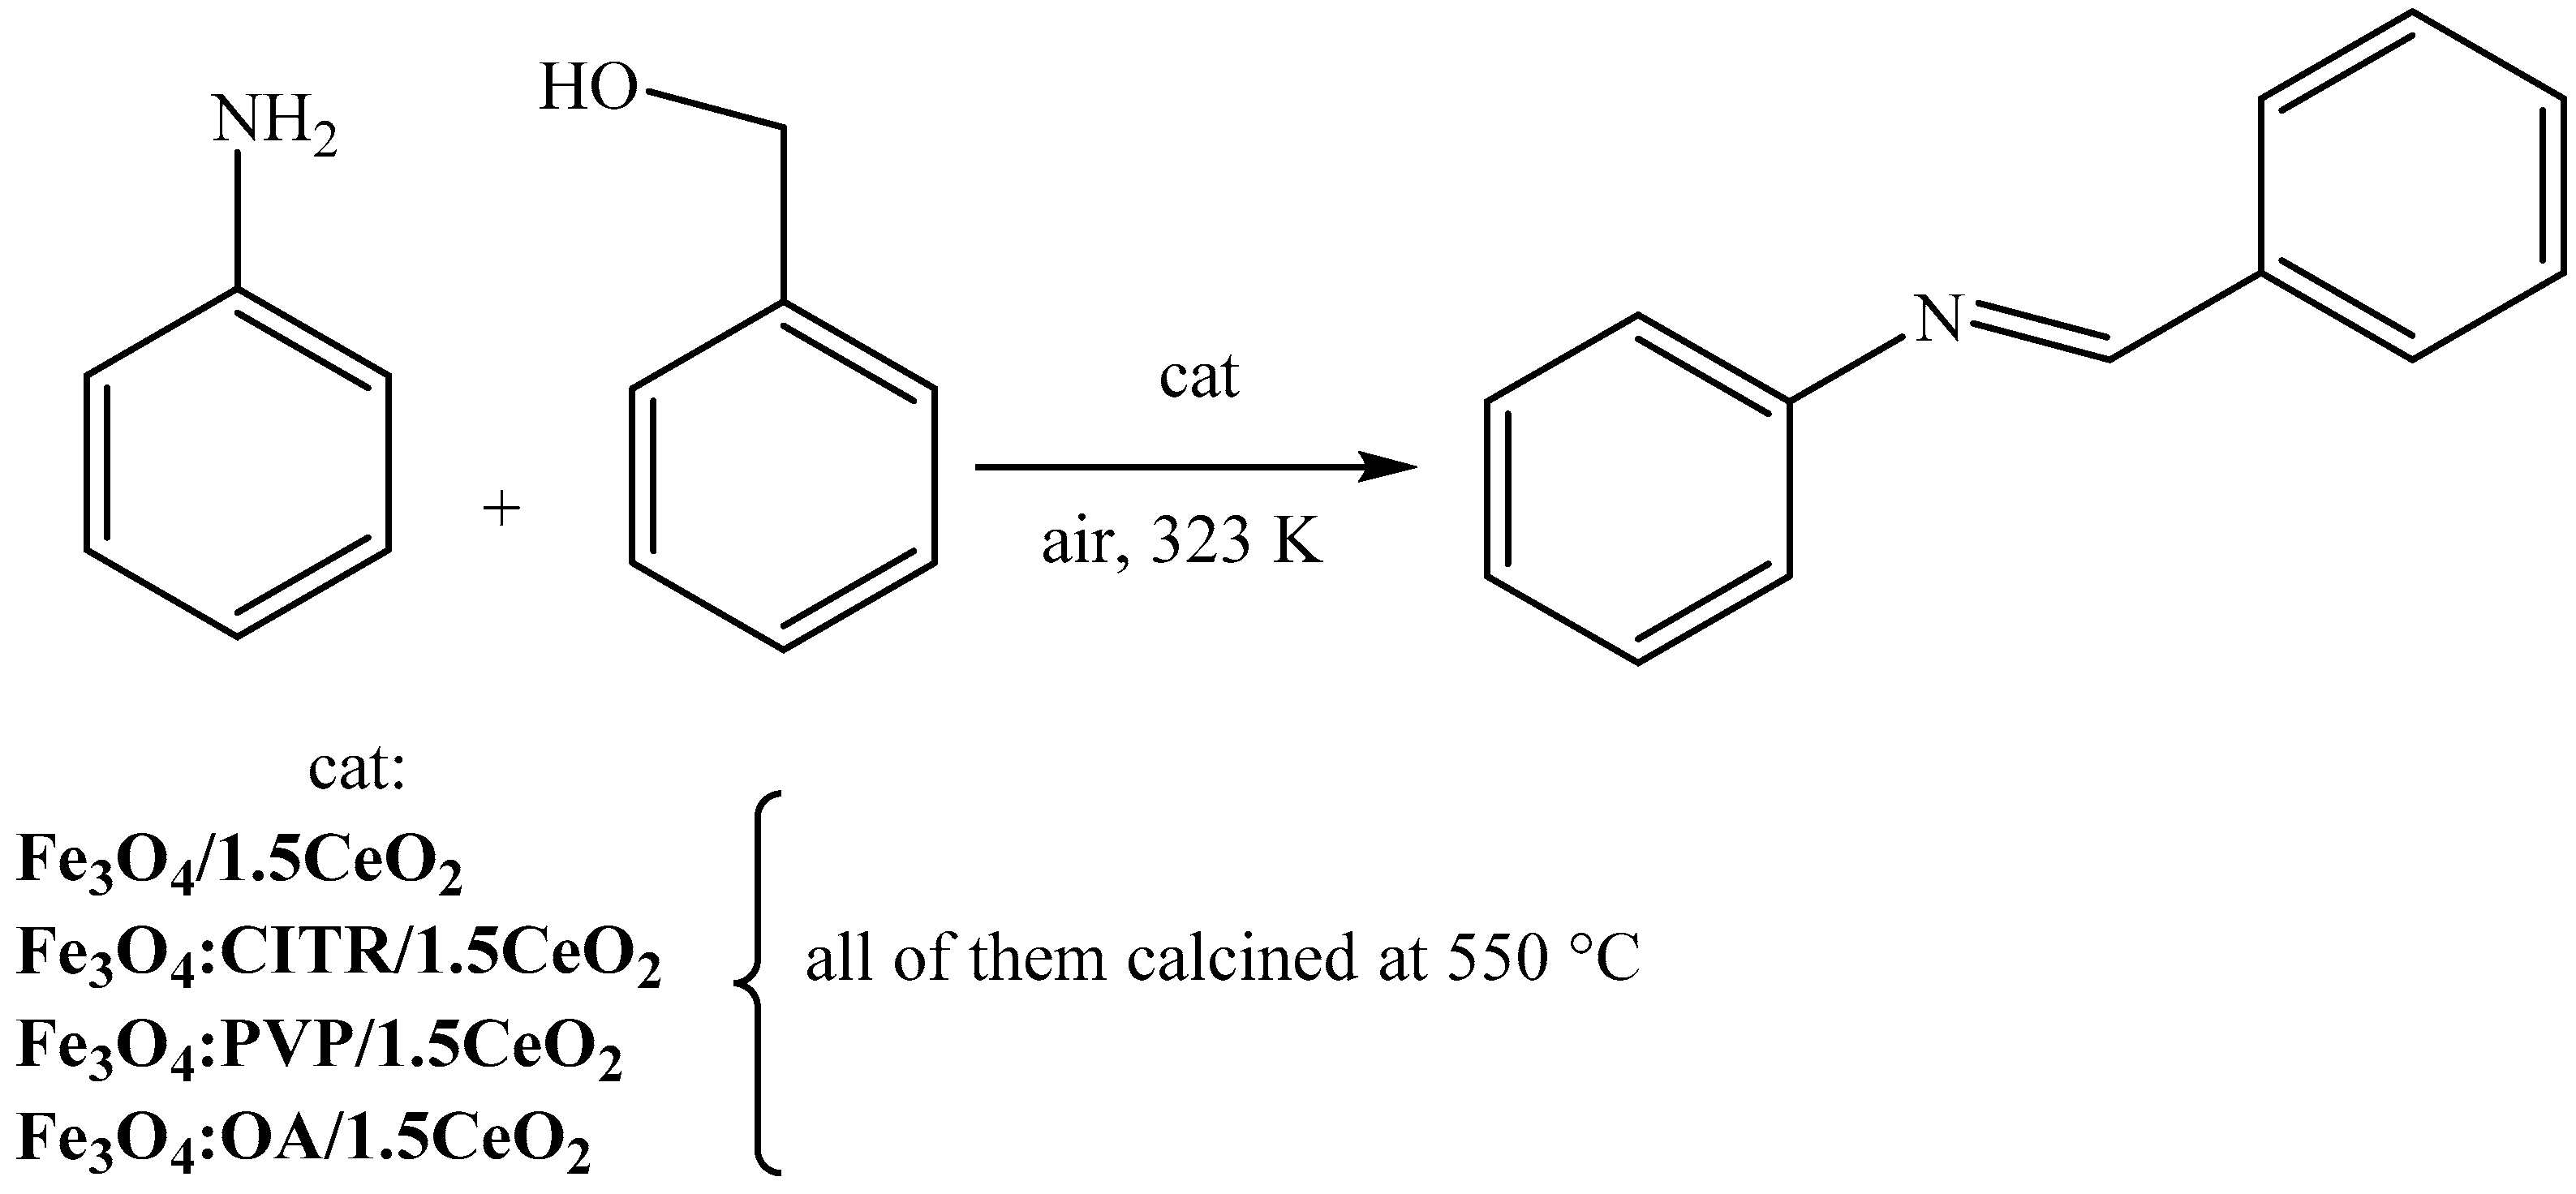
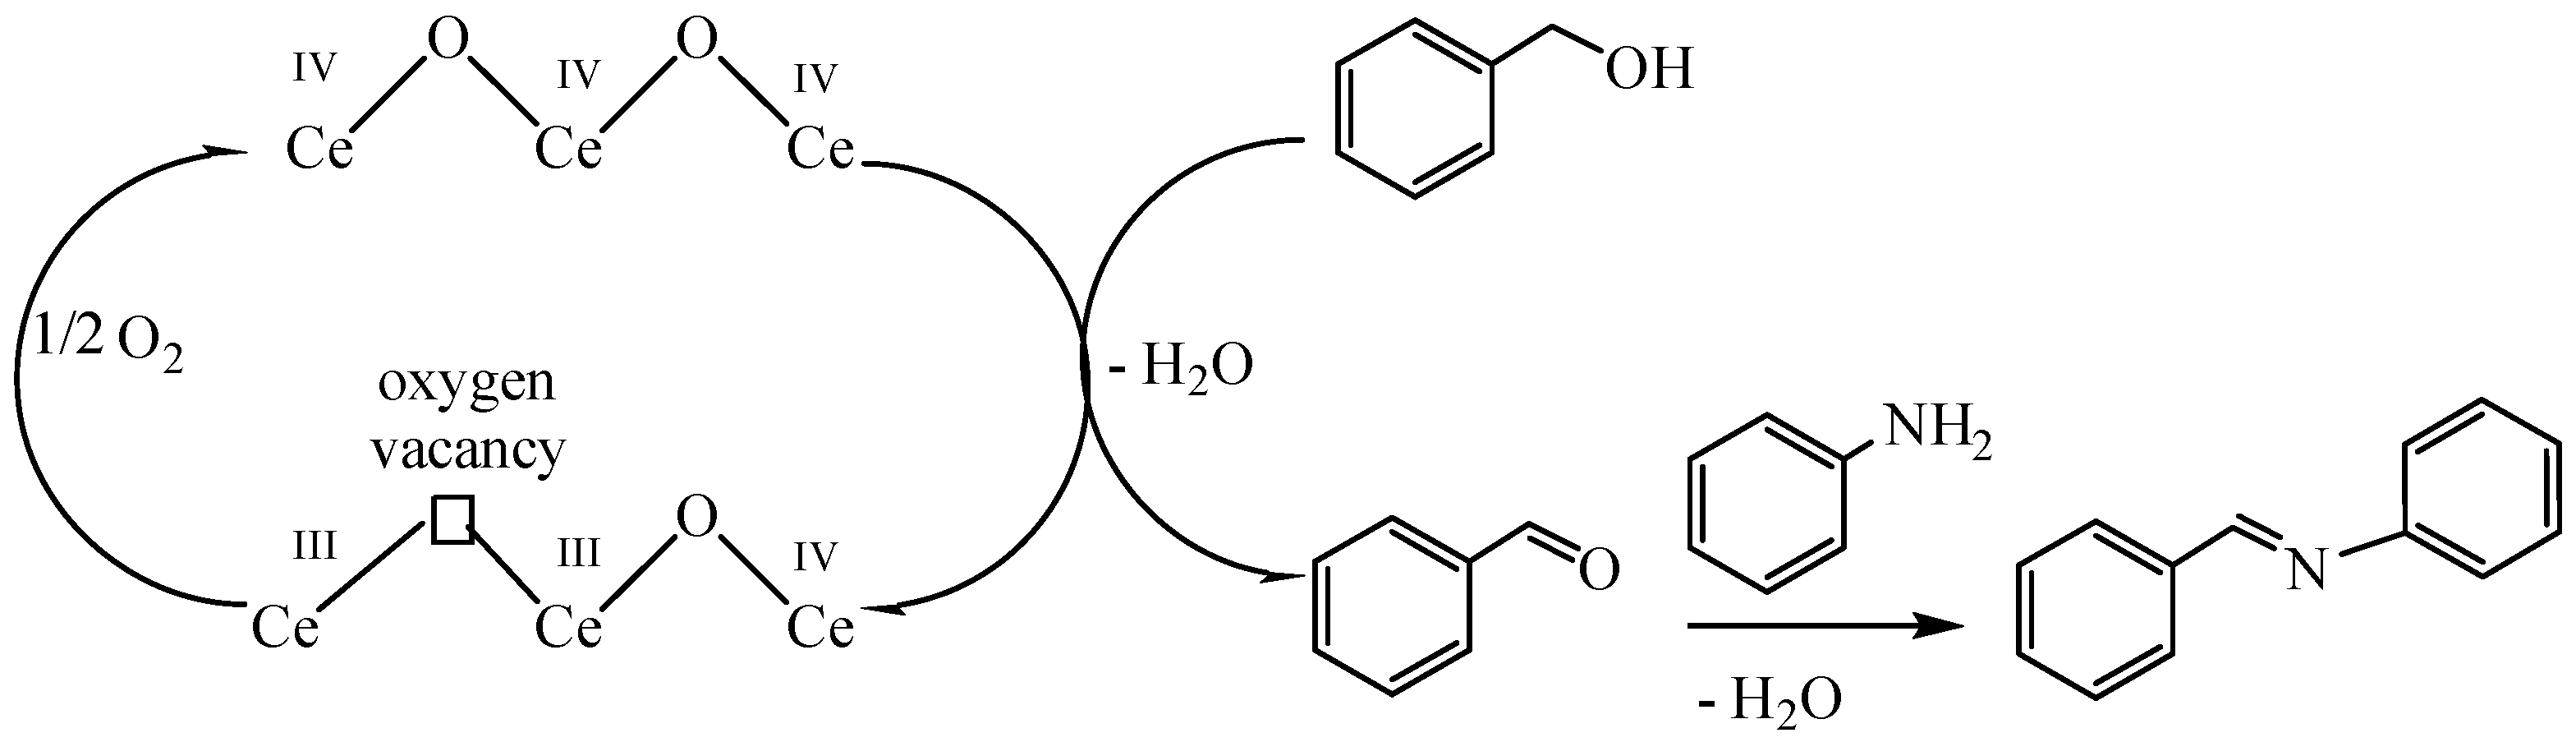
2.7. Catalytic Tests
3. Experimental
3.1. Materials and Methods
3.2. Synthesis of Magnetite-Ceria Nanocomposites
3.2.1. Synthesis of Fe3O4 Nanoparticles
3.2.2. Coating of Fe3O4 Nanoparticles with Ceria
3.3. Synthesis of Ceria Nanoparticles 1.5CeO2 and 0.6CeO2
3.4. Catalytic Experiments
3.5. Reusing of the Catalyst
4. Conclusions
Supplementary Materials
Author Contributions
Funding
Acknowledgments
Conflicts of Interest
References
- Trovarelli, A. Catalytic Properties of Ceria and CeO2-Containing Materials. Catal. Rev. 1996, 38, 439–520. [Google Scholar] [CrossRef]
- Zhang, B.; Zhang, S.-G.; Liu, B. Effect of oxygen vacancies on ceria catalyst for selective catalytic reduction of NO with NH3. Appl. Surf. Sci. 2020, 529, 147068. [Google Scholar] [CrossRef]
- RajeshKumar, S.; Naik, P. Synthesis and biomedical applications of Cerium oxide nanoparticles—A Review. Biotechnol. Rep. 2018, 17, 1–5. [Google Scholar] [CrossRef] [PubMed]
- Kargozar, S.; Baino, F.; Hoseini, S.J.; Hamzehlou, S.; Darroudi, M.; Verdi, J.; Hasanzadeh, L.; Kim, H.-W.; Mozafari, M. Biomedical applications of nanoceria: New roles for an old player. Nanomedicine 2018, 13, 3051–3069. [Google Scholar] [CrossRef] [PubMed]
- Xu, C.; Qu, X. Cerium oxide nanoparticle: A remarkably versatile rare earth nanomaterial for biological applications. NPG Asia Mater. 2014, 6, e90. [Google Scholar] [CrossRef]
- Jasinski, P.; Suzuki, T.; Anderson, H.U. Nanocrystalline undoped ceria oxygen sensor. Sens. Actuators B Chem. 2003, 95, 73–77. [Google Scholar] [CrossRef]
- Montini, T.; Melchionna, M.; Monai, M.; Fornasiero, P. Fundamentals and Catalytic Applications of CeO2-Based Materials. Chem. Rev. 2016, 116, 5987–6041. [Google Scholar] [CrossRef]
- Haeussler, A.; Abanades, S.; Julbe, A.; Jouannaux, J.; Cartoixa, B. Solar thermochemical fuel production from H2O and CO2 splitting via two-step redox cycling of reticulated porous ceria structures integrated in a monolithic cavity-type reactor. Energy 2020, 201, 117649. [Google Scholar] [CrossRef]
- Goubin, F.; Rocquefelte, X.; Whangbo, M.; Montardi, Y.; Brec, R.; Jobic, S. Experimental and Theoretical Characterization of the Optical Properties of CeO2, SrCeO3, and Sr2CeO4 Containing Ce4+ (f0). Ions. Chem. Mater. 2004, 16, 662–669. [Google Scholar] [CrossRef]
- Dhall, A.; Self, W.T. Cerium Oxide Nanoparticles: A Brief Review of Their Synthesis Methods and Biomedical Applications. Antioxidants 2018, 7, 97. [Google Scholar] [CrossRef]
- Thakur, N.; Manna, P.; Das, J. Synthesis and biomedical applications of nanoceria, a redox active nanoparticle. J. Nanobiotechnol. 2019, 17, 1–27. [Google Scholar] [CrossRef] [PubMed]
- Naz, S.; Beach, J.; Heckert, B.; Tummala, T.; Pashchenko, O.; Banerjee, T.; Santra, S. Cerium oxide nanoparticles: A ‘radical’ approach to neurodegenerative disease treatment. Nanomedicine 2017, 12, 545–553. [Google Scholar] [CrossRef] [PubMed]
- Maqbool, Q.; Nazar, M.; Naz, S.; Hussain, T.; Jabeen, N.; Kausar, R.; Anwaar, S.; Abbas, F.; Jan, T. Antimicrobial potential of green synthesized CeO2 nanoparticles from Olea europaea leaf extract. Int. J. Nanomed. 2016, 11, 5015–5025. [Google Scholar] [CrossRef] [PubMed]
- Zhang, Y.; Wu, X.; Hou, C.; Shang, K.; Yang, K.; Tian, Z.; Pei, Z.; Qu, Y.; Pei, Y. Dual-responsive dithio-polydopamine coated porous CeO2 nanorods for targeted and synergistic drug delivery. Int. J. Nanomed. 2018, 13, 2161–2173. [Google Scholar] [CrossRef]
- Huang, X.; Li, L.; Li, G. Synthesis of CeO2 assemblies through interaction with short-chain dicarboxylic acids under facile hydrothermal conditions. RSC Adv. 2019, 9, 28581–28587. [Google Scholar] [CrossRef]
- Zhang, H.; He, X.; Zhang, Z.; Zhang, P.; Li, Y.; Ma, Y.; Kuang, Y.; Zhao, Y.; Chai, Z. Nano-CeO2Exhibits Adverse Effects at Environmental Relevant Concentrations. Environ. Sci. Technol. 2011, 45, 3725–3730. [Google Scholar] [CrossRef]
- Fisher, T.J.; Wang, M.; Ibrahim, Y.; Steffensmeier, B.; Cheung, C.L. Effect of sodium nitrate on microwave-assisted synthesis of ceria nanocubes. Mater. Lett. 2016, 178, 71–74. [Google Scholar] [CrossRef]
- Panda, S.R.; Singh, R.K.; Priyadarshini, B.; Rath, P.P.; Parhi, P.; Sahoo, T.; Mandal, D.; Sahoo, T.R. Nanoceria: A rare-earth nanoparticle as a promising anti-cancer therapeutic agent in colon cancer. Mater. Sci. Semicond. Process. 2019, 104, 104669. [Google Scholar] [CrossRef]
- Xu, H.; Zeiger, B.W.; Suslick, K.S. Sonochemical synthesis of nanomaterials. Chem. Soc. Rev. 2013, 42, 2555–2567. [Google Scholar] [CrossRef]
- Wu, K.; Sun, L.-D.; Yan, C.-H. Ceria-Based Nanocatalysts: Recent Progress in Well-Controlled Synthesis of Ceria-Based Nanocatalysts towards Enhanced Catalytic Performance. Adv. Energy Mater. 2016, 6, 1600501. [Google Scholar] [CrossRef]
- Gao, X.; Chen, C.; Ren, S.; Zhang, J.; Su, D. Structural Effects of Cerium Oxides on Their Thermal Stability and Catalytic Performance in Propane Oxidation Dehydrogenation. Chin. J. Catal. 2012, 33, 1069–1074. [Google Scholar] [CrossRef]
- Trovarelli, A.; Llorca, J. Ceria Catalysts at Nanoscale: How Do Crystal Shapes Shape Catalysis? ACS Catal. 2017, 7, 4716–4735. [Google Scholar] [CrossRef]
- Toyao, T.; Rashed, N.; Morita, Y.; Kamachi, T.; Siddiki, S.H.; Ali, A.; Touchy, A.S.; Kon, K.; Maeno, Z.; Yoshizawa, K.; et al. Esterification of Tertiary Amides by Alcohols Through C−N Bond Cleavage over CeO 2. ChemCatChem 2019, 11, 449–456. [Google Scholar] [CrossRef]
- Kim, D.; Kwon, H.J.; Hyeon, T. Magnetite/Ceria Nanoparticle Assemblies for Extracorporeal Cleansing of Amyloid-β in Alzheimer’s Disease. Adv. Mater. 2019, 31, 1807965. [Google Scholar] [CrossRef] [PubMed]
- Gu, Z.; Li, K.; Qing, S.; Zhu, X.; Wei, Y.; Li, Y.; Wang, H. Enhanced reducibility and redox stability of Fe2O3 in the presence of CeO2 nanoparticles. RSC Adv. 2014, 4, 47191–47199. [Google Scholar] [CrossRef]
- Rashid, J.; Parveen, N.; Haq, T.; Iqbal, A.; Talib, S.H.; Awan, S.U.; Hussain, N.; Zaheer, M. g-C3N4/CeO2/Fe3O4 Ternary Composite as an Efficient Bifunctional Catalyst for Overall Water Splitting. ChemCatChem 2018, 10, 5587–5592. [Google Scholar] [CrossRef]
- Gogoi, A.; Navgire, M.; Sarma, K.C.; Gogoi, P. Fe3O4 -CeO2 metal oxide nanocomposite as a Fenton-like heterogeneous catalyst for degradation of catechol. Chem. Eng. J. 2017, 311, 153–162. [Google Scholar] [CrossRef]
- Farokhi, M.; Parvareh, A.; Moraveji, M.K. Performance of ceria/iron oxide nano-composites based on chitosan as an effective adsorbent for removal of Cr(VI) and Co(II) ions from aqueous systems. Environ. Sci. Pollut. Res. 2018, 25, 27059–27073. [Google Scholar] [CrossRef]
- Khataee, A.; Hassandoost, R.; Pouran, S.R. Cerium-substituted magnetite: Fabrication, characterization and sonocatalytic activity assessment. Ultrason. Sonochemistry 2018, 41, 626–640. [Google Scholar] [CrossRef]
- Zhang, F.; Yao, S.; Liu, Z.; Gutiérrez, R.A.; Vovchok, D.; Cen, J.; Xu, W.; Ramírez, P.J.; Kim, T.; Senanayake, S.D.; et al. Reaction of Methane with MOx/CeO2 (M = Fe, Ni, and Cu) Catalysts: In Situ Studies with Time-Resolved X-ray Diffraction. J. Phys. Chem. C 2018, 122, 28739–28747. [Google Scholar] [CrossRef]
- Dai, Q.; Wang, J.; Yu, J.; Chen, J.; Chen, J. Catalytic ozonation for the degradation of acetylsalicylic acid in aqueous solution by magnetic CeO2 nanometer catalyst particles. Appl. Catal. B Environ. 2014, 144, 686–693. [Google Scholar] [CrossRef]
- Wei, J.; Yao, H.; Wang, Y.; Luo, G. Controllable Preparation and Catalytic Performance of Magnetic Fe3O4@CeO2-Polysulfone Nanocomposites with Core–Shell Structure. Ind. Eng. Chem. Res. 2018, 57, 15039–15045. [Google Scholar] [CrossRef]
- Wu, Y.; Yang, Y.; Zhao, W.; Xu, Z.P.; Little, P.J.; Whittaker, A.K.; Zhang, R.; Ta, H.T. Novel iron oxide-cerium oxide core-shell nanoparticles as a potential theranostic material for ROS related inflammatory diseases. J. Mater. Chem. B 2018, 6, 4937–4951. [Google Scholar] [CrossRef] [PubMed]
- Vono, L.L.R.; Damasceno, C.C.; Matos, J.R.; Jardim, R.F.; Landers, R.; Masunaga, S.H.; Rossi, L.M. Separation technology meets green chemistry: Development of magnetically recoverable catalyst supports containing silica, ceria, and titania. Pure Appl. Chem. 2018, 90, 133–141. [Google Scholar] [CrossRef]
- Gawande, M.B.; Bonifácio, V.D.B.; Varma, R.S.; Nogueira, I.D.; Bundaleski, N.; Ghumman, C.A.A.; Teodoro, O.M.N.D.; Branco, P.S. Magnetically recyclable magnetite–ceria (Nanocat-Fe-Ce) nanocatalyst–applications in multicomponent reactions under benign conditions. Green Chem. 2013, 15, 1226–1231. [Google Scholar] [CrossRef]
- Rizzuti, A.; Dassisti, M.; Mastrorilli, P.; Sportelli, M.C.; Cioffi, N.; Picca, R.A.; Agostinelli, E.; Varvaro, G.; Caliandro, R. Shape-control by microwave-assisted hydrothermal method for the synthesis of magnetite nanoparticles using organic additives. J. Nanopart. Res. 2015, 17, 1–16. [Google Scholar] [CrossRef]
- Tamura, M.; Tomishige, K. Redox Properties of CeO2 at Low Temperature: The Direct Synthesis of Imines from Alcohol and Amine. Angew. Chem. Int. Ed. 2015, 54, 864–867. [Google Scholar] [CrossRef]
- Zhang, J.; Yang, J.; Wang, J.; Ding, H.; Liu, Q.; Schubert, U.; Rui, Y.; Xu, J. Surface oxygen vacancies dominated CeO2 as efficient catalyst for imine synthesis: Influences of different cerium precursors. Mol. Catal. 2017, 443, 131–138. [Google Scholar] [CrossRef]
- Hirano, M.; Kato, E. Hydrothermal Synthesis of Cerium(IV) Oxide. J. Am. Ceram. Soc. 2005, 79, 777–780. [Google Scholar] [CrossRef]
- Leonelli, C.; Lojkowski, W. Main development directions in the application of microwave irradiation to the synthesis of nanopowders. Chem. Today 2007, 25, 34–38. [Google Scholar]
- De Almeida, L.; Grandjean, S.; Vigier, N.; Patisson, F. Insights into the Thermal Decomposition of Lanthanide(III) and Actinide(III) Oxalates—From Neodymium and Cerium to Plutonium. Eur. J. Inorg. Chem. 2012, 31, 4986–4999. [Google Scholar] [CrossRef]
- Lundberg, M.; Skårman, B.; Cesar, F.; Wallenberg, L.R. Mesoporous thin films of high-surface-area crystalline cerium dioxide. Microporous Mesoporous Mater. 2002, 54, 97–103. [Google Scholar] [CrossRef]
- Ma, M.; Zhang, Y.; Yu, W.; Shen, H.; Zhang, H.; Gu, N. Preparation and characterization of magnetite nanoparticles coated by amino silane. Colloids Surf. A Physicochem. Eng. Asp. 2003, 212, 219–226. [Google Scholar] [CrossRef]
- El Desouky, F.G.; Saadeldin, M.; Mahdy, M.A.; El Wahab, S.A.; El Zawawi, I. Impact of calcination temperature on the structure, optical and photoluminescence properties of NanocrystallineCerium oxide thin films. Mater. Sci. Semicond. Process. 2020, 111, 104991. [Google Scholar] [CrossRef]
- Prakash, S. Reduction and sintering of fluxed iron ore pellets-a comprehensive review. J. South Afr. Inst. Min. Metall. 1996, 96, 3–16. [Google Scholar]
- Moloto, L.H.; Manzini, S.S.; Dikio, E.D. Reduction of Magnetite in the Presence of Activated Carbon Using Mechanical Alloying. J. Chem. 2013, 2013, 1–8. [Google Scholar] [CrossRef]
- Wang, S.; Zhang, P. Adsorption and dissociation of H2O monomer on ceria(111): Density functional theory calculations. Mod. Phys. Lett. B 2020, 34, 2050254. [Google Scholar] [CrossRef]


| Entry | Sample | Stabilizer | Shape | Mean Thickness a (nm) | Mean Diameter (nm) |
|---|---|---|---|---|---|
| 1 | Fe3O4 | – | Hexagonal | 40 | 120 a |
| 2 | Fe3O4:PVP | PVP | Hexagonal | 53 | 116 a |
| 3 | Fe3O4:CITR | Trisodium citrate | Spheroidal | – | 60 |
| 4 | Fe3O4:OA | Oleic acid | uasi-Spheres | – | 25 |
Publisher’s Note: MDPI stays neutral with regard to jurisdictional claims in published maps and institutional affiliations. |
© 2020 by the authors. Licensee MDPI, Basel, Switzerland. This article is an open access article distributed under the terms and conditions of the Creative Commons Attribution (CC BY) license (http://creativecommons.org/licenses/by/4.0/).
Share and Cite
Rizzuti, A.; Dipalo, M.C.; Allegretta, I.; Terzano, R.; Cioffi, N.; Mastrorilli, P.; Mali, M.; Romanazzi, G.; Nacci, A.; Dell’Anna, M.M. Microwave-Assisted Solvothermal Synthesis of Fe3O4/CeO2 Nanocomposites and Their Catalytic Activity in the Imine Formation from Benzyl Alcohol and Aniline. Catalysts 2020, 10, 1325. https://doi.org/10.3390/catal10111325
Rizzuti A, Dipalo MC, Allegretta I, Terzano R, Cioffi N, Mastrorilli P, Mali M, Romanazzi G, Nacci A, Dell’Anna MM. Microwave-Assisted Solvothermal Synthesis of Fe3O4/CeO2 Nanocomposites and Their Catalytic Activity in the Imine Formation from Benzyl Alcohol and Aniline. Catalysts. 2020; 10(11):1325. https://doi.org/10.3390/catal10111325
Chicago/Turabian StyleRizzuti, Antonino, Maria C. Dipalo, Ignazio Allegretta, Roberto Terzano, Nicola Cioffi, Piero Mastrorilli, Matilda Mali, Giuseppe Romanazzi, Angelo Nacci, and Maria Michela Dell’Anna. 2020. "Microwave-Assisted Solvothermal Synthesis of Fe3O4/CeO2 Nanocomposites and Their Catalytic Activity in the Imine Formation from Benzyl Alcohol and Aniline" Catalysts 10, no. 11: 1325. https://doi.org/10.3390/catal10111325
APA StyleRizzuti, A., Dipalo, M. C., Allegretta, I., Terzano, R., Cioffi, N., Mastrorilli, P., Mali, M., Romanazzi, G., Nacci, A., & Dell’Anna, M. M. (2020). Microwave-Assisted Solvothermal Synthesis of Fe3O4/CeO2 Nanocomposites and Their Catalytic Activity in the Imine Formation from Benzyl Alcohol and Aniline. Catalysts, 10(11), 1325. https://doi.org/10.3390/catal10111325