Article

Effect of Temperature on the Hydrotreatment of Sewage Sludge-Derived Pyrolysis Oil and Behavior of Ni-Based Catalyst

by
Maria V. Alekseeva (Bykova)
1,2,*,
Olga A. Bulavchenko
1,2,
Andrey A. Saraev
1,2,
Anna M. Kremneva
1,
Mikhail V. Shashkov
1,2,
Olesya O. Zaikina
1,
Yuliya K. Gulyaeva
1,
Andrey N. Grachev
3,
Oleg Kikhtyanin
4,
David Kubička
4 and
Vadim A. Yakovlev
1,2
1
Federal Research Center Boreskov Institute of Catalysis SB RAS, Pr. Akad. Lavrentieva, 5, 630090 Novosibirsk, Russia
2
Department of Natural Sciences, Novosibirsk State University, Pirogova Str., 2, 630090 Novosibirsk, Russia
3
Department of Chemical Technology of Wood, Kazan National Research Technological University, K. Marksa Str., 68, 420015 Kazan, Russia
4
Department of Petroleum Technology and Alternative Fuels, University of Chemistry and Technology Prague, Technická 5, 166 28 Prague 6, Czech Republic
*
Author to whom correspondence should be addressed.
Catalysts 2020, 10(11), 1273; https://doi.org/10.3390/catal10111273
Submission received: 30 September 2020 / Revised: 23 October 2020 / Accepted: 29 October 2020 / Published: 3 November 2020
(This article belongs to the Special Issue The New Catalytic Processes in Alternative Fuel Production)

Abstract

:
The high-energy potential of wastewater sewage sludge (SS) produced in large amounts around the world makes it an attractive feedstock for fuels and energy sectors. Thermochemical valorization relying on pyrolysis of SS followed by hydrotreatment of pyrolysis oil (Py-SS) might even allow the integration of SS into existing oil refineries. In the present study, catalytic hydrotreatment of Py-SS was performed over a NiCuMo-P-SiO2 catalyst in a batch reactor at temperatures in the range of 200–390 °C. Due to sulfur presence in the feed, the increasing reaction temperature induced in situ transformation of metallic Ni into Ni3S2 in the catalyst. In contrast, the Ni3P active phase possessed remarkable stability even at the harshest reaction conditions. The oxygen content in the reaction products was decreased by 59%, while up to 52% of N and 89% of S were removed at 390 °C. The content of free fatty acids was greatly reduced by their conversion to n-alkanes, while the larger amount of volatile aromatics was generated from high molecular mass compounds. The quality of oil-derived products greatly changed at elevated temperatures, providing strong evidence of effective upgrading via decarboxy(ny)lation, hydrogenation, and hydrocracking transformations.

Graphical Abstract

1. Introduction

Over past few decades, global population growth and increasing industrialization have led to the ever-growing production of wastewater sewage sludge (SS) all over the world, which is expected to continue into the future. Therefore, effective wastewater management and sludge disposal have to be developed. The primary physicochemical processing of wastewaters (flotation, sedimentation, and flocculation) followed by their biological treatment and secondary sedimentation processes are widely used, producing the so-called activated sewage sludge [1,2]. The activated sludge is a paste-like organic mineral mass composed of mineral components (30–40%) and organic compounds (60–70%) represented by carbohydrates, proteins, fats, lignin, tannins, etc. [3] The biodegradable organic part usually consists of 50–55% C, 25–30% O, 10–15% N, and 6–10% H, with a small amount of P and S [4]. Activated sludge also contains pollutants and potential carcinogens (heavy metals, dioxins, pathogenic microbes, etc.) [5], making the use of these wastes as fertilizers problematic and disputable. Nonetheless, the high content of organic components makes SS an attractive feedstock for the fuel and energy sector. So far, several approaches have been used towards the utilization of SS, namely: landfilling, thermochemical processing (incineration, pyrolysis, hydrothermal liquefaction, and gasification), and biochemical treatment (anaerobic digestion) [1]. At that, widely used landfilling and incineration approaches might cause different ecological concerns. Along with the generation of heat and electricity, the presence of gaseous pollutants in the flue gases of SS incineration requires additional purification before final emission into the atmosphere [6]. The gasification route, though effective towards the generation of a syn-gas (a mixture of H2, CO, CO2, and CH4) [7], faces several challenges, like, for example, suppressed gasification efficiency affected by high humidity and a low calorific value of SS [8].
Thermochemical valorization by pyrolysis opens the prospects for obtaining valuable liquids from SS [9,10]. For the most part, plenty of studies devoted to SS pyrolysis are based on the experiences obtained in the case of lignocellulosic biomass. In fact, the most important efforts to convert biomass into liquid fuel were made after the oil crisis of the 1970s [11]. At the same time, a significant difference between the lignocellulosic biomass and SS is the higher nitrogen and ash content of the latter. The presence of nitrogen in the sludge originates from the proteins of microorganisms used for water purification, while the ash component can additionally catalyze the pyrolysis process. Compared to incineration and gasification, SS pyrolysis presents some advantages, such as a low bioavailability of heavy metals in the solid residue [12], less purification needed to meet the emission limits, and the endothermic nature of the process, affording products with a higher calorific value [13]. Carver-Greenfield (C-GT), Oil from Sludge (OFS), and Siemens Schwell-Brenna (SSBT) are advanced technologies of SS pyrolysis put into practice to produce liquid fuels [9]. Along with pyrolysis, hydrothermal liquefaction (HTL) is a widely used technique to obtain liquids from SS [14,15,16]. HTL is a specific form of hydrothermal processing that operates at temperatures and pressures around 300–350 °C and 20 MPa respectively, where water is kept in a liquid state below its critical point (subcritical water) [14]. Since the water medium is used for the conversion of organic matter into biocrude oil in the HTL processing, it becomes advantageous for handling biomass feedstocks with high moisture content. However, high-pressure needs are known to increase the construction costs of HTL.
The integration of SS pyrolysis oils (Py-SS, bio-oil) into an existing oil refinery is to be considered as one of the promising options for the production of liquid biofuels. However, a direct integration of Py-SS into an oil refinery might present an obstacle. On the one hand, Py-SS is reported to be a complex mixture of alkanes, alkenes, aromatic compounds, carboxylic acids, fatty acids, aldehydes, ketones, steroids, fatty nitriles, and amides [17]. Moreover, particular attention is to be paid to the considerable amount of nitrogen, oxygen, and water in such feedstock, which makes it substantially different from crude oil and oil distillates. According to the report of Cao et al. [18], the nitrogen-containing compounds in the composition of the Py-SS are mainly amides, nitriles, and nitrogen-heterocyclic compounds. Fonts et al. [17] noted that reducing the nitrogen content in the pyrolysis products of sewage sludge is an important task for the development of this disposal pathway. Among possible solutions, catalytic pyrolysis and catalytic hydroprocessing of the pyrolysis oil deserve attention, by analogy to the conventional oil refining. However, in contrast to SS pyrolysis, the information related to the upgrading of pyrolysis oil via catalytic hydrotreatment is scarcely represented in the literature, typically using different nonpolar and polar solvents to increase bio-oil flowability [19,20]. At that, the presence of sulfur and oxygen-containing chemical species along with the high content of nitrogenous ones, their mutual influence, and considerable amounts of water are expected to pose big challenges for the catalyst and the process efficiency.
In particular, a lack of information is given in the literature regarding what happens with the catalyst itself during the hydrotreatment of sewage sludge-derived oils, which has become the inspiration of the present study. However, catalyst performance is one of the crucial aspects to be taken into consideration upon the development of hydrotreatment catalysts. Arazo et al. [19] reported the use of a nickel-modified HZSM-5 catalyst in biodiesel production from SS bio-oil. The authors considered a fresh catalyst, with a special focus on the effect of temperature, bio-oil/solvent mass ratio, and reaction time on the upgraded bio-oil properties. Izhar et al. [20] addressed the hydrodenitrogenation of bio-oil derived from sewage sludge using sulfided P-added NiMo/Al2O3 catalyst and various solvents. The authors also stressed the importance of the detailed analysis of the feed and product properties. Nonetheless, no special attention was paid to the catalyst stability. Particularly, catalyst deactivation caused by the negative impact of heteroatomic constituents of sewage sludge pyrolysis oil is essential.
Here we report the use of a Ni-based catalyst with a high metal loading, modified by Cu, Mo, and P in the hydrotreatment of pyrolysis oil obtained from sewage sludge. We have shown the potential of such catalytic systems in the hydrotreatment of lignocellulosic bio-oil and its model compounds previously [21,22,23,24]. The use of an advanced heterophase sol-gel method ensured a high surface area of the active metallic Ni in the catalyst. The role of copper was mainly to induce the reduction of nickel [25], while phosphorus and molybdenum additives were intended to improve the catalyst mechanical strength, as well as stability to coking, sintering, and leaching in aggressive reaction media [22,23,26].
Thus, the present study focuses on the detailed consideration of the fresh catalyst, as well as the effect of process temperature and reaction medium on the catalyst performance. In this regard, a wide range of physicochemical tools has been used in the study, such as X-ray diffraction (XRD), high-resolution transmission electron microscopy (HRTEM), X-ray absorption spectroscopy (XANES/EXAFS), etc. Apart from the catalyst, the fate of the different constituents of SS pyrolysis oil under hydrotreatment conditions is of particular interest. However, the present paper only briefly discusses the main tendencies related to the effect of process temperature on the organic matter. Bearing in mind the importance of a more in-depth discussion of this issue, the detailed analysis of the feedstock and upgrading products will be evaluated in a forthcoming publication.

2. Results and Discussion

2.1. Hydrotreatment of Py-SS in a Batch Reactor

The pyrolysis oil (Py-SS) derived from activated sewage sludge was supplied by LLC EnergoLesProm Company (Kazan, Russia), and Table 1 provides its relevant properties. A series of experiments were carried out in a batch reactor to study the effect of temperature on the performance of NiCuMo-P-SiO2 catalyst in the hydrotreatment of Py-SS.
Table 2 presents mass balances after catalytic tests at temperatures in the range of 200 to 390 °C. The data obtained without using the catalyst at 350 °C are reported as well. In each run, the amount of consumed hydrogen and the initial pyrolysis oil were denoted as the “feed” for further mass balance calculations. Figure 1 presents the corrected H2 consumption, taking into account the formation of light hydrocarbons in the gaseous phase. This parameter was observed to increase with the increasing reaction temperature, indicating an increased hydrogenation extent. Interestingly, the corrected hydrogen uptake was about 74 nL per 1 kg of Py-SS under catalyst-free conditions, assumed to be analogous to hydrovisbreaking of heavy petroleum feedstocks [27,28]. Besides, it was lower when compared with catalytic hydrotreatment performed at the same temperature of 350 °C. Although hydrogen was consumed in the absence of a catalyst, the properties of the resulting products might differ substantially from those after catalytic hydrotreatment, as it will be discussed below.
In this study, all mass balances were in the range of 94 to 98 wt. %. In the case of lower process temperatures (200–300 °C), as well as for the non-catalytic hydrotreatment, the mass balances were apparently lower compared to those obtained at 350–390 °C, which was in good agreement with physicochemical peculiarities (Conradson carbon residue and density, Figure 2) of the product oils obtained. At lower temperatures, more dense and viscous products were formed that made the withdrawal of products from the reactor difficult. Consequently, the losses on the mixer and reactor walls were inevitably higher. The increase in reaction temperature resulted also in changes in product yields. The yield of OP products decreased, in good agreement with the increasing yield of gaseous products (light hydrocarbons, CO, and CO2) due to a higher extent of hydrocracking reactions. At the same time, the yield of AP increased as well. This could be associated with the higher extent of deoxygenation reactions, particularly hydrodeoxygenation and decarboxylation of oxygenated compounds present in the feed. However, a confirmation of this assumption by analysis of the aqueous phase was prevented due to its low stability. This resulted in its immediate color change due to some transformations, probably due to atmospheric oxygen. Besides, short-term storage under ambient conditions as well as in a dark cool place resulted in an additional splitting of the aqueous phase into two phases. Therefore, a detailed study of the aqueous phase composition was not performed.
Table 2 presents the yields of gaseous products calculated based on their molar percentages from GC-FID/TPD analysis data. Table 2 shows evidences that the yield of light hydrocarbons C2–C4 and methane increased noticeably at reaction temperatures above 300 °C due to more intense hydrocracking. When reaching 390 °C, an even more pronounced increase in gas phase yield was observed, which is undesirable due to the decreased retention of carbon in the organic liquid phase. The formation of carbon monoxide and carbon dioxide increased with the increasing reaction temperature due to the promotion of decarbonylation and decarboxylation reactions. As evidenced by Table 2, the reactions leading to gaseous phase formation occurred also in the absence of the catalyst. This would indicate that they were either of thermal nature or catalyzed by some metallic impurities in Py-SS. As a confirmation of this assumption, the XRF analysis data revealed the presence of about 2 mg Na, 0.5 mg Mg, 0.4 mg Cl, 0.1 mg Ca, and 0.1 mg Fe per kg of Py-SS, respectively. The lower yield of methane and the higher yield of CO2 in the case of the non-catalytic experiment in comparison with the catalytic one indicates that the primary gas-phase products, such as CO2, were partially hydrogenated in the presence of the catalyst. It was noted that the yield of coke-like solid products on the catalyst surface was lower than 0.5 wt. % and decreased with an increase in the process temperature. This was very likely due to the more intense hydrogenation of reactive coke precursors, which was previously observed during the hydrotreatment of such unstable complex feeds as lignocellulosic pyrolysis oils [29]. In addition, the fairly low amount of coke deposits could be attributed to the dilution of the active metallic Ni phase with other elements: such as copper, molybdenum, and phosphorus. In other words, these elements are likely to increase the distance between the Ni centers active in structure-sensitive reactions leading to coke formation, as it was suggested in [23,25] and thus limit these reactions. The catalyst characterization section provides evidence for such nickel phase dilution.

2.2. The Analysis of Reaction Products

Table 3 presents the elemental composition of the organic-rich phases. As the temperature of hydrotreatment processing increased from 200 to 390 °C, the carbon content in the OPs also increased from 75.7 to 81.6 wt. %, in contrast to 73.5 wt. % (Table 1) of the feedstock used. Nonetheless, at reaction temperature below 300 °C, it did not change considerably, being in the range of 75.7–76.8 wt. %. Considering the only minor changes in H (9.2–9.6 wt. %) and O (10.7–11.6 wt. %) content in products obtained < 300 °C (Table 3), it could be inferred that under these conditions the extent of the deoxygenation reaction was only limited. The hydrogen content increased further to 10.6 wt. % at 350 and 390 °C, thus providing additional evidence of products saturation with hydrogen and deoxygenation. This is corroborated by the decrease in O content to 7.8 and 5.7 wt. %, respectively, at these reaction temperatures. The data from Table 3 also demonstrate a strong correlation with Figure 1 concerning non-catalytic hydroprocessing (red bar). Thus, Table 3 shows lower hydrogen content in the products for the non-catalytic experiment, if compared with OP-350, agreeing with hydrogen consumption data (Figure 1). It is worth noting that the H/C atomic ratio is also a very convenient instrument for assessing the quality of hydrotreatment products, which will be discussed later in this section.
A special mention should be made of heteroatoms (O, N, S) content in organic-rich phases of Py-SS hydrotreatment. Comparing the data provided in Table 1 and Table 3, an obvious correlation with the process temperature can be made concerning oxygen content. It decreases from 13.9 wt. % for Py-SS to 11.6 wt. % at low process temperatures, and up to 5.7 wt. % in severe conditions. This is indicative of an effective, although not yet full, oxygen removal from pyrolysis oil. Besides, the content of oxygen with no catalyst used was 6.5 wt. % on a dry basis. This result might suggest that oxygen was removed extensively by non-catalytic processes. For instance, it is possible that some reactive oxygen-containing species more readily decompose under thermal treatment and contribute most to the observed oxygen decrease. There was no clear tendency observed in the case of nitrogen content versus process temperature. However, at high temperatures as 350 and 390 °C, about half of nitrogen was removed, as the N content dropped from 4.4 for Py-SS (Table 1) to 2.1–2.3 wt. %. Besides, by analogy to oxygen, nitrogen content decreased to 2.7 wt. % without using a catalyst, though being still higher than in the case when the catalyst was present (2.3 wt. %). One of the possible reasons underlying such behavior is that some nitrogen-containing constituents, being polar compounds, could be very likely concentrated in the aqueous phases after processing (including ammonia). Similar observations about nitrogen and oxygen removal trends were made by Biller and co-workers [30]. The authors hydroprocessed bio-crude oil derived by HTL of microalgae biomass using CoMo and NiMo catalysts at two temperatures (350 °C and 405 °C) in a batch reactor. It is to be noted that the composition and quality of bio-crudes obtained via HTL or pyrolysis of wastewater sludge have many similarities with bio-crudes generated from algae feeds [14]. By analogy to the current study, Biller et al. have shown a good performance of the catalysts in terms of deoxygenation; however, the nitrogen content was not reduced to a satisfactory level [30]. Besides, they have shown that non-catalytic and catalytic hydroprocessing at 350 °C provide very close denitrogenation and deoxygenation levels of the feed [30]. This was explained by the presence of the majority of N and O compounds in the heavier, high boiling point fractions of the oil following hydroprocessing. It was expected that high molecular weight polymers containing N and O were not as easily hydrogenated and hydrocracked. The authors also suggested that batch hydroprocessing might be affected by mass transfer limitations, resulting in incomplete heteroatoms’ removal [30]. Later investigation of this scientific group [31] addressed the hydroprocessing of the same bio-oil in a batch-type reactor using Pd/C and bio-Pd/C catalysts. They have reported the oxygen content reduction by 65%, whilst the nitrogen content decreased by 35%, with a bio-oil:catalyst ratio of 20, at a temperature of 325 °C and a reaction time of 4 h [31]. Reductions in N and O provided in Table 3 were similar to those observed by Li et al. [32] in their batch studies of algal bio-oil hydrotreatment. Li et al. [32] reported close elemental composition of the thermally (400 °C) treated oil to that produced at the same conditions but with the HZSM-5 catalyst. The authors have concluded that the combined action of thermal energy and gas-phase H2 result in several desirable changes in the elemental composition of the treated oils. Roussis et al. [33] demonstrated that the removal of oxygen from crude algae oils is possible by thermal means alone and without the use of catalysts or hydrogen. In general, the results obtained in the present study are consistent with findings reported in the literature.
Lastly, a remarkable observation was made concerning sulfur content in organic-rich phases. Obviously, as the temperature of hydroprocessing increased, the amount of sulfur decreased from 0.24 to 0.05 wt. % (Table 3). These results are indicative of an effective sulfur removal from Py-SS, especially if compared with the initial value of 0.47 wt. % for dry pyrolysis oil (Table 1). Moreover, desulfurization appeared to be much more effective in the case of the catalytic processing (0.13 wt. % S) than the non-catalytic one (0.34 wt. % S).
A considerable improvement in the thermal stability of the OPs was observed based on the Conradson carbon residue (CCR) measurements (Figure 2a). By analogy to the thermogravimetric residue (TG residue [34]) or micro carbon residue (MCR, D4530), the CCR is normally used as an indicator of the coking tendency of complex organic feedstocks. The CCR value was about 6.2 wt. % in the case of Py-SS, while for the OPs the CCR value decreased gradually with the growth in reaction temperature (Figure 2a). It is worth emphasizing that, in contrast to catalytic hydrotreatment at 350 °C, the non-catalytic hydroprocessing at the same reaction temperature induced the formation of products with significantly higher coking tendency, as demonstrated by the CCR value of about 9.5 wt. %, which is even higher than that of the feedstock. Thus, it allows concluding that the non-catalytic thermal processing, even in presence of hydrogen, does not improve the stability of the products, as hydrogenation reactions reducing unsaturated bonds, and thus improving thermal stability, cannot take place to a significant extent. Therefore, it is important to use a catalyst in the hydroconversion of pyrolysis oils obtained from sewage sludge.
The density of the organic-rich phase was also higher in the case of non-catalytic hydrotreatment as compared to catalytic processing at 350 °C (Figure 2b). It provides additional evidence that catalytic transformations were more effective and essential for improving the quality of the products formed via hydrotreatment of Py-SS. Interestingly, the density increased for most of the products from 1.003 g/cm3 for Py-SS feed when catalytic hydrotreatment was performed in the temperature range from 200 to 350 °C in presence of NiCuMo–P–SiO2 catalyst. This might be associated with water, which could be separated from the more dense organic part due to a change in polarity, thus causing an increase in the density of the residue (if the original organic part had a higher density than water). Secondly, under mild conditions, the rate of condensation reactions could exceed that of hydrocracking and again lead to an increase in density. The density of OPs became less than 1 g/cm3 only at severe process conditions (390 °C), as could be expected, and this was probably associated with the deeper conversion of Py-SS constituents. Most likely, a detailed characterization of the chemical composition of products would provide a better understanding of these effects, which will be addressed in forthcoming studies. Nonetheless, the density of products is significantly affected by the process conditions. Similarly, the water content of the OPs decreased significantly due to hydrotreatment (Figure 3a), as all products contained less than 4 wt. % while the Py-SS had ca. 9 wt. %. After hydrotreatment at 390 °C, the water content decreased almost to 0.5 wt. %, indicating low polarity and hydrophilicity of the OPs. Surprisingly, there was no difference in water content between catalytic and non-catalytic experiments.
Figure 3b reveals H/C atomic ratios calculated on a dry basis for the feed and the organic-rich phases. The data provided in Figure 3b show that in all cases the H/C atomic ratio of OPs is higher than that of Py-SS, also defined in the figure (1.25 for Py-SS). For non-catalytic processing, this parameter appears to be quite close to the initial feed, while the H/C ratio drastically increased in the presence of the catalyst. Thus, in contrast to a monotonous increase in hydrogen consumption with increasing process temperature (Figure 1), the change in the H/C ratio is more complex, as is evident from Figure 3b. In the temperature range from 200 to 300 °C, the atomic H/C ratio decreases to some extent (from 1.52 to 1.43), while increasing the process temperature up to 350 °C results in a significant improvement of the H/C ratio. In general, the H/C ratio will increase either due to H-addition or due to C-abstraction. The results perhaps show that H-addition is more important and is the main pathway in catalytic experiments. On the other hand, the non-catalytic experiment mostly allows C-abstraction (through decarbo(ny)xylation) and less effective hydrogen consumption, if compared to catalytic processing (Figure 1). The 0.2 difference at 350 °C presumably reflects the effect of H-addition on top of decarbo(ny)xylation. A small decrease in the H/C ratio is observed at 390 °C, very likely associated with C-abstraction and more intense formation of gaseous products (Table 2). Li et al. [32] also noted that the H/C ratios of algae-derived oils treated at the harshest conditions fell below that of the bio-crude due to their high aromatic content and the migration of H atoms into the gaseous products.
In order to evaluate differences in the chemical composition of organic samples, a GC–MS study was performed. This method, widely used by different authors to study SS pyrolysis oils [8,18,35,36,37,38,39,40,41], gives semi-quantitative results suitable for comparing relative percentages of compounds in analyzed complex mixtures. In the present study, the composition of Py-SS was compared with that of organic-rich phases (OP) obtained by Py-SS hydrotreatment at 350 and 390 °C. It is to be noted that this section shows only the data for the GC-eluted portion of analyzed samples since nonvolatile high molecular weight and thermally unstable compounds cannot be assessed by GC–MS.
Around 78%, 84%, and 90% of the total chromatographic areas were identified in Py-SS and organic-rich phases OP-350 and OP-390, respectively. The total ionic chromatograms are shown in Figure S1 (TIC1, TIC2, and TIC3, respectively). The assignment of chromatographic peaks and relative peak areas are provided in Table 4. As is mentioned in the Experimental section, the data presented are not absolute and serve only for evaluation of trends.
It was previously noted that constituents of sewage sludge pyrolysis oil are derived mainly from the protein and the lipid fractions of sewage sludge [42]. The compounds identified in TICs 1-3 were grouped into the following chemical families based on the functionalities in their molecular structures: monoaromatics, polycyclic aromatic hydrocarbons (PAHs), O-aromatic compounds (substituted phenols), alkanes, acids, esters, polycyclic compounds, and N-heteroaromatic compounds. Several identified oxygen-containing products that cannot be attributed to compounds with the above-mentioned functional groups were classified as “other oxygenated compounds”. This group consisted of cyclopentane and cyclopentene oxygen-containing derivatives, benzoic acid, and oxygenated long aliphatic chains (n-decanal, 7-tetradecen-1-ol). All these compounds were absent after hydrotreatment processing, probably due to their transformation into other hydrocarbon species via deoxygenation. Methyl cyclopentenones were also found in pyrolysis oil by Dominguez et al. [37] and Fonts et al. [43].
Although there were some intersections in the qualitative composition of the samples concerned, generally different chromatographic profiles (Figure S1) indicated that hydrotreatment processing had a major influence on the composition of oils. Thus, the GC–MS analysis of OP-350 and OP-390 demonstrated that GC-eluted fractions of these samples were very different from those of the pyrolysis oil.
Table 4 demonstrates that a large portion of the Py-SS comprised fatty acids, such as palmitic acid (about 11.5%), oleic acid (about 10.6%), stearic acid (6.8%), and linoleic acid (6.1%). Fatty acids were also found in large quantities in sewage sludge pyrolysis oils by many other researchers [35,36,37,38,39,44,45]. Along with high molecular fatty acids, Py-SS contained more volatile acids, namely acetic acid, propanoic, and crotonic acid, which released stronger odors [45]. It is worth mentioning that the specificity of the self-designed chromatographic column used in the study and based on quinolinium ionic liquids opened the prospects for better separation of carboxylic acids and phenolic compounds, while normally derivatization is required to increase their volatility and efficiency of chromatographic separations (peak shapes). Previously, the advantages of a quinolinium ionic liquid column for separating these compounds were shown for lignocellulose-derived bio-oil [46].
The drastic change in n-alkanes (C13–C17) content for OP-390, if compared to Py-SS and OP-350, was observed, very likely due to the conversion of long-chain fatty acids and their methyl esters. At that, the most abundant n-alkanes C15 and C17 in OP-390 can be formed via decarboxylation of palmitic (C16) and stearic acid (C18), and hydrogenation-decarboxylation of unsaturated oleic and linoleic acids (C18), respectively. Moreover, the decarboxylation transformations give rise to CO2, which was evidenced by the gas formation data (see Table 2). Generally, the presence of long-chain aliphatic hydrocarbons in pyrolysis oil is of particular importance for its use as a fuel. A number of previous studies showed a large portion of straight-chain aliphatic hydrocarbons in SS pyrolysis oils [35,36,37,38,39,41,44].
Other researchers studying the pyrolysis of sewage sludge found significant quantities of monoaromatics, PAHs [36,38,39,44,47], and oxygen-containing aromatic compounds [36,37,41,44,48] in pyrolysis oils. It was suggested that secondary reactions of oxygenated compounds (phenols, cresols, and xylenols) at moderate to high temperatures can produce monoaromatics and PAHs via deoxygenation [49]. The relative amounts of PAHs with two to three rings (naphthalene and phenanthrene alkyl derivatives), monoaromatics, and O-aromatic species were observed to increase after Py-SS hydrotreatment. Especially phenol derivatives were detected in significant proportions. According to Table 4, the amount of monoaromatic species increases from 2.1% TIC area for Py-SS to 4.93% and 13.35% for OP-350 and OP-390, respectively. After hydrotreatment at 390 °C, there is a two-fold increase in the relative amount of oxygen-containing aromatics: from about 23% (Py-SS) to 43.6% of the TIC area (OP-390). All these trends might be associated with increased volatility of corresponding types of molecules due to the hydrocracking of higher molecular mass substances, which are less volatile.
It is to be noted that different nitrogen-containing species (aliphatic and aromatic ones) are very important from the viewpoint of NOx formation when sewage sludge oils are used in fuel applications [50]. In the present study, GC–MS analysis could not reveal any N-containing compounds in Py-SS, as it is very likely that nitrogen was a part of high molecular weight nonvolatile species invisible for GC–MS. Moreover, elemental analysis of Py-SS pointed out that nitrogen content in the feed was quite significant, about 4 wt. % (Table 1). Biller et al. [30] reported that N-containing species occurred in the high boiling fractions of the bio-crude due to being linked to condensed structures, which are not cracked at the hydrotreating conditions. The N-containing compounds were still hardly visible after Py-SS hydrotreatment. Among them, indole derivatives in the amount of less than 1% are given in Table 4.
As a short summary to this section, the relative amount of free fatty acids was greatly reduced by their plausible transformation into alkanes with increasing Py-SS hydrotreatment temperature, in agreement with hydrogen consumption and gas evolution data. Besides, more volatile aromatic species (monoaromatics, oxygen-containing aromatics, and PAHs) were generated. The results clearly indicated that the quality of organic-rich phases was greatly changed at elevated temperatures, very likely due to decarboxylation, hydrogenation, and hydrocracking.

2.3. Catalyst Characterization

2.3.1. Fresh Catalyst

In general, the catalyst preparation procedure was inverse to a common method when solid catalyst support is impregnated by the solution of corresponding metal salts. Oppositely, the heterophase sol-gel technique is based on an interaction between a solid metallic precursor and ethyl silicate. Such an approach opens opportunities for the preparation of a catalyst with any content of active metal, being advantageous. The Si-containing agent is to be hydrolyzed followed by the thermal treatment of the metal precursor, which results in the formation of amorphous silica and silicate-alike species on its surface [51].
The reduced NiCuMo-P-SiO2 catalyst had the following textural characteristics: the specific surface area ABET—116 m2/gcat; the total pore volume VΣ—0.19 cm3/gcat, and the average pore diameter—6.6 nm. The micropore volume Vμ was about 0.002 cm3/gcat. It is to be noted that the specific surface area of such types of catalytic systems appears to be quite high, despite the high content of the active metallic component. The textural properties of the catalyst are mostly attributed to the amorphous silica matrix and a special synthesis approach based on a heterophase sol-gel technique [51].
Temperature-programmed reduction allows studying the reduction behavior of active phase precursors and determines the appropriate temperature for their reductive activation. TPR profile of NiCuMo-P-SiO2 catalyst presented in Figure 4 reveals two reduction regions:
  • Low-temperature region with a series of small peaks (150–350 °C) predominantly corresponds to the reduction of CuO and well crystallized NiO particles with a defective structure, weakly bonded with SiO2 [23].
  • High-temperature region with one dominant peak corresponds to the reduction of oxide-silicate Ni forms, Mo6+ species into Mo4+, and the total reduction of Mo4+ into metallic Mo0 [23,52]. Moreover, the reduction of phosphate species occurs in this region as well because of the high thermal stability of the P–O bond [53].
In our recent studies, similar TPR profiles were obtained for the NiCu-based catalysts modified by molybdenum and phosphorus [22,23]. On the one hand, the presence of one intense hydrogen consumption peak in the TPR profile is very likely to be explained by the formation of highly dispersed Mo oxides and their intimate contact with NiO. In the case of P-containing samples, the intense peak of hydrogen consumption was also observed at high temperatures (650–750 °C), presumably pointing out the strong interaction of components in these systems. Otherwise, several peaks could be expected in the TPR profiles starting from 200 °C, which could be attributed to the reduction of Ni (II), Cu (II), and P and Mo oxide forms. For the previously studied NiCuMo-P catalysts, the maximum of reduction was at much higher temperatures (650 and 750 °C) if compared with NiCuMo-P-SiO2 (Figure 4) having its maximum at 525 °C. This is very likely associated with a lower amount of phosphorus in this catalyst.
XPS spectra (Figure S2) of the studied catalyst show lines corresponding to Ni, Cu, Si, Mo, P, and O. No impurities of other elements were found. The relative atomic concentrations of the corresponding elements determined based on the XPS data are shown in Table 5. Before the measurement, the catalyst in reduced and passivated form (Section 2.2) was additionally reduced at 450 °C by H2 inside the high-pressure cell of the XPS spectrometer to remove the passivating oxide film. The reduction procedure is described in detail in the Supplementary Materials.
From Table 5 it is evident that atomic ratios El/Si (where El = Ni, Mo, Cu, and P) are much smaller than those in the case of a homogeneous distribution of the elements in the catalyst (as proved by XRF, see Section 3.2). This difference indicates that the surface is enriched with Si, while most of the other elements (especially Ni and Cu) are in an external volume. Si2p spectrum of NiCuMo-P-SiO2 catalyst (for typical spectrum see reference [22]) shows a wide symmetric peak corresponding to silicon in the Si4+ state. This line was used as an internal standard (EBE = 103.3 eV) to take into account the charging effect of the samples. Ni2p spectrum (Figure S2, Ni2p) with two narrow intense peaks at 852.6 and 869.7 eV evidenced nickel to be in the metallic state. This was additionally confirmed by spin-orbit splitting (the difference between the Ni2p1/2 and Ni2p3/2 binding energies) of 17.2 eV, whereas this value is 17.6–17.8 eV for nickel in the oxidized state Ni2+. Additional peaks at 858.6 and 874.7 eV correspond to plasmon losses [54].
The shape of the Cu2p spectrum (Figure S2, Cu2p) indicates that copper exists in the reduced state, since there is no intense shake-up satellite characteristic to the Cu2+ state. The integral intensity of the shake-up satellite in the CuO spectrum, for example, reaches 55% of the intensity of the Cu2p3/2 main line [55]. In the spectra of Cu1+ compounds and that of metallic copper, no shake-up lines of satellites are observed. The Cu2p3/2 binding energies for Cu0 and Cu1+ are quite close, making it difficult to distinguish between them. Based on our previous studies for similar catalysts [52,56], it was assumed that copper is in the metallic state in the reduced NiCuMo-P-SiO2 catalyst, with a Cu2p3/2 binding energy of 932.3 eV.
Unlike copper and nickel, Mo is only partially reduced. Mo3d spectrum (Figure S2, Mo3d) contains three Mo3d5/2–Mo3d3/2 doublets with Mo3d5/2 binding energies of 227.9, 229.2, and 231.6 eV. These binding energies correspond to molybdenum in the metallic Mo0 as well as Mo4+, and Mo5+ oxidized states, respectively. The binding energies of Mo3d5/2 provided in the literature for Mo0, Mo4+, Mo5+, and Mo6+, are in the respective ranges of 227.7–227.9, 229.2–229.9, 230.8–231.6, and 232.7–233.2 eV [57,58,59,60,61]. It is to be also noted that Mo0 comprised about 10% of all molybdenum species in the near-surface layer of the NiCuMo-P-SiO2 catalyst.
According to the P2p spectrum of the reduced catalyst revealing two peaks (Figure S2, P2p), a substantial part of phosphorus exists as metal phosphides Pδ− (129.5 eV). A higher binding energy peak (134.5 eV) corresponds to phosphorus P5+ in the composition of phosphate groups (PO4)3− [62,63].
XANES and EXAFS X-ray absorption methods were used to study the chemical composition and the structure of the NiCuMo-P-SiO2 catalyst, providing additional information to the XRD and XPS data. The study was performed for the reduced and passivated NiCuMo-P-SiO2 catalyst after an additional reduction in situ at 400 °C.
Figure 5a and Figure 6 show the Ni and Cu K-edge XANES spectra for NiCuMo-P-SiO2 catalyst, along with that for standard nickel and copper samples. The K-absorption edge of metallic Ni is at 8333 eV [64]. At that, the metallic Ni XANES spectrum revealed the presence of two peaks in the region of 8350–8360 eV of approximately the same intensity, as well as a shoulder at 8335 eV (transition 1s → 3d). In contrast to the XANES spectrum of metallic nickel, the NiO spectrum shows an intense peak at 8350 eV [65,66]. From Figure 5a it is evident that in the case of our test sample NiCuMo-P-SiO2 the Ni K-edge XANES spectrum had a shape similar to that of metallic nickel.
The module of k2-weighted Fourier transformation of k2χ(R) EXAFS oscillations observed at the Ni K-edge of the studied sample is also shown in Figure 5b. The EXAFS curve of the nickel absorption edge of the NiCuMo-P-SiO2 catalyst exhibited an intense broadened peak, having its maximum at 2.05 Å. The same peak was also present in the EXAFS curve of a standard Ni foil at 2.2 Å and corresponded to Ni–Ni distances. The broadening of peaks in EXAFS curves was accounted for by thermal and structural disorder. In general, the EXAFS analysis data provided additional confirmation that practically all nickel was in the metallic state in the reduced NiCuMo-P-SiO2 catalyst.
The absorption edge of the XANES spectrum for metallic copper is at 8979 eV [64]. The spectrum had a characteristic shoulder at 8981 eV and two peaks at 8993 and 9002 eV. By analogy to Ni, the Cu K-edge XANES spectra in the case of the NiCuMo-P-SiO2 catalyst (after additional in situ reduction at 400 °C) resembled that of the standard copper foil.
The Mo K-edge XANES spectra are shown in Figure 7a. The absorption edge was determined from the maximum of the first derivative of the XANES spectra; for metallic molybdenum, the absorption edge is at 20,000 eV [64]. The Mo K-edge XANES spectrum for the studied catalyst had a shape similar to that of MoO2 used as a standard. This suggested that this state of molybdenum was present in the NiCuMo-P-SiO2 catalyst. The intensity of the near-edge peaks is known to be quite sensitive to the symmetry of the environment of the absorbing atom. The near-edge features in the Mo XANES spectra of the studied catalyst were weakly pronounced. However, a small shoulder was observed at about 20,005 eV, which was similar to the standard MoO3 sample, while there was no such shoulder in the case of the MoO2 and Mo spectra. Usually, a linear combination fitting (LCF) is applied for the XANES data processing [67]. In this approach, the unknown spectrum is modeled by least-squares fitting using a linear combination of known structures. In the present study, the linear combination of Mo, MoO2, and MoO3 spectra could not provide satisfactory fitting of Mo K-edge spectrum of the NiCuMo-P-SiO2 catalyst, which could be associated with the following reasons. On the one hand, apart from the set of known structures used in the study (Mo, MoO2, MoO3), there may be some other states of Mo in the catalyst, which cannot be taken into consideration. Therefore, the excellent fitting of the unknown spectrum could not be achieved in this case. The second point is that the shape of the XANES spectra might depend on the crystallinity of phases comprising the NiCuMo-P-SiO2 catalyst. In this case the catalyst constituents are highly dispersed and the peaks might become less pronounced, which is actually observed in the Mo K-edge XANES spectrum of the concerned catalyst. Besides, this is in good agreement with the XRD data (vide infra). The diffraction pattern of the fresh reduced NiCuMo-P-SiO2 did not reveal any states of Mo, pointing at their highly dispersed or amorphous state. Nevertheless, the XANES data of the NiCuMo-P-SiO2 catalyst provided us with good evidence that among the states of molybdenum, there are considerable amounts of MoO2 and MoO3 in the catalyst bulk.
Figure 7b shows the modules of the k2-weighted Fourier transforms of k2χ(R) EXAFS oscillations observed at the Mo K-absorption edge. In the EXAFS curve of the NiCuMo-P-SiO2 sample, several peaks were observed at radial distances of 1.0, 1.5, 1.9, and 2.2 Å. The first two peaks may relate to a photoelectron wave scattering by light atoms from the nearest environment. It was noted that the peaks at 1.15 and 1.59 Å were also present in the EXAFS curve of MoO3 and corresponded to Mo–O distances. A similar peak at 1.5 Å in the spectrum of MoO2 was attributed to Mo–O distance as well. Peaks at longer distances may relate to the scattering of the photoelectron wave by the heavier atoms of Ni and Mo. This applies to a peak at 2.44 Å present in the EXAFS curve of the standard Mo foil. Considering this, it can be argued that in the EXAFS curve of the NiCuMo-P-SiO2 sample, the main contribution to the peak at 2.2 Å is due to Mo-Mo scattering paths in metallic molybdenum. Besides, the formation of Mo-Ni solid solution cannot be excluded. In general, it can be concluded that the test sample contained molybdenum oxide and metallic species, which is consistent with the XANES spectrum analysis.

2.3.2. The Study of a Spent Catalyst after the Hydrotreatment of Py-SS

Since the reaction medium and process conditions might cause considerable changes in the catalyst properties, the structural and morphological features of the spent catalyst samples were studied by XRD and HRTEM techniques. Figure 8a shows X-ray diffraction patterns of the studied NiCuMo-P-SiO2 catalyst in the oxidized, reduced state, and after Py-SS hydrotreatment at different temperatures from 200 to 390 °C. Broad diffraction peaks corresponding to NiO reflections (PDF # 471049) and relatively narrow reflections due to CuO (PDF # 05661) were observed in the XRD pattern of the oxidized catalyst, whereas Mo- and P-containing phases were not observed. After reduction, the signals of oxidic phases disappeared and intensive XRD reflections due to metallic Ni and Cu appeared. Moreover, small diffraction peaks located at 2θ = 41.9 and 46.7° were attributed to the Ni3P phase. After hydrotreatment experiments, the XRD patterns changed dramatically. The relative intensity of metallic Ni reflections decreased, along with the appearance of Ni3S2 reflections. Taking into account these changes, the quantitative phase analysis was performed based on the Rietveld method [68]. The data given in Figure 8b for freshly reduced and spent catalyst samples show the increasing amount of Ni3S2 from 40 to 62–65% when the process temperature rose from 200 to 390 °C. Oppositely, the relative amount of metallic Ni phase decreased from 74 to 23%. Here, it is worth noting that the amount of Ni3P changed more smoothly—from 21% for the freshly reduced catalyst to 14% in the case of the severest reaction conditions. A slight deviation from this tendency was observed for the last sample sp-390, due to the inaccuracy of the method. Additionally, low-intense XRD reflections attributed to the MoS2 phase (at 2Θ of 33 and 58°) could be hardly distinguished in the X-ray diffraction pattern of this sample. Their presence, though not taken into account in the calculations, might have a small influence on the resulting values; nevertheless, the general trend is evident.
The lattice parameter of metallic Ni was in the range of 3.542–3.549 Å and differed from the reference value of 3.523 Å for Ni (PDF # 040850). A possible explanation for this is the modification of the nickel structure by Cu and/or Mo atoms with the formation of bi- and tri-metallic solid solutions, observed in our previous studies as well [22]. For metallic Cu, the lattice parameter value corresponds to 3.615–5.614 Å, which is close to that reported in the literature for pure metallic copper phase—3.615 Å (PDF # 040836). Besides, the relative amount of copper detected in the XRD decreased from 5 to 1% with the increasing reaction temperature. This is very likely due to copper incorporation into the metallic Ni phase, following the increased lattice parameter of Ni. However, the inaccuracy of the method applied should also be taken into consideration.
As indicated above, spent catalysts contained sulfur. The amount of sulfur increased from 7.1 to 13.5 wt. % with the increasing reaction temperature (Table 6). At the same time, the content of sulfur in organic phase products oppositely decreased from 0.24 to 0.05 wt. % (Table 3), in all cases being lower than that for the initial feed (0.47 wt. % of S for Py-SS). In agreement with XRD data, this implies that sulfidation of the catalyst was favored by the increasing reaction temperature. The effect of sulfur onto Ni-based catalysts was demonstrated by other research groups focusing on the hydrotreatment of various biomass-derived feedstocks. Boscagli et al. [69] studied the hydrotreatment of pyrolysis oils obtained from different biomass feeds. One of their crucial findings was that the effect of sulfur poisoning of Ni-based catalysts was a factor determining the catalyst activity, selectivity, and deactivation of certain reaction paths. By characterization of the spent catalysts, they have shown that sulfur was directly bonded to the nickel nanoparticles forming Ni3S2 in addition to coke and alkali metal deposition on the catalyst surface. It was shown by Mortensen et al. [70] that Ni/ZrO2 used as a catalyst for the hydrodeoxygenation of guaiacol was subjected to irreversible deactivation by the formation of a bulk NiS-like phase. Unlike other impurities in the feed, which were potassium and chlorine, sulfur was found to be the worst poison.
Thus, in conjunction with the sulfur content data, the phase composition of the catalyst before and after hydrotreatment brings us to the following main conclusion. Unlike the case of pyrolysis oil from lignocellulose, catalysts based on metallic Ni can be hardly considered a good choice for the hydrotreatment of pyrolyzed sewage sludge due to a significant catalyst restructuring from the metallic into the sulfide state. However, despite the nature of this transformation, it actually has a positive effect on removing sulfur from such feed, being one of the main goals. At the same time, high stability observed for the nickel phosphide species in the present study makes them quite promising for the hydroconversion of pyrolysis oil from sewage sludge.
An HRTEM investigation of freshly reduced catalyst (Figure 9) revealed the presence of metallic nickel particles with a size of 15–20 nm, in good agreement with XRD data. Besides, the presence of Ni3P species was additionally evidenced. It was interesting to see that phosphide particles were stacked to the “neighboring” metallic nickel particles. Molybdenum oxide species MoOx as well as silicon oxide species were shown to be uniformly distributed in the catalyst, being in a well dispersed and therefore X-ray amorphous state. Drastic changes were observed after using the catalyst in Py-SS hydrotreatment at the severest conditions (390 °C). A considerable part of metallic Ni particles was transformed into Ni3S2 species, while others were still preserved in the amorphous silica matrix. In contrast, Ni3P particles remained quite stable, stacked to the “neighboring” nickel sulfide particles. MoOx species were also transformed into a stacked MoS2 phase (multilayered MoS2 particles composed of 4–6 layers), providing additional evidence to XRD data for the sp-390 sample. EDX analysis data (Figure 9) provided additional evidence of the increased amount of sulfur in the catalyst after hydrotreatment. In addition, iron was detected in the sp-390 sample, very likely associated with the deposition of iron initially presented in the feed. The presence of Fe in pyrolysis oil (about 0.1 mg/kg) was confirmed by XRF analysis. It is to be noted that despite most of the inorganic matter of sewage sludge being separated in the solid residue after the pyrolysis process, the presence of different inorganic impurities in the liquid product cannot be avoided [1,9,12]. Therefore, it is reasonable to expect that such impurities might be deposited on the catalyst during Py-SS hydrotreatment. Nonetheless, in the present study, the EDX analysis has revealed no other deposited metals in the sp-390 sample, even under the harshest process conditions.
Summarizing, the data obtained by XRD and HRTEM allow us to conclude that the reaction medium and process temperature strongly affected the performance of the NiCuMo-P-SiO2 catalyst under the hydrotreatment conditions applied. In this research, it became possible to arrange the simultaneous presence of several types of active species (metallic and phosphide) in the same catalyst and to keep an eye on their ability to withstand the impact of sewage sludge-derived oil. Despite the obtained data indicating that the restructuring of the catalyst occurred, the stability or deactivation issues could be discussed only after several runs of testing, including the development of an appropriate regeneration procedure for the catalyst, precise characterization of the catalyst and organic matter after each run. These issues are of high importance and deserve a separate detailed investigation. Further studies might be also focused on developing catalysts based on transition metal phosphides, which are quite stable as it was proved here; additionally, carbides and nitrides as analogous systems could be considered as well. Besides, a continuous fixed bed operation mode could be used, which is expected to open the prospects for even more effective denitro-/desulfur-/deoxygenation, as it can provide better availability of H2 and immediate removal of the reaction by-products (such as NH3, H2S, and H2O) in contrast to a batch reactor.

3. Materials and Methods

3.1. Materials

Nickel (II) carbonate basic hydrate (≥98%), copper (II) carbonate basic (≥98%), ammonium molybdate tetrahydrate (≥99%), phosphoric acid of analytical grade (87% solution), aqueous ammonia (99%), ethyl silicate (ES, ≥99%) were used for catalyst synthesis and supplied by the JSC Reakhim (Staraya Kupavna, Russia). Hydrogen (>99.99%), argon (>99.99%) were obtained from the Ltd. Pure Gases (Novosibirsk, Russia). Dichloromethane (99.9%) and acetone (99%) used as solvents were supplied by the JSC Base 1 Chemical Reagents (Moscow, Russia) and the Ltd. TK Spectr-Chem (Moscow, Russia), respectively.

3.2. Catalyst Preparation

The catalyst used in the study was denoted as NiCuMo-P-SiO2 and consisted of 51 wt. % Ni, 2.4 wt. % Cu, 8.3 wt. % Mo, 2 wt. % P, and 6.1 wt. % Si according to XRF analysis (see Supplementary Materials). It was prepared using a heterophase sol-gel technique similar to that described previously [51,71]. In brief, the appropriate amounts of nickel (II) carbonate basic hydrate and copper (II) carbonate basic were mixed with bi-distilled water (100 mL) under constant stirring. Afterward, the required amount of phosphoric acid was gradually added to the mixture, and intense gas formation (CO2) was observed. After the gas evolution stopped, the mixture was cooled down to room temperature at near-neutral pH. Afterward, the required amount of aqueous ammonia (25% of NH3) was added followed by the addition of ammonium molybdate tetrahydrate reaching the pH value of 10. Finally, ethyl silicate (with the SiO2 content of 32 wt. %) was added to the mixture, and after vigorous stirring, the formation of a viscous paste-like product was observed. The obtained viscous paste was left to dry in air overnight at 120 °C and was then calcined at 500 °C for several hours.
Before the reaction, the catalyst was reduced in a flow of H2 and Ar (1:1, 200 cm3/min) in a quartz reactor with a heating rate of 10 °/min—up to 400 °C, and 5 °/min—from 400 to 650 °C. After cooling down to ambient conditions the catalyst was passivated by ethanol.

3.3. Catalytic Hydrotreatment of Py-SS in a Batch Reactor

The catalytic hydrotreatment of Py-SS was carried out using a high-pressure set-up (Autoclave Engineers, Erie, PA, USA) in a sealed 300 mL stainless steel batch reactor (EZE Seal type). The reactor was equipped with a magnetic stirrer, a thermocouple, a pressure sensor, and a system for controlling the stirring rate, temperature, and pressure. The reduced catalyst NiCuMo-P-SiO2 (Section 2.2) in the form of fine powder (2 g) and 60 g of pyrolysis oil was placed into the batch reactor. After sealing, the reactor was flushed twice with 2.0 MPa of hydrogen and subsequently pressurized with additional H2 up to 6.0 MPa at room temperature (V0(H2)/m0(Py-SS) = 245 nL/kg). The reaction mixture was then heated to the desired temperature (ranging from 200 to 390 °C) at 10 °/min with a constant stirring speed of 1200 rpm. The pressure inside the reactor depended on the predetermined reaction temperature. At the final temperature, the reactor was operated for 3 h with a gradual reduction in pressure due to hydrogen consumption. After finishing the process and cooling the reactor to ambient conditions, the gaseous phase was thoroughly analyzed. The amount of gaseous phase was determined by the pressure difference in the reactor before and after the reaction at room temperature. In these calculations, the ideal gas approximation was applied. Thereby, the gas volume in the reactor assumed to be constant was calculated as the physical volume of the reactor minus the pyrolysis oil volume. The reactor and its content were weighed. Then the condensed product mixture together with the spent catalyst was taken out of the reactor, transferred to a centrifuge tube, and separated by centrifugation (3200 rpm, 1 h). The liquid part from the centrifuge tube was transferred to a conical funnel, and the separation into two phases was observed: a dark brown organic-rich phase (OP) at the top and a transparent yellowish aqueous phase (AP) at the bottom. The reactor was thoroughly washed with acetone and dichloromethane and the recovered solid was added to the paste-like residue at the bottom of the centrifuge tube. This residue was washed several times by acetone and dichloromethane to remove soluble organic part and the resulting insoluble residue was dried in air for further analysis. The collected solid material thus consisted of the spent catalyst and coke deposits in the case of catalytic experiments and solid organic residue (coke) for the non-catalytic one. The aqueous phase, being more fluid than the organic-rich phase, was separated and weighed for mass balance calculations. Considering the low flowability of the organic-rich phase, the amount of organic-rich phase was determined by subtracting the mass of the aqueous phase and that of the solid residue (including the catalyst) from the reactor content after reaction to achieve a proper mass balance closure. The amount of coke on the catalyst was determined by CHNS-O analysis of the solid residue. The AP-T and OP-T designations were applied to the aqueous and organic-rich phases, respectively, with T denoting the reaction temperature.

3.4. Analysis of Reaction Products

The gas-phase products were analyzed using a gas chromatograph Chromos GCh 1000 (Dzerzhinsk, Russia), equipped with a thermal conductivity detector (TCD) and a flame ionization detector (FID) for the qualitative and quantitative determination of gas components.
The amount of hydrogen consumed in each experiment reflecting the catalyst activity was estimated according to the procedure described in detail in the Supplementary Materials. This procedure was based on the approximation of the ideal gas and took into consideration pressure and temperature recordings and gas-phase composition data before and after the reaction. H2 uptake was also corrected taking into account the formation of light hydrocarbons in the gaseous phase.
The elemental CHNS-O analysis of the Py-SS and the OPs was performed by using an Elemental Vario EL Cube analyzer (Elementar Analysensysteme GmbH, Langenselbold, Germany). The amount of oxygen was calculated by difference (O% = 100-C–H–N–S). The sulfur content of the pyrolysis oil and the OPs was measured on a Lab-X 3500SCl energy dispersive X-ray fluorescence analyzer (Oxford Instruments Analytical, High Wycombe, United Kingdom). Inorganic impurities in the pyrolysis oil were examined using X-ray fluorescence spectrometer ARL Perform’X (Thermo Fisher Scientific, Ecublens, Switzerland). Conradson Carbon Residue (CCR, according to ASTM D189) was measured to provide an indication of the thermal stability of Py-SS and its hydrotreatment products based on their relative coke-forming propensities. The CCR was calculated from the residual mass of coke (wt. %) being formed after the evaporation of volatile components and pyrolysis of the relatively non-volatile components in the analyzed sample, which undergo partial degradation during atmospheric distillation. The moisture content in the Py-SS and the OPs was determined by Karl Fischer titration using Metrohm 870 Titrino Plus equipment. The density of organic samples was determined using a Densito 30PX densimeter (Mettler Toledo, Greifensee, Switzerland) via the ASTM D 4052 procedure. Gas chromatography-mass spectrometry (GC–MS) analyses of the Py-SS and the OPs were carried out using GC system Agilent 7000B equipped with a triple quadrupole detector. Chromatographic separations were performed using a self-designed capillary column based on N-propyl-6-methyl-quinolinium [46]. Specifically, calibration was not carried out, since a large number of compounds and functionalities were present in the samples. The percentage of the components was calculated from respective peak areas divided by the total ion chromatogram (TIC). This approach of peak area normalization does not provide the real concentration of compounds but serves for a general comparison of samples. A detailed description of the analytic tools used to study the reaction products is provided in the Supplementary Materials.

3.5. Catalyst Characterization

The elemental composition of the fresh catalyst in the oxidized state was determined using an X-ray fluorescence spectrometer ARL Advant’X 2247 (Thermo Fisher Scientific, Ecublens, Switzerland). The textural properties of the catalyst were analyzed by nitrogen physisorption at the liquid nitrogen temperature using an ASAP-2400 automated volumetric adsorption analyzer (Micromeritics Instrument. Corp., Norcross, GA, USA). The reducibility of the catalyst was studied by temperature-programmed reduction (TPR, self-designed U-tube quartz reactor, see Supplementary Materials), which is widely used for choosing appropriate conditions for the reductive activation of oxidized catalyst species. The chemical composition of the catalyst surface was studied by the X-ray photoelectron spectroscopy (XPS) using a photoelectron spectrometer (SPECS Surface Nano Analysis GmbH, Berlin, Germany). The catalyst NiCuMo-P-SiO2 was studied after the reduction of the pre-reduced catalyst (see Section 2.2) in H2 in a high-pressure cell of the XPS spectrometer at a temperature of 450 °C. X-ray absorption spectra at the K-edges of Ni, Cu, and Mo were obtained at the Structural Materials Science beamline at the Kurchatov Synchrotron Radiation Source (National Research Center “Kurchatov Institute”, Moscow, Russia). X-ray diffraction (XRD) studies were performed on an ARL X’TRA (Thermo Scientific, Lausanne, Switzerland) using the monochromatic CuKα radiation (λ = 0.1542 nm). The lattice parameters and the phase ratios were defined by the Rietveld method [68]. Fresh and spent catalysts were also studied by a high-resolution transmission electron microscopy (HRTEM) using a JEM-2010 (JEOL, Tokyo, Japan) electron microscope. Besides, in the case of spent catalysts, the elemental CHNS analysis was performed by using an Elemental Vario EL Cube analyzer (Elementar Analysensysteme GmbH, Langenselbold, Germany). More detailed information about the physicochemical characterization of catalyst samples is given in the Supplementary Materials.

4. Conclusions

Nowadays, the utilization of sewage sludge (SS) from municipal and industrial wastewater treatment plants is of great importance, both from a fundamental and a practical point of view. With the increased sludge production throughout the world, an economic and environmentally sustainable treatment process needs to be developed. The downsides of incineration and landfilling as major means of SS utilization, on the one hand, and the high-energy potential of such wastes, on the other, make thermochemical processing (e.g., via pyrolysis) an interesting option towards the production of fuels from SS. However, liquefied sewage sludge needs to be upgraded, since water, heteroatoms (O, N, and S), and lots of toxic constituents (like polyaromatic hydrocarbons, heavy metal impurities) pose challenges for the direct use of SS bio-oil as a fuel source. In this regard, hydrotreatment is expected to open the prospects for effective upgrading of Py-SS by hydrogenation and heteroatoms removal. Despite some similarities with crude oil distillates or bio-oil from lignocellulosic biomass, sewage sludge pyrolysis oil is substantially different and requires some specific treatment approaches. Thus, high activity and stability of catalysts are of crucial importance for the effective upgrading of SS pyrolysis oil. Herewith, the development of such catalytic systems presents a certain genuine challenge, not to be underestimated.
The present study specifically addresses the use of the NiCuMo-P-SiO2 catalyst with high Ni loading in hydrotreatment of pyrolysis oil obtained from sewage sludge. In particular, the effect of process temperature on the properties of product oils was considered, with a special focus on the catalyst behavior. A more in-depth analysis of the chemical composition of the feed and product oils will be provided as a separate publication. However, concerning a brief consideration of the ultimate and proximate analysis of organic samples, the following main observations were made in the present study:
  • The increase in the temperature of Py-SS hydrotreatment resulted in the increasing yield of gas-phase products along with the decreasing yield of coke deposits, very likely due to more intense decarboxy(carbony-)lation, hydrocracking, and hydrogenation.
  • The decrease in water content, density, and CCR value of the hydrotreated product oils indicated that less polar and more thermally stable products were formed as a result of the catalytic hydrotreatment.
  • As compared to the initial feed and non-catalytic processing, a higher H/C atomic ratio of product oils in the case of catalytic hydrotreatment evidenced the high hydrogenation ability of the NiCuMo-P-SiO2 catalyst.
  • Severe temperature conditions promoted the conversion of long-chain fatty acids into n-alkanes, while the amount of volatile aromatic species (monoaromatic hydrocarbons, oxygen-containing aromatic hydrocarbons, and PAHs) increased via the hydroconversion of high molecular mass components.
Related to the catalyst behavior and structural features, the following main observations were made:
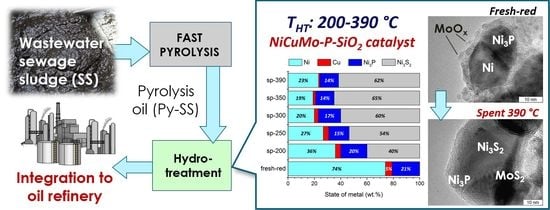
  • Active catalyst species comprised of Ni3P and metallic Ni-based solid solutions with possible incorporation of Cu and Mo were uniformly distributed throughout the amorphous silica matrix.
  • Mo-oxidized species were in an amorphous or highly dispersed state in the fresh catalyst, while Cu was in a fully reduced metallic state.
  • Initially amorphous Mo species were transformed into a MoS2 state in post-reaction catalysts; the MoS2 phase is known to be active in hydroprocessing.
  • As the severity of the hydroprocessing increased, metallic Ni particles were transformed into sulfide state Ni3S2, whilst nickel phosphide species possessed outstanding stability in the whole temperature range, holding great promise for the upgrading of sewage sludge crude bio-oils.
As a summary of these points, the distinctive feature of this work is the combination of two types of active components (solid metallic solutions NiMo(Cu) and nickel phosphides) in one catalytic system. Although the restructuring of the metallic phase under the impact of the reaction media during Py-SS hydrotreatment could have been predictable, the main achievement was the remarkable stability of the active Ni3P phase even at high process temperature. These results might be of particular importance for the future development of stable catalysts for the effective upgrading of Py-SS and other similar types of feedstocks with a high amount of water and heteroatomic species (O, N, S). However, despite all structural changes observed in the catalyst, it is to be noted that the results obtained do not actually point out the catalyst deactivation. Besides, the in situ formation of the MoS2 phase during Py-SS hydrotreatment might be an interesting option for the improvement of catalyst activity. Therefore, future detailed studies are to be performed to clarify all these possibilities.
In general, the results reported in this paper can be also useful for the hydrotreatment of similar bio-feedstocks, although received differently. For example, this might relate to the products of sewage sludge hydrothermal processing, and the liquids obtained via pyrolysis or hydrothermal liquefaction of food waste and microalgae biomass [15,72,73,74].

Supplementary Materials

The following are available online at https://www.mdpi.com/2073-4344/10/11/1273/s1, Figure S1: Total ion chromatograms: A) of sewage sludge pyrolysis oil Py-SS (TIC1), B) of OP obtained after Py-SS hydrotreatment at 350 °C (TIC2), C) of OP obtained after Py-SS hydrotreatment at 390 °C (TIC3). Peak assignment is provided in original paper, Table 4, Figure S2: The Ni2p, Cu2p, Mo3d, and P2p core-level spectra of the reduced NiCuMo-P-SiO2 catalyst.

Author Contributions

Conceptualization, V.A.Y.; methodology, M.V.A., Y.K.G. and O.O.Z.; formal analysis, M.V.S.; investigation, M.V.A., O.A.B., A.A.S., and A.M.K.; resources, A.N.G.; writing—original draft preparation, M.V.A.; writing—review and editing, M.V.A., O.K. and D.K.; visualization, M.V.A. All authors have read and agreed to the published version of the manuscript.

Funding

This research was funded by the Russian Foundation of Basic Research (RFBR) and Grantová Agentura České Republiky (GAČR) within the framework of the joint project (RFBR project No. 19-53-26005, GAČR project No. 20-28086J).

Acknowledgments

The authors express their gratitude to Evgenia Vlasova (BIC SB RAS, Novosibirsk, Russia) for performing XRF-S analysis and Dmitry Yu. Ermakov (BIC SB RAS, Novosibirsk, Russia) for the TPR measurements.

Conflicts of Interest

The authors declare no conflict of interest.

References

  1. Raheem, A.; Sikarwar, V.S.; He, J.; Dastyar, W.; Dionysiou, D.D.; Wang, W.; Zhao, M. Opportunities and challenges in sustainable treatment and resource reuse of sewage sludge: A review. Chem. Eng. J. 2018, 337, 616–641. [Google Scholar] [CrossRef]
  2. De Gisi, S.; Notarnicola, M. Industrial wastewater treatment. In Encyclopedia of Sustainable Technologies; Abraham, M.A., Ed.; Elsevier: Oxford, UK, 2017; pp. 23–42. [Google Scholar]
  3. Kelessidis, A.; Stasinakis, A.S. Comparative study of the methods used for treatment and final disposal of sewage sludge in European countries. Waste Manag. 2012, 32, 1186–1195. [Google Scholar] [CrossRef] [PubMed]
  4. Tyagi, V.K.; Lo, S.-L. Sludge: A waste or renewable source for energy and resources recovery? Renew. Sustain. Energy Rev. 2013, 25, 708–728. [Google Scholar] [CrossRef]
  5. Rulkens, W. Sewage Sludge as a biomass resource for the production of energy: Overview and assessment of the various options. Energy Fuels 2008, 22, 9–15. [Google Scholar] [CrossRef]
  6. Beyene, H.D.; Werkneh, A.A.; Ambaye, T.G. Current updates on waste to energy (WtE) technologies: A review. Renew. Energy Focus 2018, 24, 1–11. [Google Scholar] [CrossRef]
  7. Roche, E.; de Andrés, J.M.; Narros, A.; Rodríguez, M.E. Air and air-steam gasification of sewage sludge. The influence of dolomite and throughput in tar production and composition. Fuel 2014, 115, 54–61. [Google Scholar] [CrossRef]
  8. Zhang, B.; Xiong, S.; Xiao, B.; Yu, D.; Jia, X. Mechanism of wet sewage sludge pyrolysis in a tubular furnace. Int. J. Hydrog. Energy 2011, 36, 355–363. [Google Scholar] [CrossRef]
  9. Manara, P.; Zabaniotou, A. Towards sewage sludge based biofuels via thermochemical conversion—A review. Renew. Sustain. Energy Rev. 2012, 16, 2566–2582. [Google Scholar] [CrossRef]
  10. Parnaudeau, V.; Dignac, M.-F. The organic matter composition of various wastewater sludges and their neutral detergent fractions as revealed by pyrolysis-GC/MS. J. Anal. Appl. Pyrolysis 2007, 78, 140–152. [Google Scholar] [CrossRef]
  11. Mohan, D.; Pittman, J.; Charles, U.; Steele, P.H. Pyrolysis of wood/biomass for bio-oil: A critical review. Energy Fuels 2006, 20, 848–889. [Google Scholar] [CrossRef]
  12. Jin, J.; Li, Y.; Zhang, J.; Wu, S.; Cao, Y.; Liang, P.; Zhang, J.; Wong, M.H.; Wang, M.; Shan, S.; et al. Influence of pyrolysis temperature on properties and environmental safety of heavy metals in biochars derived from municipal sewage sludge. J. Hazard. Mater. 2016, 320, 417–426. [Google Scholar] [CrossRef] [PubMed]
  13. Samolada, M.C.; Zabaniotou, A.A. Comparative assessment of municipal sewage sludge incineration, gasification and pyrolysis for a sustainable sludge-to-energy management in Greece. Waste Manag. 2014, 34, 411–420. [Google Scholar] [CrossRef] [PubMed]
  14. Marrone, P.A.; Elliott, D.C.; Billing, J.M.; Hallen, R.T.; Hart, T.R.; Kadota, P.; Moeller, J.C.; Randel, M.A.; Schmidt, A.J. Bench-scale evaluation of hydrothermal processing technology for conversion of wastewater solids to fuels. Water Environ. Res. 2018, 90, 329–342. [Google Scholar] [CrossRef]
  15. Castello, D.; Haider, M.S.; Rosendahl, L.A. Catalytic upgrading of hydrothermal liquefaction biocrudes: Different challenges for different feedstocks. Renew. Energy 2019, 141, 420–430. [Google Scholar] [CrossRef] [Green Version]
  16. Huang, H.-j.; Yuan, X.-z.; Zhu, H.-n.; Li, H.; Liu, Y.; Wang, X.-l.; Zeng, G.-m. Comparative studies of thermochemical liquefaction characteristics of microalgae, lignocellulosic biomass and sewage sludge. Energy 2013, 56, 52–60. [Google Scholar] [CrossRef]
  17. Fonts, I.; Gea, G.; Azuara, M.; Ábrego, J.; Arauzo, J. Sewage sludge pyrolysis for liquid production: A review. Renew. Sustain. Energy Rev. 2012, 16, 2781–2805. [Google Scholar] [CrossRef]
  18. Cao, J.-P.; Zhao, X.-Y.; Morishita, K.; Wei, X.-Y.; Takarada, T. Fractionation and identification of organic nitrogen species from bio-oil produced by fast pyrolysis of sewage sludge. Bioresour. Technol. 2010, 101, 7648–7652. [Google Scholar] [CrossRef]
  19. Arazo, R.O.; de Luna, M.D.G.; Capareda, S.C. Assessing biodiesel production from sewage sludge-derived bio-oil. Biocatal. Agric. Biotechnol. 2017, 10, 189–196. [Google Scholar] [CrossRef]
  20. Izhar, S.; Uehara, S.; Yoshida, N.; Yamamoto, Y.; Morioka, T.; Nagai, M. Hydrodenitrogenation of fast pyrolysis bio-oil derived from sewage sludge on NiMo/Al2O3 sulfide catalyst. Fuel Process. Technol. 2012, 101, 10–15. [Google Scholar] [CrossRef]
  21. Ardiyanti, A.R.; Bykova, M.V.; Khromova, S.A.; Yin, W.; Venderbosch, R.H.; Yakovlev, V.A.; Heeres, H.J. Ni-based catalysts for the hydrotreatment of fast pyrolysis oil. Energy Fuels 2016, 30, 1544–1554. [Google Scholar] [CrossRef]
  22. Alekseeva, M.V.; Otyuskaya, D.S.; Rekhtina, M.A.; Bulavchenko, O.A.; Stonkus, O.A.; Kaichev, V.V.; Zavarukhin, S.G.; Thybaut, J.W.; Alexiadis, V.; Venderbosch, R.H.; et al. NiCuMo-SiO2 catalyst for pyrolysis oil upgrading: Model acidic treatment study. Appl. Catal. A Gen. 2019, 573, 1–12. [Google Scholar] [CrossRef]
  23. Bykova, M.V.; Ermakov, D.Y.; Khromova, S.A.; Smirnov, A.A.; Lebedev, M.Y.; Yakovlev, V.A. Stabilized Ni-based catalysts for bio-oil hydrotreatment: Reactivity studies using guaiacol. Catal. Today 2014, 220–222, 21–31. [Google Scholar] [CrossRef]
  24. Yin, W.; Venderbosch, R.H.; Alekseeva, M.V.; Figueirêdo, M.B.; Heeres, H.; Khromova, S.A.; Yakovlev, V.A.; Cannilla, C.; Bonura, G.; Frusteri, F.; et al. Hydrotreatment of the carbohydrate-rich fraction of pyrolysis liquids using bimetallic Ni based catalyst: Catalyst activity and product property relations. Fuel Process. Technol. 2018, 169, 258–268. [Google Scholar] [CrossRef]
  25. Yakovlev, V.A.; Khromova, S.A.; Sherstyuk, O.V.; Dundich, V.O.; Ermakov, D.Y.; Novopashina, V.M.; Lebedev, M.Y.; Bulavchenko, O.; Parmon, V.N. Development of new catalytic systems for upgraded bio-fuels production from bio-crude-oil and biodiesel. Catal. Today 2009, 144, 362–366. [Google Scholar] [CrossRef]
  26. Alekseeva, M.V.; Rekhtina, M.A.; Lebedev, M.Y.; Zavarukhin, S.G.; Kaichev, V.V.; Venderbosch, R.H.; Yakovlev, V.A. Hydrotreatment of 2-methoxyphenol over high Ni-loaded sol-gel catalysts: The influence of Mo on catalyst activity and reaction pathways. ChemistrySelect 2018, 3, 5153–5164. [Google Scholar] [CrossRef]
  27. Li, M.; Zhang, Y.; Yu, S.; Xie, C.; Liu, D.; Liu, S.; Zhao, R.; Bian, B. Preparation and characterization of petroleum-based mesophase pitch by thermal condensation with in-process hydrogenation. RSC Adv. 2018, 8, 30230–30238. [Google Scholar] [CrossRef] [Green Version]
  28. Menoufy, M.F.; Ahmed, H.S.; Betiha, M.A.; Sayed, M.A. A comparative study on hydrocracking and hydrovisbreaking combination for heavy vacuum residue conversion. Fuel 2014, 119, 106–110. [Google Scholar] [CrossRef]
  29. Smirnov, A.A.; Alekseeva, M.V.; Bulavchenko, O.A.; Yakovlev, V.A. Studying the effect of the process temperature on the degree of bio-oil hydrotreatment at low hydrogen contents over NiCu-SiO2 catalyst with a high metal loading. Catal. Ind. 2019, 11, 65–73. [Google Scholar] [CrossRef]
  30. Biller, P.; Sharma, B.K.; Kunwar, B.; Ross, A.B. Hydroprocessing of bio-crude from continuous hydrothermal liquefaction of microalgae. Fuel 2015, 159, 197–205. [Google Scholar] [CrossRef] [Green Version]
  31. Kunwar, B.; Deilami, S.D.; Macaskie, L.E.; Wood, J.; Biller, P.; Sharma, B.K. Nanoparticles of Pd supported on bacterial biomass for hydroprocessing crude bio-oil. Fuel 2017, 209, 449–456. [Google Scholar] [CrossRef]
  32. Li, Z.; Savage, P.E. Feedstocks for fuels and chemicals from algae: Treatment of crude bio-oil over HZSM-5. Algal Res. 2013, 2, 154–163. [Google Scholar] [CrossRef]
  33. Roussis, S.G.; Cranford, R.; Sytkovetskiy, N. Thermal treatment of crude algae oils prepared under hydrothermal extraction conditions. Energy Fuels 2012, 26, 5294–5299. [Google Scholar] [CrossRef]
  34. Ardiyanti, A.R.; Gutierrez, A.; Honkela, M.L.; Krause, A.O.I.; Heeres, H.J. Hydrotreatment of wood-based pyrolysis oil using zirconia-supported mono and bimetallic (Pt, Pd, Rh) catalysts. Appl. Catal. A Gen. 2011, 407, 56–66. [Google Scholar] [CrossRef]
  35. Sánchez, M.E.; Menéndez, J.A.; Domínguez, A.; Pis, J.J.; Martínez, O.; Calvo, L.F.; Bernad, P.L. Effect of pyrolysis temperature on the composition of the oils obtained from sewage sludge. Biomass Bioenergy 2009, 33, 933–940. [Google Scholar] [CrossRef]
  36. Chen, Y.; Zhang, L.; Zhang, Y.; Li, A. Pressurized pyrolysis of sewage sludge: Process performance and products characterization. J. Anal. Appl. Pyrolysis 2019, 139, 205–212. [Google Scholar] [CrossRef]
  37. Domınguez, A.; Menéndez, J.A.; Inguanzo, M.; Bernad, P.L.; Pis, J.J. Gas chromatographic–mass spectrometric study of the oil fractions produced by microwave-assisted pyrolysis of different sewage sludges. J. Chromatogr. A 2003, 1012, 193–206. [Google Scholar] [CrossRef]
  38. Huang, F.; Yu, Y.; Huang, H. Temperature influence and distribution of bio-oil from pyrolysis of granular sewage sludge. J. Anal. Appl. Pyrolysis 2018, 130, 36–42. [Google Scholar] [CrossRef]
  39. Jindarom, C.; Meeyoo, V.; Rirksomboon, T.; Rangsunvigit, P. Thermochemical decomposition of sewage sludge in CO2 and N2 atmosphere. Chemosphere 2007, 67, 1477–1484. [Google Scholar] [CrossRef]
  40. Liu, T.; Guo, Y.; Peng, N.; Lang, Q.; Xia, Y.; Gai, C.; Liu, Z. Nitrogen transformation among char, tar and gas during pyrolysis of sewage sludge and corresponding hydrochar. J. Anal. Appl. Pyrolysis 2017, 126, 298–306. [Google Scholar] [CrossRef]
  41. Arazo, R.O.; Genuino, D.A.D.; de Luna, M.D.G.; Capareda, S.C. Bio-oil production from dry sewage sludge by fast pyrolysis in an electrically-heated fluidized bed reactor. Sustain. Environ. Res. 2017, 27, 7–14. [Google Scholar] [CrossRef]
  42. Boocock, D.G.B.; Konar, S.K.; Mackay, A.; Cheung, P.T.C.; Liu, J. Fuels and chemicals from sewage sludge: 2. The production of alkanes and alkenes by the pyrolysis of triglycerides over activated alumina. Fuel 1992, 71, 1291–1297. [Google Scholar] [CrossRef]
  43. Fonts, I.; Azuara, M.; Gea, G.; Murillo, M.B. Study of the pyrolysis liquids obtained from different sewage sludge. J. Anal. Appl. Pyrolysis 2009, 85, 184–191. [Google Scholar] [CrossRef]
  44. Fonts, I.; Azuara, M.; Lázaro, L.; Gea, G.; Murillo, M.B. Gas chromatography study of sewage sludge pyrolysis liquids obtained at different operational conditions in a fluidized bed. Ind. Eng. Chem. Res. 2009, 48, 5907–5915. [Google Scholar] [CrossRef]
  45. Doshi, V.A.; Vuthaluru, H.B.; Bastow, T. Investigations into the control of odour and viscosity of biomass oil derived from pyrolysis of sewage sludge. Fuel Process. Technol. 2005, 86, 885–897. [Google Scholar] [CrossRef]
  46. Shashkov, M.V.; Sidelnikov, V.N.; Bratchikova, A.A. New stationary ionic liquid phases with quinolinium cations for capillary gas chromatography. Anal. Lett. 2020, 53, 84–101. [Google Scholar] [CrossRef]
  47. Dai, Q.; Jiang, X.; Lv, G.; Ma, X.; Jin, Y.; Wang, F.; Chi, Y.; Yan, J. Investigation into particle size influence on PAH formation during dry sewage sludge pyrolysis: TG-FTIR analysis and batch scale research. J. Anal. Appl. Pyrolysis 2015, 112, 388–393. [Google Scholar] [CrossRef]
  48. Jaramillo-Arango, A.; Fonts, I.; Chejne, F.; Arauzo, J. Product compositions from sewage sludge pyrolysis in a fluidized bed and correlations with temperature. J. Anal. Appl. Pyrolysis 2016, 121, 287–296. [Google Scholar] [CrossRef]
  49. Cypres, R. Aromatic hydrocarbons formation during coal pyrolysis. Fuel Process. Technol. 1987, 15, 1–15. [Google Scholar] [CrossRef]
  50. Tian, F.-J.; Li, B.-Q.; Chen, Y.; Li, C.-Z. Formation of NOx precursors during the pyrolysis of coal and biomass. Part, V. Pyrolysis of a sewage sludge. Fuel 2002, 81, 2203–2208. [Google Scholar] [CrossRef]
  51. Ermakova, M.A.; Ermakov, D.Y. High-loaded nickel-silica catalysts for hydrogenation, prepared by sol-gel Route: Structure and catalytic behavior. Appl. Catal. A Gen. 2003, 245, 277–288. [Google Scholar] [CrossRef]
  52. Bykova, M.V.; Ermakov, D.Y.; Kaichev, V.V.; Bulavchenko, O.A.; Saraev, A.A.; Lebedev, M.Y.; Yakovlev, V.A. Ni-based sol-gel catalysts as promising systems for crude bio-oil upgrading: Guaiacol hydrodeoxygenation study. Appl. Catal. B Environ. 2012, 113–114, 296–307. [Google Scholar] [CrossRef]
  53. Zuzaniuk, V.; Prins, R. Synthesis and characterization of silica-supported transition-metal phosphides as HDN catalysts. J. Catal. 2003, 219, 85–96. [Google Scholar] [CrossRef]
  54. Li, C.P.; Proctor, A.; Hercules, D.M. Curve fitting analysis of ESCA Ni 2p spectra of nickel-oxygen compounds and Ni/Al2O3 catalysts. Appl. Spectrosc. 1984, 38, 880–886. [Google Scholar] [CrossRef]
  55. Wöllner, A.; Lange, F.; Schmelz, H.; Knözinger, H. Characterization of mixed copper-manganese oxides supported on titania catalysts for selective oxidation of ammonia. Appl. Catal. A Gen. 1993, 94, 181–203. [Google Scholar] [CrossRef]
  56. Yin, W.; Kloekhorst, A.; Venderbosch, R.H.; Bykova, M.V.; Khromova, S.A.; Yakovlev, V.A.; Heeres, H.J. Catalytic hydrotreatment of fast pyrolysis liquids in batch and continuous set-ups using a bimetallic Ni-Cu catalyst with a high metal content. Catal. Sci. Technol. 2016, 6, 5899–5915. [Google Scholar] [CrossRef] [Green Version]
  57. Bianchi, C.L.; Cattania, M.G.; Villa, P. XPS characterization of Ni and Mo oxides before and after “in situ” treatments. Appl. Surf. Sci. 1993, 70–71, 211–216. [Google Scholar] [CrossRef]
  58. DeCanio, S.J.; Cataldo, M.C.; DeCanio, E.C.; Storm, D.A. Evidence from XPS for the stabilization of high-valent molybdenum by addition of potassium in MoAl2O3 catalysts. J. Catal. 1989, 119, 256–260. [Google Scholar] [CrossRef]
  59. Galtayries, A.; Wisniewski, S.; Grimblot, J. Formation of thin oxide and sulphide films on polycrystalline molybdenum foils: Characterization by XPS and surface potential variations. J. Electron Spectrosc. Relat. Phenom. 1997, 87, 31–44. [Google Scholar] [CrossRef]
  60. Olsson, C.-O.A.; Mathieu, H.-J.; Landolt, D. Angle-resolved XPS analysis of molybdenum and tungsten in passive films on stainless steel PVD alloys. Surf. Interface Anal. 2002, 34, 130–134. [Google Scholar] [CrossRef]
  61. Óvári, L.; Kiss, J.; Farkas, A.P.; Solymosi, F. Surface and Subsurface Oxidation of Mo2C/Mo(100):  Low-energy ion-scattering, aAuger electron, angle-resolved X-ray photoelectron, and mass spectroscopy studies. J. Phys. Chem. B 2005, 109, 4638–4645. [Google Scholar] [CrossRef] [Green Version]
  62. Guo, L.; Zhao, Y.; Yao, Z. Mechanical mixtures of metal oxides and phosphorus pentoxide as novel precursors for the synthesis of transition-metal phosphides. Dalton Trans. 2016, 45, 1225–1232. [Google Scholar] [CrossRef] [PubMed]
  63. Burns, A.W.; Gaudette, A.F.; Bussell, M.E. Hydrodesulfurization properties of cobalt-nickel phosphide catalysts: Ni-rich materials are highly active. J. Catal. 2008, 260, 262–269. [Google Scholar] [CrossRef]
  64. Bearden, J.A.; Burr, A.F. Reevaluation of X-ray atomic energy levels. Rev. Mod. Phys. 1967, 39, 125–142. [Google Scholar] [CrossRef]
  65. Rochet, A.; Baubet, B.; Moizan, V.; Devers, E.; Hugon, A.; Pichon, C.; Payen, E.; Briois, V. Influence of the preparation conditions of oxidic NiMo/Al2O3 catalysts on the sulfidation ability: A quick-XAS and Raman spectroscopic study. J. Phys. Chem. C 2015, 119, 23928–23942. [Google Scholar] [CrossRef]
  66. Preda, I.; Soriano, L.; Diaz-Fernandez, D.; Dominguez-Canizares, G.; Gutierrez, A.; Castro, G.R.; Chaboy, J. X-ray absorption study of the local structure at the NiO/oxide interfaces. J. Synchrotron. Radiat. 2013, 20, 635–640. [Google Scholar] [CrossRef] [PubMed] [Green Version]
  67. Gaur, A.; Shrivastava, B.D.; Joshi, S.K. Copper K-edge XANES of Cu(I) and Cu(II) oxide mixtures. J. Phys. Conf. Ser. 2009, 190, 012084. [Google Scholar] [CrossRef]
  68. Rietveld, H. A profile refinement method for nuclear and magnetic structures. J. Appl. Crystallogr. 1969, 2, 65–71. [Google Scholar] [CrossRef]
  69. Boscagli, C.; Yang, C.; Welle, A.; Wang, W.; Behrens, S.; Raffelt, K.; Grunwaldt, J.-D. Effect of pyrolysis oil components on the activity and selectivity of nickel-based catalysts during hydrotreatment. Appl. Catal. A Gen. 2017, 544, 161–172. [Google Scholar] [CrossRef]
  70. Mortensen, P.M.; Gardini, D.; de Carvalho, H.W.P.; Damsgaard, C.D.; Grunwaldt, J.-D.; Jensen, P.A.; Wagner, J.B.; Jensen, A.D. Stability and resistance of nickel catalysts for hydrodeoxygenation: Carbon deposition and effects of sulfur, potassium, and chlorine in the feed. Catal. Sci. Technol. 2014, 4, 3672. [Google Scholar]
  71. Yakovlev, V.A.; Khromova, S.A.; Ermakov, D.Y. Catalyst and Process for Hydrodeoxygenation of Oxygen-Organic Products of Plant Biomass. Processing. Patent RU2440847, 27 January 2012. [Google Scholar]
  72. Déniel, M.; Haarlemmer, G.; Roubaud, A.; Weiss-Hortala, E.; Fages, J. Energy valorisation of food processing residues and model compounds by hydrothermal liquefaction. Renew. Sustain. Energy Rev. 2016, 54, 1632–1652. [Google Scholar] [CrossRef] [Green Version]
  73. Elliott, D.C.; Biller, P.; Ross, A.B.; Schmidt, A.J.; Jones, S.B. Hydrothermal liquefaction of biomass: Developments from batch to continuous process. Bioresour. Technol. 2015, 178, 147–156. [Google Scholar] [CrossRef] [PubMed] [Green Version]
  74. Gollakota, A.R.K.; Kishore, N.; Gu, S. A review on hydrothermal liquefaction of biomass. Renew. Sustain. Energy Rev. 2018, 81, 1378–1392. [Google Scholar] [CrossRef]
Figure 1. H2 uptake (in normal liters per kg of Py-SS) corrected for gaseous products of pyrolysis oil hydrotreatment at temperatures in the range of 200 to 390 °C.
Catalysts 10 01273 g001
Figure 2. (a) Conradson carbon residue (CCR), wt. %; (b) Density, g/cm3 of Py-SS and organic-rich phases (OP) obtained after catalytic and non-catalytic hydrotreatment of Py-SS.
Catalysts 10 01273 g002
Figure 3. (a) Moisture content, wt. %; (b) H/C atomic rations on a dry basis of Py-SS and organic-rich phases (OP) obtained after catalytic and non-catalytic hydrotreatment of Py-SS.
Catalysts 10 01273 g003
Figure 4. Temperature-programmed reduction profile of NiCuMo-P-SiO2 catalyst.
Catalysts 10 01273 g004
Figure 5. (a) Ni K-edge XANES spectra; (b) The module of k2-weighted Fourier transforms of k2χ(R) EXAFS-oscillations at the Ni K-edge for NiCuMo-P-SiO2 catalyst after additional in situ reduction at 400 °C, in comparison to Ni foil and NiO standards.
Catalysts 10 01273 g005
Figure 6. Cu K-edge XANES spectra for NiCuMo-P-SiO2 catalyst after additional in situ reduction at 400 °C, in comparison to Cu foil, Cu2O, and CuO standards.
Catalysts 10 01273 g006
Figure 7. (a) Mo K-edge XANES spectra; (b) The module of k2-weighted Fourier transforms of k2χ(R) EXAFS-oscillations at the Mo K-edge for NiCuMo-P-SiO2 catalyst after additional in situ reduction at 400 °C, in comparison to Mo foil, MoO2, and MoO3 standards.
Catalysts 10 01273 g007
Figure 8. (a) X-ray diffraction patterns of NiCuMo-P-SiO2 catalyst in an oxidized state (fresh-ox), reduced state (fresh-red), and after Py-SS hydrotreatment at 200 °C to 390 °C (sp-200/sp-250/sp-300/sp-350/sp-390). (b) Quantitative analysis of phase composition for fresh reduced and spent catalysts, based on the Rietveld method.
Catalysts 10 01273 g008
Figure 9. HRTEM images and EDX analysis data of NiCuMo-P-SiO2 catalyst: fresh reduced (1, 2) and spent at 390 °C (3, 4).
Catalysts 10 01273 g009
Table 1. Relevant properties of pyrolysis oil (Py-SS) obtained from sewage sludge.
Type of AnalysisParameterAnalytical MethodAs-Received Wet BasisDry Matter Basis
Ultimate analysis, wt. %CElemental analysis66.873.5
HElemental analysis8.07.7
OBy difference20.813.9
NElemental analysis4.04.4
SXRF-S analysis0.430.47
Proximate analysisWater content, wt. %KF Titration9.17-
Density, g/cm3ASTM D 40521.003-
Conradson carbon residue (CCR), wt. %ASTM D 1896.17-
Table 2. Mass balances after hydrotreatment of Py-SS obtained from sewage sludge.
Reaction Temperature200 °C250 °C300 °C350 °C350 °C—No Cat390 °C
Feed (H2 consumed + Py-SS), g60.4960.5560.6960.8760.4760.99
Yield (wet basis), wt. % of feed:
Organic-rich phase (OP)85.685.681.981.379.175.8
Aqueous phase (AP)6.66.48.712.511.414.3
Coke on the catalyst0.50.50.40.30.3 10.3
Gas phase (GP)1.61.83.23.84.56.7
CH40.050.100.400.770.451.19
CO21.511.642.672.673.514.16
CO--0.030.140.150.44
Light HCs (C2–C4)0.020.020.070.270.370.91
Mass balance, wt. %94.394.394.297.995.397.1
1 Solid organic residue at the bottom of the centrifuge tube after Py-SS hydrotreatment, washed by acetone and dichloromethane.
Table 3. Elemental analysis of organic-rich phases (OP) of Py-SS hydrotreatment.
Organic Sample
Dry Matter, wt. %
OP-200OP-250OP-300OP-350OP-390OP-350 No Cat
C 175.776.276.879.181.681.2
H 19.69.39.210.610.69.3
O 211.611.610.77.85.76.5
N 12.92.73.22.32.12.7
S 30.240.190.170.130.050.34
1 CHNS-O analysis, 2 calculated by difference, 3 XRF-S analysis.
Table 4. Indication and relative proportions (% area) of GC-eluted compounds in Py-SS and selected hydrotreatment products.
CompoundPy-SS Peak Area, % (Peak No., Figure S1A)OP-350 Peak Area, % (Peak No., Figure S1B)OP-390 Peak Area, % (Peak No., Figure S1C)
Monoaromatic compounds
Benzene, ethyl---1.76 (1)
Benzene, 1,2-dimethyl-0.74 (1)-1.21 (2)
Benzene, 1,4-dimethyl--0.55 (1)-
Benzene, n-propyl--0.68 (3)0.88 (4)
Benzene, (1-methylethyl)--0.48 (4)-
Benzene, 1-ethyl-4-methyl---0.9 (5)
Benzene, 1-methyl-4-(1-methylethyl)--1.67 (5)2.56 (6)
Benzene, 1-ethyl-2-methyl-0.46 (3)-0.24 (7)
Benzene, 1-ethyl-4-(1-methylethyl)---1.0 (9)
Benzene, 1-methyl-2-(1-methylethyl)-0.42 (4)--
Benzene, 1,2,4-trimethyl--0.27 (9)0.92 (10)
Benzene, 1-methyl-4-propyl---0.08 (11)
1H-Indene, 2,3-dihydro--0.26 (11)0.37 (12)
Benzene, 1-butenyl-0.48 (8)--
Benzene, n-pentyl--0.5 (13)0.34 (14)
1H-Indene, 2,3-dihydro-4-methyl---0.24 (17)
Benzene, 1-methyl-4-(1-methyl-2-propenyl)---0.22 (18)
Benzene, 1-methyl-4-(1-methylethenyl)---0.96 (19)
1H-Indene, 2,3-dihydro-1,6-dimethyl---0.21 (20)
Benzene, 2-ethyl-1,4-dimethyl---0.36 (21)
Benzene, 1-methyl-2-(2-propenyl)--0.27 (16)-
1H-Indene, 2,3-dihydro-4,7-dimethyl--0.25 (17)-
Benzene, 2-ethenyl-1,3,5-trimethyl---0.56 (25)
1H-Indene, 2,3-dihydro-1,1,5-trimethyl---0.54 (29)
Monoaromatics total area, %2.14.9313.35
Polycyclic aromatic hydrocarbons (PAHs)
Naphthalene, 1-methyl--0.16 (43)0.18 (39)
Phenanthrene, 1-methyl-7-(1-methylethyl)-0.53 (74)0.69 (80)1.15 (76)
PAHs total area, %0.530.851.33
O-aromatic compounds
Phenol, 2,6-dimethyl-0.31 (18)0.45 (34)0.61 (30)
Phenol, 2-methoxy-2.71 (20)--
Phenol1.52 (21)3.4 (37)4.16 (32)
Phenol, 2-methyl-1.17 (22)1.8 (38)2.78 (33)
Phenol, 2,3-dimethyl--0.77 (40)1.53 (35)
Phenol, 2,5-dimethyl-0.49 (24)--
Phenol, 2-methoxy-4-methyl-5.29 (25)--
Phenol, 2,5-diethyl---0.28 (36)
Phenol, 4-methyl-1.31 (26)5.64 (41)4.91 (37)
Phenol, 3-methyl--4.34 (42)7.32 (38)
Phenol, 2,3,5-trimethyl--0.56 (44)0.84 (40)
Phenol, 2-ethyl-5-methyl--1.04 (46)1.52 (42)
Phenol, 4-ethyl-2-methoxy-2.11 (29)--
Phenol, 2-ethyl-0.61 (30)--
Phenol, 4-ethyl-0.03 (32)3.08 (47)2.58 (43)
Phenol, 3-ethyl--1.7 (48)2.56 (44)
Phenol, 4-(1-methylpropyl)--0.23 (49)0.35 (45)
Phenol, 3,4-dimethyl--1.03 (50)1.25 (46)
Phenol, 2-(1-methylpropyl)--0.68 (51)0.9 (47)
Phenol, 4-propyl--3.18 (52)3.03 (48)
Phenol, 3-propyl--2.05 (53)3.71 (49)
Phenol, 3,4,5-trimethyl--0.56 (55)1.32 (51)
Phenol, 2-methoxy-4-propyl-1.1 (33)--
Ethanone, 1-(2-hydroxyphenyl)---1.45 (53)
Phenol, 4-(3-hydroxyprop-1-en-1-yl)-0.61 (58)2.1 (54)
Phenol, 2-methoxy-4-(1-propenyl)-0.99 (36)--
Phenol, 2-methoxy-4-vinyl-0.52 (39)--
Phenol, 4-(2-propenyl)--0.61 (62)0.42 (57)
Phenol, 2-methoxy-4-(2-propenyl)-2.54 (46--
Phenol, 2,6-dimethoxy-1.04 (47)--
1,2-Benzenediol0.69 (49)--
1,4-Benzenediol0.58 (51)--
Phenol, 2,6-dimethoxy-4-(2-propenyl)-0.32 (58)--
Oxy-aromatics total area, %23.3331.7343.62
Alkanes
n-Tridecane--0.47 (3)
n-Tetradecane--0.37 (8)
n-Pentadecane--2.32 (16)
n-Heptadecane--4.92 (23)
Alkanes total area, %--8.08
Acids
Ethanoic acid (acetic acid)1.51 (2)1.32 (2)-
Propanoic acid0.49 (5)0.48 (6)-
Butanoic acid-3.01 (12)2.08 (13)
2-Butenoic acid, (E)-(crotonic acid)0.4 (10)--
Butanoic acid, 3-methyl--0.57 (15)0.46 (15)
Pentanoic acid-0.8 (18)-
Pentanoic acid, 4-methyl--0.51 (23)-
Hexanoic acid-0.45 (24)-
Heptanoic acid-0.42 (29)-
Dodecanoic acid0.15 (37)--
Tetradecanoic acid0.97 (45)--
Hexadecanoic acid (palmitic acid)11.49 (53)10.69 (67)6.16 (63)
9-Hexadecenoic acid (palmitoleic acid)1.81 (54)--
Octadecanoic acid (stearic acid)6.83 (59)7.33 (70)3.73 (66)
9-Octadecenoic acid (Z)-(oleic acid)10.55 (60)3.49 (71)3.29 (67)
9,12-Octadecadienoic acid (Z,Z)-(linoleic acid)6.05 (63)6.09 (72)1.05 (68)
Eicosanoic acid1.56 (65)--
Docosanoic acid-1.87 (75)0.66 (70)
Acids total area, %41.8137.0317.43
Fatty acids methyl esters (FAMEs)
5,9-docosadienoic acid, methyl ester0.48 (27)--
Hexadecanoic acid, methyl ester0.94 (35)--
9-Octadecenoic acid (Z)-, methyl ester0.91 (44)--
FAMEs total area, %2.33--
Polycyclic compounds
1-Isopropyl-4,7-dimethyl-
1,2,4a,5,6,8a-hexahydronaphthalene
0.88 (12)--
Naphthalene, 6-ethyl-1,2,3,4-tetrahydro--0.22 (27)1.3 (24)
Naphthalene, 1,2,3,4-tetrahydro-
1,6-dimethyl-4-(1-methylethyl)-
-0.54 (31)0.5 (28)
18-Norabieta-8,11,13-triene0.46 (38)0.5 (60)-
Abieta-8,11,13-trien-18-al0.38 (41)-2.89 (55)
Tetrahydroabietic acid-3.26 (77)0.52 (74)
Dihydroabietic acid-0.68 (78)-
Dehydroabietic acid2.27 (75)2.86 (83)0.28 (79)
Polycyclic compounds area, %3.998.065.49
Other oxygenated compounds
1,2-Cyclopentanediol, 3-methyl--0.83 (7)-
n-Decanal0.4 (11)--
2-Cyclopenten-1-one, 2,3-dimethyl-0.43 (15)--
2-Cyclopenten-1-one, 2-hydroxy-3-methyl-1.25 (16)--
2-Cyclopenten-1-one, 3-ethyl-2-hydroxy-0.24 (19)--
Benzoic acid0.53 (34)--
7-Tetradecen-1-ol0.87 (64)--
Total area, %3.720.83-
N-heteroaromatic compounds
1H-Indole, 6-methyl--0.27 (68)0.49 (64)
1H-Indole, 5,7-dimethyl--0.13 (69)0.24 (65)
Total area, %-0.40.73
Total identified peaks, % area77.8183.3390.03
Table 5. Relative atomic concentrations of elements in the near-surface layer of NiCuMo-P-SiO2-R1 catalyst (upper part of the table); Ni2p3/2, Cu2p3/2, Mo3d5/2, and P2p binding energies and charge states of elements with distribution in atomic % (lower part of the table).
Sample ( N i ) ( S i ) ( C u ) ( S i ) ( M o ) ( S i ) ( P ) ( S i ) ( C u ) ( N i ) ( M o ) ( N i ) ( P ) ( N i ) ( O ) ( S i )
NiCuMo-P-SiO2-R 10.340.00470.160.160.0140.470.462.04
SpectrumNi2p3/2Cu2p3/2Mo3d5/2P2p
Charge state
(atom. %)
Ni0 (100)Cu0 (100)Mo0 (10)Mo4+ (75)Mo5+ (15)Pδ− (60)P5+ (40)
Binding energy, eV852.6932.3227.9229.2231.6129.5134.5
1 Catalyst additionally reduced at 450 °C by H2 inside the high-pressure cell of the XPS spectrometer (see Supplementary Materials).
Table 6. Sulfur content in the catalysts after Py-SS hydrotreatment at 200–390 °C.
Catalyst SampleSp-200Sp-250Sp-300Sp-350Sp-390
S wt. %7.19.211.413.213.5
Publisher’s Note: MDPI stays neutral with regard to jurisdictional claims in published maps and institutional affiliations.

