CO2 Methanation of Biogas over 20 wt% Ni-Mg-Al Catalyst: on the Effect of N2, CH4, and O2 on CO2 Conversion Rate

1
Department of Environmental and Energy Engineering, University of Suwon, Hwaseong-si 18323, Korea
2
Unisys International R&D, Bio Friends Inc., Yuseong-gu, Daejeon 34028, Korea
*
Author to whom correspondence should be addressed.
Catalysts 2020, 10(10), 1201; https://doi.org/10.3390/catal10101201
Submission received: 27 August 2020
/
Revised: 13 October 2020
/
Accepted: 14 October 2020
/
Published: 16 October 2020
(This article belongs to the Special Issue Characterization Analysis of Heterogeneous Catalysts)
Abstract
:Biogas contains more than 40% CO2 that can be removed to produce high quality CH4. Recently, CH4 production from CO2 methanation has been reported in several studies. In this study, CO2 methanation of biogas was performed over a 20 wt% Ni-Mg-Al catalyst, and the effects of CO2 conversion rate and CH4 selectivity were investigated as a function of CH4, O2, H2O, and N2 compositions of the biogas. At a gas hourly space velocity (GHSV) of 30,000 h−1, the CO2 conversion rate was ~79.3% with a CH4 selectivity of 95%. In addition, the effects of the reaction temperature (200–450 °C), GHSV (21,000–50,000 h−1), and H2/CO2 molar ratio (3–5) on the CO2 conversion rate and CH4 selectivity over the 20 wt% Ni-Mg-Al catalyst were evaluated. The characteristics of the catalyst were analyzed using Brunauer–Emmett–Teller surface area analysis, X-ray diffraction, X-ray photoelectron spectroscopy, and scanning electron microscopy. The catalyst was stable for approximately 200 h at a GHSV of 30,000 h−1 and a reaction temperature of 350 °C. CO2 conversion and CH4 selectivity were maintained at 75% and 93%, respectively, and the catalyst was therefore concluded to exhibit stable activity.
1. Introduction
The recent years have witnessed a growing interest in the regulation of greenhouse gases and the quest for sustainable renewable energy to combat global warming. This has culminated in the demand for an efficient energy storage system (ESS) that can stabilize electric power systems with high output fluctuations. The lithium-ion battery is an ESS widely employed in various energy generation systems owing to its high energy density and efficiency; however, its short shelf life and low storage capacity limit its long-term power storage [1]. The availability of organic waste, which is a sustainable energy source, can increase with economic and population growth. Consequently, much attention has been drawn to the utilization of biogas, as it can be easily obtained from livestock (organic) waste and urban solid waste. Biogas, which typically contains 40–65 vol% CH4, 40–50 vol% CO2, and minor quantities of (the subsequently removed) N2, H2S, O2, and H2O [2], is employed as a high-concentration CH4 fuel after more than 40% of CO2 is removed using absorbents or amines [3]. The power-to-gas technology generates H2 from water by employing renewable energy and produces CH4 via the methanation of H2 and CO2. Further, CO2 methanation and reverse water gas shift (RWGS) are competing processes that occur during the production of CH4 from CO2, as described by Equations (1)–(3) [4]. This has become a topic of research considering the possibility of a ‘carbon-neutral fuel’ and the replacement of natural gas as well as ESSs [5].
Biogas is initially subjected to purification to remove impurities such as H2S, H2O, and siloxanes. Subsequently, CO2 and highly concentrated CH4 are separated, so that CH4 can be utilized as fuel [6]. In addition to being used as a fuel, biogas generated by catalytic reforming is also used to produce high-value-added chemicals (e.g., methanol, acetic acid, dimethyl ether, ammonia, and Fischer–Tropsch oil), which greatly contributes to the reduction of greenhouse gas emissions [7,8]. Moreover, biogas is an affordable and suitable raw material for syngas production, even though syngas is now largely produced through the CH4 reforming of natural gas.
In a recent study, Mohammad et al. [9] compared the activity of Al2O3-supported Ni, Co, Fe, and Mo catalysts during CO2 methanation. The Ni catalyst showed the highest CO2 conversion and CH4 selectivity, followed by Co, Fe, and Mo. The study by Aziz et al. [10] on the activity of mesostructured silica nanoparticle (MSN)-supported Ni, Fe, and Mo catalysts demonstrated that the Fe catalyst was active at high temperatures, whereas the Ni catalyst exhibited the highest catalytic activity at lower temperatures (<350 °C) [11]. Daroughegi et al. [12] conducted CO2 methanation experiments on Al2O3-supported Ni catalysts with different metal loadings, and the results revealed that the specific surface area and CO2 conversion increased with an increase in the Ni loading from 15, 20, and 25 wt%, whereas the specific surface area and CO2 conversion decreased at 33 wt%. In the study on Ni/γ-Al2O3, Cho et al. [13] reported that the highest dispersion, CH4 selectivity, and reaction rate were observed at 20 wt% Ni content when the Ni content was varied from 15 to 50 wt%.
Affar et al. [9] compared the activities of the 10 wt% Ni catalysts supported on SiO2, MCN (Mesoporous carbon nitrides), and Al2O3. Among the experiments performed at 360 °C, the Ni-Al2O3 catalyst showed the highest CO2 conversion and CH4 selectivities of 82.9 and 97.9%, respectively. Further, the SEM (Scanning Electron Microscopy) results confirmed that the Ni particles were more uniformly dispersed in the 10 wt% Ni-Al2O3 catalyst than those in the 10 wt% MCM (Mobile Crystalline Material) and SiO2 catalysts. It has also been reported that the catalytic activity of SiO2-supported catalysts for methane production decreases in the presence of H2O. On MCM, Aziz [14] reported that the CH4 conversion and selectivity decrease because of the consumption of the carbonyl species by conversion to CO2 in the presence of water vapor, via the water gas shift reaction. Vetrivel et al. [15] and Wang et al. [16] reported that the fabrication of the catalysts by reduction on a CeO2 support generated more surface oxygen vacancies, which resulted in high CO2 conversion, CH4 selectivity, and enhanced catalyst stability.
Typically, promoters are used for improving the activity of supported catalysts. For example, the promoter MgO can increase carbon resistance [17], thermal stability [18], and the dispersion of Ni/Al2O3 catalysts [19,20], affording enhanced activity [21,22]. Thus, MgO, in combination with support materials such as Al2O3 or SiO2 has been proposed as a support for methanation catalysts [23,24]. Bette et al. [25] demonstrated that the maximum CO2 conversion of 74% was obtained with a 59 wt% Ni/(Mg,Al)Ox catalyst, and the addition of MgO to Ni/SiO2 resulted in a conversion of 66.5% [14]. In addition, MgO is a basic material that absorbs carbon dioxide and reduces catalyst deactivation via sintering and carbon deposition [26]. While catalysts become inactive because of the water produced during CO2 methanation, MgO reacts with water to generate magnesium hydroxide (Mg(OH)2) and thereby mitigates catalyst deactivation [27,28].
The activation energy of Ni catalysts for methanation was 93.61 kJ/mol in Ni/ZrO2 catalysts [29], 75 kJ/mol in Ni/Al2O3 catalysts [30], and 75 kJ/mol in Ni/Al hydrotalcite catalysts [31].
The present work studies the production of CH4 by the reaction of biogas CO2 with hydrogen over a 20wt% Ni-Mg-Al catalyst with high dispersion of Ni metal and BET (Brunauer–Emmett–Teller) value and characterizes this catalyst by several instrumental analyses. The conditions for the reaction of biogas, including reaction temperature, space velocity, and H2/CO2 ratio, were varied to investigate their effects on CO2 conversion, CH4 yield, and selectivity. In addition, because biogas is a mixture of various gases and trace elements, the effect of the concentration of these components (N2, O2, CH4, and CO2) on CO2 conversion, CH4 yield, and selectivity were studied. Based on this, the optimal reaction conditions for producing CH4 from biogas were determined, under which a stability test of the 20 wt% Ni-Mg-Al catalyst was performed for 200 h.
2. Results and Discussion
2.1. Effect of Reaction Temperature on CO2 Conversion
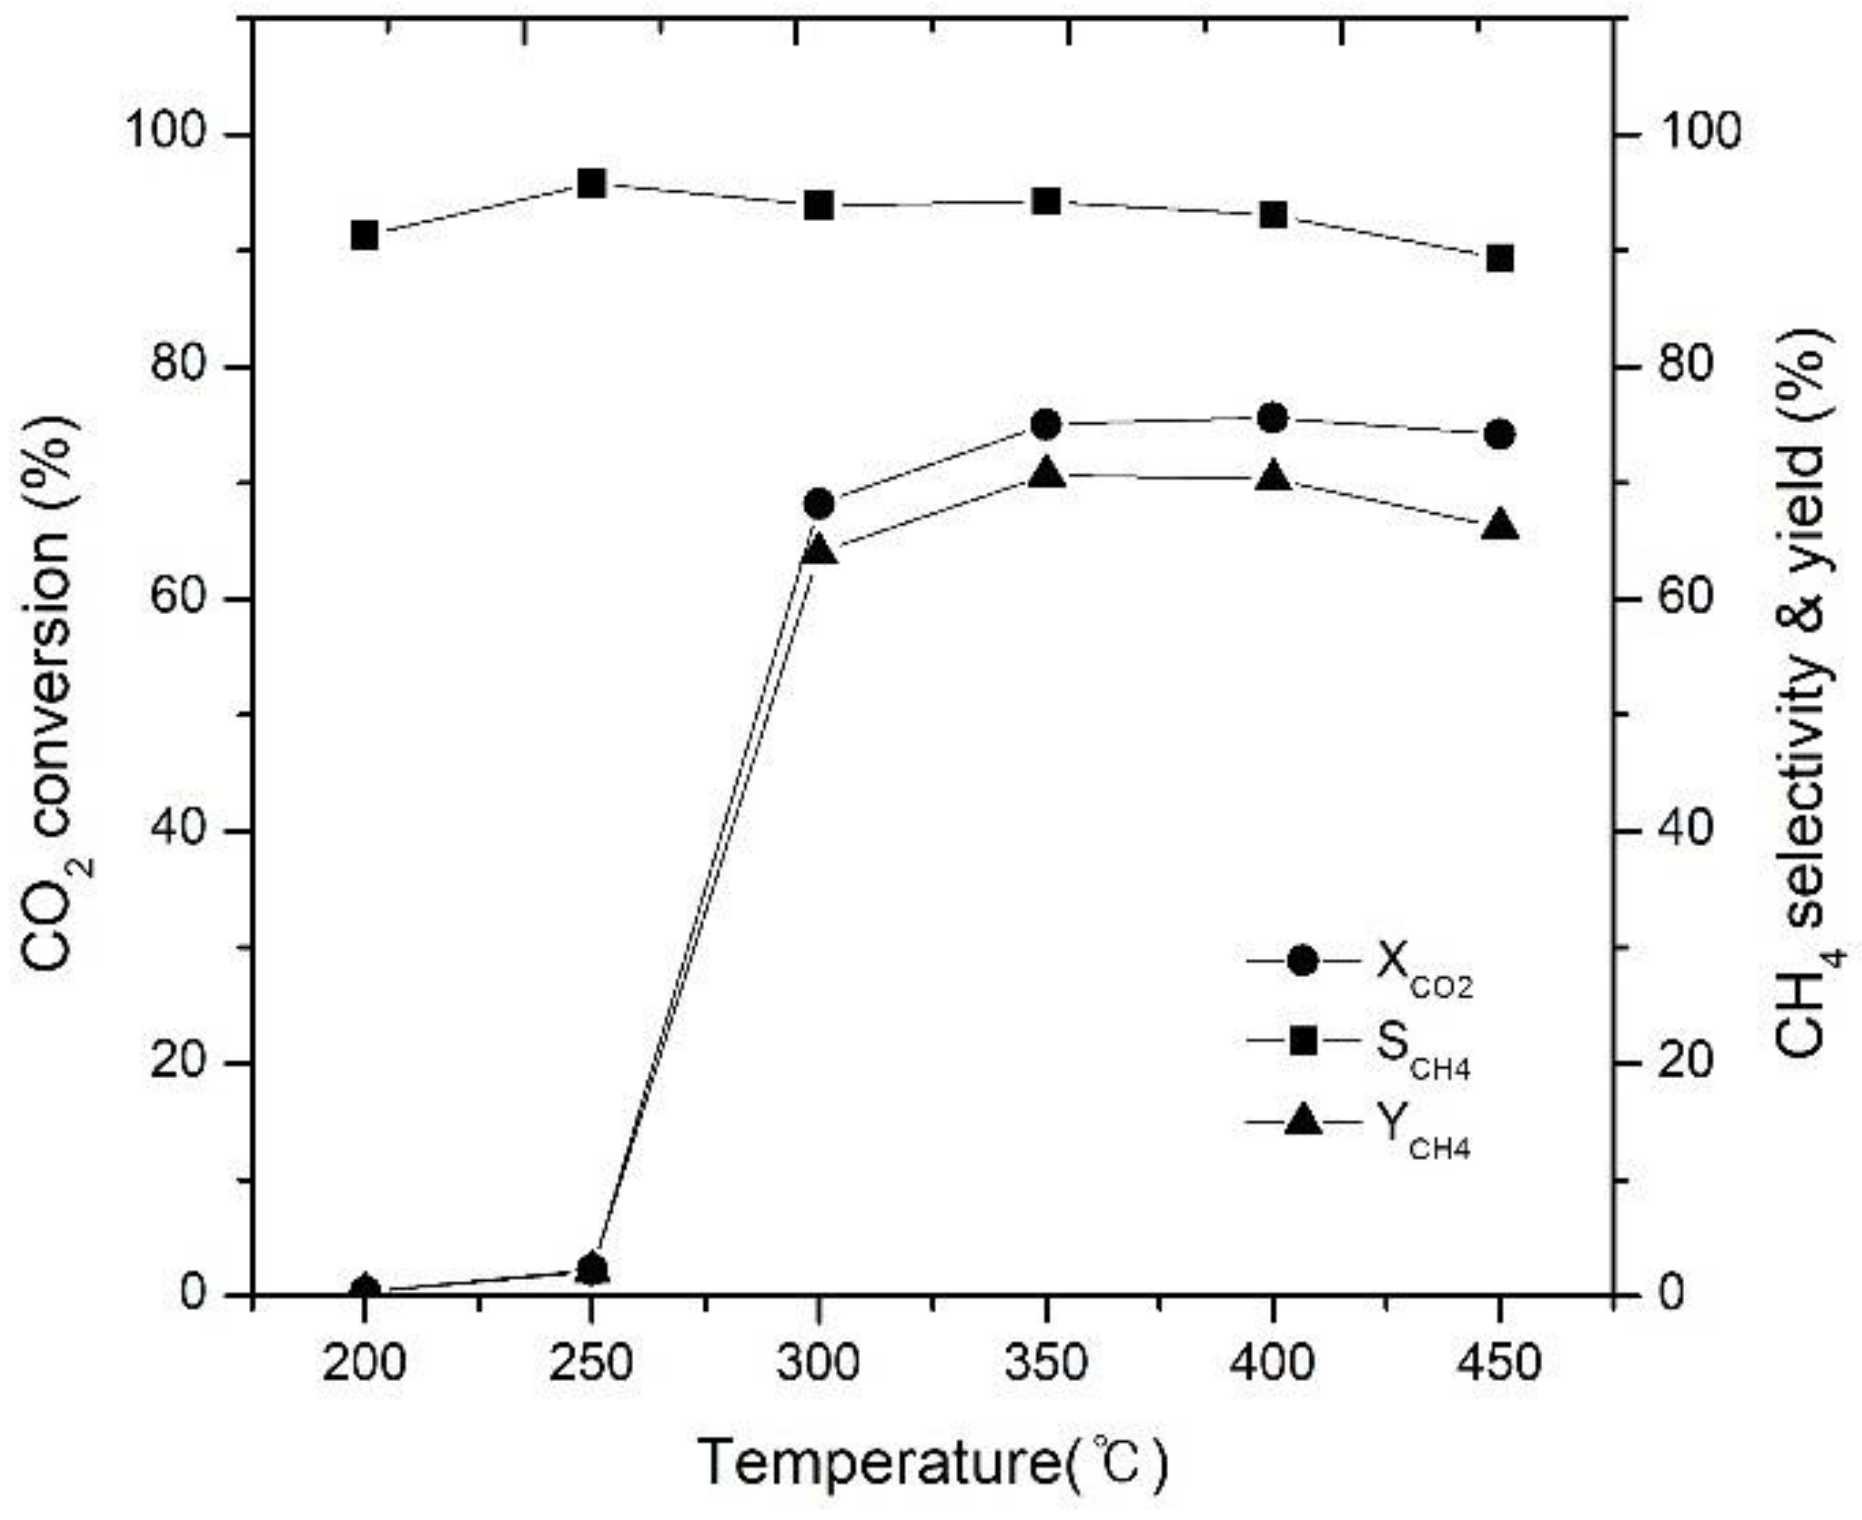
The dependence of CO2 conversion and CH4 selectivity on reaction temperature at a gas hourly space velocity (GHSV) of 30,000 h−1 and H2/CO2 ratio of 4 is displayed in Figure 1. As shown in the figure, CO2 conversion increased as the temperature increased and reached a maximum at 400 °C, whereas CH4 selectivity and yield showed the highest values at 350 °C. This trend is probably the result of CO2 methanation suppression above 350 °C, at which the RWGS reaction (Equation (3)) is enhanced, which resulted in the conversion of CO2 to CO. This result agreed with that reported by Mohammad et al. [9], wherein the CO concentration increased as the RWGS reaction increased at 400 °C, whereas the methane selectivity decreased. A study by Jia et al. [29] also reported that the highest CO2 conversion and CH4 yield were observed at 350 °C as the temperature increased, and a further increase in temperature decreased the CO2 conversion because of the thermodynamic equilibrium limit [32].
In addition, the activation energy obtained from the 20 wt% Ni-Mg-Al catalyst was approximately 74.2 kJ/mol, which was similar to that obtained by using Ni/Al2O3 (75 kJ/mol) in the study by Carbarino [30].
2.2. Effect of H2/CO2 Ratio on CO2 Conversion
Figure 2 shows the effects of the H2/CO2 ratio at a reaction temperature of 350 °C and a GHSV of 30,000 h−1 on CO2 conversion and CH4 selectivity and yield. Figure 2a shows the results obtained for different H2/CO2 ratios by increasing the amount of H2 at a given amount of CO2 and by increasing the amount of CO2 at a given amount of H2. Figure 2b shows the effects of increasing the reactant amounts at a given H2/CO2 ratio. As shown in Figure 2a, the CO2 conversion and CH4 yield increased by approximately 15% when the H2/CO2 ratio increased from 3.5 to 5, whereas the CH4 selectivity remained almost constant. As shown in Figure 2b, the same H2/CO2 ratio led to similar CO2 conversion and CH4 selectivity and yield, regardless of the amount of reactants. These results were similar to those from a study by Rahmani [33] in which a 15% increase was observed when the H2/CO2 ratio was increased from 3 to 4, and the study by Aziz et al. [34] also reported that the concentration of hydrogen affects the catalytic activity because of hydrogen adsorption onto the surface of the catalyst and the conversion to methane via hydrogenation.
2.3. Effect of GHSV on CO2 Conversion
The effects of increasing GHSV on CO2 conversion and CH4 selectivity and yield at a reaction temperature of 350 °C and H2/CO2 ratio of 4 are shown in Figure 3a,b, respectively. The effect of increasing the reactant flow rate on GHSV of 21,000–50,000 h−1 is shown in Figure 3a, and the effect of increasing the amount of nitrogen at a given reactant flow rate on GHSV of 9000–38,000 h−1 is shown in Figure 3b. As shown in the figure, CO2 conversion and CH4 yield/selectivity showed a general decreasing trend as the GHSV increased, and the effect for (b) was larger than that for (a). This is because an increase in GHSV shortens the time during which the reactants CO2 and H2 are in contact with the catalyst, thus reducing the amount of reactants adsorbed onto the surface of the catalyst. These results were consistent with the experimental results reported by Abate et al. [35].
2.4. Effect of Initial Concentration of Biogas Components on CO2 Conversion
2.4.1. Effect of Initial CH4 Concentration on CO2 Conversion
The effect of changing the initial CH4 concentration to 0, 50, and 65 vol% for CO2 conversion at a reaction temperature of 400 °C, GHSV of 30,000 h−1, and H2/CO2 ratio of 4 is shown in Figure 4. As shown in the figure, increasing the content of CH4 in the reactant gas to 40, 50, and 65 vol% led to low CO2 conversions of approximately 67, 64, and 54%, respectively, resulting in up to a 20% decrease in the CO2 conversion compared to that in the absence of CH4. This phenomenon is attributed to the Le Chatelier principle, in which the initial CH4 present in the reactant gas inhibits the conversion to CH4. These results were also reported in a simulation study by Jürgensen et al. [36], wherein CO2 conversion decreased as the initial methane concentration increased.
2.4.2. Effect of Initial CO2 Concentration on CO2 Conversion
The effects of increasing the initial CO2 concentration on CO2 conversion and CH4 selectivity and yield at a reaction temperature of 350 °C, GHSV of 30,000 and 50,000 h−1, and H2/CO2 ratio of 4 are presented in Figure 5. As shown in the figure, an increase of CO2 in biogas from 10 to 14 vol% at a GHSV of 30,000 h−1 resulted in a 2% increase in CO2 conversion and a 3% increase at a GHSV of 50,000 h−1. This is probably due to the increase in reaction temperature owing to the exothermic reaction of CO2 methanation with increasing amounts of the reactants; thus, the increase in CO2 conversion is more at a GHSV of 50,000 h−1 than that at 30,000 h−1, because more reactants are present in the former than in the latter.
2.4.3. Effect of Initial N2 Concentration on CO2 Conversion
Approximately 15% of N2 exists in landfill gas—a type of biogas—which is used as an inactive gas to prevent the deactivation of catalysts caused by the spot exothermic reaction of CO2 methanation. The effect of the presence of 0, 10, and 30% N2 in the reactant gas on CO2 conversion at a GHSV of 15,000 h−1 and H2/CO2 ratio of 4 is shown in Figure 6. When nitrogen concentrations were 10 and 30% in the reactant, the respective CO2 conversions were approximately 3 and 5% lower than that in the absence of N2. This is believed to be due to the decrease in the reactant concentration as the N2 concentration increased, leading to less heat generation, which, in turn, lowers the reaction temperature.
2.4.4. Effect of Initial Oxygen Concentration on CO2 Conversion
The effects of the presence of oxygen in the reactant gas on CO2 conversion at a GHSV of 30,000 h−1, H2/CO2 ratio of 4, and reaction temperatures of 300 and 400 °C are shown in Figure 7. When 4% oxygen was present in the reactant gas, CO2 conversion and selectivity decreased by approximately 5% and 3%, respectively. This is thought to be a protected re-oxidation reaction due to the presence of oxygen in the reactant gas, which prevents the forward reaction in CH4 synthesis paths (1) and (2). According to the mechanism proposed by Lin et al. [21], CO2 is separated from the oxygen vacancies on the Ni metal and support material, which are produced during the reduction of the catalysts, and it is reported that a decrease in the oxygen vacancies on the catalyst and support reduces the catalytic activity. Therefore, it is considered that the CO2 conversion and selectivity decrease in the presence of oxygen because of the decrease in the amount of oxygen vacancies on the Ni catalyst and support, which prevents CO2 from being converted to CO or carbon species, or because of the re-oxidation of CO.
2.5. Stability and Activity of Catalyst Test
To evaluate the activity and stability of the catalysts, CO2 methanation was conducted at a GHSV of 30,000 h−1, reaction temperature of 350 °C, and H2/CO2 ratio of 4 for 200 h. As shown in Figure 8, the CO2 conversion was constant at 75%, and CH4 selectivity was 93% for a reaction time of 200 h. These results confirmed the activity and stability of the 20 wt% Ni-Mg-Al catalyst for the CO2 methanation reaction. The catalytic activity was retained even upon storage at room temperature.
3. Materials and Methods
3.1. Catalyst Preparation
The catalyst used in this study is a 20 and 40 wt% Ni-Mg-Al catalyst (supported by Korea Institute of Energy Research, Daejeon, Korea). The catalyst was prepared on a Ni metal that exhibits high catalytic activity and CH4 selectivity. The catalyst was prepared by mixing calculated ratios of Ni(NO3)2ㆍ6H2O, Al(NO3)2ㆍ9H2O, and Mg(NO3)2ㆍ6H2O solutions at 60 °C until the Ni content was 20, 40 wt%, and a precipitate was obtained after adding a precipitant to the mixture and stirring for approximately 1 h while maintaining a constant pH. The precipitated catalyst precursor was repeatedly washed with distilled water and filtered with a filter press until the pH reached approximately 7.0. The catalyst precursor was then dried in an oven at 150 °C for 12 h, and 20 and 40 wt% Ni-Mg-Al2O3 catalysts were prepared through a heat treatment process under an air atmosphere at 600 °C for 4 h. Prior to their use, all catalysts were heated to the reduction temperature under a gas flow of 100 mL/min (20% H2, 80% N2) for 2 h, and the catalysts were reduced while the temperature was maintained for 4 h.
Figure 9 illustrates the variations in catalytic activity of the 40 wt% Ni-Mg-Al2O3 catalysts at the reaction temperatures of 350 and 400 °C as a function of changes in the reduction temperatures to 450, 550, 700, and 800 °C. The CO2 conversion initially showed a significant increase as the reduction temperature increased, while the CO2 conversions at 700 and 800 °C were similar; therefore, 700 °C was used as the reduction temperature of the catalysts.
3.2. CO2 Methanation Apparatus and Activity Test
Isothermal CO2 methanation experiments were conducted in a plug-flow system (Figure 10) at steady state with Ni catalysts loaded into the reactor. The catalytic reactor has an outer diameter of 12.7 mm (1/2”), a thickness of 1.257 mm, a length of 209 mm, and Inconel 800 HT composed of 80% Ni, 14% Cr, and 6% Fe. During the experimentation, a mesh sieve was installed in the lower part of the reactor to support the catalyst layer, and 0.5 g of the catalyst was loaded. A back-pressure regulator (BPR) in the latter section of the reactor was used to control the reaction pressure from 1 to 9 atm. A water trap in the latter section of the BPR was used to remove the water generated from the reaction, and a high-pressure check valve was installed to prevent gas backflow. All tubes used were of SUS (Steel Use Stainless) grade with an outer diameter of Φ3.2 mm and a thickness of 0.8 t, and the products were analyzed using gas chromatography (GC). To prevent the condensation of the products inside the tube during this process, a line heater was installed and maintained above 150 °C.
The reaction products were characterized using a GC (YL Instrument 6500 GC, YL Instruments Co., Anyang, Korea), SS COL 10FT 1/8” PORAPACK N (Model: 13052-U), a Phase None Matrix 45/60 Molecular Sieve 13X was used for the GC columns, and argon was used as the carrier gas. Hydrogen, methane, and carbon monoxide were analyzed with a thermal conductivity detector (TCD), whereas carbon dioxide was analyzed using a flame ionization detector (FID). Characterization in the GC oven was conducted by maintaining the temperature initially at 35 °C for 0–6 min and raising it to approximately 170 °C at a ramp rate of 15 °C/min. FID characterization was performed at 250 °C by supplying 35 mL/min of hydrogen and 300 mL/min of oxygen, while TCD characterization was carried out at 150 °C under a gas flow rate of 35 mL/min of hydrogen and 20 mL/min of Ar. CO2 conversion (XCO2), CH4 selectivity (SCH4), and CH4 yield (YCH4) were calculated according to Equations (4)–(6) [37].
Using a reactant gas flow rate of 250 mL/min, a reaction temperature of 350 °C, GHSV of 30,000 h−1, and an H2/CO2 ratio of 4 as the basis, methanation reaction experiments were conducted by changing the experimental conditions, as listed in Table 1.
3.3. Catalyst Characterization
3.3.1. Brunauer–Emmett–Teller (BET) Measurement
The BET specific surface area, which is one of the key catalyst properties, was measured using ASAP 2020 Plus Physisorption (Center for Advanced Materials Analysis, Suwon University) (Micrometrics Instruments, Norcross, GA, USA). A known amount of catalyst sample was added to the BET measurement tube, and the moisture in the catalyst was removed through a pretreatment process under a vacuum of 10 µm Hg by heating to 250 °C at a ramp rate of 10 °C/min for 12 h, after which the weight of the catalyst sample was measured.
Measurements of the specific surface area, pore volume, and pore size of the fresh (20 and 40 wt% Ni-Mg-Al) and spent (20 wt% Ni-Mg-Al catalyst after 200 h of use) catalysts are summarized in Table 2. The BET surface area of the spent catalyst decreased in comparison with that of the fresh catalyst. In addition, an increase in the Ni content led to a decrease in the specific surface area, which is attributed to the blocking of catalyst pores with increasing Ni content, similar to the results reported by Daroughegi et al. [12] with catalysts containing greater than 20 wt% of Ni. In addition, these observations were similar to the results obtained by A. Zhao et al. [38]—the Ni metal crystal size increased in the catalysts comprising Ni loadings greater than 20 wt%. As shown in Table 3, the 20 wt% catalyst also showed a high TOF (Turnover Frequency) value. TOF values towards CO2 were defined as the number of CO2 molecules converted over per surface metallic Ni active site per second. High TOF value means that the catalytic activity is high. Therefore, the 20 wt% catalyst showed a higher CO2 conversion than the 40 wt% catalyst (Table 3 and Table 4).
3.3.2. X-ray Diffraction (XRD) Characterization
The elemental composition of the catalysts was characterized using an XRD diffractometer (Center for Advanced Materials Analysis, Suwon University) (Thermo Fisher Scientific, ARL Equinox 3000, MA, USA). The catalyst powder samples were pretreated at 250 °C for 5 h to remove moisture, and the crystals of the catalysts were analyzed. Cu-Kα radiation was used to fix the axis of the sample, and measurements were performed at 30 mA and 40 kV over a 2θ range 10–80° using a scanning speed of 8θ/min. The XRD analysis results of the catalytic supports and Ni catalysts before and after the reaction are shown in Figure 11. Diffraction peaks that appear at 2θ values of 37.3°, 43.3° and 62.9° are associated with the NiO phase, whereas those at 44.55°, 51.85°, and 76.3° are associated with Ni metal. The 2θ values of 45.86 and 66.91 correspond to MgO, whereas the diffraction peaks at 2θ values of 37.4°, 46.07°, and 66.9° are associated with the alumina phase. Figure 11 shows the XRD characterization of the catalysts before and after reduction at 700 °C and on the spent catalyst 200 h after the reaction. As shown in the figure, peaks corresponding to Ni metal were not observed in the fresh catalyst prior to the reaction, whereas NiO peaks were observed [39]. In contrast, the reduction catalyst and spent catalyst exhibited prominent Ni metal peaks at 2θ values of 51.85° and 76.3°, respectively [30].
3.3.3. H2-TPR Analysis
The interaction and reduction between the catalyst metal and support were characterized by H2-temperature-programmed reduction (H2-TPR, AutoChem II 2920 V5.02, Micromeritics Instruments, Norcross, GA, USA). As shown in Figure 12, the H2 consumption of the catalysts appeared at 300–450 and 600–700 °C. The two peaks correspond to the reduction of the NiO particles. The first peak refers to the reduction of NiO particles that exhibit a weak interaction due to MgO, and the second peak that appears at high temperatures corresponds to the reduction of NiO. Al2O3 particles with spinel structures exhibit a strong interaction between the NiO particles and the Al2O3 support. An improved H2 consumption was observed as the Ni content of the catalysts increased.
3.3.4. X-ray Photoelectron Spectroscopy (XPS) Characterization
To investigate the oxidation state of the catalysts, XPS (Center for Advanced Materials Analysis, Suwon University) (K-Alpha plus, Thermo Fisher Scientific, East Grinstead, UK) was conducted to measure the binding energy. XPS characterization was performed under vacuum using Al-Kα radiation on a fresh catalyst and on the spent catalyst after 200 h of reaction, without any separate sample pretreatment process (Figure 13). The oxidation state of Ni can be determined from the binding energy (BE) of the XPS Ni2p3/2 spectrum. The Ni2p3/2 BE of NiO is 855–856 and 860.5 eV, and that of the Ni metal is 852.3–852.6 eV [40]. Also, the Ni2p1/2 BE of the Ni metal is 873–875 eV. As shown in the figure, the XPS spectrum for the BE of the fresh catalyst displayed peaks at 855.0 and 860.4 eV that are associated with NiO, and a small amount of Ni(OH)2 (peaks at 865.6 eV). The XPS profile of the spent catalyst revealed the presence of Ni metal (851.9 eV) and NiO (855 eV and 860.3 eV).
3.3.5. Scanning Electron Microscopy (SEM)–Energy-Dispersive X-ray Spectroscopy (EDX) Characterization
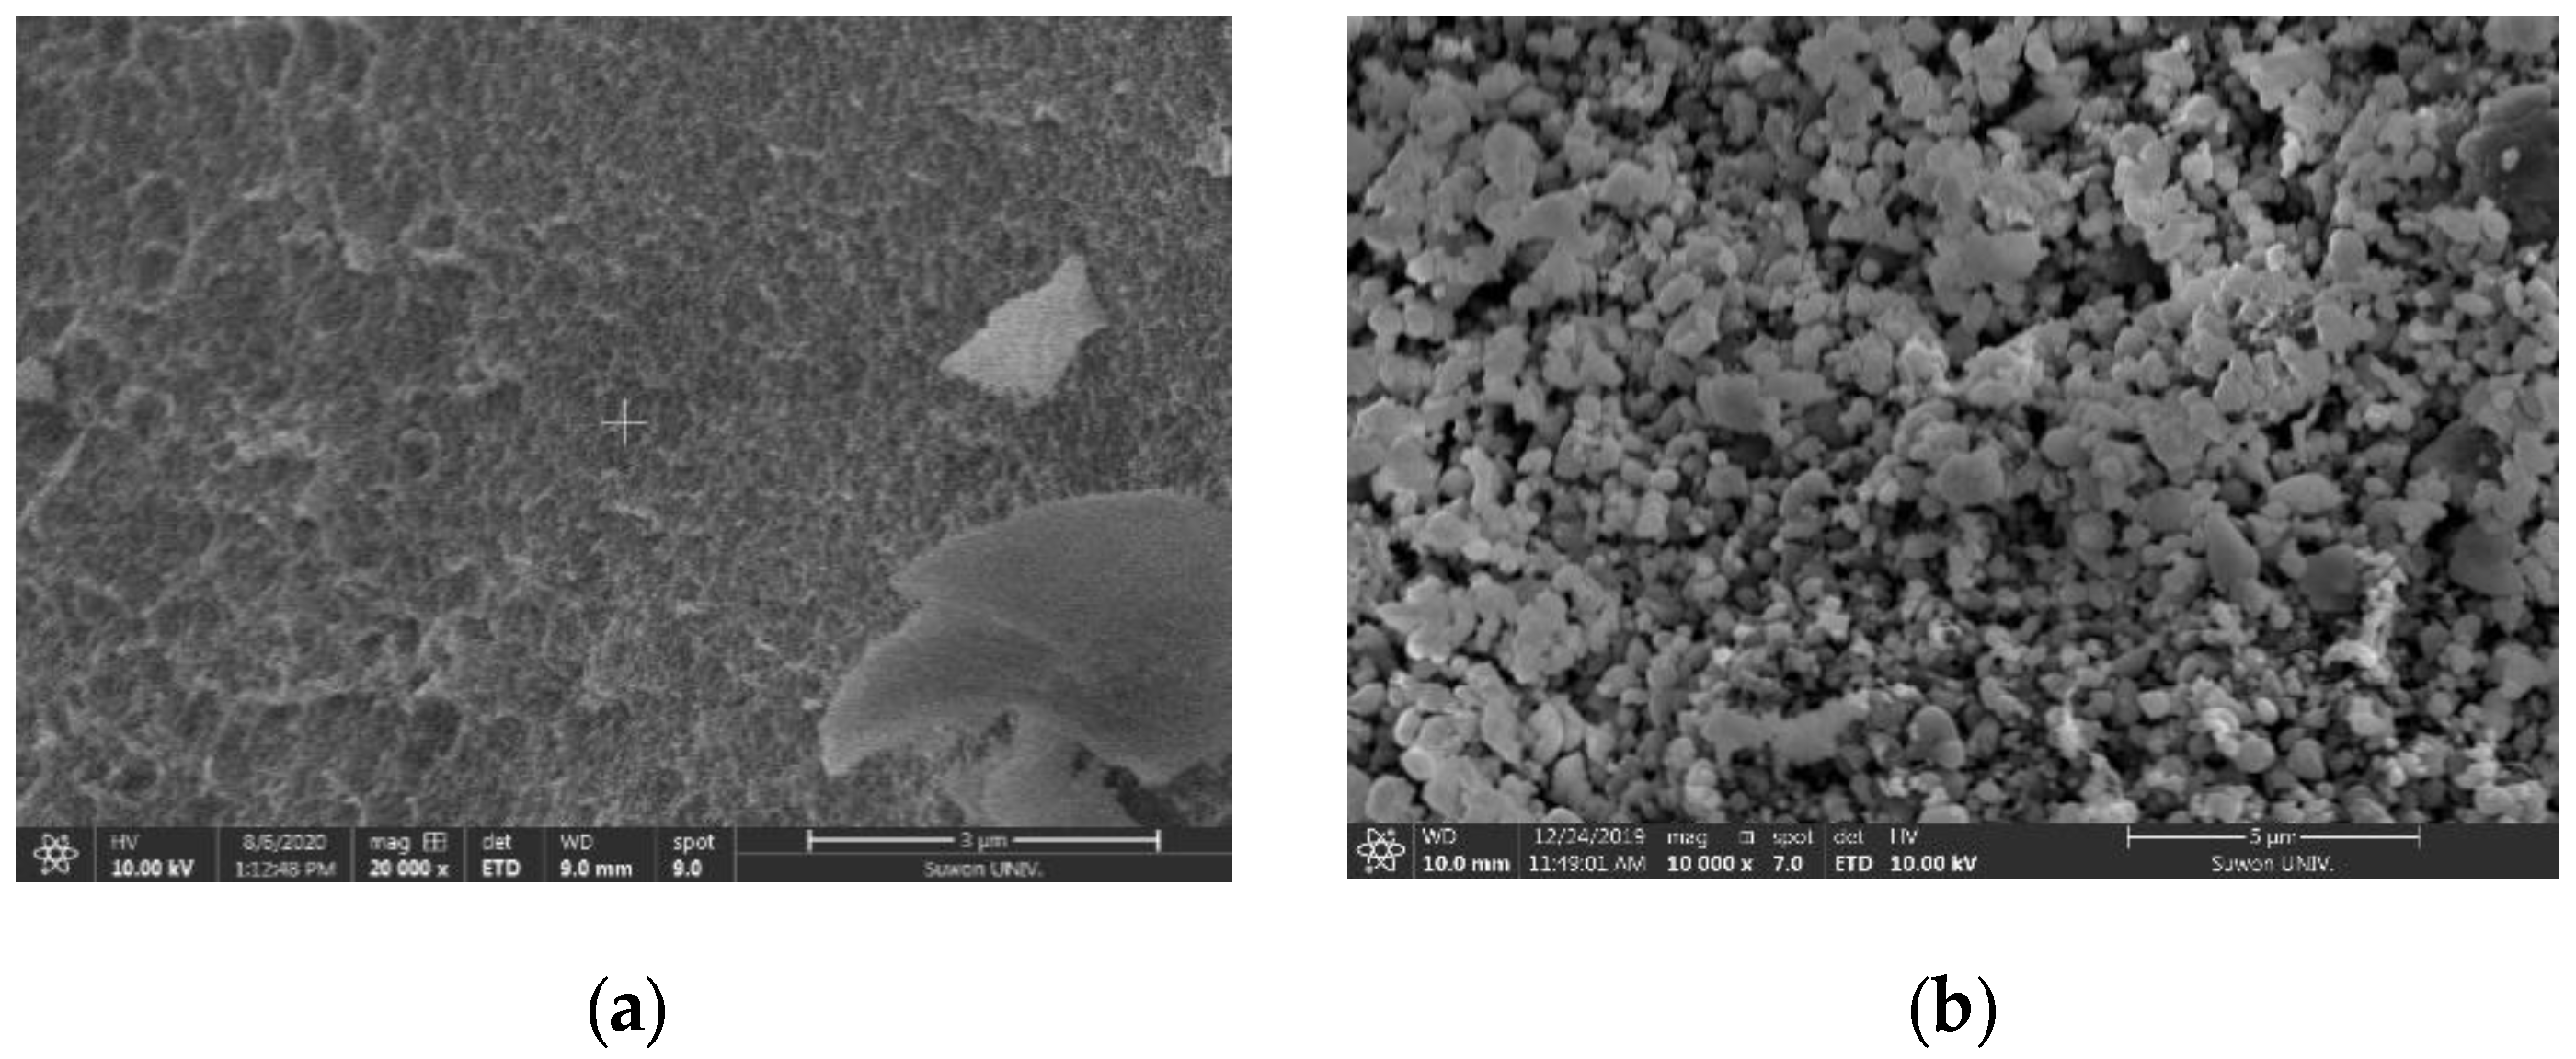
SEM-EDX was used to investigate the surface morphology of the catalysts and the dispersion of Ni. (Center for Advanced Materials Analysis, Suwon University) (APREO SEM, FEI, Hillsboro, OR, USA) was used to obtain images at 20,000 × magnification of the catalyst samples prepared by removing powders and dust, drying at 120 °C for 1 h, and coating with metal (Au). SEM images of the fresh catalyst and the spent catalyst after 200 h of reaction are presented in Figure 14. As shown in the SEM images, nanoscale particles were uniformly dispersed throughout the surface. Owing to the decomposition of Mg(NO3)2·6H2O to MgO at temperatures above 600 °C, it was confirmed that spherical [41] particles were uniformly dispersed.
The results of the elemental composition analysis of the catalyst using EDX and of the surface morphology characterization from the SEM image are shown in Table 5. The contents of Ni, Mg, and Al metals from the cross-section of the catalysts are summarized in Table 5 (the data is for indicative purposes only).
4. Conclusions
In this study, the reaction between H2 and the CO2 present in biogas was explored, and experiments on CO2 methanation for producing CH4 were conducted over a 20 wt% Ni-Mg-Al catalyst. The optimal conditions for CO2 methanation over the 20 wt% Ni-Mg-Al catalyst were determined based on the effects of the reaction temperature, GHSV, and H2/CO2 ratio on CO2 conversion. Furthermore, experiments investigating the effects of CO2, CH4, N2, and O2 concentrations (i.e., biogas composition) on CO2 conversion led to the following conclusions.
1) CO2 conversion increased as the reaction temperature increased, but decreased beyond 400 °C, and the highest values of CH4 selectivity and yield were obtained near 350 °C. This is due to the thermodynamic equilibrium limit that reduces the CO2 conversion at temperatures above 400 °C [29] and inhibits the methanation reaction above 350 °C via the RWGS reaction, which increases the production of CO and decreases the CH4 selectivity. The activation energy at this point was 72.4 kJ/mol.
2) CO2 conversion and CH4 selectivity increased as the H2/CO2 ratio increased from 3.5 to 5.0, whereas the CO2 conversion resulted in similar values as long as the H2/CO2 ratio remained the same regardless of the H2 and CO2 concentrations when the H2/CO2 ratio was varied. Increasing the GHSV of the reactant gas and its N2 concentration shortened the contact time between the reactant and catalyst and reduced the CO2 conversion.
3) A higher initial concentration of CO2 in the biogas led to a slightly higher CO2 conversion, but increasing the initial CH4 concentration to 40, 50, and 65 vol% decreased the CO2 conversion by up to 20% compared to that in the absence of CH4. This trend is believed to be the result of Le Chatelier’s principle, in which the conversion of CH4 was suppressed by the initial concentration of CH4 in the reactant gas. The selectivity was shown to be independent of CH4 concentration and remained constant.
4) Investigation of the effect of the concentrations of N2 and O2 components of biogas revealed that CO2 conversion decreased by approximately 5% in the presence of 10 vol% N2. In the presence of O2, the CO2 conversion decreased as a result of the decrease in the number of active sites of the Ni catalyst due to oxygen, which also reduced the CH4 selectivity because of the re-oxidation reaction.
5) The stability of the 20 wt% Ni-Mg-Al catalyst for CO2 methanation was evaluated from experiments at 350 °C for 200 h. The catalyst is expected to exhibit stable activity, because the CO2 conversion and CH4 selectivity were maintained at constant values of 75 and 93%, respectively.
As mentioned above, because of its stability over 200 h and CO2 conversion over 75%, as indicated by the activity test of the 20 wt% Ni catalyst, the prepared catalyst exhibits excellent performance. In future, we plan to (i) apply the developed strategy to power plants (which generate much CO2) and food waste treatment plants (which generate much anaerobic digestion gas) to produce methane gas and (ii) carry out demonstration tests for use in natural gas grids and natural gas-powered vehicles.
Author Contributions
Data curation Y.K. and H.B.; investigation and writing-original draft, D.H.; writing-review and editing Y.B. and D.H., funding acquisition W.C., validation W.C. and Y.B.; supervision Y.B. All authors have read and agreed to the published version of the manuscript.
Funding
This research was funded by the Korea Institute of Energy Technology Evaluation and Planning (KETEP) and the Korean government (Ministry of Trade, Industry and Energy, 2018, Funding source No. 20182010106370).
Acknowledgments
This study was conducted with the support of the Korea Institute of Energy Technology Evaluation and Planning (KETEP) and the Korean government (Ministry of Trade, Industry and Energy, 2018). (Funding source No. 20182010106370, Fine Dust Mitigation Clean Fuel DME Engine Demonstration Research Project). This study was conducted with the support of the Basic Science Research Capacity Enhancement Project through the Korea Basic Science Institute (National research Facilities and Equipment Center) grant funded by the Ministry of Education. (2019R1A6C1010013)
Conflicts of Interest
The authors declare no conflict of interest.
References
- Lee, S.H. The Role of Hydrogen Energy for Renewable Energy 3020; KDB Research: Seoul, Korea, 2018; Volume 749. [Google Scholar]
- Nam, J.J.; Shin, J.D.; Hong, S.G.; Hahm, H.S.; Park, W.K.; So, K.H. Biomethanol conversion from biogas produced by anaerobic digestion. J. Korea Org. Resour. Recycl. Assoc. 2006, 14, 93–103. [Google Scholar]
- Petersson, A.; Wellinger, A. Biogas Upgrading Technologies–Developments and Innovations; Peterssson, A., Wellinger, A., Eds.; IEA Bioenergy Report: Paris, France, 2009. [Google Scholar]
- Li, W.; Wang, H.; Jiang, Z.; Zhu, J.; Liu, Z.; Guo, X.; Song, C. A short review of recent advances in CO2 hydrogenation to hydrocarbons over heterogeneous catalysts. RSC Adv. 2018, 8, 7651–7669. [Google Scholar] [CrossRef] [Green Version]
- Shayan, E.; Zare, V.; Mirzaee, I. Hydrogen production from biomass gasification; a theoretical comparison of using different gasification agents. Energy Convers. Manag. 2018, 159, 30–41. [Google Scholar] [CrossRef]
- Sternberg, A.; Jensa, C.M.; Bardow, A. Life cycle assessment of CO2-based C1-chemicals. Green Chem. 2017, 19, 2244–2259. [Google Scholar] [CrossRef]
- Jessica, L.E.; Kovarik, L.; Kenvina, C.K.; Sievers, C. Effect of preparation methods on the performance of Co/Al2O3 catalysts for dry reforming of methane. Green Chem. 2014, 2, 885–896. [Google Scholar]
- Dimitriou, I.; Garcia-Gutierrez, P.; Elder, R.H.; Cueller-Franca, R.M.; Azapagic, A.; Allen, R.W.K. Carbon dioxide utilisation for production of transport fuel: Process and economic analysis. Energy Environ. Sci. 2015, 8, 1775–1789. [Google Scholar] [CrossRef] [Green Version]
- Affar, M.M.; Nahil, M.A.; Williams, P.T. Parametric study of CO2 methanation for synthetic natural gas production. Energy Technol. 2019, 7, 190075. [Google Scholar]
- Aziz, M.A.A.; Jalil, A.A.; Triwahyono, S.; Sidik, S.M. Methanation of carbon dioxide on metal-promoted mesostructured silica nanoparticles. Appl. Catal. A 2014, 486, 115–122. [Google Scholar] [CrossRef]
- Frontera, P.; Macario, A.; Ferraro, M.; Antonucci, P.L. Supported Catalysts for CO2 Methanation: A Review. Catalyst 2017, 7, 59. [Google Scholar] [CrossRef]
- Daroughegi, R.; Meshjani, F.; Rezaei, M. Enhanced activity of CO2 methanation over mesoporous nanocrystalline Ni-Al2O3 catalysts prepared by ultrasound-assisted co-precipitation method. Int. J. Hydrogen Energy 2017, 42, 15115–15125. [Google Scholar] [CrossRef]
- Cho, E.H.; Kim, W.H.; Ko, C.H.; Yoon, W.L. Enhanced CO2 methanation reaction in C1 chemistry over a highly dispersed nickel nanocatalyst prepared using the one-step melt-infiltration method. Catalysts 2020, 10, 643. [Google Scholar] [CrossRef]
- Aziz, M.A.A.; Jali, A.A.; Triwahyono, S.; Saad, M.W.A. CO2 methanation over Ni-promoted mesostructured silica nanoparticles: Influence of Ni loading and water vapor on activity and response surface methodology studies. Chem. Eng. J. 2015, 260, 757–764. [Google Scholar] [CrossRef]
- Vertivel, S.; Stefan, N.; Ralf, Z.; Helmut, P.; Gunther, K. Effect of support and chelating ligand on the synthesis of Ni catalysts with high activity and stability for CO2 methanation. Catalysts 2020, 10, 493. [Google Scholar]
- Wang, L.; Hu, J.; Liu, H.; Wei, Q.; Gong, D.; Mo, L.; Tao, H.; Zhang, C. Three-Dimensional Mesoporous Ni-CeO2 Catalysts with Ni Embedded in the Pore Walls for CO2 Methanation. Catalysts 2020, 10, 523. [Google Scholar] [CrossRef]
- Hu, D.; Gao, J.; Ping, Y.; Jia, L.; Gunawan, P.; Gu, F.; Su, F. Enhanced investigation of CO methanation over Ni/Al2O3 for synthetic natural gas production. Ind. Eng. Chem. Res. 2012, 51, 4875–4886. [Google Scholar] [CrossRef]
- Fan, M.-T.; Miao, K.-P.; Lin, J.-D. Mg-Al oxide supported Ni catalysts with enhanced stability for efficient synthetic natural gas from syngas. Appl. Surf Sci. 2014, 307, 682–688. [Google Scholar] [CrossRef]
- Tan, J.; Wang, J.; Zhang, Z.; Ma, Z.; Wang, L.; Liu, Y. Highly dispersed and stable Ni nanoparticles confined by MgO on ZrO2 for CO2 methanation. Appl. Surf. Sci. 2019, 281, 1538–1548. [Google Scholar] [CrossRef]
- Yan, Y.; Dai, Y.; He, H.; Yu, Y.; Yang, Y. A novel W-doped Ni-Mg mixed oxide catalyst for CO2 methanation. Appl. Catal. 2016, 196, 108–116. [Google Scholar] [CrossRef]
- Lin, J.; Ma, C.; Wang, Q.; Xu, Y.; Ma, G.; Wang, J.; Wang, H.; Dong, C.; Zhang, C.; Ding, M. Enhanced low-temperature performance of CO2 methanation over mesoporous Ni/Al2O3-ZrO2 catalysts. Appl. Catal. B 2019, 243, 262–272. [Google Scholar] [CrossRef]
- Petala, A.; Panagiotoppuluo, P. Methanation of CO2 over alkali-promoted Ru/TiO2 catalysts: I. Effect of alkali additives on catalytic activity and selectivity. Appl. Catal. B 2018, 224, 919–927. [Google Scholar] [CrossRef]
- Guo, M.; Lu, G. The effect of impregnation strategy on structural characters and CO2 methanation properties over MgO modified Ni/SiO2 catalysts. Cat. Commun. 2014, 54, 55–60. [Google Scholar] [CrossRef]
- Thien, A.L.; Jieum, K.; Park, E.D. CO and CO2 methanation over M(=Mn,Ce,Zr,Mg,K,Zn, or V)-promoted Ni/Al@Al2O3 catalysts. Catal. Today 2020, 348, 80–88. [Google Scholar]
- Bette, N.; Thielemann, J.; Schreiner, M.; Mertens, F. Methanation of CO2 over a (Mg, Al)Ox supported nickel catalyst derived from a Ni, Mg, Al-hydrotalcite-like precursor. ChemCatChem 2016, 8, 2903. [Google Scholar] [CrossRef]
- Duyar, M.S.; Wang, S.; Arellano-Trevirio, M.A.; Farrauto, R.J. CO2 utilization with a novel dual function material (DFM) for capture and catalytic conversion to synthetic natural gas: An update. J. CO2 Util. 2016, 15, 65–71. [Google Scholar] [CrossRef]
- Fisher, J.C.; Siriwardane, R.V. Mg(OH)2 for CO2 capture from high-pressure, moderate-temperature gas streams. Energy Fuels 2014, 28, 5936–5941. [Google Scholar] [CrossRef]
- Loder, A.; Siebenhofer, M.; Lux, S. The reaction kinetics of CO2 methanation on a bifunctional Ni/MgO catalyst. J. Ind. Eng. Chem. 2020, 85, 196–207. [Google Scholar] [CrossRef]
- Jia, X.; Zhang, X.; Rui, N.; Hu, X.; Chang, J.L. Structural effect of Ni/ZrO2 catalyst on CO2 methanation with enhanced activity. Appl. Catal. B 2019, 244, 159–169. [Google Scholar] [CrossRef]
- Carbarino, G.; Riani, P.; Magistri, L.; Busca, G. A study of the methanation of carbon dioxide on Ni/Al2O3 catalysts at atmospheric pressure. Int. J. Hydrogen Energy 2014, 39, 11557–11565. [Google Scholar] [CrossRef]
- Marocco, P.; Morosanu, E.A.; Giglio, E.; Ferrero, D.; Mebrahtu, C.; Lanzini, A.; Abate, S.; Bensaid, S.; Perathoner, S.; Santarelli, M.; et al. CO2 methanation Ni/Al hydrotalcite-derived catalyst: Experimental characterization and kinetic study. Fuel 2018, 225, 230–242. [Google Scholar] [CrossRef]
- Gao, J.; Wang, Y.; Ping, Y.; Hu, D.; Xu, G.; Gu, F.; Su, F. A thermodynamic analysis of methanation reactions of carbon oxides for the production of synthetic natural gas. RSC Adv. 2012, 2, 2358–2368. [Google Scholar] [CrossRef]
- Rahmani, S.; Rezaei, M.; Meshkani, F. Preparation of highly active nickel catalysts supported on mesoporous nanocrystalline Al2O3 for CO2 methanation. J. Ind. Eng. Chem. 2014, 20, 1346–1352. [Google Scholar] [CrossRef]
- Aziz, M.A.A.; Jalil, A.A.; Triwahyono, S.; Mukti, R.R.; Taufiq-Yap, Y.H.; Sazegar, M.R. Highly active Ni-promoted mesostructured silica nanoparticles for CO2 methanation. Appl. Catal. B 2014, 147, 359–368. [Google Scholar] [CrossRef]
- Abate, S.; Barbera, K.; Giglio, E.; Deorsola, F.; Bensaid, S.; Perathoner, S.; Pirone, R.; Centi, G. Synthesis, Characterization, and activity pattern of Ni-Al Hydrotalcite catalysts in CO2 methanation. Ind. Eng. Chem. Res. 2016, 55, 8299–8308. [Google Scholar] [CrossRef]
- Jürgensen, L.; Ehimen, E.A.; Born, J.; Holm-Nielsen, J.B. Dynamic biogas upgrading based on the Sabatier process: Thermodynamic and dynamic process simulation. Bioresour. Technol. 2015, 178, 323–329. [Google Scholar] [CrossRef] [PubMed]
- Muroyama, H.; Tsuda, Y.; Asakoshi, T.; Masitah, H.; Okanishi, T.; Matsui, T.; Eguchi, K. Carbon dioxide methanation over Ni catalysts supported on various metal oxides. J. Catal. 2016, 343, 178–184. [Google Scholar] [CrossRef] [Green Version]
- Zhao, A.; Ying, W.; Zhang, H.; Ma, H.; Fang, D. Ni–Al2O3 catalysts prepared by solution combustion method for syngas methanation. Catal. Comm. 2012, 17, 34–38. [Google Scholar] [CrossRef]
- Tada, S.; Shimizu, T.; Kameyama, H.; Haneda, T. Ni/CeO2 catalysts with high CO2 methanation activity and high CH4 selectivity at low temperature. Int. J. Hydrogen Energy 2012, 37, 5527–5531. [Google Scholar] [CrossRef]
- Song, F.; Zhong, Q.; Yu, Y.; Shi, M.; Wu, Y.; Hu, J.; Song, Y. Obtaining well-dispersed Ni/Al2O3 catalyst for CO2 methanation with a microwave-assisted method. Int. J. Hydrogen Energy 2017, 42, 4174–4183. [Google Scholar] [CrossRef]
- Pradita, T.; Shih, S.J.; Aji, B.B.; Sudibyo. Synthesis of MgO powder from magnesium nitrate using spray pyrolysis. AIP Conf. Proc. 2017, 1823, 020016. [Google Scholar]
Figure 1.
Effect of reaction temperature.

Figure 2.
Effect of H2/CO2 mole ratio along with (a) CO2 or H2 variation; (b) reactant amount variation.
Figure 2.
Effect of H2/CO2 mole ratio along with (a) CO2 or H2 variation; (b) reactant amount variation.
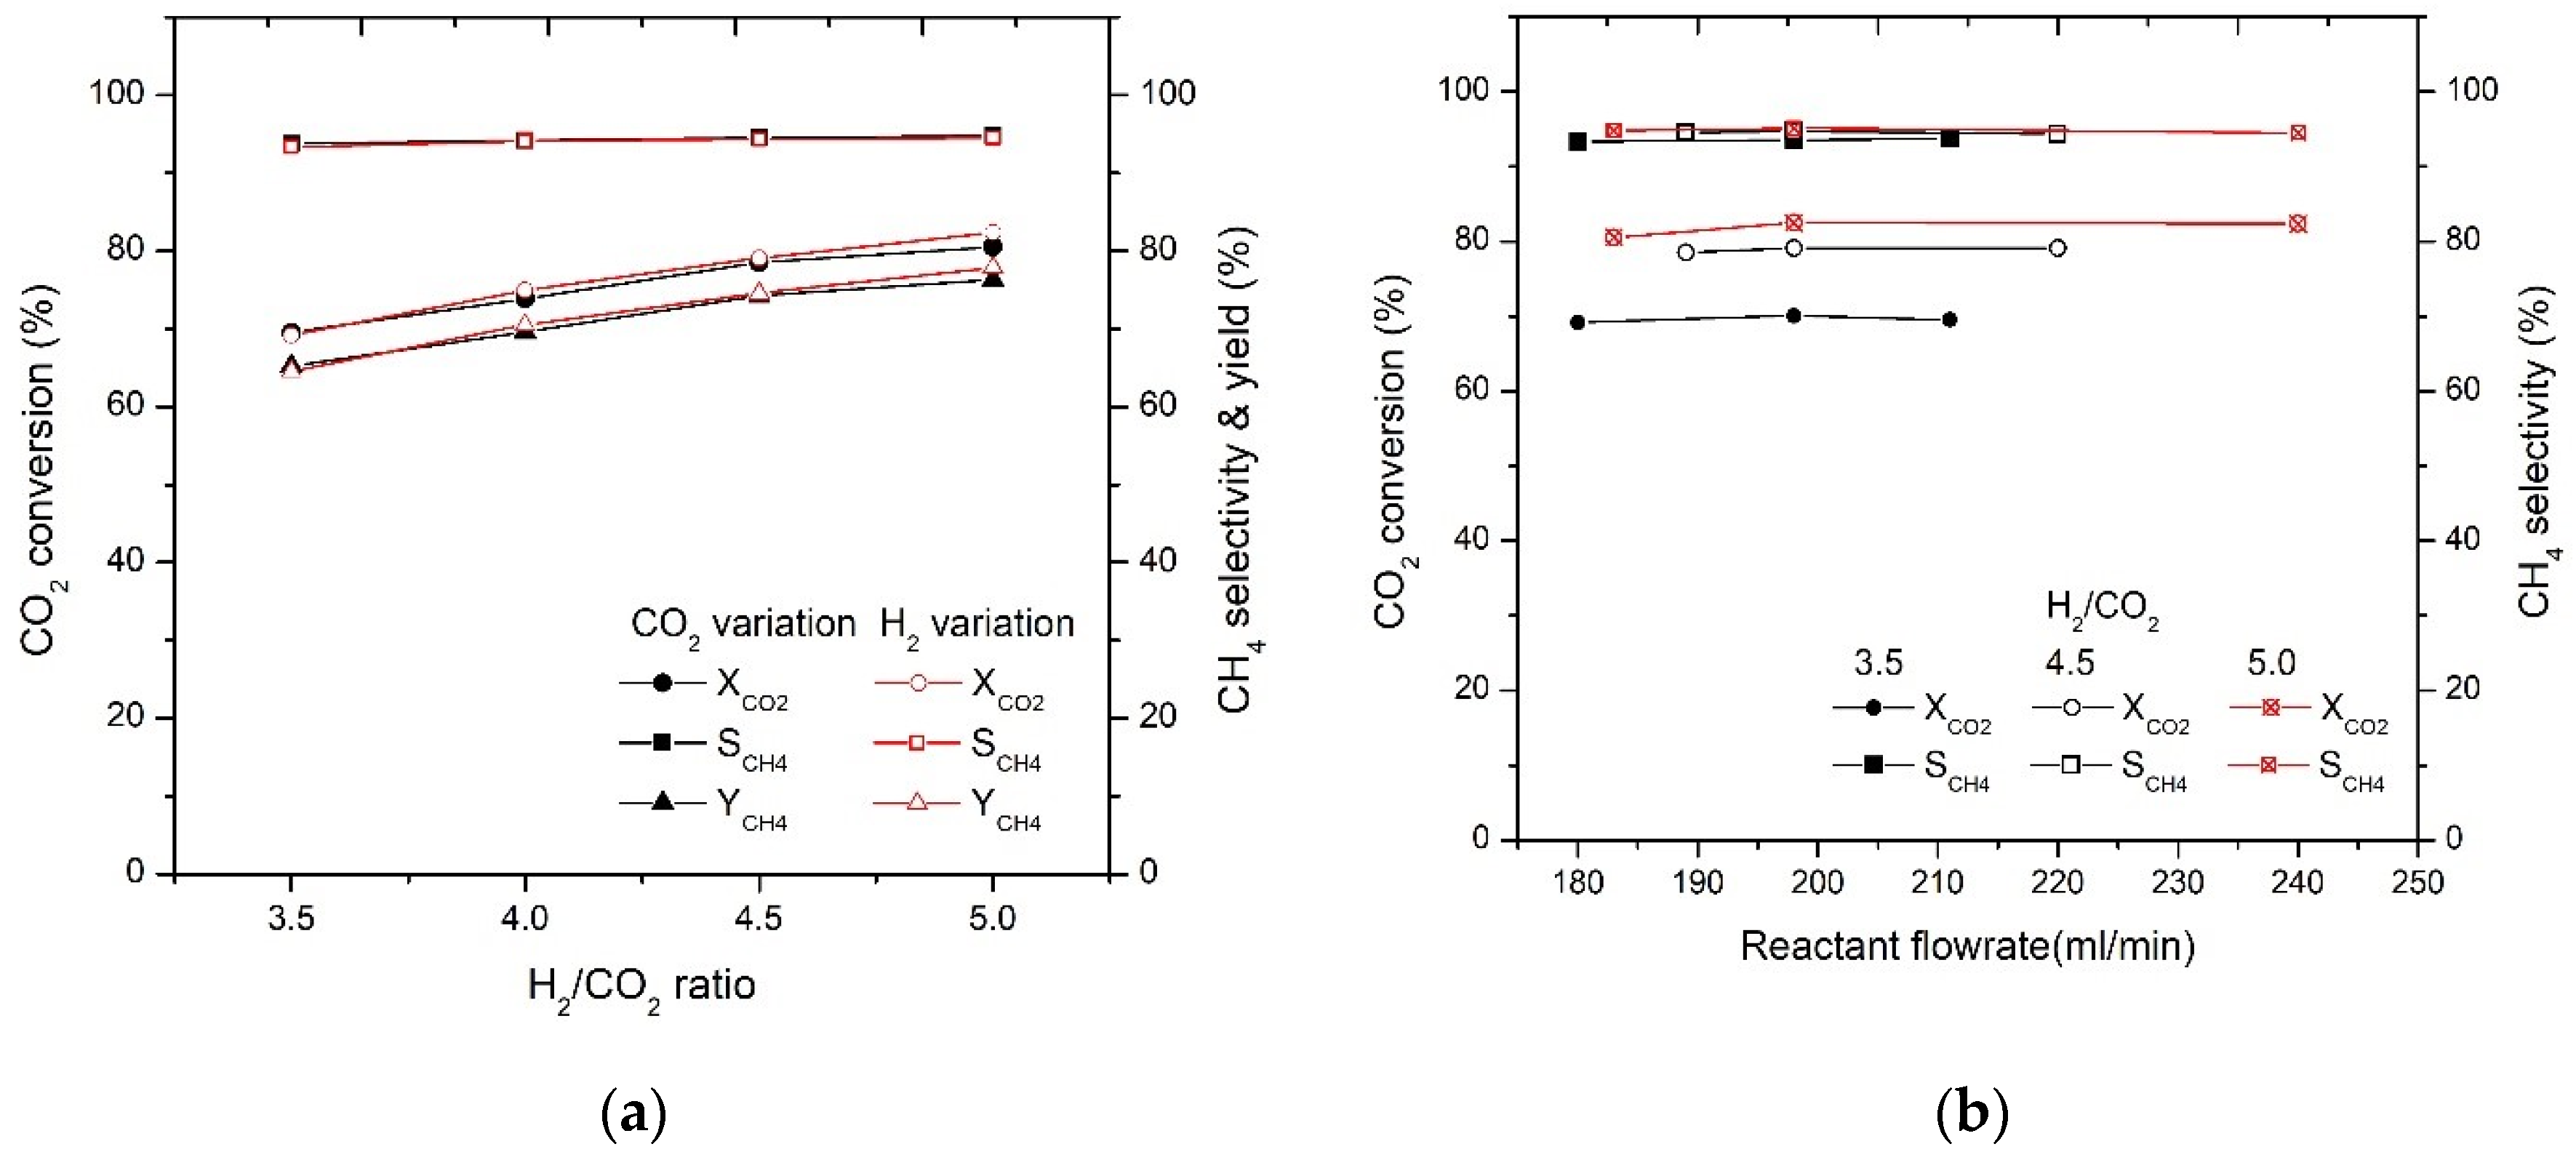
Figure 3.
Effect of increased gas hourly space velocity and N2 concentration at H2/CO2 ratio of 4 and reaction temperature of 350 °C (a) total reactant flow rate (b) N2 flow rate (N2 concentration).
Figure 3.
Effect of increased gas hourly space velocity and N2 concentration at H2/CO2 ratio of 4 and reaction temperature of 350 °C (a) total reactant flow rate (b) N2 flow rate (N2 concentration).
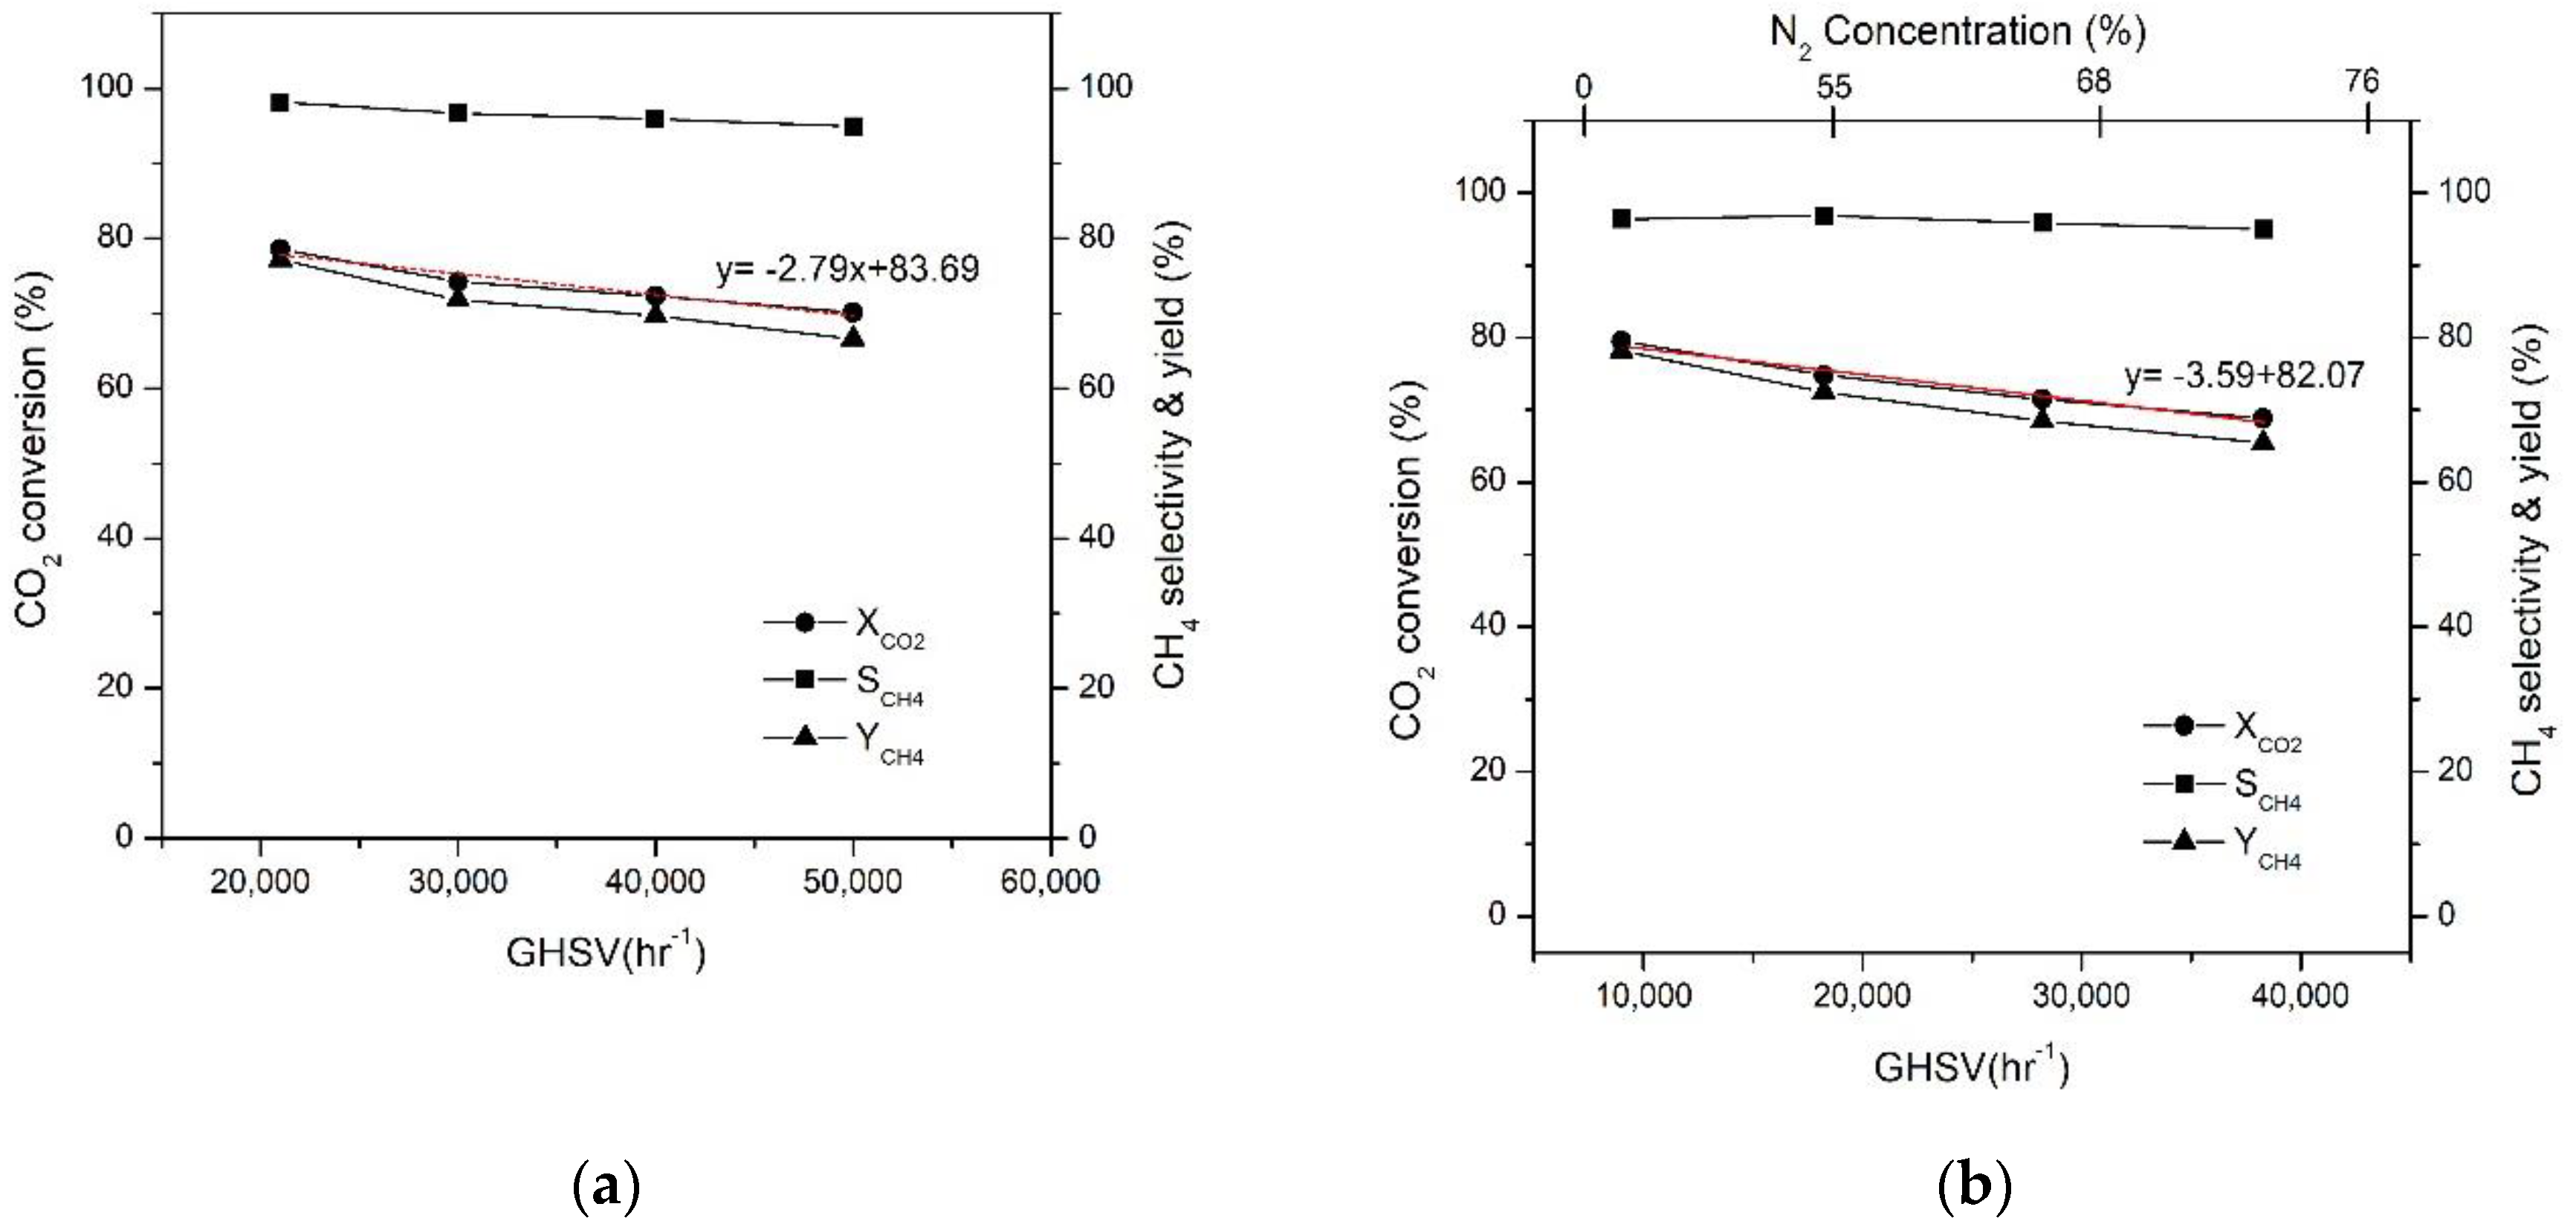
Figure 4.
Effect of initial CH4 content in the reactant gas.
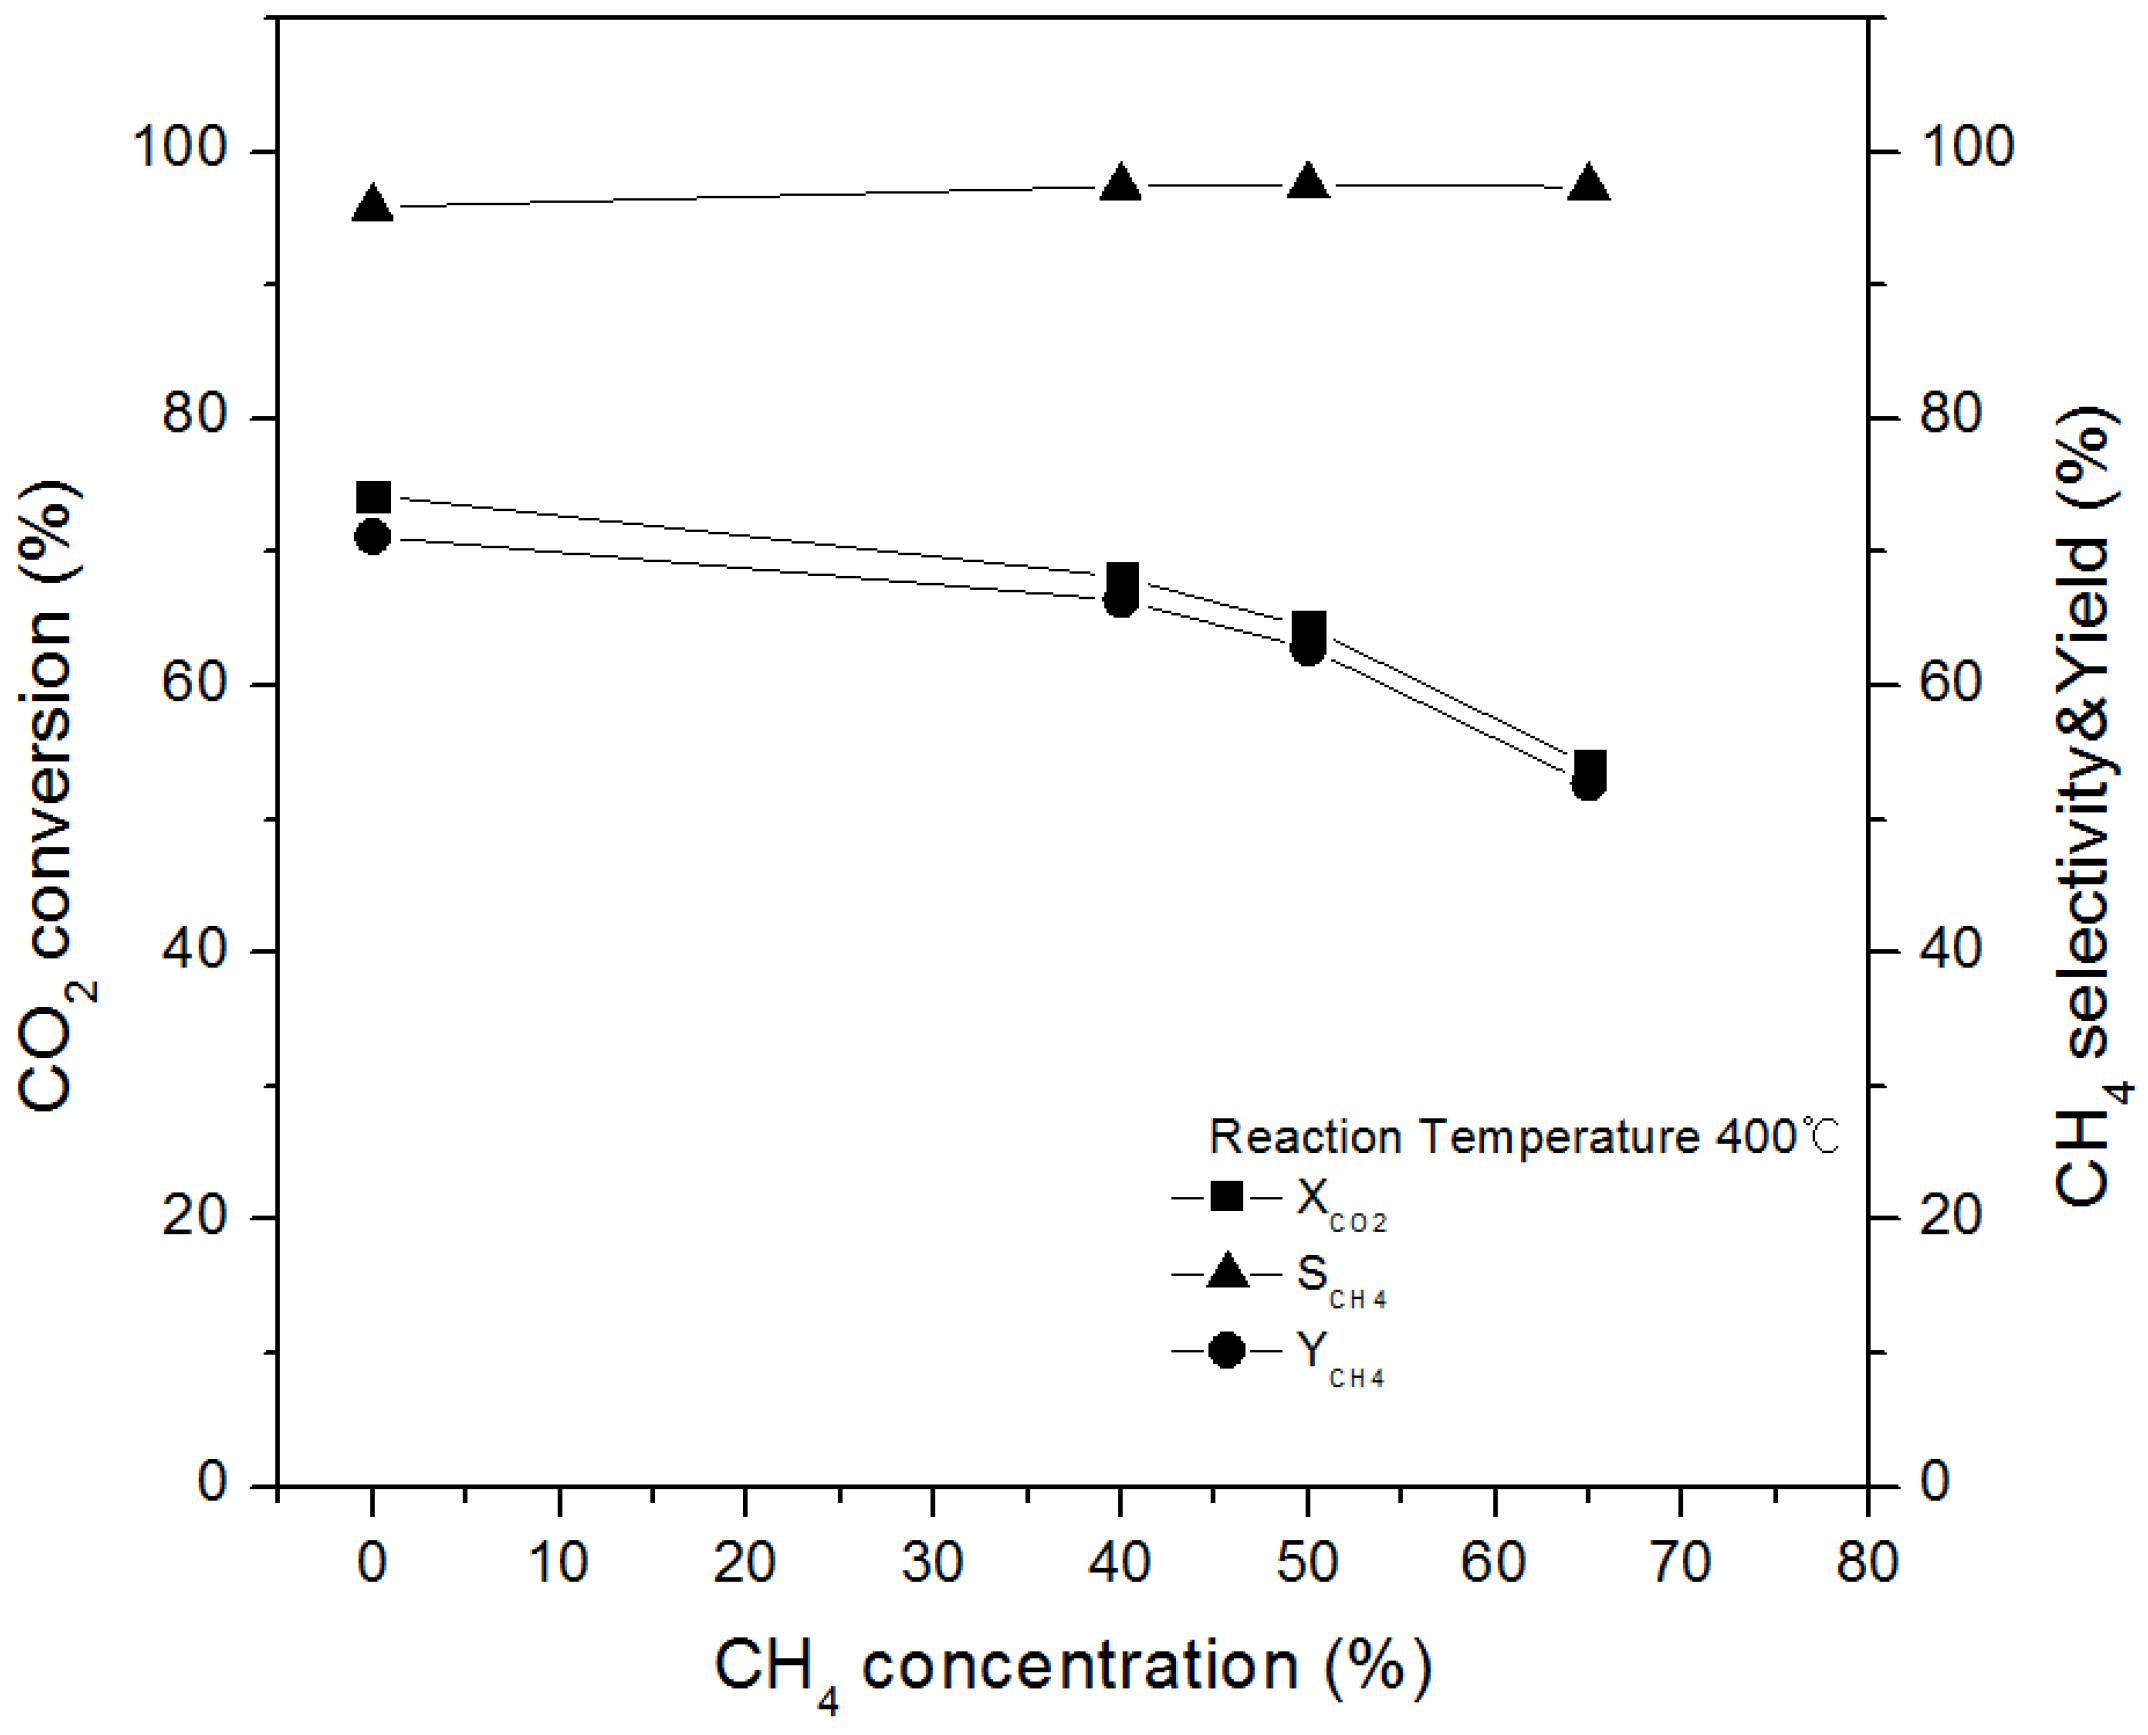
Figure 5.
Effect of reactant concentration (CO2 concentration = CO2/(H2 + CO2 + N2)) at a reaction temperature of 350 °C.
Figure 5.
Effect of reactant concentration (CO2 concentration = CO2/(H2 + CO2 + N2)) at a reaction temperature of 350 °C.
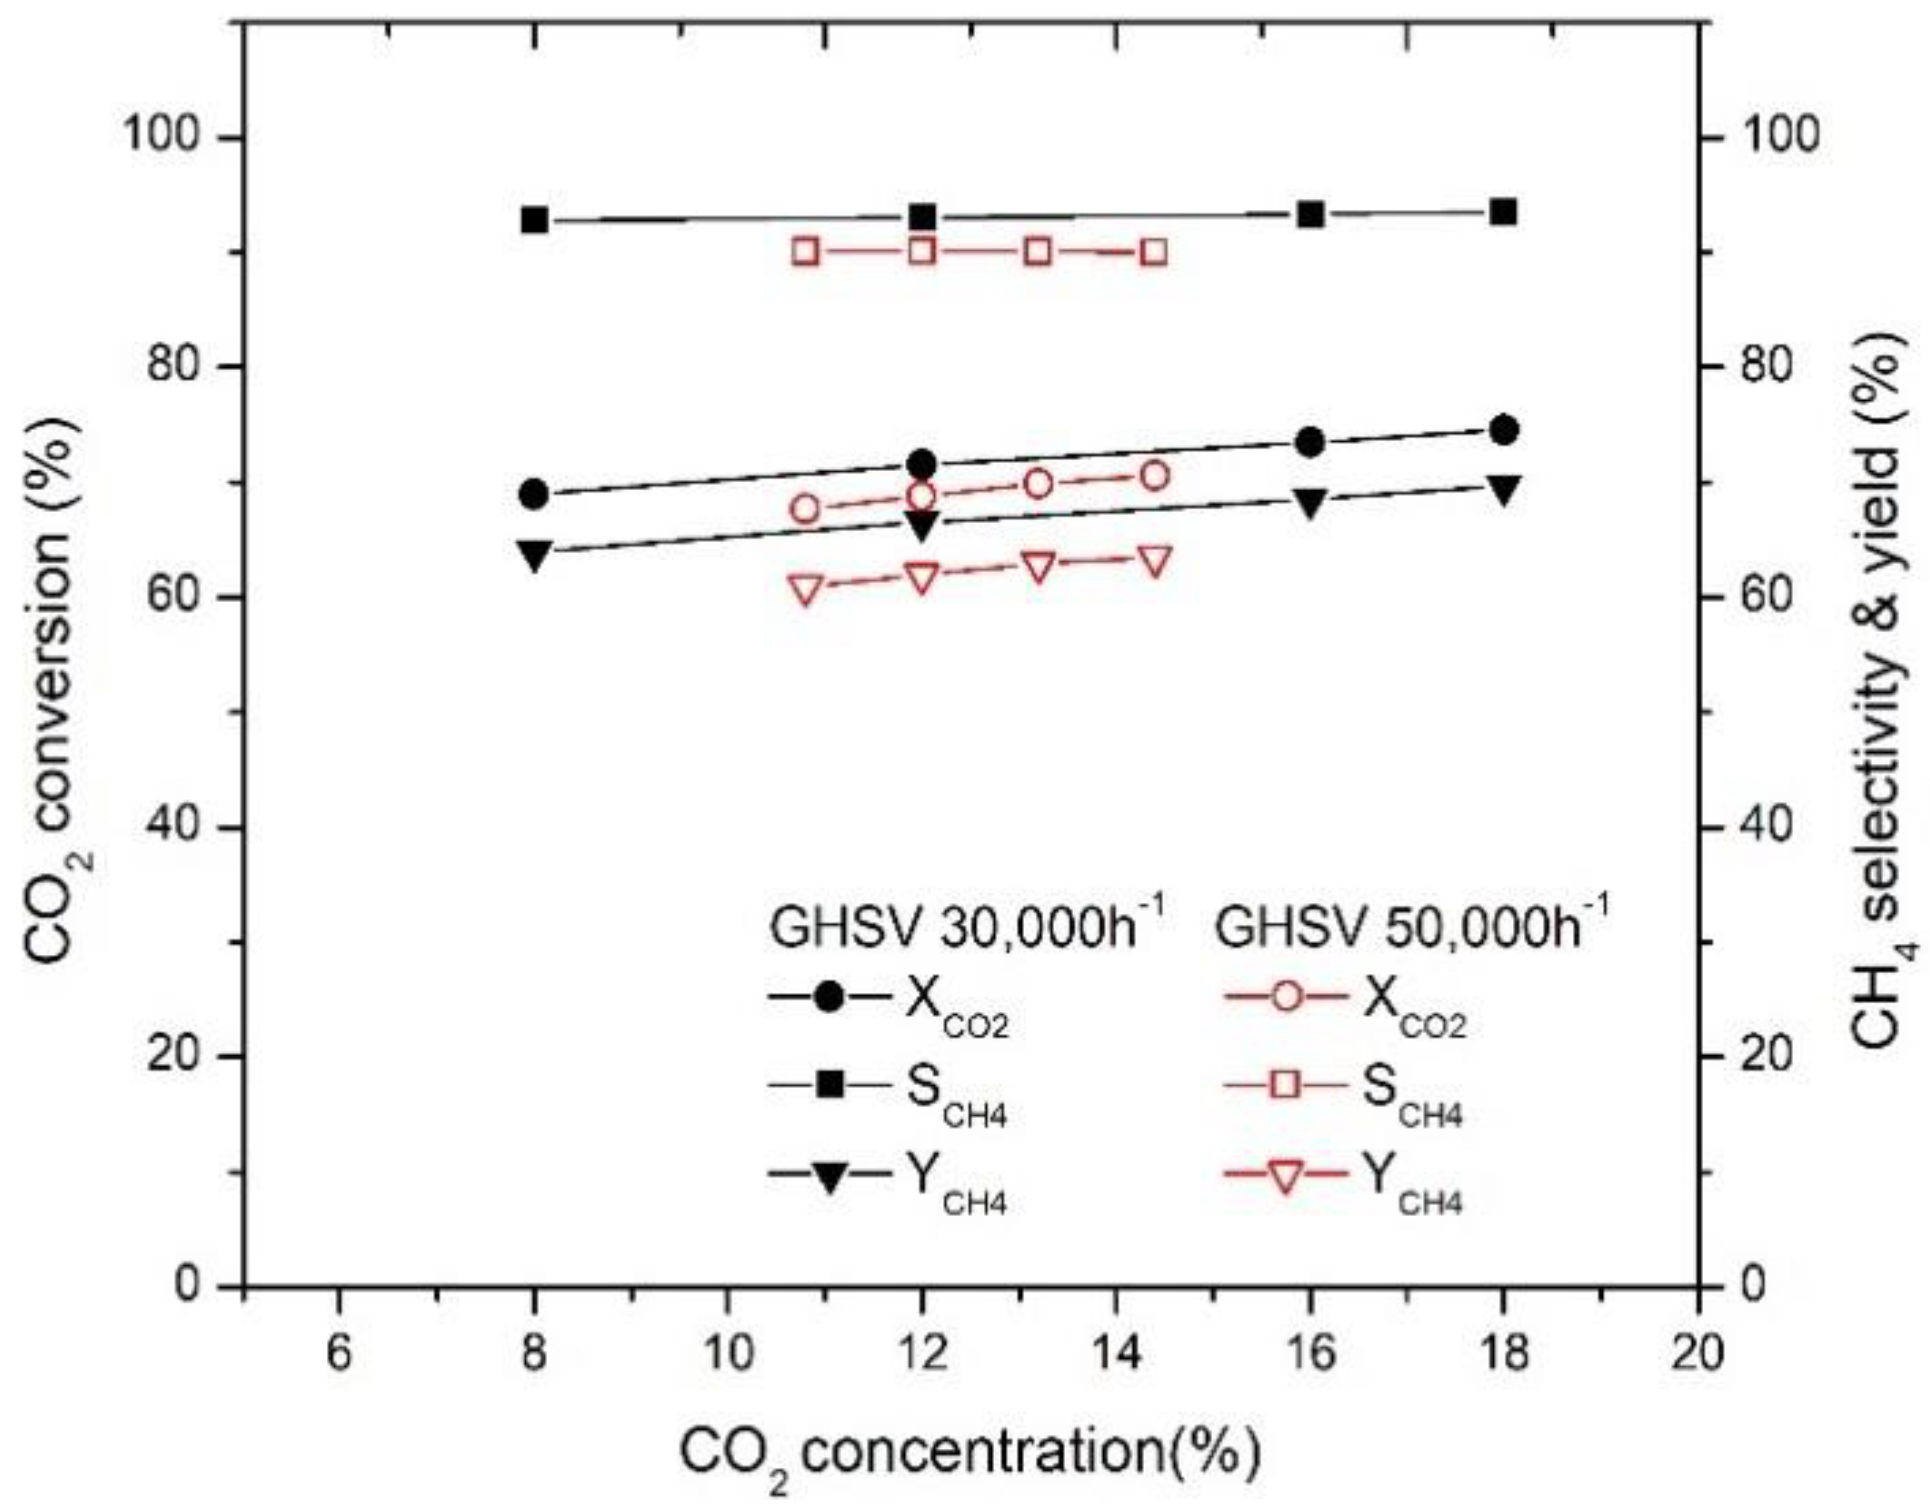
Figure 6.
Effect of N2 in biogas at reaction temperature of 350 °C.

Figure 7.
Effect of O2 in reaction gas.

Figure 8.
Stability test over 20 wt% Ni-Mg-Al catalysts.
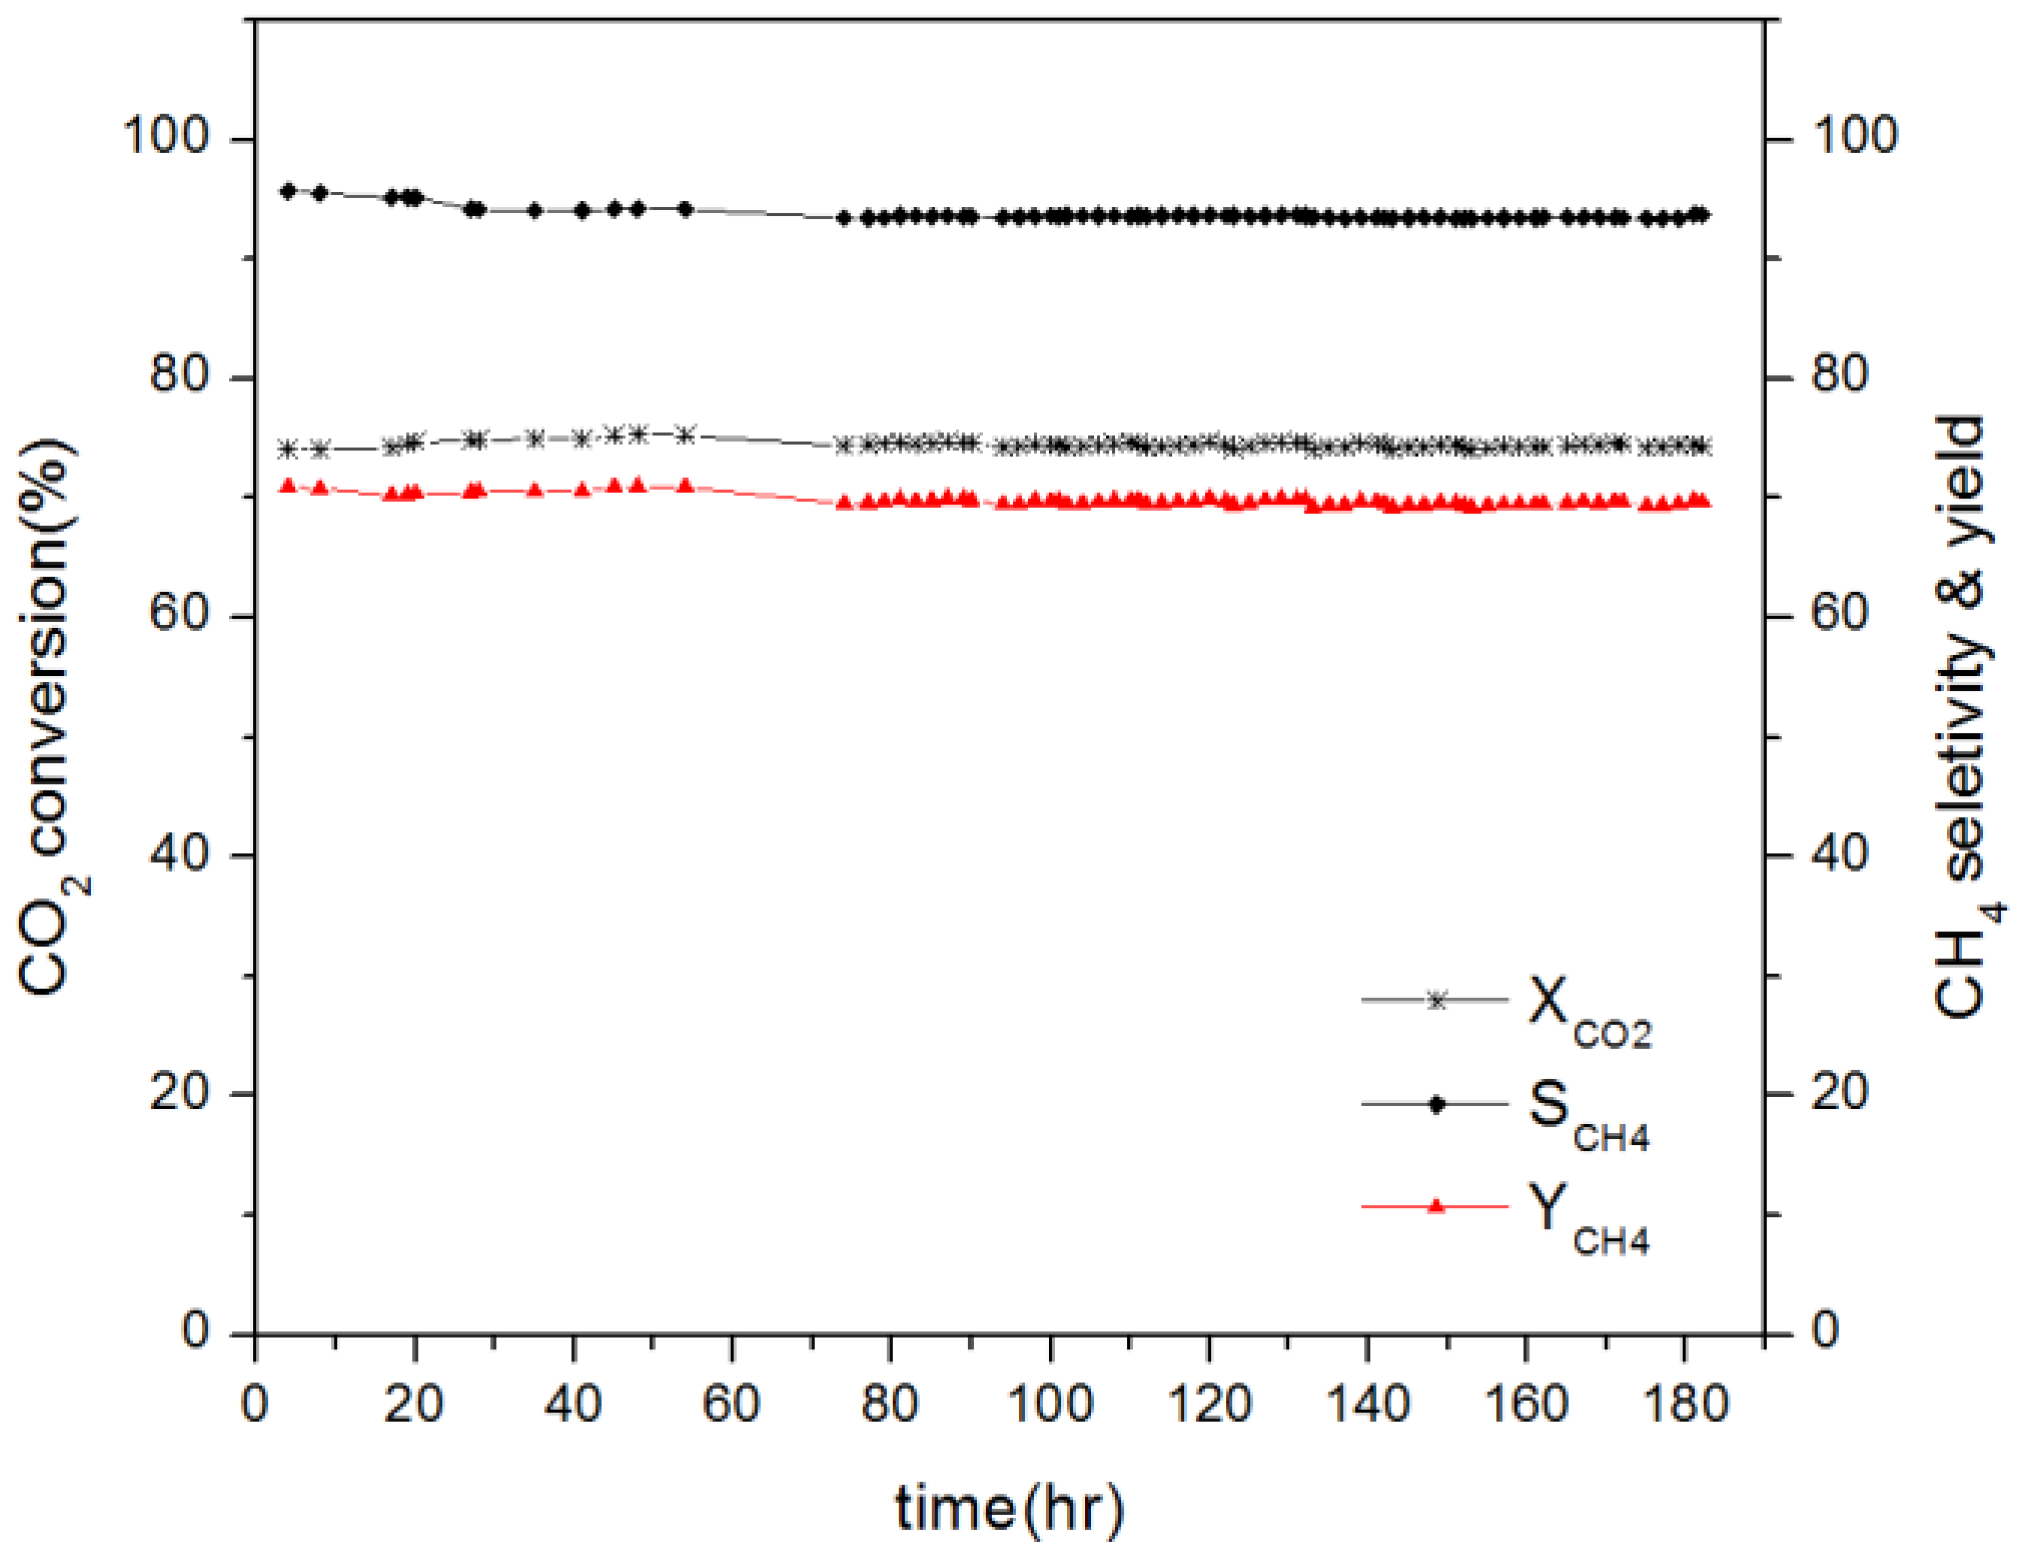
Figure 9.
Effect of reduction temperature on CO2 conversion and CH4 selectivity over the 40 wt% Ni-Mg-Al catalyst.
Figure 9.
Effect of reduction temperature on CO2 conversion and CH4 selectivity over the 40 wt% Ni-Mg-Al catalyst.
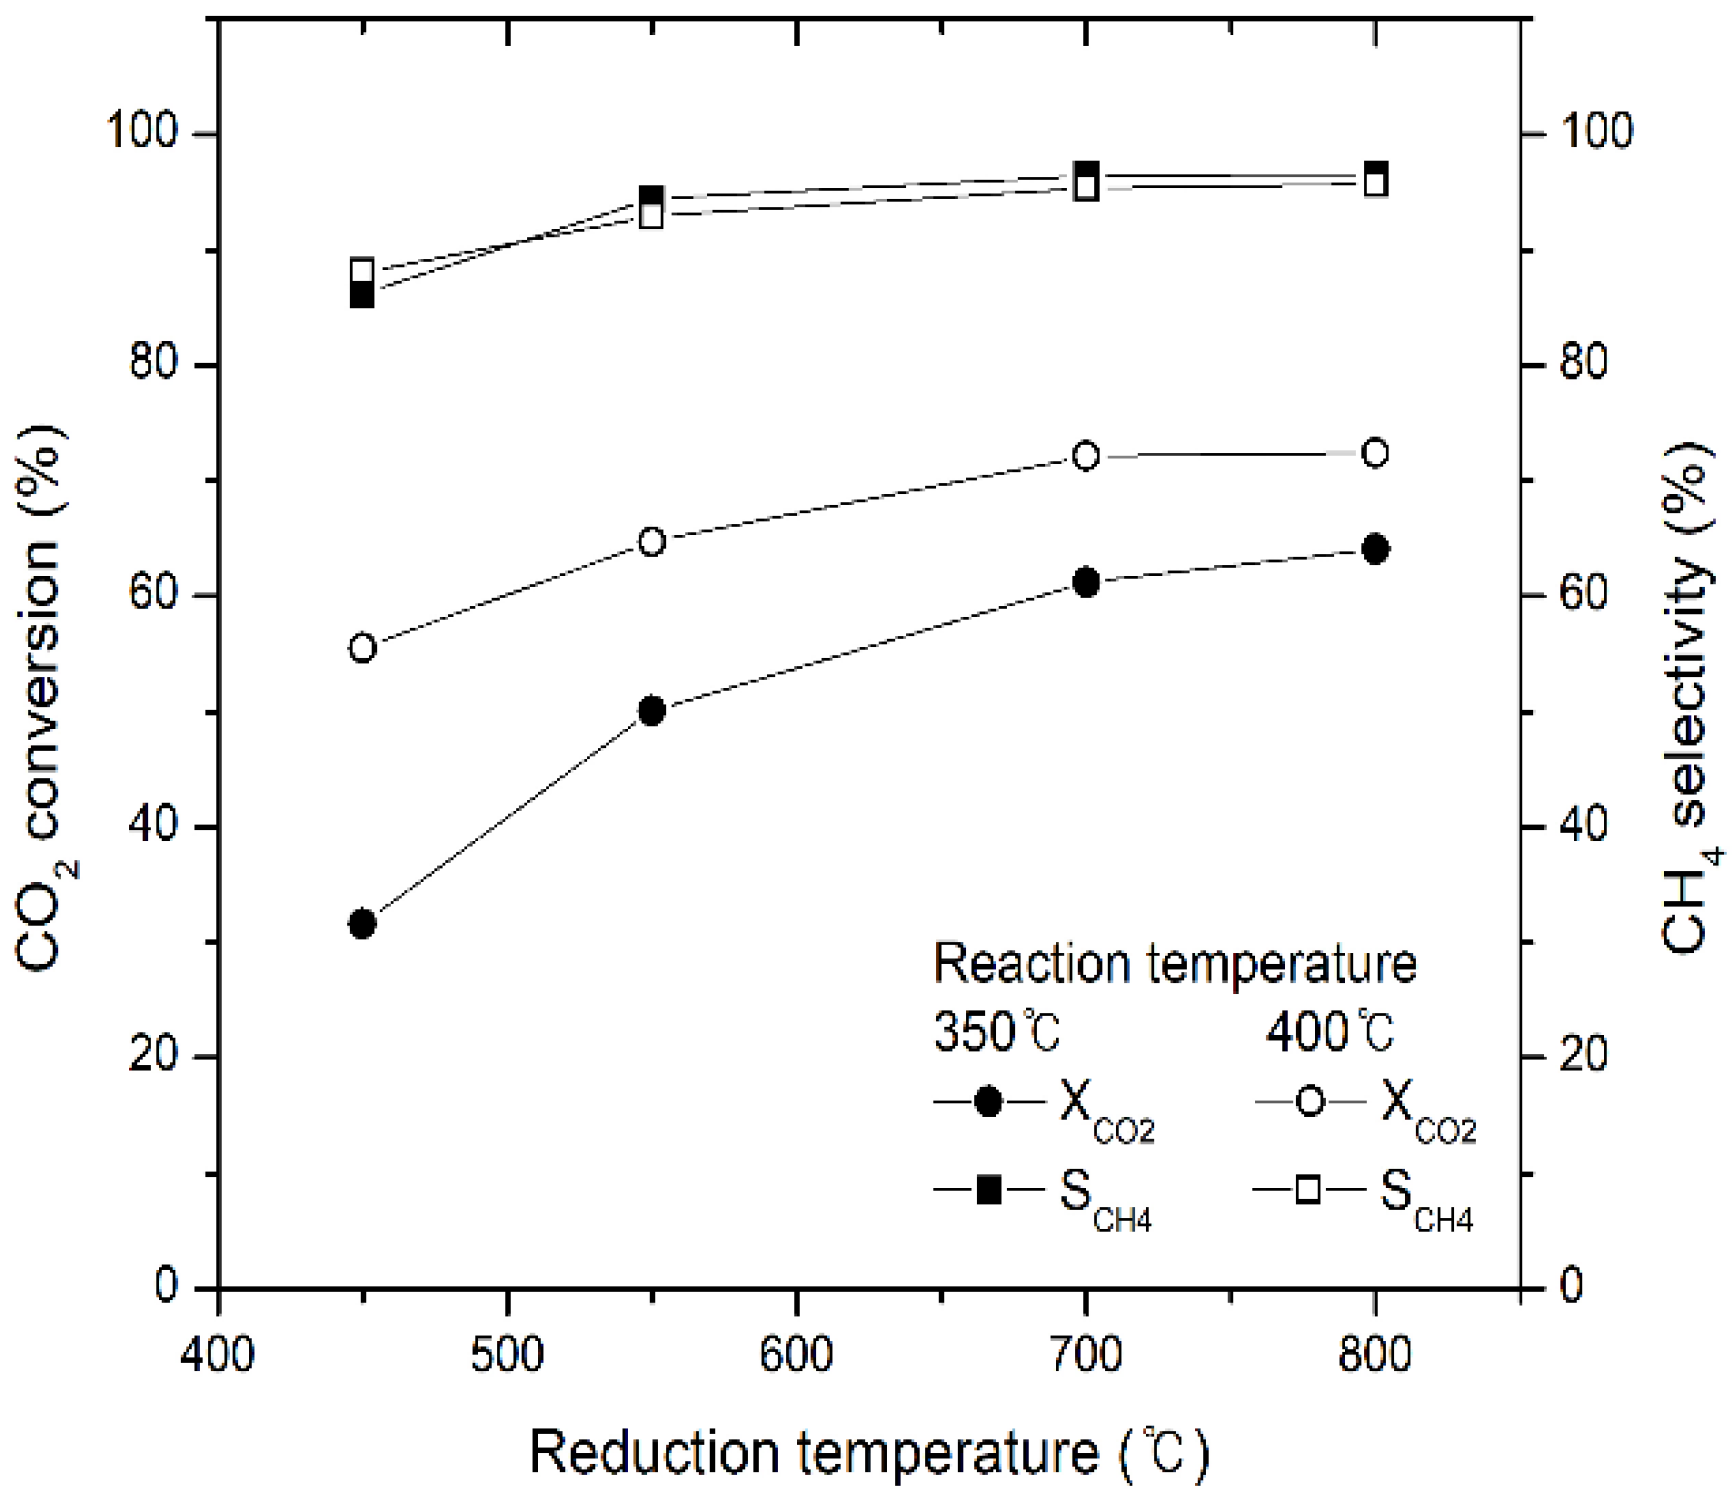
Figure 10.
Schematic of CO2 methanation.
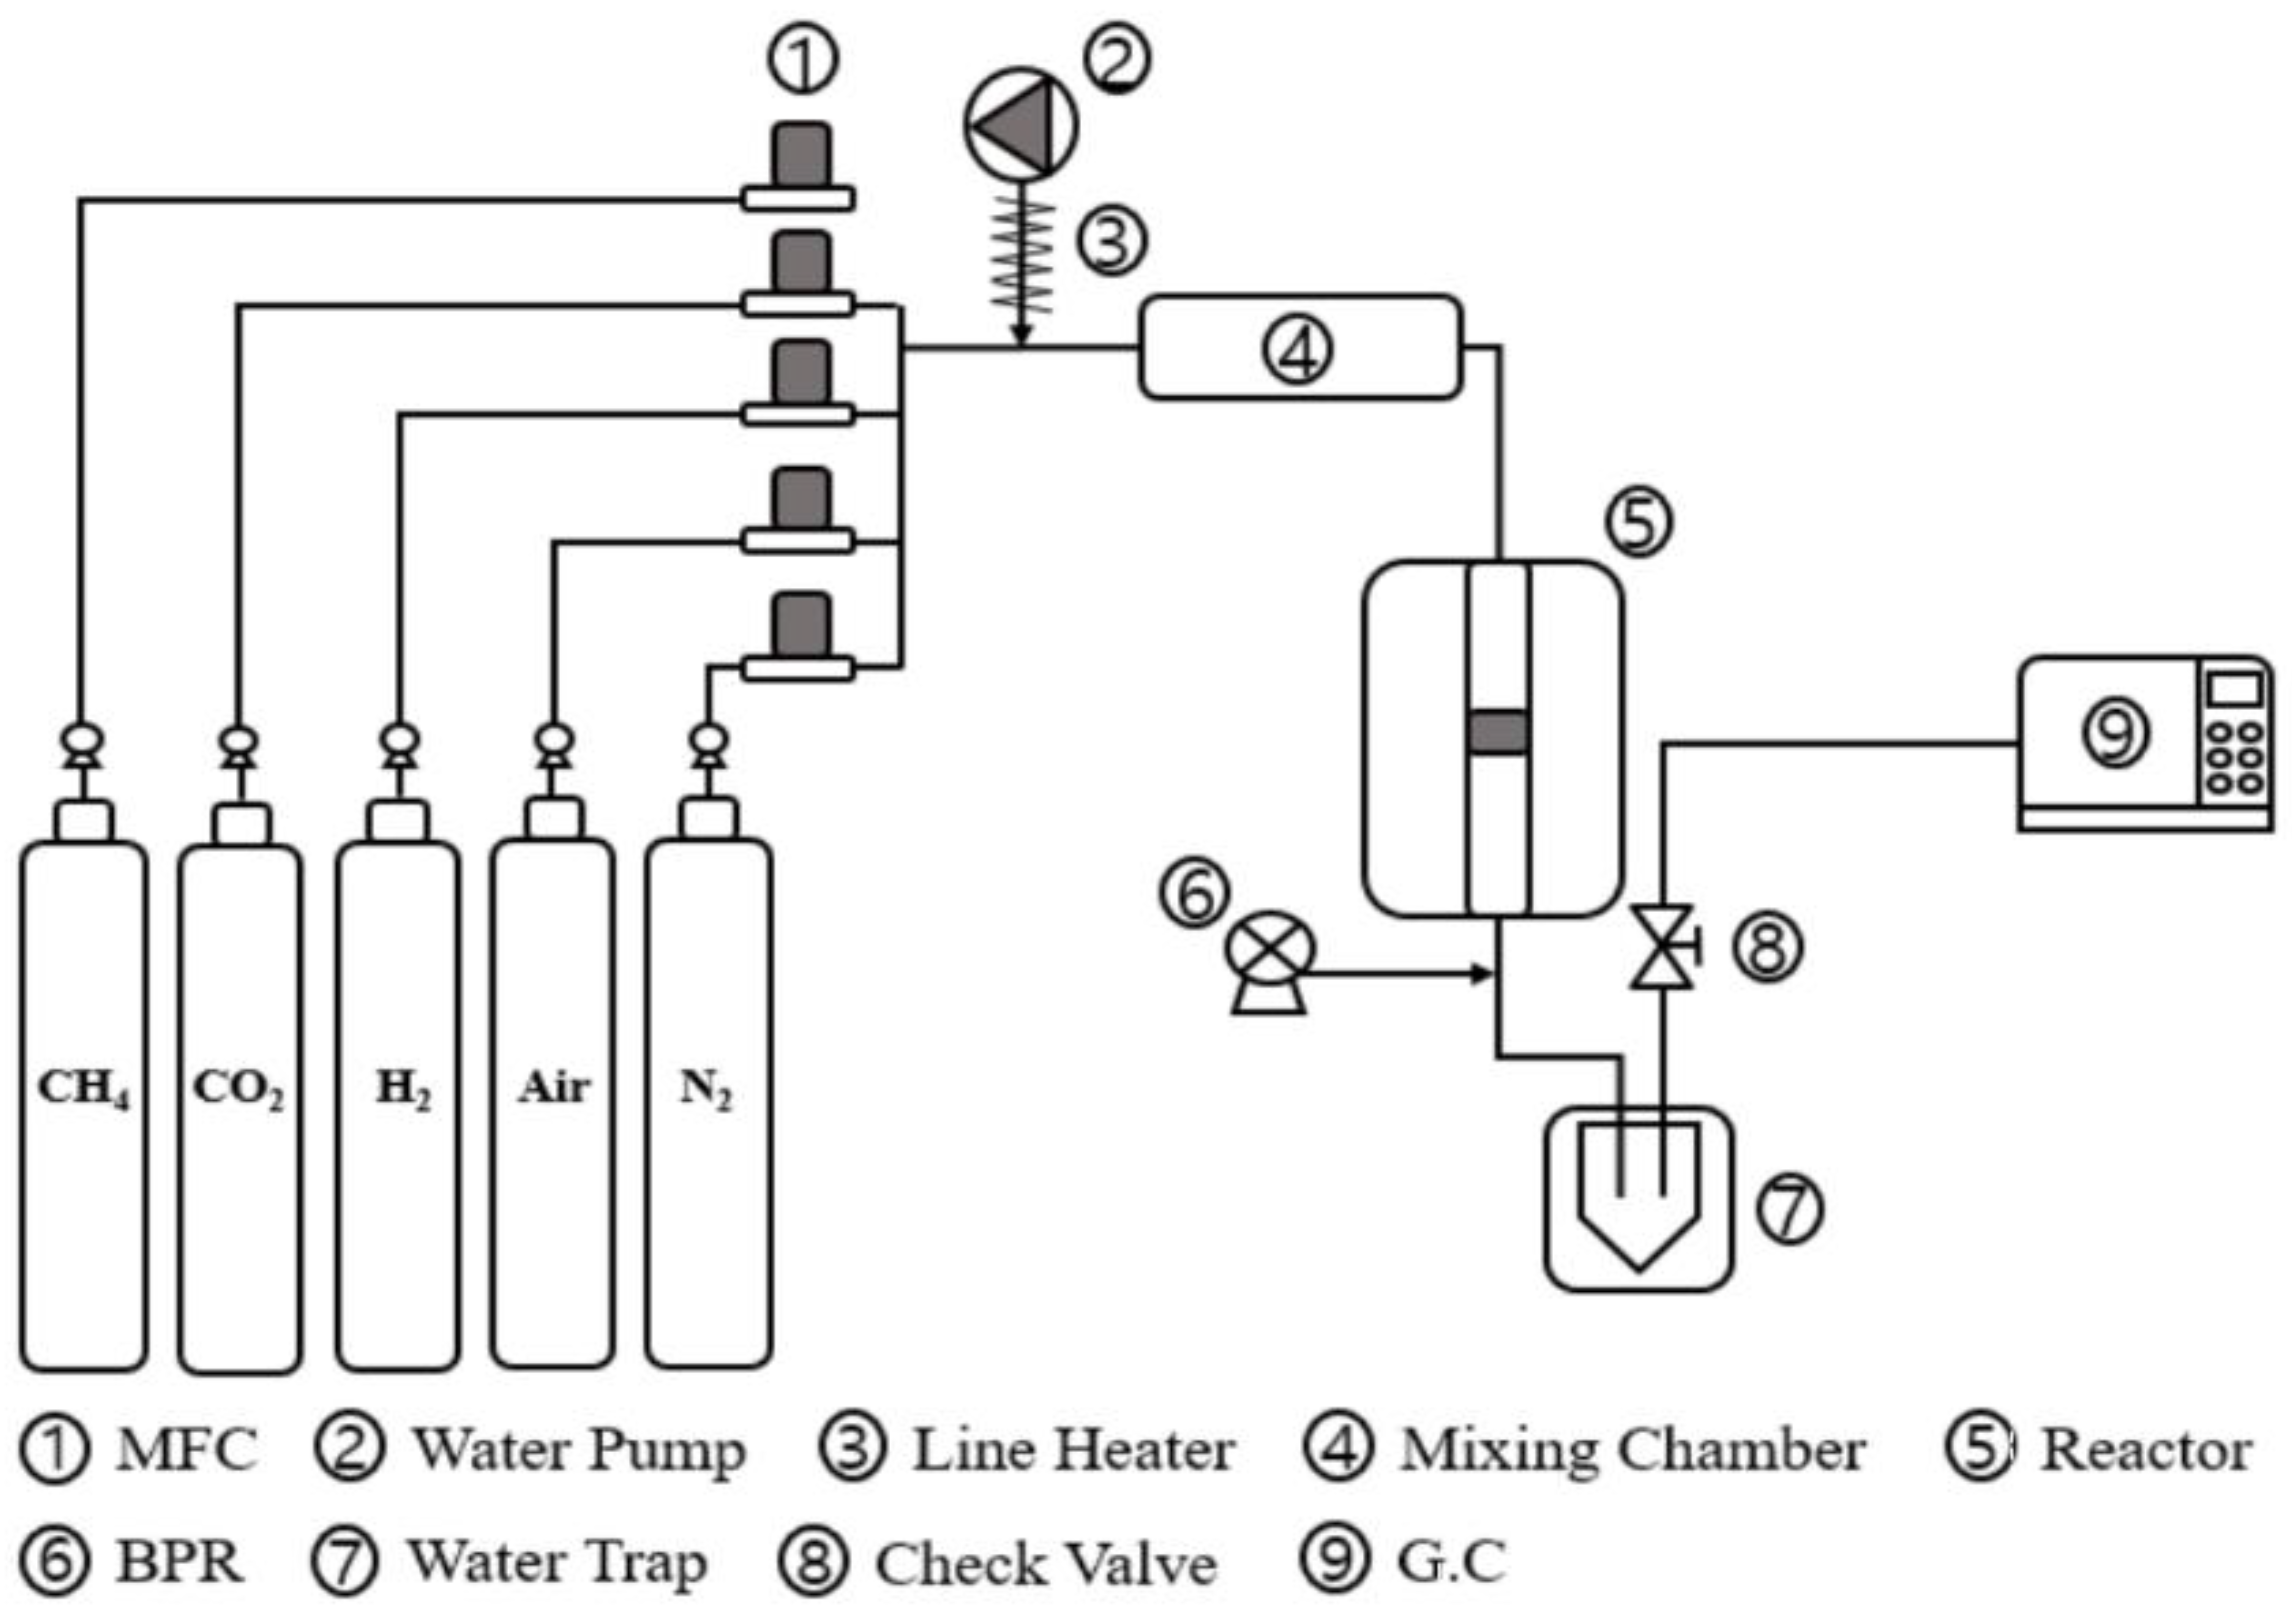
Figure 11.
X-ray diffraction patterns of (a) fresh, (b) reduced at 700 °C in the fresh state, and (c) spent 20 wt% Ni-Mg-Al catalysts.
Figure 11.
X-ray diffraction patterns of (a) fresh, (b) reduced at 700 °C in the fresh state, and (c) spent 20 wt% Ni-Mg-Al catalysts.
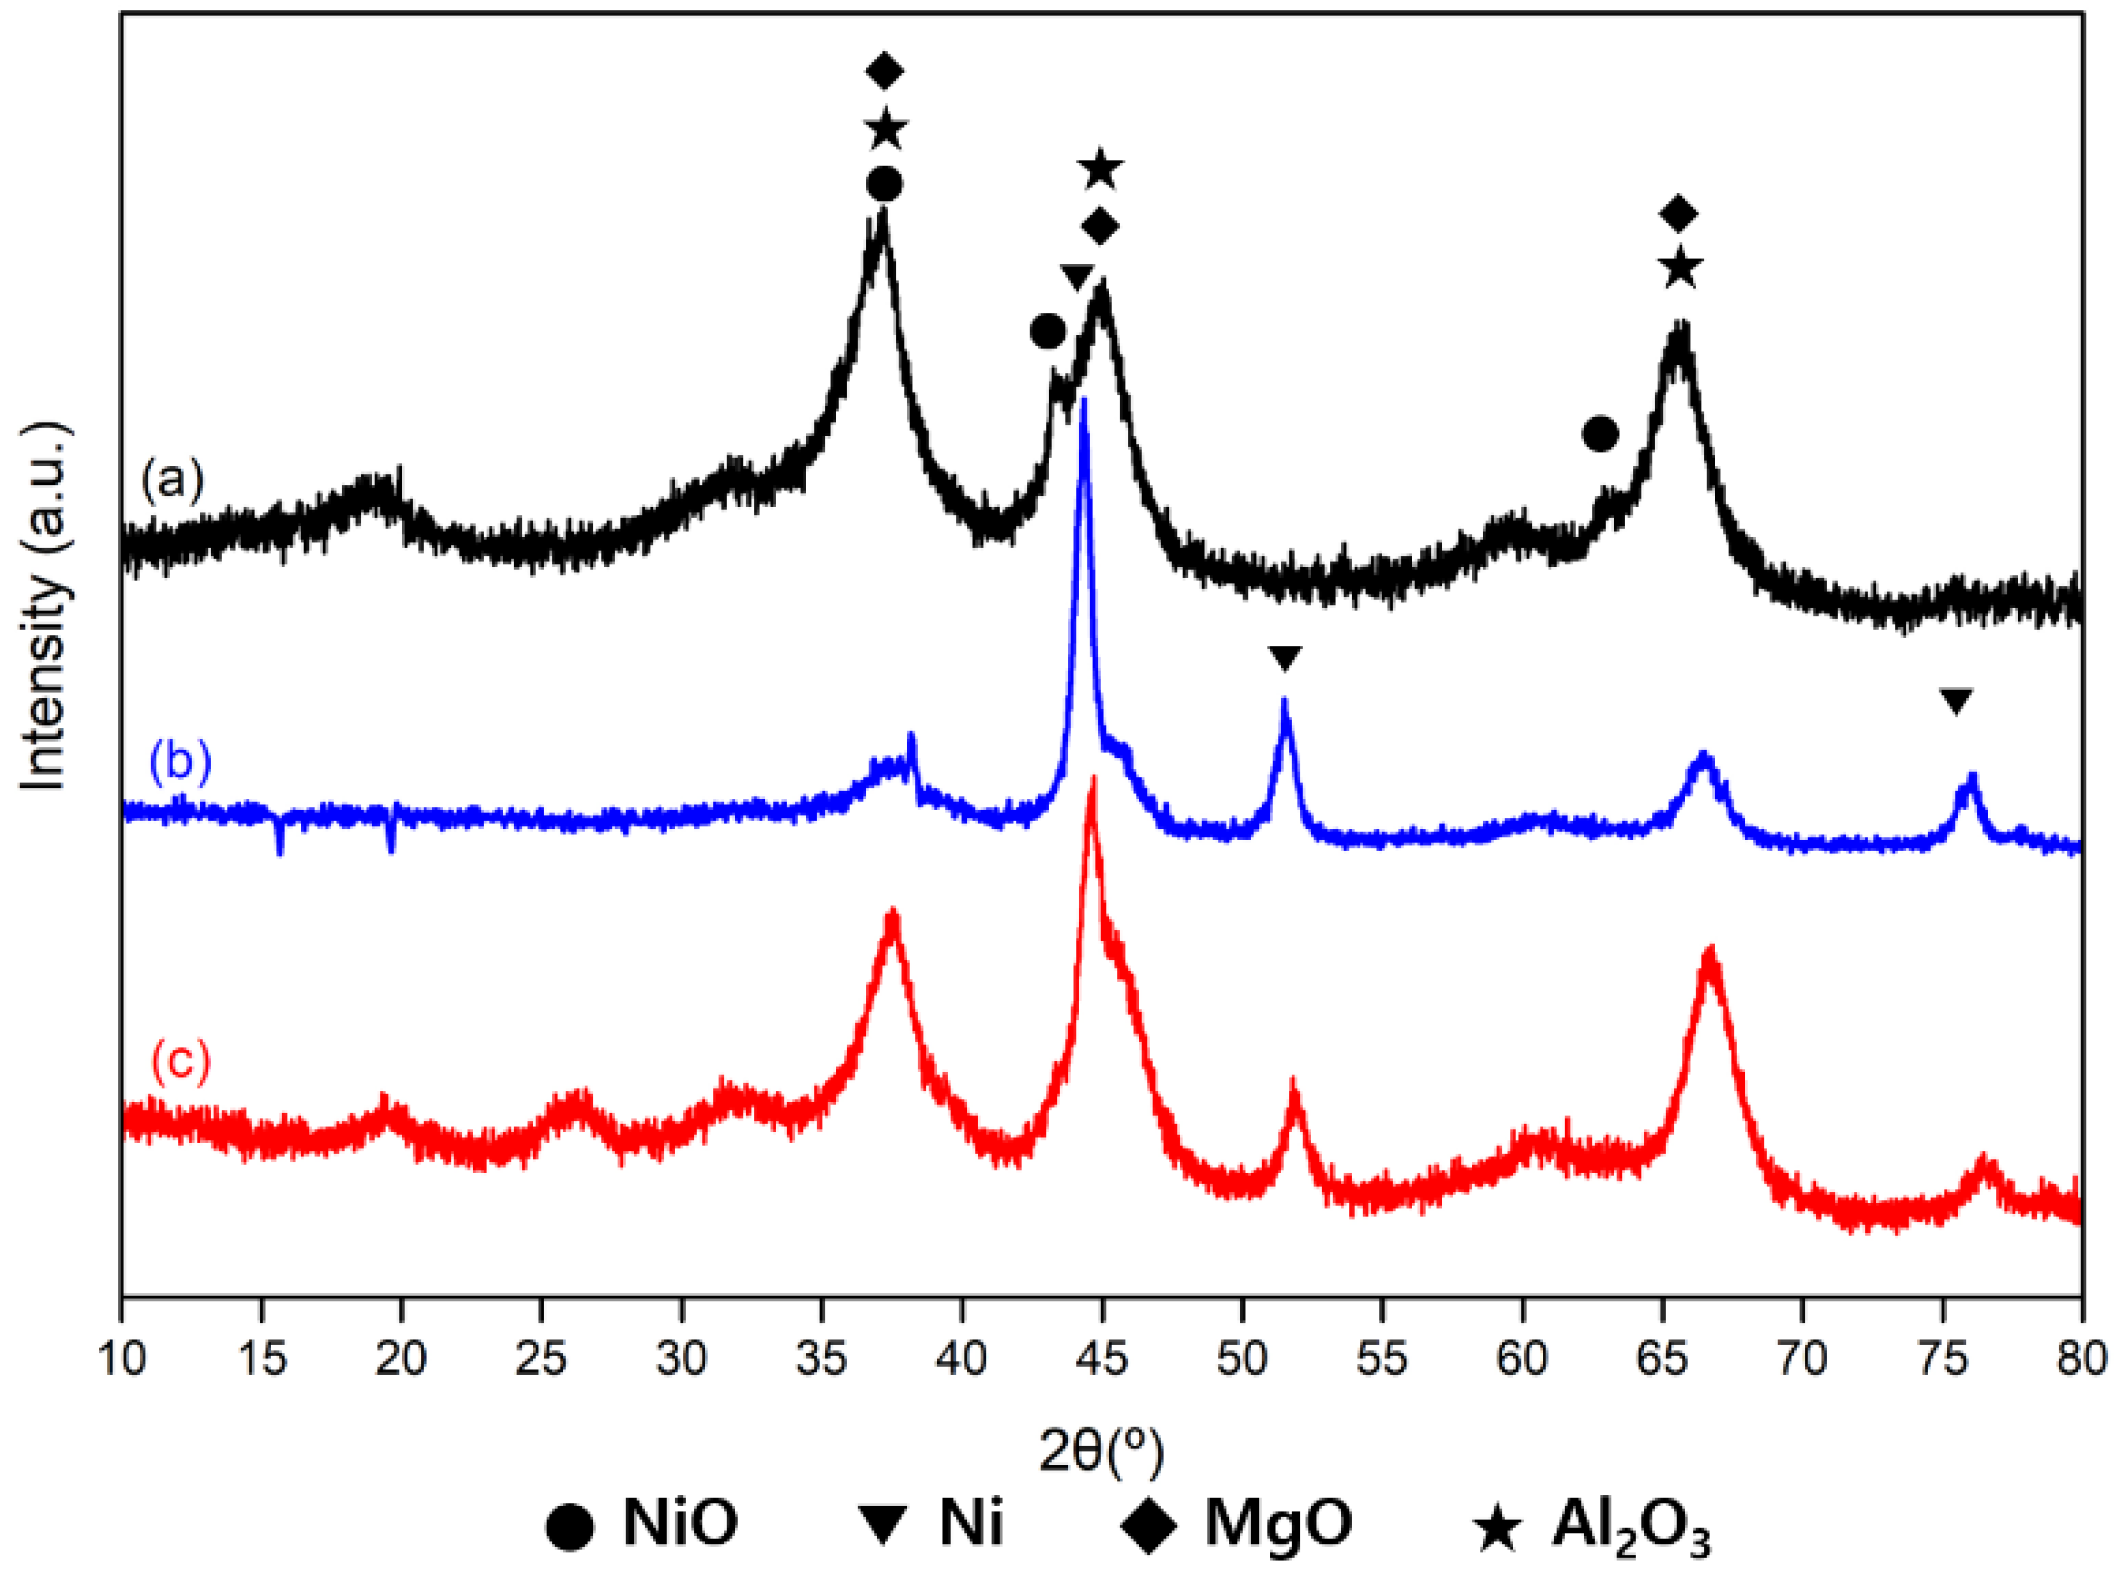
Figure 12.
Hydrogen temperature-programmed desorption profiles of 20 and 40 wt% Ni-Mg-Al catalysts (supported by KIER).
Figure 12.
Hydrogen temperature-programmed desorption profiles of 20 and 40 wt% Ni-Mg-Al catalysts (supported by KIER).
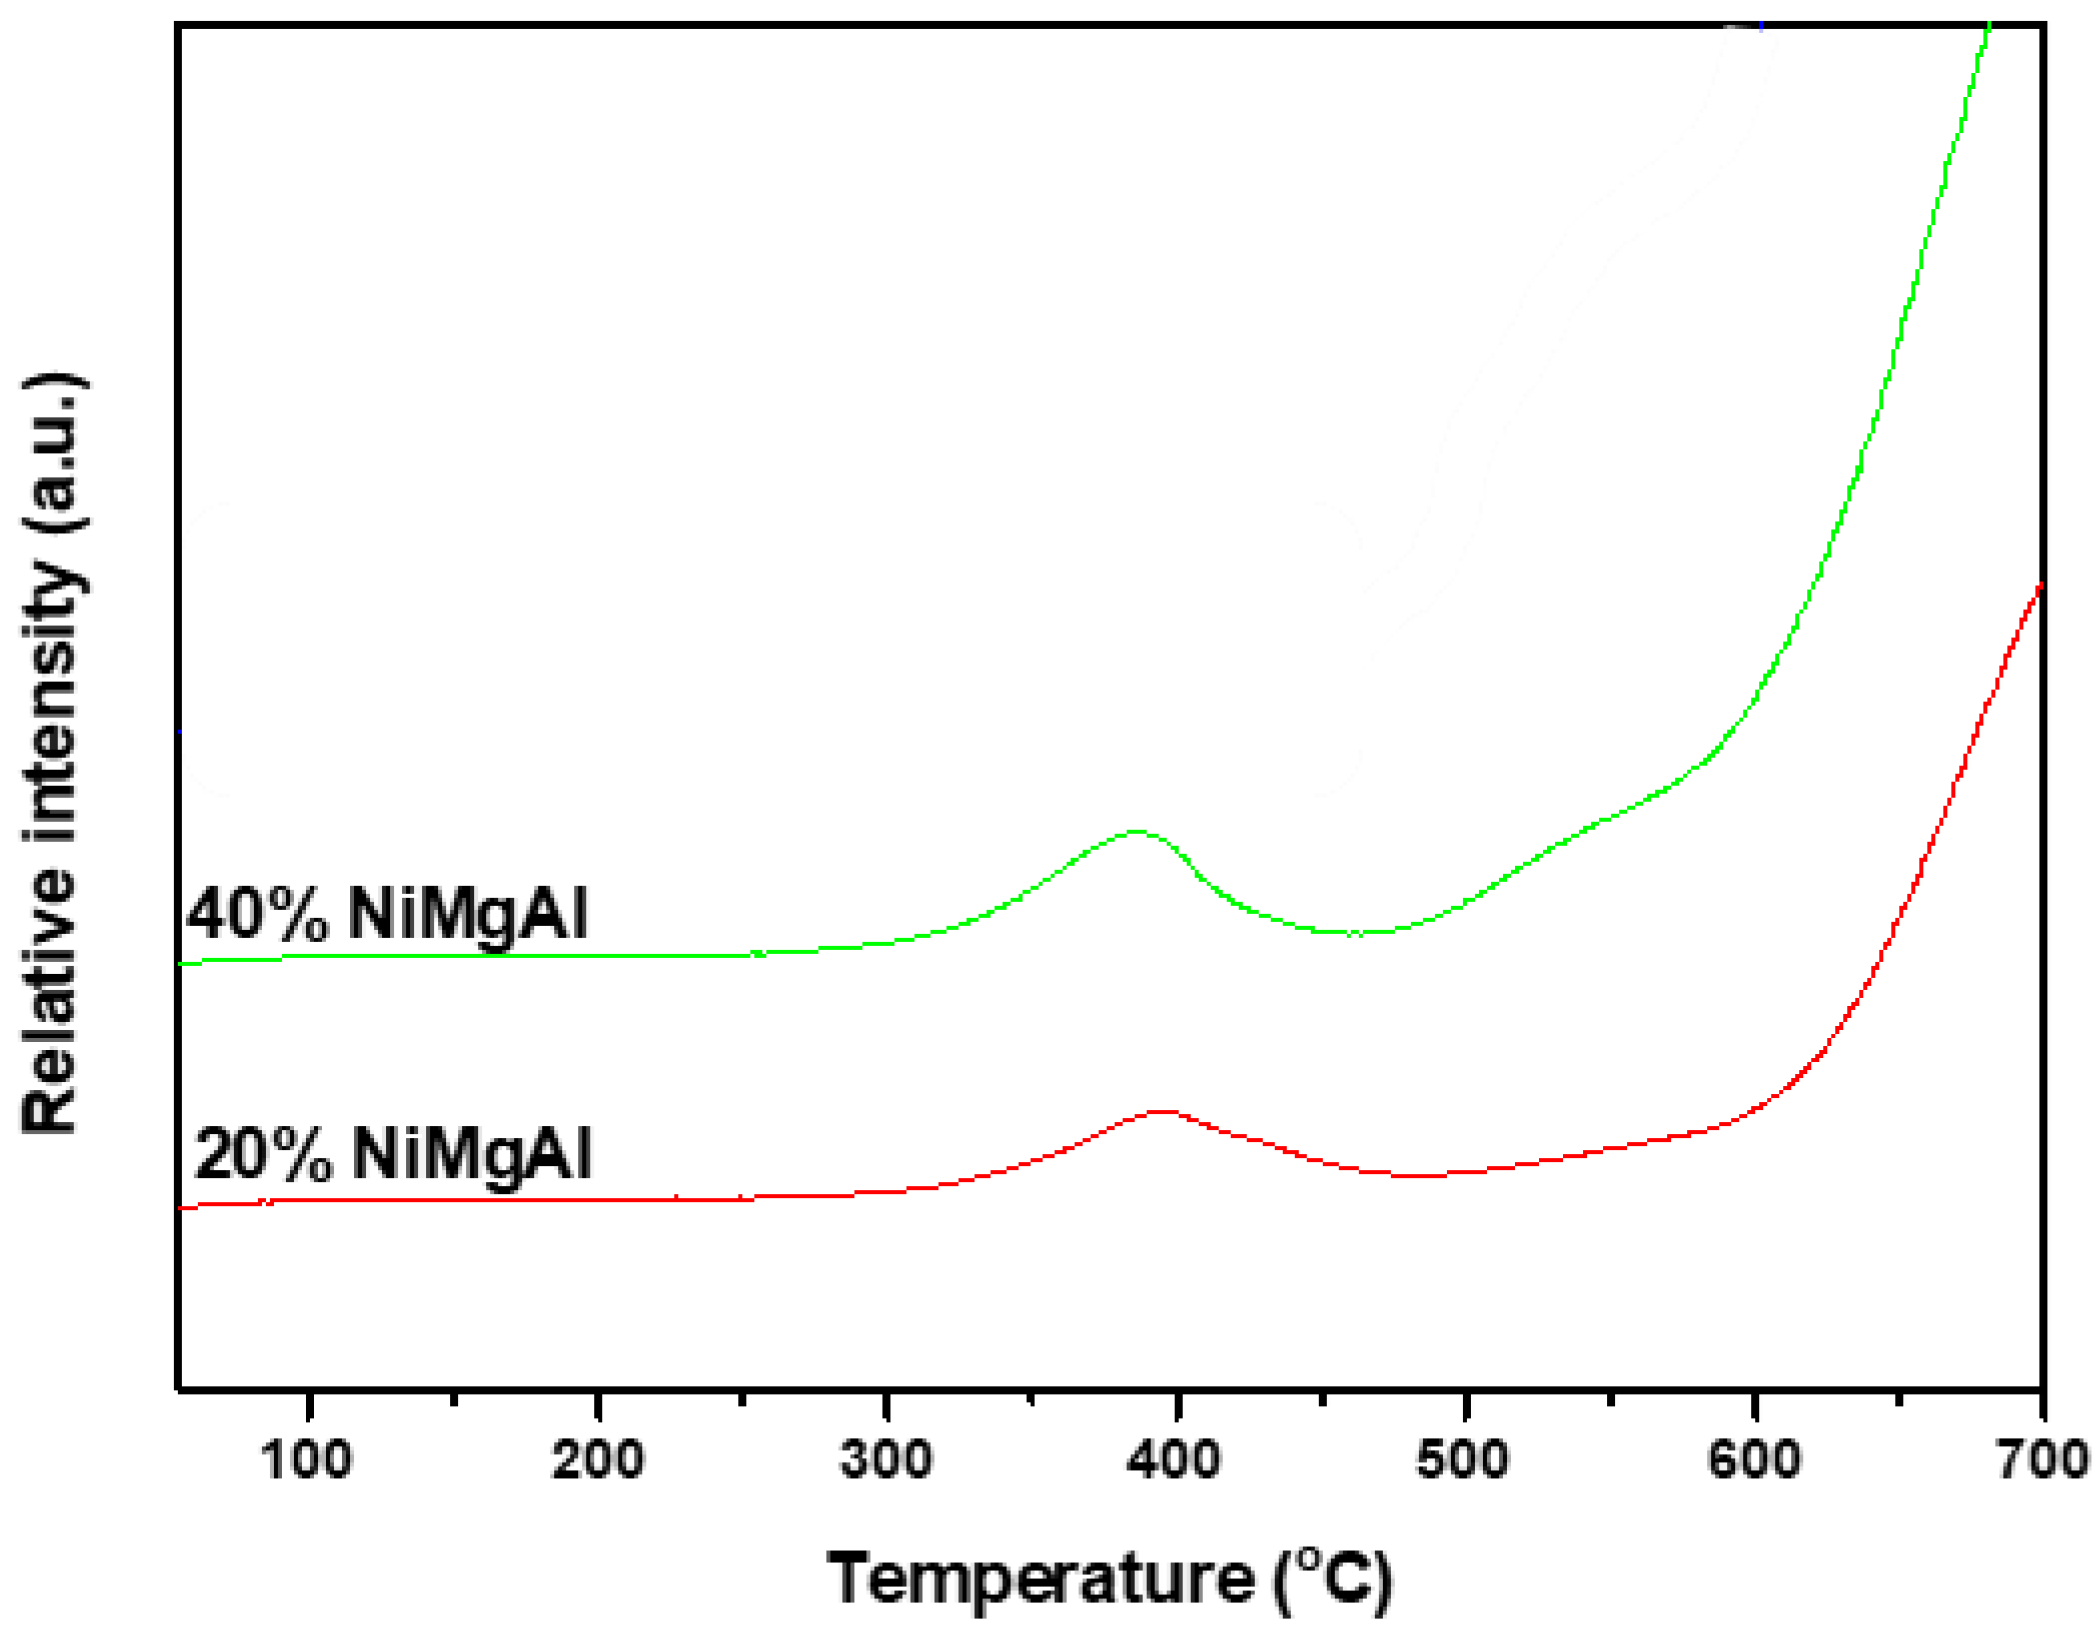
Figure 13.
X-ray photoelectron spectra of (a) fresh and (b) spent 20 wt% Ni-Mg-Al catalysts.
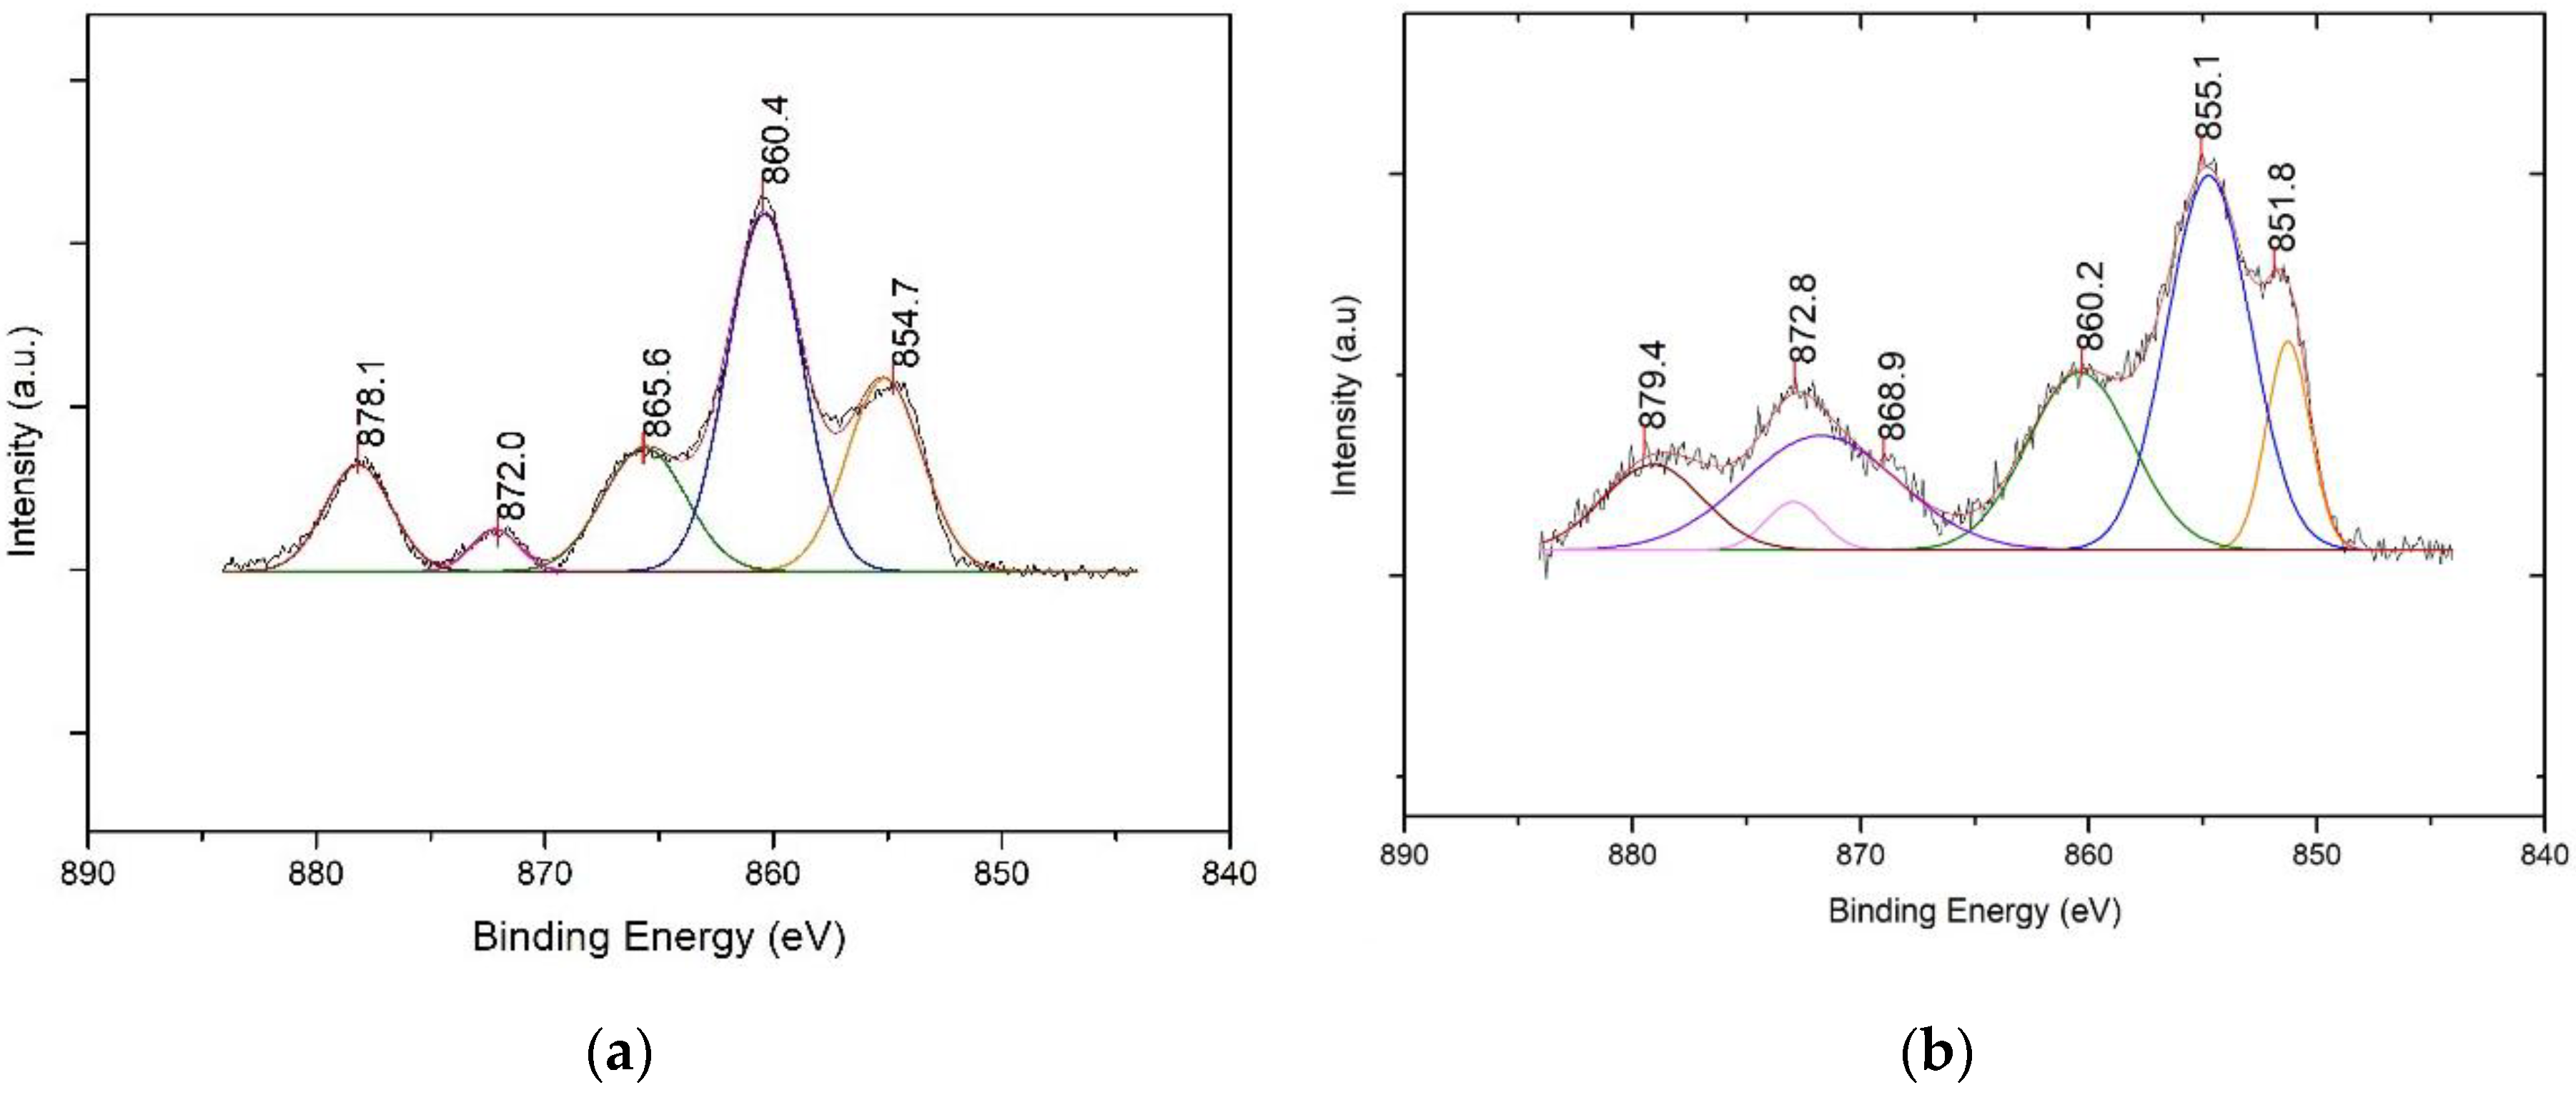
Figure 14.
Scanning electron microscopy images of (a) fresh and (b) spent 20 wt% Ni-Mg-Al catalysts.
Figure 14.
Scanning electron microscopy images of (a) fresh and (b) spent 20 wt% Ni-Mg-Al catalysts.

Table 1.
Experimental condition for CO2 methanation reaction.
| Items | Condition | |
|---|---|---|
| Variable | Reaction Temperature (°C) | 200–450 |
| CH4 and CO2 composition ratio (%) | 65:35, 50:50, 40:60 | |
| GHSV (h−1) | 21,000–50,000 | |
| H2/CO2 mole ratio | 3.5, 4, 4.5, 5 | |
| O2 (cc/min) | 10.5 (4%) | |
Table 2.
Brunauer–Emmett–Teller (BET) surface area, pore volume, and pore size of 20 wt% Ni-Mg-Al catalyst (fresh and spent).
Table 2.
Brunauer–Emmett–Teller (BET) surface area, pore volume, and pore size of 20 wt% Ni-Mg-Al catalyst (fresh and spent).
| Catalyst | BET(m2/g) | Total Pore Volume (m3/g) | Pore size(Å) | |
|---|---|---|---|---|
| 20 wt% Ni-Mg-Al | Fresh | 180.3 | 0.36 | 81.5 |
| spent | 148.9 | 0.30 | 81.1 | |
| 40 wt% Ni-Mg-Al | Fresh | 152.6 | 0.31 | 82.1 |
| spent | 107.8 | 0.32 | 82.4 |
Table 3.
Ni loading and dispersion of Ni-Mg-Al catalysts and their Turnover Frequency values based on CO2 conversion.
Table 3.
Ni loading and dispersion of Ni-Mg-Al catalysts and their Turnover Frequency values based on CO2 conversion.
| Catalyst | Ni Loading (wt%) | Ni Dispersion(%) a | Ni Particle Size (nm) | TOF(s−1) b |
|---|---|---|---|---|
| 20wt% Ni-Mg-Al | 20 | 3.57 | 28.3 | 0.36 |
| 40wt% Ni-Mg-Al | 40 | 3.68 | 27.5 | 0.17 |
a Estimated from H2 chemisorption, b TOF of CO2 conversion at 350 °C.
Table 4.
CO2 conversion and selectivity of CH4 with different Ni loadings.
| Catalyst | Reaction Temperature (°C) | CO2 Conversion (XCO2) | CH4 Selectivity (SCH4) |
|---|---|---|---|
| 20 wt% Ni-Mg-Al | 350 | 75.0 | 94.2 |
| 400 | 75.6 | 93.0 | |
| 40 wt% Ni-Mg-Al | 350 | 61.2 | 96.4 |
| 400 | 72.2 | 95.3 |
Table 5.
Elemental composition of fresh 20 wt% Ni-Mg-Al catalyst determined by scanning electron microscopy–energy-dispersive X-ray spectroscopy.
Table 5.
Elemental composition of fresh 20 wt% Ni-Mg-Al catalyst determined by scanning electron microscopy–energy-dispersive X-ray spectroscopy.
| Element | C | O | Ni | Mg | Al |
|---|---|---|---|---|---|
| Weight (%) | 4.82 | 36.99 | 16.80 | 2.59 | 38.80 |
Publisher’s Note: MDPI stays neutral with regard to jurisdictional claims in published maps and institutional affiliations. |
© 2020 by the authors. Licensee MDPI, Basel, Switzerland. This article is an open access article distributed under the terms and conditions of the Creative Commons Attribution (CC BY) license (http://creativecommons.org/licenses/by/4.0/).
Share and Cite
MDPI and ACS Style
Han, D.; Kim, Y.; Byun, H.; Cho, W.; Baek, Y. CO2 Methanation of Biogas over 20 wt% Ni-Mg-Al Catalyst: on the Effect of N2, CH4, and O2 on CO2 Conversion Rate. Catalysts 2020, 10, 1201. https://doi.org/10.3390/catal10101201
AMA Style
Han D, Kim Y, Byun H, Cho W, Baek Y. CO2 Methanation of Biogas over 20 wt% Ni-Mg-Al Catalyst: on the Effect of N2, CH4, and O2 on CO2 Conversion Rate. Catalysts. 2020; 10(10):1201. https://doi.org/10.3390/catal10101201
Chicago/Turabian StyleHan, Danbee, Yunji Kim, Hyunseung Byun, Wonjun Cho, and Youngsoon Baek. 2020. "CO2 Methanation of Biogas over 20 wt% Ni-Mg-Al Catalyst: on the Effect of N2, CH4, and O2 on CO2 Conversion Rate" Catalysts 10, no. 10: 1201. https://doi.org/10.3390/catal10101201
Note that from the first issue of 2016, this journal uses article numbers instead of page numbers. See further details here.