Abstract
This study theoretically analyzes the mass transport through capillary, asymmetric, biocatalytic membrane reactor, where the diffusive plus convective mass transport is accompanied by biochemical reaction with Michaelis-Menten kinetics. An approach mathematical model was developed that provides the mass transfer properties in closed, explicit mathematical forms. The inlet and outlet mass transfer rates can then put into the differential mass transport expressions of the lumen and the shell fluid phases as boundary values. The approach solution was obtained by dividing the membrane layer into very thin sub-layers with constant transport and reaction kinetic parameters and the obtained second-order differential equation with constant parameters, given for every sublayer, could be solved analytically. Two operating modes are analyzed in this paper, namely, with and without a sweeping phase on the permeating side. These models deviate by the boundary conditions, only, defined them for the outlet membrane surface. The main purpose of this study is to show how the cylindrical space affects the transport process, concentration distribution, mass transfer rates and conversion in presence of a biochemical reaction. It is shown that the capillary transport can significantly be affected by the lumen radius, by the biocatalytic reactor thickness and the convective flow. Decreasing values of the lumen radius reduce the effect of the biochemical/chemical reaction; the increasing reactor thickness also decreases the physical mass transfer rate and, with it, increases the effect of reaction rate. The model can also be applied to reactions with more general kinetic equations with variable parameters.
1. Introduction
Biocatalytic/catalytic membrane reactors, as a promising novel technology, are widely recommended in the chemical and the biochemical, food, pharmaceutical, etc. industries [,,,,,] or environmental applications []. Different biochemical/chemical reactions have been studied by this process, e.g., dehydrogenation of alkanes to alkenes, partial oxidation reactions using inorganic or organic peroxides, as well as partial hydrogenations, hydration, etc. [,,]. For these reactions, intrinsically catalytic membranes, e.g., zeolite, metallic membranes or a porous, inert membrane layer are made catalytic by dispersion or impregnation of catalytically active particles such as metallic complexes, metallic clusters, activated carbon, biocatalytic enzymes, zeolite particles, etc. throughout polymeric or inorganic membrane layers [,,,]. Catalano et al. [] measured the hydrogen transfer rate through a Pd-Ag selective membrane layer and examined the role of the polarization layer. Lüdke et al. [] used a two-resistance transport model to describe transfer during the gas-vapor separation in a PDMS-dense membrane layer. They calculated the overall mass transfer coefficient as a function of Reynolds number. He et al. [] theoretically analyzed the role of concentration polarization during binary gas separation as hydrogen recovery—or air separation. They stated that when the permeation rate of the more permeable gas larger than 100 GPU (gas permeance unit, m3STP/m2sPa), the role of concentration polarization must be considered. Among others, Murmura et al. [,] theoretically investigated the effect of the methane steam-reforming reaction in catalyst-bed membrane reactors in flowing gas phase, taking into account the axial dispersion and radial diffusion, but the radial convection was not taken into account. Nagy [] both experimentally and theoretically investigated the effect of the convective velocity in flat-sheet flowthrough catalytic membrane reactors. They have stated that the convective flow increases the concentration in the membrane reactor and accordingly the reaction rate, as well, in case of concentration dependence chemical/biochemical reaction.
Several studies have analyzed the different application of immobilized enzyme membrane reactors [,,]. Biocatalytic membrane reactors contain enzyme catalysts—bounded mostly into the internal surface of the porous support layer of an asymmetric membranes, thus during the bioreaction process, reactant(s) and product(s)—are diffusing or additionally transported by convective flow across the catalytic reactor layer, when one applies hydraulic pressure difference. Numerous papers have been published on enzymatic hydrolysis of cellulose, applying biocatalytic membrane reactors for it [,,,,]. Calabro et al. [] and also Godongwana et al. [] described theoretically the solute transport in the lumen phase of a capillary bioreactor. The numerically evaluated model takes into account the radial convective transport and the biochemical reaction. Nagy et al. [] measured and modeled the mass transport through a cylindrical biocatalytic membrane reactor, taking into account the convective velocity induced by transmembrane pressure difference. They have shown remarkable effects of the capillary radius as well as the convective velocity on the reaction rate.
The basic mathematical transport expressions, developed for chemical transport processes for gas-liquid, liquid-liquid or solid-fluid systems, depending on the hydrodynamic conditions [] as well as on the transport resistances between phases [,] can be, at least partly, applied for description of the substrate transport for biocatalytic membrane reaction processes, as well. The solute transport, accompanied by biochemical/chemical reactions, in presence of diffusive and convective flows, across a porous membrane, has often special properties, thus the previous literature expressions should be adapted to the biocatalytic membrane properties. Transport rate can strongly depend on the ratio between the transported molecule size and the pore size, membrane structure, whether solute or gas component is transported, what kind of interactions exist between the matrix molecules and the transported one, etc. [,,,]. The simplest model of a solute transport can be described by second-order differential equation with diffusive, convective and reaction terms, with constant or variable parameters.
The starting differential expressions and their solutions are known from the literature [,,,]. Numerous papers discussed the transport in special cases. Nagy and Nagy et al. studied, in couple of papers, the transport accompanied by chemical/biochemical reactions mostly without [] (Chapter 6), [,] and partly with convective one [] (Chapter 8), [,,] for flat-sheet membrane layer. Hardly any paper discusses the solute transport through cylindrical membrane though the diffusive transport across capillary membrane was discussed by Nagy [] (Chapter 9).
Summarizing the literature data, the inlet and the outlet mass transfer rate during the solute transport, with diffusive and convective flows through a biocatalytic cylindrical space, accompanied by chemical/biochemical reactions is not discussed in details in the literature, to our knowledge. The knowledge of the inlet and the outlet mass transfer rates, then can be inserted in the mass balance expressions of both the lumen and the shell side fluid phases as boundary conditions, thus their solute transport can be discussed consecutively, practically separately from each other. Thus, the mass transfer rate expressions connect them to each other. Additionally, the membrane performance can easily be predicted knowing the inlet, outlet mass transfer expressions. Accordingly, the important novelty of this study is that the inlet and outlet mass transfer rates of the cylindrical, biocatalytic membrane reactor have been developed, and the mass transport process across the biocatalytic membrane can directly be analyzed under different operating conditions and membrane properties. For getting it, the catalytic membrane reactor was divided into very thin sublayers, assuming that the mass transfer parameters (diffusion coefficient, reaction kinetic parameters, even the membrane radius within every single sublayer) are constant, and the differential mass balance equations with constant transport parameters can already be solved analytically. The obtained algebraic equation system—containing 2 × N algebraic equations, after the analytical solution of the second-order differential mass balance equations with constant parameters—were solved with conventional mathematical method [].
2. Theoretical
The capillary, hollow fiber membrane is a most often applied membrane module in the separation industry, due to its very advantageous surface/volume ratio. The very small lumen radius and membrane thickness, with the required mechanical resistance, can provide very favorable mass transport and separation conditions. The asymmetric inorganic/polymeric membrane layer excellently applicable for immobilizing biocatalytic nanoparticles, enzymes, into the porous membrane support layer, thus it can be an effective biocatalytic membrane reactor. This proves the importance of the mass transport description through a cylindrical membrane layer. The schematic illustration of the physical model of the capillary transport, with notations is given in Figure 1.
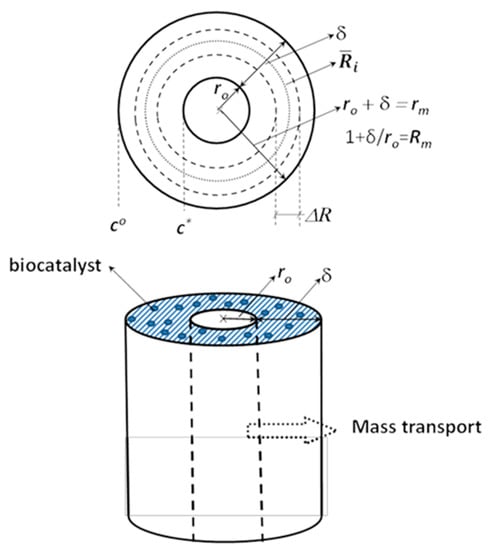
Figure 1.
Physical model of the mass transport across a biocatalytic capillary membrane layer and some important notations are illustrated. For quasi-analytical solution the biocatalytic membrane is divided into very thin sublayers (less than one micrometer), which have constant mass transport parameters and even its radius is also assumed, (for the ith sublayer) to be constant across the whole sublayer.
Component transport through a biocatalytic membrane layer can take place either across the porous support layer or on the selective layer of a cylindrical membrane—depending on the location of immobilized biocatalyst. The inlet of the substrate solution should often occur on the porous side of the membrane in order to avoid enzyme washing away from the porous, biocatalytic support layer. However, this can be prevented by placing a protective skin layer on the shell side of membrane or by forming chemical bound between the enzyme molecules and the matrix molecules. It is assumed here that the component(s) [product(s), reactant(s)] have diffusive plus convective transport, accompanied by biochemical reaction(s), from the lumen side of the membrane into its shell side. The bioreaction, assuming Michalis-Menten kinetics with or without product or substrate resistance, has nonlinear kinetics. Its analytical solution is not known; thus, we have developed a quasi-analytical approach solution for this. Summarizing all parameters involving in the expressions given in the following section for the easier perspicuity, are (see Appendix A):
where Peo means the inlet Peclet number; is the average radius of a sublayer; vmax is the maximum reaction rate; D is the diffusion coefficient; KM is the Michaelis–Menten coefficient. The differential mass balance equation in steady-state condition, assuming a single component reaction with diffusive plus convective transport and variable mass transport parameters [D(C,r), vmax (r)] is as [] (pp. 68–88), []:
where C is the substrate concentration, r is the local radial coordinate; vo is the inlet convective flow, Rewriting Equation (1) in general dimensionless form, one can get as (R = r/ro):
with:
where ro is the lumen radius; R = r/ro. The solution of the above differential equation by constant parameters can analytically be solved by Bessel function [,]. We have looked for such an approach solution, which can be used in case of variable mass transfer coefficients (e.g., variable diffusion coefficient, due to the, e.g., anisotropic character of the membrane, and/or variable reaction rate constant) as well as the results are expressed in closed, explicit mathematical form. The variable parameters are assumed to be constant in every, thin sublayer, thus one obtains a second-order differential equation with constant parameters, among them even the R value is also constant, which can be solved analytically. The variation of the parameters as a function of local coordinate and/or as a function of concentration is then taken into account from sublayer to sublayer. After the reformulation of the differential expression into dimensionless space coordinate, changes of parameters are then involved partly in the values of parameters of the bioreaction term. For the approach solution let us do the following simplification: dividing the membrane layer (during our simulation N value was chosen to be 1000), N number, very thin sublayers, in them the variable diffusion coefficient, reaction rate constant and or convective velocity as well as the average value of radius, (its algebraic mean value is considered to be constant in every sublayer; ; ; ro is the lumen radius of the cylindrical membrane, m) are constant. The approaching differential equation for the ith sublayer (i = 1, …, N) is as follows:
where:
where is the reaction modulus. The Ci−1 concentration here means concentration value obtained by the previous iteration steps. Hereinafter the concentration and radius dependency of the mass transport and the kinetic parameters are neglected for the sake of the convenience. In case of bioreactor, the concentration dependence is not really important, while the local coordinate dependency occurs in case of anisotropic membrane, only. Thus, for a homogeneous, porous, biocatalytic, support membrane layer, it can be found as:
Or in order to get the reaction rate in measure of unit of the first-order reaction, in 1/s, one should divide both the numerator and the denominator by, e.g., the inlet reactant concentration, and then one finds:
The denominator of Equation (5) contains the concentration distribution in the membrane layer obtained for the previous step, Ci−1, which means that the calculation of the correct concentration distribution the so-called self-approaching iteration steps are needed. According our experiences few steps of iteration (3–5 repeated steps) are enough to reach the correct concentration distribution for every sublayer and consequently for the biocatalytic membrane layer/reactor.
Thus, the differential balance equation to be solved is as follows:
The methodology of solution was applied by numerous Nagy’s works with chemical/biochemical reactions, mostly without [] (Chapter 6) and partly with convective one [] (Chapter 8), [,,,,,,] for flat-sheet membrane layer. This study is the first case of application of the mass transport with convective velocity defined in Equation (7), for cylindrical biocatalytic membrane. To find an analytical solution, the elimination of the second first-order differential term in Equation (6) must be carried out. Let us introduce for this the following new variable []:
Replacing the C value given by Equation (8) into Equation (6), one can get the following simplified second-order differential equation to be solved:
where
The general solution of Equation (8) is as follows:
where Ti and Si are the parameters of this solution, which should be determined by means of suitable boundary conditions. Taking the into account Equation (8) and replacing it into Equation (11), the concentration distribution can easily be obtained, as it follows:
Ti and Pi parameters of Equation (12) can be determined by means of the internal, for the ith sublayer (with 1 ≤ i ≤ N − 1) and the two external boundary conditions, namely at R = 1 and R = 1 + δ/ro, where δ is the thickness of the cylindrical (capillary) membrane (see Figure 1; the thickness of the active layer is negligible). The boundary conditions at the internal interfaces of the sublayers (1 ≤ i ≤ N − 1; Ri = 1 + iΔR; ΔR = δ/[Nro]) can be obtained from the following two equations, considering the equalities of the interface concentrations and the mass transfer rates between the neighboring sublayers []. Thus, they can be written for the concentrations and the mass transfer rates, R = Ri, as:
The internal concentrations:
Another internal condition is the equality of the internal mass transfer rates, at the neighboring sublayers. The specific mass transfer rate should be the sum of the diffusive and the convective flows. Accordingly, this can be expressed as:
where J is the mass transfer rate at R = Ri. According to Equations (14) and (15), one gets for the specific mass transfer rate, at R = Ri (i = 1, …, N − 1) as:
with:
where N is the number of the sublayers (N = 1000 was chosen). Now considering Equation (16), the second internal boundary condition at R = Ri (i = 1, …, N − 1) will be as:
Value of expresses that the surfaces of the two sides of the ith internal border are different due to the fact that the ith and (i + 1)th sub-layers have different values, i.e., different mass transfer surfaces. Accordingly, the specific mass transfer rates on the two sides of an interface are not equal to each other.
Let us focus on the outlet boundary conditions. It is worth noting that the boundary condition at the outlet surface (on the permeate side of the biocatalytic membrane) depends on the operation condition, namely how the permeated component(s) is removed from the outlet membrane surface or there is sweeping phase or not []. In this study, we assume that both cases can occur. Thus, it will be distinguished these two cases because the outlet boundary condition will be different depending on the absence (the outlet diffusive flow will be equal to zero) or presence of sweeping phase (, at R = 1 + δ/ro ≡ Rm) Accordingly, the diffusive mass transport exists on the outlet membrane surface, thus the inlet and the outlet boundary conditions are as:
The outlet boundary condition without sweeping phase is as follows:
The outlet boundary, when sweeping phase washes away the outlet flow, from the outer surface, is as follows:
Applying the internal (Equations (14) and (18)) and the external boundary conditions (Equations (19) and (20) or Equations (19) and (21)), one can get three N × N dimensional determinants in both cases (see, e.g., [,]), for the applied solution methodologies). Solution of these determinants gives values of the Ti and Si (i = 1, …, N), applying the known determinant laws []. Values of T1 and S1 as solution of the first two columns of determinant is as follows:
2.1. The Solution When There Is No Sweeping Phase on the Permeate Side (dC/dR = 0 at R = Rm)
The solution methodology of this case is discussed, in details, in the previous part of this section. There is only one specific boundary condition, namely Equation (19), which is applied for this case, only. Values of the predicted T1 and S1 are as follows:
and:
where superscript of T represents the solution with the boundary conditions of the determinant in the first column, S the solution of determinant with outlet boundary conditions of its second column of determinant, 0 represents the solution of determinant obtaining by the internal boundary conditions. Values of parameters , , as well as , , with i = 1, …, N are listed with their values in the Appendix A. Knowing the values of T1 and S1, one can calculate the concentration distribution in the first sublayer by Equation (11) with 1 ≤ R ≤ R1, while the inlet and outlet mass transfer rates by Equation (15) with R = 1 and R = R1. The other Ti and Si values (i = 2, …, N) should be predicted by means of the internal boundary conditions as well as the outlet boundary condition, given by Equation (19), for the mass transport without sweeping phase.
2.2. The Concentration Distribution in Presence of Sweeping Phase, dC/dR > 0 at R = Rm
The solution methodology is practically same, with the same boundary conditions, as those for the case without sweeping phase on the outlet side of the biocatalytic membrane layer. The only deviation from those given for the boundary conditions is that given for the outlet surface. Accordingly, that for the outlet surface is defined by Equation (21). Thus, values of T1 and S1 for the case when there is sweeping phase on the outlet membrane surface are as:
where superscript of T represents the solution with the boundary conditions of the determinant in the first column, S the solution of determinant with outlet boundary conditions of its second column of determinant, 0 represents the solution of determinant obtaining by the internal boundary conditions. Values of parameters, , , as well as , , with i = 1, …, N are listed with their values in the Appendix. Knowing the values of T1 and S1 the values of the other Ti and Si parameters, for predicting the concentration distribution, can be obtained by means of the internal boundary conditions (Equations (13) and (17); i = 1,..., N − 1).
The presented models give the mass transfer rates, concentration distribution by explicit closed mathematical expressions. It defines the exact concentration distribution for every single sublayer (the concentration fall is not regarded as linear one, in a single sublayer, as made during numeric solution), accordingly the transport data can be predicted very accurately, depending on the software used for calculation. Important advantage of this model is that it has no stability problems in contrast with those of the numeric methods. Thus, its application is simpler, against its relatively complex equation system.
3. Methods
To predict the calculated results, an in-house computer program was written in the QuickBASIC computer language. Accuracy of the calculated concentration and conversion or mass transfer rates, is 16 decimals. The predicted inlet concentration, using values of T1 and S1, was calculated to be of 0.9999999 accuracy, which is practically the same value as the boundary value of the inlet concentration, (CO = 1; Equation (19)). Taking into account that equation systems with 1000 algebraic expressions are to be solved, this accuracy is really remarkable. The inlet mass transfer rate was predicted by Equations (15) or (16), depending on the value of Ri while the enhancement and the conversion by Equations (26) and (27) (see later), for operating mode without sweeping phase on the permeate side or by values of E = J/JO and by Equation (27), respectively, with sweeping phase on the permeate side. Concentrations inside the membrane reactor as a function of Ri was predicted by iterative manner, due to the variation of the biochemical reaction rate with the actual substrate concentration (see Equation (4)). This was a self-adjusted parameter fitting, it needed 3–5 iteration steps.
As a practical example the effect of the membrane radius and the convective velocity (more exactly Péclet number) have been shown, using kinetic (vmax, Km, D) data obtained by the authors [] for the hydrolysis of oleuropein, catalyzed by β-glucosidase enzyme and measured by biocatalytic membrane reactor. The main aim of this analysis is to show the significance of the roles of the kinetic and transport parameters using capillary biocatalytic membrane reactor.
4. Results and Discussion
This study elaborates and discusses theoretical results in this section, which is obtained by predicted mass transport process, using the developed mathematical models. The model applies a special approach; the physical model assumes, that the transport parameters, diffusion coefficient, convective velocity and given cases, the reaction rate parameters in the sub-layers of the biocatalytic membrane layer (about 300–1000 μm thick catalytic membrane layer was divided into 1000 sublayers, which means 0.3–1 μm-thick sublayers) as well as the radius of every cylindrical sublayer are constant. This assumption enables the applier to solve the second-order differential transport equation, now already with constant transport parameters, analytically. The solution methodology and the calculation modes are discussed, in details, in the theoretical section (Section 2).
The transport properties of capillary/cylindrical membrane is actual, since the most frequently applied membrane modules are capillary ones with their very advantageous transfer area and volume ratio. Transport across a capillary membrane layer is much complex process than that across a flat-sheet membrane. On the other hand, the differential mass balance equation of the solute transport cannot be solved analytically in this case. Thus, the transport rate, the concentration distribution cannot be given in closed mathematical forms. The present model serves such an analytical approach solution that practically gives the mass transfer rates or concentration distribution in closed, explicit mathematical forms. The model involves both the diffusive and convective flows as well as the simultaneous effect a biochemical/chemical reactions across the biocatalytic membrane layer. In our previous paper, published in this journal [], it is discussed the mass transport across a flat-sheet membrane. This paper also applies the same solution methodology for transport with constant or variable parameters—taking into account both the diffusive and convective flow across a cylindrical membrane reactor. Now, the transport across capillary membrane will be analyzed, focusing on the simultaneous effects of the capillary radius, the convective flow and the bioreaction rate. The practical importance of this problem is obvious in our opinion.
4.1. Mass Transport without Sweeping Phase
A few figures illustrate the effect of the biochemical reaction, the Péclet number in this operation mode. Characteristic of this operation mode is that the concentration distribution is a simple, horizontal line across the whole membrane, at value of unity, in case of physical transport. It is known that the convective velocity does not have any separation effect, thus its presence does not induce any concentration gradient.
In operation mode without sweeping phase only the chemical/biochemical reaction can induce concentration gradient, assuming local coordinate independent diffusion coefficient. Two figures, Figure 2a,b, illustrate the concentration distribution across the biocatalytic membrane layer. These figures clearly illustrate the effect of the operation mode on the concentration distribution, considering the outlet concentration gradients. As can be seen its outlet value is equal to zero, independently of the reaction rate. Figure 2a shows the effect of the reaction rate on the concentration distribution as a function of the local coordinate, across the biocatalytic membrane layer. With the increase of the reaction rate quickly decreases the outlet concentration down to zero. It is well observable, that raising the value of vmax/CO above unity, 1/s, the concentration decreases quickly to zero, and the reactor volume will gradually, partially be used, only. This is why the right choice of membrane thickness may be important. On the other hand, the thickness of available commercial membranes often have similar values as applied in the calculation, thus, e.g., the outlet reactant concentration can be raised by using forced convective flow. The effect of the membrane thickness is illustrated in Figure 2b. where its value was varied between 100 μm and 1000 μm, at a given value of reaction rate (vmax/CO = 0.5 1/s). The tendency in the concentration fall is similar to those of the reaction rate constant. With the increase of the membrane thickness the concentration quickly lowers down to zero. As is expected, this parameter, similarly to the value of the vmax/CO, substantially affects the concentration distribution and accordingly the inlet mass transfer rate. Thus, depending on the reaction rate, the transported component can perfectly be reacted, thus the too thick membrane layer will not be useful anymore, since the forced transport needs additional energy with the increase of the thickness. It can be stated that the operation conditions, e.g., the hydrodynamic pressure difference between the two sides of the biocatalytic membrane, the membrane thickness should be carefully chosen, depending on the reaction rate, in order to get efficient catalytic membrane reactor.
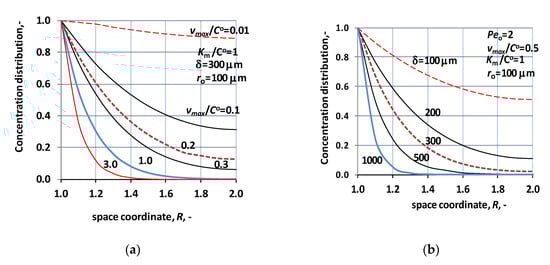
Figure 2.
Normalized concentration distribution across the biocatalytic membrane layer, in case of mass transport without sweeping phase. (a) The parameter is the relative value of the maximal reaction rate, i.e., vmax/CO (Peo = 2; D = 1.9 × 10⁻⁹ m2/s; ro = 100 μm; δ = 300 μm; KM/CO = 1); (b) concentration distribution at different values of the thickness of the biocatalytic membrane layer (Peo = 2; D = 1.9 × 10⁻⁹ m2/s; ro = 100 μm; KM/CO = 1).
4.1.1. Effect of Membrane Properties of Measures, i.e., Lumen Radius, Membrane Thickness
Two important properties of a commercially available asymmetric membrane are the lumen radius and the thickness of the membrane layer, made it catalytic. The membrane thickness is especially important since it can expectably strongly affect the performance of a catalytic/biocatalytic membrane reactor. The lumen radius determines the so-called cylindrical effect. Increasing its value, the space of a sublayer will also increase and as its consequence, the concentration will decrease even without biochemical reaction, as well (Note, it is assumed, that the component transport is directed to the shell side of membrane from the lumen side). This means that the effect of the concentration depending chemical or biochemical reactions, e.g., Michaelis–Menten kinetics, first- or higher-order reaction, can be lowered to some extent. This is why value of lumen radius is important; the cylindrical effect is gradually decreasing with the increase of ro values. The lumen radius of commercially available capillary membranes varies mostly between 100 and 200–300 μm, since the membrane thickness can vary between 300 and 600 μm or even more. Its thickness is limited because its increasing transport resistance.
There are several parameters of the reactor performance, which can be characteristic for a membrane bioreactor, e.g., inlet and outlet specific mass transfer rates, enhancement and reacted amount of the transferred reactant(s). The effect of the biochemical reaction rate on the enhancement and on the reacted portion of the inlet reactant are shown in Figure 3a,b, respectively. Value of the diffusive, physical mass transfer rate, namely without biochemical reaction, is zero, since there is no concentration gradient across the biocatalytic reactor, thus JO = 0. Accordingly, the enhancement, E, was obtained in such a way, that the actual mass transfer rate was divided with D/ro:
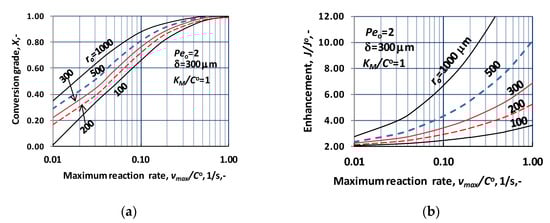
Figure 3.
Effect of the vmax/CO on the enhancement and on the conversion grade, X, at operating mode without sweeping phase, i.e., dC/dR = 0 at R = Rm, applying the Michaelis-Menten kinetics. (a) Change of the conversion as a function of the reaction rate, more exactly as a function of vmax/CO, at different values of the lumen radius; (b) change of the enhancement as a function of the reaction rate (N = 1000).
Thus, value of the JO does not give back the real change of the specific, physical mass transfer rate as a function of the space coordinate. As we can see in case of mass transport with sweep phase on the permeate side, the specific physical mass transfer coefficient can strongly depend on the space coordinate.
Conversion is predicted by means of the inlet and the outlet mass transfer rates. Thus, this was obtained as:
Value of X should be changed between zero (there is no reaction) and unity (the outlet transfer rate is equal to zero). Ratio of Rave(N)/Rave(1), takes into account that the extent of surface for the mass transport are different in the inlet and the outlet surfaces. Accordingly, the specific mass transfer rates are different in case of the identical values of the specific mass transfer rates. Note, there is not concentration gradient at the outlet surface, thus the convective mass transfer rate determines the outlet mass transfer rate.
Enhancement increases substantially as a function of the values of vmax/CO, with increasing intensity. Note that the inlet Péclet number was chosen to be 2, Peo = 2. Thus, if there is no chemical reaction during the transport then the outlet mass flow will be as PeoC(N) = PeoCm. This is why the value of enhancement tends to be 2 as the reaction rate lowers to zero. This can well see at Figure 3b. The fast increase of the enhancement can partly be caused by the decreasing values of D/ro due to the increase of the lumen radius. Obviously, however, the larger portion of this increase is induced by the biochemical reaction taking place in a membrane layer with thickness of 300 μm. Let us look an example of it., e.g., enhancement of the diffusive flow is equal to be 8.1 at vmax/CO = 1, with ro = 500 μm. Let us compare the enhancement using the Ha number () [,], developed for gas-liquid system for the same reaction rate constant. Enhancement obtained here is also 8.1, proving the similar effect of reaction in gas-liquid system and biocatalytic membrane reactor.
The conversion grade, X, is illustrated as a function of the reaction rate in Figure 3a. Here also the lumen radius is applied as parameter. Other parameter values were kept constant (δ = 300 μm; KM/CO = 1; D = 1.9 × 10⁻⁹ m2/s); Peo = 2). As it could be expected, based on results of Figure 3a, the value of X strongly rises with increasing lumen radius. On the other hand, its value quickly elevated as function of the reaction rate, corresponding to values of vmax/CO. The deviation in results at different ro values strongly depends on the reaction, in the so-called intermediate reaction rate regime, practically up to vmax/CO = 0.1. Generally, it can be stated that the cylindrical effect gradually decreases with the increase of the reaction rate. This deviation is practically diminished close to vmax/CO = 1. This means that the concentration reduces down to zero in larger and larger portion of the reactor volume, eliminating the effect of the reaction rate. The component transport process is affected by the cylindrical space mostly in the so-called slow reaction rate regime () and partly in the intermediate reaction range (), only.
4.1.2. Mass Transport with Membrane Thickness as a Parameter
Here also the effect of two important parameters are discussed, namely the enhancement and the conversion grade as a function of the reaction rate. These effects are plotted by Figure 4a,b.
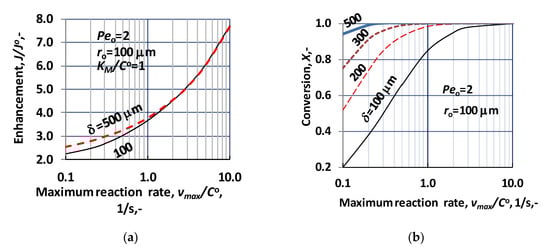
Figure 4.
Change of enhancement and the conversion as a function of the vmax/CO, under operating mode without sweeping phase, i.e., dC/dR = 0 at R = Rm, applying the Michaelis–Menten kinetics (N = 1000). (a) Change of the enhancement as a function of the reaction rate, more exactly as a function of vmax/CO, at different values of the biocatalytic membrane thickness (Peo = 2; ro = 100 μm; KM/CO = 1); (b) change of the conversion grade as a function of the reaction rate (Peo = 2; ro = 100 μm; KM/CO = 1).
The values of enhancement increase with similar tendency, as plotted in Figure 3b. Values of enhancement are in harmony with data of Figure 3b, at ro = 100 μm and δ = 300 μm (values corresponding to these parameters should be located between the two curves shown in Figure 4a). On the other hand, perhaps a little bit surprising, that value of the enhancement depends on the thickness of the biocatalytic membrane reactor in small measure, only. Figure 4a shows effect at two reactor thicknesses, at δ = 100 μm and δ = 500 μm. Their values tend to the same values with increasing reaction rate, independently of the biocatalytic membrane thickness. This behavior is the consequence of the lower and lower reactant concentration as the reaction rate increases. Due to it, the membrane reactor takes part in the reaction in lesser and lesser portion, eliminating the role of the reactor thickness. As can be seen, the thickness can influence the value of enhancement at low reaction rate (vmax/CO), only, in that reaction rate regime, where reactant exists in the whole layer of the reactor. This effect is shown in reaction rate regime between 0.1 and 1.0, which is at border of intermediate and fast reaction rate regime.
Figure 4b illustrates the change of the conversion grade as a function of vmsx/CO, at different values of the catalytic membrane thickness (ro = 100 μm; Peo = 2; KM/CO = 1). With the increase of the biocatalytic reactor volume, i.e., with increase of the catalytic membrane thickness, the conversion grade, as it expected, essentially increases. The conversion value quickly, in narrow reaction rate regime, increases up to unity, at a given value of reactor thickness. The reaction rate necessary to reach the complete conversion lowers significantly with increase of the reactor thickness. Generally, it can be stated that the reactor thickness should carefully be chosen, taking into account the reaction rate. On the other hand, the negative effect of the mass transport resistance should also be taken into account, when one wants to choose the correct biocatalytic membrane thickness.
4.1.3. The effect of the Convective Flow, Peo
Application of the convective velocity can also be important at biocatalytic membrane processes. Its presence may lift the reactant concentration and consequently can raise the reaction efficiency, during transport of the reactant across the membrane. In particular, it can provide higher concentration in the “bulk” catalytic membrane reactor, in case of fast reaction. On the other hand, the convective velocity does not contribute to the separation of the product component, and it can also reduce the residence time of component in the membrane reactor. Effect of the convective flow rate (through Peo number) is illustrated by Figure 5. As can be seen, the Peo-number can significantly alter the conversion grade, depending on the reaction rate. It is obvious that convective flow decreases the X value because it raises the concentration values across the biocatalytic membrane layer. The right choice of its values can help to accomplish the desired conversion in case of a given biochemical reaction. The mathematical model developed is suitable to predict the reactor performance and help to plan the reactor volume with the reactor surface to reach the desired catalytic performance.
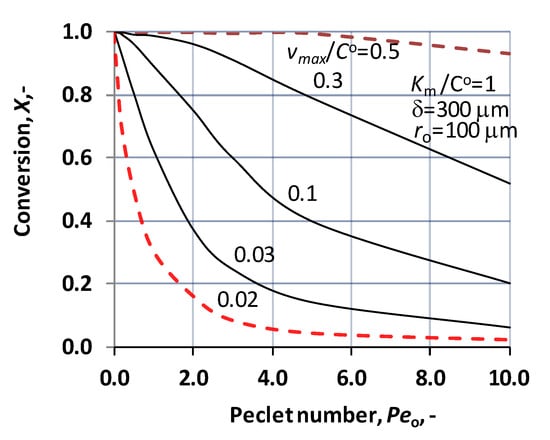
Figure 5.
Change of conversion as a function of the inlet Peo-number, at different values of vmax/CO, under operating mode without sweeping phase, i.e., dC/dR = 0 at R = Rm, applying the Michaelis–Menten kinetics (N = 1000; δ = 300 μm ro = 100 μm; KM/CO = 1; D = 1.9 × 10⁻⁹ m2/s).
4.2. Mass Transport with Sweeping Phase on the Permeate Side
Application of a sweeping phase, which then washes away the permeated phase from the outer surface can essentially alter the working conditions of a biocatalytic membrane reactor. In this case the outlet reactant and the product concentration, if their values are larger than zero, are determined by the hydrodynamic conditions of the sweeping phase. By its usage, the product concentration can be kept at very low values, which enables the users to shift the biochemical reaction in direction of higher conversion grade, in case of reversible reaction. The solution of the physical model is described in details in the theoretical part of this study (see Section 2). Here a couple of figures are shown for illustration of the most typical features of this biocatalytic process.
As it was written in the Section 2, the solution of the transport in presence of sweeping phase differs from that without sweeping phase, basically, by consequence of the boundary condition, at the outlet surface of the biocatalytic membrane reactor. Accordingly, it can be expected that the transport process itself, as, e.g., concentration distribution, the mass transfer rates are also similar in the two operating modes. Let us illustrate this similarity by the concentration distribution. Figure 6 illustrates that the concentration distribution with the two operation modes, i.e., using sweeping phase on the permeate side of the membrane reactor (dotted lines; dC/dR = 0 at R = Rm) as well as with sweeping phase (continuous lines; dC/dR > 0 at R = Rm). In the latter case, the diffusive flux can dominate the mass transfer rate, especially at higher reaction rate, when the reactant concentration is very low due to the biochemical reaction. As can be seen the deviation of the concentration distribution curves is remarkable only then, when the outlet concentration is larger than zero, i.e., at low concentration regime, namely at vmax/CO up to about vmax/CO = 0.5, according to Figure 6. On the other hand, it can also be stated that concentration curves have similar tendencies, at the inlet point (R = 1), which means that the inlet, specific mass transfer rate should also be close to each other. Accordingly, the two operating modes show practically negligible difference, considering the inlet mass transfer rate and the conversion grade, when values of vmax/CO are larger than about 0.5. This limiting value may be changed with further increase of the convective flow.
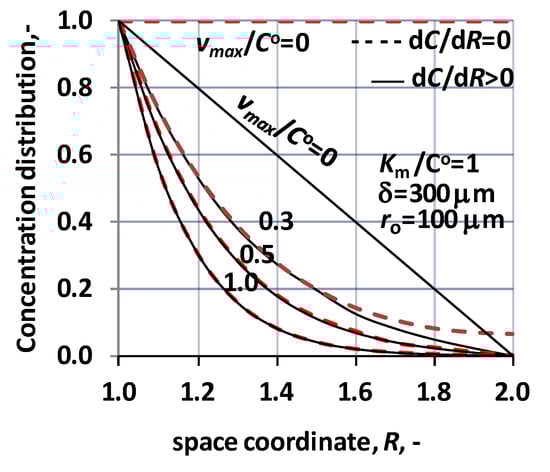
Figure 6.
Concentration distribution as a function of space coordinate, applying the two operating modes, i.e., transport without sweeping phase (broken lines) and transport with sweeping phase (continuous lines). ((N = 1000); δ = 300 μm ro = 100 μm; KM/CO = 1; D = 1.9 × 10⁻⁹ m2/s; Peo = 2).
As the diffusive flow also exists here, the physical mass transfer rate also will be larger than zero, thus the transport rate in presence of biochemical reaction can be normalized by its value. Accordingly, one can get more clear “build” on the effect of the biochemical reaction. The diffusive transport (without convective velocity, Peo = 0; see the first two terms of the left hand side of Equation (2)) of the reactant(s) component across a cylindrical membrane, can be solved analytically (see, e.g., []). Thus, the specific mass transfer rate can be expressed, as a function of the space coordinate, as:
where
According to Equation (28), it can clearly be seen that the specific mass transfer rate gradually decreases as a function of the increase of the biocatalytic membrane thickness (this decrease corresponds to the change of the cylindrical surface’s increase according to the value of R) and, on the other hand, its value increases with the decrease of the lumen radius. According to Equation (28), the inlet mass transfer rate will be (R = 1) as:
Taking into account the strong similarity in the concentration distributions and thus, the inlet mass transfer rate and because these transfer was discussed in details in Section 4.1, this transport mode will be illustrated here by two figures, only.
Effect of the Lumen Radius and the Reactor Thickness on the Enhancement
The effect of the biochemical reaction rate, at different values of the lumen radius, is illustrated in Figure 7, at δ = 300 μm; KM/CO = 1; D = 1.9 × 10⁻⁹ m2/s, Peo = 0. The predicted values were obtained without convective velocity across the catalytic membrane layer. The significant increase of the normalized reaction rate is the consequence of effect of biochemical reaction rate, at a given value of the lumen radius. Let us look at the value of the reaction modulus at, e.g., ro = 100 μm and vmax/CO = 10. For that case the reaction modulus, , is equal to 10 (). Enhancement should be identical with the value of the reaction modulus at this reaction modulus. The actual value of enhancement in Figure 7 is close to 5, which indicates that the specific physical mass transfer rate is much higher at this lumen radius and it reduces the effect of the reaction rate on the mass transfer rates. On the other hand, the thickness also strongly affects the enhancement at a given lumen radius. This is the consequence of the increasing reaction volume and the fact that the physical specific mass transfer rate also decreases with the increase of the delta (see Equation (30)).
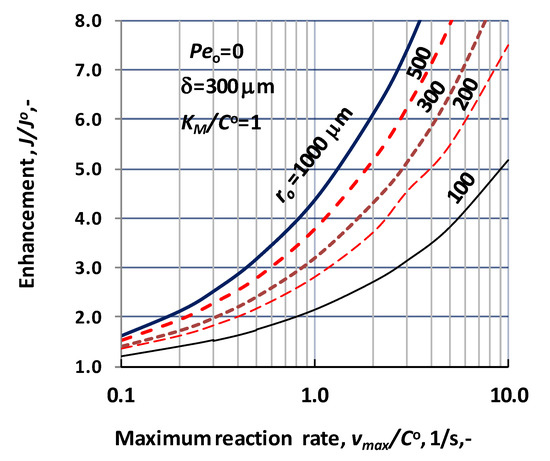
Figure 7.
Enhancement as a function of the bioreaction rate, i.e., vmax/CO, at different values of the lumen radius, applying sweeping phase on the permeate side of the biocatalytic membrane reactor, dC/dR > 0 at R = Rm (N = 1000; δ = 300 μm; KM/CO = 1; D = 1.9 × 10⁻⁹ m2/s).
The effect of the biocatalytic membrane thickness is illustrated as a function of the vmax/CO by Figure 8, at values of ro = 100 μm; KM/CO = 1; D = 1.9 × 10⁻⁹ m2/s; Peo = 0. The increase of the enhancement is also the consequence of the biochemical reaction, at a given value of the membrane thickness, δ and lumen radius. Increasing value of the reactor volume lowers the physical mass transfer rate and increases the effect of the reaction and both effects raise the values of the enhancement. The effect of the reactor thickness differs from that obtained for operating mode without sweeping phase (Figure 4a). This can be the results of the different values of the reference expression used for normalization of the mass transfer rate. This may be the consequence that the thickness of the catalytic membrane reactor does not be involved in the reference expression used for normalization of the mass transfer rate (Equation (30)).
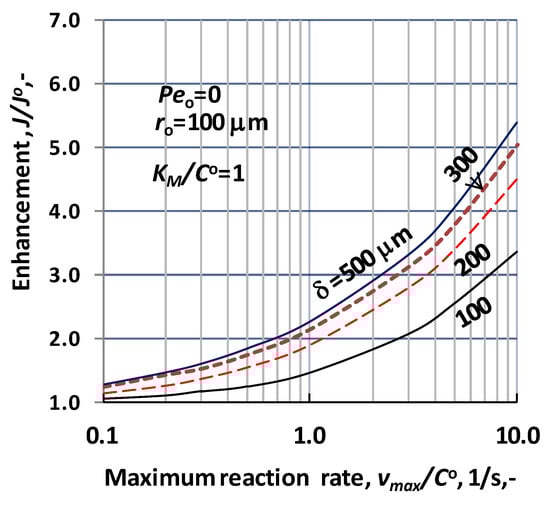
Figure 8.
Enhancement as a function of the reaction rate, vmax/CO, at different values of the biocatalytic membrane thickness, applying sweeping phase on the permeate side of the biocatalytic membrane reactor, dC/dR > 0 at R = Rm (N = 1000; ro = 100 μm; KM/CO = 1; D = 1.9 × 10⁻⁹ m2/s, Peo = 0; JO = D/ro).
Summarizing, results discussed in this study it is clearly shown, that the lumen radius strongly affects the performance of the biocatalytic membrane reactor. Its decrease significantly increases the specific mass transfer rate and with that it lowers the effect of the biochemical reaction. This bioreactor/reactor is really a promising and efficient reactor type, which simultaneously can realize two important processes of chemical technologies, i.e., the reaction and separation.
4.3. A Practical Example for Showing the Important Effect of the Lumen Radius and the Péclet Number
The hydrolysis of oleuropein as substrate of the olive mill wastewater, in substrate concentration range of 2 to 80 mol/m3, was investigated by authors []. The kinetic parameters of the Michaelis–Menten kinetics with substrate inhibition, catalyzed by β-glucosidase enzyme, were determined using mixed tank reactor and membrane bioreactor. The values of the Michaelis–Menten parameters obtained for the maximum reaction rate, the Michaelis–Menten constant as well as the substrate diffusion coefficient, are, respectively as: vmax = 0.081 mol/m3 s; km = 3.1 mol/m3, D = 3.7 × 10⁻¹⁰ m2/s [].
The measured and the calculated data, listed in Table 1, are in good agreement proving the correctness of the model used for calculation []. This biochemical reaction is chosen, as practical example, for showing the important role of the cylindrical radius and the convective flow, proving the significance of the results of the presented mass transfer model. Accordingly, the presented and for cylindrical space extended model developed for biocatalytic, capillary membrane layer, enables the user to apply it for description of the fluid phase substrate transport as a boundary value for the fluid-membrane interface in its differential mass balance equation. Thus, knowing the inlet and outlet mass transfer rates of the biocatalytic membrane layer, the transport in the fluid phases, in the lumen and the shell sides, can be calculated independently. In the following, the essential effect of both the lumen radius and the Péclet number will be shown, for the case without sweeping phase on the permeate side due to its major importance for biocatalytic membrane reactors. Accordingly, there is no concentration gradient throughout the biocatalytic membrane layer without biochemical reaction.

Table 1.
Relative concentration as a function of the Péclet number in biocatalytic plane-sheet membrane reactor during hydrolysis of oleuropein [] (CO = 2.5 mol/m3. KM = 3.8 mM; vmax = 0.081 mol/m3s; δ = 3 35 μm; D = 3.7 × 10⁻¹⁰ m2/s).
4.3.1. The Effect of the Lumen Radius
The mass transfer rate through a cylindrical membrane depends strongly on the function of the radius, due to the varying space volume, which is increasing in case of mass transport from the lumen side. It is assumed that the dense layer is located on the shell side of the cylindrical membrane layer. The inlet physical mass transfer rate of a membrane layer can be expressed as (Equation (29)). Accordingly, value of J decreases by factor of 4.5, when values of δ/ro increase between 2 and 10 (e.g., 200 μm; ro = 100–1000 μm). The presented model enables the user to predict the effect of the lumen radius, in presence of chemical/biochemical reaction, which can be remarkable depending on the radius and membrane thickness, on the reaction rate. These are shown in the next three figures. Figure 9 illustrates the enhancement of the inlet mass transfer rate, at constant biocatalytic membrane thickness, δ = 700 μm and at four different substrate concentrations between 2 and 40 mol/m3 (2–40 mM), without convective flow (Peo = 0), as a function of the lumen radius of the capillary membrane. (Note, here the mass transfer rate is related to that obtained at ro = 1000 μm, since J = 0 without reaction in the case discussed here; its value changed between 2.99 × 10⁻⁶ to 1.52 × 10⁻⁶ mol/m2s with the increase of CO). As can be seen, the change of the enhancement varies between about 1 to 2.6, at CO = 2 mM and 1 to 3.4 at CO = 40 mM, when the lumen radius varies between 100 and 1000 μm, though the biochemical reaction also affects the mass transfer rate. On the other hand, it can also be seen that the mass transfer rate increases in increasing manner with the decrease of the radius. The main change in it occurs between 100 μm and 400 μm. At its higher values, the effect of the cylindrical space gradually decreases. The lumen radius of the industrial capillary membranes are generally low; it changes mostly between about 100–300 μm. Exactly this size is very sensitive on the value of capillary radius.
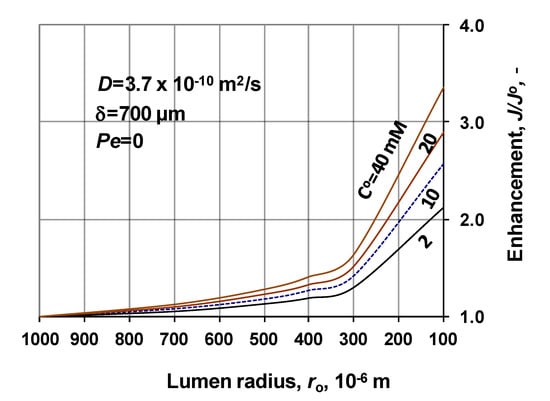
Figure 9.
Enhancement as a function of the membrane radius, at different values of the inlet substrate concentration (D = 3.7 × 10⁻¹⁰ m2/s; δ = 700 μm; Peo = 0; N = 1000).
The inlet, specific mass transfer rate and the conversion are shown as function of the membrane inlet radius, at different values of the Peo-number in Figure 10. This figure more clearly illustrates the significant effect of the lumen radius, on the inlet mass transfer rate. The increasing mass transfer rate, with the decrease of radius, is the consequence of the higher cylindrical effect, at lower value of radius. On the other hand, the transfer rate decreases with the increase of the Peo-number. The effect of convective velocity on the mass transfer rate is at least twofold: partly increases the concentration and with it the reaction rate and partly decreases the residence time and with it the effect of the reaction. Here due to the relatively low bioreaction rate, the effect of the shorter residence time dominates. The conversion is also plotted in this figure. Tendency of the conversion curves (broken lines) is in harmony with the mass transfer rates’ data. X values strongly increase with the increase of the lumen radius, suggesting the lower values of the inlet transfer rate causing smaller concentration values throughout the biocatalytic membrane layer.
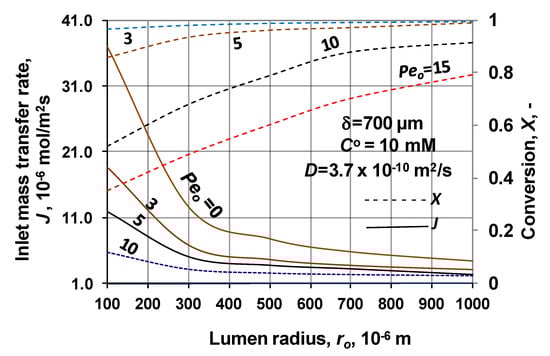
Figure 10.
Inlet mass transfer rate and the conversion as a function of the lumen radius, at different values of the membrane Peo-number. (D = 3.7 × 10⁻¹⁰ m2/s; δ = 700 μm; CO = 10 mM; N = 1000).
Another important parameter of the biocatalytic membrane reactor is the specific performance of the membrane reactor, namely the specific reacted amount of substrate. Figure 11 shows the change of its relative values as a function of the Peo-number, at different values of the membrane radius. The specific value of the reacted amount was calculated by Equation (31) (in unit of measure: mol/m3 s). The actual reacted amount is related to that obtained without convective velocity, i.e., at Peo = 0. Value of the specific reacted amount increases with the increase of the Peo-number, at given value of ro. The higher values of the reacted amount, at lower lumen radius are the consequence of the fact that the higher mass transfer rate involves higher substrate concentration, in that the effect of the bioreaction is stronger.
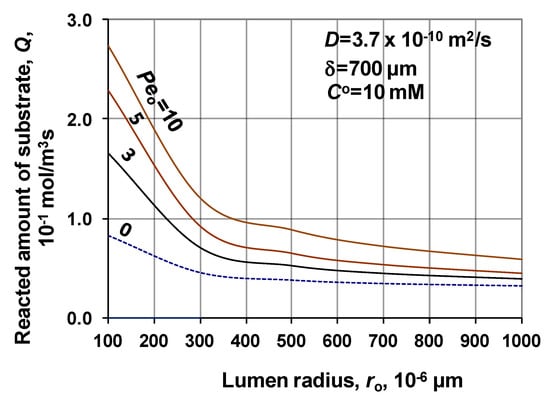
Figure 11.
Reacted amount of substrate in the biocatalytic membrane layer as a function of the membrane radius, at different values of Peo (D = 3.7 × 10⁻¹⁰ m2/s; δ = 700 μm; CO = 10 mM; N = 1000).
The effect of the membrane radius is results of more factors. It can be stated that its effect on the mass transport can be significant and thus it must not be taken out of consideration. This is especially true in case of capillary membranes, where the cylindrical space can essentially affect the chemical/biochemical reaction at low values of the biocatalytic membrane layer.
4.3.2. The Effect of the Péclet Number (Peo)
The effect of Peo, on the conversion, is discussed in Section 4.1, by Figure 5, at different values of the maximum reaction rate. Two additional figures show its effect on the mass transport, using measured kinetic data, in this section. Change of the specific reacted amount is plotted, at different values of the membrane radius, in Figure 12. The absolute values of the Qo varies between 0.032 and 0.082 mol/m3 s with lowering values of the membrane radius, at ro, range of 100 and 1000 μm, at Peo = 0. Values of Q/Qo strongly increase as a function of Peo. This variation is caused by the elevated concentration due to the higher convective velocity. On the other hand, Q/Qo shows a decreasing tendency with increasing ro values. This behavior can be caused by the lower inlet mass transfer rate and due to it by the lower substrate concentration throughout the catalytic membrane layer, due to the higher conversion. This is well illustrated in Figure 10.
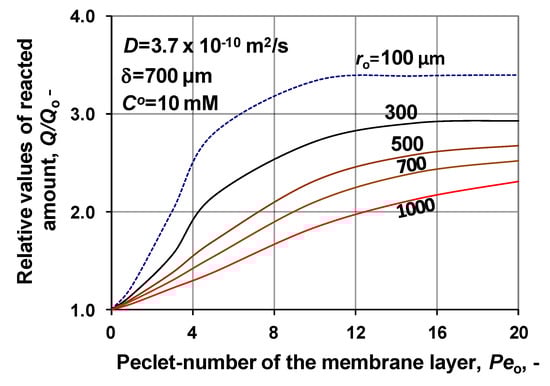
Figure 12.
Specific reacted amount of substrate as a function of the inlet Péclet number, at various numbers of membrane inlet radius; Qo belongs its value without convective flow, at Peo = 0. (D = 3.7 × 10⁻¹⁰ m2/s; δ = 700 μm; CO= 10 mM; N = 1000).
The reacted specific amount of substrate is plotted as a function of the membrane reactor thickness at different values of the Peo, with constant membrane radius, ro = 100 μm as well as inlet substrate concentration, CO = 10 mM, in Figure 13. At a low Péclet number, the Q value monotonously lowers, since at higher Peo, the curves have maximum and after which the Q gradually decreases. Here also valid the so-called double effect, namely the Peo increases the concentration, while the biocatalytic membrane layer decreases it. It may be clear for the user, studying the results presented that the correct choice of the membrane thickness depends on several parameters as the reaction rate, membrane radius, applied transmembrane pressure difference, diffusion coefficient, This model can help the user to predict the membrane performance depending on the operating conditions as well as on the membrane transport properties.
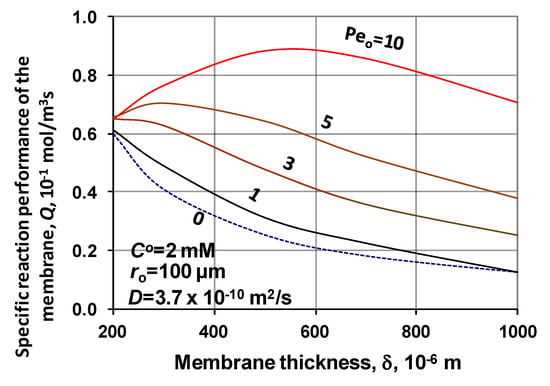
Figure 13.
Specific reacted amount of substrate in the biocatalytic membrane layer as a function of the membrane reactor thickness, with parameter of the Peo-number (D = 3.7 × 10⁻¹⁰ m2/s; ro = 100 μm; CO = 2 mM; N = 1000).
5. Conclusions
This study serves as an approach solution of the biochemical reaction process for improving reactor performance, realized in a capillary biocatalytic membrane reactor, which also uses convective velocity. The second-order differential equation with non-linear reaction term (Michaelis–Menten kinetic equation) was solved, after its linearization, containing constant transport and reaction kinetic parameters, by analytical methods. Two operating modes are discussed, namely process without sweeping and with sweeping phase. Results obtained by freely chosen typical and measured parameter values unambiguously show that not only the biochemical reaction rate and the thickness of the biocatalytic membrane reactor, but the lumen radius can essentially affect the reaction rate and accordingly the conversion and the membrane reactor performance. Increasing lumen radius decreases the specific mass transfer rate, thus increases the normalized values of the enhancement. For example, in order to reach a 100% conversion at the outlet surface of the reactor using practically the total reactor volume, a careful prediction of transport of a given biochemical/chemical reaction is needed. For this, it is indispensable the correct description of the reaction kinetics and the reactant’s transport rates are needed. On the other hand, the application of measured reaction kinetic parameters of an enzyme catalyzed reaction, using flowthrough biocatalytic membrane reactor clearly shows the importance of defining the diffusive plus convective flow in the mass transfer rate equation given across cylindrical membrane reactor. This makes possible the direct prediction of the membrane reactor performance as well as the combined effect of the convective flow, the cylindrical space and the bioreaction rate. The mathematical model developed defines the substrate transport expressions in closed, explicit forms, which enable the user the direct analysis of the transport behavior of a capillary, biocatalytic membrane reactor applying transmembrane pressure. These expressions can then be input in the differential mass balance equation of the fluid lumen and shell phases as boundary values at R = 1 and R = Rm.
Author Contributions
E.N.: evaluation, model development, writing the study; I.H.: visualization of the results. All authors have read and agreed to the published version of the manuscript.
Funding
This research was funded by the Hungarian National Development Agency grants OTKA K 116727 and NKFIH-1158/2019.
Acknowledgments
The Hungarian National Development Agency, grants OTKA K 116727 and NKFIH-1158-6/2019, is gratefully acknowledged for the financial support.
Conflicts of Interest
The authors declare no conflict of interest.
Abbreviations
| C | Concentration in the membrane layer, kg/m3, mol/m3 |
| CO | Inlet substrate concentration, kg/m3, mol/m3 |
| Cm | Outlet reactant concentration, kg/m3, mol/m3 |
| D | Diffusion coefficient, m2/s |
| E | Enhancement |
| Ha | Hatta number () |
| J | Inlet mass transfer rate, kg/m2 s, mol/m2 s |
| JO | Mass transfer rate without biochemical reaction, kg/m2 s, mol/m2 s |
| km | Michaelis–Menten constant, kg/m3, mol/m3 |
| N | Number of sublayers, (N = 1000) |
| Peo | The inlet Péclet number, (=voro/d) |
| Q | Reacted amount of substrate in a volume unit of catalytic membrane, mol/m3 s |
| Qo | Reacted amount of substrate related to membrane volume at Peo = 0, mol/m3 s |
| r | Radial coordinate, m |
| ro | Lumen radius (cylindrical membrane inlet radius), m |
| rm | =Ro + δ, m |
| R | Dimensionless local coordinate, (r = r/ro) |
| Average transport radius, m | |
| S | Parameter of solution of a 2nd order differential equation, kg/m3, mol/m3 |
| T | Parameter of solution of a 2nd order differential equation, kg/m3, mol/m3 |
| vo | Inlet convective velocity, m/s |
| vmax | Maximum reaction rate, kg/m2 s, mol/m2 s |
| X | Conversion |
| Greek Letters | |
| δ | Biocatalytic membrane thickness, m |
| ϑ | Reaction modulus |
| Superscript | |
| o | Bulk and interface; physical |
| Subscript | |
| i | ith sublayer |
| m | Outlet |
Appendix A. Expressions for Calculation of the T1 and S1 Value
(A) Operating mode without sweeping phase on the permeate side
The better understanding the expressions of often used parameters of the solution are as (i = 1, …, N):
Expressions for the case when there is no sweeping phase on the permeate side, dC/Dr = 0 at R = Rm, are as follows: Values of different parameters for calculation of the T1 and S1 are listed below:
The initial values of and (j = T,S,0) are as:
Values of Ai (i = 1, …, N − 1) and Bi (i = 2, …, N − 1) are as:
Values of AN and BN are deviating from each other in the two operating modes, i.e., using or not sweeping phase, due to the fact that the outlet boundary conditions are diverse ones. Their values are as:
The value of Ai, (i = 1,..,N) and Bi (with i = 2, …, N − 1) as well as (with j = T,S,0 and i = 1, …, N − 1) and (with j = T,S,0 and i = 1, …, N) are listed above. Important to note, the calculation of the and values for i = 1 to N − 1 (or i = 1, …, N in case of ) needs very accurate calculation process. Every, calculated variables should be given or calculated, even, e.g., also the value of ∆R (=δ/(roN) with very accurately. Each steps of the calculation was carried out by the QuickBASIC computer program with accuracy of 14 decimals. This is the maximal accuracy by this program. To get the concentration distribution, the values of Ti and/or Si, with i = 2,…, N should be determined (the N value was chosen to be 1000; note that in reality it is enough to predict either T1 or S1 because if we know one of these two parameters the other one can be obtained from the boundary condition given for the inlet surface, namely for R = 1: ). We, however, for checking the correctness of our computer program, both the T1 and S1 values were calculated. (The predicted value of the inlet concentration, CO = 1, has been got back by 0.9999999 accuracy).
The predicted values of the T1 and S1 parameters, using the above expressions are as:
(B) Operation mode with sweeping phase on the permeate side, dC/Dr > 0 at R = Rm
As it already was mentioned, the two operating modes differ from each other in the outlet boundary condition only, as it was given by Equations (20) and (21). For this case, the second one is valid. Accordingly, the values of AN and BN will be for that case, as follows:
Other parameters are the same as for the case without sweeping phase on the permeate side. It is obvious that the real values of the parameters can differ from each other, in the two operation modes, though we used the same notations. Starting values of the T1 and S1 parameters are as:
Appendix B. Prediction of the Ti and Si values (i = 2, …, N)
In order to get the necessary information on the mass transport process, thus the concentration distribution across the whole biocatalytic membrane layer, the mass transfer rates in every single sublayer should be predicted. As it was mentioned, the internal boundary conditions will be used to it. This can be carried out from sublayer to sublayer. In principle, the determinant can also be applied, but its application, for it, is somewhat more complicated. Taking into account the equalities of the neighboring concentrations and the mass transfer rates on the internal membrane surface, one can get the following expressions for calculation of the Ti and Si values for the next sublayer (Ji−1 is the outlet specific mass transfer rate at the outlet internal surface of the (i − 1)th sublayer, i.e., at:
and:
The Ci−1 means the solute concentration of the (i − 1)th sublayer at R = Ri−1. Knowing the T1 and S1 values then values of Ti and Si (i = 2, …, N) can easily be calculated by expressions (A12) and (A13).
References
- Marcano, J.G.S.; Tsotsis, T.T. Catalytic Membranes and Membrane Reactors; Wiley-VCH: Veinheim, Germany, 2002. [Google Scholar]
- Giorno, L.; Drioli, E. Biocatalytic membrane reactors: Applications and perspectives. Trends Biotechnol. 2000, 18, 339–349. [Google Scholar] [CrossRef]
- Giorno, L.; Mazzei, R.; Drioli, E. Biochemical membrane reactors in industrial processes. In Membrane Operations: Innovative Separations and Transformations; Wiley-VCH Verlag: Weinheim, Germany, 2009; pp. 397–409. [Google Scholar]
- Charcosset, C. Membrane processes in biotechnology: An overview. Biotechnol. Adv. 2006, 24, 482–492. [Google Scholar] [CrossRef]
- Rios, G.M.; Belleville, M.-P.; Paolucci-Jeanjean, D. Membrane engineering in biotechnology: Quo vamus? Trends Biotechnol. 2007, 25, 242–246. [Google Scholar] [CrossRef] [PubMed]
- Westermann, T.; Melin, T. Flow-through catalytic membrane reactors- Principles and applications. Chem. Eng. Process. 2012, 48, 17. [Google Scholar] [CrossRef]
- Asif, M.B.; Hai, F.I.; Jegatheesan, V.; Price, W.E.; Nghiem, L.D.; Yamamoto, K. Applications of membrane bioreactors in biotechnology processes. In Current Trends and Future Developments on (Bio-) Membranes; Elsevier Inc.: Amsterdam, The Netherlands, 2019. [Google Scholar]
- Seidel-Morgenstein, A. Membrane Reactors; Wiley-WCH: Weiheim, Germany, 2010. [Google Scholar]
- Brunetti, A.; Caravella, A.; Barbiella, G.; Drioli, E. Simulation study of water shift reaction in a membrane reactor. J. Membr. Sci. 2007, 306, 329–340. [Google Scholar] [CrossRef]
- Dittmeyer, R.; Avajda, K.; Reif, M. A review of catalytic membrane layers for gas/liquid reactions. Top. Catal. 2004, 29, 3–27. [Google Scholar] [CrossRef]
- McLearely, E.E.; Jancen, J.C.; Kapteijn, F. Zeolite based films, membranes and membrane reactors. Progress and prospects. Microporous Mesoporous Mater. 2006, 90, 198–220. [Google Scholar] [CrossRef]
- Catalano, J.; Baschetti, M.G.; Sarti, G.C. Influence of the gas phase resistance on hydrogen flux through thin palladium–silver membranes. J. Membr. Sci. 2009, 339, 57–67. [Google Scholar] [CrossRef]
- Lüdtke, O.; Behling, R.-D.; Ohlrogge, K. Concentration polarization in gas permeation. J. Membr. Sci. 1998, 146, 145–157. [Google Scholar] [CrossRef]
- He, G.; Mi, Y.; Yue, P.L.; Chen, G. Theoretical study on concentration polarization in gas separation membrane processes. J. Membr. Sci. 1999, 153, 243–258. [Google Scholar] [CrossRef]
- Murmura, M.A.; Cerbelli, S.; Annesini, M.C. An equilibrium theory for catalytic steam reforming in membrane reactors. Chem. Eng. Sci. 2017, 160, 291–303. [Google Scholar] [CrossRef]
- Murmura, M.A.; Cerbelli, S.; Annesini, M.; Sheintuch, M. Derivation of an enhanced Sherwood number accounting for reaction rate in membrane reactors. Steam reforming of methane as case study. Catal. Today 2020. [Google Scholar] [CrossRef]
- Nagy, E. Mass transfer rate through a convection flow catalytic membrane layer with dispersed nanometer-sized catalyst. Ind. Eng. Chem. Res. 2010, 49, 1057–1062. [Google Scholar] [CrossRef]
- Chakraborty, S.; Rusli, H.; Nath, A.; Sikder, J.; Bhattacharjee, C.; Curcio, S.; Drioli, E. Immobilized biocatalytic process development and potential application in membrane separation: A review. Crit. Rev. Biotechnol. 2016, 36, 43–48. [Google Scholar] [CrossRef] [PubMed]
- Chapman, J.; Ismail, A.E.; Dinu, C.Z. Industrial applications of enzymes: Recent advances, techniques, and outlooks. Catalysts 2018, 8, 238. [Google Scholar] [CrossRef]
- Irfan, M.; Ghazanfar, M.; Ur Rehman, A.; Asma, S. Approaches to Enhance Industrial Production of Fungal Cellulases. In Approaches to Enhance Industrial Production of Fungal Cellulases; Srivastava, M., Srivastava, N., Ramteke, P.W., Mishra, P.K., Eds.; Springer: Cham, Switzerland, 2019; pp. 37–52. [Google Scholar]
- Jing, Y.; Guo, Y.; Xia, Q.; Liu, X.; Wang, Y. Catalytic Production of Value-Added Chemicals and Liquid Fuels from Lignocellulose Biomass. Chem 2019, 5, 2520–2546. [Google Scholar] [CrossRef]
- Mazzei, R.; Piacentini, E.; Gebreyohannes, A.; Giorno, L. Membrane Bioreactors in Food, Pharmaceutical and Biofuel Applications: State of the Art, Progresses and Perspectives. Curr. Org. Chem. 2017, 21, 1671–1701. [Google Scholar] [CrossRef]
- Zhou, M.; Ju, X.; Li, L.; Yan, L.; Xu, X.; Chen, J. Immobilization of cellulase in the non-natural ionic liquid environments to enhance cellulase activity and functional stability. Appl. Microbiol. Biotechnol. 2019, 103, 2483–2492. [Google Scholar] [CrossRef]
- Nagy, E.; Dudás, J.; Mazzei, R.; Giorno, L. Description of the diffusive-convective mass transport in a hollow-fiber biphasic biocatalytic membrane reactor. J. Membr. Sci. 2015, 482, 144–157. [Google Scholar] [CrossRef]
- Calabro, V.; Curcio, S.; Iorio, G. A theoretical analysis of transport phenomena in a hollow fiber membrane bioreactor with immobilized biocatalysts. J. Membr. Sci. 2002, 206, 217–341. [Google Scholar] [CrossRef]
- Godongwana, B.; Solomons, D.; Sheldon, M.S. A finite-difference solution of solute transport through a membrane bioreactor. Mech. Probl. Eng. 2010, 215, 810843. [Google Scholar] [CrossRef]
- Bird, B.; Stewart, W.E.; Lightfoot, E.N. Transport Phenomena; Wiley & Sons: New York, NY, USA, 1960. [Google Scholar]
- Danckwerts, P.V. Gas-Liquid Reactions; McGraw-Hill: New York, NY, USA, 1970. [Google Scholar]
- Westerterp, K.R.; van Swaaj, W.P.M.; Beenackers, A.A.C.M. Chemical Reactor Design and Operation; Wiley and Sons: New York, NY, USA, 1984. [Google Scholar]
- Crank, J. The Mathematics of Diffusion, 2nd ed.; Clarendon Press: Oxford, UK, 1975. [Google Scholar]
- Mulder, M. Basic Principles of Membrane Technology, 2nd ed.; Kluwer Acad. Publisher: Amsterdam, The Netherlands, 1996. [Google Scholar]
- Baker, R.W. Membrane Technology and Application, 2nd ed.; John Wiley and Sons: Chichester, UK, 2004. [Google Scholar]
- Nagy, E. Basic Equation of Mass Transfer through a Membrane Layer; Elsevier: Amsterdam, The Netherlands, 2019. [Google Scholar]
- Nagy, E.; Kulcsar, E. Mass transport through biocatalytic membrane layer. Desalination 2009, 245, 422–436. [Google Scholar] [CrossRef]
- Nagy, E. Mass transfer through catalytic membrane layer. In Mass Transfer in Multiphase Systems and its Applications; El-Amin, A., Ed.; INTECH Open access Publisher: Rijeka, Croatia, 2011; pp. 677–716. [Google Scholar]
- Nagy, E. Convective and diffusive mass transport through anisotropic, cylindrical membrane layer. Chem. Eng. Process. Process. Intensif. 2010, 49, 716–721. [Google Scholar] [CrossRef]
- Nagy, E.; Lepossa, A.; Prettl, Z. Mass transfer through bio-catalytic membrane reactor. Ind. Eng. Chem. Res. 2012, 51, 1635–1646. [Google Scholar] [CrossRef]
- Nagy, E. Mass transport in biocatalytic membrane reactors. Chem. Eng. Trans. 2009, 17, 1047–1052. [Google Scholar]
- Perry, J. Chemical Engineers’ Handbook; McGraw Hill: Amsterdam, The Netherlands, 1968. [Google Scholar]
- O’Neil, P.V. Advanced Engineering Mathematics; Wadsworth Inc.: Belmont, CA, USA, 1987. [Google Scholar]
- Nagy, E. Mathematical modeling of biochemical membrane reactors. In Membrane Operations, Innovative Separation and Transformations; Drioli, E., Giorno, L., Eds.; Wiley-VCH Verlag: Weinheim, Germany, 2009; pp. 309–334. [Google Scholar]
- Nagy, E. Basic equations of mass transfer through biocatalytic membrane layer. Asia Pac. J. Chem. Eng. 2009, 21, 270–278. [Google Scholar] [CrossRef]
- Nagy, E. Survey on Biocatalytic Membrane Reactor and Membrane Aerated Biofilm Reactor. Org. Chem. 2017, 21, 1713–1724. [Google Scholar] [CrossRef]
- Nagy, E.; Vitai, M. Analysis of mass transport through anisotropic, catalytic/biocatalytic membrane reactors. Catalysts 2019, 9, 358. [Google Scholar] [CrossRef]
© 2020 by the authors. Licensee MDPI, Basel, Switzerland. This article is an open access article distributed under the terms and conditions of the Creative Commons Attribution (CC BY) license (http://creativecommons.org/licenses/by/4.0/).