1. Introduction
Cobalt carbide (Co
2C) and carbon-based materials have been usefully employed in diverse areas, such as chemical industry, energy industry, and environmental catalysts [
1,
2,
3,
4,
5,
6]. Co
2C has been extensively studied as a catalyst in photocatalytic hydrogen evolution [
1], Fischer–Tropsch synthesis [
7,
8,
9,
10,
11,
12], hydrogen storage [
13], water reduction electrocatalysis [
14], and CO
2 conversion [
15]. Guo et al. introduced metallic Co
2C as a cocatalyst for cadmium selenide (CdSe) quantum dots in hydrogen evolution reaction. They showed that when metallic Co
2C was coupled with CdSe quantum dots, the photocatalytic H
2 evolution activity increased to 18,000 μmol·g
−1·h
−1 (λ = 450 nm), which was 10 times more compared with that with bare CdSe [
1]. Dong et al. prepared active carbon-supported Co–Co
2C catalysts for Fischer–Tropsch synthesis and showed a high catalytic activity for the hydroformylation of 1-hexene at low pressure [
3]. Gao et al. showed that Co
3C nanoparticles (NPs), prepared by direct ball milling of Co and graphene, showed an electrochemical hydrogen storage capacity of 1415 mA·h·g
−1(5.176 wt% hydrogen) [
13]. Kawashima et al. employed carbon-coated Co–Co carbide (Co–Co
xC, Co
xC: Co
2C, and Co
3C) composites for electrochemical hydrogen evolution reaction (HER) and achieved an overpotential of 78 mV at a current density of 10 mA·cm
−2 and a Tafel slope of 87.8 mV·dec
−1 [
14]. Guo et al. used flowerlike Co
2C for the synthesis of cyclic carbonates by cycloaddition of CO
2 with epoxides and showed yields of up to 95% under solar light [
15].
For the enhancement of Co
2C catalytic performance, various factors have been considered. For electrochemical application such as HER, crystalline phase and electrical conductivity are major factors for improving catalytic activity [
1,
14], where an active facet enhances efficient interfacial charge transfer [
1]. For Co
2C nanoparticles in the Fischer–Tropsch synthesis of olefins, the activity and selectivity decreased as the particle size decreased from 7 nm [
8]. Above 7 nm, the performances were nearly constant irrespective of the particle size. It is known that the sensitivity and selectivity are dependent on the exposed crystal facets [
9,
11], which are also determined by particle size in the nanosize region [
8]. The catalytic activity was found to depend on the ratio of Co
2C to Co. Co
0/Co
2C(111) is known to have dual active sites: Co
0 for CO dissociation and chain propagation and Co
2C(111) for CO nondissociative activation and insertion [
11]. The relative composition and exposed crystal facets of Co
2C were found to depend on the reaction pressure; consequently, the syngas conversion performance was greatly influenced by the pressure [
11].
For the fabrication of Co and Co
2C, various synthesis methods include carburization [
4], pulsed-spray evaporation (using alcohols) chemical vapor deposition (CVD) method process [
16], pulsed plasma in liquid ethanol method [
17], laser-induced irradiation method [
18], polyol method and ball milling [
13], spark plasma sintering [
19], and laser ablation [
20]. A previous report showed that the solvent (e.g., methanol, ethanol, and n-propanol) and the substrate temperature (with a working temperature below 300 °C) determined the composition and crystallinity of Co and Co
2C. Co
2C can be prepared by the carburization of Co with CO for >400 h at 200 °C [
4]. Pola et al. prepared Co, Co
2C, and Co
3C nanograins embedded in the carbon matrix, such as hexagonal graphite, by the infrared laser-induced irradiation of Co under gaseous hydrocarbon (e.g., benzene and ethylene) atmosphere [
18]. Co carbide NPs, with a magnetic moment of 47 emu/g, were prepared by a modified polyol method at ~300 °C using Co acetate tetrahydrate, NaOH, and polyvinylpyrrolidone in tetraethylene glycol [
21]. Kamal et al. employed a spark plasma sintering method for the in situ decomposition of cobalt acetate, resulting in the formation of Co and Co
2C [
19]. Metallic Co and Co
2C phases were formed at 30 and 60 MPa, respectively, and a mixed phase was formed at 45 MPa [
19]. Zhang et al. showed that onionlike carbon-encapsulated Co
3C core/shells (~22 nm) could be prepared by the laser ablation of metallic Co in acetone [
20]. Hasin showed that a mixture of graphene oxide and Co
3O
4 under H
2–N
2 gas stream at 200 °C was converted to Co
2C with a crystallite size of around 5 nm [
22]. Motivated by the existing literature, it was demonstrated to find more efficient ways of preparing Co and Co
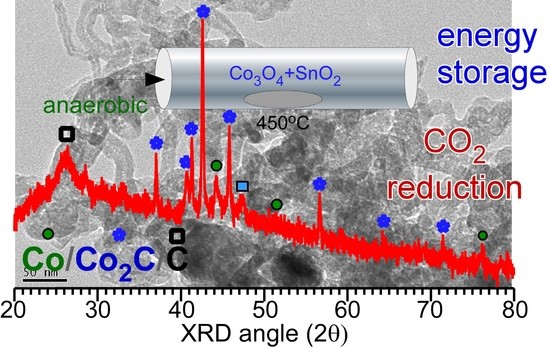
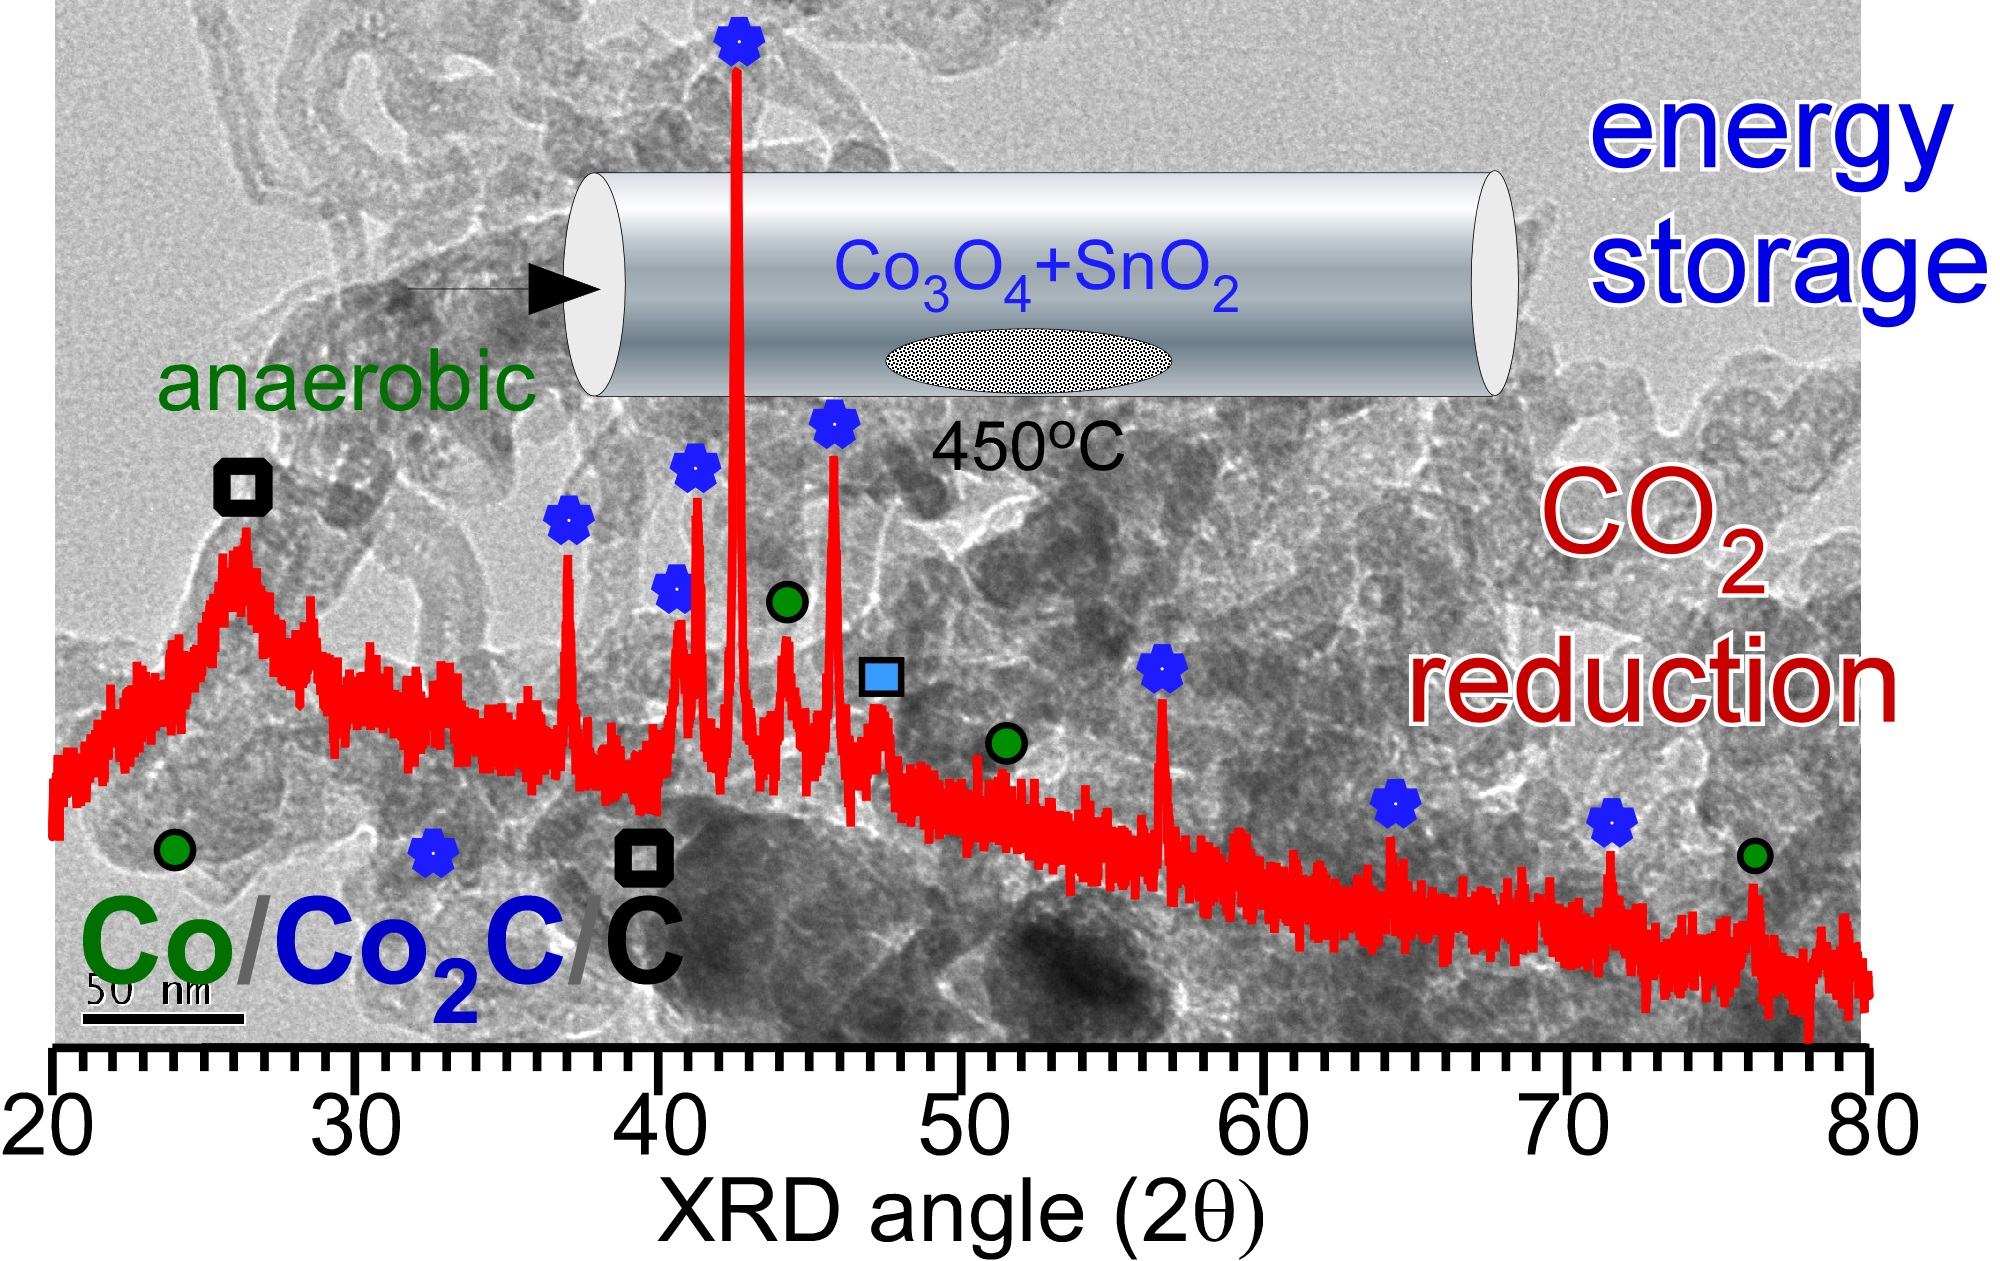
2C embedded in the carbon matrix; thus, an anaerobic ethanol oxidation reaction method was introduced. The advantage of using anaerobic ethanol oxidation reaction over other literature synthesis methods is that it is possible to make a bulk carbon fiber matrix where metal carbides are embedded. Therefore, a desirable high electrical conductivity can be achieved. In addition, Co/Co
2C ratio could be controlled by varying the amount of sacrificial SnO
2. It was found that the introduction of sacrificial SnO
2 was an important factor for the determination of the relative composition and formation of Co
2C. The newly developed method using ethanol as a carbon source could be further used to fabricate various metal carbide-based materials supported in the carbon matrix. Furthermore, in the present study, energy storage and CO
2 reduction tests were demonstrated to show their possible application in new areas.
2. Results and Discussion
Co/Co
2C/C hybrids were prepared by the ethanol oxidation reaction of Co
3O
4 NPs mixed with sacrificial SnO
2 under an anaerobic condition.
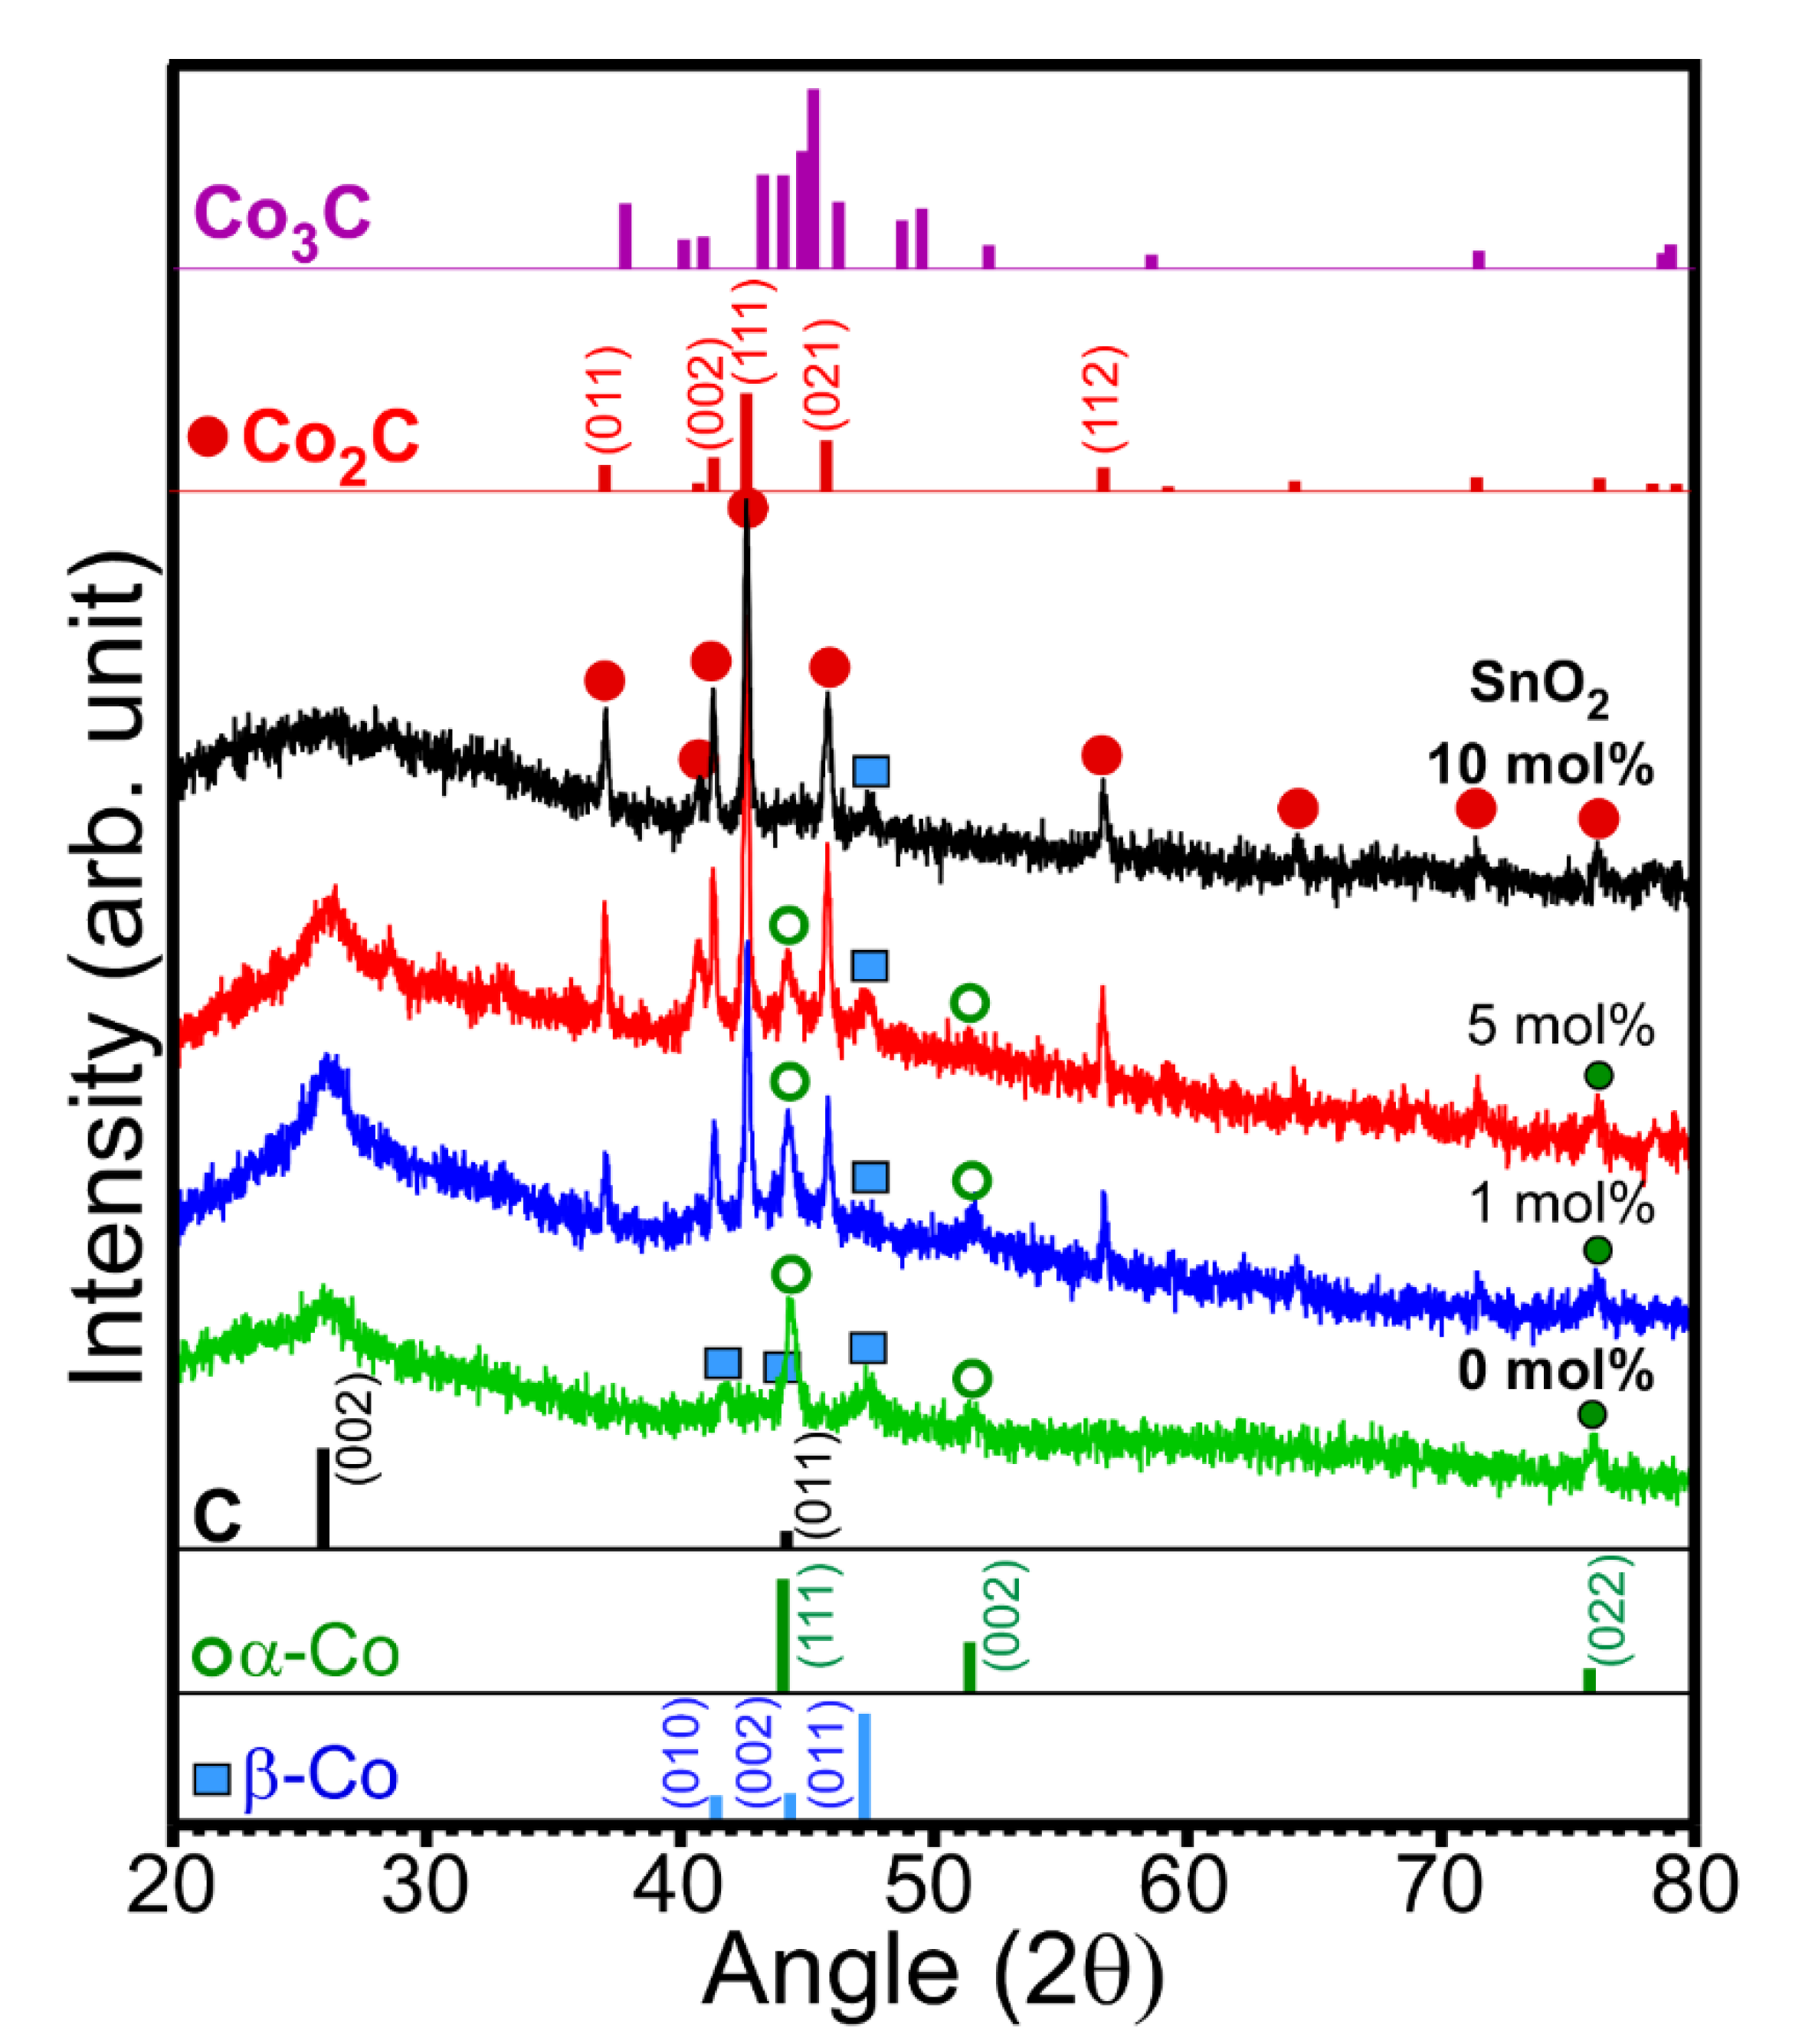
Figure 1 shows the XRD patterns of the prepared samples with different amounts of SnO
2. The XRD patterns show a drastic difference due to the difference in SnO
2 content. In the absence of SnO
2, peaks corresponding to two phases of metallic Co and carbon were observed in the XRD pattern. The peak at 2θ = 26.2° could be assigned to the (002) plane of graphite carbon (JCPDS 98-005-3781) [
2]. Thus, metallic Co adopts two different phases (■ and ο). The three peaks (
ο, open circle) at 2θ = 44.2°, 51.5°, and 75.9° were assigned to the (111), (002), and (022) planes of the cubic α-Co phase (Fm-3m, JCPDS 98-005-3805), respectively. The other three peaks (■, closed square) at 2θ = 41.6°, 44.3°, and 47.4° were assigned to the (010), (002), and (011) planes of the hexagonal β-Co phase (P63/mmc, JCPDS 98-004-4900), respectively [
3]. The corresponding standard XRD patterns for the α-Co and β-Co phases are also shown in
Figure 1. The peaks corresponding to Co
3O
4 were not observed due to a lack of oxygen supply during the reaction. The oxygen of Co
3O
4 appeared to be consumed for ethanol oxidation without addition of oxygen supply under an anaerobic condition. Therefore, no Co
3O
4 (undetectable by XRD) was observed, which is further discussed below. The addition of 1 mol% SnO
2 suppresses the formation of the hexagonal β-Co phase compared with that of the cubic α-Co phase. Interestingly, a new crystal phase was found. The new peaks (∙, closed circle) that appeared at 2θ = 37.0°, 41.3°, 42.6°, 45.7°, and 56.6° were assigned to the (011), (002), (111), (021), and (112) planes of orthorhombic cobalt carbide (Pmnn, JCPDS 1-072-1369), respectively [
1,
3,
4,
19]. The rough XRD quantification ratios of Co
2C/Co were 0, 0.8, 0.9, and 1 for the 0, 1, 5, and 10 mol% samples, respectively. Co
2C/Co ratio was increased as the amount of SnO
2 was increased. It appears that Sn acts as a catalyst material for the formation of Co
2C. However, the Co
3C phase was not observed, as can be seen in the reference patterns [
21]. For samples containing 10 mol% SnO
2, the XRD peaks were mostly due to the Co
2C phase and carbon. A small peak corresponding to the hexagonal β-Co phase was observed, but that corresponding to the α-Co phase was not observed. Moreover, the crystal phases of Sn and Sn oxide were also not observed, plausibly due to their low content and/or amorphous state [
23].
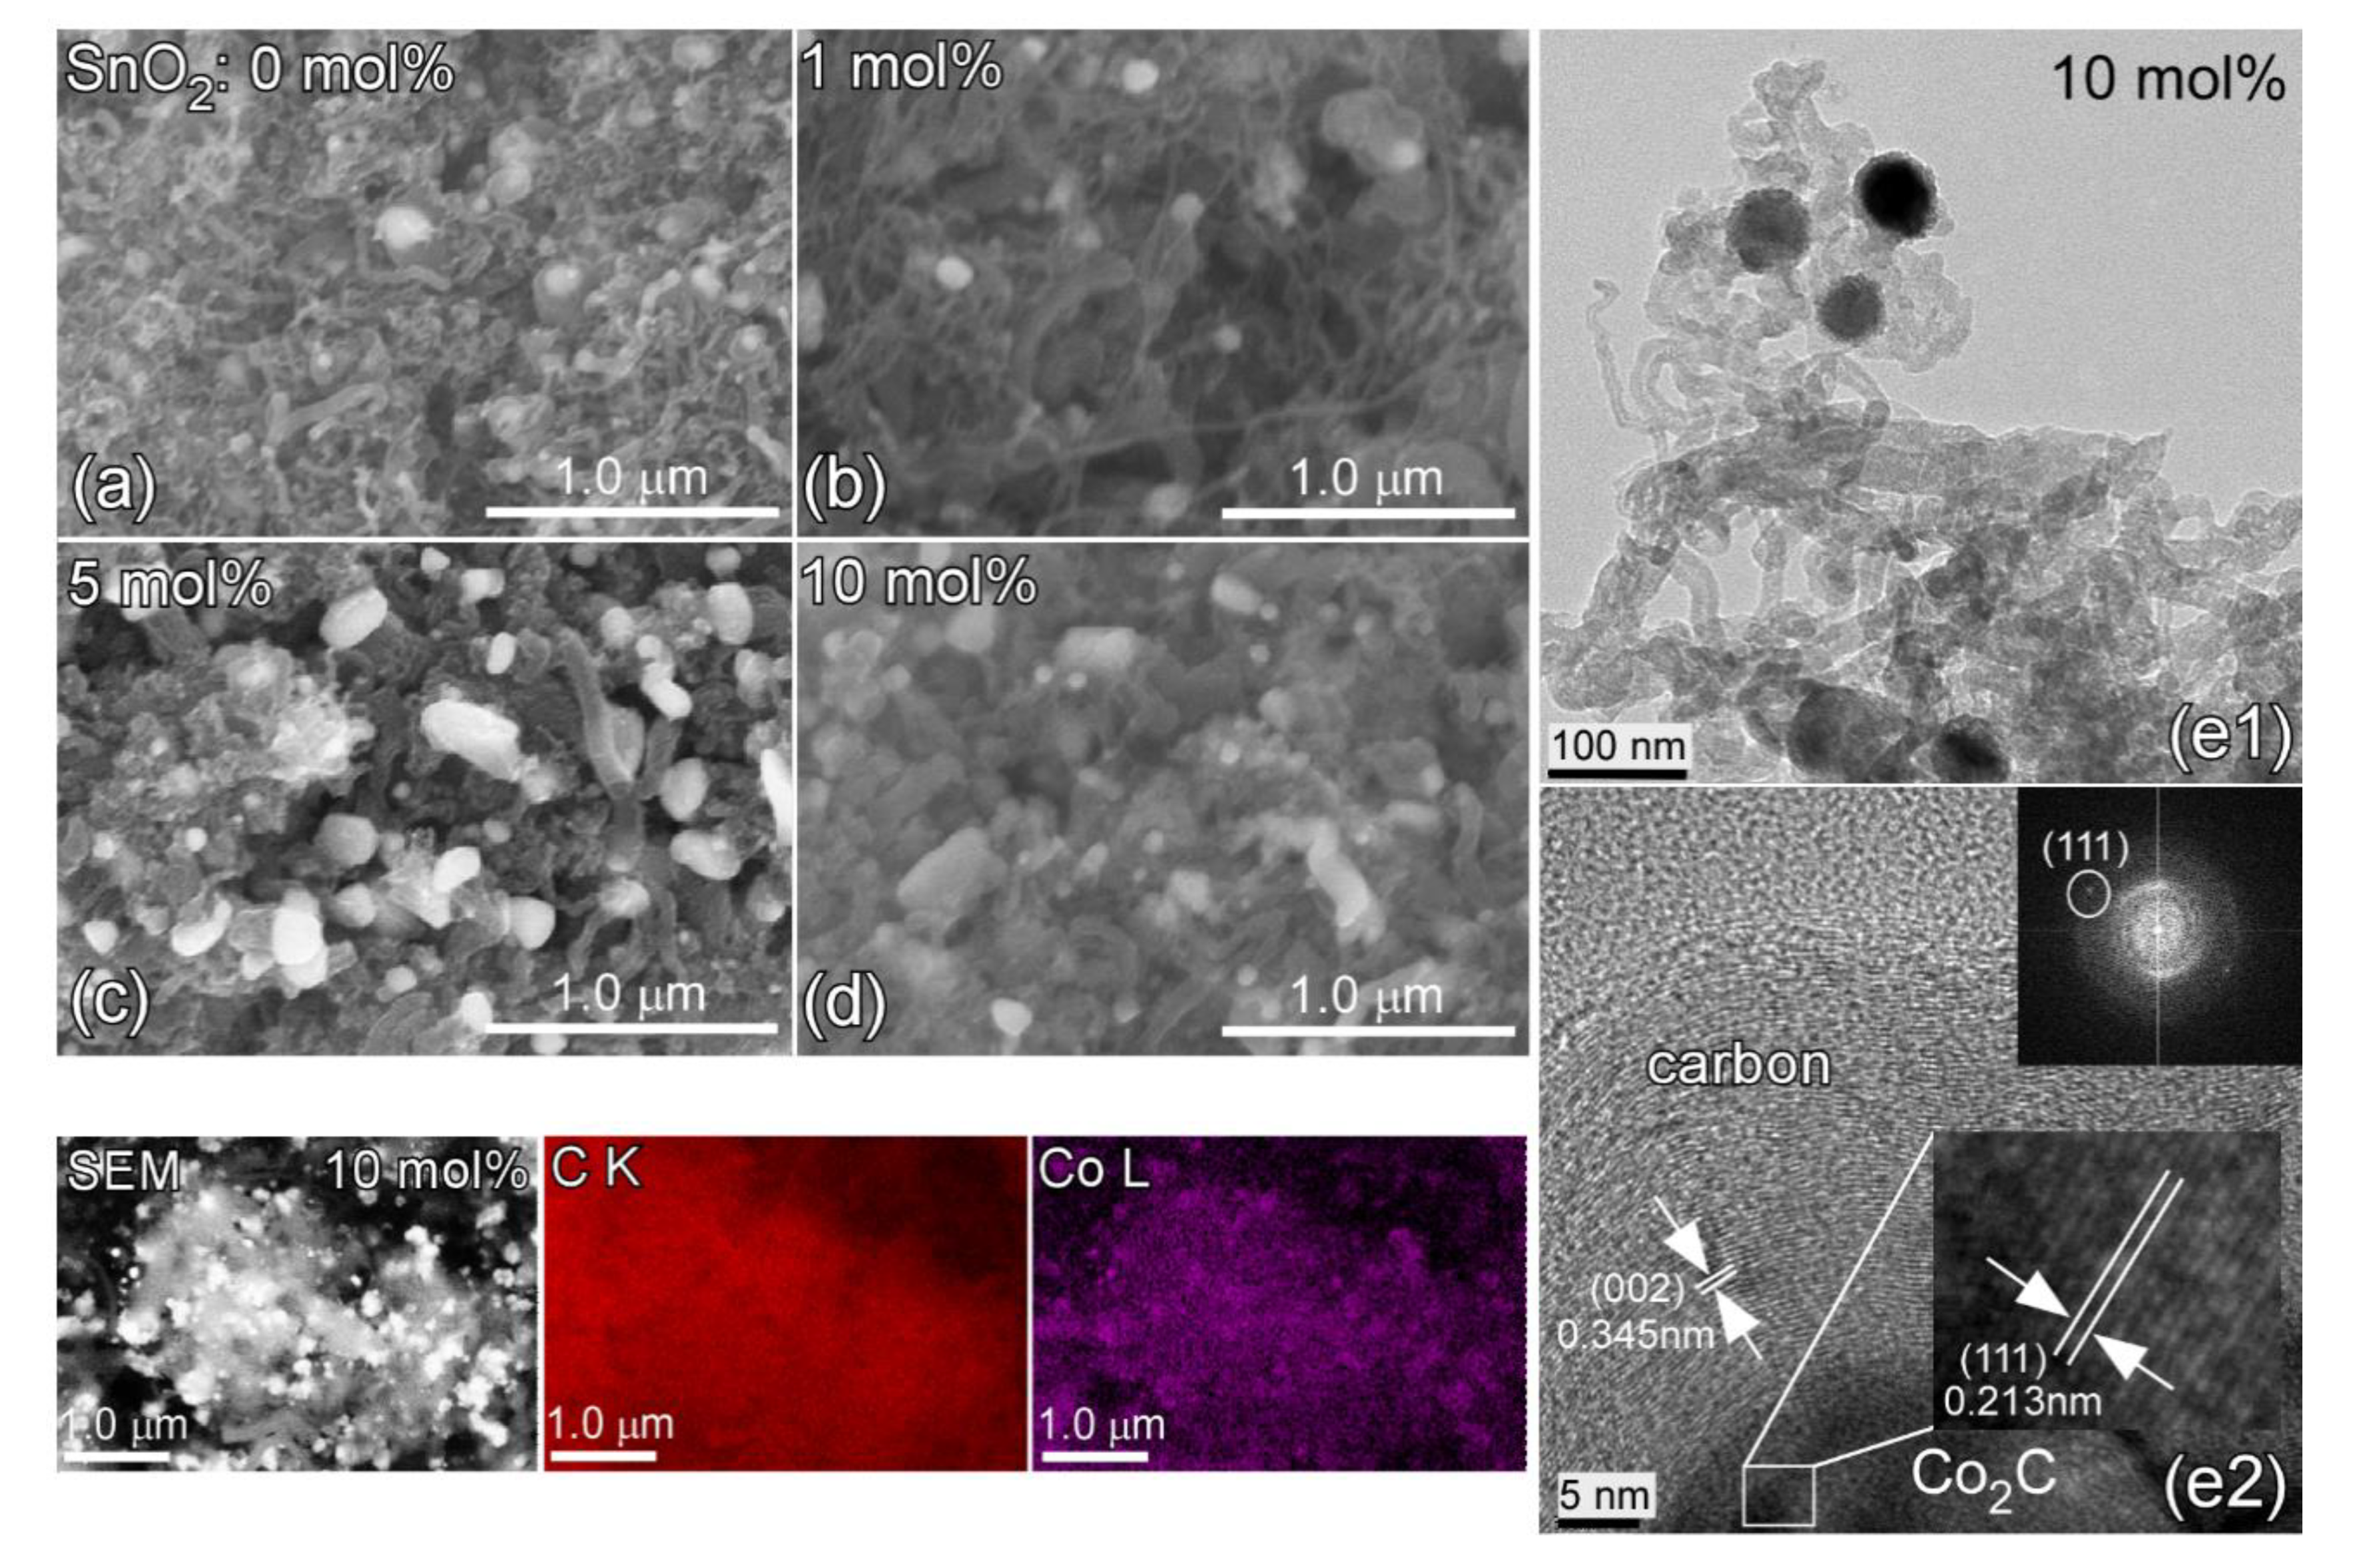
The morphology and the microstructure were examined by electron microscopy. The scanning electron microscope (SEM) images showed at least three different morphologies of the samples, such as fibers and large and small particles (shown in
Figure 2). The corresponding energy-dispersive X-ray (EDX) analysis spectra (not shown) showed the presence of the elements Co, C, and Sn [
1]. The Co/C ratio decreased with the amount of Sn. The EDX atomic C%/Co% values were roughly estimated to be 98.7%/1.3%, 98.3%/1.7%, 94.8%/2.7%, and 92.5%/7.2% for the samples prepared with 0, 1, 5, and 10 mol% of sacrificial SnO
2, respectively. All the samples were mainly carbon species. The amounts of Sn, from the EDX data, were barely (below 0.3%) detected for the samples prepared with 5 and 10 mol% of sacrificial SnO
2. This indicates that the sacrificial SnO
2 played an important role in the formation of Co
2C. X-ray photoelectron spectroscopy (XPS) quantification for the 10 mol% sample was also performed and is shown later below. Briefly, Sn was estimated to be <0.2%, relative to the carbon. EDX elemental (C K and Co L) mapping images were obtained to discriminate the particles with various shapes and sizes from others. Sn elemental mapping signal was not detected because of extremely small amount. For the two mapping images of Co and C, the Co mapping image resembles more the SEM image. On the basis of the mapping images, the particles were concluded to be mainly Co species irrespective of the shapes. The Co species were appeared to be supported on the carbon species. The transmission electron microscope (TEM) and high-resolution transmission electron microscope (HR-TEM) images of the sample with 10 mol% of SnO
2 showed particle and fibrous morphologies of the sample. The Co species were covered by carbon fibers. In the TEM image, the fiber appeared like a tube [
24]. For a particle, a clear lattice spacing of 0.213 nm corresponding to the (111) plane of orthorhombic Co
2C was observed [
3,
4,
18]. The corresponding fast Fourier transform (FFT) pattern showed the (111) crystal plane. In HR-TEM, the round-shaped (or onionlike) area appeared to have been formed due to the stacking of bent graphite sheets [
24]. A lattice spacing of 0.345 nm was a good match to the (002) plane of graphitic carbon [
25].
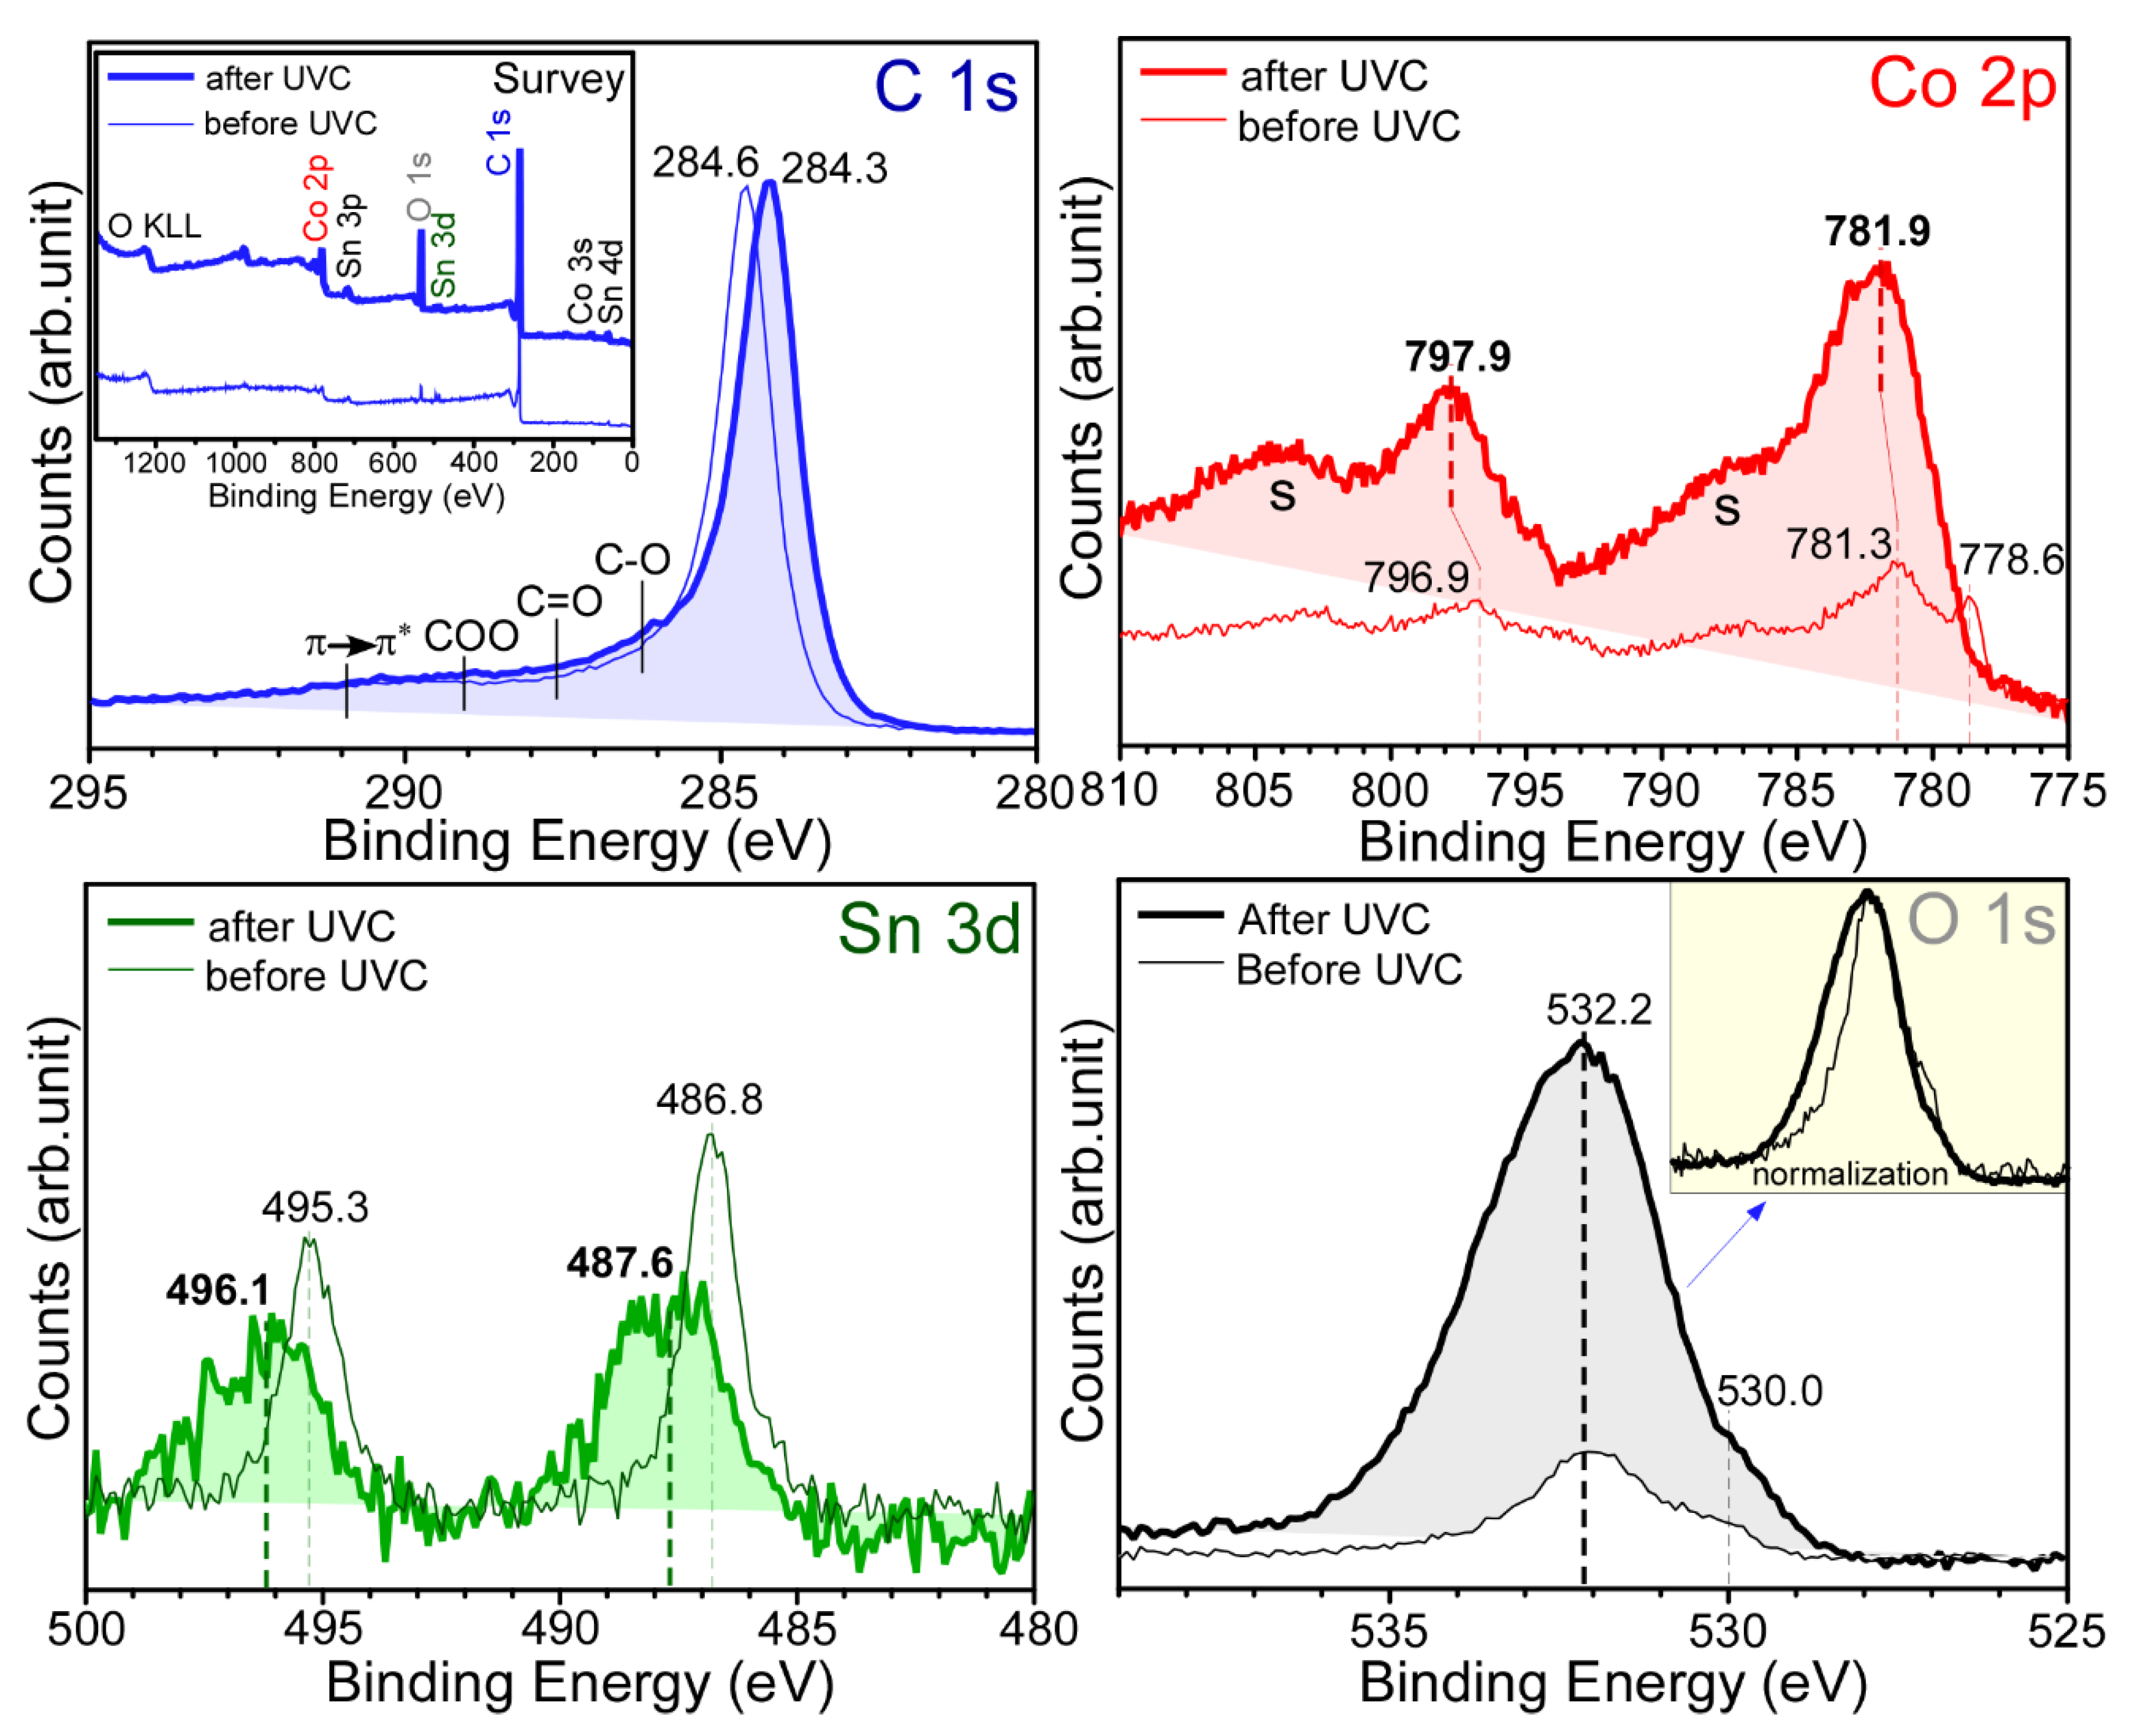
Figure 3 shows the survey and normalized high-resolution XPS profiles of the sample with 10 mol% SnO
2 and depicts the surface chemical states of the newly fabricated sample. The survey spectrum for the as-prepared sample shows the elements C, Co, Sn, and O. Carbon was predominantly observed as expected (
Figure 2). The atomic percentages for C, O, Co, and Sn were estimated to be 93.7%, 4.47%, 1.63%, and 0.2%, respectively. In the Sn 3d XPS profile, two peaks were observed at binding energies (BEs) of 495.3 eV (Sn 3d
3/2) and 486.8 eV (Sn 3d
5/2), with a spin-orbit splitting of 8.5 eV, plausibly due to Sn
4+ of SnO
2 [
23]. The weak shoulder observed at approximately 485.5 eV (Sn 3d
5/2) could be due to metallic Sn. The corresponding O 1s XPS peak was observed at 530.2 eV (inset
Figure 3). A strong C 1s XPS peak at 284.6 eV was attributed to sp
2 elemental carbon (e.g., carbon nanotube). The other broad peak spanning from 286 to 292 eV was due to C‒O, C=O, O=C‒O, and π→π* shake-ups, where ‒ and = are single and double bonds, respectively [
14,
26]. In the Co 2p XPS profile, the Co 2p
3/2 and Co 2p
1/2 XPS peaks were observed at 781.3 and 796.9 eV, respectively, with a spin-orbit splitting of 15.6 eV, which can be attributed to Co
2+ of Co
2C [
1,
14,
26]. Moreover, two broad satellite peaks at approximately 788 and 804 eV confirmed the oxidation state of Co
2+ [
27]. Additionally, a narrow peak at 778.6 eV (Co 2p
3/2) confirmed the formation of metallic Co [
1,
14,
18,
27]. Based on the XPS data, it was confirmed that Co
2C and Co embedded in the carbon matrix were formed by the anaerobic ethanol oxidation reaction. XPS quantification was performed to examine the amounts of surface carbon, Co, and Sn species [
28]. It was estimated that the amounts of Co and Sn were only 1.5% and <0.2% relative to that of carbon, respectively. This indicates that carbon was a main species and Co species were embedded in the carbon matrix. The rough EDX quantification above also showed that carbon was a main matrix species.
After CO
2 reduction of the corresponding samples, the high-resolution XPS profiles of C 1s, Co 2p, Sn 3d, and O 1s showed substantial changes (thick lines in
Figure 3). The relative intensities of Co and O with respect to carbon were substantially increased after photocatalytic CO
2 reduction using a ultraviolet C (UVC) lamp. In the C 1s XPS profile, the major peak was observed at 284.3 eV. In addition, the broad region between 286 and 289 eV was somewhat increased, which can be attributed to increased signals of C‒O, C=O, and O=C‒O upon the adsorption of CO
2 and the species formed on reduction [
14,
26]. Interestingly, in the Co 2p XPS profile, the signal of metallic Co disappeared and the signal of Co 2p of Co
2+ substantially increased. It appears that metallic Co changed to CoO after CO
2 reduction. In the Sn 3d XPS profile, the Sn 3d
3/2 and Sn 3d
5/2 peaks were substantially broadened and shifted to BEs of 496.1 and 487.6 eV, respectively, with a spin-orbit splitting of 8.5 eV. The broadness was plausibly due to the adsorption of CO
2 and Sn via O‒Sn
4+⋯O
2C, where ⋯ is an interaction. In the O 1s XPS profile, two broad regions were observed, which may be attributed to the lattice oxygen of surface-oxidized Co at a lower BE of 530 eV and surface OH, C-O, and C=O at a higher BE of approximately 532.2 eV. The comparison of the normalized O 1s spectra before and after CO
2 reduction revealed that the intensity of the O 1s signal at a higher BE region was increased, similar to the C 1s spectra.
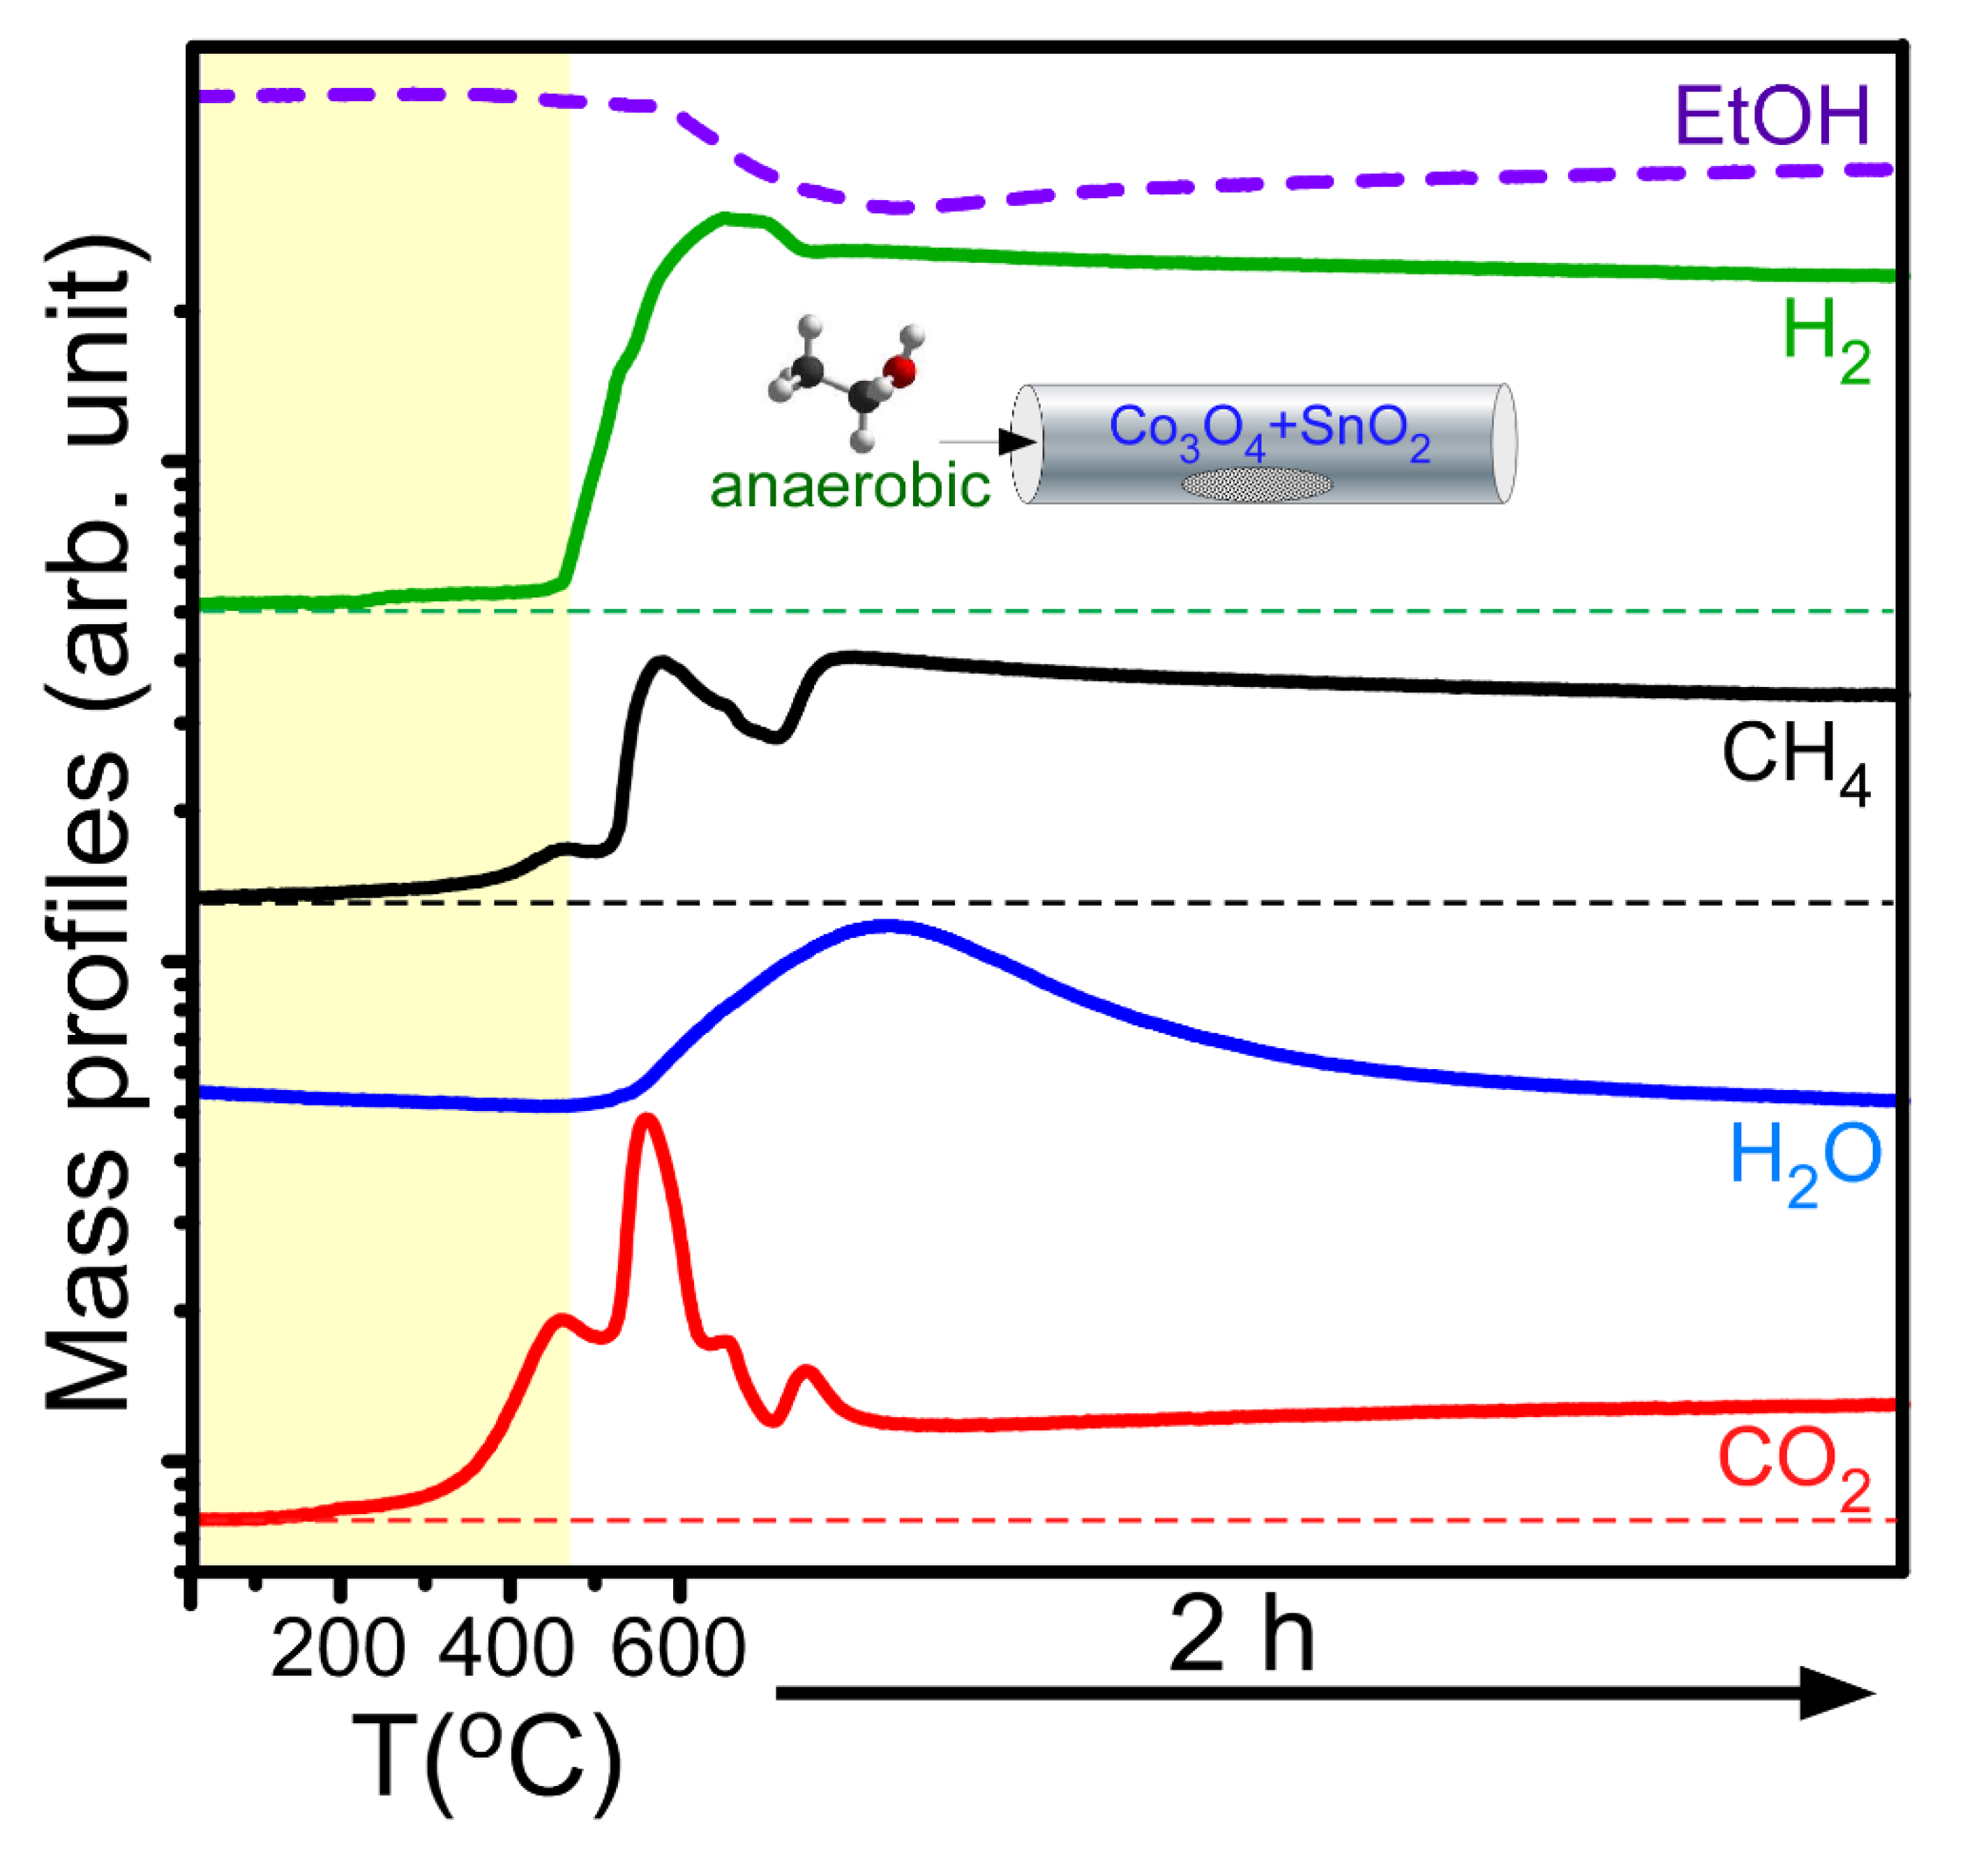
Figure 4 displays typical mass profiles of the major gaseous products detected during the anaerobic ethanol oxidation reactions over the Co
3O
4 NPs mixed with 5 mol% SnO
2 NPs. The gaseous species include ethanol (46 amu), hydrogen (2 amu), methane (16 amu), water (18 amu), and carbon dioxide (44 amu). For the mass profiles with temperature, the temperature ramp rate was set to 20 °C/min within the range 25–600 °C. After the temperature reached 600 °C, the reaction was kept for 2 h. A slight increase in the mass signals of H
2, CH
4, and CO
2 began at approximately 200 °C, and the mass signals abruptly increased above 450 °C. At the same time, the mass signal of ethanol decreased, indicating that ethanol was significantly consumed in the catalytic reaction. The shapes of the mass profiles were all different. In the CO
2 and CH
4 mass profiles, there were two maxima below 600 °C, and two other maxima were found at 600 °C within 30 min. This indicates that the reaction channels were all different, and different solid catalyst species were formed at different temperatures. Kim et al. performed an anaerobic ethanol oxidation reaction over SnO
2 NPs and reported that H
2, H
2O, CO
2, and CH
4 were observed. In addition, their mass signals increased from 200 °C and showed a maximum at approximately 450 °C [
23]. Based on the literature result, it was assumed that the gas products formed by adding sacrificial SnO
2 NPs could participate in catalyzing the Co
2C formation. On the basis of the mass profiles and the material analysis data, a general chemical equation can be written as CH
3CH
2OH + Co
3O
4 (and SnO
2) →
a CO
2 (g) +
b H
2O (g) +
c CH
4 (g) +
d H
2 (g) + Co
2C + Co (and Sn). Here, a simplified mechanism (where ⎕ is Co
3O
4 or SnO
2) is proposed: ethanol is initially adsorbed and decomposes on the surface of metal oxides (e.g., Co
3O
4 and SnO
2 here) in reaction (1). The dissociatively adsorbed ethanol is further decomposed as the temperature is increased in reactions (2), (3), and (4). Subsequently, H
2O, CO
2, CH
4, and H
2 are formed during the reactions. In reaction (5), metallic Sn or Co is formed by the reduction of the metal oxide due to adsorbed hydrogen. Adsorbed H can be associated to release molecular hydrogen in reaction (6). In the absence of an external oxygen supply, adsorbed CO (plausibly formed in reaction 2) can be participated in reducing metal oxides in reaction (7). Upon addition of SnO
2, metallic Sn was appeared to be more facile to be formed [
23], compared with metallic Co. Therefore, it may catalyze the Co
2C formation. Co
2C could be formed via 2 Co + CH
4 → Co
2C + 2 H
2 in reaction (8) or 2 Co + CO + H
2 → Co
2C + H
2O in reaction (9) [
29,
30]. It has been reported that Co
3C could be formed in the range of 450–500 °C; however, the prepared Co
3C spontaneously decomposes to α-Co [
2]. Co
2C is also known to decompose at above the temperature [
29,
30]. For this reason, Co
2C was appeared to be stably formed during the cooling stage when the temperature was below the equilibrium reaction temperature [
2,
29,
30]. Co
3C could be formed via 3Co + CH
4 → Co
3C + 2H
2; however, the formation probability (relative to that of Co
2C) was low plausibly due to the non-stoichiometric ratio of Co/CH
4, which needs further investigation.
Pola et al. reported that Co, Co
2C, and Co
3C embedded in the carbon matrix were synthesized by IR laser-induced irradiation of Co in the presence of gaseous hydrocarbons [
18]. Moreover, carbon film can be formed by the dehydrogenation and carbonization reactions of the hydrocarbons. Premkumar et al. employed a pulsed-spray evaporation CVD method to grow Co using cobalt acetylacetonate [
16]. A mixture of Co carbide and metallic Co was formed below 250 °C when ethanol was used as a precursor solution. On the other hand, Co
2C was the dominant species when methanol or ethanol was used [
16].
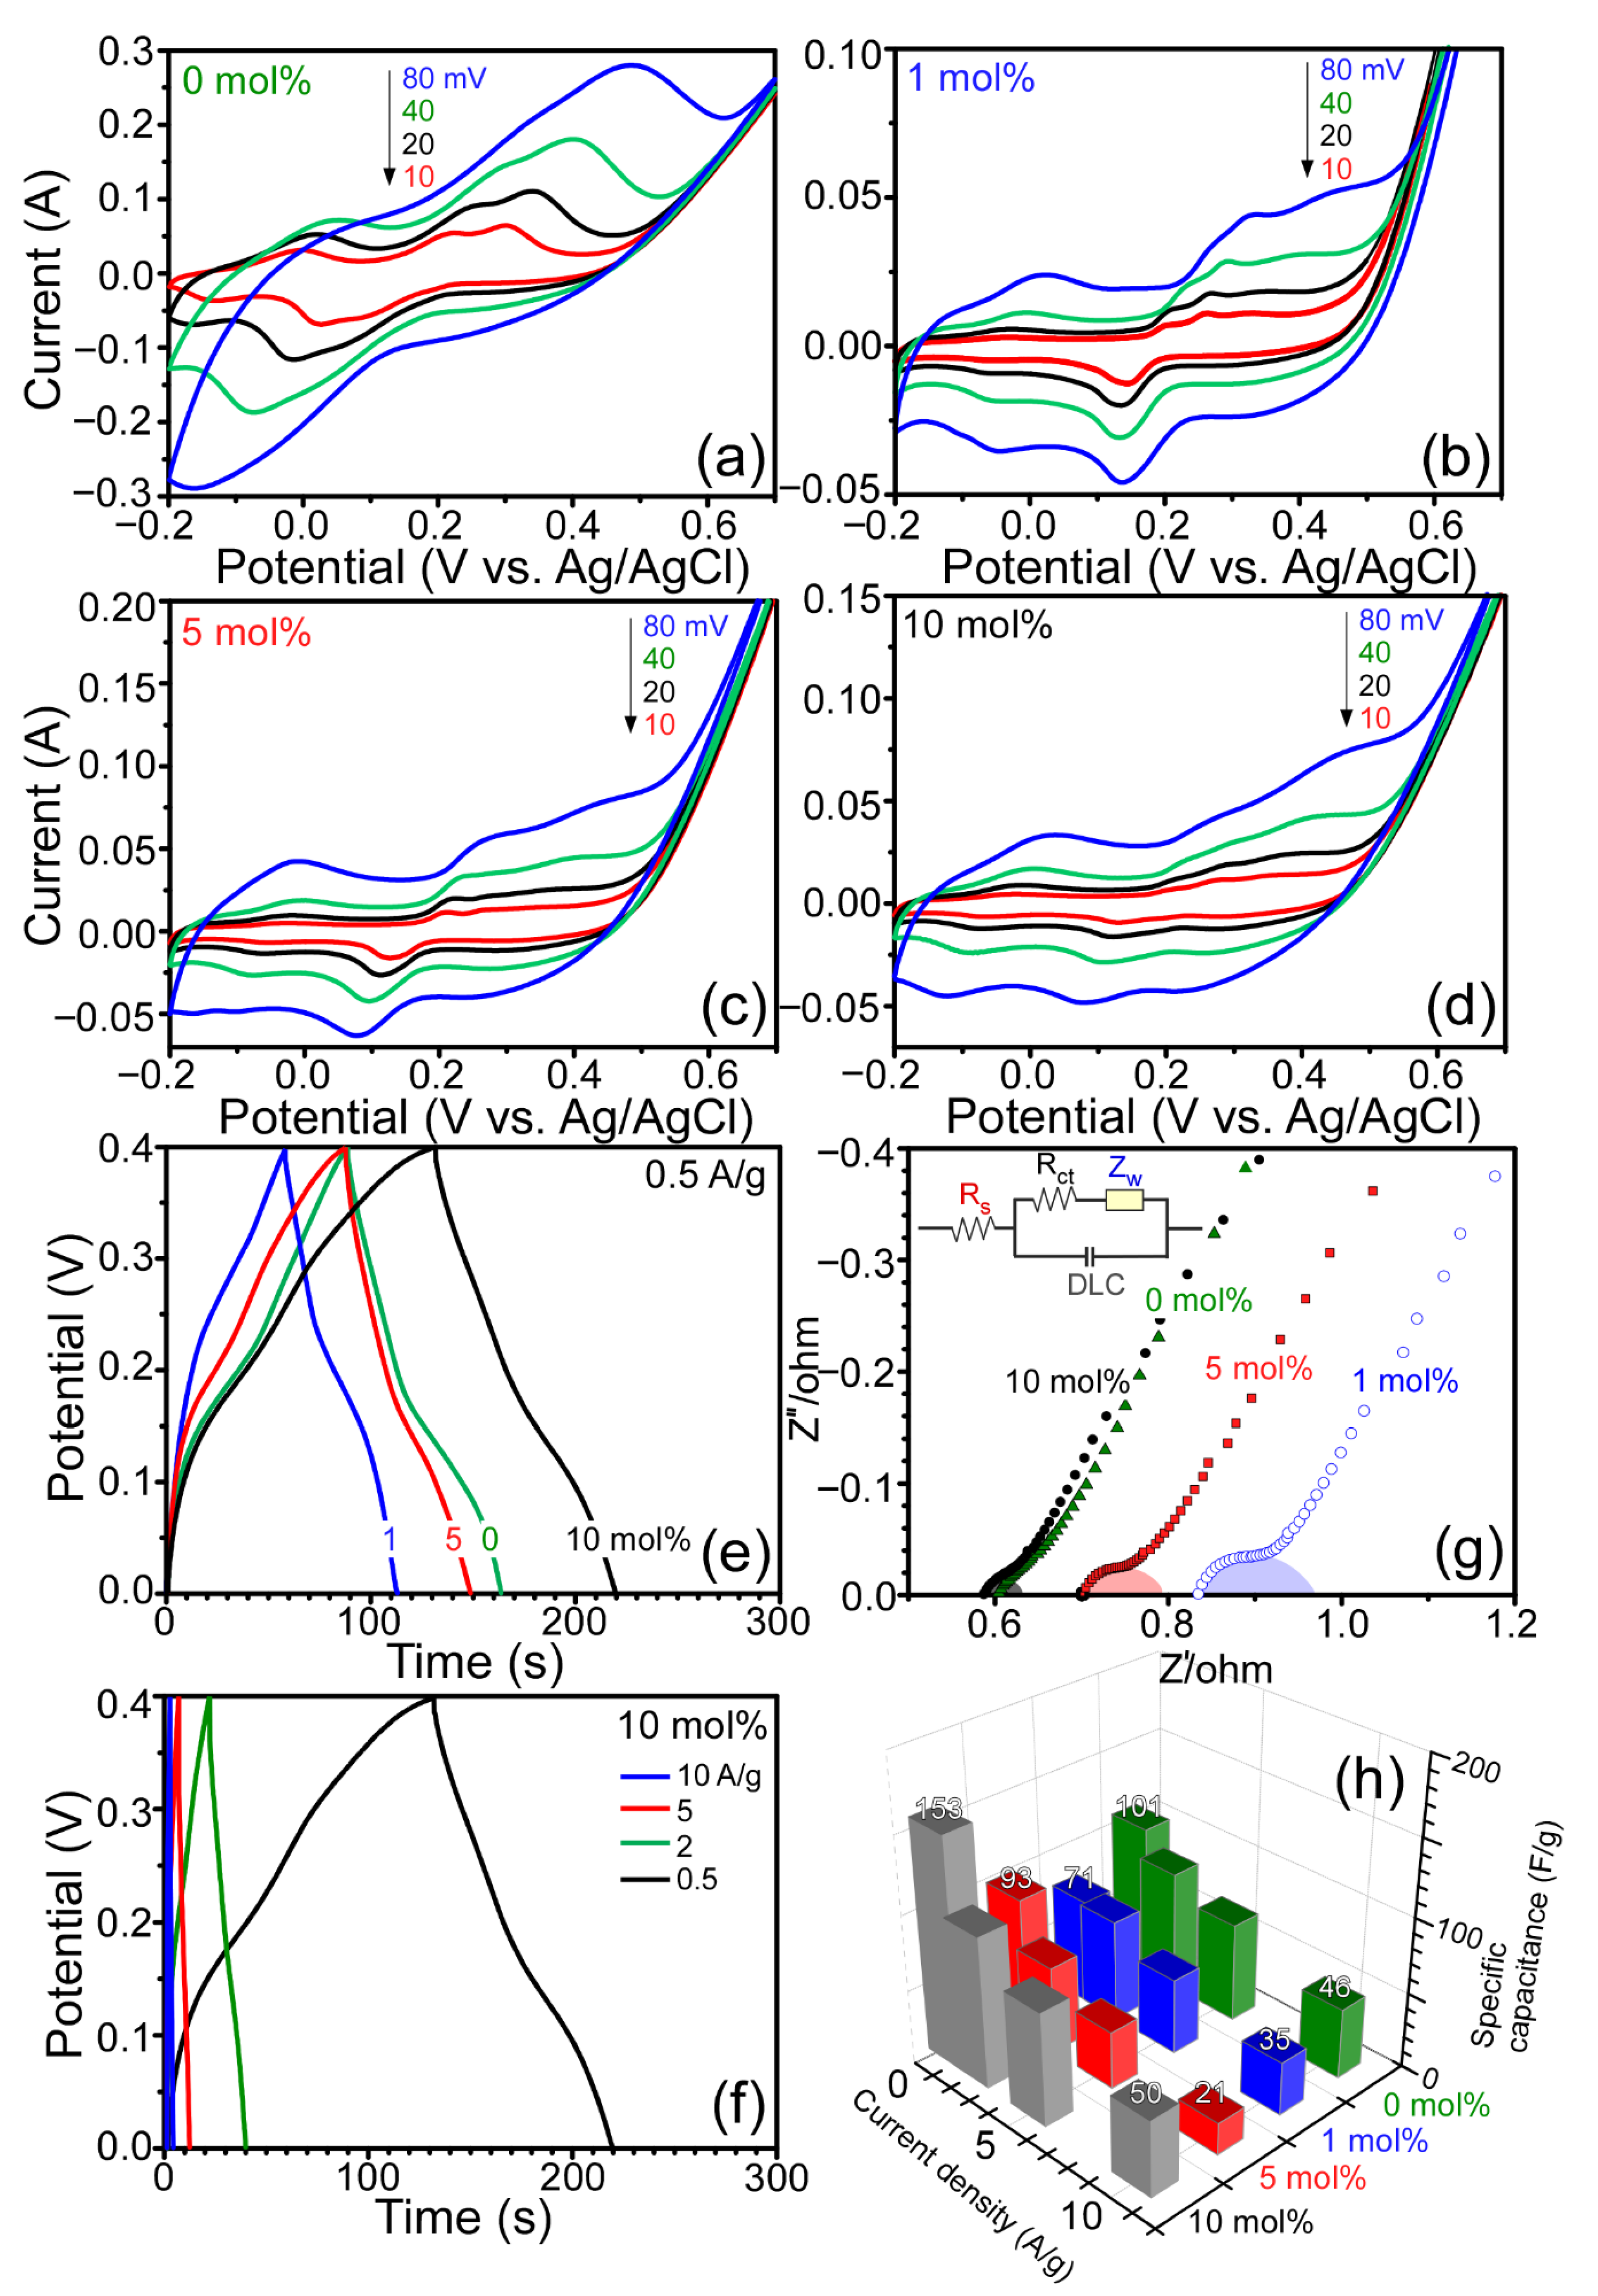
Figure 5 displays cyclic voltammetry (CV) curves, galvanostatic charge–discharge (CD) curves, and electrochemical impedance plots for the four different samples prepared with 0, 1, 5, and 10 mol% of sacrificial SnO
2. The CV curves were obtained between −0.2 and 0.7 V (vs. Ag/AgCl) in 6.0 M KOH at different scan rates of 10, 20, 40, and 80 mV/s. In general, the peak intensities in the CV curves increased with the increase in scan rate. For the sample without SnO
2, the oxidation and reduction peak width became substantially wider with increasing scan rate, indicating a diffusion-controlled electrode reaction [
31]. Several peaks were observed due to the redox transformations Co ↔ Co(II), Co(II) ↔ Co(III), and Co(III) ↔ Co(IV) [
31,
32]. For the other three samples with additional Co
2C and SnO
2 species, additional cathodic and anodic peaks were observed. For the galvanostatic charge–discharge (CD) curves between 0.0 and 0.4 V (vs. Ag/AgCl), the CD time generally increased with increase in current density (
Figure 5), as expected. The CD times were in the order 1.0 < 5.0 < 0.0 < 10.0 mol% SnO
2 at a fixed current density of 0.5 A/g. On the basis of the CD curves, the specific capacitance (C
m, F/g) was calculated using the expression C
m = (
I·Δ
t)/(Δ
V·m), where Δ
t is the discharge time (s),
I is the discharge current (A), Δ
V is the potential (V) range of 0.4 V, and
m is the mass (g) of the sample [
31,
33]. At a current density of 0.5 A/g, the specific capacitances were calculated to be 101, 71, 93, and 153 F/g for the four different samples with 0, 1, 5, and 10 mol% SnO
2, respectively. Choi et al. previously reported a specific capacitance of ~100 F/g for Co
3O
4 nanostructures measured at a current density of 0.5 A/g [
34]. The present value was comparable to the literature value measured under the same experimental conditions. This may indicate that Co/Co
2C/C hybrids can be a good supercapacitor material. The sample consisted of mainly Co
2C and carbon and showed the highest specific capacitance. To further extend the applicability of Co
2C supported in the carbon matrix, a long-term cycling stability test is needed. Electrochemical impedance spectroscopy (EIS) was employed, and the corresponding Nyquist plots (
Figure 5) showed the real (Z′) and imaginary (Z″) parts. Inset shows the plausible equivalent circuit model, where R
s, R
ct, Z
w, and double-layer capacitance (DLC) are bulk resistance, charge transfer resistance, Warburg resistance, and double-layer capacitance, respectively [
35]. A semicircle in the high-frequency region and a straight line in the low-frequency region are generally attributed to the charge transfer resistant (R
ct) and the Warburg diffusion resistance (Z
w), respectively [
31,
34]. The intercept on the
X-axis (real part, Z′) is related with the bulk resistance (R
s) of electrolyte, separator, and electrodes. In the electrode/electrolyte system, R
ct and R
s were appeared to be dependent on the Co
2C/Co ratio in the carbon matrix. When the purity of Co or Co
2C was high, the resistance was observed to be low. The 0 and 10 mol% samples showed high purity with Co
2C/Co ratios of 0 and 1, respectively. The Co
2C/Co ratios for 1 and 5 mol% samples were estimated to be 0.8 and 0.9, respectively. Consequently, the lowest impure 1 mol% sample showed the highest resistance. The measured impedance data are in good consistency with the XRD Co
2C/Co quantification ratios as discussed above.
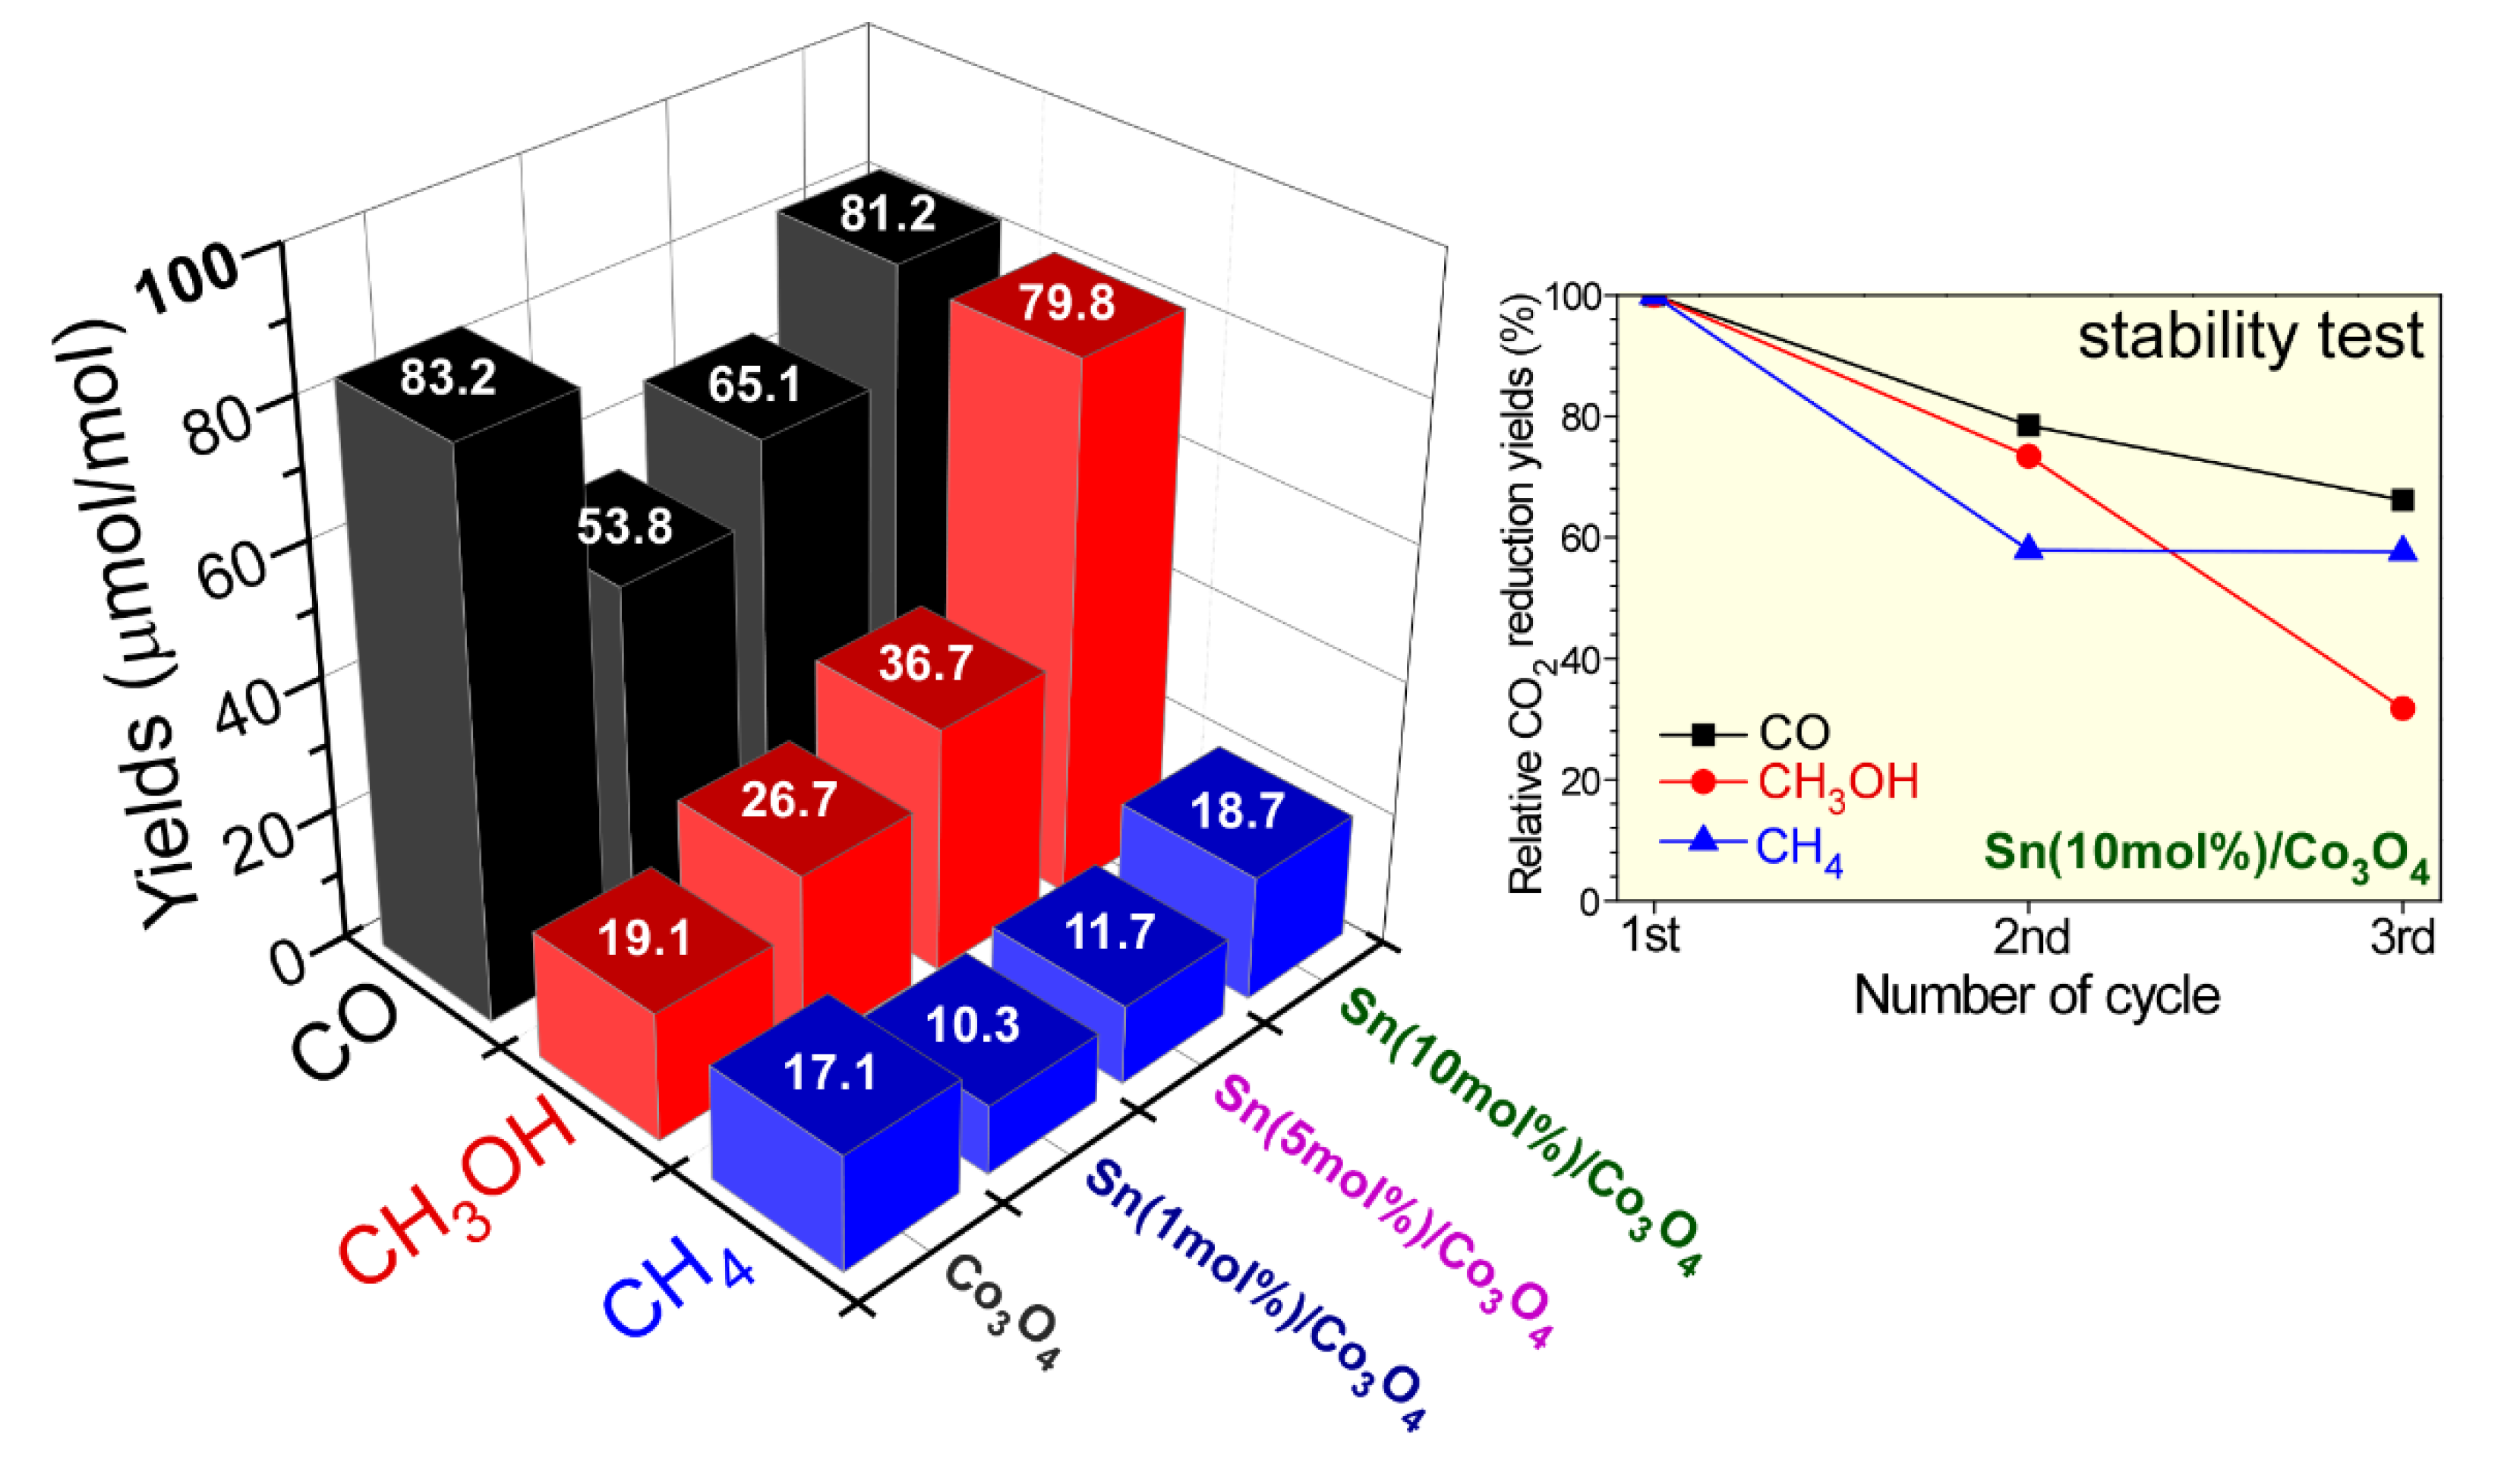
CO
2 reduction capability was also tested for bare Co
3O
4 and various Co/Co
2C/C hybrids under UVC irradiation for 13 h. CO, CH
4, and CH
3OH were commonly detected as CO
2 reduction products. For bare Co
3O
4, the yields of CO, CH
4, and CH
3OH were observed to be 83.2, 17.1, and 19.1 ppm (=μmol/mol), respectively. These values correspond to 48.9, 10.0, and 5.6 μmol/g, respectively. As the sacrificial SnO
2 content was increased, the amount of CO and CH
4 generated slightly decreased and then increased. The yields of CO, CH
4, and CH
3OH were observed to be 81.2, 18.7, and 79.8 ppm, respectively, for Co
3O
4 with 10 mol% Sn. These values correspond to 47.7, 11.0, and 23.4 μmol/g, respectively. Interestingly, the production yield of CH
3OH constantly increased with the amount of sacrificial Sn. The yield increased by 4.2 times on the addition of 10 mol% Sn compared with that of bare Co
3O
4. This indicates that Co/Co
2C/C hybrids were beneficial for photocatalytic CH
3OH production. Additionally, smaller amounts of Sn may also contribute to the production. The hydrogen production channel is a major obstacle for increasing selectivity in CO
2 reduction. However, hydrogen evolution (2H
+ + 2e
− → H
2) was not observed in the present study. CO
2 reduction commonly proceeds via multielectron transfer processes, where the electrons (e
−) are created by photoexcitation [
36]. The holes (h
+) generated by photoexcitation undergo the reaction 2H
2O + 4h
+ → O
2 + 4H
+. Thereafter, CO
2, e
−, and H
+ react to form CO, CH3OH, and CH
4 via multielectron transfer reactions described below [
36,
37,
38], where ⎕ is a catalyst support.
For CO generation via CO
2 + 2H
+ + 2e
− → CO + H
2O:
For CH
4 generation via CO
2 + 8H
+ + 8e
− → CH
4 + 2H
2O:
For CH
3OH generation via CO
2 + 6H
+ + 6e
− → CH
3OH + H
2O:
The stability of Co/Co
2C/C hybrids on CO
2 reduction was tested and is shown in
Figure 6. The CO
2 reduction products became commonly decreased as the test cycle was increased. After the third test cycle, CO, CH
4, and CH
3OH yields were decreased by 30%, 40%, and 70%, respectively. It may appear that the oxidation states (discussed in
Figure 3) of Co/Co
2C species were changed, and the surface states were deactivated on CO
2 reduction. Several Co-based photocatalysts on CO
2 reduction have been reported [
39,
40,
41]; however, the literature on CO
2 reduction over Co
2C is not available. Jiang et al. introduced CuCo
2O
4 nanoplates as a photocatalytic CO reduction catalyst showing products of CO and H
2, and a CO selectivity of 82% [
39]. Gao et al. tested the photocatalytic CO
2 reduction efficiency for Co
3O
4 hexagonal platelets [
40]. They reported CO and H
2 production rates of 2003 and 596 μmol·h
−1·g
−1, respectively, and a CO selectivity of 77.1%. Ren et al. reported a CO selectivity of 77.3% and a CO production rate of 39.70 μmol·h
−1 for Co
3O
4 hierarchical nanosheets [
41]. In all these cases, CH
4 and CH
3OH were not reported.
3. Materials and Methods
For the synthesis of Co3O4 NPs, 1.0 mmol of cobalt(II) nitrate hexahydrate (Acros Organics, 99.9%, Thermo Fisher Scientific, New Jersey, NJ, USA) was completely dissolved in 30 mL ethanol solvent followed by the addition of 2.0 mL of dimethylamine to the solution. The resulting solution was then tightly capped in a Teflon-lined stainless steel autoclave and kept at 180 °C for 12 h. Thereafter, the reaction vessel was cooled naturally to room temperature before collecting the resulting powder sample. The sample was repeatedly washed with deionized water and ethanol and dried at 80 °C. Thereafter, the dried sample was thermally treated at 350 °C for 3 h to obtain Co3O4 NPs. For the synthesis of Co/Co2C/C nanostructures by the anaerobic ethanol oxidation reaction, 0.1 g of Co3O4 powder sample, mixed with 0, 1, 5, and 10 mol% SnO2 powder, was first placed in a quartz U-tube (4 mm inner diameter, Quantachrome Instruments, Boynton Beach, FL, USA). Ethanol vapor was then introduced into the sample by flowing pure N2 gas (99.99%) at the rate of 40 mL/min. During the introduction of ethanol vapor, the sample was heated to 600 °C at the rate of 20 °C/min. The sample was then kept at 600 °C for 2 h to complete the reaction. After the reaction, the reactor was naturally cooled to room temperature, and the introduction of ethanol vapor was stopped when the reactor temperature was below 150 °C. The gaseous products of the reaction were continuously monitored using an SRS RGA200 quadrupole mass spectrometer (Stanford Research Systems, Sunnyvale, CA, USA).
The morphology of the powder samples was examined using scanning electron microscopy (SEM; Hitachi S-4800, Tokyo, Japan) operating at an acceleration voltage of 10 keV. High-resolution transmission electron microscopy (HR-TEM) images of the powder samples on a carbon-coated Cu grid were recorded using a Tecnai G2 F20 S-TWIN microscope (FEI, Hillsboro, TX, USA) set at an acceleration voltage of 200 kV. Energy-dispersive X-ray (EDX) spectroscopy data were obtained using a Hitachi S-4200 SEM (Hitach Ltd., Tokyo, Japan). The X-ray diffraction patterns (2θ angles from 20° to 80°) of the crystal phases of the newly synthesized powder samples were obtained using a PANalytical X’Pert Pro MPD diffractometer (Bruker Co., Ltd., Billerica, MA, USA) with Cu Kα radiation (40 kV and 30 mA). High-resolution XPS profiles were obtained using a Thermo Scientific K-Alpha spectrometer (Thermo VG Scientific, Waltham, MA, USA) with a monochromatic Al Kα X-ray source and a hemispherical energy analyzer.
Photocatalytic CO2 reduction using a 15 W UVC lamp (a power density of 5.94 mW/cm2) was performed in a closed home-built stainless steel reactor, which was fully charged with CO2 gas and 20 μL H2O. A catalyst (3 mg) was dispersed on a quartz circular plate (a diameter of 45 mm) and placed in the reactor. After UVC light irradiation for 13 h, 0.5 mL of gas was taken and injected into a YL 6500 gas chromatograph (GC, Young In Chromass Co., Ltd., Seoul, Korea), which was equipped with a thermal conductivity detector (TCD), a flame ionization detector (FID), and a Ni catalyst methanizer.
For electrochemical and supercapacitor performance tests, a typical three-electrode system was employed, where a Pt wire (counter electrode), Ag/AgCl (3.0 M NaCl) reference electrode, and working electrode were connected electrically to a CHI660D (CH Instruments, Austin, TX, USA) electrochemical workstation. For the preparation of the working electrode, the synthesized powder material, acetylene black, and poly(vinylidene fluoride) (PVDF) at a weight ratio of 60:20:20, respectively, were completely dissolved in 2 mL of N-methyl-2-pyrrolidone (NMP) by grinding using an agate mortar. The sample ink was mounted onto a Ni foam (1 × 1 cm). The galvanostatic charge–discharge experiment was performed in a 6.0 M KOH aqueous solution over the potential range 0.0–0.4 V, with different charge densities (0.5, 1.0, 5.0, and 10.0 A/g). Electrochemical impedance spectroscopy (EIS) was conducted over the frequency range from 0.1 MHz to 0.01 Hz.


