Article

The Preparation and Characterization of Co–Ni Nanoparticles and the Testing of a Heterogenized Co–Ni/Alumina Catalyst for CO Hydrogenation

by
Julián López-Tinoco
1,2,
Rubén Mendoza-Cruz
3,*,
Lourdes Bazán-Díaz
3,
Sai Charan Karuturi
4,
Michela Martinelli
5,
Donald C. Cronauer
6,
A. Jeremy Kropf
6,
Christopher L. Marshall
6 and
Gary Jacobs
4,7,*
1
Department of Physics and Astronomy, University of Texas at San Antonio, One UTSA Circle, San Antonio, TX 78249, USA
2
Facultad de Ingeniería Química, Universidad Michoacana de San Nicolás de Hidalgo, Morelia, Michoacán 58030, Mexico
3
Instituto de Investigaciones en Materiales, Universidad Nacional Autónoma de México, Ciudad de México, 04510, Mexico
4
Department of Mechanical Engineering, University of Texas at San Antonio, One UTSA Circle, San Antonio, TX 78249, USA
5
Center for Applied Energy Research, University of Kentucky, 2540 Research Park Drive, Lexington, KY 40511, USA
6
Argonne National Laboratory, Argonne, IL 60439, USA
7
Department of Biomedical Engineering and Chemical Engineering, University of Texas at San Antonio, One UTSA Circle, San Antonio, TX 78249, USA
*
Authors to whom correspondence should be addressed.
Catalysts 2020, 10(1), 18; https://doi.org/10.3390/catal10010018
Submission received: 7 November 2019 / Revised: 18 December 2019 / Accepted: 19 December 2019 / Published: 21 December 2019
(This article belongs to the Special Issue Iron and Cobalt Catalysts)

Abstract

:
Samples of well-controlled nanoparticles consisting of alloys of cobalt and nickel of different atomic ratios were synthesized using wet chemical methods with oleylamine as the solvent and the reducing agent. These materials were characterized by a variety of techniques, including high-angle annular dark-field scanning transmission electron microscopy (HAADF-STEM), X-ray energy dispersive spectroscopy (EDS), and X-ray diffraction (XRD). Small amounts of heterogenized catalysts were prepared using alumina as the support. However, the potential for use of Co–Ni catalysts in CO hydrogenation was explored using a larger amount of Co–Ni/alumina catalyst prepared from standard aqueous impregnation methods and tested in a continuously stirred tank reactor (CSTR) for Fischer–Tropsch synthesis (FTS). Results are compared to a reference catalyst containing only cobalt. The heterogenized catalysts were characterized using synchrotron methods, including temperature programmed reduction with extended X-ray absorption fine structure spectroscopy and X-ray absorption near edge spectroscopy (TPR-EXAFS/XANES). The characterization results support intimate contact between Co and Ni, strongly suggesting alloy formation. In FTS testing, drawbacks of Ni addition included decreased CO conversion on a per gram catalyst basis, although Ni did not significantly impact the turnover number of cobalt, and produced slightly higher light gas selectivity. Benefits of Ni addition included an inverted induction period relative to undoped Co/Al2O3, where CO conversion increased with time on-stream in the initial period, and the stabilization of cobalt nanoparticles at a lower weight % of Co.

1. Introduction

Cobalt catalysts are important for the Fischer–Tropsch synthesis (FTS) reaction, which is at the heart of the gas-to-liquids (GTL) process [1]. Not only do they offer good activity and stability, as well as high selectivity toward heavier hydrocarbons, but they also possess low water–gas shift (WGS) activity relative to iron carbide catalysts, making them suitable for converting the higher H2:CO ratio syngas associated with natural gas derived syngas [2].
Cobalt is an expensive metal, with a price that has ranged from $22 to $100 per kg within the past five years [3]. Therefore, in order to maximize its surface area, cobalt is typically supported on a metal oxide carrier such as γ-Al2O3 or TiO2. Cobalt catalysts are typically prepared by aqueous impregnation methods, such as incipient wetness impregnation (IWI) or a preferred slurry impregnation method (SIM) [1] using a precursor such as cobalt nitrate, and then the catalyst is dried and calcined (e.g., 350 °C, 4 h). There are three major problems with heterogenized cobalt catalysts that are of interest to commercial developers.
The first problem is that of reducibility. Following calcination, cobalt is present as Co3O4 nanoclusters and, unlike unsupported cobalt oxide which reduces to the metal at 300–350 °C, the two-step reduction profile of Co3O4 on alumina, which involves CoO as an intermediate, is broadened. Co3O4 reduces to CoO in a relatively facile manner in the range of 300–350 °C, but to reduce CoO to Co0, temperatures as high as 800 °C are needed [4,5]. In order to facilitate the reduction of cobalt oxides, promoters (e.g., Pt [4,5,6,7,8], Ru [4,7,8,9,10], Re [4,7,8,11,12,13,14], Ag [15,16]) are utilized, and researchers have suggested that the catalytic action is either by a direct chemical effect (e.g., alloying), or by reduction of the promoter at low temperature, followed by a H2-dissociation and spillover mechanism that facilitates the reduction of cobalt oxides. One problem with these promoters is that they are very expensive. The price range of platinum, the most common promoter used, has been $25,000–$50,000 per kg within the past five years [3]. Fortunately, only small percentage loadings (<0.5% Pt) are needed to facilitate cobalt oxide reduction. Nevertheless, it is of interest to find a suitable base metal replacement. As nickel is in the same group as platinum and has a much lower price ($8–$20 per kg over the past five years [3]), investigations on Ni as a reduction promoter for cobalt oxides are important.
The second issue is selectivity. Cobalt is a d7 metal and has an electronic configuration suitable for growing long-chained hydrocarbons. The metal has the right balance in that it is able to dissociate CO, as well as stabilize the vinylic intermediate in the appropriate sp3 configuration, such that chain growth is controlled to one side, producing primarily straight chained paraffins, 1-olefins, and 1-alcohols [17]. Nickel, however, is a d8 metal, and the electronic back-donation capability of Ni is excessive for the FTS application, such that the vinylic intermediate is insufficiently stabilized, resulting primarily in undesired light gas production [17]. Thus, there are questions related to how much nickel can be added to cobalt nanoparticles such that the resulting alloy still possesses adequate hydrocarbon selectivity for FT, and whether a catalyst possessing a nickel core and a cobalt shell might be developed such that the reaction occurs primarily on a cobalt shell.
Finally, there is the problem of stability with heterogenized cobalt catalysts [9,18,19,20,21]. While it is important to disperse cobalt on a carrier such as alumina to maximize the surface availability of Co0, which provides the active sites, there is a thermodynamic limit regarding how small the cobalt nanoparticles can be in FTS and still maintain adequate stability [18]. In FTS, H2O is a major product of the reaction, and studies have concluded that cobalt nanoparticles that are <2–4 nm will oxidize under commercially relevant reaction conditions; this renders the cobalt nanoparticles inactive. As such, catalysts are often made with cobalt nanoparticles that target the 6–10 nm range [19]. A consequence of this design is that the majority of the expensive cobalt is locked within the cobalt nanoparticle rather than being exposed to the surface where the catalysis occurs. Thus, it would be of interest to replace a fraction of the more expensive cobalt with a less expensive metal-like nickel.
The incorporation of a second metal to form alloyed metal nanoparticles has helped to increase activity on a per gram of catalyst basis, as well as improving stability, thus decreasing the cost of the process [22]. By controlling the synthesis conditions such as solvent, reducing agent, temperature and metal composition, it is also possible to control the size, shape and structure of the nanoparticles, tailoring in this way their final properties toward different applications [23,24,25].
In this work, we begin to explore the preparation of well-controlled nanoparticles consisting of alloys of cobalt and nickel having different atomic ratios. These are synthesized using wet chemical methods with oleylamine as both the solvent and the reducing agent. These materials were characterized by a variety of techniques, including HAADF-STEM, EDS, and XRD. Small amounts of heterogenized catalysts were also prepared using alumina as the support. However, because it was not possible at this time to prepare large enough batches for catalyst testing using a CSTR, the potential for use of Co–Ni catalysts in CO hydrogenation was explored using a larger amount of Co–Ni/alumina catalyst prepared from standard aqueous impregnation methods. This catalyst was tested in a CSTR for FTS and compared to a reference catalyst containing only cobalt. The heterogenized catalysts were characterized by, among other techniques, synchrotron methods including TPR-EXAFS and TPR-XANES.

2. Results

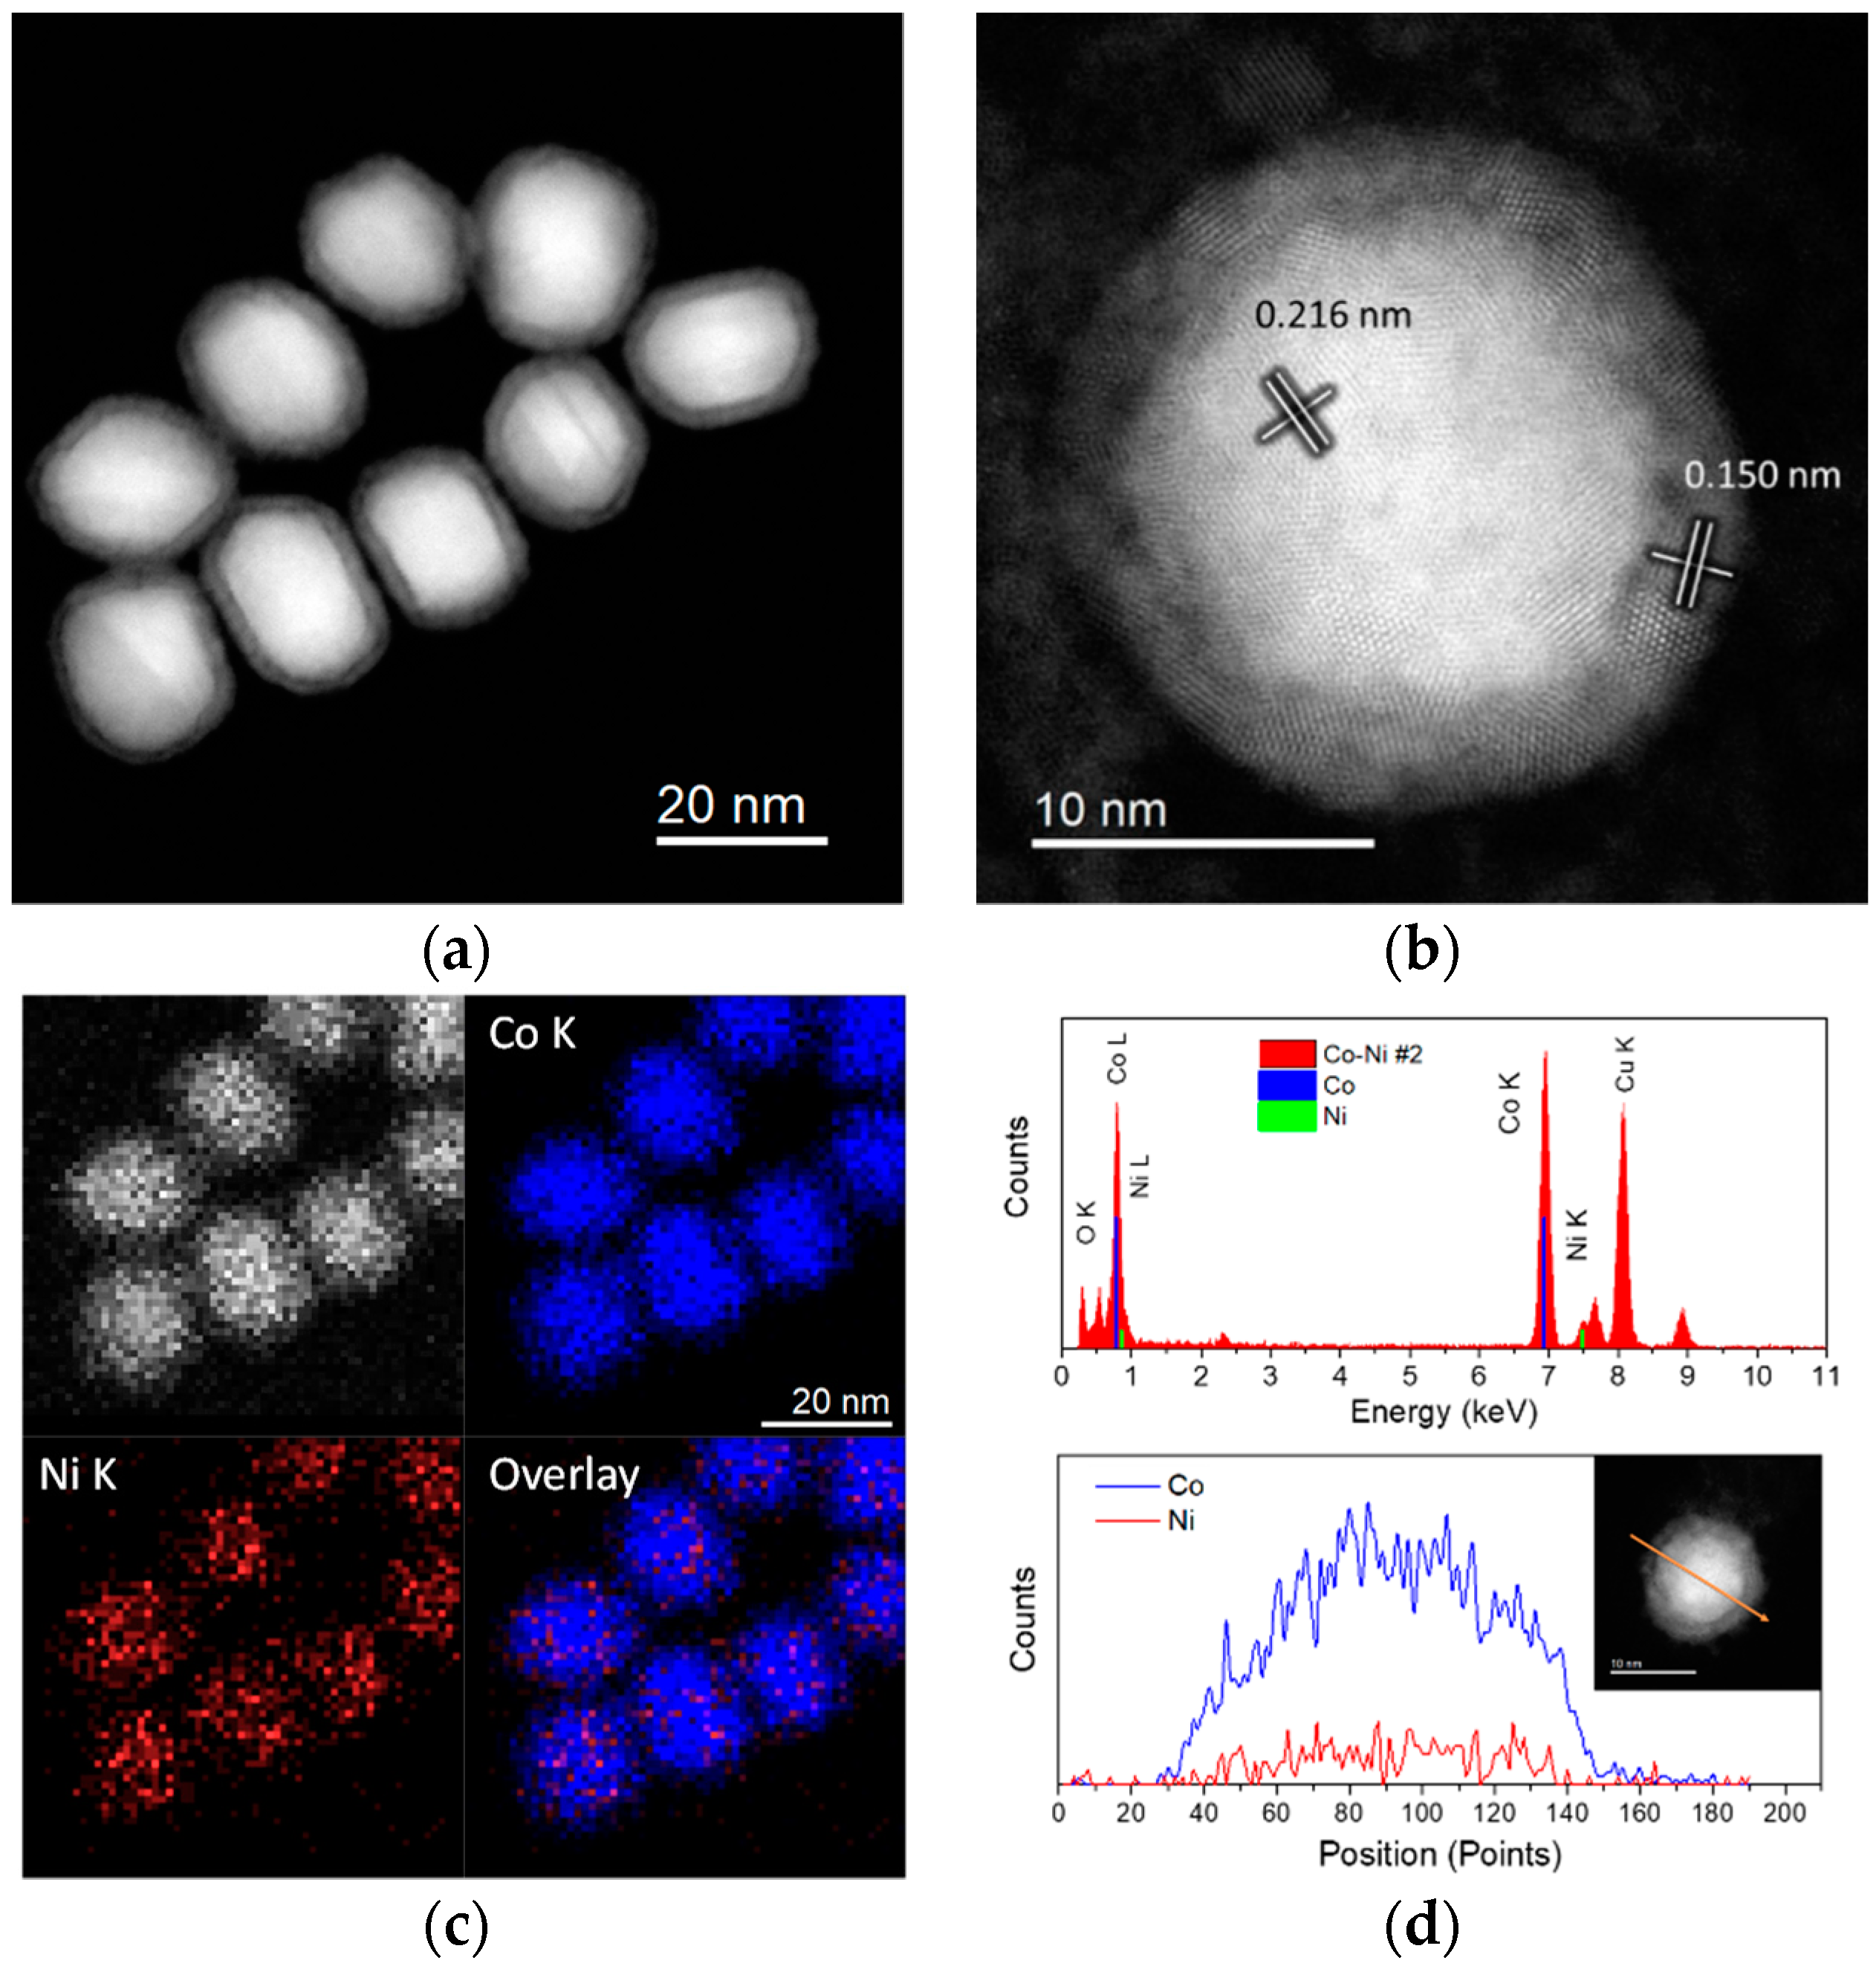
2.1. Cobalt–Nickel Nanoparticles

Co–Ni alloy nanoparticles were prepared by a colloidal wet-chemical method using oleylamine (OAm) as the solvent and reducing agent. Three samples were prepared with different initial atomic ratios, Co98.4Ni1.6 (Sample #1), Co92.7Ni7.3 (Sample #2), and Co89.7Ni10.3 (Sample #3). Figure 1a shows a low magnification HAADF image of the synthesized Co98.4Ni1.6 nanoparticles. The sample consisted of 20.5 ± 3.2 nm polycrystalline dendritic particles, formed by the apparent attachment of small crystallites. The high-magnification image (Figure 1b) confirmed that the particles were well crystallized.
The measured interplanar distance of the well-resolved lattice fringes was 0.203 nm, corresponding to the (002) planes of the hexagonal-close packed (HCP) phase or the (111) planes of a face-centered cubic (FCC) structure of cobalt [26]. Cobalt and nickel FCC have a very close atomic weight and similar lattice constants, differing by less than 1%, making it difficult to differentiate them within the measuring error. Therefore, EDS analysis was performed to estimate the Ni content that is present within the nanoparticle structure. Figure 1c corresponds to the EDS spectrum acquired from mapping a group of nanoparticles laying on the carbon support. It was observed that nickel was at an ultra-low concentration ([email protected] keV), and its content was below detection limits. This is expected from the very low amount of Ni used during synthesis of the nanoparticles. Oxygen was also detected, such that the formation of an oxide layer on the nanoparticle surface, formed when exposing to air during purification, cannot be discounted. From the estimated Ni content, it was inferred that the synthesized nanoparticles crystallized in a hexagonal close packed structure, which forms at a relatively low temperature and low Ni content [27]. With increasing nickel content, a significant change in terms of shape and composition was achieved. Figure 2 corresponds to HAADF-STEM images of the nanoparticles when using a Co:Ni atomic ratio of 92.7:7.3. As observed from the low-magnification image in Figure 2a, the nanoparticles exhibit a very different morphology, presenting a core-shell feature with a mean diameter of 12.3 ± 1.5 nm core and 2.3 ± 0.2 nm shell. The low contrast of the outer layer surrounding the particles suggests a lower atomic density, attributed to the presence of an oxidized layer. The high-magnification images in Figure 2b reveal the multiply-twinned structure of the nanoparticles. Different regions of well-resolved lattice fringes are visible. The lattice distance measured at the nanoparticle core was 0.216 nm while at the nanoparticle surface the measured lattice distance was 0.150 nm, matching with the (100) planes of an HCP Co–Ni alloy (0.217 nm) and the (220) planes of the CoO FCC structure (0.151 nm) [27,28].
EDS analysis confirmed the presence of both Co and Ni elements within the nanoparticles, as shown from the EDS spectrum in Figure 2c. The estimated atomic composition was 92.7%Co–7.3%Ni, giving support to the presence of the HCP Co–Ni alloy. Additionally, an EDS line scan crossing at the center of an individual nanoparticle confirmed that Co and Ni are well distributed along the particle, as displayed in Figure 2d.
In the bulk, the Co–Ni alloy crystallizes in a complete solid solution having an FCC structure (α phase) for compositions >30% atomic nickel, while for compositions below ~30% atomic Ni and a relatively low temperature, a martensitic transformation from the FCC to HCP phase (ε phase) takes place. Since the nanoparticles were synthesized at a relatively low temperature (230 °C) and with a low Ni content, it was possible to obtain an HCP Co–Ni alloy. However, the boundaries of the bulk transition are not well established [27], and the temperature range of transitions lowers at the nanoscale, since it is strongly affected by particle size and shape [29,30].
In the absence of 1,2-hexadecanediol, larger nanoparticles were obtained by using only OAm as the reducing agent, as shown in the SEM image provided in Figure 3a (Sample #3). The nanoparticles presented cubic and octahedral shapes having a highly faceted surface. The average size was 85 ± 13 nm. Figure 3b,c show an HAADF-STEM image of a single particle at atomic resolution. From the measured lattice distances of 0.242 and 0.211 nm, which formed an angle of ~55°, the particle was indexed as a Co1−xNixO FCC structure viewed along the [110] axis zone. The CoO-type phase crystallizes in a rock salt structure having the Fm3m space group, with a difference in the lattice parameters of ~2.3% between a CoO and NiO structure (a = 4.2667 Å for CoO, and a = 4.1684 Å for NiO). Hence, the measured distances between both structures suggest the formation of a Co1-xNixO solid solution. The EDS analysis from a large group of nanoparticles (e.g., the cluster shown in Figure 3d) confirmed the presence of Co, Ni, and O, as presented in the spectrum and mapping in Figure 3c,d. The estimated average composition from the acquired EDS spectra was 89.7%Co–10.3%Ni, indicating an atomic percentage ratio of 8.7 between the cations.
To better determine the structure of the synthesized particles, the freshly prepared powders were characterized by XRD. Figure 4 shows the diffraction patterns of the Co–Ni alloy nanoparticles (Sample #1, #2, and #3). In Figure 4a,b, corresponding to the colloidal preparation method of Samples #1 and #2, the characteristic peaks of metallic nickel FCC (ICSD 518120) and metallic cobalt HCP (ICSD 15288) were taken as references. As shown, both patterns present similar features with peaks located at 44.5, 51.8, and 76.4° assigned to the (111), (200), and (220) planes of the FCC structure, with additional peaks at 41.7, 44.3, 62.6, and 76.1° assigned to the HCP phase of cobalt. The observed peaks presented a slight shift with respect to the reference; this is associated with the alloyed Co–Ni, indicating the coexistence of both FCC and HCP phases of cobalt within the samples [31,32]. Meanwhile, the XRD pattern of the colloidally prepared Sample #3 confirmed the oxidized nature of the nanoparticles, Figure 4c. The pattern is indexed as a CoO-type structure, confirming the Co1-xNixO FCC solid solution phase.

2.2. Heterogenized Catalysts

For sample designations, please refer to the Materials and Methods Section. Figure 5 displays hydrogen TPR-XANES spectra at the Co K-edge of the different samples. Figure 5a,b reveal that the nanoparticles prepared by the non-conventional method (Samples #1 and 2) start as a mixture of Co2+ and Co0, and the spectra resemble a mixture of CoO and Co0, while that of Figure 5c corresponding to Sample #3 begins entirely in the Co2+ oxidation state, resembling CoO. As shown by the linear combination (LC) fittings of TPR-XANES spectra with reference compounds in Figure 6a,b, both Samples #1 and #2 started with high Co0 content (75% and 80%, respectively), and achieved nearly complete reduction by 350 °C. Sample #3, as shown in Figure 6c, achieved nearly complete reduction from CoO to Co0 by 400 °C. The point of 50% reduction of CoO to Co0 occurred at ~330 °C.
Figure 5d, on the other hand, representing the catalyst prepared by the traditional slurry impregnation method (Sample #4), followed the conventional two-step reduction of cobalt oxides to metallic compounds, where: Co3O4 + H2 = 3CoO + H2O and 3CoO + 3H2 = 3Co0 + 3H2O. Figure 6d shows linear combination fittings of the TPR-XANES spectra using reference compounds. The catalyst nears complete reduction to Co0 by 580 °C. The point at which 50% of the Co3O4 converts to CoO occurs at ~290 °C, while the point at which 50% of the CoO converts to Co0 occurs at ~480 °C. Note that Ni is clearly facilitating reduction, as the point of 50% of CoO conversion for unpromoted 25%Co/alumina was found from our prior work to be ~550 °C with nearly complete reduction at temperatures higher than 700 °C [5].
XANES snapshots along the TPR trajectory of key states of cobalt are provided in Figure 7. These snapshots highlight key differences among the different Co–Ni catalysts. For example, Co3O4 is only detected in Sample #4 (i.e., the catalyst prepared by the conventional method). While Samples #1 and #2 have very little CoO content initially, Sample #3 starts out as virtually all CoO, with no Co0 or Co3O4 being detected, in good agreement with the HAADF-STEM structural characterization. This suggests that Co–Ni nanoparticles can be tuned to have different oxidation state characteristics.
Figure 8 displays hydrogen TPR-XANES spectra at the Ni K-edge of the different samples. Figure 8a,b reveal that the nanoparticles prepared by the nonconventional method (Samples #1 and 2) start as a mixture of primarily Ni0 with very little Ni2+, and the spectra resemble a mixture of Ni0 and NiO, while that of Figure 8c,d corresponding to Sample #3 and Sample #4 begin entirely in the Ni2+ oxidation state, resembling NiO. Due to the low amount of Ni2+ in Samples #1 and #2, as well as the noise level of Sample #1 (due to low Ni content), LC fittings were not performed on these samples. However, LC fittings of TPR-XANES spectra with reference compounds were performed for both Samples #3 and #4. As shown in Figure 9, Sample #3 achieved nearly complete reduction of nickel by 350 °C, while Sample #4 achieved nearly complete reduction of nickel by 600 °C. Interestingly, the XANES spectra of Sample #4 display a shift in the NiO spectrum to lower energy when Co3O4 reduces to CoO; this suggests that Ni2+ is in intimate contact with cobalt oxides. The point at which the Ni2+ is at the halfway position between NiO associated with Co3O4 and NiO associated with CoO occurs at 290 °C, which matches the temperature at which 50% reduction of Co3O4 to CoO occurs. The point of 50% reduction of NiO to Ni0 occurred at ~330 °C for Sample #3 and at ~480 °C for Sample #4. These temperatures match those of 50% CoO reduction to Co0, suggesting once again that the Co and Ni are in intimate contact in both the oxide and metallic forms (e.g., alloys).
XANES snapshots along the TPR trajectory of key states of nickel are provided in Figure 10. These spectra highlight key differences among the different Co–Ni catalysts. While Samples #1 and #2 have very little NiO content initially, Sample #3 and #4 start out as virtually all NiO, with no Ni0 being detected. Once again, this is in good agreement with the structural characterization, and it suggests that Co–Ni nanoparticles can be tuned to have different oxidation state characteristics. Before (solid line) and after (dashed line) spectra denote the shift to lower energy for the Ni2+ spectra for Sample #4.
TPR-EXAFS data at the Co K-edge are provided in Figure 11. For Samples #1 and #2, which are represented by Figure 11a,b, there is already a strong peak for Co–Co coordination in Co0 from the initial temperature. There is, however, a small amount of oxide initially present in Sample #1, which upon reduction causes slight shifts in the Fourier transform peak positions. This is best observed in the development of the third Co–Co coordination shell (see arrow). Figure 11c for Sample #3 starts with peaks of Co–O (low distance) and Co–Co (higher distance) consistent with CoO and then the peak for Co–Co for the metal starts to develop by ~325 °C. Figure 11d for Sample #4 shows similar contributions from our earlier work with Co/alumina catalysts [5]. The initial cyan spectra show a strong peak at low distance for Co–O and a broad asymmetric peak at higher distance consistent with multiple Co–Co distances in Co3O4, which is a spinel structure. However, a second oxide, CoO clearly develops as shown by the initial green spectrum. The Co–O peak is lower in intensity and the Co-Co peak has sharpened (consistent with a rock salt structure). Then, the Co–Co peak for the metal develops only at high temperature (~500 °C). The results are consistent with those of TPR-XANES. This is at a lower temperature than that observed in our previous work [5], where the peak develops at ~600 °C.
EXAFS snapshots along the TPR trajectory of key states of cobalt are provided in Figure 12. These snapshots highlight key differences among the different Co–Ni catalysts. For example, Co3O4 is only detected in Sample #4 (i.e., the catalyst prepared by the conventional method). While Samples #1 and #2 have very little CoO content initially (as shown by low peaks for Co–O and Co–Co coordination in CoO), Sample #3 starts out as virtually all CoO (strong peaks for Co–O and Co–Co coordination in CoO are detected at the outset), with no Co0 or Co3O4 being detected (Figure 8, left). The CoO in Sample #4 forms from the reduction of Co3O4 (Figure 8, top spectrum). The final spectra after TPR-EXAFS (Figure 8, right) shows the characteristic Co–Co coordination of Co0.
TPR-EXAFS data at the Ni K-edge are provided in Figure 13. For Samples #1 and #2, the Ni was significantly reduced at the outset and these spectra are not provided (see Figure 10 left) moreover, there was significant noise in Sample #1 during much of the TPR. Figure 13a,b of Samples #3 and #4, respectively, starts with peaks of Ni–O (low distance) and Ni–Ni (higher distance) consistent with NiO and then the peak for Ni–Ni for the metal starts to develop by ~325 °C for Sample #3 and ~500 °C for Sample #4, respectively. These are similar temperatures to those of the development of the Co-Co metallic coordination peak, once again suggesting intimate contact between Co and Ni in the catalyst samples. For Sample #4, the cyan spectra denote where Ni2+ is associated with Co3O4 reduction to CoO and the light green spectra denote where Ni2+ is associated with CoO reduction to Co0. Dark green spectra indicate significant Co–Co metal coordination.
EXAFS snapshots along the TPR trajectory of key states of nickel are provided in Figure 14. These snapshots highlight key differences among the different Co–Ni catalysts. While Samples #1 and #2 have very little NiO content initially (as shown by low peaks for Ni–O and Ni–Ni coordination in NiO in left hand spectra of Figure 14), Sample #3 and Sample #4 start out as virtually all NiO (strong peaks for Ni–O and Ni–Ni coordination in NiO are detected at the outset), with no Ni0 being detected. For Sample #4, Ni2+ associated with Co3O4 is shown as a solid line, while Ni2+ associated with CoO is displayed as a dashed line. The final spectra (Figure 10, right) after TPR-EXAFS shows the characteristic Ni–Ni coordination of Ni0.
Figures S1 and S2, as well as Table S1, provide EXAFS fittings for the Co K-edge and Ni K-edge data. To constrain the fitting model for EXAFS spectra following TPR-EXAFS and cooling (i.e., cobalt and nickel in metallic state), a simple model was developed where metal coordination to Ni (whether the core atom was Co or Ni) was given as a fraction, X, of metal–cobalt coordination. Using this approach, excellent fittings with low r-factors were obtained. The results are consistent with Co–Ni alloy formation, but do not prove Co–Ni alloy formation. Since Sample #4 showed large uncertainties with the model, a second constrained model (fitting #2) was performed that demonstrates that an excellent fitting can be obtained using X = 0.10.

2.3. Activity Data

Sample #4 and Sample #5 have similar surface areas of ~96 m2/g suggesting that the nickel substitution does not affect catalyst morphology. The N2 adsorption–desorption results are reported in Table 1.
Results of hydrogen chemisorption with pulse O2 titration are shown in Table 2. In agreement with the TPR-XANES results, the Ni-doped catalyst had a higher % reduction by 8–11%, depending on the method used. The Ni-doped catalyst had a slightly larger metal cluster size (approximately 2 to 3 nm larger diameter, depending on the method used).
XRD patterns for the support (Al2O3), the oxide, and reduced samples are shown in Figure 15. XRD profiles of the oxide samples are very similar showing characteristic reflection peaks of Co3O4 (i.e., 2Θ = 36.8°). No nickel diffraction peaks are distinguishable for Sample #4 suggesting the formation of Ni–Co solid solution. In contrast, the patterns for the reduced samples are quite different. In the case of the Ni-promoted catalyst (Sample #4), the cobalt seems to not be completely reduced as CoO (main diffraction peak at 2Θ = 42.8°) is still present in the catalyst, while the reflection peaks attributed to FCC metallic cobalt (main diffraction peak at 2Θ = 44.6°) can be observed for Co/Al2O3 (Sample #5). A quantitative crystallite size estimation for the reduced samples is not possible because of the poor signal/noise in the XRD patterns.
TEM and STEM of reduced Sample #4 are shown in Figure 16. The particle sizes are in the range of 18–23 nm, whereas EDS analysis confirms the presence of both Ni and Co. The uniform distribution of these two metals confirm the formation of Ni–Co solid solution as already observed from XRD. The measured Co/Ni weight ratio is ~10, very closed to the theoretical value. STEM micrographs for Sample #5 are reported in Figure 17, and the particle sizes fall within the range of 15–20 nm, similar to the nickel promoted catalyst. EDS shows that some areas are richer in cobalt (until 55 wt%), while in other areas the cobalt loading is lower than 10 wt%; however, the average loading for an extended area is close to 28 wt%.
CO conversion and product selectivity (CH4, CO2, C2–C4, and C5+) versus Time on Stream (T.o.S.) are reported in Figure 18 and Figure 19, respectively. CO conversion for Sample #4 starts at 21% and it progressively increases with T.o.S. until a steady-state value of 35.7%. On the other hand, the undoped catalyst, Sample #5, has a higher initial CO conversion of 42.5%, which slightly decreases until a value of 39.5%. The presence of nickel inverted the induction period. The performance of Sample #4 is stable after the induction period, even though the cobalt loading is lower compared to that of Sample #5.
The selectivities of Sample #4 evolve with the T.o.S. In particular, the methane selectivity decreases from 11% to 9.2%, C2–C4 selectivity drops from 18% to 8.5%, whereas the C5+ selectivity increases from 69% to 79% in the first 200 h (Figure 19). However, the methane selectivity is higher for Sample #4 than for Sample #5.

3. Discussion

From the results, it was observed that when a very low content of Ni during nanoparticle synthesis (Co–Ni 98.4:1.6) polycrystalline dendritic particles were formed with negligible Ni content. The XRD patterns showed the presence of a mixture of HCP and FCC metallic phases in the sample. However, by increasing the Ni content during the particle growth smaller Co–Ni alloy nanoparticles were obtained. The presence of Ni not only changes the atomic arrangement, but also enabled shape tuning of the particles. Furthermore, the aerobic synthesis protocol by using only oleylamine led to the formation of predominantly CoNi–O nanoparticles. The presence of 1,2-hexadecanediol seemed to have an effect. The addition of 1,2-hexadecanediol promotes the reduction of metal complexes at lower temperature compared to the synthesis protocol without using it [33], facilitating the higher percentage of Co and Ni reduction during their synthesis in Samples #1 and #2 to form metallic Co–Ni nanoparticles. Furthermore, not only did it restrict the oxidation of Co and Ni, but also the particle size in comparison with the protocol used without it [34]. This restricted oxidation was confirmed by the structural characterization through HAADF-STEM and XRD, and by the TPR-XANES profiles of Co and Ni, where the heterogenized unconventional catalysts exhibited high initial Co0 and Ni0 content (Samples #1 and 2) or high CoO/NiO content (Sample #3) in comparison with the catalyst prepared by traditional aqueous impregnation of nitrates; the conventional catalyst started in a higher oxidation state, with Co3O4 and Ni2+ associated with Co3O4. The TPR-XANES results at the Ni edge show that this Ni2+ undergoes a shift to lower energy when Co3O4 reduces to CoO in the case of the conventional catalyst prepared by aqueous impregnation. This result strongly suggests that Co and Ni are in intimate contact, supporting the alloy formation upon reduction; further evidence for alloy formation is that the NiO and CoO reduce over a similar range, such that the point of 50% reduction is identical. Although EXAFS results show that an alloy model provides an excellent fitting of the experimental results, the sizes of Co and Ni are so similar that a definitive conclusion on alloying should not be drawn from EXAFS results. The TPR-EXAFS/XANES and hydrogen chemisorption/O2 titration results demonstrate that Ni has a positive effect on improving the percentage reduction (by 8–11%) of cobalt oxides relative to the undoped catalyst. For the conventional catalysts, chemisorption results indicate that adding Ni tended to slightly increase (by 2–3 nm) the metal cluster size relative to the undoped catalyst.
Cobalt-based catalysts are usually characterized by a decrease in the activity in the first few days. The possible reasons for this deactivation are: the re-oxidation of a small Co cluster to inactive CoOX, sintering, cobalt-support mixed compound formation or some carbon deposition [35,36]. Thermodynamic calculations clearly show that spherical cobalt particle crystallites with a diameter lower than 4.4 nm may oxidize in steam–hydrogen environment [18]. This initial deactivation phenomenon was not observed for Sample #4. Thus, nickel has a stabilizing effect on the cobalt–nickel cluster; a similar stabilization was reported by Rytter et al. [37] and Nikparsa et al. [38]. Interestingly, the performance of Sample #4 is stable even after the induction period, despite having lower cobalt loading as compared to Sample #5 (i.e., the 25% Co/alumina reference catalyst).
Addition of Ni resulted in higher initial methane selectivity (~3–4% absolute); however, the difference in CH4 selectivities between the two catalysts diminished with time to ~1%. The higher methane selectivity result is not surprising, because nickel has a higher hydrogenation capability. Shafer et al. [17] explain that the back-donation of nickel is so strong that the vinylic intermediate is not suitably stabilized, precluding the chain growth. Higher methane selectivity was also reported in previous studies where different Ni/Co ratios were investigated [39,40], although recent results suggest that lower amounts (e.g., <25% [41]) of Ni favor a selectivity closer to that of pure cobalt.
Finally, we have compared the activity/$ as the two metals have different market prices and the partial substitution of cobalt with a cheaper metal would be a benefit in terms of total catalyst cost. The price of nickel is reported to be 0.47 times the price of cobalt. At steady state the activity/$ for Sample #4 is 37.5, while it is 39.6 for Sample #5. However, additional studies to find the optimal loading of nickel are needed.

4. Materials and Methods

4.1. Sample Denomination

Colloidal Method:
  • Sample #1 20% metal (98.4% at. Co/1.6% at. Ni)/Al2O3
  • Sample #2 20% metal (92.7% at. Co/7.3% at. Ni)/Al2O3
  • Sample #3 20% metal (89.7% at. Co/10.3% at. Ni)/Al2O3
Impregnation Method:
  • Sample #4 25% metal (90% at. Co/10% at. Ni)/Al2O3 calcined 350 °C
  • Sample #5 25% Co/Al2O3 calcined 350 °C

4.2. Reagents

For the synthesis of Ni–Co nanoparticles, nickel (II) chloride hexahydrate (99.99%, MilliporeSigma, St. Louis, MO, USA), cobalt (III) acetylacetonate (99.99%, Aldrich), cobalt (II) acetate tetrahydrate (98%, Aldrich), oleylamine (70%, Aldrich), 1-dodecanethiol (≥98%, MilliporeSigma, St. Louis, MO, USA) and 1,2-hexadecanediol (90%, Aldrich) was used. All reagents were purchased from Sigma-Aldrich and were used without further purification.

4.3. Preparation of Ni and Co Precursors

Oleylamine was used in the preparation of the metallic precursors. For Ni, a mixture of 100 µL of nickel (II) chloride hexahydrate (dissolved in ethanol) and 6 mL of oleylamine was magnetically stirred for 30 min at 120 °C. The temperature of the mixture was increased to 230 °C for a period of 2.5 h with continuous agitation. The Co precursor was prepared by magnetic stirring of a 0.1 M mixture of cobalt (III) acetylacetonate dissolved in oleylamine for 30 min at 120 °C, and further increasing of temperature to 150 °C for 20 min. Both solutions changed their initial color to dark brown.

4.4. Preparation of Ni–Co Nanoparticles

(a)
Co–Ni Sample #1 and #2: The Co–Ni nanoparticles were prepared as follows. 20 mL of oleylamine were previously heated to 120 °C and then the Co and Ni precursors were added to obtain two samples with a Co:Ni desired molar ratio. Then, 30 µL of a 1,2-hexadecanediol (0.3 M) is added and stirring was continued vigorously for 5 min at 170 °C. The temperature was slowly increased to 230 °C and the solution was kept 60 min more at this temperature. The resulting colloid was then cooled slowly to room temperature. Two samples were prepared with an atomic ratio of 98.4/1.6 (Sample #1) and 92.7/7.3 (Sample #2) of Co:Ni respectively. Finally, the nanoparticles were washed by centrifugation several times with a mixture of chloroform and ethanol at 4000 rpm and dried at 120 °C for 4 h.
(b)
Co–Ni Sample #3: For this synthesis method of Co–Ni nanoparticles a Co/Ni atomic ratio of 89.7/10.3 was used. Briefly, 1 mmol of CoII (acet) was completely dissolved in 4 mL of oleylamine by using magnetic stirring, and 150 µL of a NiCl2 solution (0.1 M in ethanol) was injected. The mixture was stirred and heated at 100 °C for 30 min. Then, the temperature was raised to 230 °C for 1 h. Finally, the solution was let to cool down to room temperature. The samples were further purified by centrifuging several times, precipitating and redispersing the particles with a mixture of chloroform and ethanol. The final precipitated particles were collected and dried at 120 °C for 4 h.
(c)
Co–Ni Sample #4: Sample #4 was prepared by a conventional slurry impregnation method and contained 25% metal by weight, with an atomic ratio of 90/10 of Co/Ni. Co/Alumina-Catalox 150 γ-alumina (150 m2/g) was used as a support. Cobalt nitrate (Alfa Aesar) served as the precursor to load the cobalt onto the Al2O3 support. In this method, which follows a Sasol patent [1], the ratio of the volume of solution used to the weight of alumina was 1:1, such that approximately 2.5 times the pore volume of solution was used to prepare the loading solution. Two impregnation steps were used to load 12.5% of metal by weight for each step. Between each step, the catalyst was dried under vacuum in a rotary evaporator at 60 °C, and the temperature was slowly increased to 100 °C. After the second impregnation/drying step, the catalyst was calcined in air at 350 °C for 4 h.
(d)
(d) Co Sample #5: Sample #5 was prepared in the same way as Sample #4, except no Ni was included. The weight was 25% Co.

4.5. Characterization

Characterization of Samples #1–3 was carried out in the core facilities at the UTSA. Scanning transmission electron microscopy (STEM) images of Ni–Co nanoparticles were obtained in an Ultra high-resolution cold-FEG scanning electron microscope (Hitachi 5500, Tokyo, Japan) equipped with bright field (BF) and annular dark field (ADF) detectors operating at 30 keV, and in an aberration-corrected electron microscope (JEOL ARM200F, Tokyo, Japan), operated at 200 kV in high-angle annular dark-field (HAADF) mode, spatial resolution of 0.78 Å. The instrument is equipped with a Silicon Drift Detector for energy dispersive X-ray spectrometry (EDS). Samples were prepared by dropping the nanoparticles suspension onto a carbon-coated copper grid and dried in air. X-ray diffraction (XRD) analysis was carried out using a Rigaku Ultima IV diffractometer (RIGAKU, Tokyo, Japan) equipped with a dual position graphite diffracted beam monochromator for Cu, using a Cu Kα radiation at 43 kV and 30 mA. Prior to XRD and STEM characterization, Sample #4 and Sample #5 were reduced in hydrogen (American Welding & Gas, Lexington, KY, USA) for 18 h at 350 °C, cooled down at 20 °C and then passivated with 1% O2 in nitrogen (American Welding & Gas, Lexington, KY, USA). XRD analysis was carried out with a Philips X’Pert diffractometer with monochromatic Cu Kα radiation (λ = 1.54 Å). The conditions employed included a 2Θ range of 10–90°, a scan rate of 0.01° per step, and a scan time of 4 s per step. STEM analysis was carried out with FEI Talos F200X (Thermo Scientific, Waltham, MA, USA) equipped with BF, DF2, DF4, and HAADF detectors. The imaging was performed using field emission gun and accelerating voltage of 200 kV and collected by high speed Ceta 16M camera. Data processing and analysis were carried out with Velox software (Thermo Scientific, Waltham, MA, USA). The samples were dispersed in ethanol (Alfa Aesar, Haverhill, MA, USA.), sonicated and then dropped into a carbon-coated copper grid and dried in air.
In situ H2-TPR XAFS studies were performed at the Materials Research Collaborative Access Team (MR-CAT) beamline at the Advanced Photon Source, Argonne National Laboratory. A cryogenically cooled Si (1 1 1) monochromator selected the incident energy and a rhodium-coated mirror rejected higher order harmonics of the fundamental beam energy. The experiment setup was similar to that outlined by Jacoby [42]. A stainless-steel multi-sample holder (3.0 mm i.d. channels) was used to monitor the in situ reduction of six samples during a single TPR run. Approximately 6 mg of each sample was loaded as a self-supporting wafer in each channel. The catalyst to diluent weight was approximately 1:1. The diluent was alumina. The holder was placed in the center of a quartz tube, equipped with gas and thermocouple ports and Kapton windows. The amount of sample used was optimized for the Co K-edge, considering the absorption by Al of the support; however, the Ni K edge was also analyzed. The quartz tube was placed in a clamshell furnace mounted on the positioning table. Each sample cell was positioned relative to the beam by finely adjusting the position of the table to an accuracy of 20 μm (for repeated scans). Once the sample positions were fine-tuned, the reactor was purged with He for more than 5 min at 100 mL/min and then the reactant gas (H2/He, 3.5%) was flowed through the samples (100 mL/min) and a temperature ramp of ~1.0 °C/min was initiated for the furnace to 500 °C and the sample was held at this temperature for 4 h. One exception to this was the catalyst prepared by standard impregnation methods, where the maximum temperature was 700 °C. The Co and Ni K-edge spectra were recorded in transmission mode and a Co metallic foil spectrum was measured simultaneously with each sample spectrum for energy calibration. X-ray absorption spectra for each sample were collected from 7500 to 9000 eV.
Data reduction of the EXAFS/XANES spectra was carried out using the WinXAS program [43]. The details of the XANES and EXAFS analyses for Co K-edge data are provided in the appendices of our previous article, and will not be repeated here, for the sake of brevity [5]. Ni K-edge data were processed in an analogous manner (i.e., same Δk and ΔR in fittings) with the exception of Sample #1, where the lower data quality due to the lower loading necessitated a shortening of the k-range to 3–9 Å−1. For qualitative comparisons of XANES and EXAFS data, the references used for Co3O4, CoO, and Co0 were the initial spectrum, the point of maximum CoO content, and the final spectrum of the TPR trajectory of 25% Co/Al2O3 from [5]. For NiO and Ni0, the references were NiO (Alfa Aesar, Puratronic, 99.998%, Tewksbury, MA, USA) and a Ni0 foil.
For XANES linear combination fittings, the reference compounds for Co K-edge data for Samples #1–3 were the first spectrum of Sample #3 (representing 100% Co2+) and the final spectrum of each sample after remaining at 500 °C in H2 (representing ~100% Co0). Reference compounds for Sample #4 were the initial spectrum (representing a mixture of Co2+ and Co3+ similar to Co3O4), the point of maximum CoO content, and the final spectrum after H2 TPR (representing Co0). At the Ni K-edge, Samples #1 and #2 had a high amount of Ni0, with only a small amount of Ni2+ initially; also, the data of Sample #1 were of lower quality due to the low Ni loading; LC fittings were not performed on these two samples. Reference compounds for Samples #3 were the first spectrum (Ni2+ associated with CoO) and the final spectrum after remaining at 500 °C in H2 (representing ~100% Ni0). Reference compounds for Samples #4 were the first spectrum (Ni2+ associated with Co3O4), the spectrum for Ni2+ associated with maximum CoO content, and the final spectrum after H2 TPR (representing ~100% Ni0). EXAFS data reduction and fitting were carried out using the catalysts in their final state following TPR and cooling in flowing H2 using the WinXAS [43], Atoms [44], FEFF [45], and FEFFIT [45] programs. The k-range used for the fittings was 3–10 Å−1. Fitting was confined to the first metallic coordination shell by applying a Hanning window in the Fourier transform magnitude spectra, and carrying out the back-transform to isolate that shell.
BET surface area and porosity characteristics were measured by Micromeritics 3-Flex system (Norcross, GA, USA) using N2 physisorption (UHP N2, Airgas, Lexington, KY, USA). Before testing, the temperature was slowly increased to 160 °C; then, a vacuum was pulled for at least 12 h until the sample pressure was approximately 50 mTorr. The BJH method was employed to determine the average pore diameter and pore volume. Additionally, pore size distribution was obtained as a function of pore diameter via the correlation dV/d (log D).
Hydrogen chemisorption/pulse reoxidation was performed using an Altamira (Altamira Instruments, Pittsburgh, PA, USA) AMI-300 unit. The catalyst was ramped at 2 °C/min and reduced at 350 °C for 10 h in 10 cm3/min of UHP H2 (Airgas, San Antonio, TX, USA) blended with 20 cm3/min of UHP argon (Airgas, San Antonio, TX, USA). The catalyst was cooled to 100 °C, and 30 cm3/min of UHP argon was flowed to prevent the adsorption of weakly bound hydrogen. Next, the catalyst was heated at 10 °C/min in flowing argon to 350 °C to desorb the chemisorbed hydrogen. The hydrogen temperature programmed desorption peak was integrated and compared to calibration pulses in order to determine the moles of hydrogen evolved. Pulses of UHP O2 (Airgas, San Antonio, TX, USA) were then sent to reoxidize the catalyst until saturation was achieved. Two methods were used to estimate percentage of reduction. In the conventional approach, cobalt metal was assumed to oxidize to Co3O4 and nickel metal was assumed to oxidize to NiO. However, in a second approach, we assumed that during reduction, all Co3O converted at least to CoO, and that a fraction of CoO and NiO converted to Co0 and Ni0. Thus, during reoxidation, the Co0 and Ni0 is first oxidized to CoO and NiO. Then, all CoO oxidizes to Co3O4. The two approaches set maximum and minimum limits for the metal cluster size when the uncorrected dispersion is corrected by taking into account the percentage of reduction by the metal, as follows: % Dispersion (Uncorrected) = (# metal atoms on the surface)/(# metal atoms in the sample)% Dispersion (Corrected) = (# metal atoms on the surface)/((# metal atoms in the sample)(% reduction)).

4.6. Reaction Testing

Activity tests were carried out in a lab scale rig equipped with a 1 L continuously stirred tank reactor (CSTR) (PPI, Warminster, PA, USA). Additional detail on the lab scale ring are reported in our previous work [15]. In a typical run, 9.6 g of calcined catalyst (63–125 μm) was loaded into a fixed bed reactor for ex situ reduction at 350 °C for 20 h, feeding 30 Nl/h H2/He mixture (1:3 v/v, American Welding & Gas, Lexington, KY, USA) at atmospheric pressure. The reduced catalyst was transferred to a 1 L CSTR containing 310 g of melted Polywax 3000 (Baker Petrolite, Houston, TX, USA) by pneumatic transfer under the protection of nitrogen. The transferred catalyst was reduced in situ at 230 °C and at atmospheric pressure overnight feeding 30 Nl/h pure H2 (American Welding & Gas, Lexington, KY, USA). In this work, the process conditions were: T = 220 °C, P = 300 psi, H2/CO = 2 mol/mol and a stirring speed of 750 rpm. The products and the unconverted reactants leaving the reactor were sent to a warm trap, maintained at 100 °C, and then to a cold trap held at 0 °C. The uncondensed vapor stream was reduced to atmospheric, the flowrate was measured by a wet test meter, while the composition was analyzed by online 3000A micro-GC (Agilent, Santa Clara, CA, USA) equipped with four different columns (Molecular Sieve, Plot U, Alumina and OV-1) and TCD. The reaction products were collected in three traps maintained at different temperatures; a hot trap (200 °C), a warm trap (100 °C), and a cold trap (0 °C). The products were separated into different fractions (wax, oil, and aqueous) for quantification. The oil (C4–C20) were analysed with 7890 GC (Agilent, Santa Clara, CA, USA) equipped with DB-5 (60 m × 0.32 mm × 0.25 µm, Agilent J&W) column and FID, while waxes (C21–C60) were analyzed with an HP 6890 GC equipped with ZB-1HT column (30 m × 0.25 mm × 0.10 µm, Zebron) and FID.

5. Conclusions

A wet chemical approach using oleylamine as the solvent and reducing agent was applied to prepare Co–Ni nanoparticles. Nanoparticles were characterized by HAADF-STEM, EDS, and XRD. By increasing the Ni content of the alloy from Co98.4Ni1.6 to Co92.7Ni7.3, the size and shape of the nanoparticles change from 20.5 nm dendritic particles to a core-shell morphology with 12.2 nm HCP Co–Ni alloy within the core and a 2.3 nm shell showing evidence of oxidation. Small quantities of heterogeneous catalysts were prepared by supporting the nanoparticles on alumina. Interestingly, TPR-EXAFS/XANES measurements showed that the oxidation states of Co and Ni could be tuned from being completely 2+ to being up to 80% metallic, and the reduction of Ni and Co acted in tandem. This result is of interest, because much work in FTS research has been dedicated to facilitating cobalt reduction due to the presence of strong metal oxide-support interactions.
Due to the small quantity, it was not possible to test these catalysts in a CSTR reactor used to benchmark commercial slurry operations. We therefore tested a catalyst prepared by a conventional impregnation method with subsequent calcination. This catalyst offered a different TPR-XANES pattern in that it was the only catalyst to begin with Co3O4 with NiO being associated with this oxide. The Co3O4 reduced to CoO, and the NiO XANES spectra displayed a distinct shift to lower energy when reduction of Co3O4 to CoO occurred. Following this step, NiO and CoO reduced in tandem. This indicates that Co and Ni are in intimate contact, suggesting alloy formation. This explanation was also strongly favored by results of XRD, HAADF-STEM, and EDS, which indicate that a solid solution likely formed.
Finally, the catalyst prepared by impregnation was tested for Fischer–Tropsch synthesis using a CSTR. Compared to a catalyst prepared using cobalt, the CoNi alloy catalyst exhibited lower CO conversion on a per gram catalyst basis. However, Ni addition did not impact the turnover number of cobalt to a significant degree. Moreover, a slightly higher methane selectivity was observed initially (~3–4% absolute) with the CoNi catalyst; however, with time, the difference between the two catalysts became smaller, reaching ~1%. Despite these drawbacks, adding Ni had a pronounced impact on stability, resulting in an inverted induction period. Instead of a steep decline followed by a leveling off as observed with many conventional cobalt catalysts, the CO conversion increased with time on-stream for the CoNi catalyst. To stabilize typical cobalt catalysts, companies have relied on using high Co loadings. The results here indicate that the metal nanoparticles can be stabilized by Ni addition at a lower Co percentage loading.

Supplementary Materials

The following are available online at https://www.mdpi.com/2073-4344/10/1/18/s1. Figure S1: EXAFS fittings for Co K-edge data; Figure S2: EXAFS fittings for Ni K-edge data; Table S1: Results of EXAFS fittings for data acquired near the Co and Ni K-edges for catalysts following TPR-EXAFS after cooling.

Author Contributions

Conceptualization, catalyst preparation, catalyst characterization, formal analysis, writing, G.J. Catalyst preparation, catalyst characterization, formal analysis, S.C.K. Reaction testing, characterization, formal analysis, conceptualization, writing, M.M. Project administration, resources, C.L.M. Catalyst preparation, supervision, resources, D.C.C. Catalyst characterization, data curation, resources, supervision, A.J.K. Catalyst preparation, catalyst characterization, writing, J.L.-T. Catalyst preparation, catalyst characterization, writing, R.M.-C. Catalyst preparation, catalyst characterization, writing, L.B.-D. All authors have read and agreed to the published version of the manuscript.

Funding

This research received no external funding.

Acknowledgments

JLT gratefully acknowledges the scholarship from CONACyT for the postdoctoral stay, CVU No. 219621. Argonne’s research was supported in part by the US Department of Energy (DOE), Office of Fossil Energy, National Energy Technology Laboratory (NETL). Advanced Photon Source was supported by the US Department of Energy, Office of Science, Office of Basic Energy Sciences, under Contract No. DE-AC02-06CH11357. MRCAT operations are supported by the Department of Energy and the MRCAT member institutions.

Conflicts of Interest

The authors declare no conflict of interest.

References

  1. Espinoza, R.L.; Visagie, J.L.; van Berge, P.J.; Bolder, F.H. Fischer-Tropsch catalysts containing iron and cobalt. U.S. Patent 5,733,839, 31 March 1998. [Google Scholar]
  2. van Berge, P.J.; Barradas, S.; van de Loosdrecht, J.; Visagie, J.L. Advances in the cobalt catalyzed Fischer-Tropsch synthesis. Erdoel Erdgas Kohle 2001, 117, 138–142. [Google Scholar]
  3. Glacier Resource Management Group. InvestmentMine. Available online: http://www.infomine.com/investment/ (accessed on 15 November 2019).
  4. Jacobs, G.; Das, T.K.; Zhang, Y.; Li, J.; Racoillet, G.; Davis, B.H. Fischer-Tropsch synthesis: Support, loading and promoter effects on the reducibility of cobalt catalysts. Appl. Catal. A Gen. 2002, 233, 263–281. [Google Scholar] [CrossRef]
  5. Jacobs, G.; Ji, Y.; Davis, B.H.; Cronauer, D.C.; Kropf, A.J.; Marshall, C.L. Fischer-Tropsch synthesis: Temperature programmed EXAFS/XANES investigation of the influence of support type, cobalt loading, and noble metal promoter addition to the reduction behavior of cobalt oxide particles. Appl. Catal. A Gen. 2007, 333, 177–191. [Google Scholar] [CrossRef]
  6. Jacobs, G.; Chaney, J.A.; Patterson, P.M.; Das, T.K.; Maillot, J.C.; Davis, B.H. Fischer-Tropsch synthesis: Study of the promotion of Pt on the reduction property of Co/Al2O3 catalysts by in situ EXAFS of Co K and Pt LIII edges and XPS. J. Synchrotron Radiat. 2004, 11, 414–422. [Google Scholar] [CrossRef] [PubMed] [Green Version]
  7. Cook, K.M.; Perez, H.D.; Bartholomew, C.H.; Hecker, W.C. Effect of promoter deposition order on platinum-, ruthenium-, or rhenium-promoted cobalt Fischer-Tropsch catalysts. Appl. Catal. A Gen. 2014, 482, 275–286. [Google Scholar] [CrossRef]
  8. Cook, K.M.; Hecker, W.C. Reducibility of alumina-supported cobalt Fischer-Tropsch catalysts: Effects of noble metal type, distribution, retention, chemical state, bonding, and influence on cobalt crystallite size. Appl. Catal. A Gen. 2012, 449, 69–80. [Google Scholar] [CrossRef]
  9. Ma, W.; Jacobs, G.; Ji, Y.; Bhatelia, T.; Bukur, D.B.; Khalid, S.; Davis, B.H. Fischer-Tropsch synthesis: Influence of CO conversion on selectivities, H2/CO usage ratios, and catalyst stability for a Ru promoted Co/Al2O3 catalyst using a slurry phase reactor. Top. Catal. 2011, 54, 757–767. [Google Scholar] [CrossRef]
  10. Iglesia, E.; Soled, S.L.; Fiato, R.A.; Via, G.H. Bimetallic synergy in cobalt-ruthenium Fischer-Tropsch synthesis catalysts. J. Catal. 1993, 143, 345–368. [Google Scholar] [CrossRef]
  11. Hilmen, A.M.; Schanke, D.; Holmen, A. TPR study of the mechanism of rhenium promotion of alumina-supported cobalt Fischer-Tropsch catalysts. Catal. Lett. 1996, 38, 143–147. [Google Scholar] [CrossRef]
  12. Vada, S.; Hoff, A.; Ådnanes, E.; Schanke, D.; Holmen, A. Fischer-Tropsch synthesis on supported cobalt catalysts promoted by platinum and rhenium. Top. Catal. 1995, 2, 155–162. [Google Scholar] [CrossRef]
  13. Ronning, M.; Nicholson, D.G.; Holmen, A. In situ EXAFS study of the bimetallic interaction in a rhenium-promoted alumina-supported cobalt Fischer-Tropsch catalyst. Catal. Lett. 2001, 72, 141–146. [Google Scholar] [CrossRef]
  14. Jacobs, G.; Chaney, J.A.; Patterson, P.M.; Das, T.K.; Davis, B.H. Fischer-Tropsch synthesis: Study of the promotion of Re on the reduction property of Co/Al2O3 catalysts by in situ EXAFS/XANES of Co K and Re LIII edges and XPS. Appl. Catal. A 2004, 264, 203–212. [Google Scholar] [CrossRef]
  15. Jacobs, G.; Ribeiro, M.C.; Ma, W.; Ji, Y.; Khalid, S.; Sumodjo, P.T.A.; Davis, B.H. Group 11 (Cu, Ag, Au) promotion of 15%Co/Al2O3 Fischer-Tropsch catalysts. Appl. Catal. A Gen. 2009, 361, 137–151. [Google Scholar] [CrossRef]
  16. Jermwongratanachai, T.; Jacobs, G.; Ma, W.; Shafer, W.D.; Gnanamani, M.K.; Gao, P.; Kitiyanan, B.; Davis, B.H.; Klettlinger, J.L.S.; Yen, C.H.; et al. Fischer-Tropsch synthesis: Comparisons between Pt and Ag promoted Co/Al2O3 catalysts for reducibility, local atomic structure, catalytic activity, and oxidation-reduction (OR) cycles. Appl. Catal. A 2013, 464–465, 165–180. [Google Scholar] [CrossRef]
  17. Shafer, W.D.; Gnanamani, M.K.; Graham, U.M.; Yang, J.; Masuku, C.M.; Jacobs, G.; Davis, B.H. Fischer-Tropsch: Product Selectivity—The Fingerprint of Synthetic Fuels. Catalysts 2019, 9, 259. [Google Scholar] [CrossRef] [Green Version]
  18. van Steen, E.; Claeys, M.; Dry, M.E.; van de Loosdrecht, J.; Viljoen, E.L.; Visagie, J.L. Stability of nanocrystals: Thermodynamic analysis of oxidation and re-reduction of cobalt in water/hydrogen mixtures. J. Phys. Chem. B 2005, 109, 3575–3577. [Google Scholar] [CrossRef]
  19. Jacobs, G.; Das, T.K.; Patterson, P.M.; Luo, M.; Conner, W.A.; Davis, B.H. Fischer-Tropsch synthesis: Effect of water on Co/Al2O3 catalysts and XAFS characterization of reoxidation phenomena. Appl. Catal. A 2004, 270, 65–76. [Google Scholar] [CrossRef]
  20. Logdberg, S.; Boutonnet, M.; Walmsley, J.C.; Jaras, S.; Holmen, A.; Blekkan, E.A. Effect of water on the space-time yield of different supported cobalt catalysts during Fischer-Tropsch synthesis. Appl. Catal. A 2011, 393, 109–121. [Google Scholar] [CrossRef]
  21. Hughes, N.A.; Gloriot, V.; Smiley, D.D.; Jacobs, G.; Pendyala, V.R.R.; Graham, U.M.; Ma, W.; Gnanamani, M.K.; Shafer, W.D.; Maclennan, A.; et al. Fischer-Tropsch synthesis: comparisons of Al2O3 and TiO2 supported Co catalysts prepared by aqueous impregnation and CVD methods. In Fischer-Tropsch Synthesis, Catalysts and Catalysis: Advances and Applications; Davis, B.H., Occelli, M.L., Eds.; CRC Press, Taylor & Francis Group: Boca Raton, FL, USA, 2016; Ch. 6; pp. 85–106. [Google Scholar]
  22. Singh, A.K.; Xu, Q. Synergistic catalysis over bimetallic alloy nanoparticles. ChemCatChem 2013, 5, 652–676. [Google Scholar] [CrossRef]
  23. Nam, K.M.; Shim, J.H.; Han, D.W.; Kwon, H.S.; Kang, Y.M.; Li, Y.; Song, H.; Seo, W.S.; Park, J.T. Syntheses and characterization of wurtzite CoO, rocksalt CoO, and spinel Co3O4 nanocrystals: Their interconversion and tuning of phase and morphology. Chem. Mater. 2010, 22, 4446–4454. [Google Scholar] [CrossRef]
  24. Morelos-Santos, O.; de la Torre, A.R.; Schacht-Hernández, P.; Portales-Martínez, B.; Soto-Escalante, I.; Mendoza-Martínez, A.M.; Mendoza-Cruz, R.; Velázquez-Salazar, J.J.; José-Yacamán, M. NiFe2O4 Nanocatalyst for Heavy Crude Oil Upgrading in Low Hydrogen/Feedstock Ratio. Catal. Today 2019. [Google Scholar] [CrossRef]
  25. Hu, L.; Wu, L.; Liao, M.; Hu, X.; Fang, X. Electrical transport properties of large, individual NiCo2O4 nanoplates. Adv. Funct. Mater. 2012, 22, 998–1004. [Google Scholar] [CrossRef]
  26. Taylor, A.; Floyd, R.W. Precision measurements of lattice parameters of non-cubic crystals. Acta Crystallogr. 1950, 3, 285–289. [Google Scholar] [CrossRef]
  27. Nishizawa, T.; Ishida, K. The Co-Ni (Cobalt-Nickel) System. Bull. Alloy Phase Diagr. 1983, 4, 390–395. [Google Scholar] [CrossRef]
  28. Downs, R.T.; Bartelmehs, K.; Gibbs, G.; Boisen, M. Interactive Software for Calculating and Displaying X-Ray or Neutron Powder Diffractometer Patterns of Crystalline Materials. Am. Mineral. 1993, 78, 1104–1107. [Google Scholar]
  29. Mendoza-Cruz, R.; Bazán-Diaz, L.; Velázquez-Salazar, J.J.; Samaniego-Benitez, J.E.; Ascencio-Aguirre, F.M.; Herrera-Becerra, R.; José-Yacamán, M.; Guisbiers, G. Order-disorder phase transitions in Au-Cu nanocubes: From nano-thermodynamics to synthesis. Nanoscale 2017, 9, 9267–9274. [Google Scholar] [CrossRef] [Green Version]
  30. Guisbiers, G.; Mendoza-Pérez, R.; Bazán-Díaz, L.; Mendoza-Cruz, R.; Velázquez-Salazar, J.J.; José-Yacamán, M. Size and shape effects on the phase diagrams of nickel-based bimetallic nanoalloys. J. Phys. Chem. C 2017, 121, 6930–6939. [Google Scholar] [CrossRef]
  31. Gallego, G.S.; Batiot-Dupeyrat, C.; Barrault, J.; Florez, E.; Mondragon, F. Dry Reforming of Methane over LaNi1−yByO3±δ (B = Mg, Co) Perovskites Used as Catalyst Precursor. Appl. Catal. A Gen. 2008, 334, 251–258. [Google Scholar] [CrossRef]
  32. Li, H.; Liao, J.; Du, Y.; You, T.; Liao, W.; Wen, L. Magnetic-Field-Induced Deposition to Fabricate Multifunctional Nanostructured Co, Ni, And Coni Alloy Films as Catalysts, Ferromagnetic and Superhydrophobic Materials. Chem. Commun. 2013, 49, 1768–1770. [Google Scholar] [CrossRef]
  33. Sun, S.; Zeng, H.; Robinson, D.B.; Raoux, S.; Rice, P.M.; Wang, S.X.; Li, G. Monodisperse mfe2o4 (m = fe, co, mn) nanoparticles. J. Am. Chem. Soc. 2004, 126, 273–279. [Google Scholar] [CrossRef]
  34. Mourdikoudis, S.; Liz-Marzan, L.M. Oleylamine in nanoparticle synthesis. Chem. Mater. 2013, 25, 1465–1476. [Google Scholar] [CrossRef]
  35. Tsakoumis, N.E.; Ronning, M.; Borg, O.; Rytter, E.; Holmen, A. Deactivation of cobalt based Fischer-Tropsch catalyst: A review. Catal. Today 2010, 154, 162–182. [Google Scholar] [CrossRef]
  36. Jahangiri, H.; Bennet, J.; Mahjoubi, P.; Wilson, K.; Gu, S. A review of advanced catalyst development for Fischer-Tropsch synthesis of hydrocarbon from biomass derived syn-gas. Catal. Sci. Technol. 2014, 4, 2210–2229. [Google Scholar] [CrossRef] [Green Version]
  37. Rytter, E.; Skagseth, T.H.; Eri, S.; Sjastad, A.O. Cobalt Fischer-Tropsch catalysts using nickel promoter as a rhenium substitute to suppress deactivation. Ind. Eng. Chem. Res. 2010, 49, 4140–4148. [Google Scholar] [CrossRef]
  38. Nikparsa, P.; Mirzaei, A.A.; Rauch, R. Modification of Co/Al2O3 Fischer-Tropsch nanocatalysts by adding Ni: A kinetic approach. Int. J. Chem. Kinet. 2016, 48, 131–143. [Google Scholar] [CrossRef]
  39. Shimura, K.; Miyazawa, T.; Hanaoka, T.; Hirata, S. Fischer-Tropsch synthesis over alumina supported bimetallic Co-Ni catalyst: Effect of impregnation sequence and solution. J. Mol. Catal. 2015, 407, 15–24. [Google Scholar] [CrossRef]
  40. Yu, H.; Zhao, A.; Zhang, H.; Ying, W.; Fang, D. Bimetallic catalyst of Co and Ni for Fischer-Tropsch synthesis supported on alumina. Energy Sources Part A Recovery Util. Environ. Eff. 2015, 37, 47–54. [Google Scholar] [CrossRef]
  41. van Helden, P.; Prinsloo, F.; van den Berg, J.A.; Xaba, B.; Erasmus, W.; Claeys, M.; van de Loosdrecht, J. Cobalt-nickel bimetallic Fischer-Tropsch catalysts: A combined theoretical and experimental approach. Catal. Today 2020, 342, 88–98. [Google Scholar] [CrossRef]
  42. Jacoby, M. X-ray absorption spectroscopy. Chem. Eng. News 2001, 79, 33–38. [Google Scholar] [CrossRef]
  43. Ressler, T. WinXAS: A Program for X-ray Absorption Spectroscopy Data Analysis under MS-Windows. J. Synchrotron Radiat. 1998, 5, 118–122. [Google Scholar] [CrossRef]
  44. Ravel, B. ATOMS: Crystallography for the X-ray absorption spectroscopist. J. Synchrotron Radiat. 2001, 8, 314–316. [Google Scholar] [CrossRef] [PubMed] [Green Version]
  45. Newville, M.; Ravel, B.; Haskel, D.; Rehr, J.J.; Stern, E.A.; Yacoby, Y. Analysis of multiple-scattering XAFS data using theoretical standards. Phys. B Condens. Matter 1995, 208–209, 154–156. [Google Scholar] [CrossRef]
Figure 1. Sample #1. (a) Low-magnification and (b) high-magnification HAADF-STEM images of the Co98.4Ni1.6 nanoparticles. (c) EDS spectrum and (d) EDS maps taken from a group of nanoparticles. The Co K and Co L lines are plotted for reference.
Catalysts 10 00018 g001
Figure 2. Sample #2. (a) Low-magnification and (b) high-magnification HAADF-STEM images of the synthesized Co–Ni 92.7:7.3 nanoparticles. (c) EDS maps and (d) EDS spectrum (up) taken from a group of nanoparticles. The Co K and Co L lines, as well as the Ni K and Ni L lines are plotted for reference. d) EDS line scan (down) crossing at the middle of the particle as shown in the inset, confirming the presence of both Co and Ni within the particle.
Catalysts 10 00018 g002
Figure 3. Sample #3. (a) SEM image of the synthesized Co89.7Ni10.3 sample. (b) High-magnification HAADF-STEM image of a single CoNi–O nanoparticle. (c) EDS spectrum and (d) EDS maps taken from a group of nanoparticles. The Co and Ni K and L lines are shown for reference in the spectrum.
Catalysts 10 00018 g003
Figure 4. XRD patterns of (a) Co98.4Ni1.6 (Sample #1) and (b) Co92.7Ni7.3 (Sample #2) nanoparticles. The patterns showed the presence of both HCP (red labels) and FCC (black labels) cobalt structure. (c) XRD pattern of Co89.7Ni10.3 (Sample #3). The pattern matched with a Co1−xNixO FCC solid solution.
Catalysts 10 00018 g004
Figure 5. H2-TPR-XANES spectra at the Co K-edge of Samples (a) #1, (b) #2, (c) #3, and (d) #4 (note difference in scale). (Cyan) is reduction of Co3O4 to CoO, and (Green) CoO to Co0.
Catalysts 10 00018 g005
Figure 6. Linear combination fittings of H2 TPR-XANES spectra of Samples (a) #1, (b) #2, (c) #3, and (d) #4. The reference compounds for Samples #1–3 were the first spectrum of Sample #3 (representing 100% Co2+) and the final spectrum of each sample after remaining at 500 °C in H2 (representing ~100% Co0). Reference compounds for Sample #4 were the initial spectrum (representing a mixture of Co2+ and Co3+ similar to Co3O4), the point of maximum CoO content, and the final spectrum following TPR and holding (representing Co0). Note difference in scale for (d).
Catalysts 10 00018 g006
Figure 7. XANES snapshots at the Co K-edge of reference compounds, and (a) the point of maximum Co3O4 content in the H2 TPR-XANES run, (b) the point of maximum CoO content in the H2 TPR-XANES run, (c) the point at 500 °C, and (d) the point of maximum Co0 content in the H2 TPR-XANES run for each catalyst sample (following ramping and holding at Tmax), including (1) Sample #1, (2), Sample #2, (3) Sample #3, and (4) Sample #4. Note that only Sample #4 displayed Co3O4 content (i.e., in the initial period).
Catalysts 10 00018 g007
Figure 8. H2-TPR-XANES spectra at the Ni K-edge of samples (a) #1, (b) #2, (c) #3, and (d) #4. (Cyan) is Ni2+ (e.g., NiO) associated with cobalt oxides during reduction of Co3O4 to CoO. (Green) is reduction of Ni2+ to Ni0 when NiO reduction is associated with CoO reduction to Co0.
Catalysts 10 00018 g008
Figure 9. Linear combination fittings of H2-TPR-XANES spectra of Samples (a) #3 and (b) #4. Reference compounds for Samples #3 were the first spectrum (Ni2+ associated with CoO) and the final spectrum after remaining at 500 °C in H2 (representing ~100% Ni0). Reference compounds for Samples #4 were the first spectrum (Ni2+ associated with Co3O4), the spectrum for Ni2+ associated with maximum CoO content, and the final spectrum after H2 TPR (representing ~100% Ni0).
Catalysts 10 00018 g009
Figure 10. XANES snapshots at the Ni K-edge of reference compounds, and (a) the point of maximum NiO content in the H2 TPR-XANES run, and (b) the point at 500 °C, and (c) the point of maximum Ni0 content in the H2 TPR-XANES run for each catalyst sample (following ramping and holding at Tmax), including (1) Sample #1, (2), Sample #2, (3) Sample #3, and (4) Sample #4. Note that Samples #1 and #2 displayed very little NiO even in the initial spectra (compare 1a with 1c and compare 2a with 2c; they are very similar). Spectrum 4a: (Solid line) initial spectrum-NiO associated with Co3O4; (dashed line) spectrum at 335 °C-NiO associated with CoO.
Catalysts 10 00018 g010
Figure 11. H2-TPR-EXAFS spectra near the Co K-edge of samples (a) #1, (b) #2, (c) #3, and (d) #4. (Cyan) is reduction of Co3O4 to CoO, and (Green) is reduction of CoO to Co0.
Catalysts 10 00018 g011
Figure 12. EXAFS snapshots near the Co K-edge of reference compounds, and (A) the point of maximum Co3O4 content, a, in the H2 TPR-XANES run, (B) the point of maximum CoO content, b, in the H2 TPR-XANES run, and (C) the point of maximum Co0 content, c, in the H2 TPR-XANES run after the hold at Tmax, for each catalyst sample, including (1) Sample #1, (2), Sample #2, (3) Sample #3, and (4) Sample #4. Note that only Sample #4 displayed Co3O4 content (i.e., in the initial period). Dashed lines denote Co–Co coordination in the oxides and metallic state, while the lower distance peak in (top) and (left) spectra at ~1.2 angstroms represents Co–O coordination.
Catalysts 10 00018 g012
Figure 13. H2-TPR-EXAFS spectra near the Ni K-edge of samples (a) #3, and (b) #4. (Cyan) is Ni2+ (e.g., NiO) associated with cobalt oxides during reduction of Co3O4 to CoO. (Green) is reduction of Ni2+ to Ni0 when NiO associated with CoO reduction to Co0.
Catalysts 10 00018 g013
Figure 14. EXAFS snapshots near the Ni K-edge of reference compounds, (A) the point of maximum NiO content, a, in the H2 TPR-XANES run, and (B) the point of maximum Ni0 content, b, in the H2 TPR-XANES run, for each catalyst sample, including (1) Sample #1, (2), Sample #2, (3) Sample #3, and (4) Sample #4. Vertical dashed lines denote Ni–Ni coordination in the oxides and metallic state, while the lower distance peak in the left-hand spectra at ~1.2 angstroms represents Ni–O coordination. Spectrum 4a: (Solid line) initial spectrum-NiO associated with Co3O4; (dashed line) spectrum at 335 °C-NiO associated with CoO.
Catalysts 10 00018 g014
Figure 15. XRD patterns for (a) Al2O3, (b) oxide Sample #5, (c) oxide Sample #4, (d) reduced Sample #5 and (e) reduced Sample #4.
Catalysts 10 00018 g015
Figure 16. (a) TEM and (b) high-magnification HAADF-STEM image of Sample #4 with EDS maps. Elemental mapping legend: (c) cobalt and nickel, (d) aluminum, cobalt, and nickel, (e) cobalt, (f) nickel, and (g) aluminum. (Red) Cobalt, (Yellow) Nickel, and (Green) Aluminum.
Catalysts 10 00018 g016
Figure 17. (a) High-magnification HAADF-STEM image of Sample #5 and EDS maps, including (b) aluminum and cobalt, (c) cobalt, and (d) aluminum. Elemental mapping legend: (Red) Cobalt and (Green) Aluminum.
Catalysts 10 00018 g017
Figure 18. Evolution with T.o.S. of CO conversion for Sample #4 (open circle) and Sample #5 (filled circle), process conditions: T = 220 °C, P = 20.6 bar, H2/CO = 2 mol/mol, SV = 3.4 slph per gcat.
Catalysts 10 00018 g018
Figure 19. Evolution with T.o.S. of (a) CH4, (b) CO2, (c) C2-C4, and (d) C5+ selectivity for Sample #4 (open circle) and Sample #5 (filled circle), process conditions: T = 220 °C, P = 20.6 bar, H2/CO = 2 mol/mol, SV = 3.4 slph per gcat.
Catalysts 10 00018 g019
Table 1. Brunauer-Emmett-Teller (BET) and Barrett-Joyner-Halenda (BJH) data of the samples.
Sample IDAs (BET)
[m2/g]
Vp
[cm3/g]
Dp
[nm]
Sample #495.50.2439.3
Sample #596.50.2269.3
Table 2. H2 chemisorption and pulse O2 titration.
μmol H2 Desorbed/gcatUncorr.% Disp.Uncorr.Diam. (nm)O2 Uptake (μmol/gcat)* % Red.** % Red.* Corr. % Disp.** Corr. % Disp.* Corr. Diam. (nm) ** Corr. Diam. (nm)
Sample #4—25%metal (90%Co-10%Ni)/Al2O3
92.54.424149554.640.58.010.812.99.6
Sample #5—25%Co/Al2O3
91.34.324132446.829.19.214.811.27.0
* method #1 assuming Co0 oxidizes to Co3O4 and Ni0 oxidizes to NiO. ** method #2 assuming all Co3O4 reduced to CoO and some CoO and NiO reduced to Co0 and Ni0. During oxidation, then, the Co0 and Ni0 oxidize to CoO and NiO, and all CoO oxidizes to Co3O4.

