Effect of Reduction of Pt–Sn/α-Al2O3 on Catalytic Dehydrogenation of Mixed-Paraffin Feed


Abstract
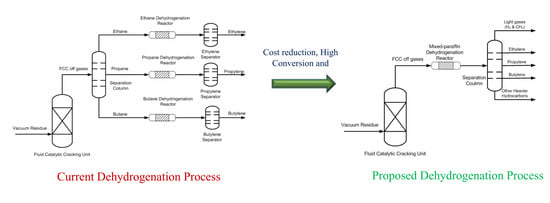
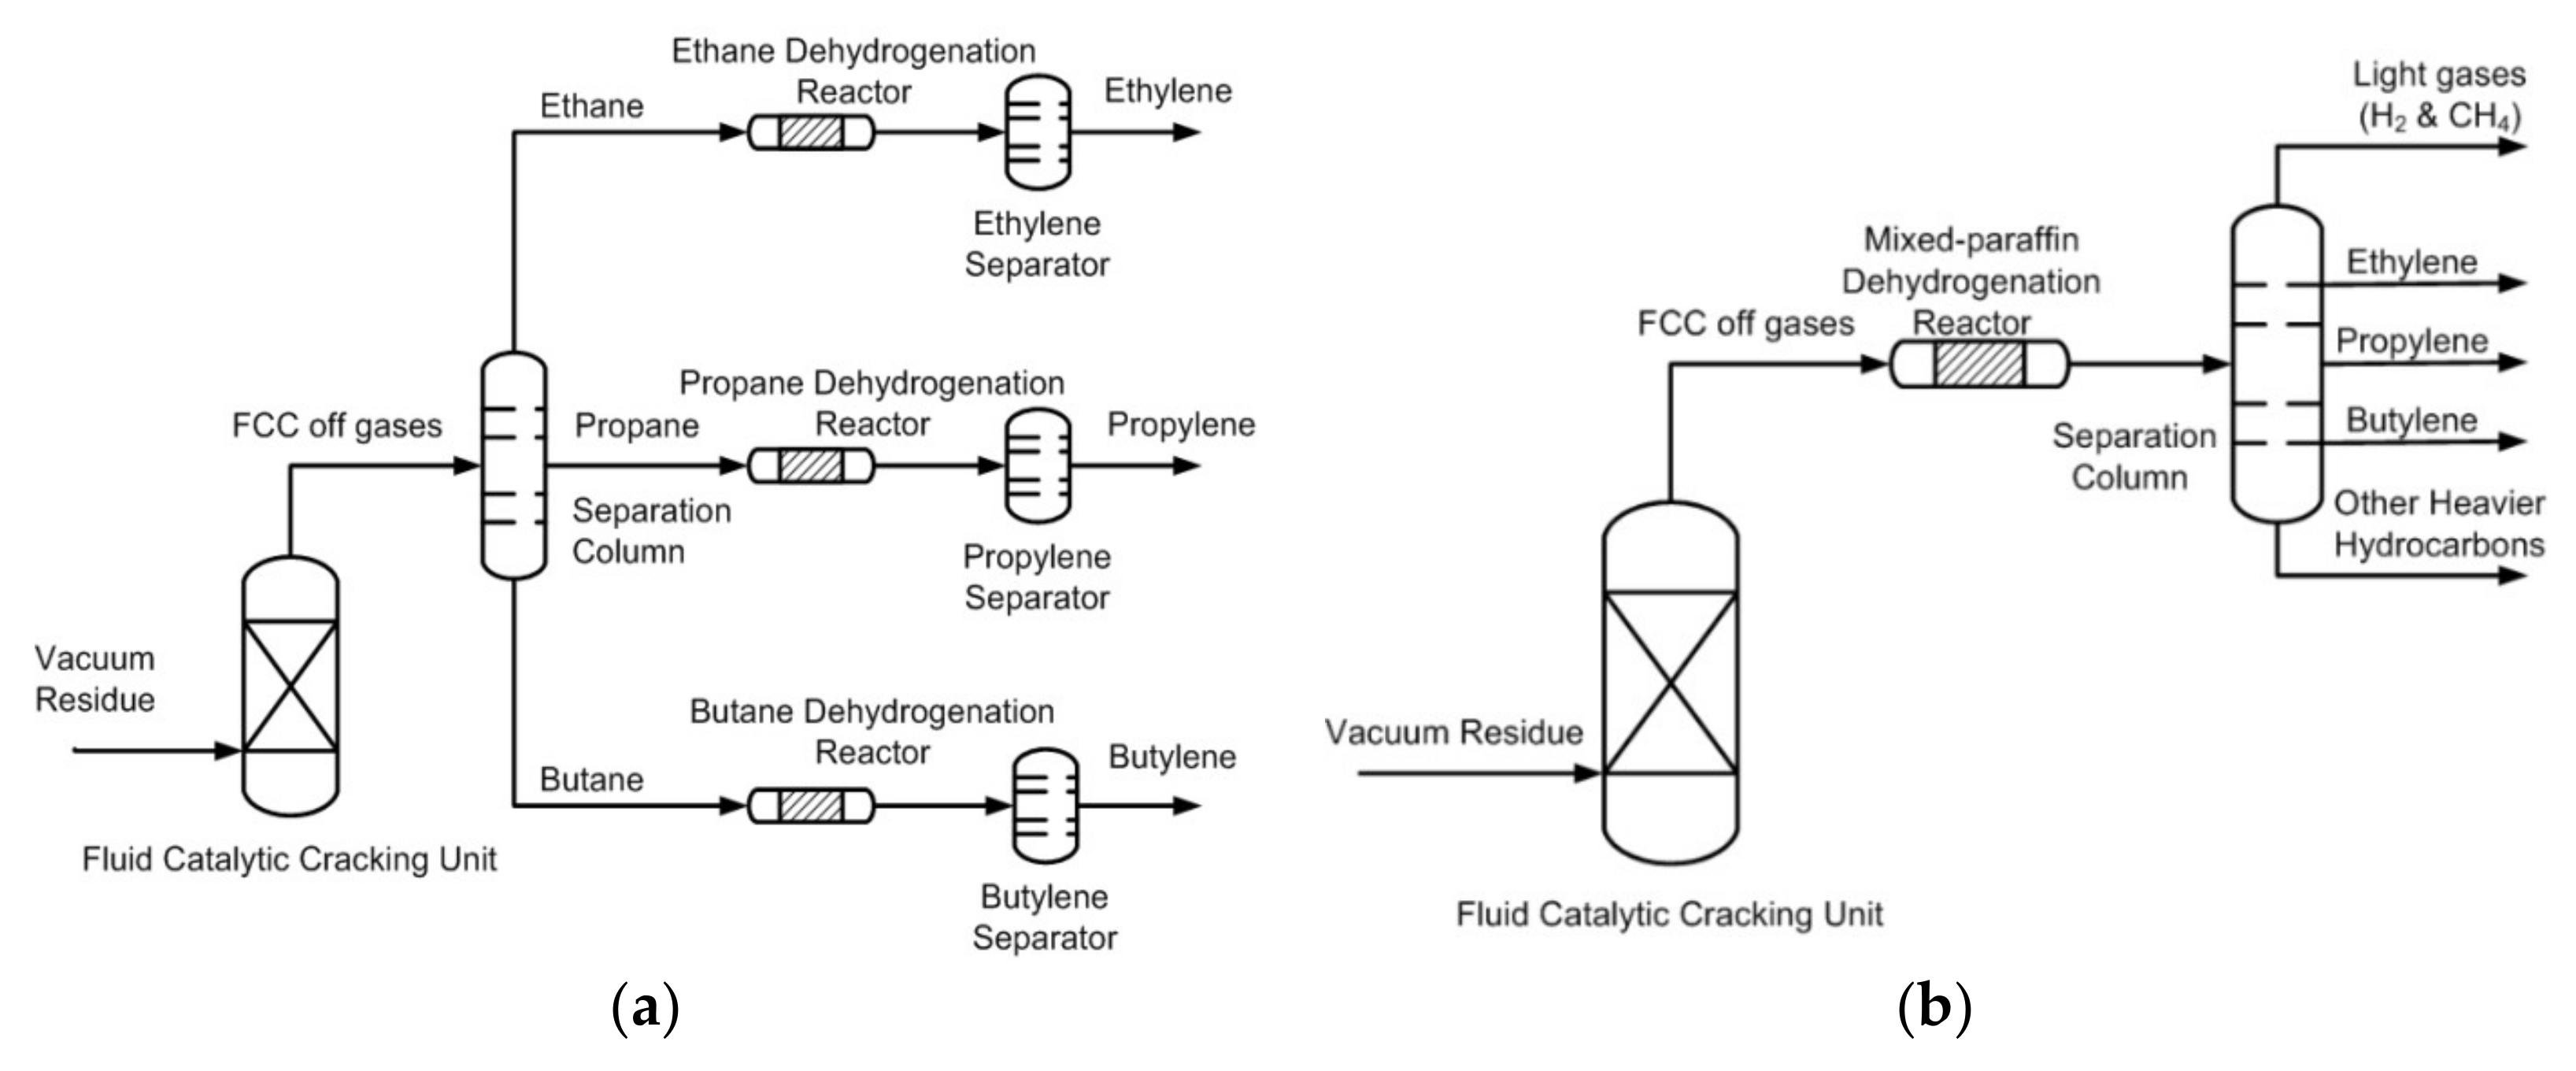
1. Introduction
2. Results and Discussion
2.1. Characterization Results
2.1.1. Brunauer–Emmett–Teller (BET) Measurements
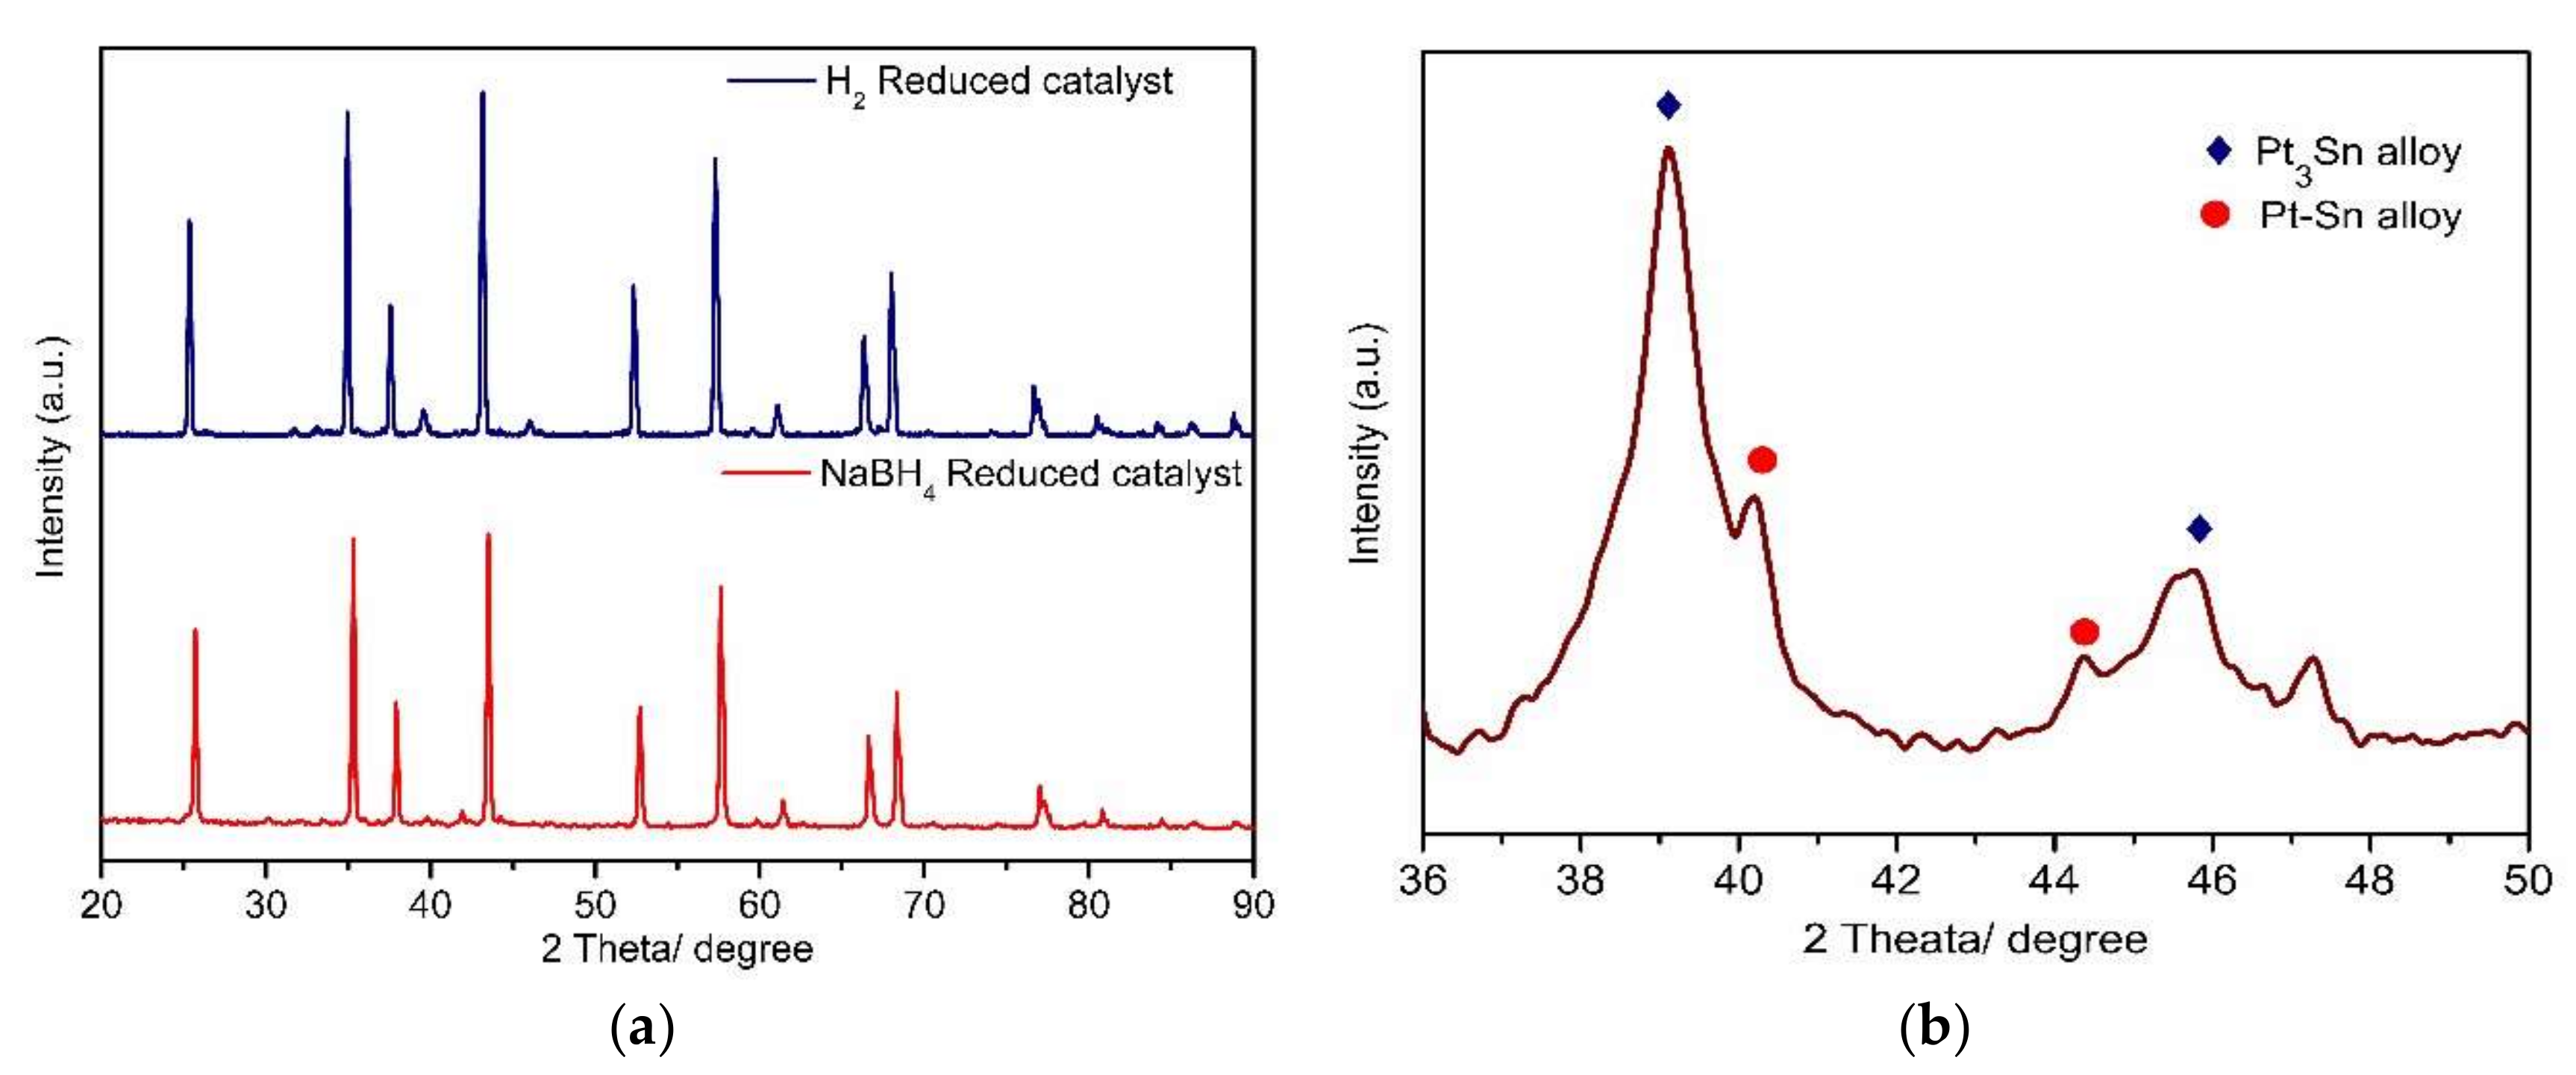
2.1.2. XRD Analysis
2.1.3. SEM and EDX Analysis
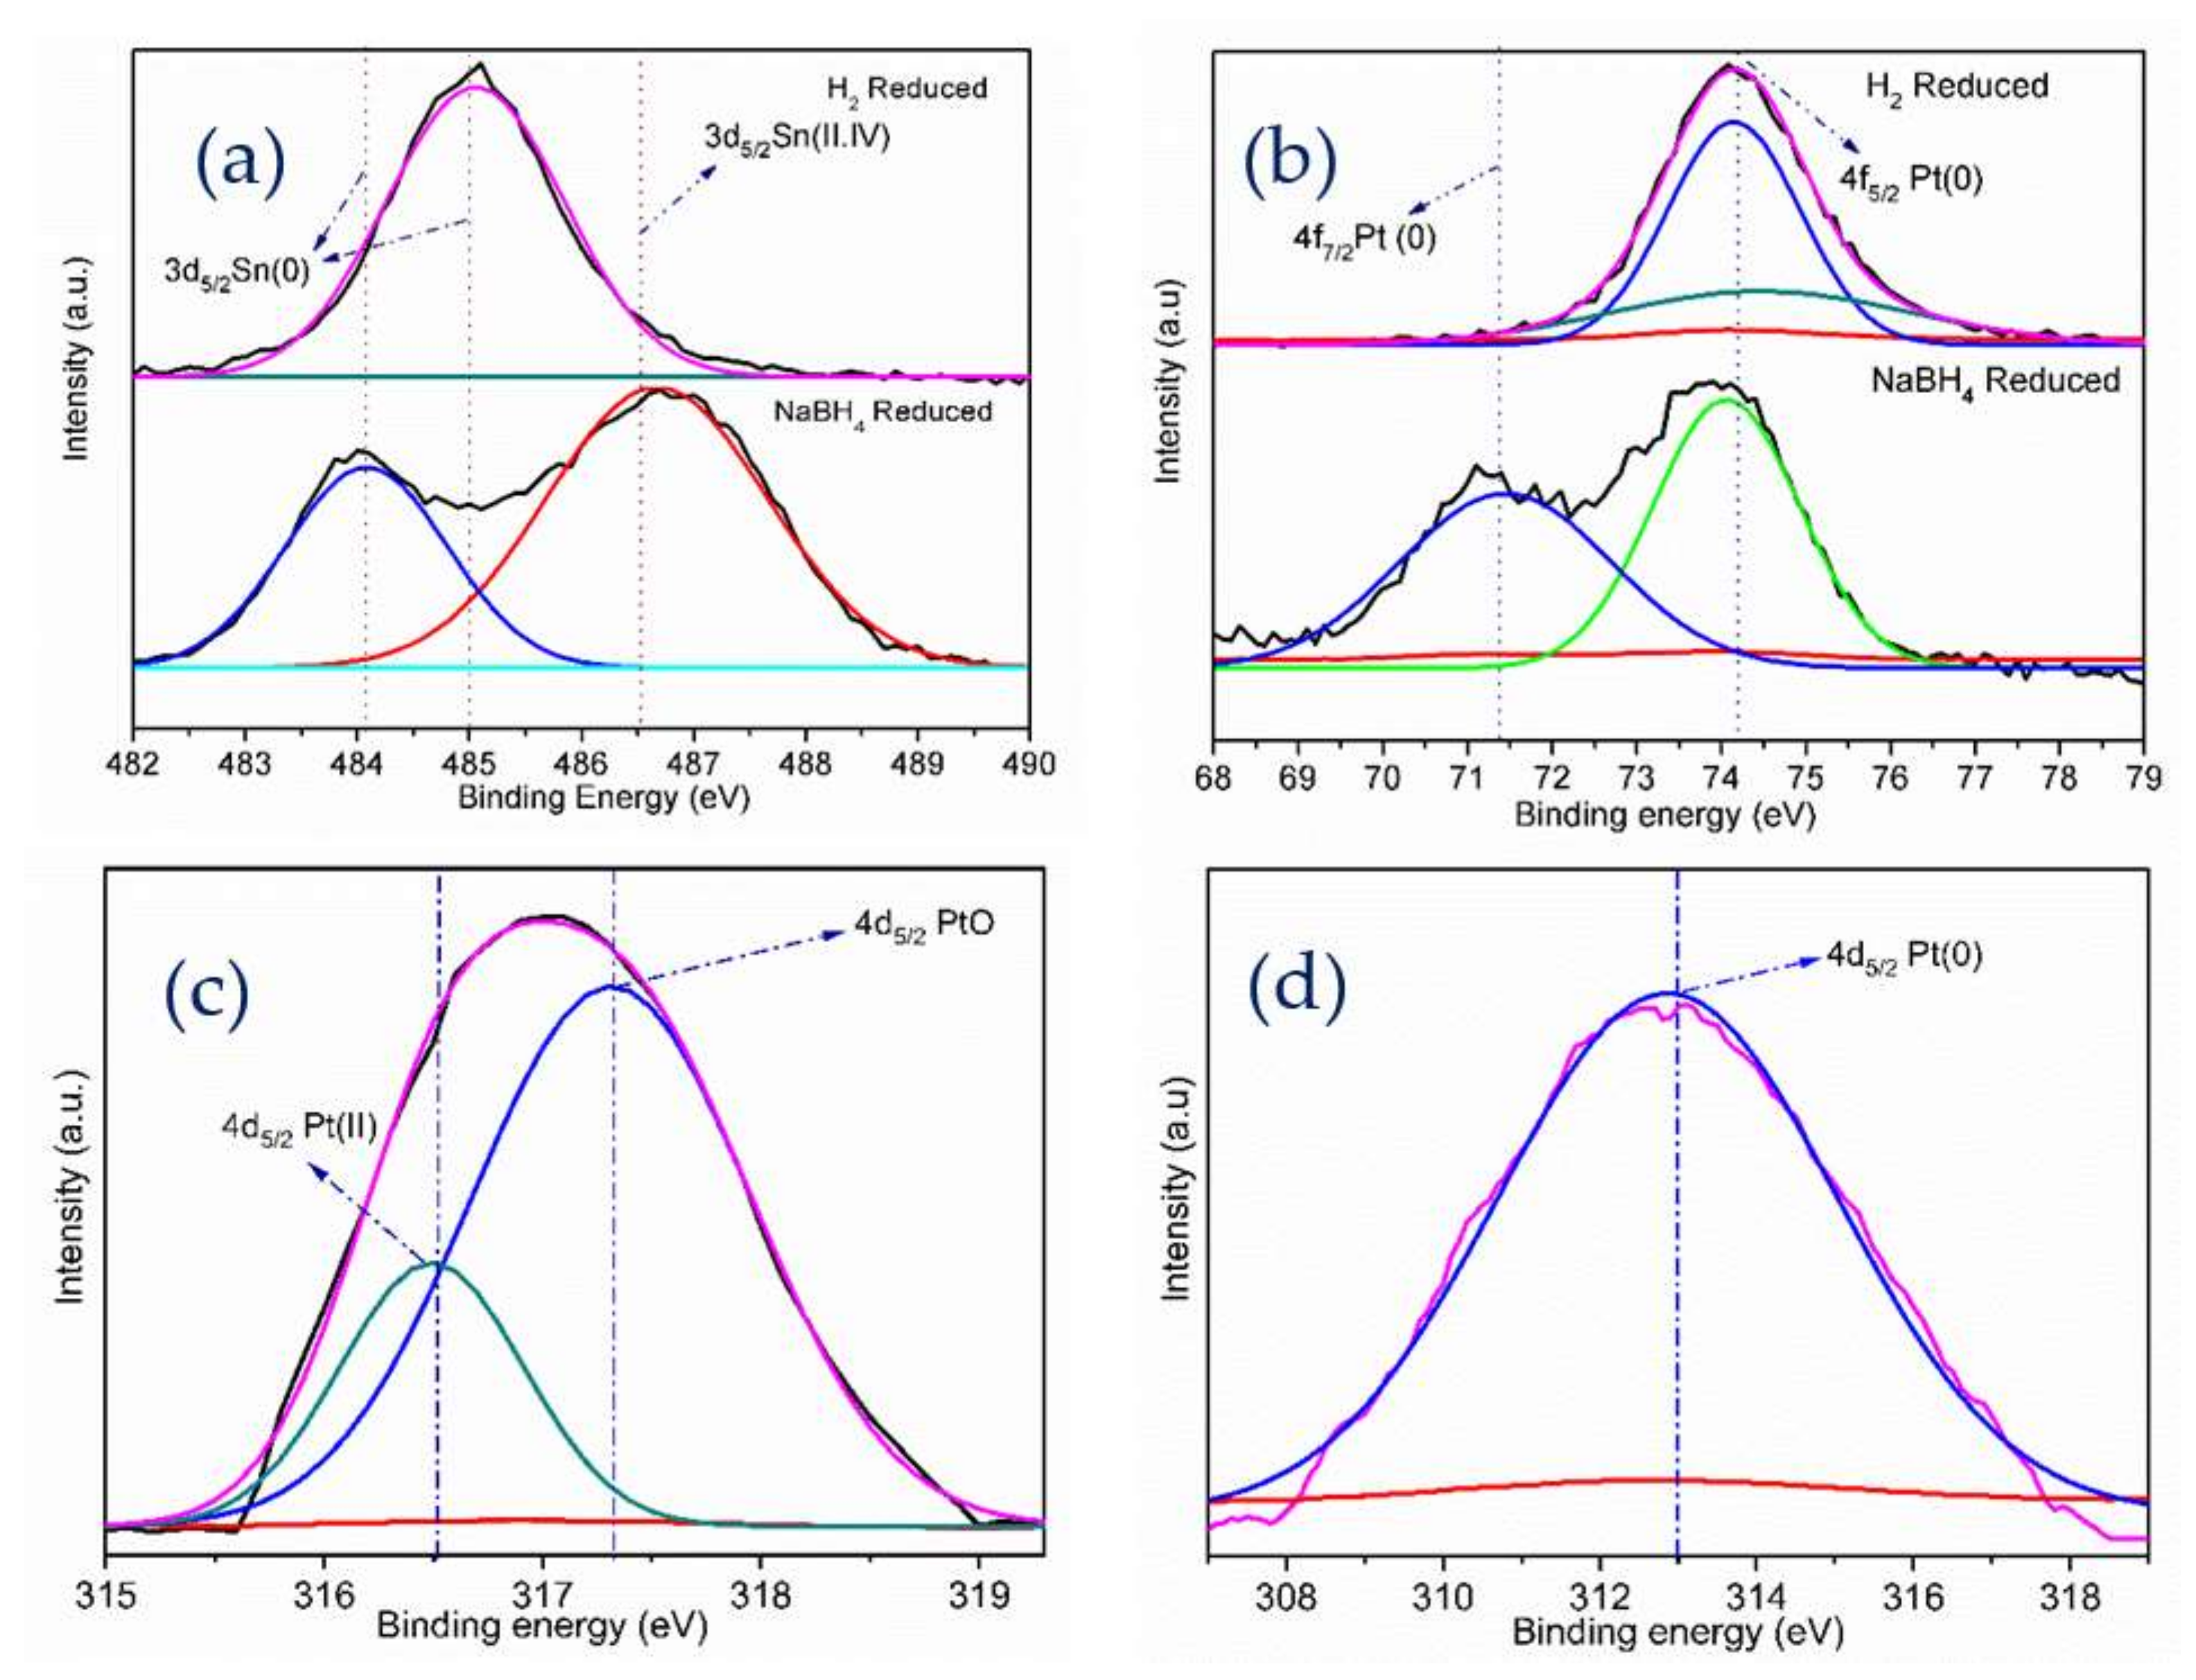
2.1.4. XPS Analysis
2.2. Dehydrogenation Catalytic Performance Studies
2.2.1. Blank Test
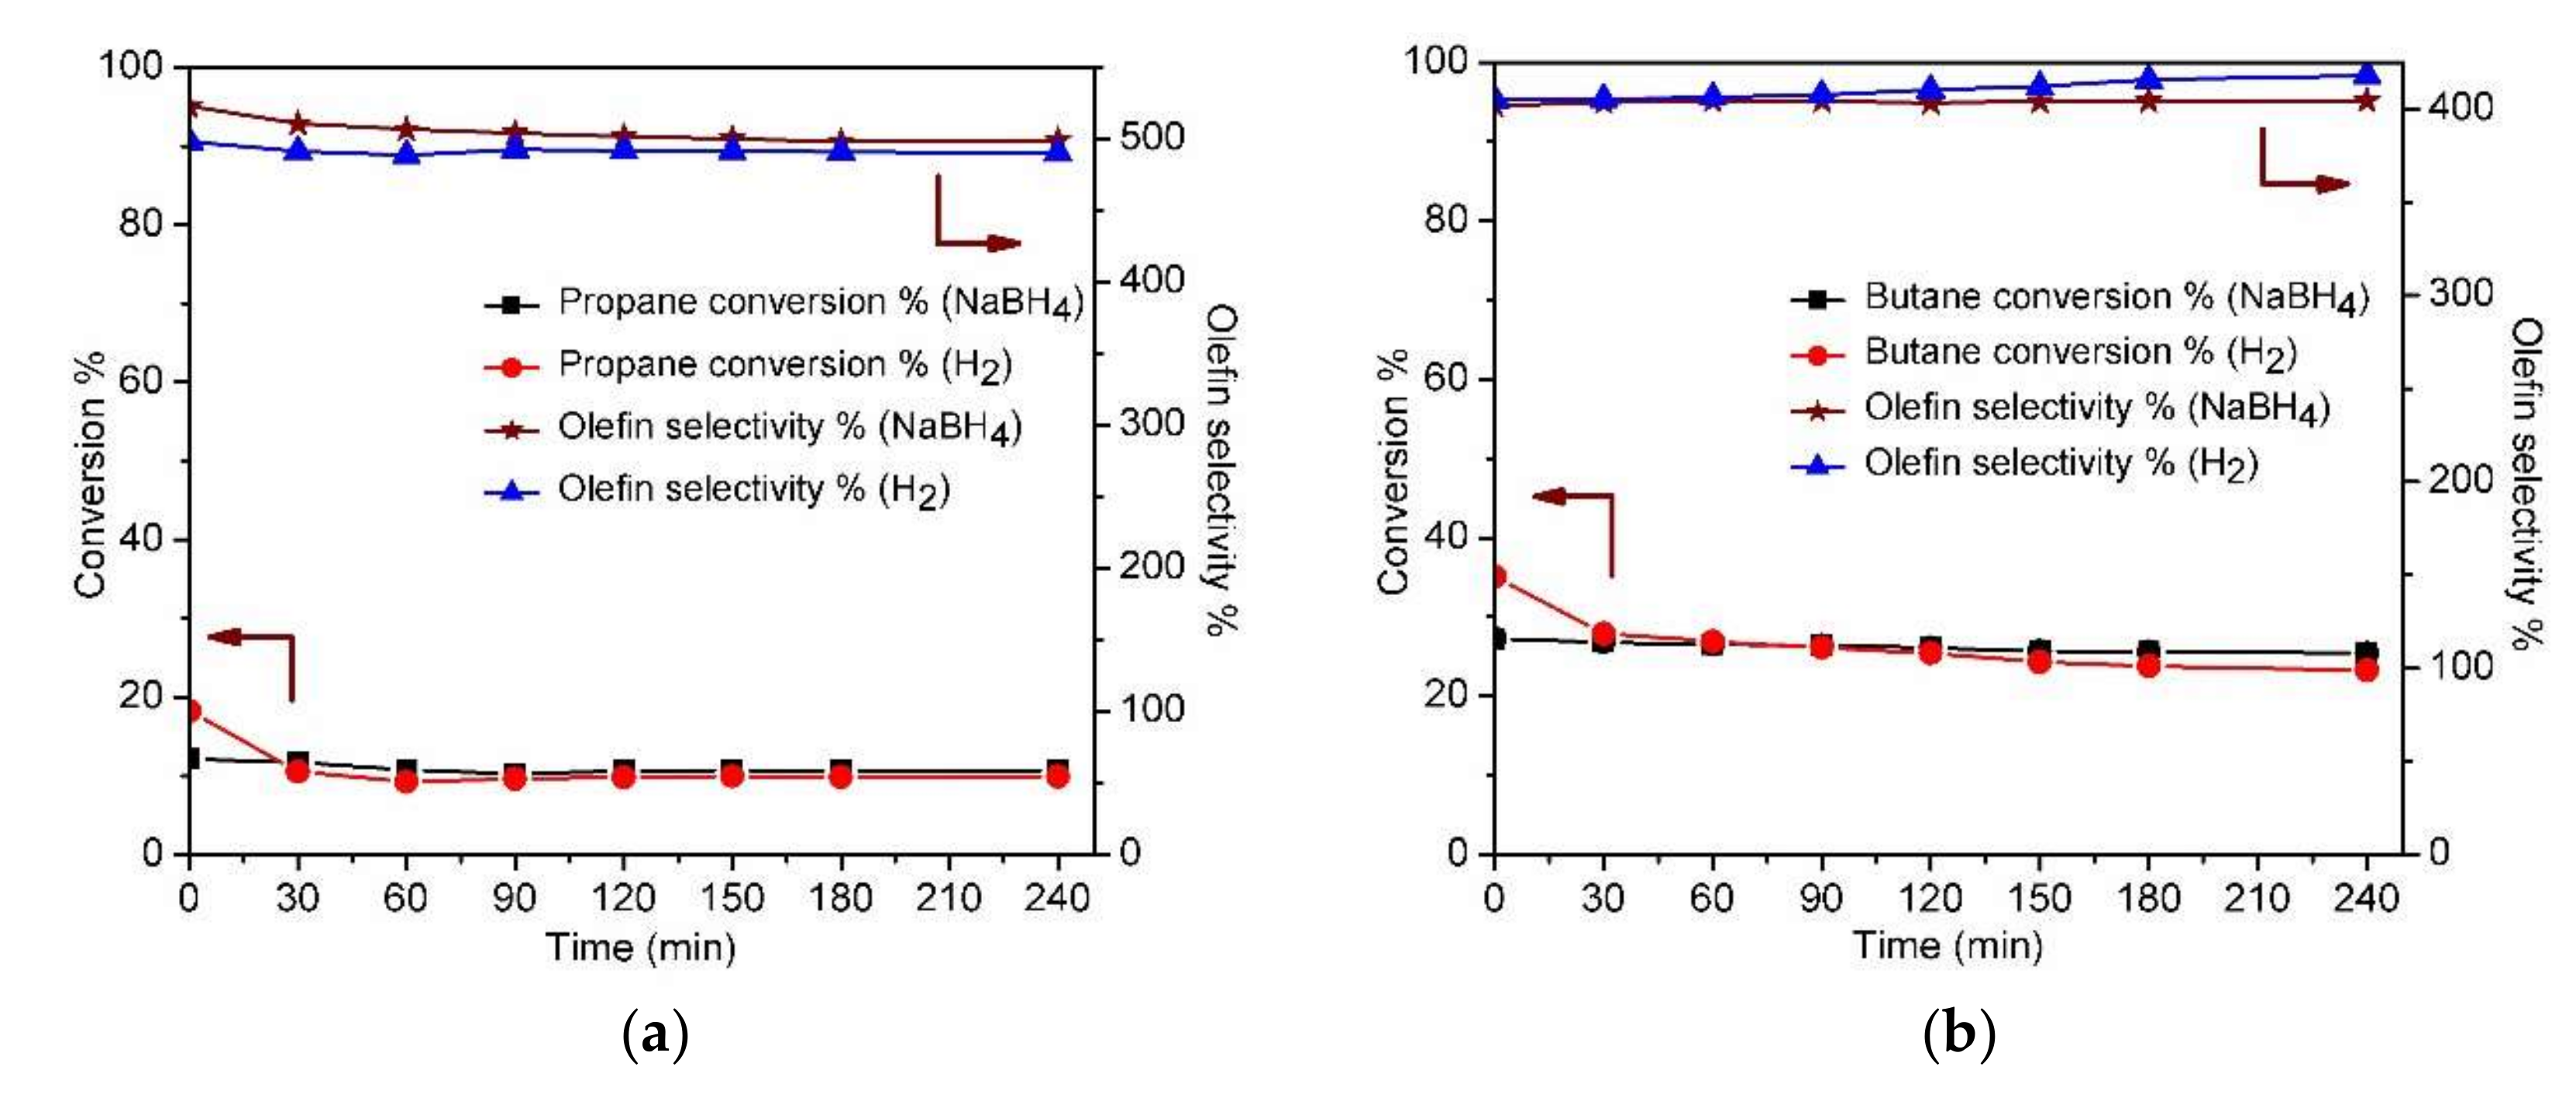
2.2.2. Individual Paraffin Dehydrogenation
- ,
- .
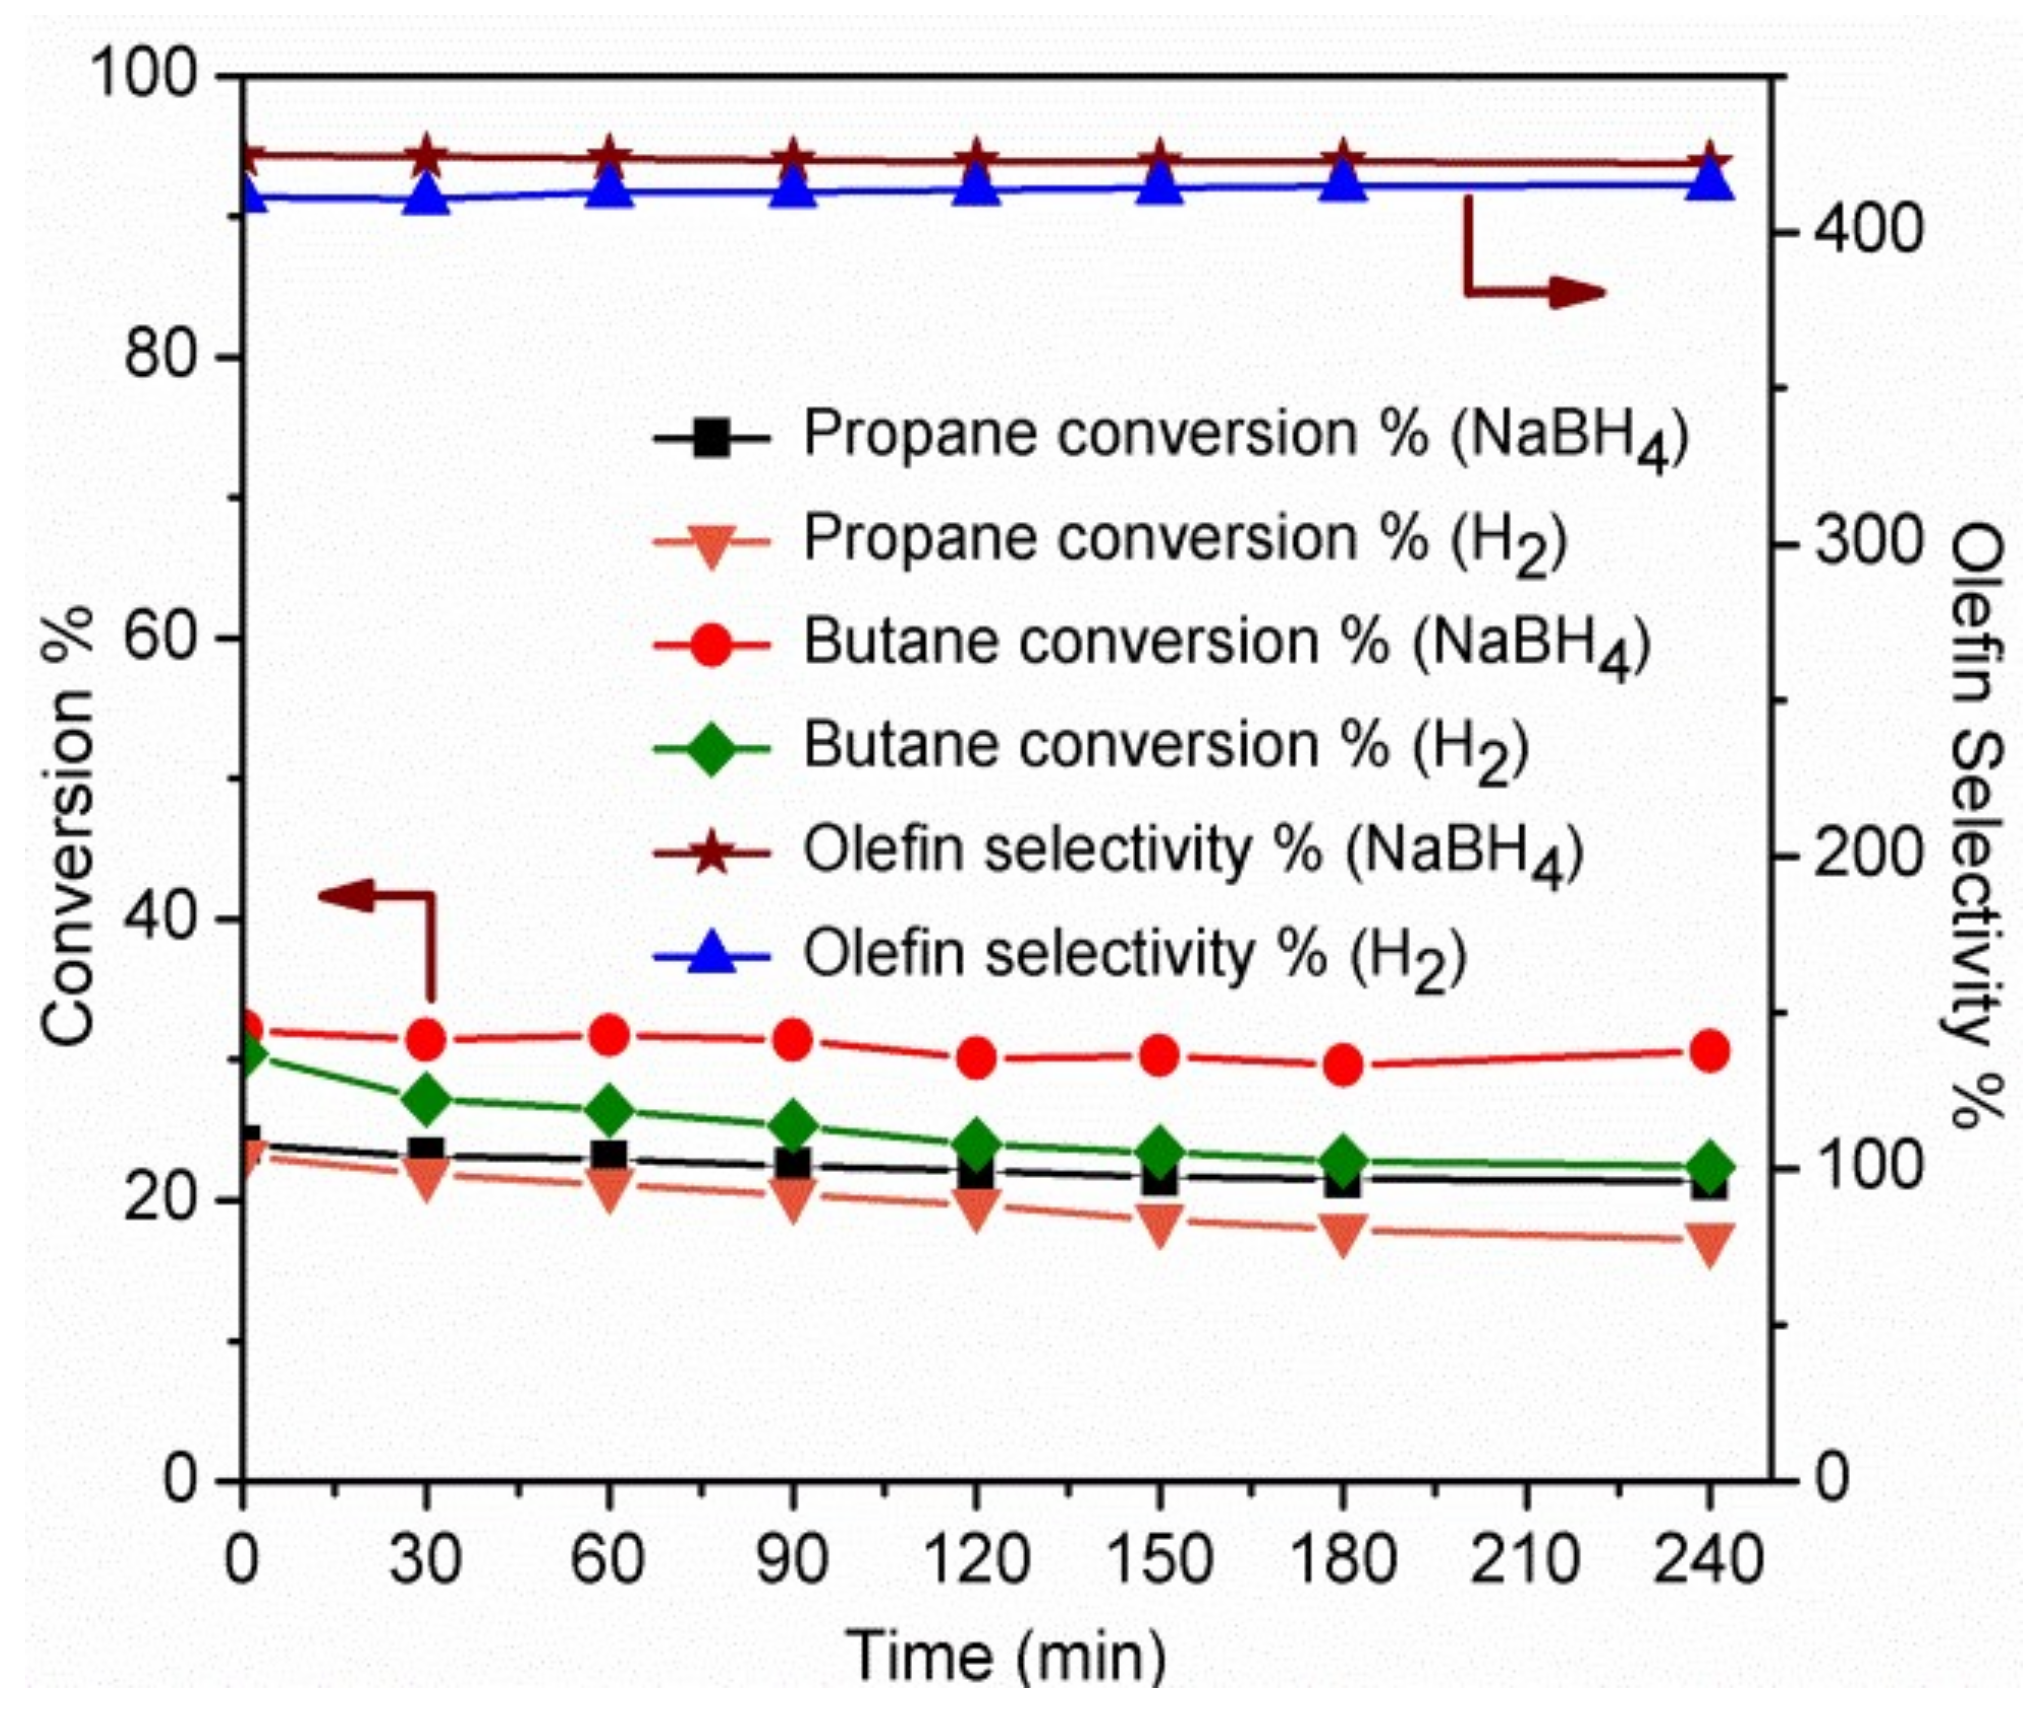
2.2.3. Mixed Paraffin Dehydrogenation
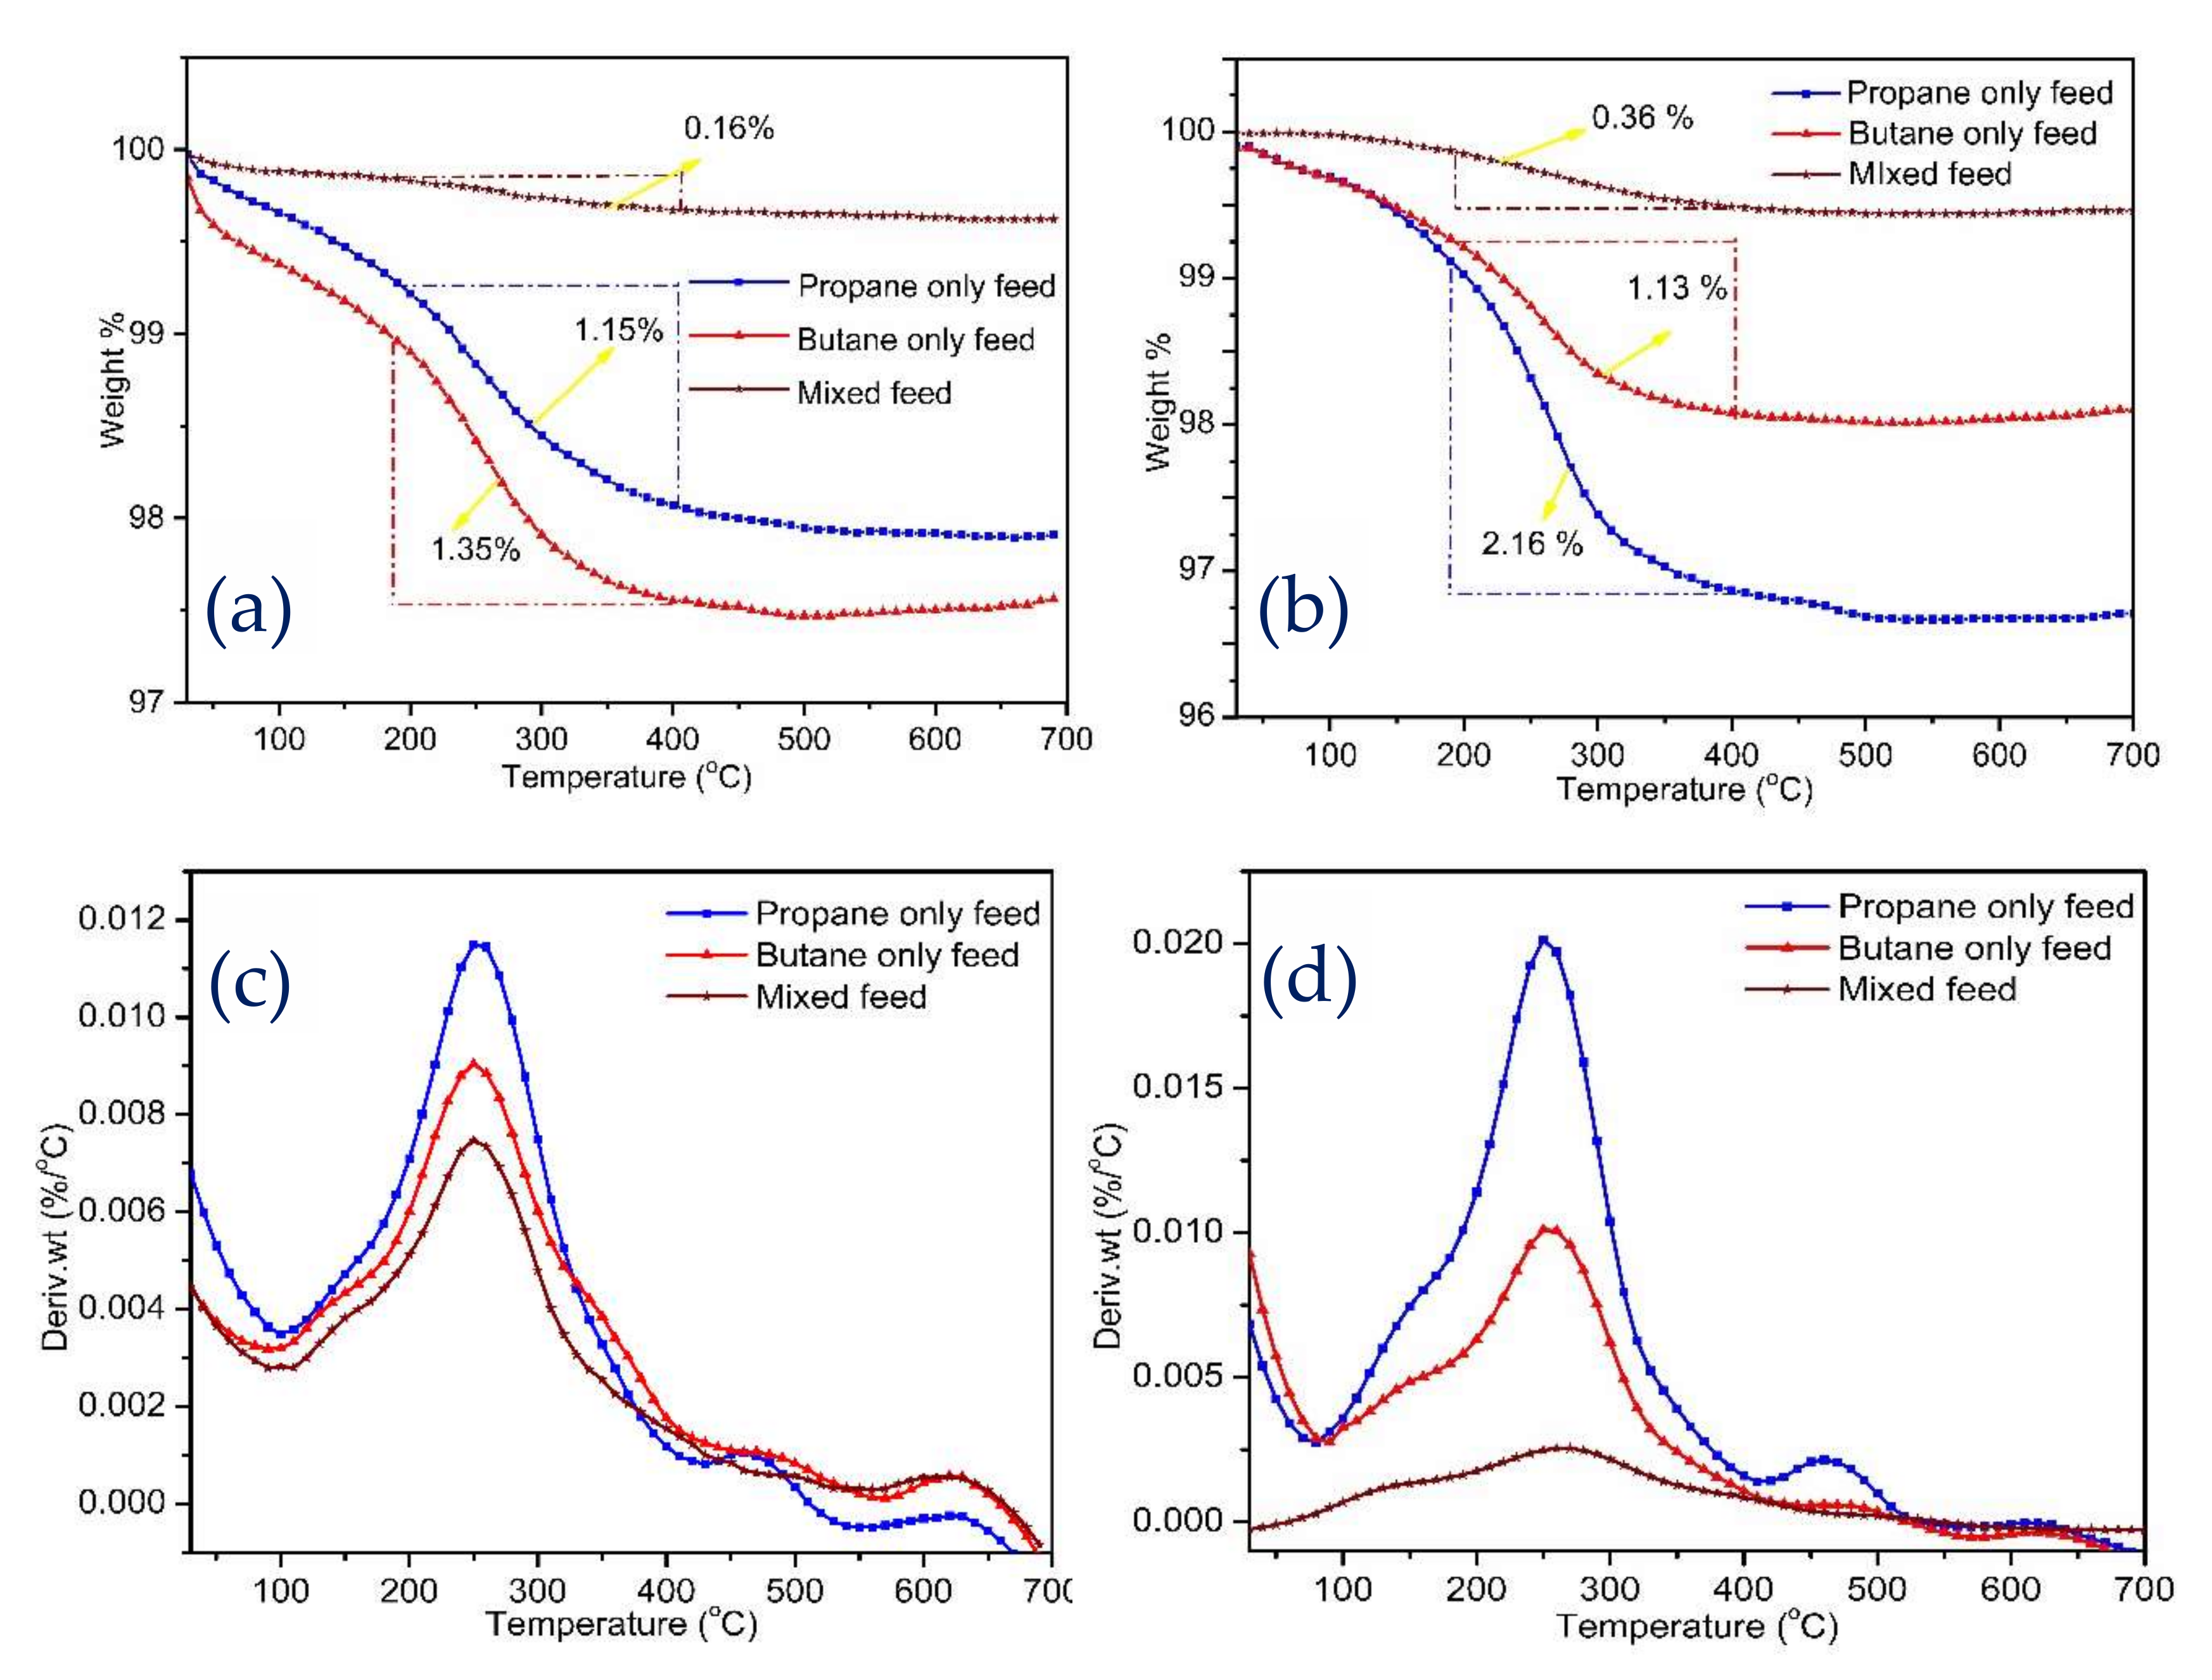
2.2.4. TGA Analysis of Coke Deposition on Spent Catalysts
3. Materials and Methods
3.1. Catalyst Preparation
3.2. Characterization
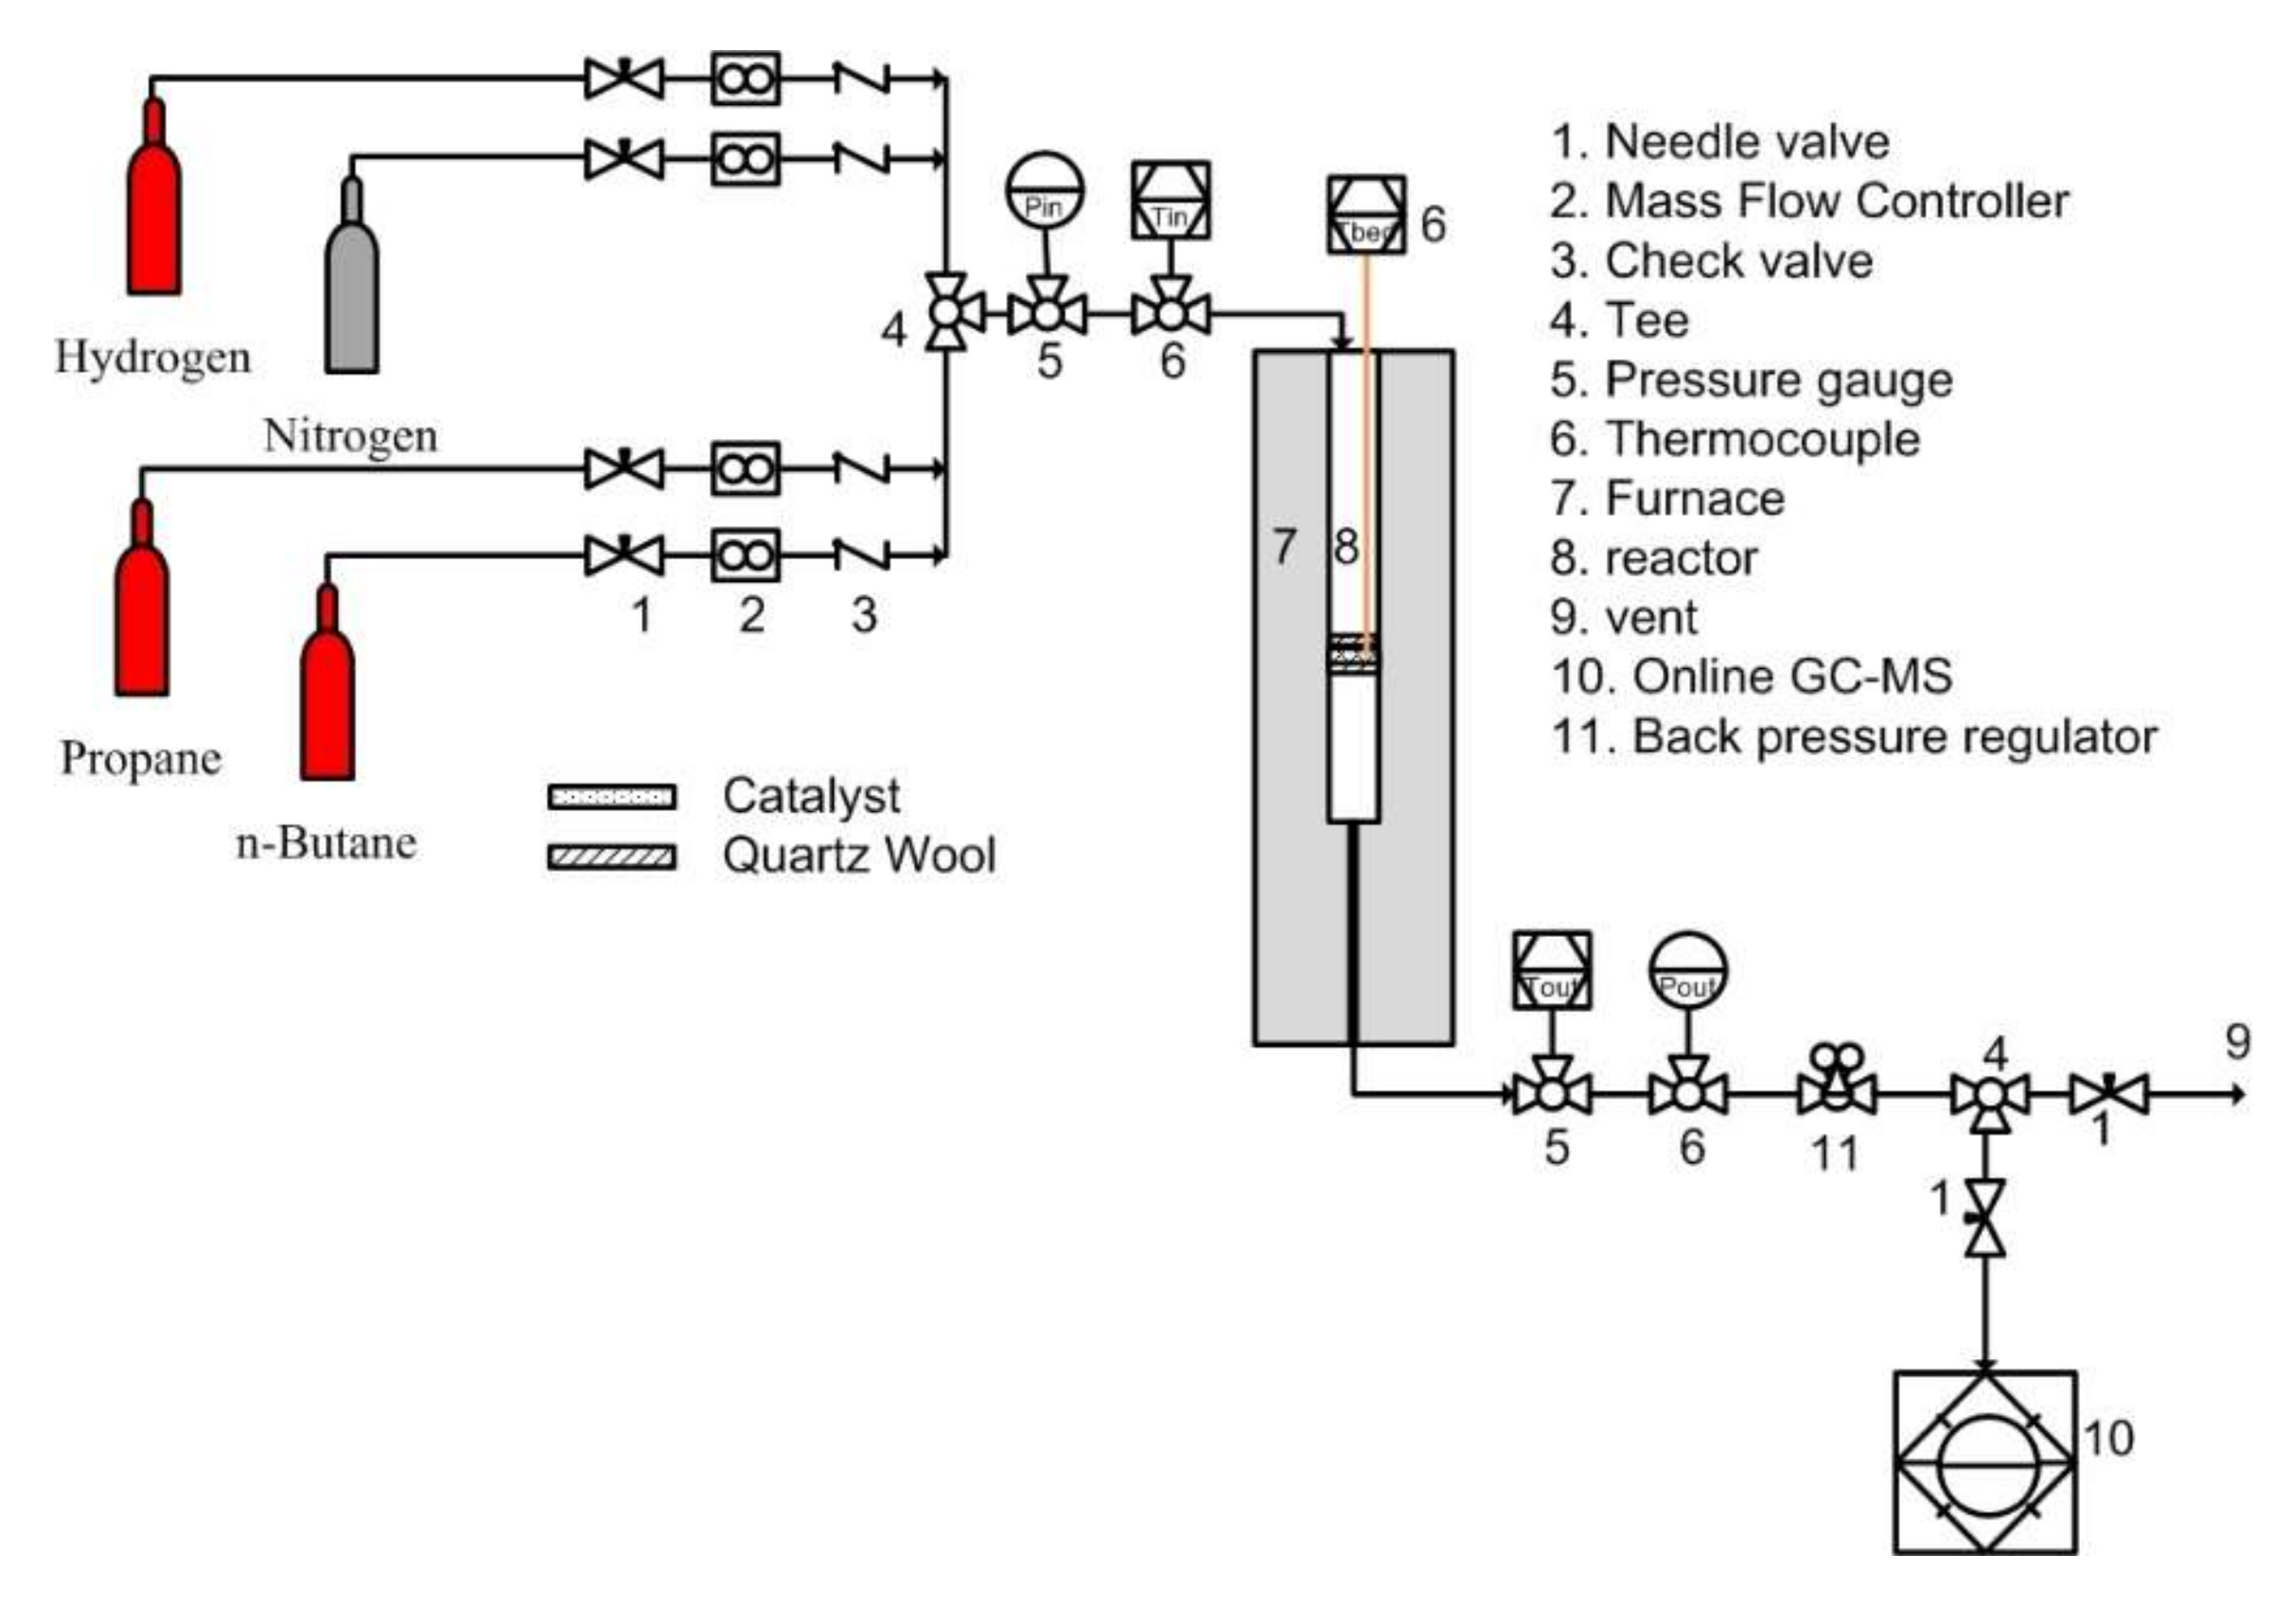
3.3. Dehydrogenation of Individual and Mixed Paraffin Feed
- is number of moles of propane at the inlet,
- is number of moles of propane at the outlet,
- is number of moles of butane at the inlet,
- is number of moles of butane at the outlet,
- is number of moles of propylene at the inlet,
- is number of moles of butylene at the outlet,
- is number moles of all hydrocarbons at the outlet.
3.4. TG-DTA Studies of Spent Catalysts under Oxygen Atmosphere
4. Conclusions
Supplementary Materials
Author Contributions
Funding
Acknowledgments
Conflicts of Interest
References
- Shi, Y.; Li, X.; Rong, X.; Gu, B.; Wei, H.; Sun, C. Influence of support on the catalytic properties of Pt-Sn-K/θ-Al2O3 for propane dehydrogenation. RSC Adv. 2017, 7, 19841–19848. [Google Scholar] [CrossRef]
- Zeeshan, N.; Nawaz, Z. Light alkane dehydrogenation to light olefin technologies: A comprehensive review. Rev. Chem. Eng. 2015, 31, 413. [Google Scholar]
- Ministry of Economy Trade and Industry. J. Forecast of Global Supply and Demand Trends for Petrochemical Products (for the 2009–2022 Period) Compiled; Ministry of Economy Trade and Industry: Tokyo, Japan, 2018; pp. 2018–2020. [Google Scholar]
- Lobera, M.P.; Biausque, G.; Téllez, C.; Herguido, J.; Menéndez, M.; Schuurman, Y. Comparison of different methods for quantitative analysis of TAP pulse-response data for propane dehydrogenation over Pt-Sn-K/γ-Al2O3. Chem. Eng. Sci. 2010, 65, 2417–2424. [Google Scholar] [CrossRef]
- Wu, J.; Mallikarjun Sharada, S.; Ho, C.; Hauser, A.W.; Head-Gordon, M.; Bell, A.T. Ethane and propane dehydrogenation over PtIr/Mg(Al)O. Appl. Catal. A Gen. 2015, 506, 25–32. [Google Scholar] [CrossRef]
- Grasselli, R.K.; Stern, D.L.; Tsikoyiannis, J.G. Strategies for combining light paraffin Dehydrogenation (DH) with Selective Hydrogen Combustion (SHC). Stud. Surf. Sci. Catal. 2000, 130 A, 773–778. [Google Scholar]
- Rashidi, M.; Nikazar, M.; Rahmani, M.; Mohamadghasemi, Z. Kinetic modeling of simultaneous dehydrogenation of propane and isobutane on Pt-Sn-K/Al2O3 catalyst. Chem. Eng. Res. Des. 2015, 95, 239–247. [Google Scholar] [CrossRef]
- Ragula, U.B.R.; Shrinidhi, S.R.; Rangarajan, M. Modeling and Simulation of Mixed-Light Paraffin Dehydrogenation in Multi-tubular Fixed Bed Reactor. In Proceedings of the Recent Advances in Chemical, Environmental and Energy Engineering, Chennai, India, 27–28 February 2014; pp. 1–11. [Google Scholar]
- Nawaz, Z.; Shu, Q.; Naveed, S.; Wei, F. Light Alkane Selective Dehydrogenation using Bi-metallic Zeolite Supported Catalyst. Bull. Chem. Soc. Ethiop. 2009, 23, 429–436. [Google Scholar] [CrossRef]
- Sattler, J.J.; Ruiz-Martinez, J.; Santillan-Jimenez, E.; Weckhuysen, B.M. Catalytic dehydrogenation of light alkanes on metals and metal oxides. Chem. Rev. 2014, 114, 10613–10653. [Google Scholar] [CrossRef]
- Resini, C.; Lucarelli, C.; Taillades-Jacquin, M.; Liew, K.E.; Gabellini, I.; Albonetti, S.; Wails, D.; Rozire, J.; Vaccari, A.; Jones, D. Pt-Sn/γ-Al2O3 and Pt-Sn-Na/γ-Al 2O3 catalysts for hydrogen production by dehydrogenation of Jet A-1 fuel: Characterisation and preliminary activity tests. Int. J. Hydrog. Energy 2011, 36, 5972–5982. [Google Scholar] [CrossRef][Green Version]
- Cesar, L.G.; Yang, C.; Lu, Z.; Ren, Y.; Zhang, G.; Miller, J.T. Identification of a Pt3Co Surface Intermetallic Alloy in Pt-Co Propane Dehydrogenation Catalysts. ACS Catal. 2019, 9, 5231–5244. [Google Scholar] [CrossRef]
- Zhu, H.; Anjum, D.H.; Wang, Q.; Abou-hamad, E.; Emsley, L.; Dong, H.; Laveille, P.; Li, L.; Samal, A.K.; Basset, J.M. Sn surface-enriched Pt-Sn bimetallic nanoparticles as a selective and stable catalyst for propane dehydrogenation. J. Catal. 2014, 320, 52–62. [Google Scholar] [CrossRef]
- Deng, L.; Arakawa, T.; Ohkubo, T.; Miura, H.; Shishido, T.; Hosokawa, S.; Teramura, K.; Tanaka, T. Highly Active and Stable Pt-Sn/SBA-15 Catalyst Prepared by Direct Reduction for Ethylbenzene Dehydrogenation: Effects of Sn Addition. Ind. Eng. Chem. Res. 2017, 56, 7160–7172. [Google Scholar] [CrossRef]
- Saerens, S.; Sabbe, M.K.; Galvita, V.V.; Redekop, E.A.; Reyniers, M.F.; Marin, G.B. The Positive Role of Hydrogen on the Dehydrogenation of Propane on Pt(111). ACS Catal. 2017, 7, 7495–7508. [Google Scholar] [CrossRef]
- Prakash, N.; Lee, M.H.; Yoon, S.; Jung, K.D. Role of acid solvent to prepare highly active PtSn/θ-Al2O3 catalysts in dehydrogenation of propane to propylene. Catal. Today 2017, 293–294, 33–41. [Google Scholar] [CrossRef]
- Kaylor, N.; Davis, R.J. Propane dehydrogenation over supported Pt-Sn nanoparticles. J. Catal. 2018, 367, 181–193. [Google Scholar] [CrossRef]
- Lee, M.H.; Nagaraja, B.M.; Lee, K.Y.; Jung, K.D. Dehydrogenation of alkane to light olefin over PtSn/θ-Al 2O3 catalyst: Effects of Sn loading. Catalysis Today 2014, 232, 53–62. [Google Scholar] [CrossRef]
- Wang, X.; Carabineiro, H.; Lemos, F.; Lemos, M.A.N.D.A.; Ramôa Ribeiro, F. Propane conversion over a H-ZSM5 acid catalyst. J. Mol. Catal. A Chem. 2004, 216, 131–137. [Google Scholar] [CrossRef]
- Jung, J.W.; Kim, W.I.; Kim, J.R.; Oh, K.; Koh, H.L. Effect of direct reduction treatment on Pt–Sn/Al2O3 catalyst for propane dehydrogenation. Catalysts 2019, 9, 1–13. [Google Scholar] [CrossRef]
- Zhang, Y.; Zhou, Y.; Shi, J.; Zhou, S.; Sheng, X.; Zhang, Z.; Xiang, S. Comparative study of bimetallic Pt-Sn catalysts supported on different supports for propane dehydrogenation. J. Mol. Catal. A Chem. 2014, 381, 138–147. [Google Scholar] [CrossRef]
- Zhang, H.; Wan, H.; Zhao, Y.; Wang, W. Effect of chlorine elimination from Pt-Sn catalyst on the behavior of hydrocarbon reconstruction in propane dehydrogenation. Catal. Today 2019, 330, 85–91. [Google Scholar] [CrossRef]
- Zangeneh, F.T.; Taeb, A.; Gholivand, K.; Sahebdelfar, S. Kinetic study of propane dehydrogenation and catalyst deactivation over Pt-Sn/Al2O3 catalyst. J. Energy Chem. 2013, 22, 726–732. [Google Scholar] [CrossRef]
- Zangeneh, F.T.; Mehrazma, S.; Sahebdelfar, S. The influence of solvent on the performance of Pt-Sn/θ-Al2O3 propane dehydrogenation catalyst prepared by co-impregnation method. Fuel Process. Technol. 2013, 109, 118–123. [Google Scholar] [CrossRef]
- Li, Q.; Sui, Z.; Zhou, X.; Zhu, Y.; Zhou, J.; Chen, D. De Coke formation on Pt-Sn/Al2O3 catalyst in propane dehydrogenation: Coke characterization and kinetic study. Top. Catal. 2011, 54, 888–896. [Google Scholar] [CrossRef]
- Zhang, Y.; Zhou, Y.; Shi, J.; Zhou, S.; Zhang, Z.; Zhang, S.; Guo, M. Propane dehydrogenation over PtSnNa/La-doped Al2O3 catalyst: Effect of La content. Fuel Process. Technol. 2013, 111, 94–104. [Google Scholar] [CrossRef]
- Salmones, J.; Wang, J.A.; Galicia, J.A.; Aguilar-Rios, G. H2 reduction behaviors and catalytic performance of bimetallic tin-modified platinum catalysts for propane dehydrogenation. J. Mol. Catal. A Chem. 2002, 184, 203–213. [Google Scholar] [CrossRef]
- Llorca, J.; Homs, N.; León, J.; Sales, J.; Fierro, J.L.G.; De, P.R. Supported Pt-Sn catalysts highly selective for isobutane dehydrogenation: Preparation, characterization and catalytic behavior. Appl. Catal. A Gen. 1999, 189, 77–86. [Google Scholar] [CrossRef]
- Ma, Z.; Mo, Y.; Li, J.; An, C.; Liu, X. Optimization of PtSnK/Al2O3 isobutane dehydrogenation catalyst prepared by an impregnation-reduction method. J. Nat. Gas Sci. Eng. 2015, 27, 1035–1042. [Google Scholar] [CrossRef]
- Vaidya, S.H.; Rode, C.V.; Chaudhari, R.V. Bimetallic Pt–Sn/γ-alumina catalyst for highly selective liquid phase hydrogenation of diethyl succinate to γ-butyrolactone. Catal. Commun. 2007, 8, 340–344. [Google Scholar] [CrossRef]
- Kogan, S.B.; Herskowitz, M. Selective propane dehydrogenation to propylene on novel bimetallic catalysts. Catal. Commun. 2001, 2, 179–185. [Google Scholar] [CrossRef]
- Ballarini, A.D.; Zgolicz, P.; Vilella, I.M.J.; de Miguel, S.R.; Castro, A.A.; Scelza, O.A. n-Butane dehydrogenation on Pt, PtSn and PtGe supported on γ-Al2O3 deposited on spheres of α-Al2O3 by washcoating. Appl. Catal. A Gen. 2010, 381, 83–91. [Google Scholar] [CrossRef]
- Lee, J.J.K.; Seo, H.; Hong, U.G.; Park, G.; Yoo, Y.; Lee, J.J.K.; Chang, H.; Song, I.K. Platinum-Tin Nano-Catalysts Supported on Alumina for Direct Dehydrogenation of n-Butane. J. Nanosci. Nanotechnol. 2015, 15, 8305–8310. [Google Scholar] [CrossRef] [PubMed]
- Vu, B.K.; Song, M.B.; Ahn, I.Y.; Suh, Y.W.; Suh, D.J.; Kim, W.I.; Koh, H.L.; Choi, Y.G.; Shin, E.W. Pt-Sn alloy phases and coke mobility over Pt-Sn/Al2O3 and Pt-Sn/ZnAl2O4 catalysts for propane dehydrogenation. Appl. Catal. A Gen. 2011, 400, 25–33. [Google Scholar] [CrossRef]
- Resende, N.S.; Perez, C.A.; Eon, J.G.; Schmal, M. The Effect of Coating TiO2 on the CO Oxidation of the Pt/γ-Alumina Catalysts. Catal. Lett. 2011, 141, 1685. [Google Scholar] [CrossRef]
- Gómez-Quero, S.; Tsoufis, T.; Rudolf, P.; Makkee, M.; Kapteijn, F.; Rothenberg, G. Kinetics of propane dehydrogenation over Pt-Sn/Al2O3. Catal. Sci. Technol. 2013, 3, 962–971. [Google Scholar] [CrossRef]
- Froment, G.F.; Van De Steene, B.O.; Vanden Berghe, P.J.; Goossens, A.G. Thermal cracking of light hydrocarbons and their mixtures. AIChE J. 1977, 23, 93–106. [Google Scholar] [CrossRef]
- Pakhomov, N.A.; Kashkin, V.N.; Nemykina, E.I.; Molchanov, V.V.; Nadtochiy, V.I.; Noskov, A.S. Dehydrogenation of C3–C4 Paraffins on Cr2O3/Al2O3 Catalysts in Fluidized and Fixed bed Reactors. Chem. Eng. J. 2009, 154, 185–188. [Google Scholar] [CrossRef]
- Ma, Z.; Jiang, A.; Li, S.; Li, J.; Sun, L.; An, C. Synthesis of Pt–Sn nanoalloy catalysts with enhanced performance in the dehydrogenation of propane. Micro Nano Lett. 2019, 14, 794–798. [Google Scholar] [CrossRef]
- Levenspiel, O. Chemical Reaction Engineering, 3rd ed.; John Wiley & Sons (Asia) Pte. Ltd.: South Tower, Singapore, 2008; ISBN 978-81-265-1000-9. [Google Scholar]
- Ragula, U.B.; Shirinidhi, S.R.; Rangarajan, M. Mixed-Light Paraffin Dehydrogenation in a Catalytic Multi-tubular Reactor: Modeling and Simulation. In Proceedings of the AIChE Annaual Meeting, Atlanta, GA, USA, 19 November 2014; pp. 600–615. [Google Scholar]


| Catalyst Type | Surface Area a (m2/g) | Avg. Pore Dia. a (nm) | Total Pore Vol. a (cm3/g) | Pt b (wt%) | Sn b (wt%) |
|---|---|---|---|---|---|
| NaBH4 reduced | 6 | 2.75 | 0.082 | 6.61 | 2.36 |
| H2 reduced | 15 | 2.02 | 0.150 | 2.30 | 0.56 |
| Dehydrogeantion Parameter a | NaBH4 Reduced Catalyst | Hydrogen Reduced Catalyst | ||
|---|---|---|---|---|
| Propane Feed Only | Butane Feed Only | Propane Feed Only | Butane Feed Only | |
| Propane conversion% | 10.7 | - | 9.9 | |
| Propylene selectivity% | 499 | - | 490 | |
| Butane conversion% | - | 25.4 | 23.3 | |
| Butylene selectivity% | - | 404 | 418 | |
| Dehydrogenation Parameter a | NaBH4 Reduced Catalyst | Hydrogen Reduced Catalyst |
|---|---|---|
| Propane conversion% | 21.4 | 17.2 |
| Butane conversion% | 30.6 | 22.4 |
| Total Olefin Selectivity% | 421.9 | 415.2 |
| Catalytic Deactivation Properties | NaBH4 Reduced Catalyst | Hydrogen Reduced Catalyst | ||||
|---|---|---|---|---|---|---|
| Propane Feed Only | Butane Feed Only | Mixed Feed | Propane Feed Only | Butane Feed Only | Mixed Feed | |
| Amount of coke% a | 1.15 | 1.35 | 0.16 | 2.16 | 1.13 | 0.36 |
© 2020 by the authors. Licensee MDPI, Basel, Switzerland. This article is an open access article distributed under the terms and conditions of the Creative Commons Attribution (CC BY) license (http://creativecommons.org/licenses/by/4.0/).
Share and Cite
Avithi Kanniappan, S.; Ragula, U.B.R. Effect of Reduction of Pt–Sn/α-Al2O3 on Catalytic Dehydrogenation of Mixed-Paraffin Feed. Catalysts 2020, 10, 113. https://doi.org/10.3390/catal10010113
Avithi Kanniappan S, Ragula UBR. Effect of Reduction of Pt–Sn/α-Al2O3 on Catalytic Dehydrogenation of Mixed-Paraffin Feed. Catalysts. 2020; 10(1):113. https://doi.org/10.3390/catal10010113
Chicago/Turabian StyleAvithi Kanniappan, Suresh, and Udaya Bhaskar Reddy Ragula. 2020. "Effect of Reduction of Pt–Sn/α-Al2O3 on Catalytic Dehydrogenation of Mixed-Paraffin Feed" Catalysts 10, no. 1: 113. https://doi.org/10.3390/catal10010113
APA StyleAvithi Kanniappan, S., & Ragula, U. B. R. (2020). Effect of Reduction of Pt–Sn/α-Al2O3 on Catalytic Dehydrogenation of Mixed-Paraffin Feed. Catalysts, 10(1), 113. https://doi.org/10.3390/catal10010113