Article

Charity Begins at Home: A Lab-in-the-Field Experiment on Charitable Giving

by
Catherine C. Eckel
1,
Benjamin A. Priday
1,* and
Rick K. Wilson
2
1
Department of Economics, Texas A&M University, College Station, TX 77843, USA
2
Department of Political Science, Rice University, Houston, TX 77005, USA
*
Author to whom correspondence should be addressed.
Games 2018, 9(4), 95; https://doi.org/10.3390/g9040095
Submission received: 1 September 2018 / Revised: 13 October 2018 / Accepted: 14 November 2018 / Published: 20 November 2018
(This article belongs to the Special Issue Dictator Games)

Abstract

:
Charities operate at different levels: national, state, or local. We test the effect of the level of the organization on charitable giving in a sample of adults in two Texas communities. Subjects make four charitable giving “dictator game” decisions from a fixed amount of money provided by the experimenter. Three decisions target different charitable organizations, all of which have a disaster-relief mission, but differ in the level of operation. The fourth targets an individual recipient, identified by the local fire department as a victim of a fire. One of the four is selected randomly for payment. Giving is significantly higher to national and local organizations compared to state. We find a higher propensity to donate and larger amount donated to the individual relative to all organizations. Subsequent analysis compares a number of demographic and attitudinal covariates with donations to specific charities. In a second decision, subjects instead indicate which of their four prior decisions they would most prefer to implement. Here we see that a majority of subjects prefer the gift to the individual.

1. Introduction

Charitable organizations vary along many dimensions, including their geographic level of operation. Organizations can operate at an international, national, state-wide, or local level. It is unclear, however, whether and how donors differentiate between charities at different levels that have similar missions. Do donors consider the reach of the charity and direct impact of their donations? Do they prefer to donate to a local organization where they will have a concentrated impact, or to a larger organization with broader reach? Little is known about how donors make tradeoffs between organizational characteristics in making their donation decisions. This study addresses this question by conducting controlled, lab-in-the-field experiments where subjects make real donation decisions to charitable organizations from a fixed budget.
In this paper, we report the results of a comparative dictator game (CDG hereafter) experiment conducted in two Texas towns. Our study systematically varies the organizational level, including national (N), state (S), local (L), and individual person (P) organizational levels. Specifically, we use a series of dictator game (DG) decisions. Subjects make four separate allocation decisions, distributing a fixed endowment between themselves and a charitable recipient at each of these different levels. One is selected randomly for payment. In a separate game, the selected dictator game (SDG hereafter), we ask subjects to indicate which of the decisions they would most like to implement.
A considerable body of research uses lab experiments to study charitable giving. The superior control of the lab provides an ideal methodology for addressing the impact of fundraising practices, examining motives for giving and testing theories of altruism [1]. Even though the decisions made in lab experiments are “real donation” decisions [2], they have been criticized for their use of convenience samples of undergraduate students. In this study we retain the control of lab-type protocols, but recruit a random sample of adult subjects. This allows us to test the effect of the level of the organization in a tightly controlled setting, but with a broader sample of participants. This methodology is ideally suited to the research question. Indeed, the question cannot be answered with observational data, as no data are available that show such tradeoffs at the level of the individual decision maker.
We are not the first to use a comparative approach to examine variations in dictator-game giving. For example, Candelo et al. [3,4] used a CDG experimental design to test the effect of recipient characteristics on donations in adult populations. It was found in [3] that people increase giving to more “worthy” recipients, such as people with disabilities, single mothers, and people with more children. The findings in [4] include an appendix describing the initial development of the CDG using lab experiments. Others, like [5,6] vary specific recipients in dictator games to assess biases due to race or need.
The work most similar to ours is [7], where the authors use federal, state and local levels in their study of dictator giving to government organizations in a lab experiment with a student sample. They find that subjects have a preference for the mission and geographic level of operation. People were more likely to give a non-zero amount towards cancer research and disaster relief than education enhancement and parks and wildlife. Furthermore, giving monotonically increased in operation level (national > state > local) for disaster relief organizations (but not all missions).
Our study focuses on disaster relief work by private charities and differs from [7] in two important ways: We use adult participants in the field, and we add an additional recipient—an anonymous individual in the subjects’ town. This is the first study to vary the levels at which charities operate in a sample of adult participants, and to include an individual in the decision set. This allows us to ask whether adults embedded in a community differentiate giving among charity-levels while also considering giving to an individual. These differences motivate our hypotheses in Section 2.1.
We find that subjects give more to an anonymous person than to any of the three charitable organizations in the CDG, consistent with prior literature discussed in more detail below. Similar to [7], we find that dictator giving to a national organization is higher than to a state organization. Contrary to [7], however, we find that average donations by community members are higher to local organizations compared to state organizations and statistically equivalent across national and local organizations. This creates a U-shaped revealed-preference giving curve across levels, which is verified by subjects’ selections in the subsequent SDG. We explore how this behavior correlates with socio-demographics and measurements of trust in people and in institutions. We also discuss possible explanations for why our findings contradict those of [7].

2. Experimental Design and Implementation

2.1. Hypotheses

As described above, Li et al. [7] find that giving to disaster relief monotonically increases with the level of operation. This is a surprising conclusion, given the extensive charitable giving literature around directed giving [8,9] and the identifiable victim effect. The identifiable victim effect, described in the charitable giving literature, is the tendency of donors to give more when a single recipient is identified. This is because they are an “identifiable” instead of a “statistical” victim [10]. Even a weak form of identifiability, without accompanying information, can increase caring [11]. For a meta-analysis of the identifiable victim effect, see [12].
When making contributions to a charity, we propose that donors in the CDG consider both the reach of an organization and the direct impact of their contribution, as well as the potential tradeoff between them. For example, national charities have a broader reach than local organizations, and may be better able to allocate funds efficiently, where they are most needed. This is a potential explanation for the behavior observed in [7]. Yet a single contribution has a very small impact on national-level needs. By contrast the reach of a local charity is much narrower, but a contribution can have a much higher relative impact. At the most extreme, a contribution to a person has the most impact, but the narrowest reach.
All of the charities we use service anonymous victims. To make our “identifiable victim” comparable, we keep that person’s identity anonymous. This allows us to better test whether impact and reach come to mind when people consider their contributions. We expect individual recipients to receive the largest amount, from which we can conclude that subjects value impact over reach. This forms our first hypothesis:
Hypothesis 1.
When presented with separate giving decisions to national, state, and local organizations and an anonymous individual, subjects give more to the individual than to any other level.
Impact and reach surely interact with each other differently when donors consider where and how much to give to organizations instead of identified individuals. Since each of the decisions in our CDG is independent, we propose that subjects consider the charities differently. We therefore use the results of [7]—subjects’ revealed preference rank of charity level (national > state > local)—to form our second hypothesis:
Hypothesis 2.
Beyond giving to the individual, subjects’ donations will be monotonically increasing with the level of the organization’s operation.
We believe this result from [7] arises because the relative impact of a donation beyond an individual becomes either less important or less clear, so subjects will switch to considering an organization’s reach. Our experiment is not designed to pull apart these two possible mechanisms; however, we propose that, in a comparative-statics analysis, preferences for the reach of an organization are mediated by prior beliefs about the relative effectiveness of aid at a given level (national, state, or local). We therefore expect some measurement of beliefs about trust in institutions (operating at the state or federal level) or trust in people (focused locally or an individual) to have a statistically significant correlation with giving behavior across organizations. Running this experiment with adults—particularly adults who have experienced natural disasters—is therefore valuable because we expect their beliefs to be more developed and informed than student subjects who may or may not have experienced natural disasters. This forms two additional testable hypotheses:
Hypothesis 3a.
Trust in institutions, as a proxy for beliefs about the effectiveness of aid at a national and state levels, has a significant effect on giving to national and state charities. Furthermore, trust in people, as a proxy for beliefs about the effectiveness of aid at the local level or to a person, has a significant effect on the giving to the local charity and the individual recipient.
Hypothesis 3b.
Age is significantly and heterogeneously correlated with giving amounts at each level.
Because we cannot a priori state how beliefs about organization level effectiveness change with age or trust in institutions or people, we remain agnostic on predicting the direction or magnitude of these coefficients. We simply hypothesize there to be heterogeneous preferences for organization level by age and trust measurements.
When making the second decision (the SDG), subjects have already selected their contribution level for each organization. They were unaware of the SDG when making the CDG decisions. In choosing which CDG decision they prefer, subjects reveal which recipient they prefer to give to among the four possibilities, conditional on the amounts they have allocated to each. For example, when forced to make a decision about how much to give to each charity, subjects may choose different amounts depending on the perceived benefit of the contribution. However, when asked to choose, a subject might prefer to avoid their more generous decision, and instead opt for the one where they gave the least. Indeed, this is what [3] find in a low-income, high minority population with a similar experimental design: subjects allocated the most to the ‘most worthy’ recipients, but subsequently chose in the SDG the recipient to which they gave the least in the CDG. This informs our final hypothesis:
Hypothesis 4.
In the selected dictator game, the majority of subjects will choose the recipient to which they sent the least in the comparative dictator game.
This argument has some of the same flavor as work on “avoiding the ask” in charitable giving. [13] place flyers on door knobs with a return time for solicitation, allowing households to seek or avoid the fundraiser. The flyer reduces the number of people opening the door, effectively “avoiding the ask”. In [14], they placed Salvation Army bell ringers near entrances at a mall around Christmastime, experimentally altering the difficulty of avoiding the ask. Making avoidance difficult increased donations. In comparison, we give subjects the option to ‘avoid’ implementing the previous CDG decisions. This decision allows us to further uncover their preferences for giving.

2.2. Sample and General Study Design

The real-donation dictator game was embedded in a larger study1 carried out in 2010 in two Texas towns whose primary focus was on natural disaster preparedness. The study included survey components and lab-in-the-field incentivized decisions. The 2010 data collection was the second wave of a multi-year study. Subjects were originally recruited in 2009 and participated in a series of incentivized decisions to elicit standard economic preferences. The second wave of the study was carried out between 14 April 2010 and 14 June 2010. A total of 310 subjects participated in this wave. The study was conducted in two communities (population < 20,000) that were selected based on their risks from natural disasters and for their comparability in terms of the local economy and the characteristics of their citizens.
In each community, we recruited a sample of adult residents from specific neighborhoods that were matched according to demographic characteristics (income, employment status, and age) using census data. For the 2009 wave, recruiters were given a random sample of households in the neighborhoods based on tax parcel information. Participants were contacted at their homes and asked to participate in a study that included a decision-making component and a survey. In order to augment the initial random sample, we used a snowball sampling strategy, asking subjects who participated to help recruit others in their neighborhood.2 Subjects signed up to participate in a specific experimental session. These sessions averaged 15 subjects and lasted approximately 2.5 hours. Sessions were conducted at a local community center by researchers from Rice University and the University of Texas at Dallas. Participants were paid $20 for completing the survey and could earn additional money for the incentivized decision-making tasks; average earnings were $80.
To accommodate different levels of education among the subjects, instructions and protocols were designed to be as simple as possible. Subjects had ‘booklets’ with visual images to aid instruction, and subjects were instructed using posters with the same images. Experimenters followed a script, and walked through each possible decision and the monetary consequences of the decisions. Subjects completed seven different tasks in a fixed order with no feedback. The first task elicited risk preferences using the gamble-choice task adapted from [15]. The second task had subjects making choices between amounts they would prefer to receive either in a week or in six months (a time discounting task). The third and fourth tasks were variations on the trust game [16]. Tasks five and six are the concern of this paper, and consist of two variations on the dictator game, as described below. Of these six tasks, one was randomly selected for payment, using a transparent randomizing device: one subject selected a sealed envelope from a clear plastic tub containing many sealed envelopes, each containing one of the tasks. Everyone in the session was paid for the task that was selected, and subjects received feedback (learned the outcome) only on that task. At the end of the experiments, subjects completed the final task, a survey collecting demographic information and household characteristics, as well as survey measures of trust in institutions and other attitudinal questions. These booklets and surveys were checked for completeness by an experimenter and each individual was privately paid and debriefed.

2.3. Dictator Game Designs

In the first of the two dictator game tasks, Task 5 (CDG), subjects were asked to make four separate allocation decisions, dividing $60 between themselves and an organization or individual. (see Figure 1). As shown in Table 1, the four target organizations were the American Red Cross Disaster Relief Fund (national level), the United Way (state level for town 1, local level for town 2), the Salvation Army (state level for town 2, local level for town 1) and a person in the town who was a victim of a fire, identified by the local fire department (individual).
Since we list different organizations at each level, it is possible that heterogeneous giving preferences across levels are actually heterogeneous giving preferences across organizations. To help mitigate this, we block the state and local charities (see Table 1). More importantly, the decision for each organization was framed around disaster relief during the experiment. An excerpt from the instructions given at the beginning of the experiment and Task 5, which included descriptions of the organizations that make their disaster relief work salient, is included in Appendix B. With this very specific frame, we believe that subjects were more likely to be considering the effectiveness of disaster relief at each level rather than the organizations’ ability to implement disaster relief or the relative importance of disaster relief in the organization’s portfolio.
Subjects were told that if the task was chosen for payment, then, at the time of payment, the subject would randomly choose from four cards indicating the four possible decisions. The decision for the organization on that card would be implemented. Subjects were told that a check would be written to the recipient and were invited to watch the check being written, placed in an addressed envelope addressed, and taken to the nearest mailbox. In the event that the fourth decision was chosen a member of the research team would deliver the check and the recipient’s identity would not be revealed. Instructions describing the experiment’s payment process is included in Appendix B.
In Task 6 (SDG) subjects were asked to choose which of the four decisions from Task 5 they would prefer to be implemented. These choices are given in Figure 2. Subjects were reminded that they had just made four allocation choices. They were told that if this task was selected for payment, the decision they choose would be implemented. The goal of this task was to see if subjects had a favored charity from the fixed list that we provided them. Subjects merely had to circle one of the decisions.

3. Data and Aggregate Results

We pool subjects from the two towns in our sample (pooled n = 310). We create a panel data set using each of the subjects’ four allocation decisions for analysis. The pooled sample is 58% female, predominantly white (64%), with 36% having “high” church attendance (at least once a week). Hispanics are the second largest racial group (26%). The average age of our sample is 45.48. Our participants are mostly low income and have low education—55% report earnings below $30,000 per year and 43% have no college education. Table 2 describes in detail the socio-demographic composition of our sample.
In addition to socio-demographics, subjects responded to survey questions assessing trust in different organizations and individuals. A selection of these questions was used to calculate two additive scales measuring trust in institutions and trust in people (Table 3). The “Trust in Institutions” index uses five items to capture subjects’ underlying trust in institutions (Cronbach’s alpha = 0.84). The “Trust in People” index uses three items to capture trust in people (Cronbach’s alpha = 0.61). The questions used to calculate each index can be found in Appendix B. Subjects report a relatively high trust in people and, on average, are more trusting of people than institutions. We include these measures as covariate controls, reasoning that trust in institutions might be important for donation decisions that reach beyond the local level.
Figure 3 shows the average amount sent to each charity level. Table A1 in Appendix A provides corresponding summary statistics. Panel A of that table includes the average amount sent out of the $60 endowment, the probability of a subject sending a positive amount, and the average amount sent by donors (conditional on a positive donation). Panel B provides the same measures by characteristics; in this panel the amounts are pooled by subject, so they reflect an average across all four decisions.
In the figure above, we see that subjects gave $20–$30 on average, or 33–50 percent of their $60 endowments. Average giving was highest for the individual, and the lowest for the state-level charity. Even though gifts to the local charity clearly benefit local victims, subjects are even more likely to donate, and to give more, to a specific local victim. Subjects allocate more to national than state (t-test, p = 0.06, Wilcoxon signed rank test, p = 0.02) and more to local than national (t-test, p = 0.04, Wilcoxon, p = 0.16) or state (t-test, p = 0.00, Wilcoxon, p = 0.00). Subjects allocate a statistically and economically significant amount ($6.58–$9.25) more to the individual than to any other level (t-test, p = 0.00, Wilcoxon, p = 0.00 for all levels). We also see a higher probability of giving to the individual recipient. In particular, 91.94% of the subjects allocated a non-zero amount to the individual—4.2%–4.8% more than any other level (t-test, p = 0.00, Wilcoxon, p = 0.00 for all levels). See Table A1 for more detail.
Turning to demographic differences, we see similar levels and likelihoods of giving by women and men. Likewise, there is not a statistical difference in propensity to give or amount given between more and less religious people or people with higher or lower income. Subjects without any college education are seven percentage points more likely to give some positive amount than those with at least some college education (t-test, p = 0.03, Mann–Whitney, p = 0.03), give $1.76 more on average (t-test, p = 0.03), and have significantly different giving distributions (Mann–Whitney p = 0.00). See Table A1, Panel B.
Since each decision was made independently subjects could give the same amount to each level, making their max and min equivalent. We call these subjects consistent givers and cover a more detailed analysis of them in Section 4.3. Among those who discriminated in the amount they gave by treatment, 134 (29) subjects gave more (less) to the individual person than to any other target. There is a clear revealed preference for charity level by where subjects gave their personal max and min amounts (see Table A1, Panel C).
In the SDG, subjects indicated which of the four decisions they most preferred to implement. More than half of subjects (51.6%) chose the individual person target, which reveals a strong preference for an identifiable victim. Interestingly, the choices in the SDG mirror the pattern of giving in the CDG, with a U-shaped revealed preference curve across level distance: 16.8 selected the national charity, 8.4 percent the state, and 23.2 percent of subjects selected the local level charity decision. However, not every difference is statistically significant and there is likely level-specific heterogeneous behavior, so a more thorough statistical treatment is necessary. (See Panel D of Table 1A).

4. Regression Results

The aggregate results show that people differentiate among charities. We now focus on the relationship between subjects’ characteristics and their donation behavior. First, we use the comparative dictator game (CDG) subject-level panel to analyze the full sample. Second, we break the regressions apart by CDG level to investigate level-specific heterogeneous behavior among characteristics. Third, we discuss the consistent givers who gave the same amount to each recipient level. Last, we examine what subjects choose in the SDG and offer explanations for this behavior.

4.1. Comparative Dictator Game: Pooled Sample

Donating behavior was truncated between ($0, $60), so we use a Tobit model to account for subjects who might have preferred to give less than $0 or more than $60 in the absence of this restriction. We use four different specifications to evaluate the relationship between these characteristics and giving
G i   =   α + L γ + ε i
G i   =   α + L γ + D β + ε i
G i   =   α + L γ + I δ + ε i
G i   =   α + L γ + D β + I δ + ε i
where L is a vector of level controls (state, local, and person); D is a vector of demographic variables (age, male, high church attendance, college, and low income); and I is a vector of our constructed trust indices (government and people). ε i is the subject-specific error term. L will capture any level-specific differences in giving, independent of demographics, with state as the control variable. Based on Figure 3 and Panel A of 
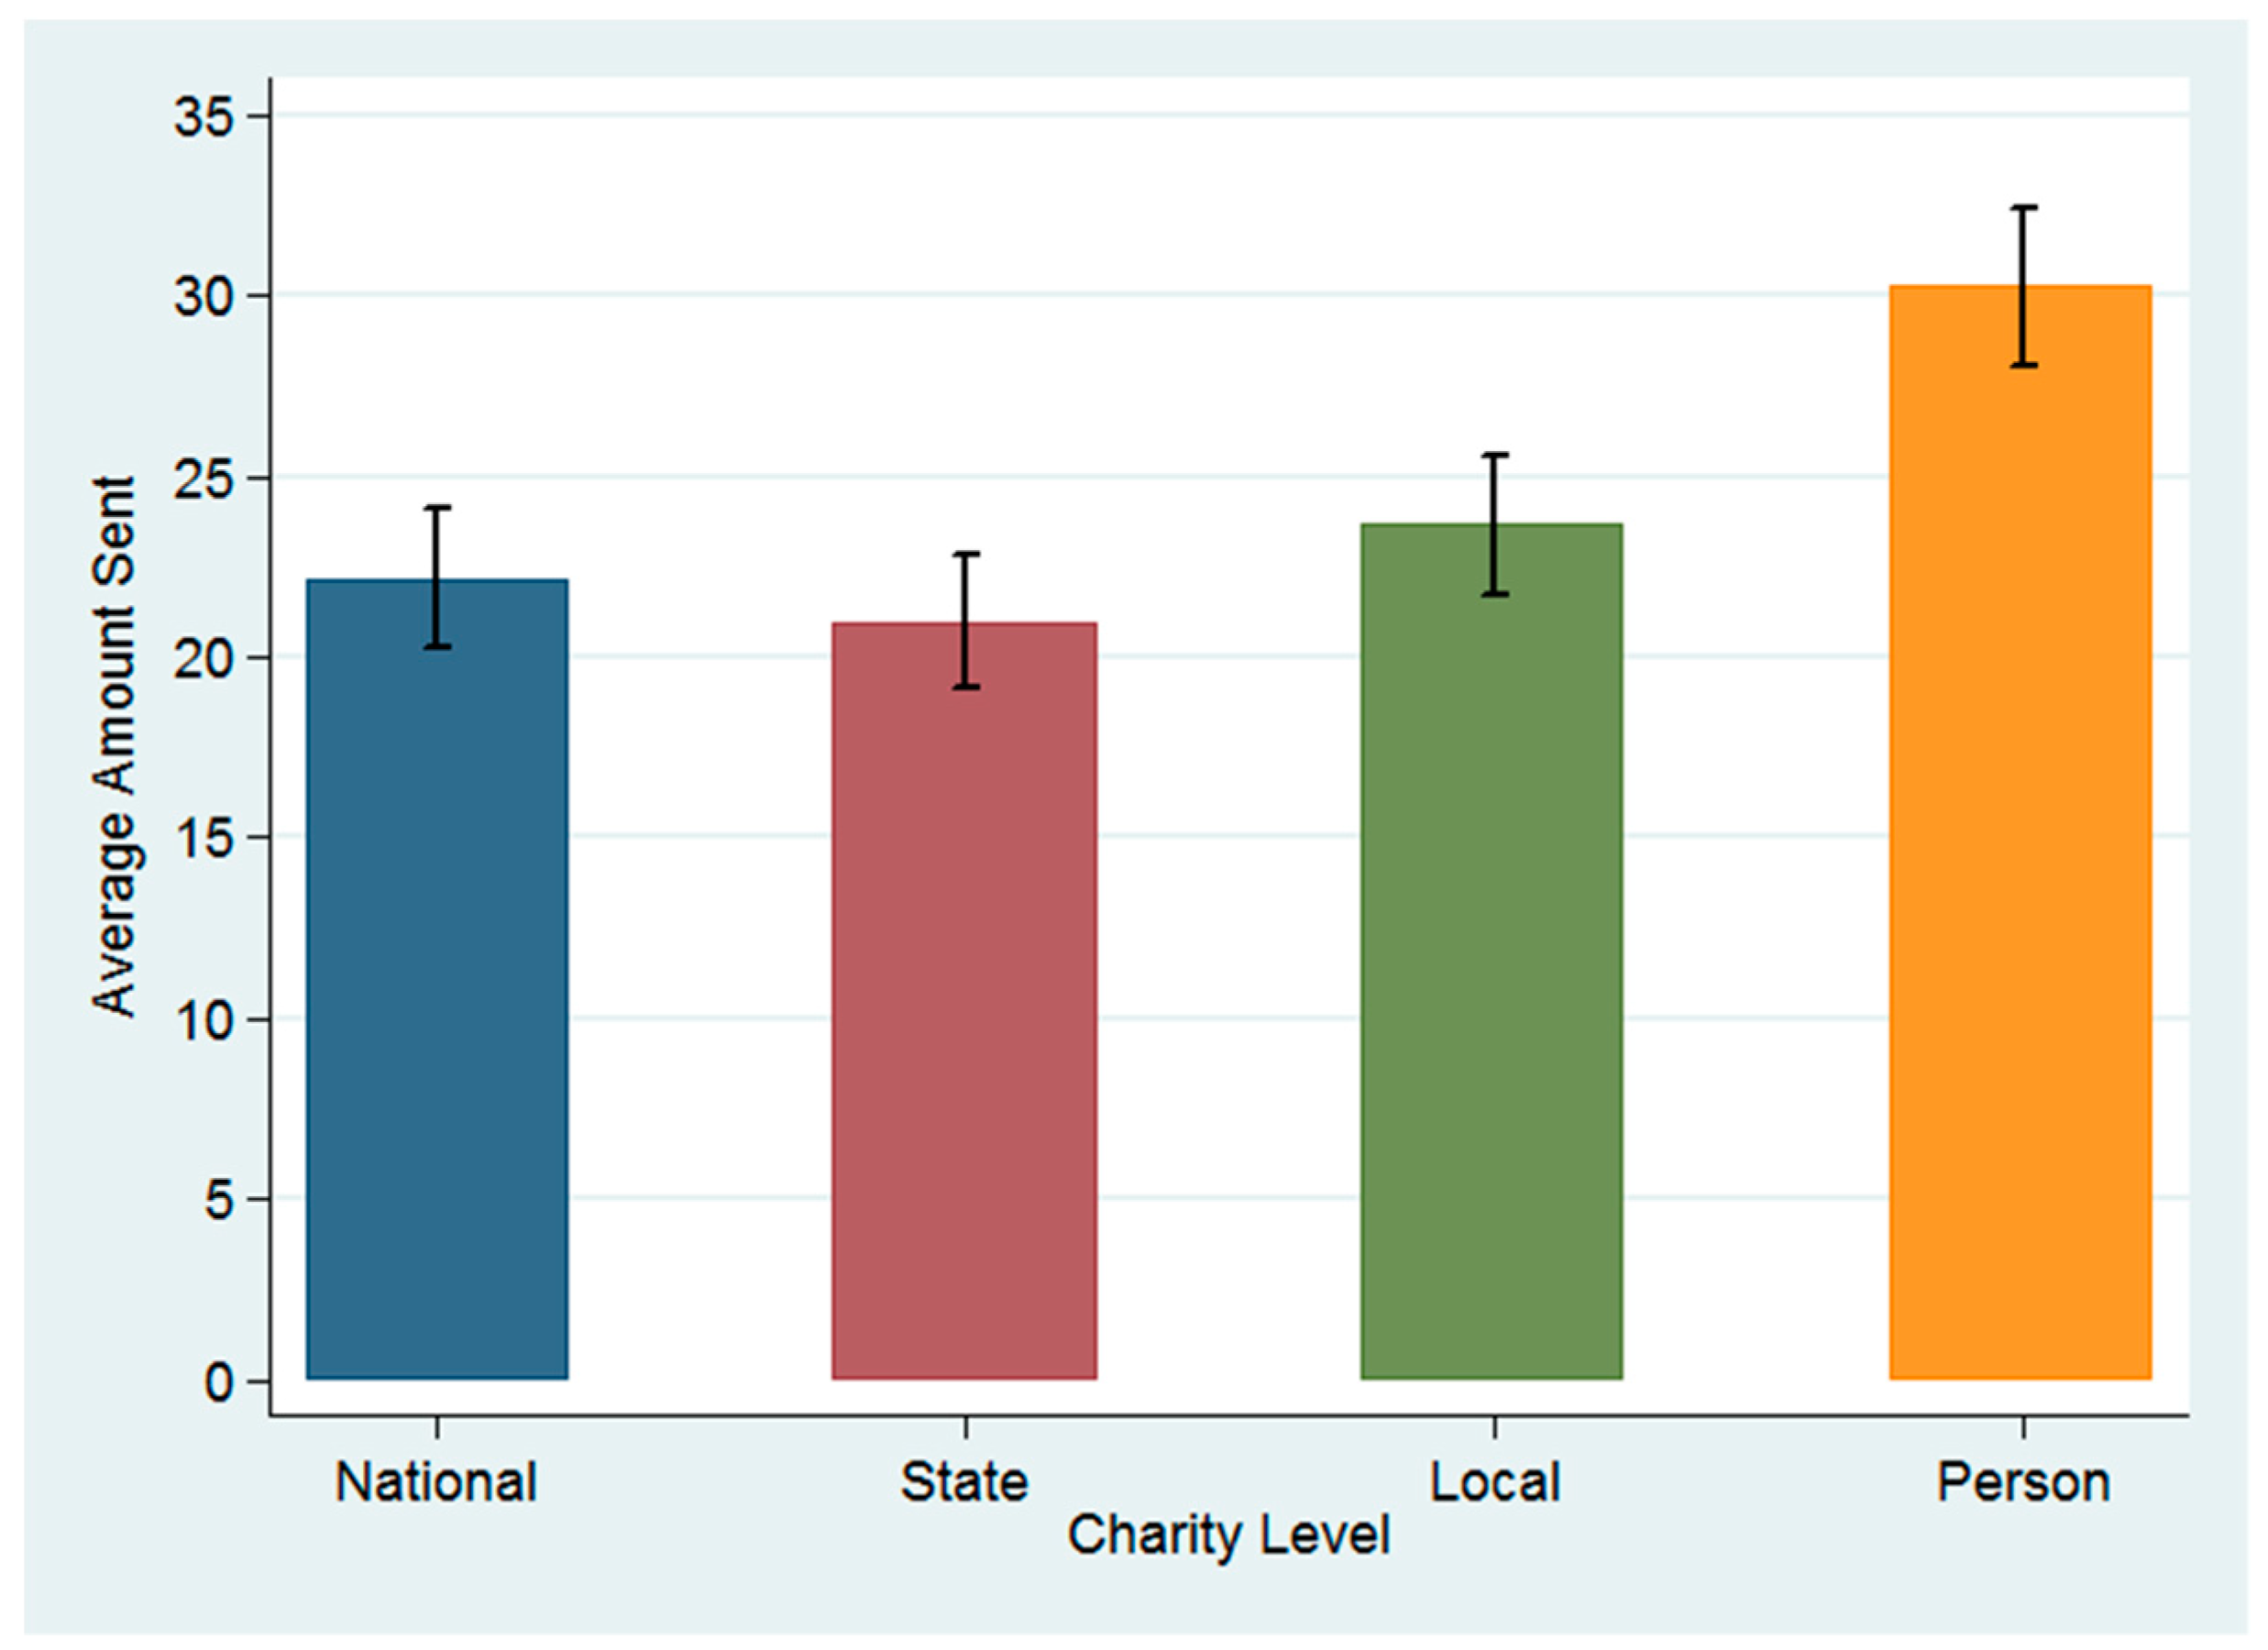
Table A1, we expect the coefficients on national, local, and person to be positive and significant.
There is a large, existing, literature on individual differences in altruistic behavior in the lab, typically measured by variations on dictator games. Gender has been extensively studied: in standard dictator games, where the recipient is an anonymous individual, women give more than men [17,18], although the gender difference may reverse if the relative price of giving is sufficiently low [19]. In “real donation” experiments [2], women also tend to give more than men, though this difference may vary by context. Two papers survey studies of charitable giving across methodologies and summarize findings on many factors including gender, age, education, religiosity, etc. [20,21]. Age, education, and income are consistently positively correlated with giving, but gender and religiosity show mixed results. From this literature, we predict age, education, and household income will have a consistent, significant, positive effect on giving. Since the literature is not entirely clear on how our other demographic covariates correlate with dictator game decisions, especially across each of our three non-human recipients (charities), we use the summary information in Panel B of Table A1 to guide our predictions: we expect gender and our measures of religiosity to have no effect. Though race is commonly and reasonably included as a control variable, our sample is predominantly white and therefore does not have enough variation to detect any racial effects. Including race in the analysis did not meaningfully change our results in any way.
The results for Specifications (1)–(4) are displayed in Table 4. The state-level charity is omitted for comparison. Consistent with the identifiable victim literature and Hypothesis 1, the coefficient on the person in town is significant and large in all specifications: subjects give considerably more to the person than to other levels (e.g., subjects give on average $11.50 more than to the state organization). We conclude from this that when an individual is included in the consideration set the relative impact of a donation becomes more salient than its geographic reach, in comparison to giving to other (organization) recipients.
Hypothesis 2 posits that the organizations will be considered differently than the individual recipient and, following [7], we will observe donation magnitude to correlate with organizations’ reach. We do not find consistent support for this hypothesis in Table 4. Subjects tend to give more to the national ($1.58) and local ($3.34) charities than to the state charity. Importantly, our full model (4) shows subjects giving a statistically significant amount more to every level than to state.
This causes a U-shaped giving curve across geographic level of operation. The relationship between ‘National’ and ‘State’ is consistent with [7] but the relationship between ‘State’ and ‘Local’ is exactly the opposite. There are two potential explanations for this difference: sample composition and consideration set. Our sample consists of adults aged 18–86 (mean of 45.48) instead of students, which (under Hypothesis 3b) we believe affects beliefs about the effectiveness of organizations operating at each level that informs charitable behavior. We test this more formally below. Another potential explanation is that we have added an individual to the subjects’ consideration set. Though each decision was made independently, simply adding the individual could affect how subjects consider giving to the other charities, possibly by shifting some internal reference point. We do not claim this as fact but offer it as conjecture, as our experiment is not designed to test how an additional recipient in the consideration set affects reference points.
There is markedly little evidence of significant demographic effects on giving across these specifications. Consistent with the literature and Hypothesis 3b, age is consistently positive and significant (p < 0.01) and economically meaningful: 10 additional years of age corresponds to a $2.40–$2.50 increase in giving. Considering our sample spans ages 18–84 there is room for considerable differences in giving behavior.3 Men give slightly less than women, but the difference is insignificant. Church attendance (religiosity) has a weak positive relationship to giving behavior here, which is possibly driven by giving to the Salvation Army (a religiously affiliated charity). People earning less than $30,000 a year give less than those earning more but not in a statistically meaningful way. Having at least some college education is negatively correlated with the amount given. Though this relationship is not statistically significant (p < 0.1), the sign is counterintuitive: education is typically positively correlated with giving.
Columns 3 and 4 include the trust survey measures, which are a preliminary test of Hypothesis 3a. Trust in institutions does not have a significant effect on giving. Trust in people, however, has an economically and statistically significant relationship with giving across both specifications: when accounting for other factors, an additional point increase in trusting people corresponds to approximately a $5 increase in sending (p < 0.01). We do not draw any definitive conclusions on Hypothesis 3a from these results, because we suspect that these indices will have a clearer relationship with giving when analysis is disaggregated. Still, it is surprising that “Trust in People” has an effect on the pooled data because it is likely to be isolated to lower levels (local and person). This suggests that people who score high on this index either always give large amounts (to all levels) or the effect is so strong in the lower levels that it is not washed out by pooling the data. Results below suggest that the former explanation is correct.
As discussed above, subjects gave approximately $10 more to the individual than any other level. This supports the importance of impact over reach when giving to an identifiable victim. Beyond this, however, rejecting Hypothesis 2 means impact and reach are related to each other. Subjects likely respond to some mixture of these two factors heterogeneously at each level, so we now turn to the disaggregated analysis.

4.2. Comparative Dictator Game: Disaggregated Analysis

We retain similar Tobit models as in Section 4.1, but restrict each specification by level (j) which necessarily means we no longer include level controls:
G i j   =   α + D j β j + ε i j
G i j   =   α + I j δ j + ε i j
G i j   =   α + D j β j + I j δ j + ε i j
where D j and I j are the demographics and trust indices vectors defined as above for each level j and ε i j is the subject-level specific error term. The results for Equation (7) are displayed in Table 5. Results for Specifications (5) and (6) are not meaningfully different from (7) and are available in Table A2 in the Appendix A.
As with the aggregate analysis, age has a persistent, significant, positive relationship with giving, further confirming Hypothesis 3b. Across all levels, an additional 10 years corresponds to sending between $2.10–$3.32 more. Surprisingly, when controlling for all factors this age effect is strongest with the state-level charity. This likely means that though it is important that our sample includes adults, the sample’s age composition is not the primary driver behind our U-shaped giving curve and, therefore, our contradiction with [7].
There is also level-specific heterogeneity in other demographic characteristics. Consistent with the findings from Section 4.1, the coefficients on gender, church attendance, and income are not statistically distinguishable from zero at the national, state, or local level. This changes when people make allocation decisions with a person. Subjects with high church attendance give $7.56 more (p < 0.05), on average, to a person than subjects with low church attendance, when including all relevant covariates. This further supports our conclusion that measuring organization-level preferences are not confused with organization preferences in our experiment (e.g., religious subjects do not display a preference for the Salvation Army because it is a religious organization).
Subjects who make less than $30,000 a year give $6.38 less (p < 0.05), on average, than subjects with a higher income. This implies that the identifiable victim effect is stronger for people with higher church attendance and higher incomes. Likewise, this implies that, if reach is a dimension on which subjects make charitable decisions, it is uncorrelated with most demographics or, at least, they do not systematically move together (i.e., men do not systematically value the reach of national over state charities more than women). The coefficient on college education is negative and significant (p < 0.05) at the national level, meaning that subjects with more education gave approximately $5 less to the national level charity. There is no such effect at other levels, with the exception of column 4 results (though this effect goes away when including our trust indices in column 6). This implies there is some relationship between education and beliefs about the efficacy of national-level charities. Since education is almost always an endogenous choice, we do not make any causal claims.
The trust indices offer additional insights. In columns 2 and 3, we observe that an additional point on the institutional trust index corresponds to sending approximately $5 more to the national charity (p < 0.01). This means that an increased trust in institutions is meaningfully expressed in giving behavior, supporting Hypothesis 3a that subjects hold underlying beliefs about the efficiency of different charity-levels. Contrary to Hypothesis 3a, institutional trust does not carry over to affect giving to the state charity. Consistent with intuition, however, the magnitude of the institutional trust effect monotonically diminishes as the recipient becomes ‘closer’ to the subject where ‘trust in people’ instead takes over as the operating behavioral mechanism. The institutional trust index is uncorrelated with political party affiliation (covariance = 0.0687) or political ideology (covariance = 0.0533), and the effect documented in Table 4 is unchanged by the inclusion of party and ideology controls.
The coefficient on the index for trusting in people is similarly consistent with intuition and Hypothesis 3a. An increased trust in people (by one point on our index) corresponds to a $6.70, $6.40, and $6.43 increase in giving to the state charity (p < 0.01), local charity (p < 0.01), and person (p < 0.05), respectively, when controlling for other demographic characteristics. As noted in Section 4.1, subjects who score higher on the ‘people trust’ measurement likely give more in general, though it is apparently limited to ‘lower level’ recipients. We would expect a trust in people to most strongly affect giving to a person, but interestingly it does not. This is likely because other factors take over at the person level (religiosity or income). Overall, we find strong support for Hypothesis 3a between our two trust indices with a slight modification—beliefs about how trustworthy institutions and people are map into donative behavior in a statistically significant way.

4.3. Consistent Givers

One challenge to our interpreting our results from the CDG above and the SDG below are subjects whose revealed preferences exhibit indifference between recipient levels. The allocation decision at each level was made independently, but this does not preclude subjects from giving the same amount to each recipient. Ninety-six subjects (30.97% of the sample) were consistent givers: they allocated the same amount to each recipient. Table 6 shows a summary of the consistent givers. Panel A describes the demographic breakdown and Panel B displays the distribution of amounts sent by consistent givers.
Table 6, Panel A shows that restricting our results to only varying givers (subjects who did not send the same amount to all recipients) would make our sample slightly older, more male, more religious, and lower income. There is no statistically significant relationship between demographic characteristics and the likelihood of being a consistent giver, with the exception of religiosity: frequent church attendees are less likely to give the same amount to each recipient (see Table A3 in Appendix A).
Consistent people most frequently chose to evenly divide the $60 endowment (30.21%) and ended up at the extremes of $0 (keep everything) and $60 (send everything) approximately 15.63% and 14.58% of the time, respectively. A detailed description of the consistent givers’ donation distribution is in Table A4. Basically, we see no reason to believe that including consistent givers biases our results; omitting them leaves us with less statistical power.

4.4. Selected Dictator Game

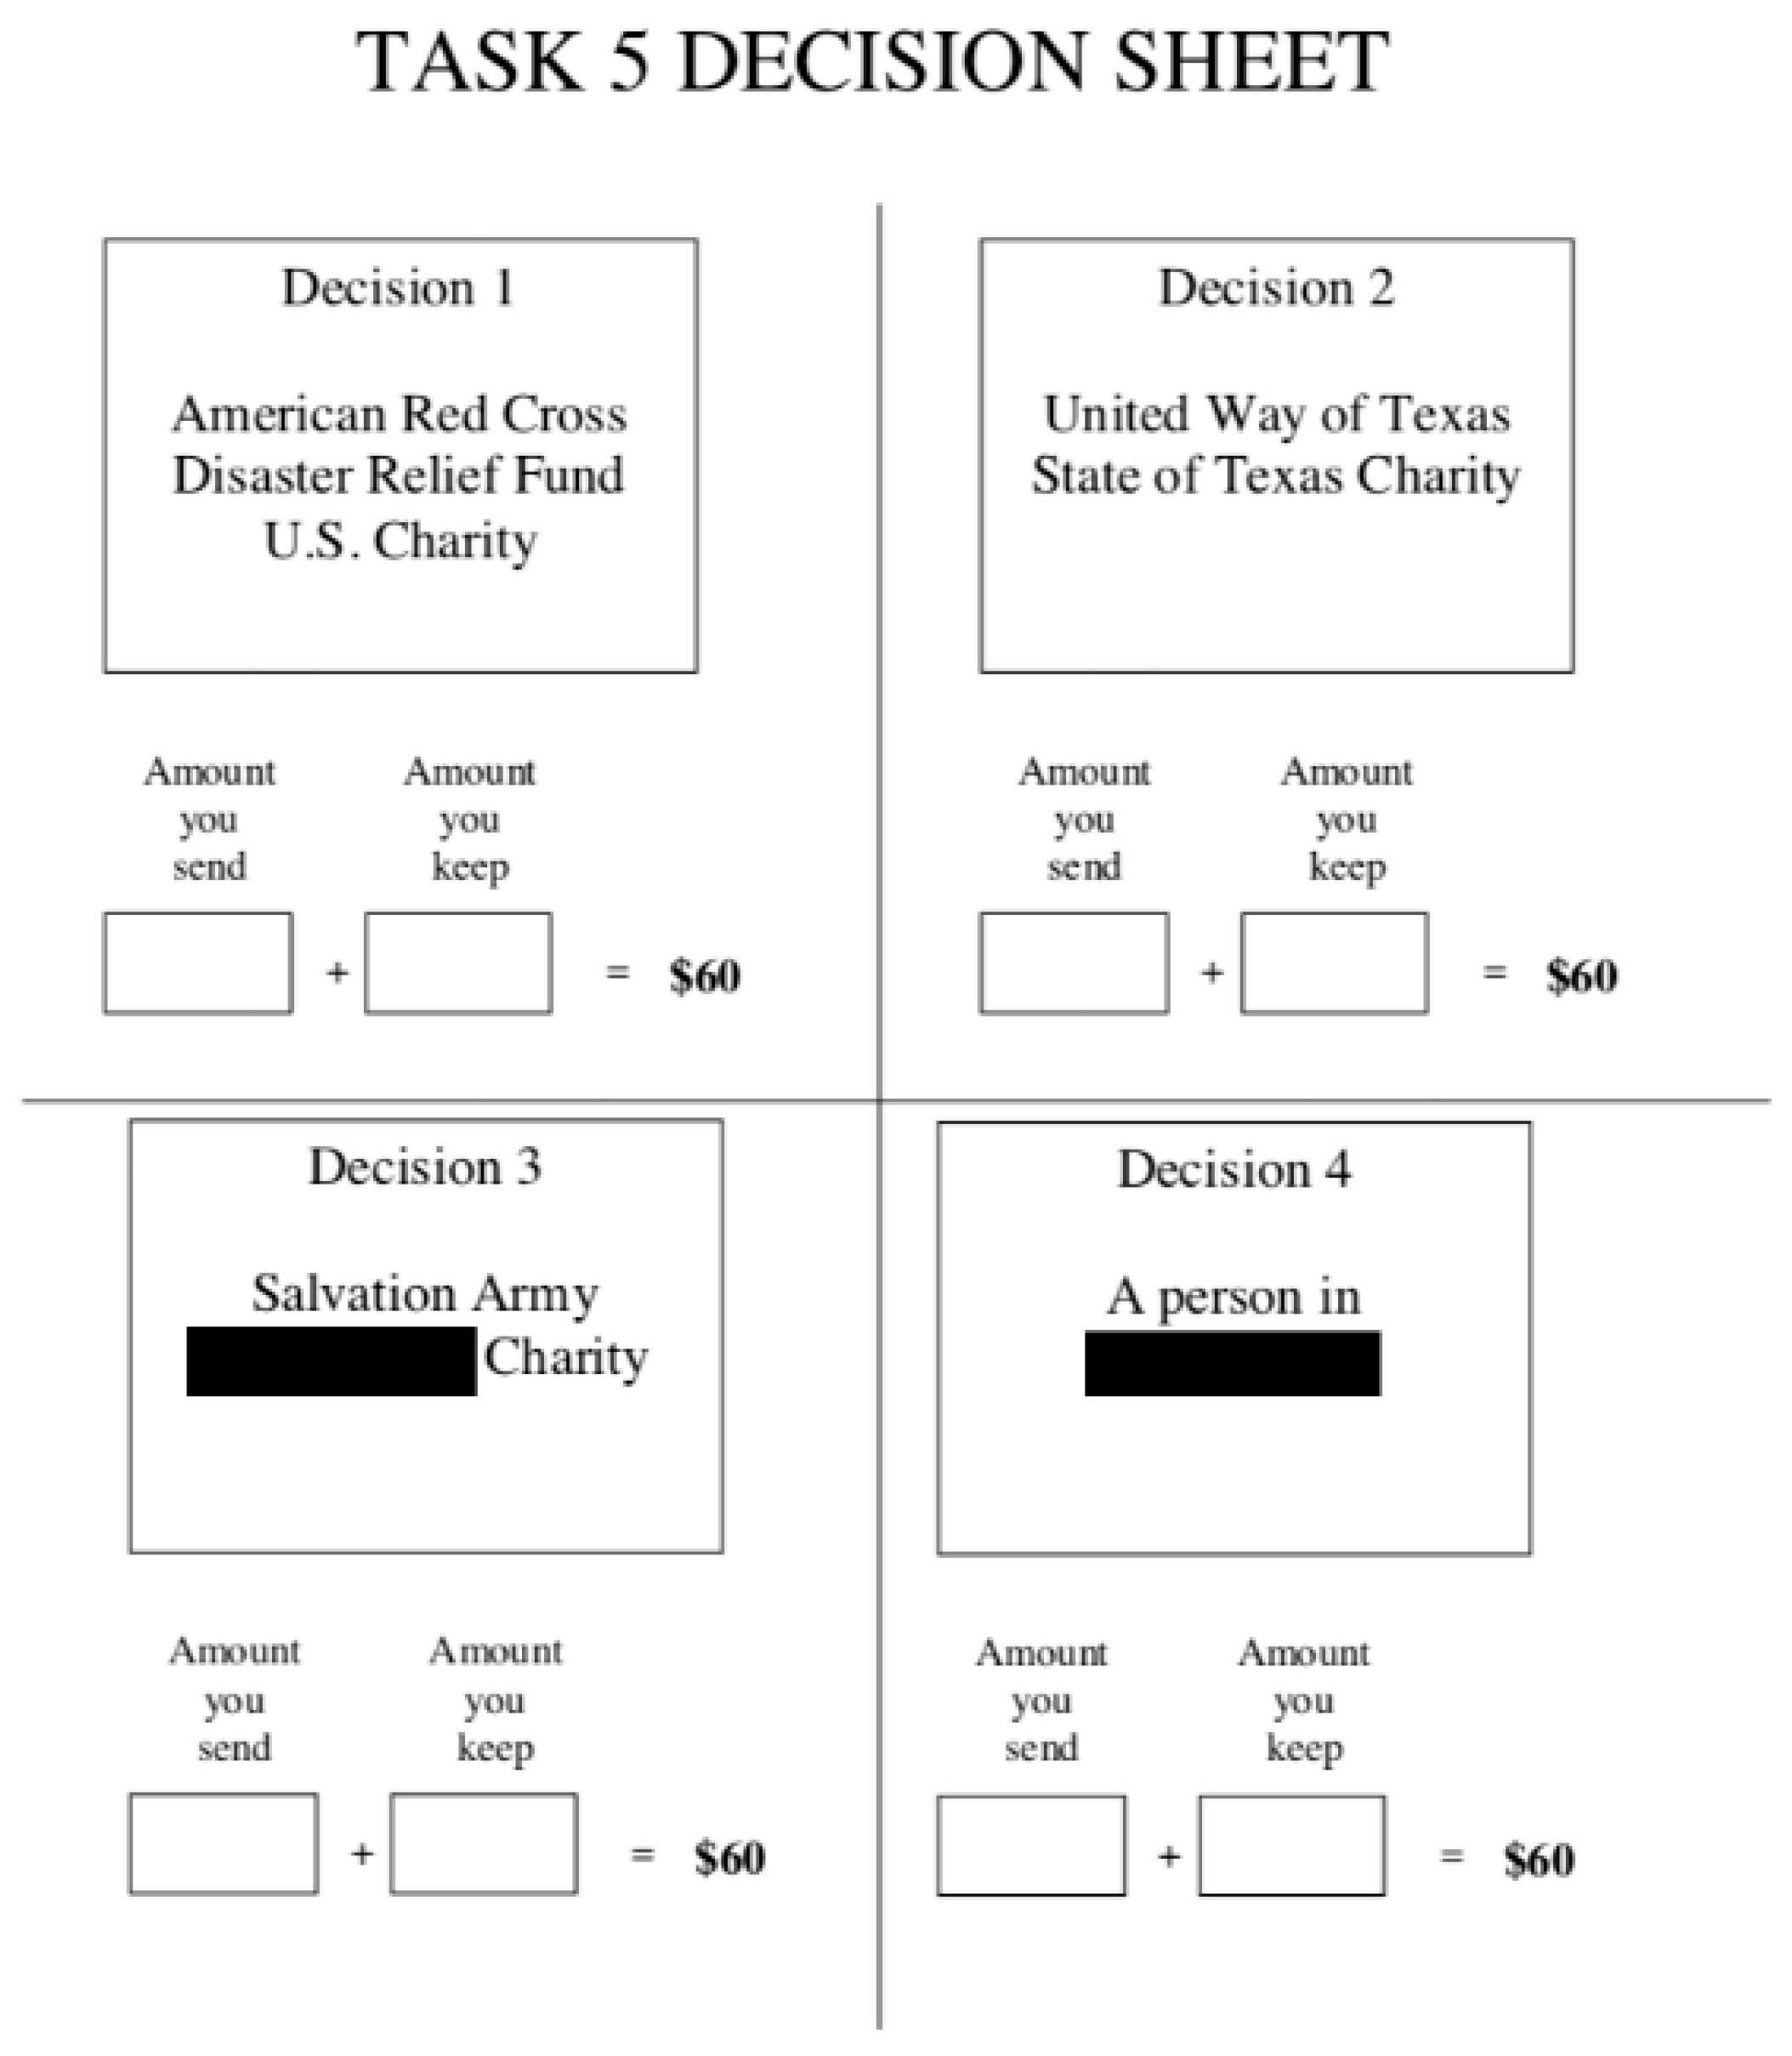
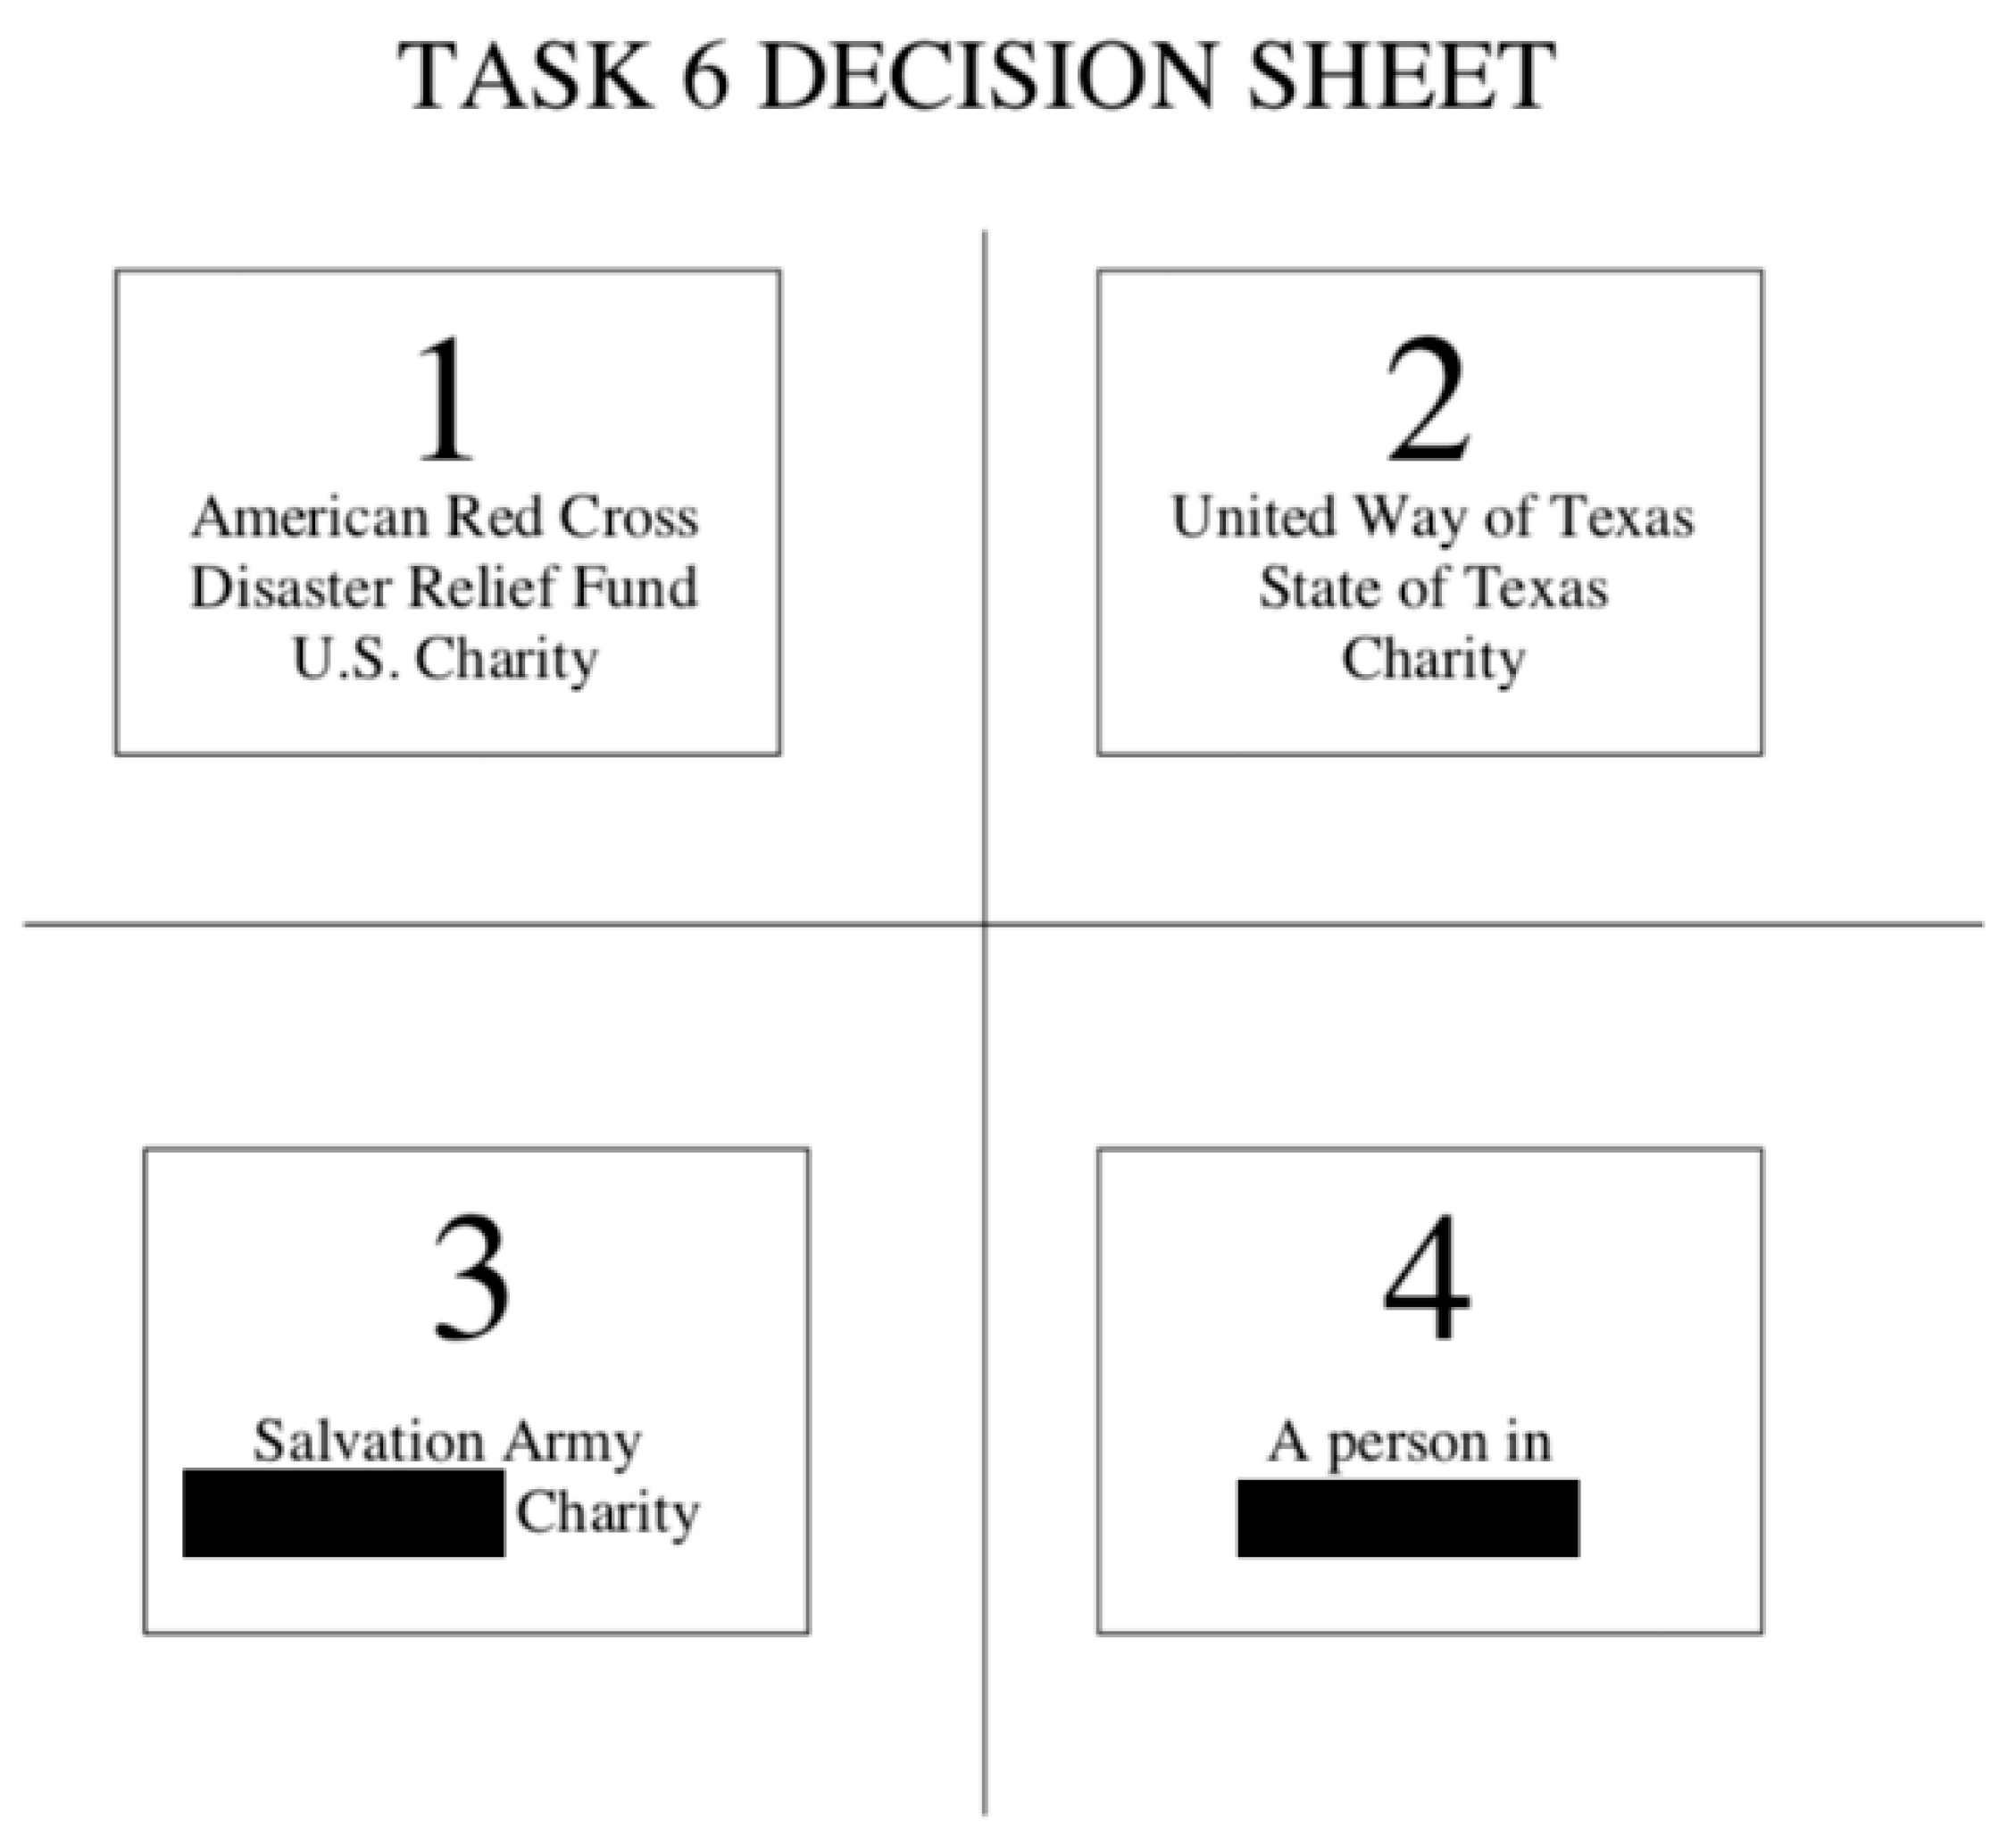
We now turn to the selected dictator game (SDG), the second task, where subjects chose one recipient out of the four levels from the CDG. If the SDG was selected for payment, subjects received the allocation for their chosen level from the CDG, with the remainder going to the selected organization. Subjects were unaware of the SDG when making allocation decisions in the CDG. The SDG is a form of revealed preference. However, it has three implications. First, it can indicate which charity the subject most prefers, independent of their allocation choice. Second, it could reveal an income-enhancing preference in which subjects chose the charity to which they gave the least (thereby maximizing what they earned if the task were selected for payment). Finally, it could reveal the subject’s desire to maximize their contribution to a charity in which the subject chose the charity to which they gave the most. Disentangling this from the first implication is difficult except for those subjects who always gave the same amount to each charity. As stated in Hypothesis 4 and consistent with [3], we expect subjects to be income-enhancing and choose the charity to which they gave the least in the CDG.
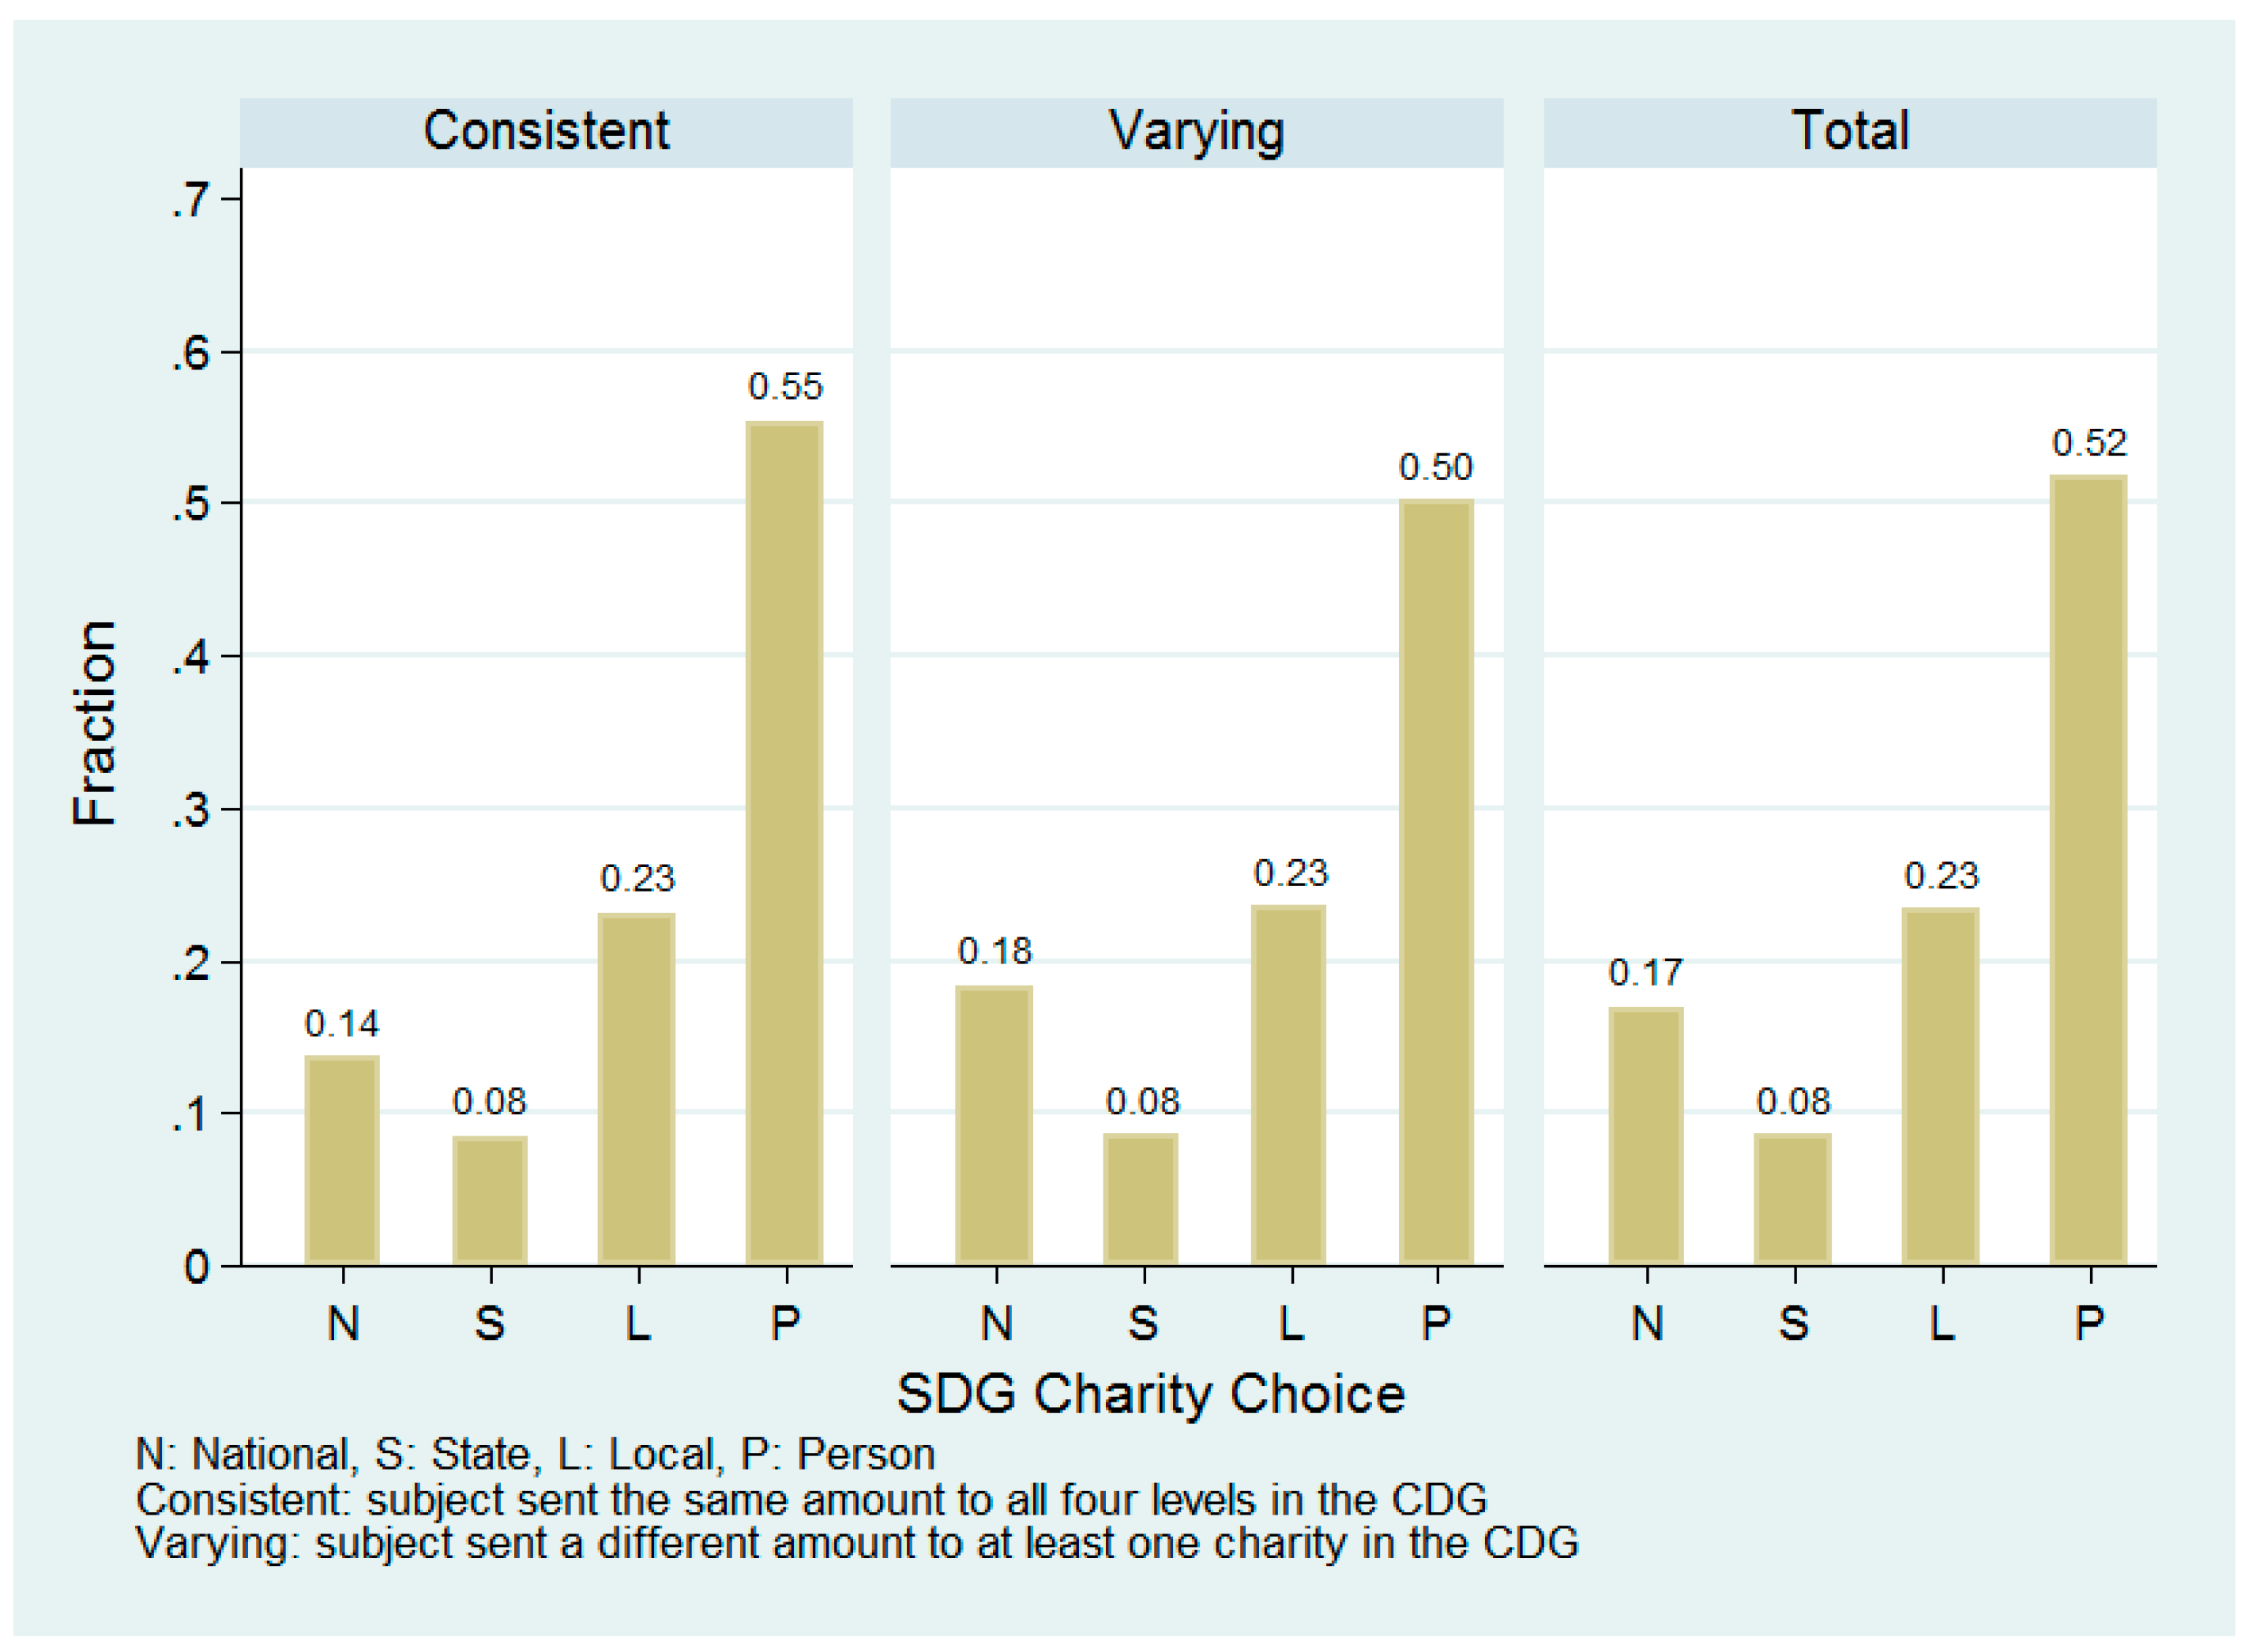
Figure 4 shows what proportion of subjects chose each level (panel C), as well as the distributions for consistent givers who gave the same amount in each decision (panel A) and varying givers who gave different amounts to each organization (panel B). Consistent with giving patterns observed in Section 4.1, the majority of subjects prefer the individual person to be the recipient followed by local, national, and then state charities. Revealed preference theory tells us that consistent givers are indifferent between each of the levels. If that were true, we should see a uniform distribution in panel A. Not only is the consistent givers’ distribution not uniform, but it is remarkably similar to the varying givers’ and total distributions. This implies that consistent givers are not truly indifferent between levels and are not so different from varying givers but have a similar behavioral response mechanism (weighing impact and reach).
Following the results from Section 4.2, there are plausibly heterogeneous preferences for SDG choice by demographic characteristics. For example, if people who attend church more give more to a person recipient, we can hypothesize that they will also be more likely to choose that level in the SDG. We test these choice and demographic relationships using an ordered logit model. We are interested in estimating the probability of choosing each level given some control variables, or P ( C   =   k   |   D , A , I ) ,   k   =   1 ,   2 ,   3 ,   4 , where D and I are defined as above and A is a vector containing the amount each subject sent to each level and C is defined as
C   =   { 1 i f   C μ 1 2 i f   μ 1 < C μ 2 3 i f   μ 2 < C μ 3 4 i f   C > μ 3
we calculate this using the latent variable models
C   =   D β + A λ + ξ
C   =   D β + A λ + I δ + ξ
An ordered logit model is particularly well-suited for this estimation because our charities’ levels retain a natural ordering (where 1 = national, 2 = state, 3 = local, and 4 = individual). Estimating this model gives us the predicted probability that subject i selects charity j from their decisions in the CDG, conditional on their characteristics (i.e., age, gender, church attendance, income, education), their trust indices, and the amounts they sent to each level. The results are displayed in Table 7.
We find little evidence of demographics influencing charity choice in the SDG. The only variable that is significant at conventional levels is age: There is a negative relationship between age and the level chosen (p < 0.05), meaning that older persons are less likely to select local organizations.
We now turn to the analysis testing Hypothesis 4. In their CDG study, [3] observed this purely selfish behavior. They argue that subjects must compete internally between financial self-interest and the desire to feel charitable by giving some amount away, and show that in their case, financial self-interest ultimately overpowered subjects’ altruism. We do not observe this: the coefficients on the donations to each recipient are small and statistically insignificant, and uncorrelated with their choice in the SDG.
We examine this more closely in Table 8 and Figure 5. We restrict our analysis here to varying givers only, since the minimum and maximum charities are equivalent for consistent givers. 
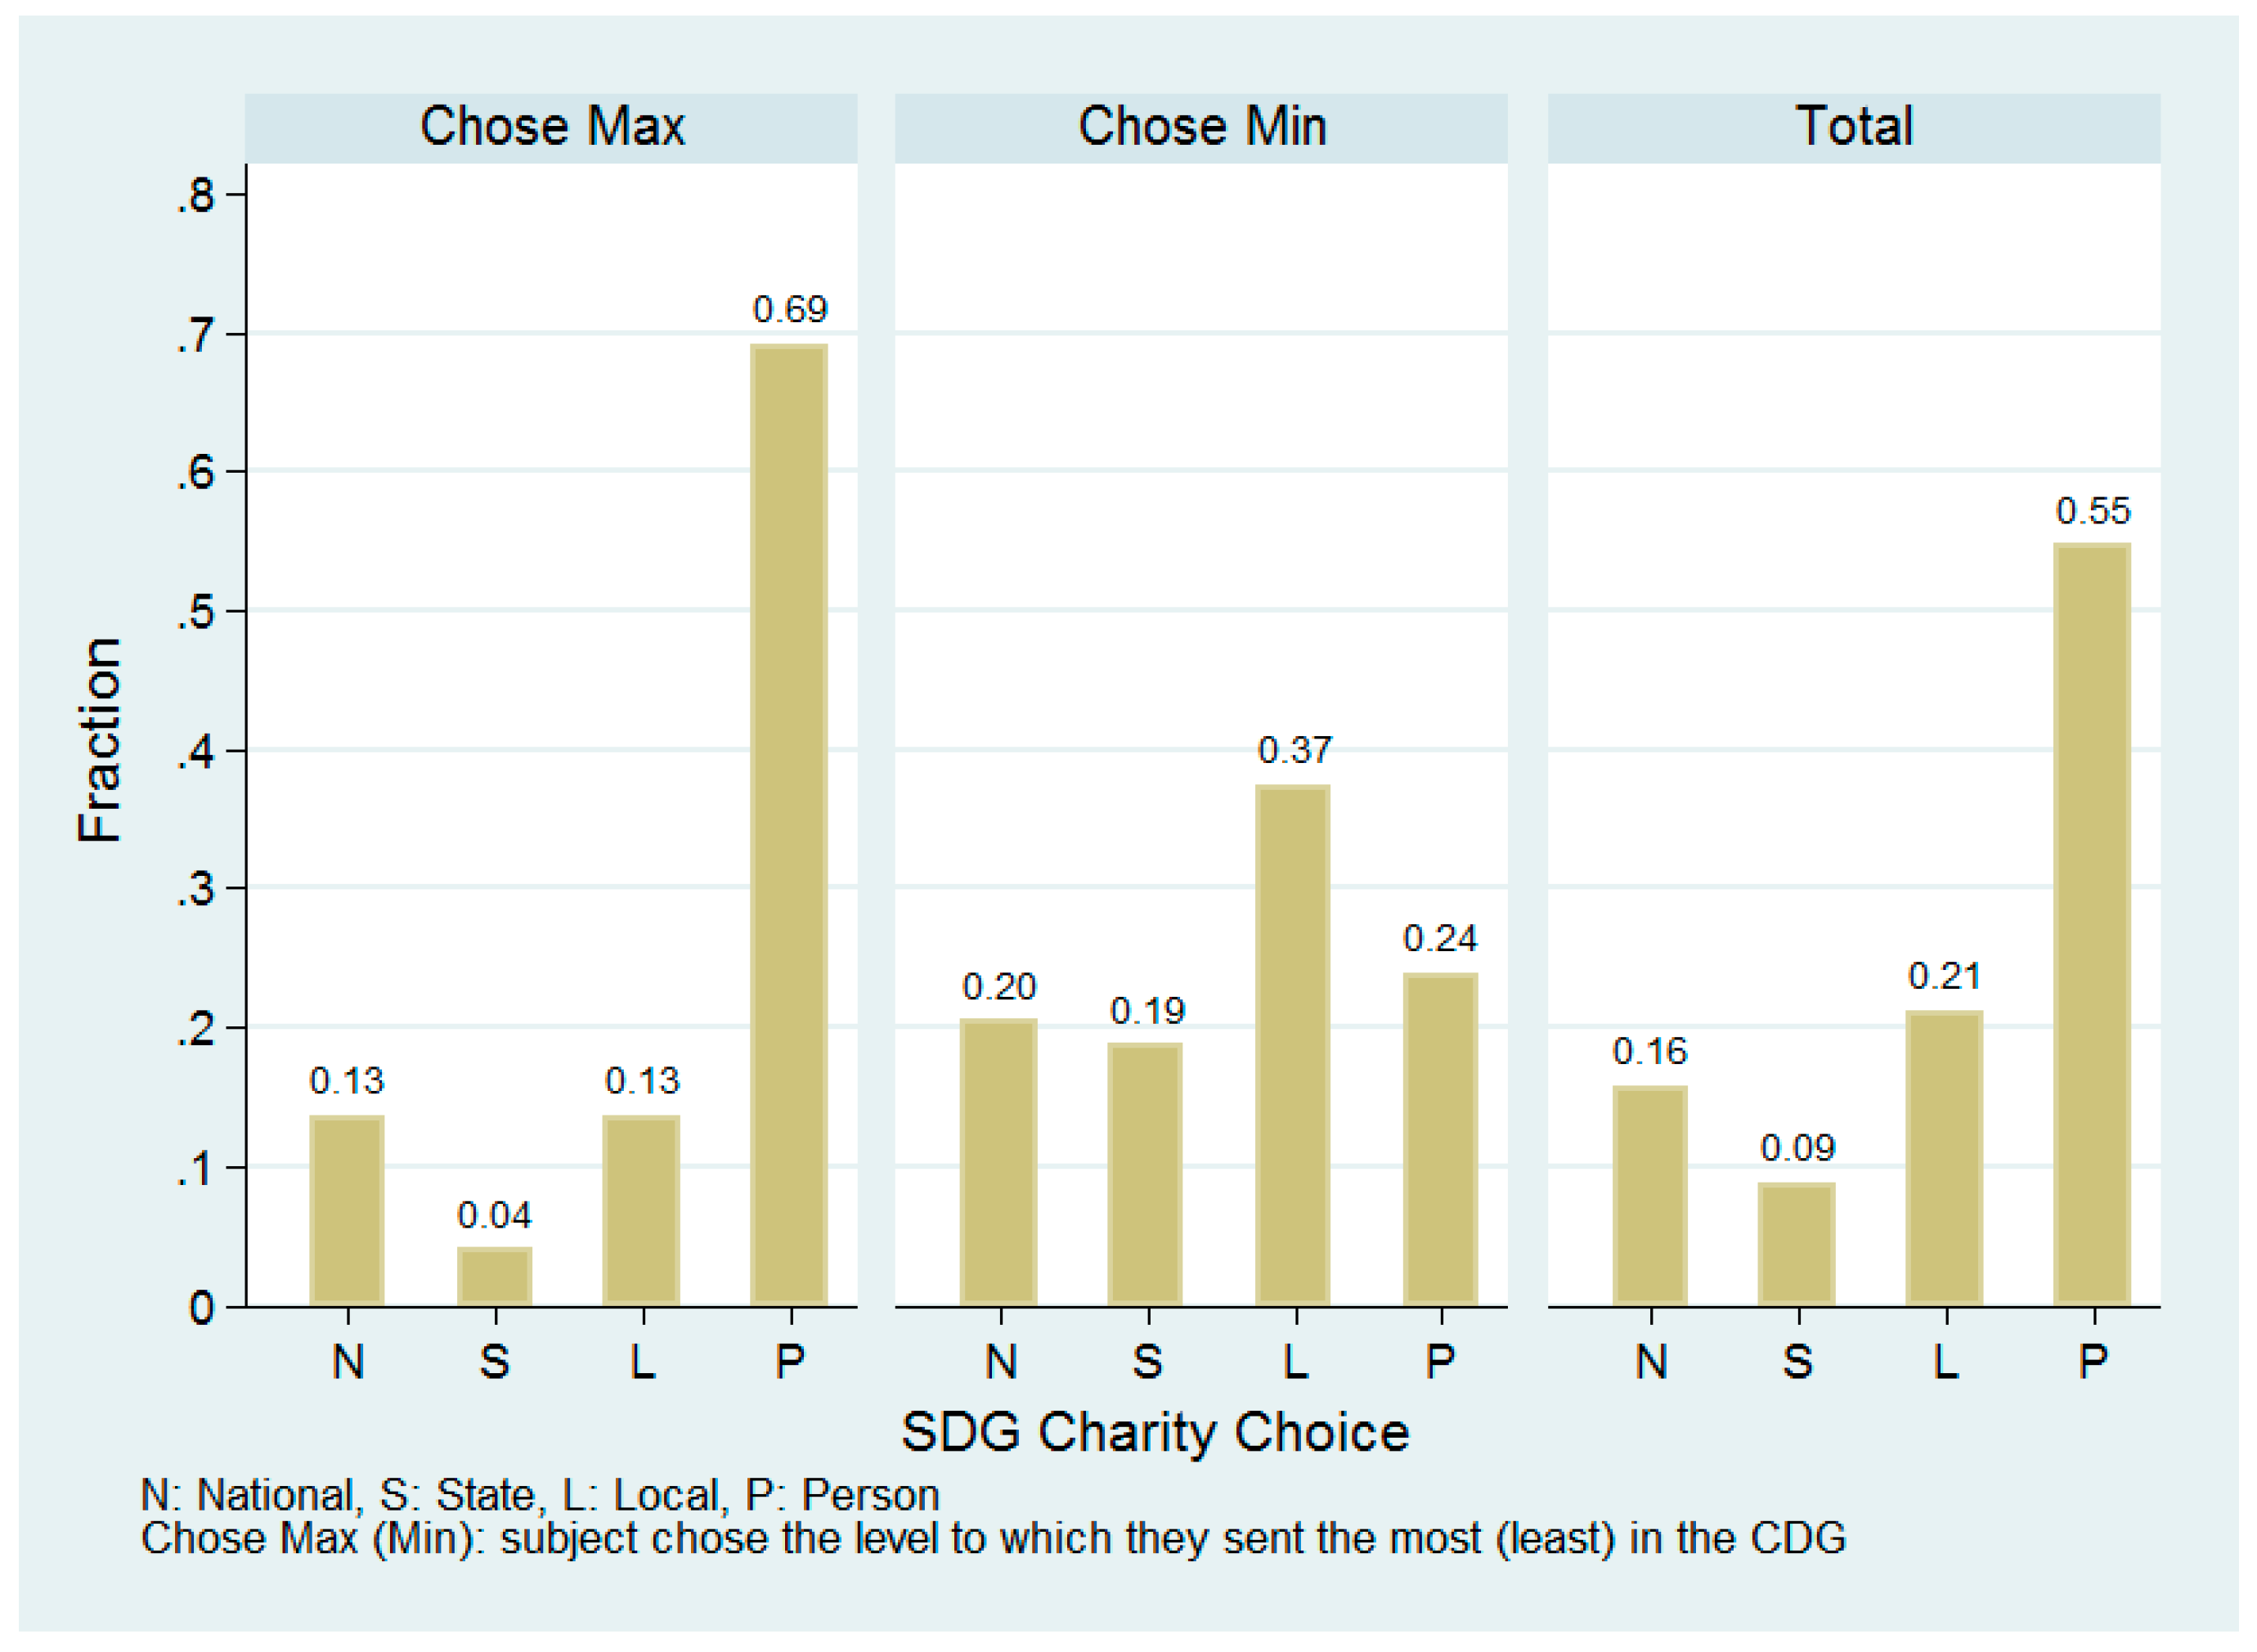
Table 8 is a tabulation of how many subjects chose each level in the SDG and breaks this down by those who chose the charity where they sent the least (min charity) and the most (max charity). We define a subject’s min (max) charity as the recipient to which they gave less (greater) than or equal to the next lowest (highest) amount sent to all other recipients by that subject. Figure 5 shows this information as a percentage of the total within each panel. For example, 23.73% (69.05%) of the subjects who chose their min (max) charity in the SDG selected the ‘person’ level. Table A5 in Appendix A shows probit results for the probability of choosing the min (columns 1–2) and max (columns 3–4) charity for each of our main covariates (demographics and indices).
Table 8 shows that substantially more people chose their max charity (126) in the SDG than their min charity (59). This further supports the rejection of our Hypothesis 4.
Additional analysis (see columns 1 and 2 of Table A5) show that no socio-demographic variables are correlated with the probability of choosing one’s min charity in the SDG. The coefficient on the people trust index is negative and statistically significant (p < 0.05): An additional point of trust on the index corresponds to a 36.2% decrease in the probability of choosing the min charity. This is unsurprising given the strong, positive relationship between this index and the amount sent (as described in Table 5). Those with higher trust in people are likely much more generous donors. They are not so altruistic, however, as to choose the max charity as shown in column 4. The coefficient on the people trust index is positive but is not significant at conventional levels (p < 0.1). Interestingly, men are much more likely than women (54%, p < 0.01) to choose their max charity in the SDG. This is surprising considering there were no gender differences in the amounts given across levels. Furthermore, the literature typically posits women as behaving more altruistically than men while we find the opposite here.

5. Discussion and Conclusions

We use a comparative dictator game and selected dictator game to explore how subjects differentiate between charities at different levels (national, state, local, individual) that have similar missions. Our study is conducted using a sample of adults, and our experiments are coupled with a survey collecting rich set of demographic and attitudinal information, which allows us to test for demographic and attitudinal correlates of charitable giving. To our knowledge, we are the first to use this experimental design with adults and the first to include an anonymous individual in the consideration set alongside different charity-levels with a similar mission.
We anticipated that donors might consider the breadth of the reach of the charitable organization, as well as the impact of their own donation in making their allocations. We hypothesized that impact would be most salient when considering an identifiable person, so giving would be highest at that level. We find support for this hypothesis, with subjects giving roughly $6.50–$9.50 more to the individual than any other level. We then propose that subjects consider organizations differently than an individual because the impact of their donation is less clear. We find only some support for our hypothesis that giving monotonically increases with the level, finding instead a U-shaped giving curve: giving to national and local charities was higher than state charities. We also find heterogeneous effects on giving by age and indices that measure trust in institutions and people. This confirms that giving behavior is at least partially determined by beliefs about the relative effectiveness of aid at each level, which varies across subjects. In addition, we find that college educated donors are more likely to give to a national charity, while church goers are more likely to provide charity at a local or individual level.
Finally, when given the opportunity to select which of their dictator decisions to be implemented, we are able to see whether people pursue a strategy of maximizing their own earnings by choosing their smallest donation, or whether they select the target to which they donated the most, reflecting their preferences for the altruistic action. Importantly, donors are not indifferent across charities, choosing the local victim more than half the time. This is true even for those who donate the same amount to all four charitable recipients. While these people should be indifferent between the four recipients, as revealed by their donation amounts, they are not, as revealed in their greater likelihood of selecting the anonymous individual recipient. Drawing from a similar, previous study, we hypothesized that donors would ultimately act in their own financial self-interest, choosing the charity to which they gave the least in the CDG. We reject this hypothesis, finding that subjects primarily select the organization to which they gave the most, revealing a stronger preference for altruism than selfishness in this environment.
For fundraisers, our research has three implications. First, we further confirm the importance of highlighting individual recipients whenever possible. Donors value the relative impact of their donation and this impact is clearest when the recipient is an identified individual (even if the person is anonymous). While this is not a novel idea to current philanthropic fundraising practices, we believe there is a second important takeaway for organizations operating at several levels. If soliciting donations for a menu of operating levels within an organization, including an individual recipient on the list may change behavior. We therefore recommend allowing (or perhaps nudging) potential donors to consider separately giving to a pre-identified individual and the organization as a whole at different levels. Lastly, if the organization operates at many geographic levels (local, state, national), we recommend including all of them on the menu for potential donors to consider so that they may self-select into giving to whichever level they prefer based on their own beliefs and values.

Supplementary Materials

The following are available online at: http://osf.io/bwq4n. Wilson, Rick K. 2018. “Charity Begins at Home.” Open Science Framework.

Author Contributions

Conceptualization, C.C.E. and R.K.W.; Data curation, C.C.E. and R.K.W.; Formal analysis, C.C.E., B.A.P. and R.K.W.; Funding acquisition, C.C.E. and R.K.W.; Project administration, C.C.E. and R.K.W.; Writing—original draft, C.C.E., B.A.P. and R.K.W.; Writing—review & editing, C.C.E., B.A.P. and R.K.W.

Funding

This research was funded by grants from the National Science Foundation (SES 0938090) and the Department of Homeland Security (NDCIEM). Neither agency bears responsibility for the conclusions reached in this article.

Acknowledgments

Thanks also go to Sheheryar (“Dave”) Banuri, Tara Larson Brown, Haley Harwell and Ngoc Phan for invaluable research assistance in carrying out the study.

Conflicts of Interest

The authors declare no conflict of interest. The funders had no role in the design of the study; in the collection, analyses, or interpretation of data; in the writing of the manuscript, or in the decision to publish the results.

Appendix A

Table A1. Summary of dictator game decisions (n = 310).
Average Amount SentProbability of DonatingConditional Average Amount Sent
Panel A: Comparative Dictator Game by Level
National charity22.170.87125.45
State charity20.980.87124.09
Local charity23.650.87726.95
Person in town30.230.91932.88
Panel B: Comparative Dictator Game Demographics
Male23.990.86627.70
Female24.490.89727.29
High church attendance 127.480.91829.92
Low church attendance22.490.86625.96
College 223.500.85527.50
No college25.260.92527.32
HH income < $30,00022.560.88325.57
HH income ≥ $30,00026.380.88829.71
Panel C: How many people sent their highest/lowest amount to each level? 3
Number sending highest amountNumber sending lowest amount
National charity2835
State charity2067
Local charity3283
Person13429
Panel D: % Choosing Each Level in Selected Dictator Game
National charity16.77
State charity8.39
Local charity23.23
Person in town51.61
1 High church attendance = 1 if subject reports attending church at least once a week. 2 College = 1 if subject reports having at least some college education. 3 Panel C: subjects were omitted if they sent the same amount to every level.
Table A2. Tobit results for comparative dictator game, by level, alternative specifications. 1
$ Sent to: 2NationalStateLocalPerson
β1: Age (in years)0.242 ** 0.211 ** 0.332 ** 0.214 *
(0.0858) (0.0787) (0.0827) (0.0996)
β2: Male−3.802 −3.036 1.630 1.296
(2.508) (2.323) (2.478) (3.083)
β3: High church attendance2.490 1.579 4.170 8.220 *
(2.683) (2.422) (2.630) (3.181)
β4: College−5.665 * −4.865 * −3.028 −3.214
(2.520) (2.285) (2.395) (3.043)
β5: Low income−0.157 −1.440 −2.437 −7.941 *
(2.646) (2.407) (2.601) (3.106)
δ1: Government 4.739 ** 3.228 * 0.548 −1.951
(1.721) (1.577) (1.780) (2.071)
δ2: People 2.959 6.181 ** 8.601 ** 10.26 **
(2.044) (1.847) (2.151) (2.636)
α: Constant14.45 **0.54414.65 **−7.2508.977 −5.39224.81 **4.200
(5.069)(6.880)(4.721)(6.404)(5.066)(7.282)(5.993)(8.680)
σ20.53 **20.71 **19.06 **19.20 **20.11 **20.76 **24.57 **25.30 **
(1.205)(1.191)(1.122)(1.094)(1.177)(1.163)(1.408)(1.448)
Number of subjects300309300309300309300309
1 Robust standard errors in parentheses: ** p < 0.01, * p < 0.05, p < 0.1. 2 Columns 1, 3, 5, and 7 correspond to equation 5. Columns 2, 4, 6, and 8 correspond to Equation (6).
Table A3. Regression results for demographic differences between consistent and varying givers. 1
Dependent Variable: Probability of Being A Consistent Giver
Age−0.000578−0.00144
(0.000863)(0.00252)
Male−0.0387−0.112
(0.0274)(0.0782)
High church attendance−0.109 **−0.318 **
(0.0284)(0.0850)
College0.01290.0383
(0.0286)(0.0807)
Low income0.02890.0865
(0.0287)(0.0820)
Constant0.375 **−0.328 *
(0.0533)(0.151)
Observations12001200
R20.018
OLS×
Probit ×
1 Robust standard errors in parentheses: ** p < 0.01, * p < 0.05.
Table A4. Distribution of amounts sent by consistent givers.
Sent ($)Frequency% of Consistent% of National% of State% of Local% of Person
01515.6337.5037.5039.4760.00
111.0416.6716.6725.00100.00
533.1317.6523.0837.5042.86
622.0840.0033.3328.5766.67
101616.6731.3727.5934.7843.24
201111.4621.5723.4020.7526.19
302930.2140.8542.0338.1639.19
3511.0433.3320.0033.33100.00
4033.1313.0418.7513.0413.64
5011.0414.2911.1112.507.69
601414.5858.3373.6850.0022.58
Table A5. Probit results for choosing the min and max in the selected dictator game. 1,2
Subject Chose Their Personal:MinMax
(1)(2)(3)(4)
Age−0.0103 −0.007940.003450.00126
(0.00616)(0.00647)(0.00583)(0.00615)
Male−0.311−0.3230.540 **0.542 **
(0.198)(0.204)(0.187)(0.192)
High church attendance−0.195−0.1640.2500.233
(0.206)(0.208)(0.195)(0.199)
College−0.133−0.06360.1860.133
(0.202)(0.210)(0.195)(0.202)
Low income0.388 0.303−0.249−0.180
(0.209)(0.215)(0.195)(0.199)
Government 0.0623 −0.0973
(0.147) (0.137)
People −0.362 * 0.277
(0.155) (0.151)
Constant−0.1060.752−0.194−0.723
(0.379)(0.645)(0.359)(0.609)
Observations205205205205
1 Robust standard errors in parentheses: ** p < 0.01, * p < 0.05, p < 0.1. 2 Analysis in this table was limited to varying givers.

Appendix B

Appendix B.1. Excerpt from Instructions at the Beginning of the Experiment

We are going to ask you to make some decisions and answer some questions. In the first part of this you will make some decisions to determine how much additional money you will receive. After all the decisions, you will answer some survey questions on natural disasters and other things about you and your community. Keep in mind that there are no right-or-wrong answers. We are interested in YOUR opinions and the way YOU make decisions. Are there any questions so far?

Appendix B.2. Excerpt from Instructions at the Beginning of Task 5 (Comparative Dictator Game)

Example 1—Look at the first decision. In this decision you have $60 which you must allocate between yourself and the recipient. Here the recipient is the American Red Cross Disaster Relief fund.
Now I am going to give you some information about the American Red Cross Disaster Relief Fund:
The American Red Cross Disaster Relief fund is a nonprofit charity that focuses on providing aid to disaster victims nationwide. It meets people’s immediate emergency disaster caused needs for shelter, food and health services. In this box, you will write how much of the $60 you would like to allocate to the American Red Cross Disaster Relief Fund. Suppose you want to allocate $42. This means you will keep $18, the rest of the $60 you were given initially, for yourself. Notice, these amounts must add up to $60.
Example 2—Look at the second decision. In this decision you have $60 which you must allocate between yourself and the recipient. Here the recipient is the United Way of Texas.
Now I am going to give you some information about the United Way of Texas:
The United Way of Texas is a nonprofit charity dedicated to meeting the needs of people across the state. It enables health and human services to get back in operation after a disaster. In this box, you will write how much of the $60 you would like to allocate to the United Way of Texas. Suppose you want to allocate $6. This means you will keep $54, the rest of the $60 you were given initially, for yourself. Notice, these amounts must add up to $60.
Example 3—Look at the Third decision. In this decision you have $60 which you must allocate between yourself and the recipient. Here the recipient is the local Salvation Army. Now I am going to give you some information about the local Salvation Army. The local Salvation Army is a nonprofit charity which focuses on providing clothing and food to disaster victims locally. In this box, you will write how much of the $60 you would like to allocate to the local Salvation Army. Suppose you want to allocate $0. This means you will keep all $60 for yourself. Notice, these amounts must add up to $60.

Appendix B.3. Excerpt from Instructions Describing the Payment Selection Process

To decide which task is going to be paid, we will pick an envelope out of this box. The envelopes look just like this example (grab example envelope). Inside the envelopes are cards with numbers on them. On this example card you can see a number sign (open example envelope to show card with number sign). The card that’s drawn will be numbered 1, 2, 3, 4, 5, or 6. The number that is selected is the number of the task you will be paid for.

Appendix B.4. Questions Used to Calculate Demographic Variables

Appendix B.4.1. Church Attendance

“How often do you attend church services or church related meetings?”
1 = More than once a week
2 = Once a week
3 = A couple of times a month
4 = Once a month
5 = Rarely
6 = Never
High church attendance is a binary variable set to unity if a subject reported attending church at least once a week.

Appendix B.4.2. Education

“Please indicate your highest level of education:”
1 = Less than 9th grade
2 = Between 9th grade and 12th grade (no diploma)
3 = High school graduate or GED
4 = Some college (no diploma)
5 = Graduated from college (Associate’s degree, Bachelor’s degree or above)
6 = Advanced degree
College is a binary variable set to unity if a subject reported having any college education.

Appendix B.4.3. Household Income

“What was your household income, before taxes and other deductions, from all sources (for example, wages, child support, alimony, investments, government or social assistance, grants) for the last 12 months? Please give us your best guess if the exact figure is not known.”
1 = Less than $10,000
2 = $10,000 to less than $20,000
3 = $20,000 to less than $30,000
4 = $30,000 to less than $40,000
5 = $40,000 to less than $50,000
6 = $50,000 to less than $60,000
7 = $60,000 to less than $75,000
8 = $75,000 to less than $100,000
9 = $100,000 to less than $125,000
10 = Greater than $125,000
Low income is a binary variable set to unity if subjects report a yearly household income of less than $30,000.

Appendix B.5. Questions Used to Calculate Attitudinal Indices

Subjects responded to the below questions with the following scale.
1 = Trust completely
2 = Trust somewhat
3 = Do not trust very much
4 = Do not trust at all

Appendix B.5.1. Institutions:

How much do you trust the following: City government
How much do you trust the following: State (Texas) government
How much do you trust the following: The Governor
How much do you trust the following: Federal government
How much do you trust the following: FEMA

Appendix B.5.2. People

How much do you trust the following: Your neighbors
How much do you trust the following: Your coworkers
How much do you trust the following: Fire department
Indices were rotated to be increasing in trust and scaled to be between 1 and 4.

References

  1. Vesterlund, L. Using experimental methods to understand why and how we give to charity. In Handbook of Experimental Economics, 1st ed.; Kagel, J.H., Roth, A.E., Eds.; Princeton University Press: Princeton, NJ, USA, 2016; Volume 2, pp. 91–151. [Google Scholar]
  2. Eckel, C.C.; Grossman, P.J. Altruism in anonymous dictator games. Games Econ. Behav. 1996, 16, 181–191. [Google Scholar] [CrossRef]
  3. Candelo, N.; De Oliveira, A.; Eckel, C. Worthiness versus Self-Interest in Charitable Giving: Evidence from a Low-Income, Minority Neighborhood. 2018; Manuscript submitted for publication. [Google Scholar]
  4. Candelo, N.; Eckel, C.C.; Johnson, C. Social Distance Matters in Dictator Games: Evidence from 11 Mexican Villages. Games 2018, 9, 77. [Google Scholar] [CrossRef]
  5. Fong, C.M. Evidence from an Experiment on Charity to Welfare Recipients: Reciprocity, Altruism and the Empathic Responsiveness Hypothesis. Econ. J. 2007, 117, 1008–1024. [Google Scholar] [CrossRef]
  6. Fong, C.M.; Luttmer, E.F.P. What Determines Giving to Hurricane Katrina Victims? Experimental Evidence on Racial Group Loyalty. Am. Econ. J. Appl. Econ. 2009, 1, 64–87. [Google Scholar] [CrossRef] [Green Version]
  7. Li, S.X.; Eckel, C.C.; Grossman, P.J.; Brown, T.L. Giving to government: Voluntary taxation in the lab. J. Public Econ. 2011, 95, 1190–1201. [Google Scholar] [CrossRef] [Green Version]
  8. Eckel, C.C.; Herberich, D.H.; Meer, J. A field experiment on directed giving at a public university. J. Behav. Exp. Econ. 2017, 66, 66–71. [Google Scholar] [CrossRef]
  9. Li, S.X.; Eckel, C.C.; Grossman, P.J.; Brown, T.L. Directed giving enhances voluntary giving to government. Econ. Lett. 2015, 133, 51–54. [Google Scholar] [CrossRef] [Green Version]
  10. Jenni, K.E.; Loewenstein, G. Explaining the “Identifiable Victim Effect”. J. Risk Uncertain. 1997, 14, 235–257. [Google Scholar] [CrossRef]
  11. Small, D.A.; Loewenstein, G. Helping a Victim or Helping the Victim: Altruism and Identifiability. J. Risk Uncertain. 2003, 26, 5–16. [Google Scholar] [CrossRef]
  12. Lee, S.; Feeley, T.H. The Identifiable Victim Effect: A Meta-Analytic Review. Soc. Influ. 2016, 11, 199–215. [Google Scholar] [CrossRef]
  13. DellaVigna, S.; List, J.A.; Malmendier, U. Testing for Altruism and Social Pressure in Charitable Giving. Q. J. Econ. 2012, 127, 1–56. [Google Scholar] [CrossRef] [PubMed] [Green Version]
  14. Andreoni, J.; Rao, J.R.; Trachtman, H. Avoiding the Ask: A Field Experiment on Altruism, Empathy, and Charitable Giving. J. Polit. Econ. 2017, 125, 625–653. [Google Scholar] [CrossRef]
  15. Eckel, C.C.; Grossman, P.J. Forecasting risk attitudes: An experimental study using actual and forecast gamble choices. J. Econ. Behav. Organ. 2008, 68, 1–17. [Google Scholar] [CrossRef]
  16. Berg, J.; Dickhaut, J.; McCabe, K. Trust, reciprocity, and social history. Games Econ. Behav. 1995, 10, 122–142. [Google Scholar] [CrossRef]
  17. Eckel, C.C.; Grossman, P.J. Are Women Less Selfish Than Men?: Evidence From Dictator Experiments. Econ. J. 1998, 108, 726–735. [Google Scholar] [CrossRef]
  18. Engel, C. Dictator games: A meta study. Exp. Econ. 2011, 14, 583–610. [Google Scholar] [CrossRef]
  19. Andreoni, J.; Vesterlund, L. Which is the fair sex? Gender differences in altruism. Q. J. Econ. 2001, 116, 293–312. [Google Scholar] [CrossRef]
  20. Bekkers, R.; Wiepking, P. Who gives? A literature review of predictors of charitable giving. Part One: Religion, education, age and socialisation. Volunt. Sect. Rev. 2011, 2, 337–365. [Google Scholar] [CrossRef]
  21. Bekkers, R.; Wiepking, P. Who gives? A literature review of predictors of charitable giving. Part Two: Gender, family composition and income. Volunt. Sect. Rev. 2012, 3, 217–245. [Google Scholar] [CrossRef] [Green Version]
1
This study was conducted in accordance with the Declaration of Helsinki, and the protocol was approved by the Institutional Review Board of: Rice University, 09-0674X, approved 26 May 2009; University of Texas at Dallas, MR09-51, approved 29 May 2009; and Texas A&M University, IR2013-3020, approved 6 May 2013.
2
Each participant was given two cards containing information about the study, along with a code number identifying the participant, and told to give these cards to their neighbors. They received a $20 bonus for every new recruit (up to two). A total of 51 additional subjects were recruited in this manner.
3
Results for second and third degree polynomials for age were insignificant. We concluded that a linear specification was most appropriate.
Figure 1. Decision sheets used by subjects when deciding allocations between themselves and charities in the comparative dictator game. References to towns are blacked out.
Games 09 00095 g001
Figure 2. Decision sheets used by subjects when deciding which charity from Task 5 to choose as the sole recipient in the selected dictator game. References to towns are blacked out.
Games 09 00095 g002
Figure 3. Average amount sent to each charity level, with 95% confidence intervals.
Games 09 00095 g003
Figure 4. Proportion of subjects that chose each level in the SDG: consistent givers, varying givers, and the full sample.
Games 09 00095 g004
Figure 5. Proportion of subjects that chose each level in the SDG: those who chose their min charity, those who chose their max charity, and the full sample.
Games 09 00095 g005
Table 1. Recipient organizations in the comparative dictator game.
NationalStateLocalPerson
Town 1American Red Cross Disaster Relief FundUnited Way of TexasSalvation Army of townIndividual selected by local fire department
Town 2Salvation Army of TexasUnited Way of town’s county
Table 2. Summary of demographic variables.
ObservationsMeanStandard Deviation
Male1290.4180.494
White2000.6450.479
Hispanic800.2580.438
High church attendance1100.3550.479
Age (in years)31045.4816.03
Married1410.4550.498
At least some college education1730.5710.495
Low income (HH income < $30 K)1660.5460.498
Male, White, Hispanic, Married, At least some college education, and low income are dummy variables equal to one if the category is true. High church attendance = 1 if subject reports attending church at least once a week. Observations shows the number of subjects in that category.
Table 3. Summary of calculated attitudinal indices.
VariableMeanStandard DeviationMinMaxNo. ItemsCronbach’s Alpha
Trust in Institutions2.4120.7141450.84
Trust in People3.1510.6441430.61
Table 4. Tobit results for comparative dictator game: full sample. 1
Dependent Variable: $ Sent(1)(2)(3)(4)
γ1: National charity1.371 1.566 *1.389 1.581 *
(0.807)(0.770)(0.811)(0.777)
γ3: Local charity3.104 **3.317 **3.124 **3.340 **
(0.925)(0.883)(0.934)(0.893)
γ4: Person in town11.53 **11.66 **11.57 **11.71 **
(1.224)(1.230)(1.228)(1.235)
β1: Age (in years) 0.252 ** 0.240 **
(0.0737) (0.0728)
β2: Male −1.046 −0.858
(2.253) (2.205)
β3: High church attendance 4.011 2.990
(2.339) (2.271)
β4: College −4.192 −4.165
(2.225) (2.242)
β5: Low income −2.866 −1.564
(2.385) (2.356)
δ1: Trust in institutions 1.7222.579
(1.512)(1.547)
δ2: Trust in people 6.959 **5.203 **
(1.823)(1.725)
α: Constant19.97 **11.37 *−6.198−11.19
(1.165)(4.638)(6.251)(7.762)
σ22.01 **21.18 **21.54 **20.87 **
(1.053)(1.011)(0.999)(0.990)
Observations1,2401,2001,2361,196
Number of subjects310300309299
1 Robust standard errors in parentheses: ** p < 0.01, * p < 0.05, p < 0.1.
Table 5. Tobit results for comparative dictator game by charity level 1.
$ Sent to:NationalStateLocalPerson
β1: Age (in years)0.263 **0.306 **0.292 **0.182
(0.0870)(0.0802)(0.0766)(0.100)
β2: Male−3.3501.7192.3801.345
(2.471)(2.440)(2.404)(3.066)
β3: High church attendance1.3493.1774.1067.558 *
(2.608)(2.565)(2.561)(3.141)
β4: College−5.082 *−3.286−3.398−3.616
(2.533)(2.439)(2.403)(3.019)
β5: Low income0.474−0.803 −6.375 *
(2.629)(2.575) (3.144)
δ1: Trust in institutions5.265 **1.4091.386−0.0600
(1.843)(1.753)(1.735)(2.082)
δ2: Trust in people2.3066.697 **6.390 **6.432 *
(2.109)(1.949)(1.935)(2.547)
α: Constant−6.895−14.80 −14.32 5.719
(8.718)(8.659)(7.943)(10.65)
σ20.19 **19.73 **19.74 **24.29 **
(1.190)(1.142)(1.137)(1.410)
Number of subjects299299305299
1 Robust standard errors in parentheses: ** p < 0.01, * p < 0.05, p < 0.1.
Table 6. Summary of varying and consistent givers’ characteristics.
Panel A: Demographics
Frequency (%)Age (average)MaleHigh ChurchCollegeLow Income
Varying214 (69.03%)46.050.430.390.570.52
Consistent96 (30.97%)44.220.390.280.560.59
Table 7. Ordered logit results for the selected dictator game. 1
Dependent Variable: Charity Level Chosen
Model 1Model 2
β1: Age−0.0143 (0.00764)−0.0157 *(0.00766)
β2: Male0.295(0.234)0.265(0.235)
β3: High church attendance0.247(0.254)0.256(0.257)
β4: College−0.360(0.257)−0.388(0.261)
β5: Low income−0.334(0.273)−0.321(0.276)
λ1: $ Sent to national−0.0180 (0.0103)−0.0172 (0.0103)
λ2: $ Sent to state−0.00979(0.0133)−0.00959(0.0135)
λ3: $ Sent to local0.0133(0.0126)0.0133(0.0129)
λ4: $ Sent to person0.0159 (0.00866)0.0156 (0.00884)
δ1: Trust in institutions −0.135(0.191)
δ2: Trust in people 0.0394(0.223)
µ1: Cutoff 1−2.338 **(0.522)−2.603 **(0.836)
µ2: Cutoff 2−1.781 **(0.507)−2.045 *(0.823)
µ3: Cutoff 3−0.715(0.490)−0.974(0.809)
Observations300 299
1 Robust standard errors in parentheses: ** p < 0.01, * p < 0.05, p < 0.1.
Table 8. Summary of selected dictator game choices.
TotalNationalStateLocalPerson
Full sample310522672160
Varying givers 1214391850107
Chose min 15912112214
Chose max 11261751787
Chose other 129102116
1 Omits consistent givers because their min/max/other charities are identical.

