Article

Favoritism and Fairness in Teams

Economics Experimental Lab, Nanjing Audit University, Nanjing 211815, China
*
Author to whom correspondence should be addressed.
Games 2018, 9(3), 65; https://doi.org/10.3390/g9030065
Submission received: 6 August 2018 / Revised: 1 September 2018 / Accepted: 4 September 2018 / Published: 6 September 2018
(This article belongs to the Special Issue Social Norms and Games)

Abstract

:
We experimentally study how people resolve a tension between favoritism and fairness when allocating a profit in a team production setting. Past research shows that people tend to favor their ingroup at the cost of an outgroup when allocating a given amount of money. However, when the money to be allocated depends on joint production, we find that most players allocate proportionally according to others’ relative contributions, irrespective of their social identity affiliations. We discuss the implications of our findings on how distributive norms could shape team cooperation.

1. Introduction

It is common to see people show goodwill to others who share their social identity, even when such identities are arbitrarily determined (e.g., Tajfel, 1971 [1]). For example, when participants are asked to allocate a given amount of money in a lab experiment, they tend to allocate more to their ingroup than outgroup members (Chen and Li, 2009) [2].1 Players’ desire to favor their ingroups may easily be justified when the money to be distributed is “manna from heaven”, and even be considered as a social norm (Harris et al., 2015 [7]). A challenge, however, occurs when the source of money depends jointly on each allocatee’s contribution. In this situation, a well-documented criterion for profit allocation is to respect each allocatee’s relative input (Adams, 1965 [8]; Selten, 1978 [9]). This liberal view of fairness is also regarded as a social norm in today’s meritocratic societies (Cappelen et al., 2007 [10]). The present study aims at understanding how people behave when the two motivations are in conflict in a team production setting, that is, whether to favor their ingroup at the cost of an outgroup or to allocate proportionally according to others’ relative inputs.
We adopt a three-person team production game first introduced in Dong et al. (2018 [11]). The game has two stages. The first stage is a production stage, where all three players voluntarily decide how much to contribute to a joint production. In the second stage, knowing each other’s contribution, each player is to allocate a fixed share of team profits between the other two group members, but not to himself. Then each player’s final payoff is determined by the money they did not contribute in the production stage and the money allocated to him by the other group members in the allocation stage. In this game, since players cannot allocate profits to themselves, the allocation stage is similar to the standalone allocation game studied in Chen and Li (2009) [2]. When participants are otherwise homogeneous and interact anonymously, Dong et al. (2018) [11] find in their experiment that more than 90 percent of them allocate proportionally to other team members’ relative contributions, and as a result, players contribute almost fully in the production stage.
To create social identities, we follow the the minimal group paradigm (Tajfel, 1971 [1]; Chen and Li, 2009 [2]). At the beginning of the experiment, all participants are divided into two arbitrary social identities. Groups are then formed randomly in each round, ensuring exactly two members from a same social identity group (ingroups) and the third member from the other social identity group (outgroup). This creates an opportunity for the two ingroups to favor each other at the cost of the outgroup in their allocation decisions. Consequently, the mistreated outgroup might be discouraged from contributing, thereby hindering team cooperation. The allocation stage thus provides us with an opportunity to understand how people resolve the tension between ingroup favoritism and fairness. Furthermore, we can use the production stage to assess the consequential team cooperation.
Our setting provides an apt analogy to many real-world situations. For example, nepotism in family owned businesses: employees’ compensation can be determined by their social ties to managers rather than their performance. Furthermore, it is not difficult to find situations where ingroups collude against outgroups in reward allocation: senior employees may discriminate against newcomers; and those who are from the same ethnic background may only act for the betterment of each other at the cost of other co-workers who are not from their social group. At national levels, natives may discriminate against immigrants and their descendants in collective events such as political campaigns and elections.
Our experimental results show that while some players favor their ingroups in allocation decisions, most players allocate proportionally at a similar frequency as in the control treatment absent of different social identities. Since most players adhere to the proportionality norm in allocation decisions, except for the first round, there is no significant difference in contribution between ingroups and outgroups.
Our study is most related to the experimental literature on social situations where allocation decisions are preceded by production stages. For example, in one of Konow’s (2000) [12] experiments, each participant is asked to divide some joint profit between a pair of other participants. Similarly, in Baranski (2016) [13], knowing each other’s contribution, group members propose ways for profit allocation and the final proposal is decided by a simple majority voting rule. There are also studies exploring plural fairness ideals, for example when the money to be distributed depends on each allocatee’s productivity (Cappelen et al., 2007 [10]) or their luck (Cappelen et al., 2013 [14]). To our best knowledge, we are the first to explore an allocating situation with heterogeneous social identities preceded by team production, which allows us to study simultaneously how players choose between two allocating norms and how their choices affect team cooperation.
At the heart of our study is the resolution of the conflicting norms between fairness and favoritism. Thus, our study links to the literature on social norms at large and in particular studies on norm enforcement in the presence of group affiliation. For example, in a third-party punishment game, Bernhard et al. (2006) [3] study how tribal people from Papua New Guinea enforce the egalitarian norm by punishing the norm violators. They find that people tend to punish norm violators more heavily if the victim comes from their own tribe as opposed to a different tribe. In another study, Goette, Huffman and Meier (2006) [15] find similar results in Swiss Army. Our study adds to this line of research and shows that the induced identities, however, are not strong enough to attenuate participants’ willingness to favor their ingroups in allocation, thus upholding team cooperation at highly efficient levels.2
Our paper is also related to the social psychology literature on ingroup bias and social status. Previous studies find that high-status individuals are more likely to favor their ingroups than low-status individuals (for a meta analysis see Bettencourt et al., 2001 [19]).3 But this effect also depends on whether or not the source of status is legitimate, that is, for example, when the status is due to luck rather than good performance or inner traits (e.g., Paetzel and Sausgruber, 2018 [21]). Two major differences distinguish our study from previous works. First, while we use the minimal group paradigm to create social identities, social status in previous studies is often created by grouping individuals according to their performance in an unrelated task. As a result, the created social status also involves a kind of entitlement. Furthermore, in our study, the performance additionally affects the pie to share. Thus, we focus on a strategically richer situation, and it allows us to examine how the resolution of the conflicting norms in allocation decisions could affect contribution decisions. We believe this is an important aspect of many economic and social situations such as organizations hiring employees of both genders and countries dealing with immigrants from various ethnic groups. The harmony and discord of these groups hinge on both resource redistribution and group cooperation, the two of which are highly intertwined.
In what follows, Section 2 outlines our experimental design, Section 3 presents the result, and Section 4 discusses implications and concludes.

2. Experimental Design and Hypotheses

We ran 12 computerized sessions programmed in z-Tree [22] at the Centre for Decision Research and Experimental Economics (CeDEx) in Nottingham. In total, 144 university students from various fields of study attended, with 12 participants in each session. All participants were recruited from the CeDEx subject pool using ORSEE [23].
Participants were randomly seated at a partitioned computer terminal upon arrival. The experimental instructions (see Appendix A) were provided to each participant in written form and were read aloud by the experimenter in each session. The experiment started when all participants provided right answers to quiz questions regarding the instructions. We used experiment currency units (ECUs) to represent money units during the experiment. After completing survey questions, participants were privately paid with every 25 ECUs worth £1 and they left the laboratory one at a time. A typical session lasted about 50 min with average earnings around £8.67 (equivalent to $13.44 or €12.14 at the time of the experiment).
The experiment has two treatments. The Base treatment is the Dong et al.’s (2018) [11] team production game: participants were randomly matched into three-player groups in each round and each participant made two decisions. The first decision is a contribution decision. Players were endowed with 10 ECUs at the beginning of each round. They had to decide how many ECUs to contribute to a group project; they kept the amount left.
The second decision is an allocation decision. After all players had made their contribution decisions, ECUs in the group project were summed up and multiplied by 1.8, i.e., Π = i = 1 3 e i . Players were informed of other group members’ contributions and the total value of the group project. Then they decided how to divide 1 3 Π between the other two group members. That is, each player i decided an allocation of a i j to player j and a i k to player k, with a i j + a i k = 1 3 Π . Please note that there were no restrictions on how players should divide this amount, but she had to divide between the others, without burning money or allocating anything to herself.
Player i’s share of the group project was determined by the allocation from the other two group members, that is, a player i’s earning in that round was π i = 10 - e i + a j i + a k i . At the end of each round, players were informed about the contributions and earnings of all group members. They were also reminded that they would never meet the same set of two other participants again in future rounds. This two-stage game with random matching was repeated for a total of 12 rounds.4
In the Identity treatment, before participants were introduced to the same game as in the Base treatment, we first primed them with social identities following the procedure of the minimal group paradigm, i.e., the classical Klee/Kandinsky painting preference task followed by a ten minutes group chat (e.g., Chen and Li, 2009 [2]; Tajfel et al., 1971 [1]). First, 12 participants in each session indicated their preferences over five pairs of paintings, each of which contained one painting by Paul Klee and one painting by Wassily Kandinsky.5 They were then assigned into two painting groups of six based on their preferences.6 Next, participants were shown two additional paintings and their task was to determine, within ten minutes, which artist (Klee or Kandinsky) painted each of these final two paintings.7 During the ten minutes, players in the same painting group were encouraged to chat via a z-Tree chat-box.8 For each correct answer, a participant earned 15 ECUs, though she was not told the correct answer until the end of the experiment. This procedure is reported to alter players’ distributive preferences to favor their ingroups against outgroups in allocation games (Chen and Li, 2009 [2]).
After the painting task, players faced 12 rounds of the game as in the Base treatment. In each round, three-person groups were formed randomly with two group members from the same painting group (ingroups) and the third group member from the other painting group (outgroup). Players were assigned at least once the role of ingroup and at least once the role of outgroup across rounds. They were also informed about their group composition (whether each of their group members came from their own painting group or the other painting group) before they proceeded to make their contribution and allocation decisions.
In both treatments, if all players allocate proportionally according to the other two group members’ relative inputs, then full contribution in the production stage will be the optimal decision. Indeed, Dong et al. (2018) [11] show theoretically that for a wide range of fairness notions, full contribution and proportional allocation are the unique Subgame Perfect Equilibirum, which is also supported in their lab experimental data.
In light of the previous evidence on the way that social identities affect norm enforcement (e.g., Bernhard et al., 2006 [3]; Goette et al., 2006 [15]), our primary hypothesis is regarding how players make allocation decisions when facing the conflicting norms between ingroup favoritism and fairness (proportionality). If favoritism prevails, compared to the allocation decisions in the Base treatment, players would allocate more than the proportional amount to their ingroups in the Identity treatment. If so, our secondary hypothesis is that the outgroup would contribute less than the ingroups, and the overall contribution would be lower in the Identity treatment than the Base treatment. The reason is simple: expecting less allocation from the two ingroups creates disincentive to the outgroup from contributing.

3. Results

3.1. Contribution Decisions

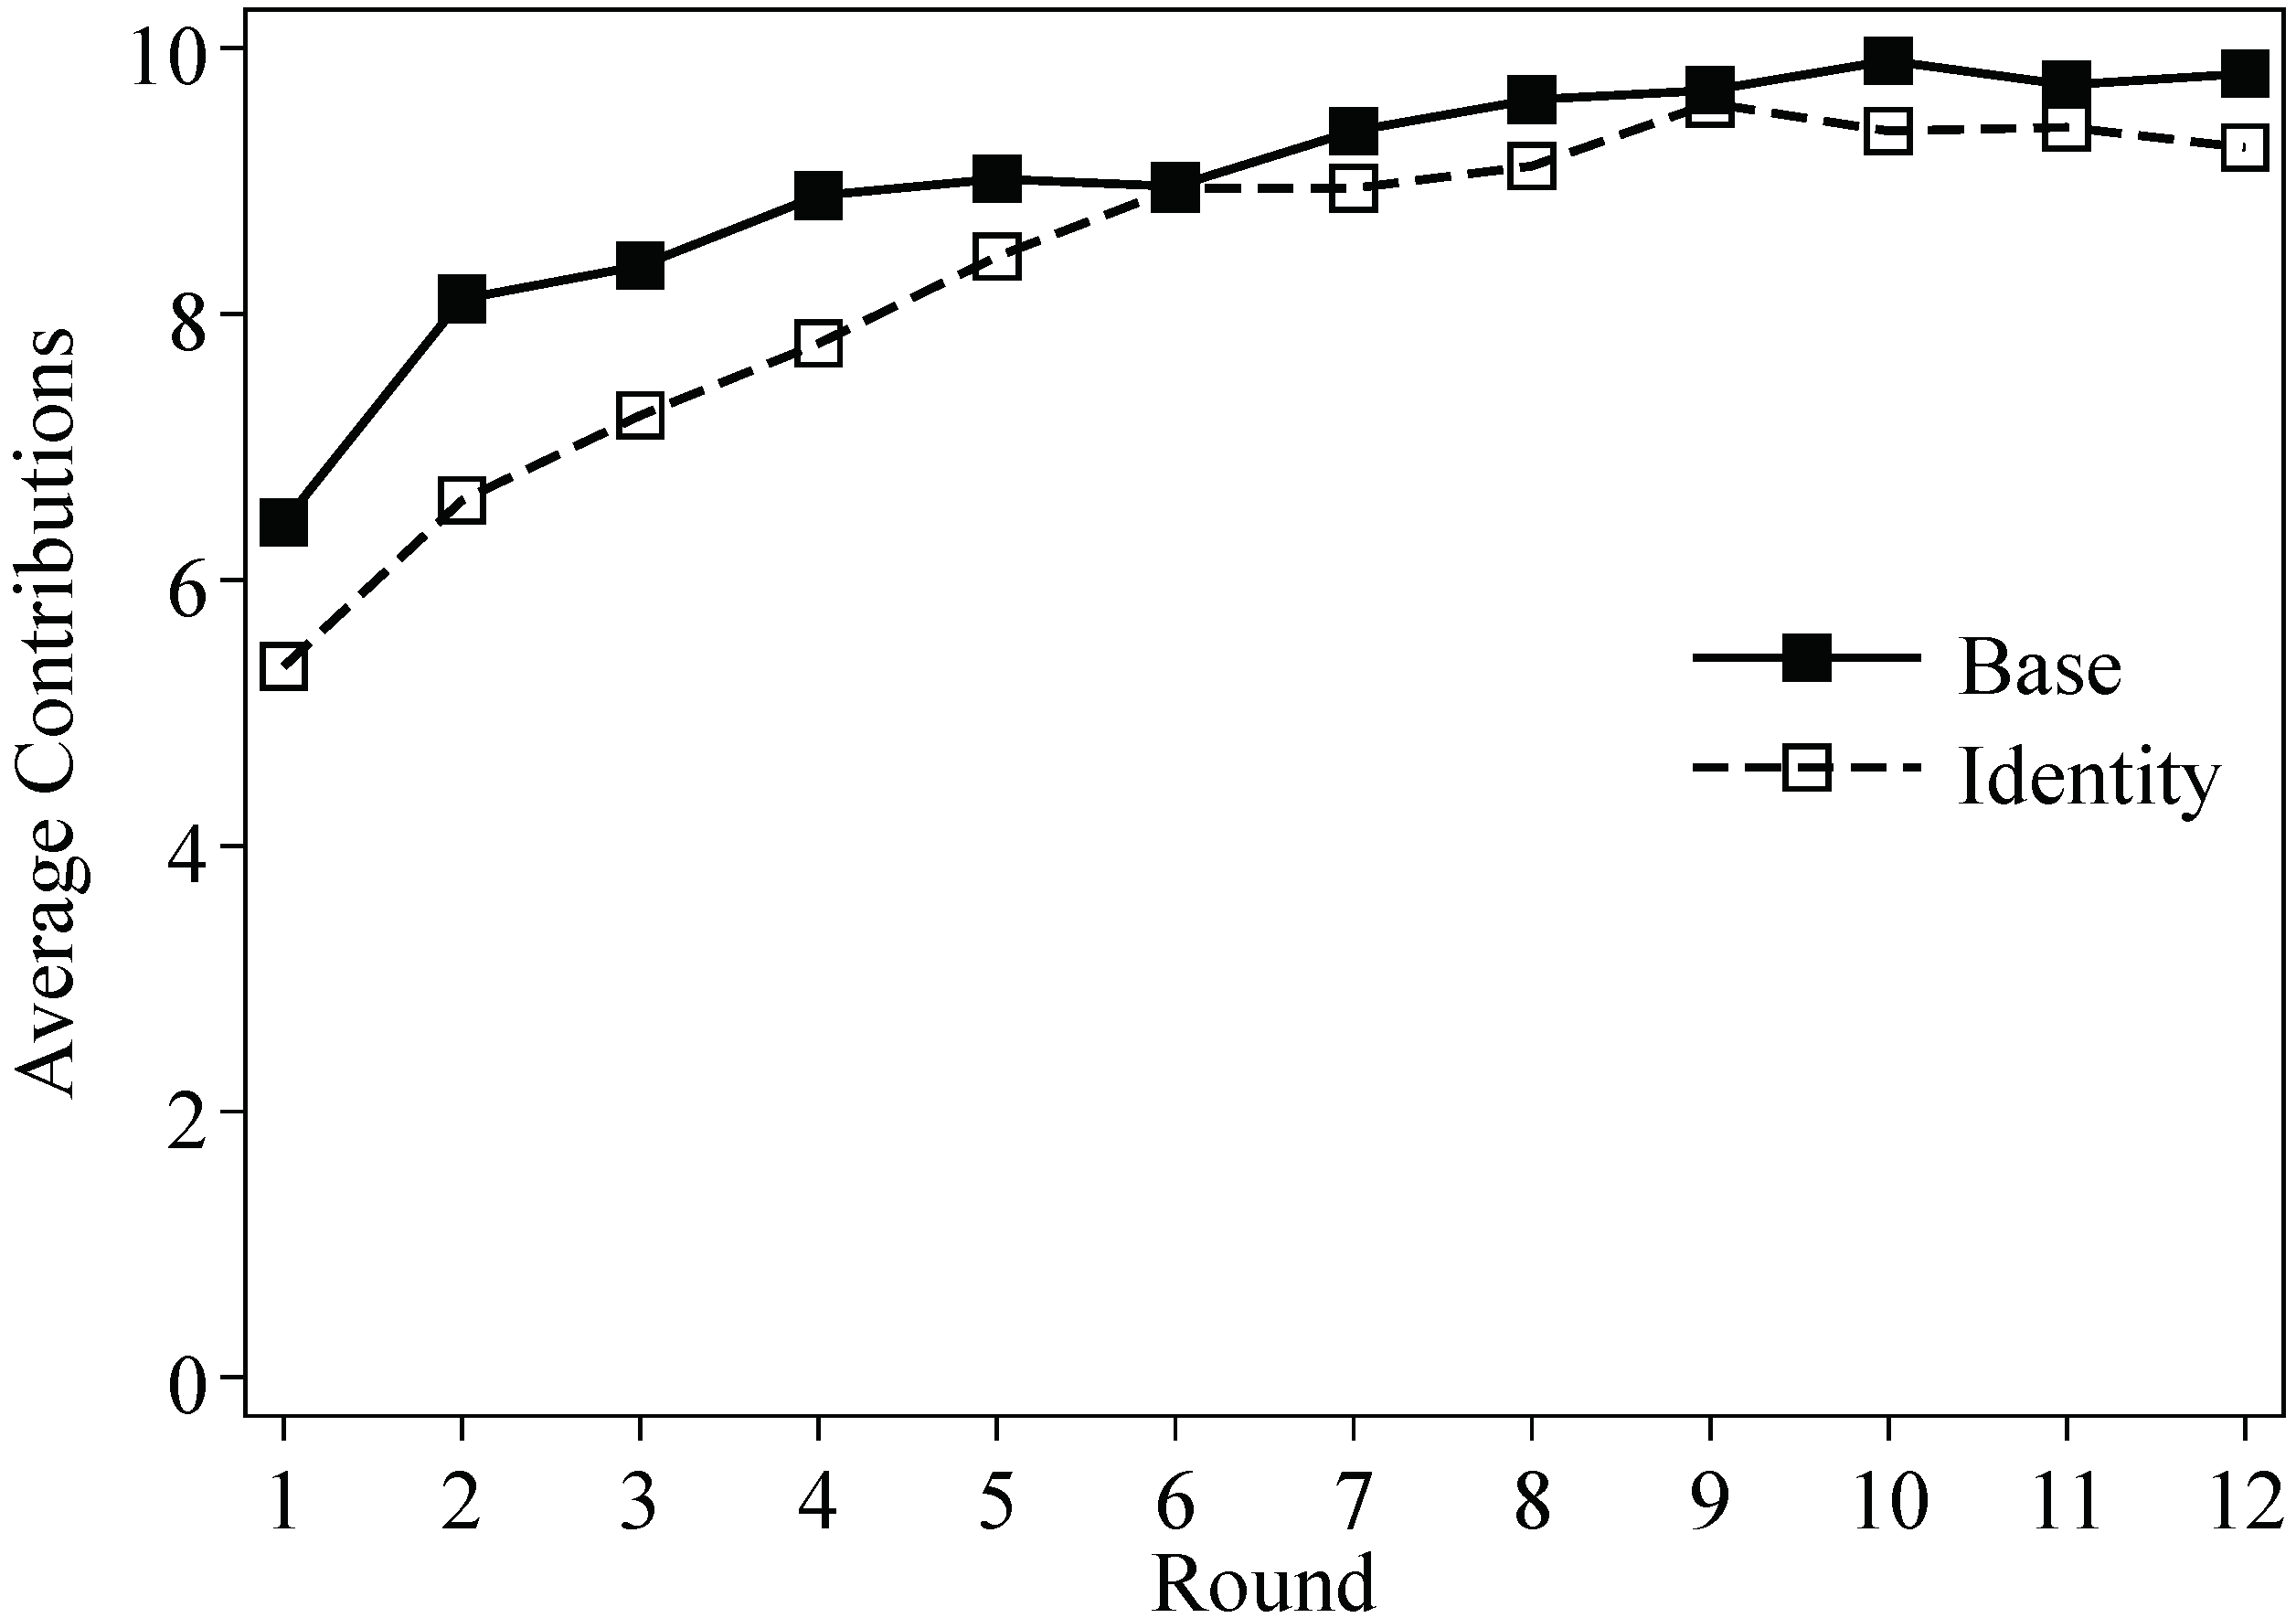
We first look at the contribution decisions of the two treatments (see Figure 1). In the Base treatment, the average contribution is 8.99, with a steady increase from an average of 6.43 in the first round (29.2 percent of players make full contribution) to 9.80 in the last round (94.4 percent of players make full contribution). These results successfully replicate Dong et al. (2018) [11].9
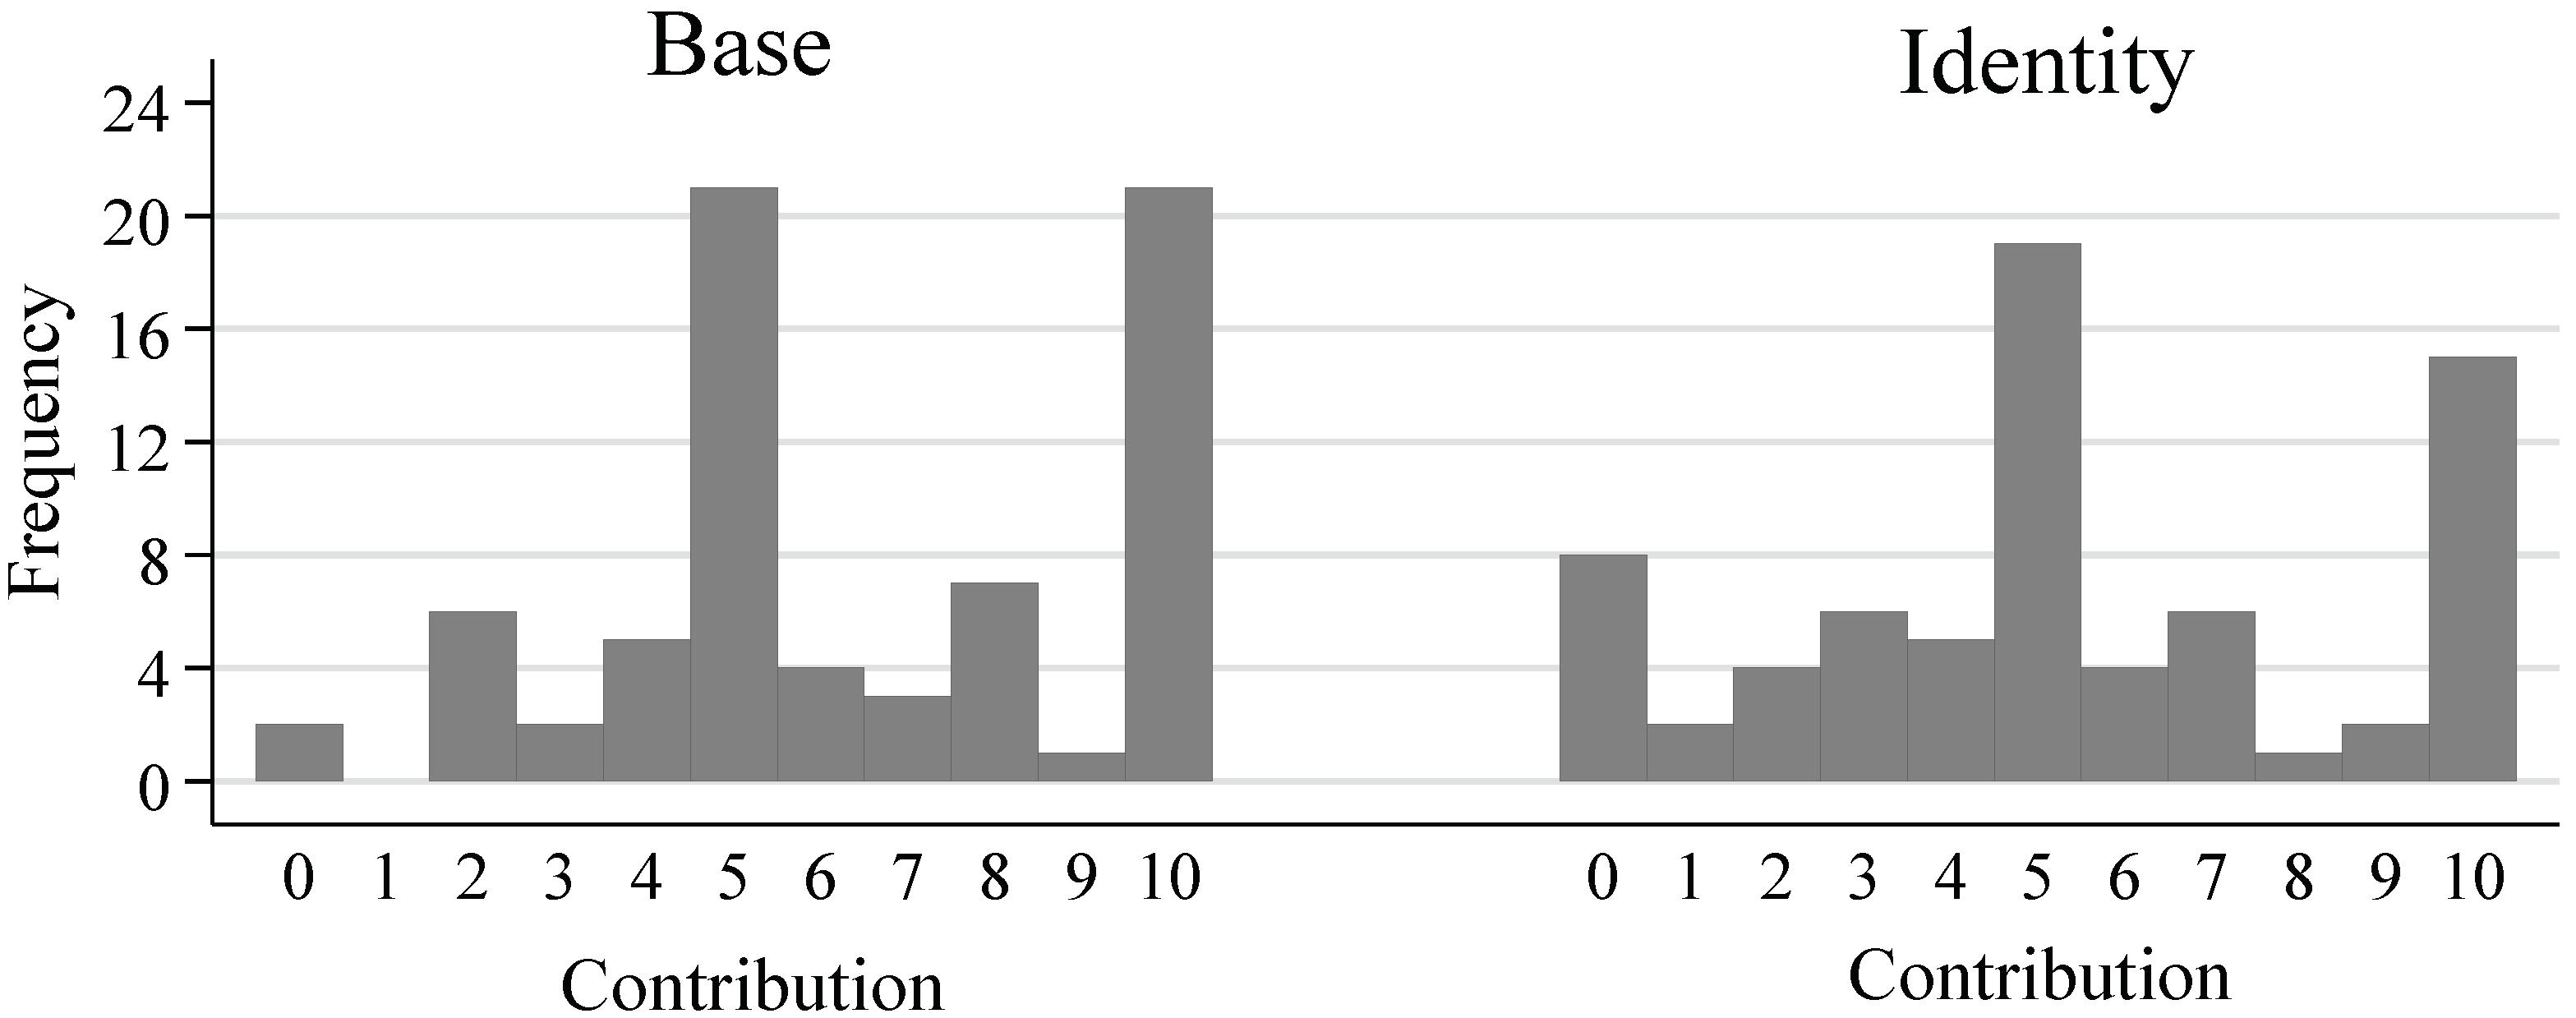
In the Identity treatment, the average contribution is 8.33, which is marginally lower than the Base treatment (mean difference = 0.67; ranksum test10, p = 0.08 ). For example, in the first round, we find that while only 15 out of 72 players contribute less than 5 in the Base treatment, 25 (out of 72) players contribute less than 5 in the Identity treatment (see Figure 2 for the distribution of contribution in round 1). However, the difference is only statistically significant in the first round (mean difference = 1.09; p = 0.04 ), and is negligible in later rounds (ps > 0.10 ).
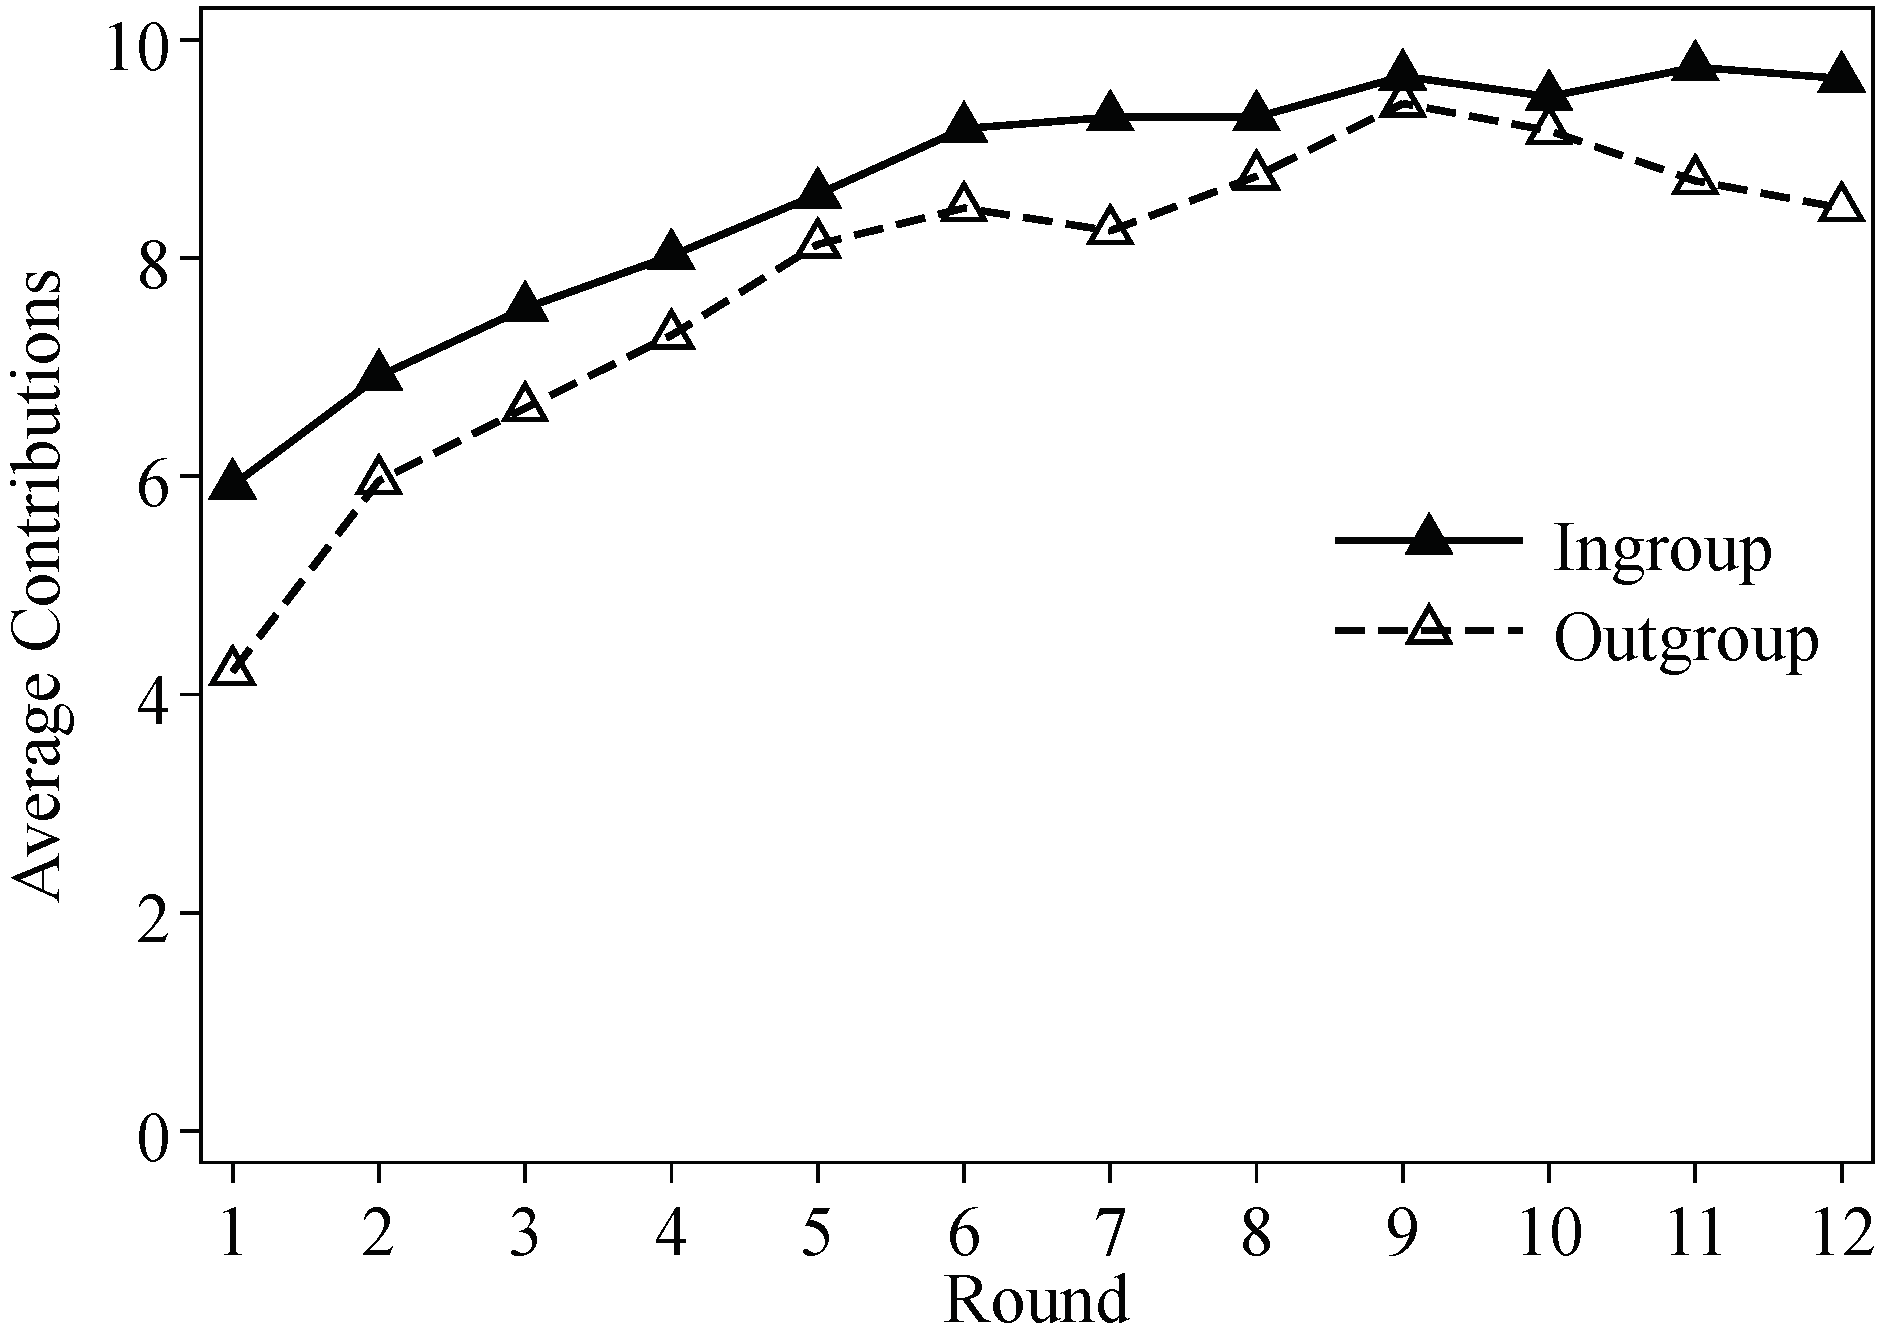
Figure 3 shows that in the Identity treatment, outgroups contribute less than ingroups (mean difference = 0.83, signed-rank test11, p = 0.05 ). In particular, outgroups contribute 1.71 less than ingroups in the first round ( p = 0.03 ), but the difference becomes smaller and not statistically significant in later rounds (ps > 0.10 ). We interpret this result as that outgroups anticipate exploitation (thus contribute less) in the first round, but with most ingroups acting fairly in allocation (see evidence below), they increase their contribution in later rounds.
Result 1.
The overall contribution level in theIdentitytreatment is marginally lower than theBasetreatment only in the first round and the treatment difference disappears in later rounds. In theIdentitytreatment, outgroups contribute significantly less than ingroups only in the first round, but the contribution gap disappears in later rounds.

3.2. Allocation Decisions

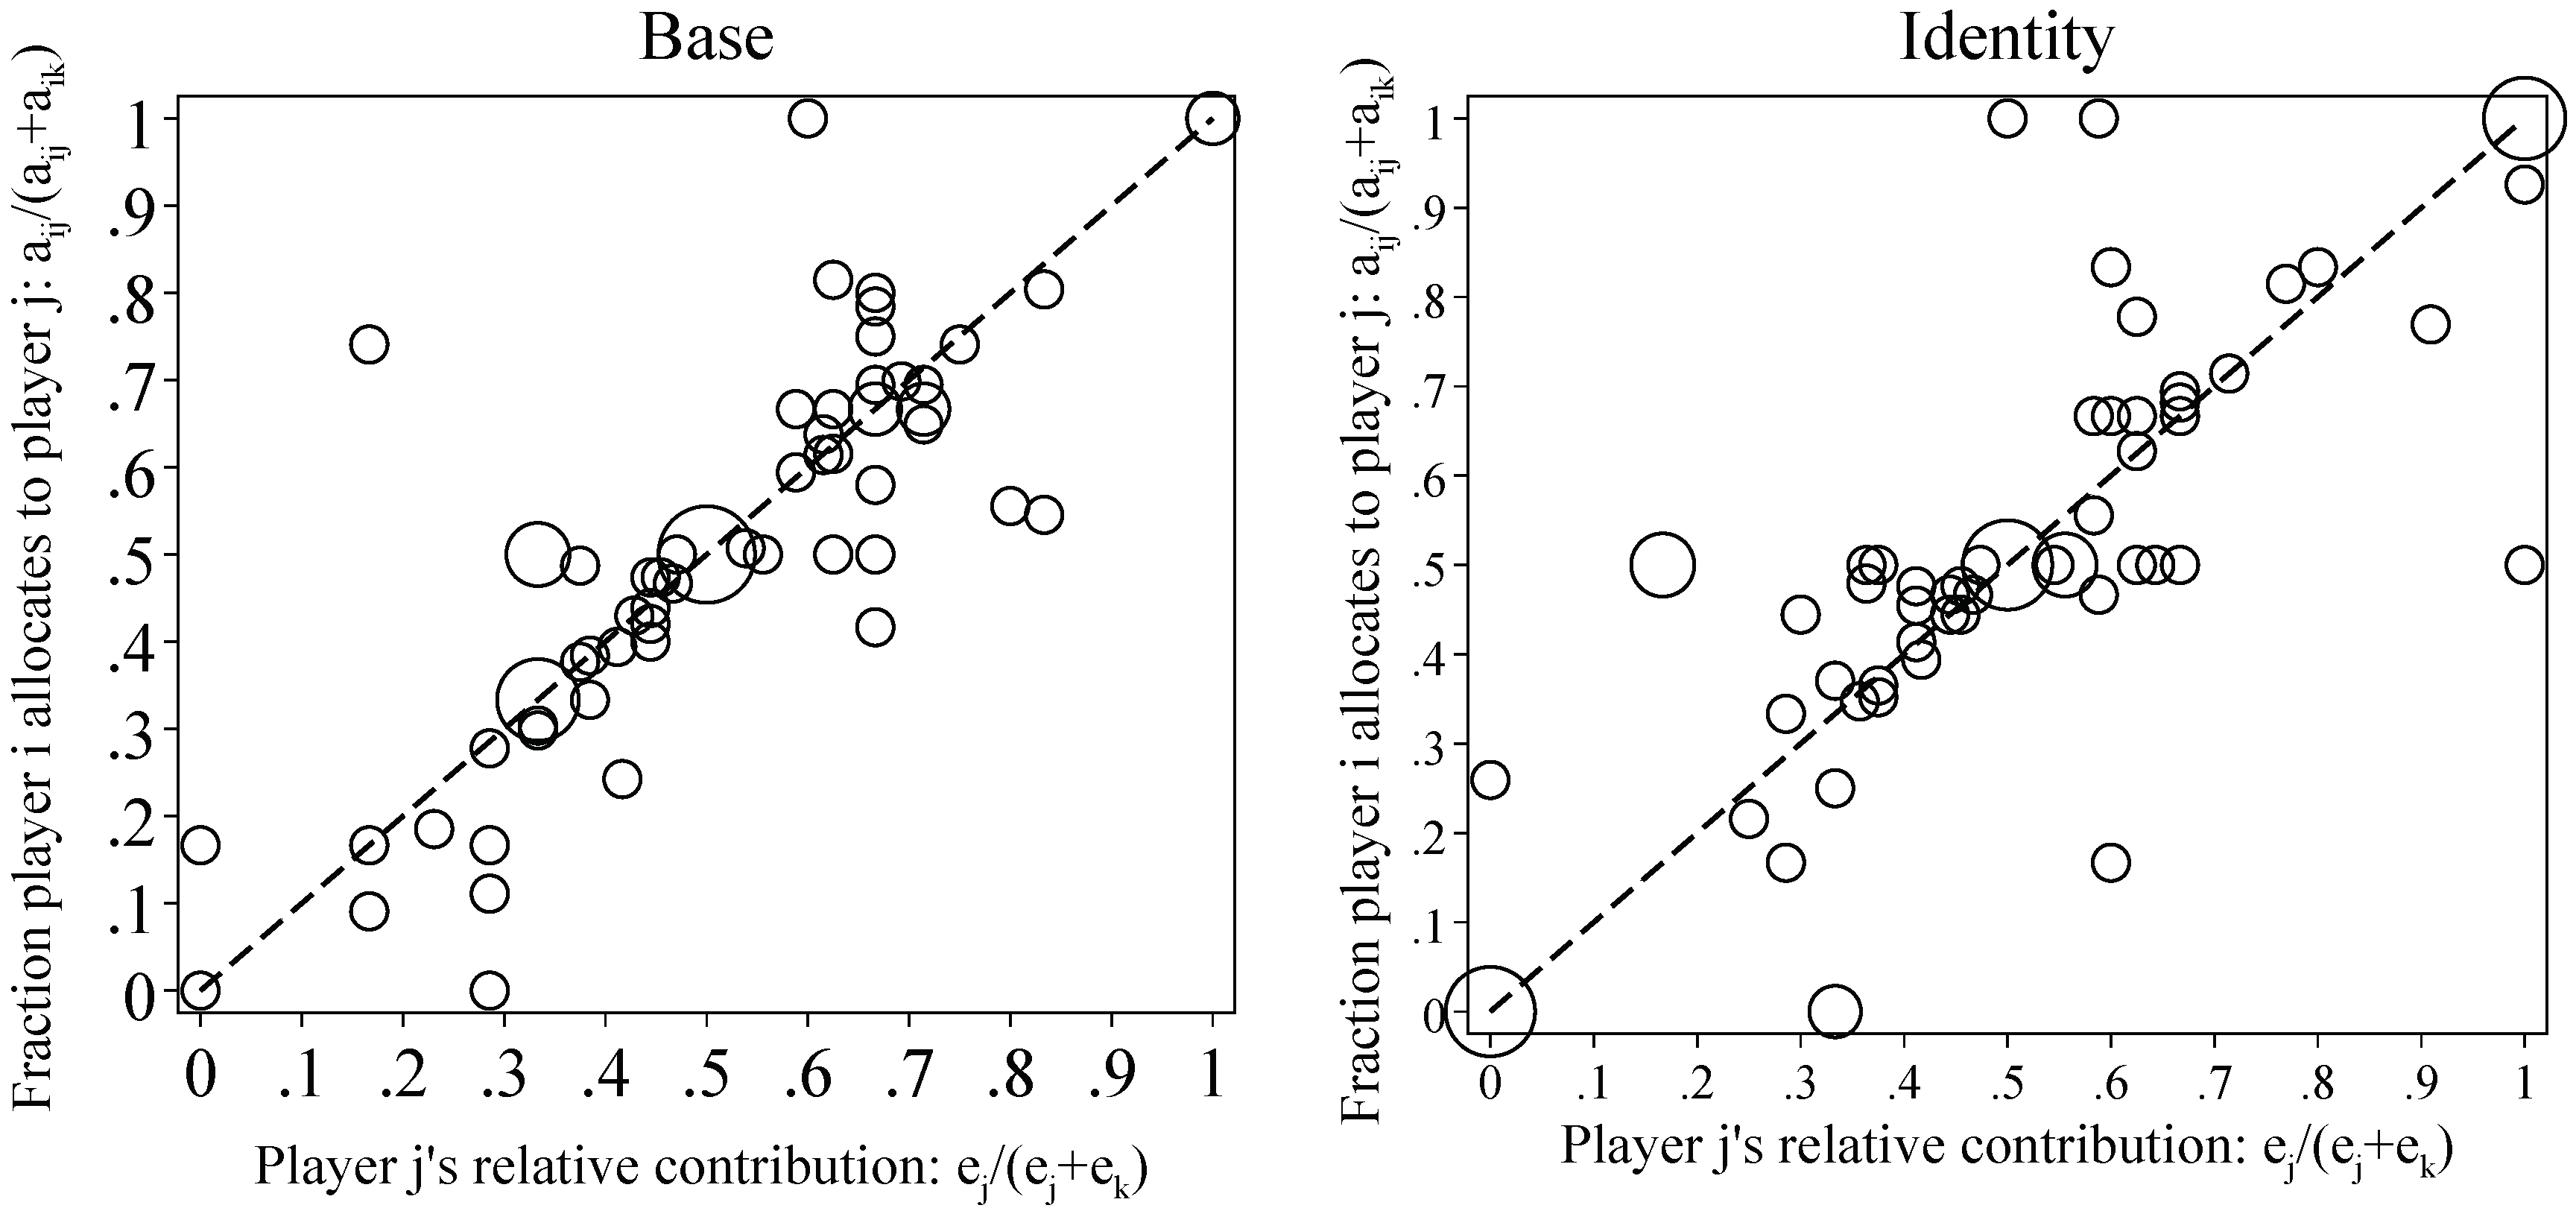
In this section, we turn to players’ allocation decisions. Players’ allocation decisions can be visually represented as in Figure 4. The horizontal axis indicates the fraction player j contributes relative to player k, and the vertical axis shows the actual fraction player i allocates to player j. The size of the circle indicates the relative frequency of allocation decisions. An observation that falls near the 45-degree line indicates a proportional allocation, since player i allocates according to player j’s relative contribution.12 An observation that falls on the vertical axis of 0.5 means that player i makes an egalitarian allocation. This figure shows no visible difference in allocation decisions between the two treatments and that most allocations are proportional and/or egalitarian.13
Table 1 summarizes players’ allocation decisions by round. In round 1, 46 out of 72 (63.9 percent) players in the Base treatment and 42 out of 72 (58.3 percent) in the Identity treatment allocate proportionally. Among these cases, most pairs of allocatees actually make unequal contributions (39 out of 46 in the Base and 36 out of 42 in the Identity treatment). In later rounds, since players increase their contributions, allocators are more likely to face situations where allocatees make equal (and full) contributions. There, almost all egalitarian allocations are made only when allocatees contribute equally, and these also happen to be proportional. We interpret these results as suggestive evidence for the prevalence of the proportionality norm in allocation decisions.
We next use a random effects regression model to study players’ allocation decisions. The dependent variable is the relative share of the group profit player i allocates to one of the other two group members j; for ingroups in the Identity treatment, it is the share player i allocates to her ingroup j.
a i j a i j + a i k = β 0 + β 1 e j e j + e k + β 2 Ingroup + β 3 e j e j + e k · Ingroup + ε i
In this specification, β 0 measures a fixed amount of share allocated to player j, and β 1 measures the proportional share based on player j’s contribution relative to player k’s. If player i is fair-minded and allocates according to player j’s contribution relative to player k’s, we have β 0 = 0 and β 1 = 1 . On the other hand, if player i tends to allocate more than the proportional amount to player j, we have β 0 > 0 and β 1 < 1 ; in the most extreme case, β 0 = 1 and β 1 = 0 , meaning that player i allocates everything to player j regardless of the j’s contribution relative to player k’s. We can use this pair of parameters to measure whether players use the proportional rule to allocate profits. We further add an dummy variable which equals 1 if player i and player j are the ingroups in the Identity treatment ( β 2 ), and an interaction term between player j’s relative contribution and whether she is an ingroup ( β 3 ). These two terms enable us to examine how ingroups’ allocation decisions in the Identity treatment differ from those in the Base treatment. In particular, we expect β 2 = 0 and β 3 = 0 if allocation decisions are similar between the two treatments. We thus include all players’ allocation decisions from the Base treatment and ingroups’ allocation decisions from the Identity treatment.
Table 2 shows the regression results for round 1 and all rounds respectively. In both regressions, β 0 and β 1 are not significantly different from 0 and 1 respectively, indicating that players in the Base treatment allocate using the proportional rule. For example, across all rounds, if player j increases her relative contribution by one unit, player i allocates 0.97 more units in his share of team profits to j. Importantly, the coefficients of the ingroup dummy ( β 2 ) and the interaction term ( β 3 ) are small and not significantly different from zero, indicating that the ingroups’ allocation strategies are not different from those of players in the Base treatment.14 In other words, we do not find evidence for ingroup favoritism in allocation decisions.15
Furthermore, among all the allocation decisions, 74.1 percent of the ingroups in the Identity treatment allocate according to others’ relative contributions, the fraction is 82.9 percent in the Base treatment (t-test, p = 0.15 ). In 18.1 percent of the decisions, ingroups allocate more than the proportional amount to their ingroups, and in 7.8 percent of the decisions, they even allocate less than the proportional amount to their ingroups.
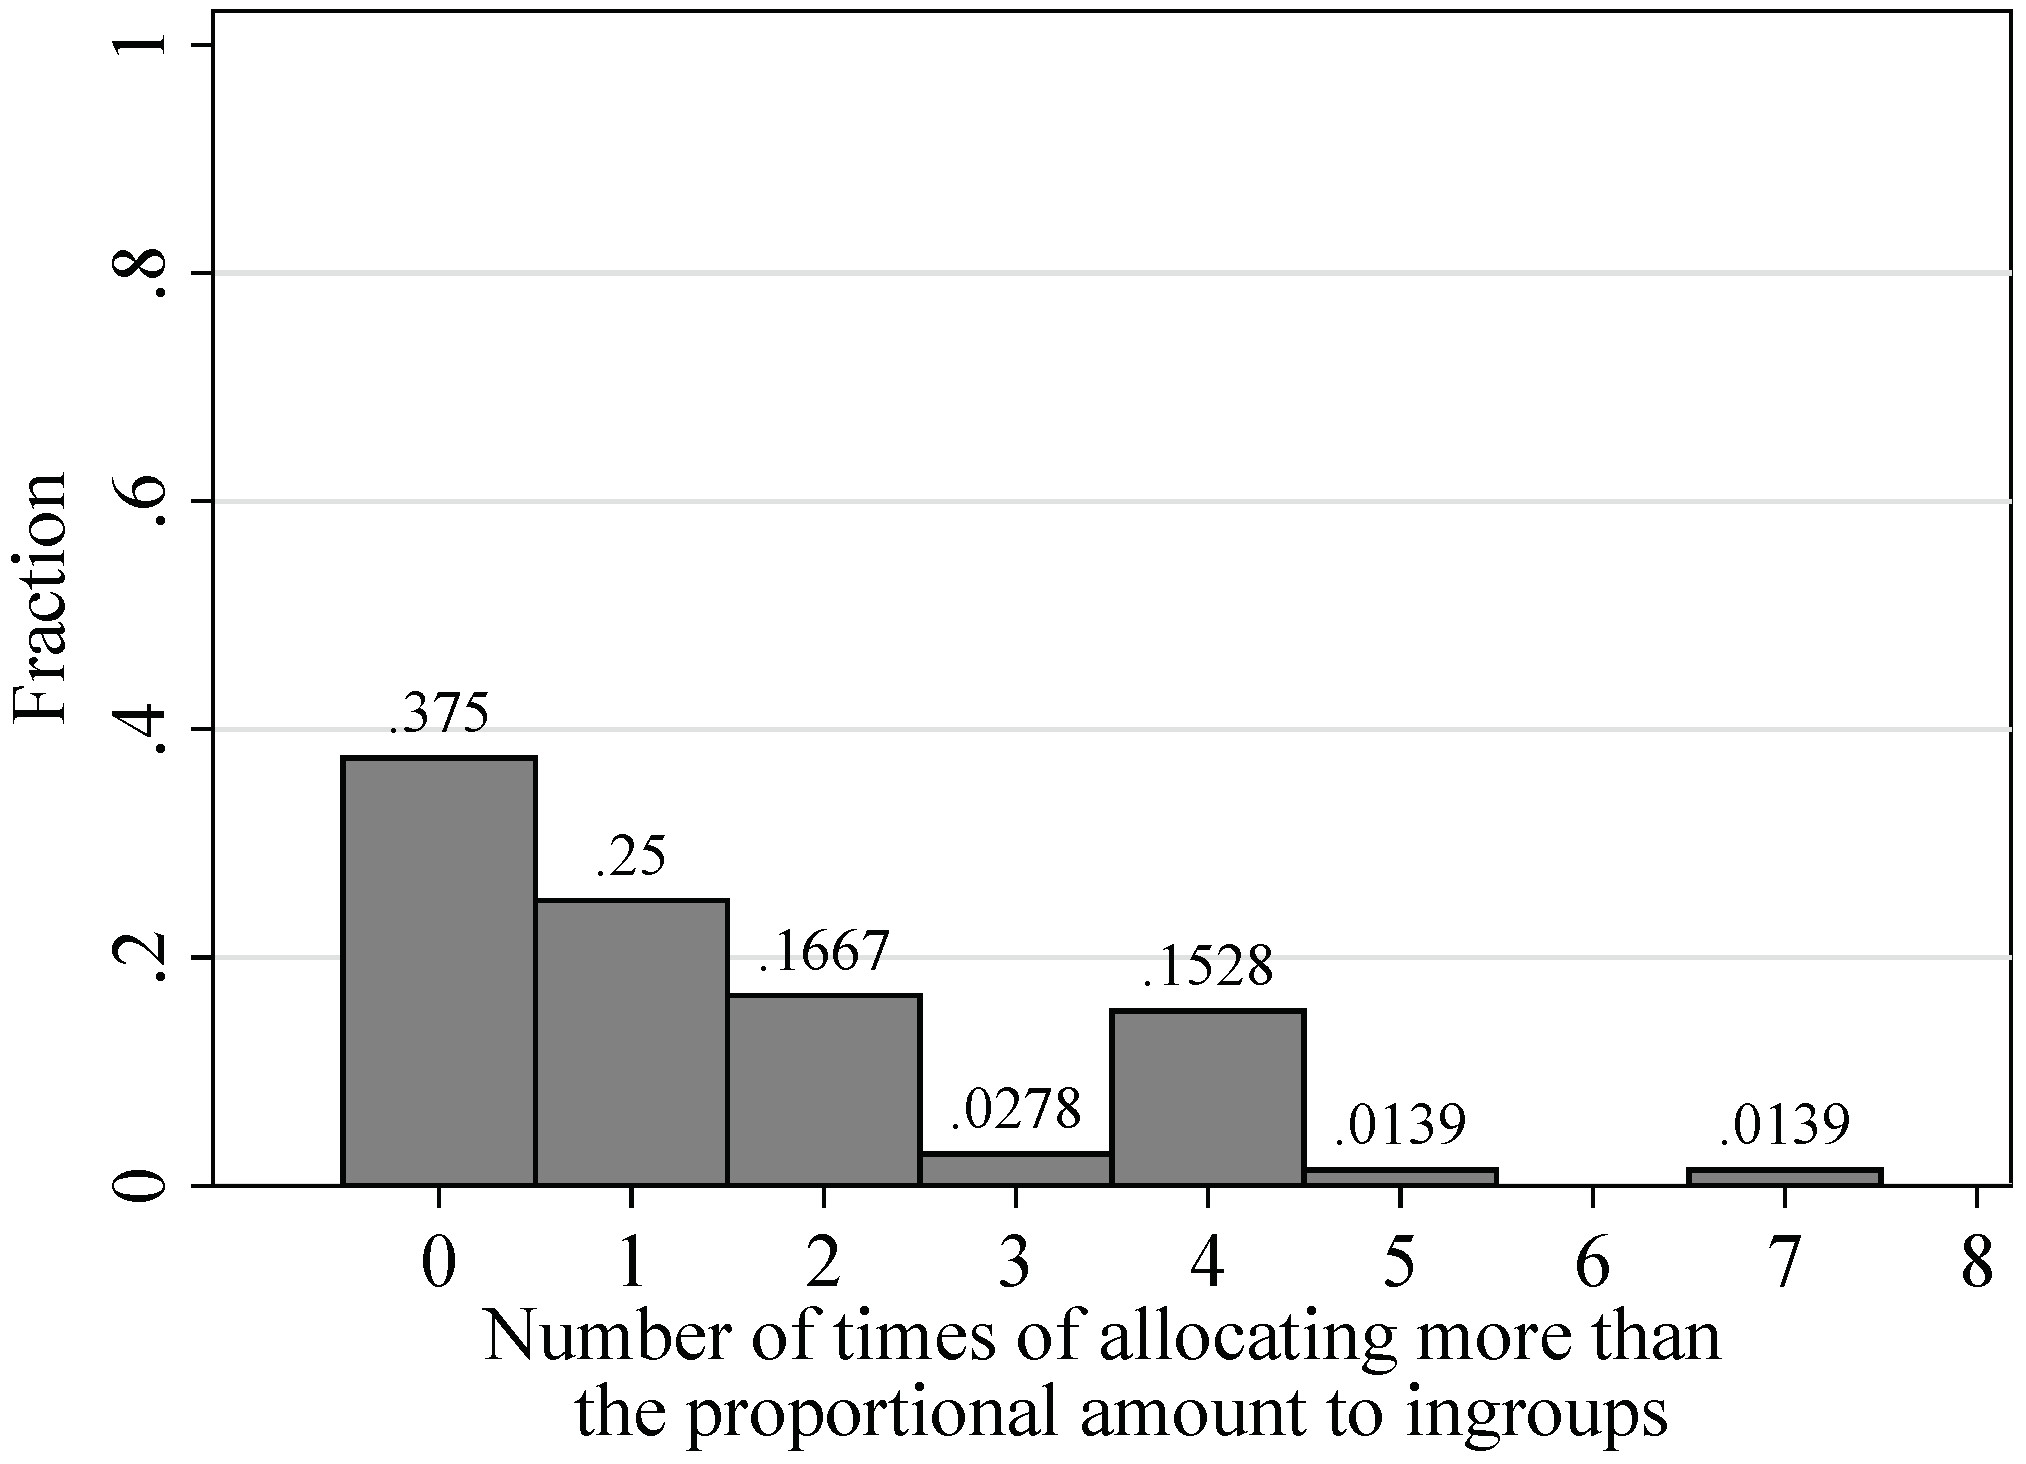
To see whether some individuals persistently allocate more than proportional amounts to their ingroups, Figure 5 shows the number of times of such incidence clustered by individual players. We find that 27 out of the 72 players (37.5 percent) never favor their ingroups throughout the 12-round interactions, 30 players (41.7 percent) do so once or twice, and only 1 player does so for more than 6 times.
Result 2.
While a few players allocate more than proportional amounts to their ingroups, most allocate proportionally at a similar frequency as in a situation absent of social identities.

4. Discussion

Our study aims to understand how people divide profits when facing a tension between ingroup favoritism and fairness in a team production setting. We conducted an experiment where we induced artificial social identities among participants before introducing a team production game in which allocation decisions are preceded by a production stage. We are primarily interested in whether players appeal to ingroup favoritism rather than the proportionality norm in their allocation decisions and whether this undermines the outgroup’s incentive to contribute to the team production.
Our experimental data show that most of our participants choose to enforce the proportionality norm regardless of other members’ group affiliations with themselves: while some players allocate more than the proportional amount to their ingroups, most allocate fairly according to others’ relative contributions. Because of the prevalence of fair allocations, except for the first round, there is no significant difference between the ingroups’ and outgroups’ contributions. The overall contribution to the team production is sustained at high levels with and without different social identities among team members.
Despite these findings, we do not suggest that the proportionality norm will always prevail over ingroup favoritism in allocation decisions. Social identities induced in the laboratory, though reported to cause divergent treatments toward ingroups and outgroups in other settings, might be too weak to foster ingroup favoritism in our team production setting. A real-world identity, like ethnical or national, might lead to stronger ingroup favoritism. For example, when students and teachers share the same nationality, students tend to give teachers higher evaluation scores (Rivkin et al., 2005) [24] and teachers tend to give students higher grades (Feld et al., 2016) [25]. Interestingly, in line with our study, recent large-scale surveys on the opinion for wealth redistribution with immigrants show that respondents’ support for redistribution increases when provided with information on the “hard work” of immigrants, but not when provided with information on the number or origin of immigrants (Alesina et al., 2018 [26]). This seems to suggest that natives’ outgroup discrimination (the flip side of ingroup favoritism) is mitigated by immigrants’ earned entitlement through effort, consistent with the meritocratic view of fairness. This effect, however, tends to subdue when respondents are prompted to think in detail about immigrants’ other characteristics such as less perceived education, lower income and being religiously and culturally more distant than themselves. Furthermore, Naumann and Stoetzer (2018) [27] show that those with higher incomes (thus presumably with stronger political power) are more likely to withdraw support for redistribution when faced with immigration. As a result, these ingroup/outgroup preferences toward immigrants, when played out by wealthy politicians, can potentially lead to ever greater social injustice.
Another feature of our design might also be responsible for our results: the role of players is alternated between ingroup and outgroup across rounds. This might help the ingroups to think in the shoes of the outgroups and empathize with the outgroups, thus refraining themselves from mistreating the outgroups. In future works, it could be interesting to see whether fixing a player’s role would change the allocation behavior. Yet another reason we find little evidence of ingroup favoritism could be that in our framework the allocators are members of their own team and their payoff depends on other members’ contribution and allocation decisions. Such a cooperation situation might create a sense of team identity, which might overwhelm the induced social identities from the painting tasks. Thus, future works might want to let the allocator be an impartial third party whose payoff does not depend on the allocatees’ decisions.
Beyond what can be learned from the allocation behavior, it is also important to consider its consequential social impact. Our team production setting provides a framework to study how unfair allocation behavior may undermine team cooperation. In modern organizations with the increasingly diverse team composition, it is of primal importance to understand how to consolidate different views on distributive justice, suppress nepotism, and promote cooperation. At a societal level, different social groups may distort the distributive justice to the advantage of their ingroups at the cost of outgroups. This may not only come with direct social wastes in various means to achieve ingroup favoritism such as cronyism and bribery, but also hinder social cooperation at larger scales where everyone gains in the long run. While the evidence from the present study suggests that our lab participants seem to have overcome the temptation to favor ingroups, much is left to learn about other situations where resistance to such temptation might be more challenging.

Author Contributions

Conception, L.D.; Software and data collection, L.D.; Data analysis, L.D.; Drafting the article, L.D.; Critical revision of the article, L.D. and L.H.

Funding

This research was funded by the University of Nottingham (CeDEx) and National Natural Science Foundation of China, Grant No. 71873068.

Conflicts of Interest

The authors declare no conflict of interest. The founding sponsors had no role in the design of the study; in the collection, analyses, or interpretation of data; in the writing of the manuscript, and in the decision to publish the results.

Appendix A. Experiment Instructions

We present the experimental instructions for the Identity treatment (Part 1 is the painting task and part 2 is the team production game). Part 2 is distributed only after the completion of part 1 decisions. Samples of screenshots are also included. Instructions for the Base treatments eliminates part 1 and the mention of painting groups. The accompanied quiz questions and z-Tree program are available upon request.

Appendix A.1. Part 1

Welcome! You are taking part in a decision-making experiment. The amount of money you earn will depend upon the decisions you make and on the decisions other people make. Your earnings in this experiment are expressed in experimental currency units, which we will refer to as ECUs. This experiment has 2 parts and your total earnings will be the sum of your payoffs in each part. At the end of the experiment you will be paid in cash using a conversion rate of £1 for every 25 ECUs of earnings from the experiment. Everyone will be paid in private and you are under no obligation to tell others how much you earn. Please do not communicate with each other during the experiment. If you have a question, feel free to raise your hand, and an experimenter will come to help you. In Part 1 everyone will be shown 5 pairs of paintings by two artists (on the screen and on the prints). You will be asked to choose which painting in each pair you prefer. You will then be classified into groups of six people, based on your choice relative to other people’s choice in this room. Then you will be asked to answer questions on two other paintings. Each correct answer will bring you 15 ECUs. The earnings will be shown at the end of this experiment.
An built-in chatting program will be available to you to get help from or help other members in your own group while answering the questions. All group members will be randomly assigned a group ID that will be only used in this chatting-box. Except for the following restrictions, you can type whatever you want in the lower box of the chat program. Messages will be shared only among all the members of your own group. You will not be able to see the messages exchanged among other groups. People in other groups will not be able to see the messages from your own group either. You will be given 10 minutes to communicate with your group members. Restrictions on messages: (1) Please do not identify yourself or send any information that could be used to identify you (e.g., age, race, professional background, etc.); (2) Please refrain from using obscene or offensive language. After Part 1 has finished, we will give you instructions for part 2 of the experiment.

Appendix A.2. Part 2

Part 2 consists of 12 decision rounds. In each round, you will be in a group with two other people. You will not be able to identify which of the other people in this room are in your group, but you will know which painting groups they came from while you are making the decisions. The people in your group will change from round to round, and in particular you will never be matched with the same set of two other participants twice for the rest of the experiment. At the beginning of each round, you will be randomly allocated a participant identification letter, either A, B, or C (Thus, your identification letter may change from round to round). Each decision round has three phases.
Phase 1: Decision Choice Each individual begins each round with an endowment of 10 tokens in their Individual Fund. Tokens in Individual Fund are worth 1 ECU each. Each three-person group begins with a Group Fund of 0 ECUs each round. You decide independently and privately whether or not to contribute any of your tokens from your Individual Fund into the Group Fund. Tokens in Group Fund are worth 1.8 ECU each. In other words, each token that a person adds to the Group Fund reduces the value of his/her Individual Fund by 1 ECU. Each token added to the Group Fund by a group member increases the value of the Group Fund by 1.8 ECUs. Each person can contribute up to a maximum of 10 tokens to the Group Fund. Decisions must be made in whole tokens. That is, each person can add 0, 1, 2, 3, 4, 5, 6, 7, 8, 9, 10 tokens to the Group Fund. Please note that when you are making the contribution decision, you will know your group composition.
Phase 3: Allocation Choice You then decide how to allocate one-third of the ECUs in the Group Fund between the other two group members. The sum of your allocation between the other two group members will be one-third of ECUs in the Group Fund. In other words, each person can only divide one-third of ECUs in the Group Fund for the other two group members, and their own share of the Group Fund will be determined by the allocation decisions of the other two group members. Specifically, (1) Person A will divide one-third of ECUs in the Group Fund between Person B and Person C. (2) Person B will divide one-third of ECUs in the Group Fund between Person A and Person C. (3) Person C will divide one-third of ECUs in the Group Fund between Person A and Person B. The other two group members’ individual contributions to the group fund and their painting groups will be shown on the upper right table when you are making allocation choices.Click the calculator button on the lower-right corner if you need assistance with calculation.
Feedback and Earnings After all individuals have made their decisions for the round, the computer will tabulate the results. A person’s share of the Group Fund will be determined at the end of phase 3. His/her earnings from Group Fund will be the sum of ECUs that the other two group members allocate towards him/her. Your earnings in a round will equal ECUs in your Individual Fund plus ECUs the other two group members allocated to you (i.e., your share of ECUs in the Group Fund). At the end of each round, you will receive information on your Group Fund earnings and your total earnings for that round. You will be informed of all group members’ allocation decisions in phase 3. You will also see all group members’ contribution to the group fund and their painting groups if you chose “Yes” in phase 2; if you chose “No” in phase 2, other group members’ individual contributions to the group fund remain unknown to you. Total Earnings for the experiment will be the sum of the earnings in all rounds in part 2 plus your earnings from part 1. This completes the instructions. Before we begin the experiment, to make sure that every participant understands the instructions, please answer several review questions on your screen.

Appendix A.3. Screenshots

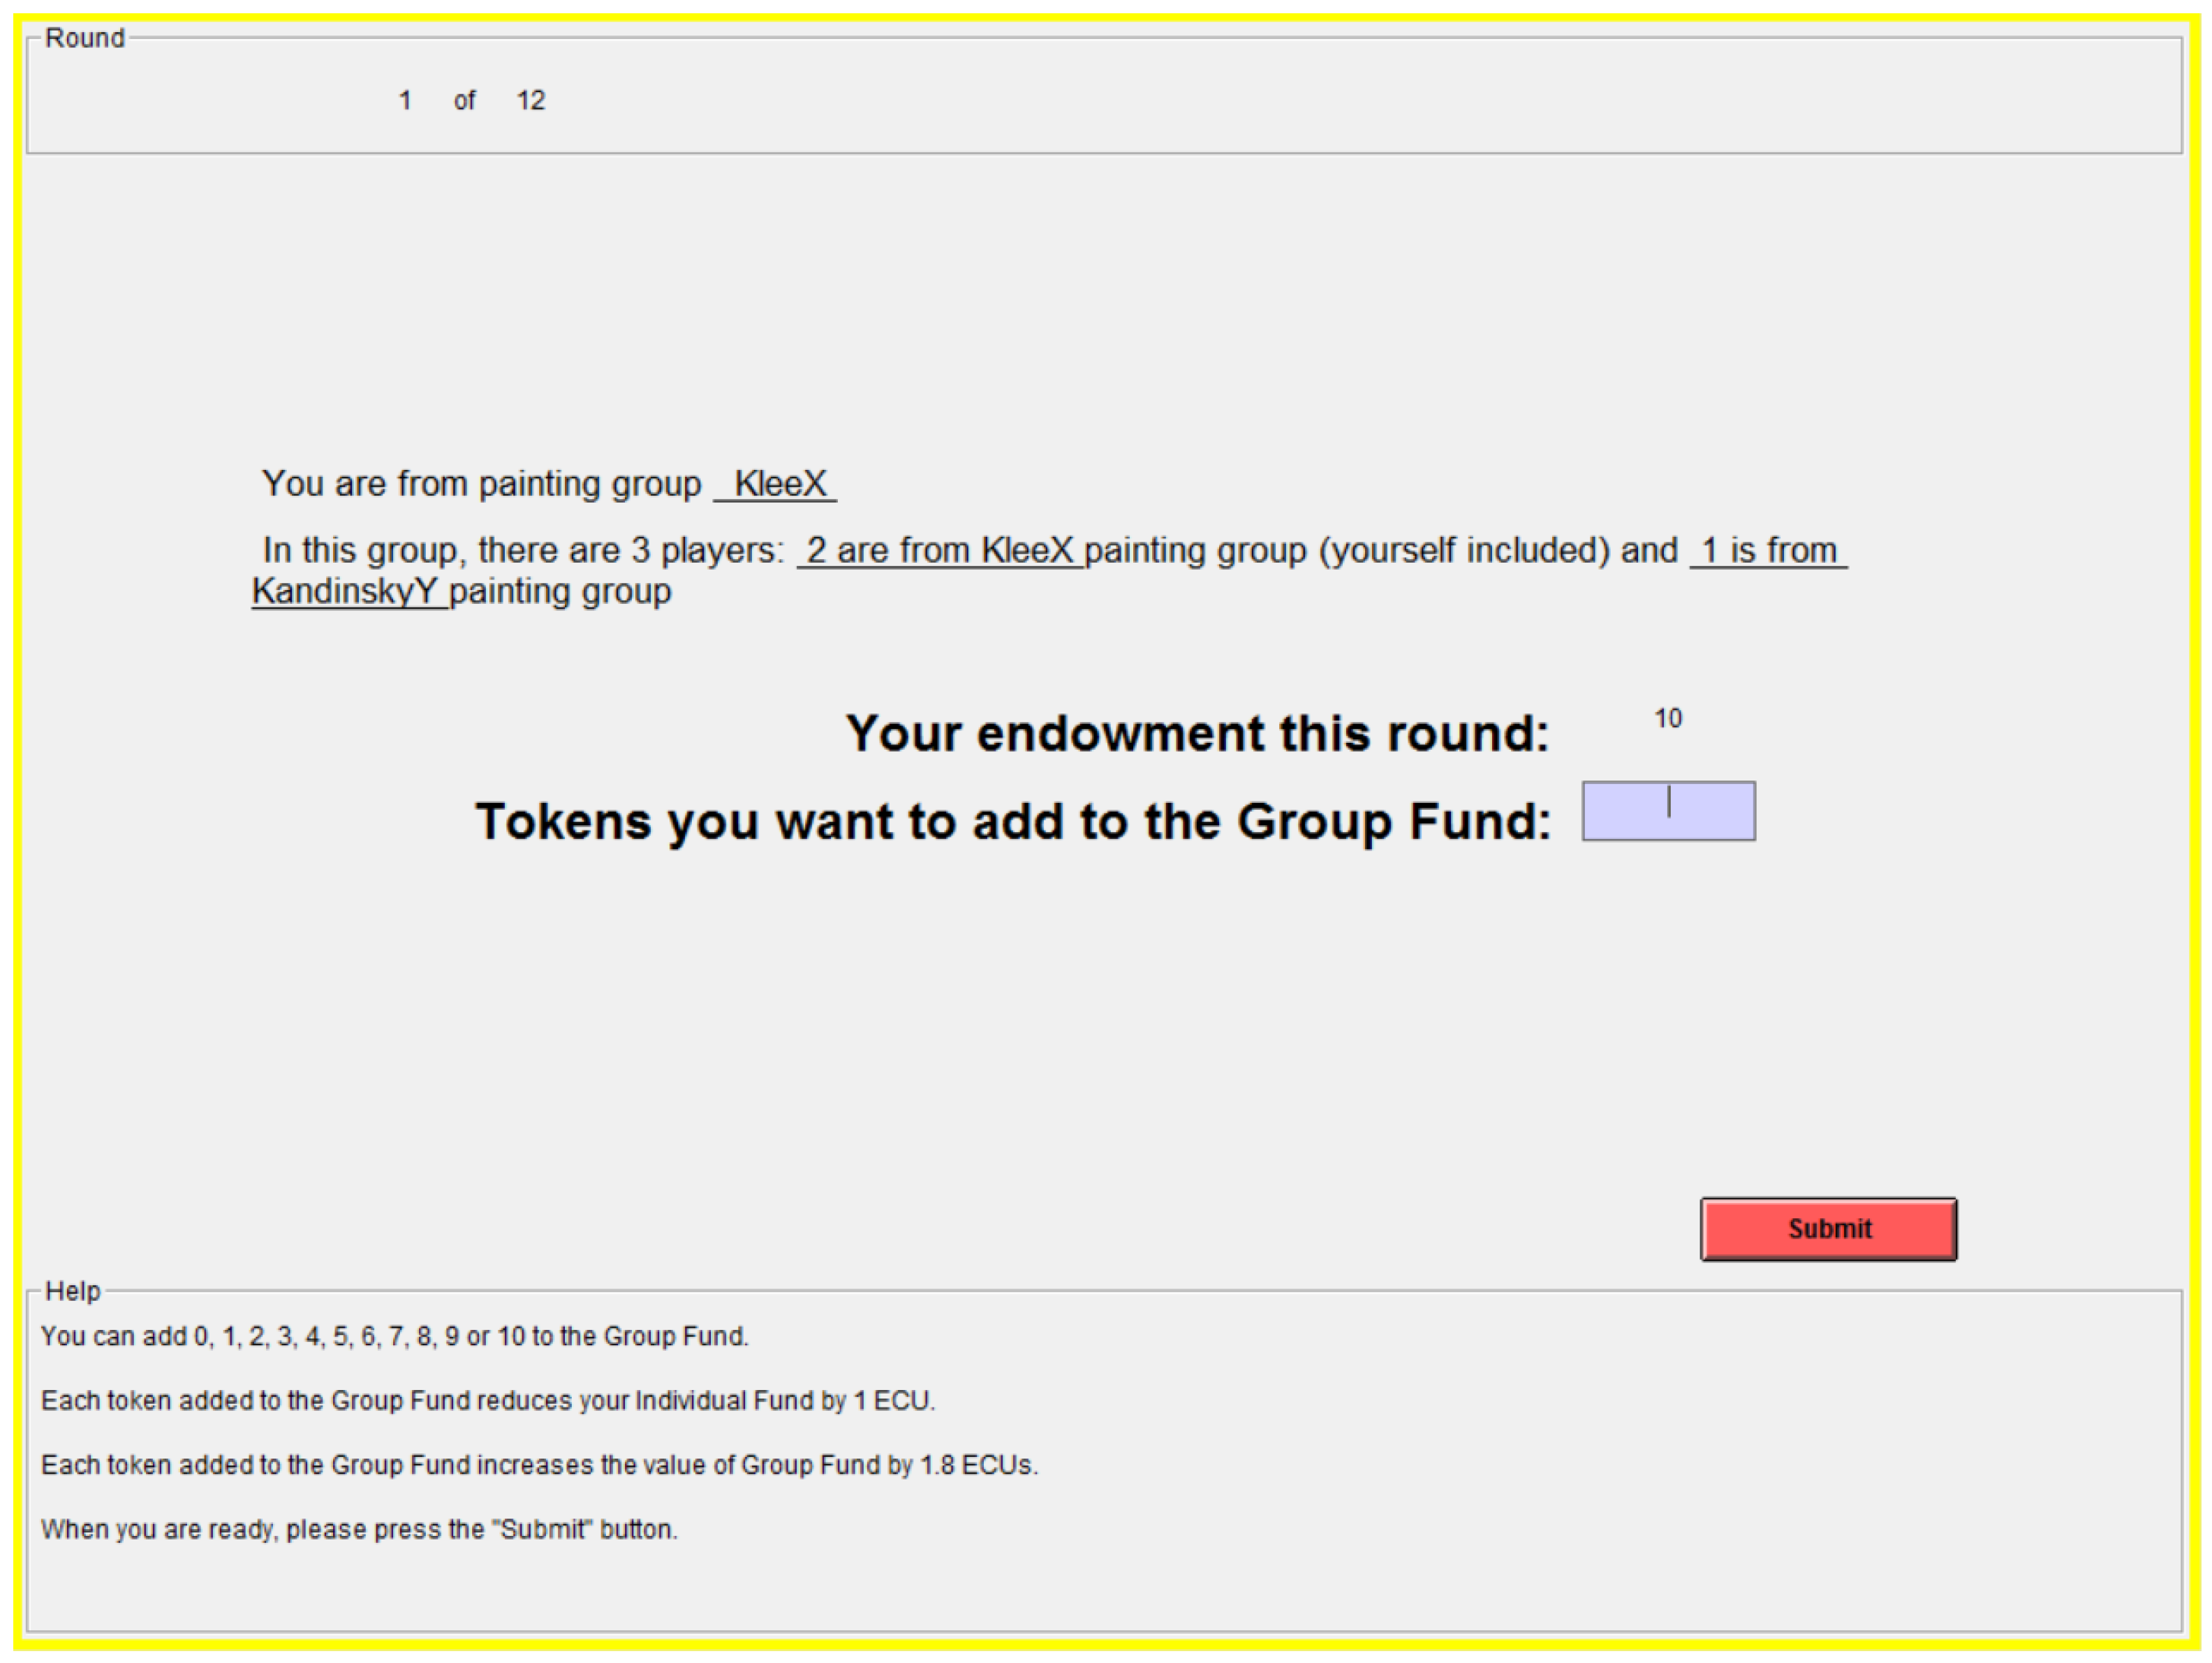
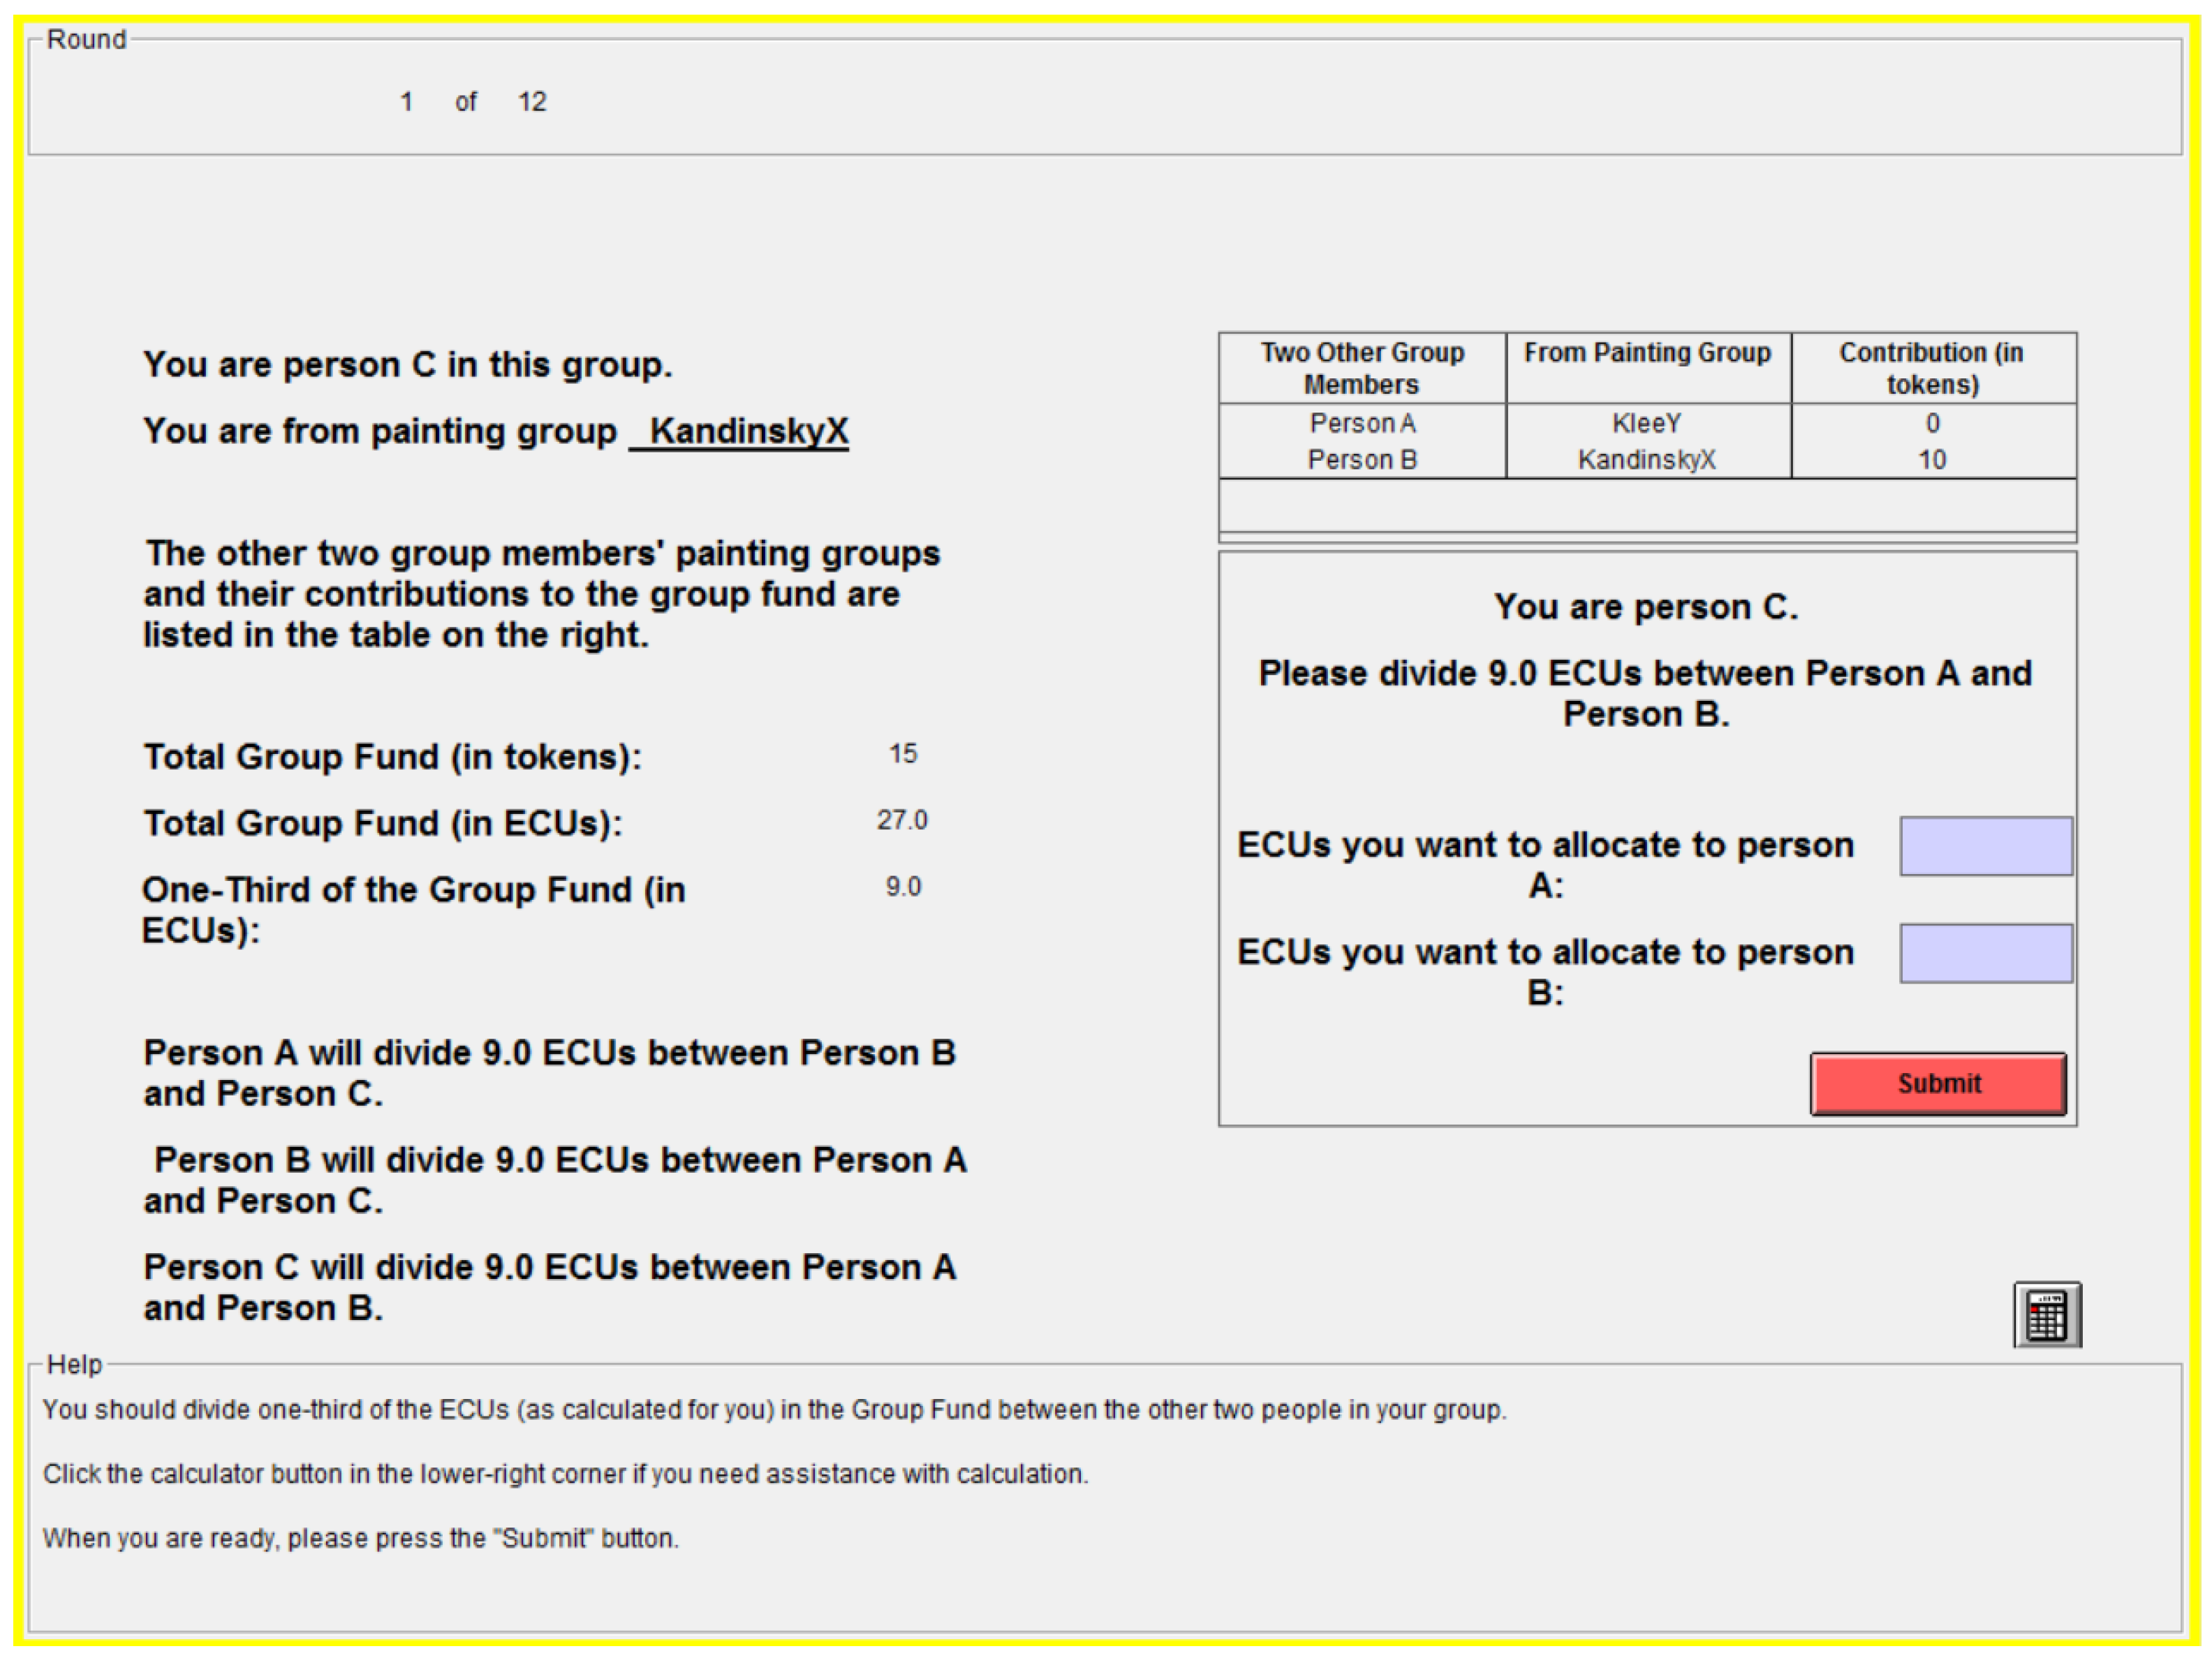
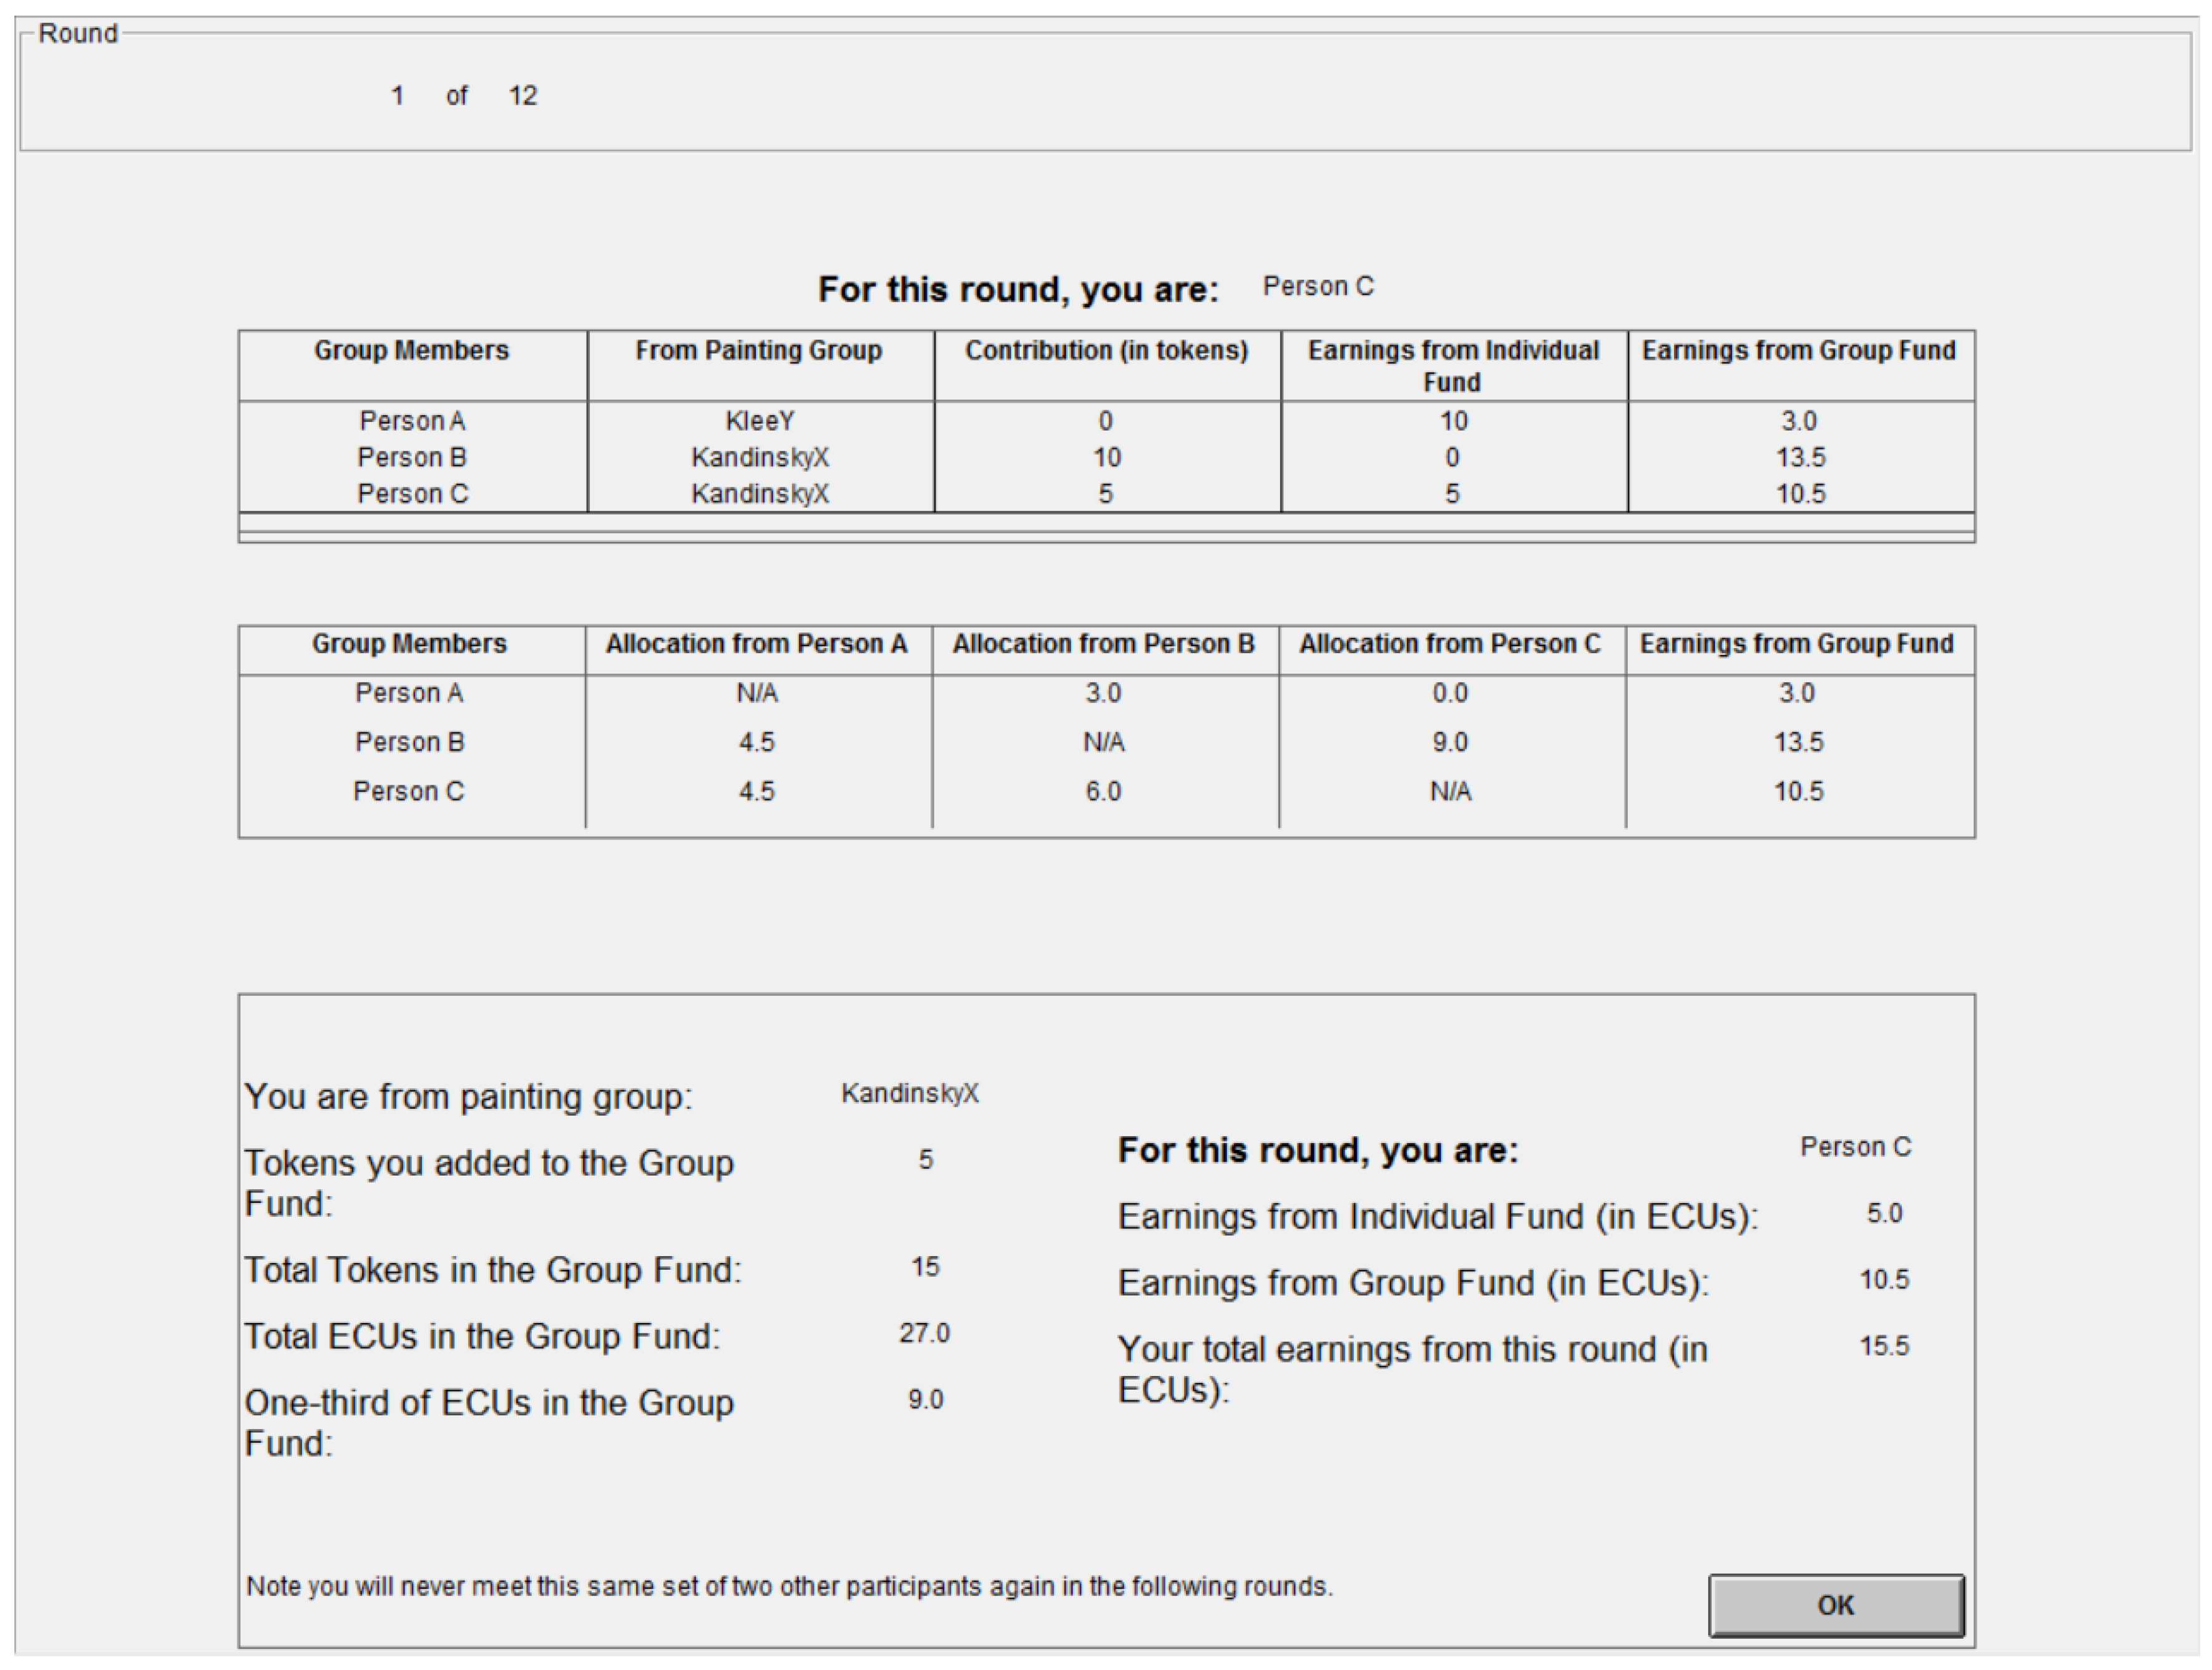
After reading the part 2 of the instructions, the subjects had to solve eight quiz questions on the screen. The questions included hypothetical combinations of group members’ contribution and allocation decisions and the participants had to calculate the resulting payoffs. There were also True/False questions to check participants’ understanding of the instructions. After all participants completed the quiz questions the experiment began. At the beginning of each round, participants learn their group composition in the Identity treatment. Figure A1 shows an example of the screen for the contribution phase. After the contribution decisions, subjects were informed of each group members’ painting group identity and the total group fund to be allocated, they would also be informed about other two group members’ contribution decisions. Figure A2 shows an example of the allocation phase with other participants’ contribution information. At the end of each round, participants were informed about each of their group members’ contribution decisions, payoffs and their allocation decisions. Figure A3 shows an example of the feedback screen.
Figure A1. Contribution Decision.
Games 09 00065 g0a1
Figure A2. Allocation Decision.
Games 09 00065 g0a2
Figure A3. Feedbacks.
Games 09 00065 g0a3

References

  1. Tajfel, H.; Billig, M.G.; Bundy, R.P.; Flament, C. Social Categorization and Intergroup Behaviour. Eur. J. Soc. Psychol. 1971, 1, 149–178. [Google Scholar] [CrossRef]
  2. Chen, Y.; Li, S. Group Identity and Social Preferences. Am. Econ. Rev. 2009, 2005, 431–457. [Google Scholar] [CrossRef]
  3. Bernhard, H.; Fehr, E.; Fischbacher, U. Group Affiliation and Altruistic Norm Enforcement. Am. Econ. Rev. 2006, 96, 217–221. [Google Scholar] [CrossRef]
  4. Hargreaves Heap, S.P.; Zizzo, D.J. The Value of Groups. Am. Econ. Rev. 2009, 99, 295–323. [Google Scholar] [CrossRef]
  5. Charness, G.; Rigotti, L.; Rustichini, A. Individual Behavior and Group Membership. Am. Econ. Rev. 2007, 97, 1340–1352. [Google Scholar] [CrossRef] [Green Version]
  6. Lane, T. Discrimination in the laboratory: A meta-analysis of economics experiments. Eur. Econ. Rev. 2016, 90, 375–402. [Google Scholar] [CrossRef]
  7. Harris, D.; Herrmann, B.; Kontoleon, A.; Newton, J. Is It A Norm To Favour Your Own Group? Exp. Econ. 2015, 18, 491–521. [Google Scholar] [CrossRef]
  8. Adams, J.S. Inequity In Social Exchange. In Advances in Experimental Social Psychology; Berkowitz, L., Ed.; Academic Press: New York, NY, USA, 1965; Volume 2, pp. 267–299. [Google Scholar]
  9. Selten, R. The equity principle in economic behavior. In Decision Theory and Social Ethics; Gottinger, H., Leinfellner, W., Eds.; Issues in Social Choice; D. Reidel: Dordrecht, The Netherlands, 1978; pp. 289–301. [Google Scholar]
  10. Cappelen, A.W.; Hole, A.D.; Sørensen, E.Ø.; Tungodden, B. The Pluralism of Fairness Ideals: An Experimental Approach. Am. Econ. Rev. 2007, 97, 818–827. [Google Scholar] [CrossRef] [Green Version]
  11. Dong, L.; Falvey, R.; Luckraz, S. Fair Share and Social Efficiency: A Mechanism in Which Peers Decide on the Payoff Division. 2018. Available online: https://ssrn.com/abstract=2812658 (accessed on 6 August 2018).
  12. Konow, J. Fair Shares: Accountability and Cognitive Dissonance in Allocation Decisions. Am. Econ. Rev. 2000, 90, 1072–1091. [Google Scholar] [CrossRef]
  13. Baranski, A. Voluntary Contributions and Collective Redistribution. Am. Econ. J. Microecon. 2016, 8, 149–173. [Google Scholar] [CrossRef]
  14. Cappelen, A.W.; Konow, J.; Sørensen, E.Ø.; Tungodden, B. Just Luck: An Experimental Study of Risk-Taking and Fairness. Am. Econ. Rev. 2013, 103, 1398–1413. [Google Scholar] [CrossRef] [Green Version]
  15. Goette, L.; Huffman, D.; Meier, S. The Impact of Group Membership on Cooperation and Norm Enforcement: Evidence Using Random Assignment to Real Social Groups. Am. Econ. Rev. 2006, 96, 212–216. [Google Scholar] [CrossRef]
  16. Fehr, E.; Schmidt, K.M. A Theory of Fairness, Competition, and Cooperation. Q. J. Econ. 1999, 114, 817–868. [Google Scholar] [CrossRef] [Green Version]
  17. Bolton, G.E.; Ockenfels, A. ERC: A Theory of Equity, Reciprocity, and Competition. Am. Econ. Rev. 2000, 90, 166–193. [Google Scholar] [CrossRef] [Green Version]
  18. Deutsch, M. Equity, Equality, and Need: What Determines Which Value Will be Used as the Basis of Distributive Justice? J. Soc. Issues 1975, 31, 137–149. [Google Scholar] [CrossRef]
  19. Bettencourt, B.; Dorr, N.; Charlton, K.; Hume, D. Status differences and in-group bias: A meta-analytic examination of the effects of status stability, status legitimacy, and group permeability. Psychol. Bull. 2001, 127, 520–542. [Google Scholar] [CrossRef] [PubMed]
  20. Liebe, U.; Naumann, E.; Tutic, A. Sozialer Status und prosoziales Handeln: Ein Quasi-Experiment im Krankenhaus. Kölner Zeitschrift für Soziologie und Sozialpsychologie 2017, 69, 109–129. [Google Scholar] [CrossRef]
  21. Paetzel, F.; Sausgruber, R. Cognitive Ability and In-group Bias: An Experimental Study. J. Public Econ. in press. [CrossRef]
  22. Fischbacher, U. Z-Tree: Zurich Toolbox For Ready-made Economic Experiments. Exp. Econ. 2007, 10, 171–178. [Google Scholar] [CrossRef]
  23. Greiner, B. Subject Pool Recruitment Procedures: Organizing Experiments with ORSEE. J. Econ. Sci. Assoc. 2015, 1, 114–125. [Google Scholar] [CrossRef]
  24. Rivkin, S.G.; Hanushek, E.A.; Kain, J.F. Teachers, Schools, and Academic Achievement. Econometrica 2005, 73, 417–458. [Google Scholar] [CrossRef] [Green Version]
  25. Feld, J.; Salamanca, N.; Hamermesh, D.S. Endophilia or Exophobia: Beyond Discrimination. Econ. J. 2016, 126, 1503–1527. [Google Scholar] [CrossRef]
  26. Alesina, A.; Miano, A.; Stantcheva, S. Immigration and Redistribution; NBER Working Paper 24733; NBER: Cambridge, MA, USA, 2018. [Google Scholar]
  27. Naumann, E.; Stoetzer, L.F. Immigration and support for redistribution: Survey experiments in three European countries. West Eur. Polit. 2018, 41, 80–101. [Google Scholar] [CrossRef]
1.
A large body of experimental literature has shown that the induced identities in the laboratory can have profound impacts on human behavior, including distributive behavior (Chen and Li, 2009) [2], punishment behavior (Bernhard, Fehr and Fischbacher, 2006 [3]), trusting behavior (Hargreaves Heap and Zizzo, 2009 [4]), cooperation in the Prisoner’s Dilemma and aggression in the Battles of Sexes (Charness, Rigotti and Rustichini, 2007 [5]), to name just a few. They typically find people tend to favor ingroups at the cost of outgroups, though the strength of ingroup favoritism varies in specific studies. See Lane (2016) [6] for a recent meta analysis.
2.
In addition to experimental evidence, various theories have been put forward to discuss the conditions under which one norm is a more appropriate basis of distributive justice than the other. See economic models of outcome-based fairness and inequality aversion (Fehr and Schmidt, 1999 [16]; Bolton and Ockenfels, 2000 [17]) and discussions by social psychologists (e.g., Deutsch, 1975 [18]).
3.
This line of research predominantly uses the other-other allocation task, varying social status or other social identities of allocators and recipients, to detect ingroup bias. However, status or identities may not be a strong enough cause for ingroup bias in the presence of self-interest motivation, that is, when players are allocating between themselves and other individuals (Liebe et al., 2017 [20]).
4.
The matching of the three-person group was pre-determined by the computer software, and the software also randomizes the display of players’ contribution decisions on the screen in each round. In this way, players were not be able to track whom they had been previously paired with.
5.
All the paintings were shown on the computer screen as well as in printed form. The five pairs of paintings are: 1A Gebirgsbidung, 1924, by Klee; 1B Subdued Glow, 1928, by Kandinsky; 2A Dreamy Improvisation, 1913, by Kandinsky; 2B Warning of the Ships, 1917, by Klee; 3A Dry-Cool Garden, 1921, by Klee; 3B Landscape with Red Splashes I, 1913, by Kandinsky; 4A Gentle Ascent, 1934, by Kandinsky; 4B Hoffmannesque Tale, 1921, by Klee; 5A Development in Brown, 1933, by Kandinsky; 5B The Vase, 1938, by Klee.
6.
Our procedure differed from [2] in two ways. First, instead of a binary choice, we gave players four options: strongly prefer A, weakly prefer A, weakly prefer B, or strongly prefer B. Second, to ensure each painting group has an equal number, players were notified that their group assignment was based on their painting preferences relative to other players’ preferences in the room. So players were not necessarily placed in the group for which they had expressed stronger preferences, but selecting a greater number of painting by a given artist and indicating “strongly prefer” the paintings from that artist increased the probability of being in that group.
7.
Painting number 6 is Monument in Fertile Country, 1929, by Klee, and Painting number 7 is Start, 1928, by Kandinsky.
8.
The 12 copies of the paintings were also on their desk for the reference during the chat. A participant was neither required to contribute to the discussion nor to give answers that conformed any decision reached by the group.
9.
In Dong et al. (2018) [11], the game is preceded by ten rounds of another game in which players alway received equal shares of the group profit. There, the average contribution reached almost zero in round ten. In their study, the two-stage mechanism helped to restore the contribution to the average of 8.0 in the next ten rounds. Using Kolmogorov-Smirnov tests of equality of distribution for last round contribution decisions, we find that the contribution level in our Base treatment is not significantly different from theirs ( p = 0.519 ).
10.
In the paper, we take sessions’ average contribution as independent observations when conducting ranksum tests, and we report two-sided p-values.
11.
In the paper, we take sessions’ average contribution for the ingroups and outgroups as independent observations when conducting signed-rank tests, and we report two-sided p-values.
12.
Because our software only allows the input with a resolution of 0.1 and e j e j + e k may not always be a fraction of ten, we define that player i allocates proportionally if a i j a i j + a i k e j e j + e k < 0.05 .
13.
In Figure 4, we demonstrate using the first round’s data because observations in later rounds are overwhelmingly full contribution and equal allocation.
14.
A power analysis shows that to achieve the 80 percent power and 5 percent significance level for at least one of the ingroup dummy and interaction term (that is, ingroup dummy in the regression using all rounds), the required sample size is 4221. This means our study might be underpowered to detect the treatment difference in allocation decisions. Alternatively, it means that the effect is probably negligible to make any economic significance.
15.
Unsurprisingly, the outgroups’ allocation decisions also strongly adhere to the proportional rule.
Figure 1. Time-path of the Average Contribution by Treatment.
Games 09 00065 g001
Figure 2. Distribution of Contribution in Round 1.
Games 09 00065 g002
Figure 3. Average Contribution of the Ingroups and Outgroups in the Identity Treatment.
Games 09 00065 g003
Figure 4. Allocation Decisions in Round 1.
Games 09 00065 g004
Figure 5. Frequency of allocating more than the proportional amount to ingroups.
Games 09 00065 g005
Table 1. Allocation Decisions by Round.
RoundBaseIdentity
PropEqualP&EOtherPropEqualP&EOther
146147204220618
25122181752261814
34923181951262117
45929261153292115
55929281353322415
65632311653363316
76140401160353512
8655049659444413
9685150451454219
10686161458434214
11676060558383714
12676262561444311
Notes: (1) This table classifies allocation decisions by round. There are 72 allocation decisions in each round for each treatment. (2) “Prop” means that proportional allocations; “Equal” means egalitarian allocations; “P&E” means allocations that are both proportional and egalitarian (this can happen when allocatees make equal contributions); “Other” are the decisions that cannot be classified as either “prop” or “equal”.
Table 2. Determinants of Allocation Decisions.
Dep. Variable:Fraction Player i Allocate to Player j
Round 1All Rounds
β 1 : Player j’s relative contribution0.877 ***0.971 ***
(0.064)(0.040)
β 2 : Player i and j are ingroups0.0010.085
(0.056)(0.052)
β 3 : j’s relative contribution × Ingroups0.037−0.078
(0.080)(0.063)
β 0 : Intercept0.0610.006
(0.030)(0.020)
#Cluster612
#Observations1201440
H 0 : β 1 = 1 3.680.55
( p = 0.08 ) ( p = 0.46 )
Notes: (1) Regression in column 2 (for round 1) is an OLS and regression in column 3 is a random effects regression. (2) The standard errors are clustered at the session level. *** indicate significance at 1% level. (3) We report the test statistics for the hypotheses tests and two-sided p values are in the brackets. (4) The Hausman test for random vs fixed effects yields a p value greater than 0.1.