1. Introduction
A central theme in the behavioural sciences is the examination of the ability of punishment regimes, where sanctioning is assigned endogenously by group members to their peers, to regulate self-interested behaviour in social dilemma games (as in [
1,
2]). We refer to these environments as “democratic punishment regimes”. Numerous laboratory experiments on public goods have shown that such democratic punishment regimes foster high cooperation rates (for recent overviews, see [
3,
4]). However, this cooperation enhancing effect has been found to be sensitive to a number of factors, such as low effectiveness of punishment (see [
5,
6,
7,
8]), second-round punishment opportunities (see [
9,
10,
11]), and antisocial punishment (see [
4,
12,
13]). The evidence from these experiments suggests that, under certain conditions, peer punishment can have little or negative effect on cooperation. The aim of this paper is to explore experimentally how subjects respond in a democratic punishment regime when they have experience with an undemocratic punishment regime and
vice versa.
To generate an undemocratic punishment regime, we propose a variant of the standard punishment game, which we refer to as the “default punishment game”. In this game, group members participate in a two-stage game. In the first stage, they are engaged in a standard linear public goods game, in which they have to decide how much of their initial endowment they are willing to contribute to the public good (see [
14]). The game is parameterized so that it captures the tension between personal interests and social benefits. At the beginning of the second stage, we introduce a new element: each group member’s income is
exogenously reduced by a fixed automatic penalty imposed on them—the default punishment. This implies that all group members unconditionally receive a decrease in their monetary income, irrespective of their first stage behaviour. During the second stage, after contribution decisions have been anonymously revealed, subjects are given the opportunity to alleviate the exogenous default punishment of others at some cost to themselves. Our environment has the interesting feature that the fixed income reduction does not depend on the individual behaviour. The automatic penalty is undemocratic in the sense that it is exogenously implemented and the sanctioning mechanism is not being any more social as it cannot identify individual defectors or cooperators.
1 We thus assume that our punishment regime generates a less democratic environment in relation to the standard punishment game where punishment is meted out endogenously by group members.
Our paper is also related to the literature examining behaviour in situations where subjects are given the possibility (typically using voting procedures) to choose the public goods game environment they would like to interact in, as well as the punishment rules governing these environments (e.g., [
16,
17,
18,
19]).
2 In sum, this literature suggests that letting subjects democratically choose which regime they prefer positively affects cooperative behaviour.
In our paper, the automatic penalty is exogenously assigned to all group members (including those with cooperative attitudes) and it is in this respect that our punishment regime is undemocratic. By having subjects experience an undemocratic punishment environment before they play the standard punishment game, we can assess whether our undemocratic environment impacts on individuals’ expectations of how punishment works. We also reverse the order of the two games. This allows us to test whether, and if so how, experience of a democratic punishment regime affects behaviour in the undemocratic punishment regime.
Our findings indicate that more pronounced detrimental effects on behaviour are present in the undemocratic punishment regime when subjects have experienced the democratic punishment regime. However, this is not the case for the democratic punishment regime where behaviour is not affected by the experience (or not) of the undemocratic default punishment game. Overall, we find that performance in the undemocratic punishment regime is worse in relation to the democratic one.
The remainder of the paper is organised as follows.
Section 2 presents the design and the procedures of the experiment.
Section 3 reports the results and
Section 4 concludes.
2. Experimental Design and Procedures
2.1. Experimental Design
To address our research questions, we implemented a within-subjects design which consists of two conditions: the “default punishment condition” (D-condition) and the “standard punishment condition” (S-condition). We alternated the order of the two conditions, enabling us to control for potential order effects. This resulted in including two sequences in our experiment: the DS sequence, in which the D-condition is followed by the S-condition and the SD sequence, in which the S-condition is followed by the D-condition.
In each condition, subjects interacted in a two-stage game for 10 periods. The group composition remained fixed across all 20 periods within a sequence (Partners’ matching protocol). The first stage of the game was common to both conditions involving a voluntary contributions mechanism game with linear payoffs. During the first stage, subjects, being randomly assigned to a four-person group, are privately endowed with 20 tokens each and have to decide how many of these to keep for themselves and how many to contribute to a public good (described to subjects as “project”). For each token kept, each subject earns 1 Money Unit (MU); whereas, for each token contributed the return is equal to 0.5 MUs, resulting in a total of 2 MUs for the whole group. Subjects make their decisions simultaneously and in private. At the end of the first stage they are informed about the sum of the contributions to the public good made by the whole group and about their own first stage income. The payoff function for a given subject in the first stage is given by Equation (1):
where
gi (0 ≤
gi ≤ 20) denotes the number of tokens contributed to the public good by group member
i.
After the first stage has finished, a second stage follows. The structure of the second stage differs between the D-condition and the S-condition. We thus discuss the second stage of each condition in turn.
2.1.1. The D-Condition
At the beginning of the second stage of the D-condition, all group members incur an automatic penalty irrespective of their first stage contributions, which we refer to “default punishment”.
3 In this stage, a group member can see the profile of contributions of the other three group members and is given the opportunity to alleviate the automatic penalty of other group members. Alleviating the automatic penalty is costly for the person who alleviates, but beneficial for the person receiving the alleviation. Subjects could assign between 0 and 2 adjustment points to each other group member. Assignment of adjustment points costs the person who alleviates 1 MU; whereas the impact of assigning one adjustment point is equal to 3 MUs.
In our experiment, the automatic penalty was set equal to 10 MUs. We did so for two reasons. First, complete alleviation of the automatic penalty was possible only if the majority of the group members decided to assign adjustment points. Since each group member can assign up to 2 adjustment points, with each point decreasing the automatic penalty by 3 MUs, the automatic penalty is fully alleviated only if two or more group members assign the total amount of points they control. Second, we did not want to create a situation where subjects would be very likely to end up with substantial losses due to the automatic penalty at the end of the experiment. In this case, subjects would receive a large lump sum payment to cover possible losses in the D-condition, which could affect their behaviour.
The payoff function for a given subject in the D-condition is given by Equation (2):
where
denotes the first stage income (as indicated in Equation (1)),
denotes the number of adjustment points that group member
i assigns to group member
j and
denotes the number of points assigned by
j to
i. Note that if a subject received more adjustment points than the automatic penalty, their income could not increase by this extra amount.
At the end of the second stage, subjects were informed about their own cost of assigning adjustment points, the total number of adjustment points assigned to them, and their earnings. No information about the number of adjustment points received by each group member was available.
2.1.2. The S-Condition
Contrary to the D-condition, the second stage of the S-condition does not include any automatic penalty. After a group member observes the profile of contributions of the other three group members from the first stage, s/he is given the opportunity to decrease each other group members’ income by assigning adjustment points. The assignment of adjustment points is costly both for the punisher and the recipient of the punishment. Each adjustment point assigned costs the punisher 1 MU. For each adjustment point, the recipient’s income decreases by 3 MUs. As in the D-condition, subjects can assign up to 2 adjustment points. The payoff function for a given subject in the D-condition is given by Equation (3):
where
denotes the first stage income (as indicated in equation (1)),
pij denotes the number of adjustment points that group member
i assigns to group member
j and
denotes the number of points assigned by
j to
i.
At the end of the second stage, subjects received the same feedback information as in the D-condition. Note also that, in both conditions, subject-specific reputations cannot develop across periods, since subject i does not have the information to construct a link between individual contributions of subject j across periods. Since subject-specific reputations cannot build up, the possibility that player i assigns adjustment points to player j in period t for contribution decisions made in a previous period from t is ruled out.
Conditional on each group member i being motivated to maximise Equations (2) and (3), the unique subgame perfect equilibrium requires that, in both conditions, each group member free rides completely in the first stage and refrains completely from assigning adjustment points in the second stage.
2.2. Procedures
All sessions took place in April and May 2008 in the Centre for Decision Research and Experimental Economics (CeDEx) lab. Recruitment was conducted via the software ORSEE ([
21]) at the University of Nottingham using subjects from a university-wide pool of registered students. All conditions were computerized and programmed with the software z-Tree ([
22]). At the beginning of each sequence, subjects received instructions for the first condition and at the end of it for the second condition. Subjects were informed that the session consists of two conditions in order to reduce the possibility for having wrong expectations about the nature of the experiment. However, they were not told what will happen in the second condition. All participants answered several test questions, concerning the calculation of payoffs for various hypothetical configurations of behaviour. None of the conditions proceeded until every subject had answered these questions correctly. Each of the two sequences was conducted twice, yielding a total of 4 sessions. In the DS sequence 40 subjects participated, resulting in 10 independent observations; while in the SD sequence 36 subjects participated, resulting in 9 independent observations.
At the end of a sequence, subjects were privately paid according to their accumulated earnings from all 20 periods, using an exchange rate of £0.015 per MU. Average earnings per sequence were as follows: £10.45 for the DS sequence and £9.48 for the SD sequence. Sessions lasted, on average, 75 min.
3. Results
3.1. Contribution Levels
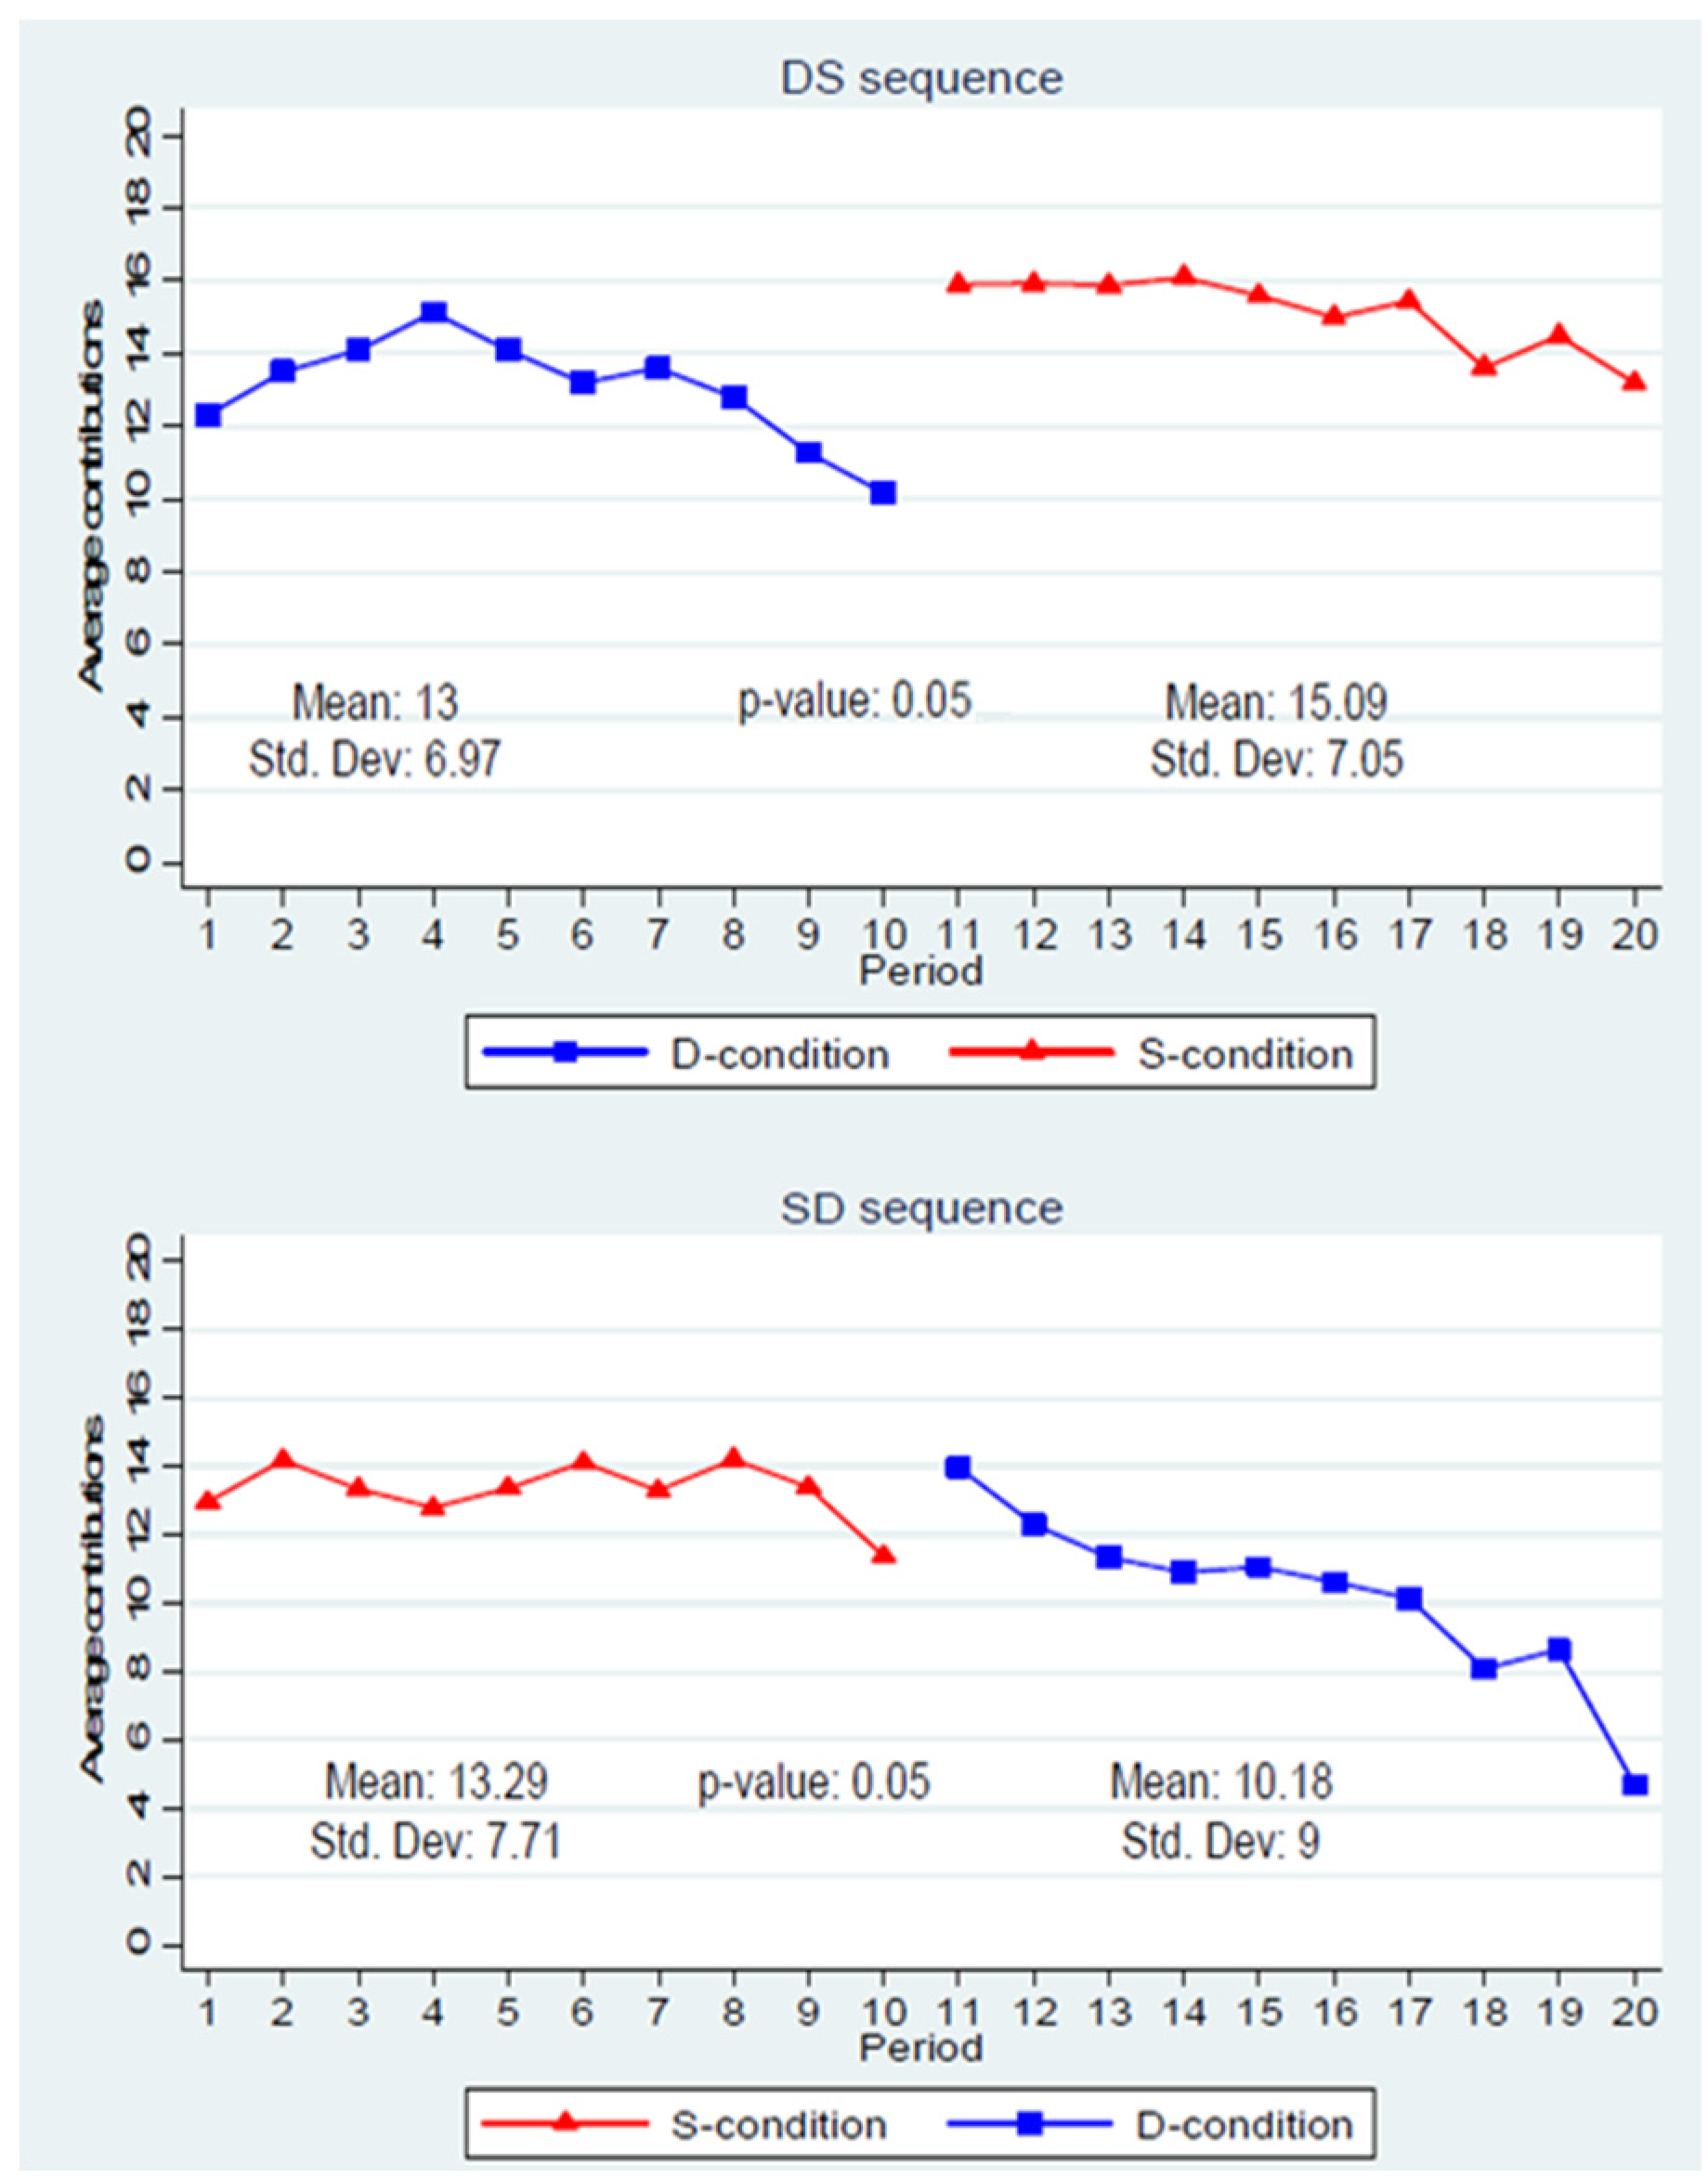
Finding 1. (a) Average contributions are significantly lower in the D-condition compared to the S-condition within a given sequence. (b) In the D-condition, average contributions decline over time only when subjects already have experienced the S-condition.
Support. We begin our data analysis by looking at how contribution levels evolved in each sequence. Data are presented as the amount of tokens contributed to the group account. Starting with the DS sequence, we find that subjects’ mean contributions were 13 and 15.09 tokens for the D- and the S-conditions, respectively. Regarding the SD sequence, average contributions across all ten periods were 13.29 tokens for the S-condition and 10.18 tokens for the D-condition.
Figure 1 shows the evolution of average contribution levels in each sequence separately. In each panel, we report the mean contributions across periods for each condition, the corresponding standard deviation and the p-values from a Wilcoxon signed-rank test for within sequence comparisons.
4
Figure 1.
Time series of average contributions for the DS and SD sequences.
Figure 1.
Time series of average contributions for the DS and SD sequences.
Figure 1 shows that contributions over time are stable in both of the S-conditions in either sequences. This is in line with existing findings in the literature of public good games with punishment (e.g., [
1]). However, we observe that the contribution patterns of the D-conditions are not stable over time. In the SD sequence, contributions initially increase during the first half of the D-condition and then follow a decaying pattern over the second half. In the DS sequence, we observe that contributions decline over time. By performing a Wilcoxon sign rank test, we find significant within-subject differences across conditions in each sequence. Specifically, in relation to the S-condition, subjects contribute significantly less in the D-condition of the DS sequence (
p = 0.05) and of the SD sequence (
p = 0.05).
5 Our econometric analysis corroborates these findings when we perform OLS regressions that test for differences across conditions within each sequence, controlling for time trends.
6 We estimate four OLS regressions, in which the dependent variable is the contribution to the group account. In Models (1a) and (1b) we focus on the DS sequence and in Models (2a) and (2b) we focus on the SD sequence. The independent variables for Models (1a) and (2a) consist of a dummy variable for a condition and period, which is equal to the actual number of periods. In Models (1a) and (1b) the dummy variable called “S-condition” is equal to 1 for the S-condition and 0 for the D-condition, whereas in Models (2a) and (2b) the dummy variable called “D-condition” is equal to 1 for the D-condition and 0 for the S-condition. We include the interaction between the treatment dummy and period in Models (1b) and (2b). The regression results are reported in
Table 1.
Table 1.
Differences in contribution levels within a sequence—Regression results.
Table 1.
Differences in contribution levels within a sequence—Regression results.
| Dependent Variable: Contribution to the Group Account |
|---|
| | DS Sequence | SD Sequence |
|---|
| Model 1(a) | Model 1(b) | Model 2(a) | Model 2(b) |
| S-condition | 2.09 ** (0.833) | 2.142 ** (0.831) | | |
| D-condition | | | −3.117 ** (1.063) | 0.719 (1.785) |
| Period | −0.287 (0.190) | −0.282 (0.217) | −0.428 *** (0.088) | −0.080 (0.169) |
| S-condition × Period | | −0.009 (0.130) | | |
| D-condition × Period | | | | −0.697 * (0.318) |
| Constant | 14.579 *** (1.195) | 14.553 *** (1.252) | 15.647 *** (2.002) | 13.730 *** (1.522) |
| Obs. | 800 | 800 | 720 | 720 |
The regression coefficients of Models (1a) and (1b) indicate that subjects contribute significantly more in the S-condition relative to the D-condition of the DS sequence. Additionally, we find no significant time trends for the evolution of contributions in the D-condition as well as in the S-condition (as the variable “Period” and the interaction term between the dummy variable “S-condition” and “Period” are not statistically significant at conventional levels). When we look at Model (2a), we find that contributions are significantly lower in the D-condition compared to the S-condition of the SD sequence. Furthermore, in Model (2b), we find that contributions do not decline over time in the S-condition (as the variable “Period” is insignificant). However, the contribution pattern seems to be different in the D-condition (as the interaction term between the treatment dummy variable “D-condition” and “Period” is negative and statistically significant). When we perform a post-estimation test for the variables “Period” and the respective interaction term, we find that contributions are decaying over time in the D-condition (p = 0.00).
3.2. Alleviation and Sanctions
Finding 2: (a) Subjects alleviate significantly more in the D-condition of the DS sequence compared to the D-condition of the SD sequence. (b) Subjects do not sanction significantly differently in the S-condition of the DS sequence compared to the S-condition of the SD sequence.
Support. We next turn our attention to how alleviation and sanctions were assigned in the respective conditions. We first examine whether the alleviation functions differ by estimating an ordered probit regression model which controls for factors that are likely to affect alleviation behaviour such as positive and negative deviations. As dependent variable, we include the number of points that player i assigns to player j. The independent variables consist of: “Player j’s absolute negative (contribution) deviation”, “Player j’s positive (contribution) deviation”, and the dummy variable called “D-condition (DS sequence)”. We also include two interaction terms, which indicate whether the slope of the alleviation function differs with respect to negative and positive deviations across the two D-conditions. Note that all deviations are calculated with respect to the player i’s contribution. The variable “Player j’s absolute negative (contribution) deviation” is the absolute value of the actual deviation of player ’s contribution from player i’s contribution, when player ’s contribution is below player i’s contribution; and zero otherwise. The variable “Player j’s positive (contribution) deviation” is constructed in an analogous way. The dummy variable “D-condition (DS sequence)” equals 1 for the D-condition of the DS sequence and 0 for the D-condition of the SD sequence.
Table 2 reveals two important observations. First, the coefficient of the dummy variable “D-condition (DS sequence)” has a positive sign and is statistically significant at the 5% level, implying that the intercept of the alleviation function is different across our two sequences. This implies that subjects in the D-condition of the DS sequence alleviate more points compared to subjects in the D-condition of the SD sequence. Additionally, the coefficients of the interaction term between negative deviations and the dummy variable “D-condition (DS sequence)” is negative and statistically significant at the 1% level, suggesting that the slope of the alleviation function is steeper in the D-condition of the DS sequence compared to the D-condition of the SD sequence. This is not the case for positive deviations where the slope of the alleviation function does not differ across sequences.
We next analyse punishment behaviour by contrasting second stage behaviour in the S-condition of the SD condition versus the S-condition of the DS sequence. To do this, we estimate an ordered probit model which controls for factors that are likely to affect punishment behaviour such as positive and negative deviations. As dependent variable, we include the number of points that player i assigned to player j. The independent variables consist of: ‘”Player j’s absolute negative (contribution) deviation”, “Player j’s positive (contribution) deviation”, and the dummy variable called “S-condition (SD sequence)”. We also include two interaction terms, which indicate whether the slope of the punishment function differs with respect to negative and positive deviations across the two S-conditions. Note that all deviations are calculated with respect to the player i’s contribution. The variables “Player j’s absolute negative (contribution) deviation” and “Player j’s positive (contribution) deviation” are defined as above. The dummy variable “S-condition (SD sequence)” equals 1 for the S-condition of the SD sequence and 0 for the S-condition of the DS sequence.
Table 2.
The alleviation function—Regression results.
Table 2.
The alleviation function—Regression results.
| Dependent Variable: Alleviation Assigned by Player i to player j |
|---|
| Player j’s absolute negative (contribution) deviation | −0.040 (0.030) |
| Player j’s positive (contribution) deviation | −0.010 (0.021) |
| D-condition (DS sequence) | 0.759 ** (0.334) |
| D-condition (DS sequence) × Absolute negative deviation | −0.133 *** (0.036) |
| D-condition (DS sequence) × Positive deviation | −0.039 (0.027) |
| Obs. | 2280 |
The results from
Table 3 indicate that the vertical intercept of the punishment function does not differ across the two sequences, since the coefficient of the dummy variable “S-condition (SD sequence)” is not statistically significant. The coefficients of the interaction terms are also insignificant, implying that the slope of the punishment function with regard both to negative and positive deviations is the same, irrespective of the sequence. The only variable that has a significant effect on the assignment of punishment is the absolute negative deviation from the punisher’s contributions: a subject punishes a co-player more, the less the co-player contributes relative to the punisher. This is in line with previous literature from public good games (e.g., [
1,
23]) indicating that the punishment function is negatively sloped.
Table 3.
The punishment function—Regression results.
Table 3.
The punishment function—Regression results.
| | Dependent Variable: Punishment Assigned by Player i to Player j |
|---|
| Player j’s absolute negative (contribution) deviation | 0.153 *** (0.025) |
| Player j’s positive (contribution) deviation | −0.027 (0.021) |
| S-condition (SD sequence) | 0.181 (0.263) |
| S-condition (SD sequence) × Absolute negative deviation | 0.002 (0.028) |
| S-condition (SD sequence) × Positive deviation | −0.008 (0.026) |
| Obs. | 2,280 |
3.3. Average Earnings
Finding 3: Average earnings are significantly lower in the D-condition compared to the S-condition within a given sequence.
Support. In this section we explore how efficiency (as measured by subjects’ net average earnings) was determined in each condition.
Table 4 presents the average net earnings in each condition and sequence, separately.
Table 4.
Average earnings for each condition and sequence.
Table 4.
Average earnings for each condition and sequence.
| D-Condition | S-Condition |
|---|
| DS sequence | 25.88 (7.80) | 31.75 (7.28) |
| SD sequence | 22.16 (10.04) | 29.07 (8.83) |
In either sequences the S-condition yields higher welfare (31.75 MUs) in the DS sequence and 29.07 MUs in the SD sequence) compared to the D-condition (25.88 MUs in the DS sequence and 22.16 MUs in the SD sequence). By performing a Wilcoxon sign rank test, we test for differences in earnings within a given sequence. We find that the S-condition yields higher welfare than the D-condition both in the DS sequence (
p = 0.01) and the SD sequence (
p = 0.01).
7 4. Concluding Remarks
In this paper, we report an experiment examining how an undemocratic public goods game (D-condition) affects behaviour in a standard public goods game with punishment (S-condition) and vice versa. Specifically, in our experiment, we introduce an environment where an automatic penalty is meted out exogenously to all group members (unconditionally and by default), irrespective of their prior behaviour. Subjects are then given the opportunity to alleviate the automatic penalty from others by assigning adjustment points to them. We refer to this game as the default punishment game.
Our findings show that average contributions and earnings are significantly lower in the default punishment game compared to the standard punishment game. We also find that contributions in the default punishment game decline over time only after the experience of the standard public goods game with punishment. This decaying pattern of contributions is explained by differences in how alleviation occurs: subjects alleviate other group members significantly less when they first experience the standard public good game with punishment compared to when they have no such experience.
Our results indicate significant order effects in relation to how subjects respond in the less democratic default punishment regime. However, this is not the case for the standard public good game with punishment where the contribution levels remain robust over time and the assignment of punishment is unaffected irrespective of whether subjects have experienced previously the default punishment game or not.
We see at least two avenues for future research. First, investigating the perception of automatic penalty in subject pools with high levels of antisocial punishment may lead to interesting insights on the behavioural consequences of the default punishment game. Second, in the light of previous research (e.g., [
5,
6]) suggesting that if norm adherence or enforcement becomes more costly, norms are more likely to collapse, it will be of interest to analyse whether and if so, how the size of automatic penalty impacts on the sustainability of social norms.


