In 2005, a special issue of Science listed the 25 areas where scientists perceived the most important gaps in our knowledge to date [
1]. These included the question, raised by Pennisi [
2], of how cooperative behavior evolved to form the basis for the complex societal structures we observe today. She pointed out the importance of investigating which conditions and institutional settings promote cooperation in situations where individuals have an incentive not to cooperate. A famous example of such a dilemma is of course the contribution to a public good. In the standard setting, individuals have strong incentives to maximize their own payoffs by free riding and not contributing to the public good. As a result, a group of rational actors would be unable to supply a public good.
A large number of laboratory experiments have investigated cooperation in the public goods game (for reviews, see [
3,
4]). In the most common version of the repeatedly played public goods game, each individual in a group makes his or her own decision about how much of the endowment to contribute to a public good in every period. The results show that contributions tend to start out at an average of around 50% and decline towards zero [
4,
5]. Looking at individual behavior, a number of subjects are usually found to contribute in the first few periods of repeated public goods games. Over time, their contributions decline as they observe other subjects free riding and contributing nothing. In the end, because of these conditional cooperators’ reactions to the free riders, the public good no longer gets produced [
6,
7,
8].
These somewhat disappointing findings on human cooperative behavior in such dilemmas have been qualified by more recent results. There are mechanisms that can foster contributions to the public good. One such solution is monetary punishment, as introduced by Ostrom, Gardner and Walker [
9]. Their paper, and a number of follow-up studies, show that (centralized and decentralized) punishment and reward can stabilize contributions at high levels [
10,
11,
12,
13].
1 Besides punishment, voting on the implementation of different proposed contribution rules has been shown to have a positive effect [
14,
15].
We claim that besides the instruments of punishment and reward, direct power over the decisions of others can play an important role when it comes to the success of collective action in dilemma situations. Weber [
16] defines power as “the likelihood that one person in a social relationship will be able, even despite resistance, to carry out his own will.” Structures of (asymmetric) power distributions are omnipresent in everyday life and characterize whole societies, but also groups, (business) organizations and the like [
16,
17]. Yet, despite its obvious importance in everyday life, the discipline of economics has not devoted much time to studying power over the decisions of others (for an analogous argument and another recent experimental study regarding power, see [
18]).
Kroll
et al. [
19] show that contributions to a public good increase if group members in a public goods game can vote for a binding proposal as opposed to making voluntary contributions. One particularly noteworthy recent exception builds on the idea of binding subjects to specific actions. It employs a new contribution mechanism in public good games, based on an asymmetric distribution of power: the allocator mechanism. The two studies introducing this topic are Hamman
et al. [
20] and Bolle and Vogel [
21]. Both show that, under certain conditions, one way of promoting the provision of a public good is to establish an allocator who has absolute power over the decisions of all group members. In the unique rational expectations equilibrium, this allocator is then able to force all group members to contribute their full endowment to the public good, thereby maximizing the collective outcome. Hamman
et al. [
20] and Bolle and Vogel [
21] largely confirm this theoretical prediction and show experimentally that the use of an allocator results in comparatively very high contributions to the public good.
Where the two studies differ is in the specifics of group members’ and allocators’ choice sets and in the structure of the experiment. Hamman
et al. [
20] let group members elect an allocator and find that groups ensure full provision of the public good primarily by electing pro-social allocators. Since each group of nine holds a new election every period, their setting allows for punishment by removing underperforming allocators from power. Allocators who contribute fully for everyone are found to be re-elected in almost all cases. Bolle and Vogel [
21] choose a different first phase for their experiment. They initially let subjects play 10 periods of a public goods game with voluntary contributions. This is followed by one period, where an allocator is chosen (either randomly or by election) to make the allocation decision for the two other members of her three-person group. This sequence of voluntary (10 periods) and allocator contribution phases (one period) is repeated twice, such that subjects play three allocator periods in total. Like Hamman
et al. [
20], Bolle and Vogel [
21] observe higher contributions in the allocator setting than in the setting with voluntary contributions. Interestingly, they find no statistically significant differences between the election and the random selection treatments.
The great success of the allocator mechanism documented in these two studies merits further research. We explore its performance characteristics by (i) systematically varying the action space of the allocator and by (ii) studying whether subjects prefer groups governed by the allocator mechanism over groups where they can freely choose their own contribution when group choice is endogenous. Note that the two precursor studies implement the allocator mechanism in a way that either forces all subjects to participate or allows endogenous participation, such that non-participating subjects profit from the public good of participating subjects. In this second case, Hamman
et al. [
20] find that the allocator mechanism is not able to increase contributions due to free riding. Only when communication is possible do half of their groups choose to transfer their decision rights and achieve high contribution levels. We build on these results and investigate whether the transformation of the public good into a club good, from which only group members can profit, is also able to foster the allocator mechanism’s efficiency. Our second question therefore is of special importance, since it captures a subject’s willingness to submit to authority for her own benefit and the benefit of the whole group. This question is also closely related to a major finding in the discipline of new institutional economics [
22]. It states that the voluntary participation of subjects in finding a solution to coordination problems substantially increases the likelihood of success.
Such endogenous institution choice has previously also been examined for the punishment and reward mechanisms mentioned above. One approach is to let subjects vote whether they want to implement, e.g., punishment in the public goods game they will later be playing [
23]. Another is to let subjects self-select into groups with different, exogenously fixed institutional settings. Gürerk
et al. [
24] find that subjects are more likely to self-select into groups with sanctioning institutions than into alternative groups and that the likelihood of choosing the group with sanctioning institution increases over time. In this way, they show that when two groups with different institutional settings compete against each other, the group with a sanctioning institution—due to the higher payoffs it generates for its members—prevails in the end. Hamman
et al. [
20] also present some of these aspects in their experiments. They allow subjects to choose whether they want to be part of electing an allocator who will then make the contribution decision on their behalf or whether they want to choose their level of contribution themselves. The important difference to the design of Gürerk
et al. [
24] (and this study) is that subjects who choose not to be part of the electoral delegation mechanism in Hamman
et al. [
20] nonetheless profit from the public goods contributions made by subjects who have delegated their decision power. This allows subjects who have not joined the delegation mechanism to free ride on its outcomes.
2 Without communication, Hamman
et al. [
20] obtain an average contribution level of only 11%. In this setting, the allocator mechanism thus fails to sustain high public goods contributions. Whether groups governed by the allocator mechanism have an advantage over groups with voluntary contribution when one group does not profit from the contributions of the other is an important and unanswered question.
Building on Hamman
et al. [
20] and Bolle and Vogel [
21], we thus identify two important questions. First, do subjects prefer a group governed by the allocator mechanism over a group with a voluntary contribution mechanism? Second, which factors influence subjects’ group choice? The present article answers both of these questions. As an additional innovation, we drill down into the role played by the allocator’s action space. Specifically, we compare a treatment with what we term a coordinator—an allocator who can choose one uniform contribution level for all members of her group, including herself—to a treatment with a dictator—an allocator who can choose a contribution level for herself and a different, uniform contribution level for all other group members. This mimics many settings outside the lab where a group leader or government establishes policies that apply to all group members equally (e.g., regulations that require every able-bodied male adult to contribute to the public good of national defense by having to serve a term in the military, as exists in many countries). Consider as a loosely-related example for our setting a country’s decision to join the European Union. This country faces a tradeoff between giving up the freedom to decide on its laws and regulations entirely on its own and abdicating some of its regulatory authority to the EU institutions in return for the benefits from greater cooperation. This example shares with our design the feature that leadership of the group, in this case, the presidency of the council of the EU, rotates through all member states, with each country serving only one term. (Another example would be the decision by a stone-age human to join a tribe, thus giving up individual freedom in order to gain the ability to jointly hunt larger game, which is argued to have contributed to the rise of modern civilization; see, e.g., [
26]).
The remainder of this paper is structured as follows. In
Section 1, we state our research questions and derive our hypotheses.
Section 2 outlines the experimental design and procedures. Results are presented in
Section 3 and discussed in
Section 4.
1. Research Question and Hypotheses
We investigate the question of how societal coordination can arise endogenously in response to economic coordination problems. We take a standard public good game as our workhorse model and augment it by giving subjects the freedom to select into one of two groups at the beginning of every period. In the voluntary contribution group (VCG), they play a standard public good game by deciding how much of their endowment to keep for themselves and how much to invest into a public good. If subjects select into the allocator contribution group (ACG), one group member is randomly chosen to set the contribution level for all ACG members.
Given a contribution level, we use the same payoff function in both groups. Specifically, a subject’s payoff for any one period in our experiment is calculated as follows:
3
where
is the payoff of subject
i,
is a subject’s endowment in each period in experimental currency units (ECU),
is the subject’s contribution to the public good in this period,
is a constant determining the marginal per capita return (MPCR),
is the number of subjects in group
and
is the sum of all contributions of subjects
j in group
θ in this period. The return from the public good is rendered independent of the group size through the inclusion of
in the denominator of the MPCR. It thus depends only on the average contribution in the group (this follows the design of Rockenbach and Milinski [
27]). In the special case that only a single subject selects into one of the groups, the subject’s contribution is automatically set to zero, and no public good is generated (subjects are so informed in the instructions). Note that subjects receive information about their group’s size before making their contribution decision.
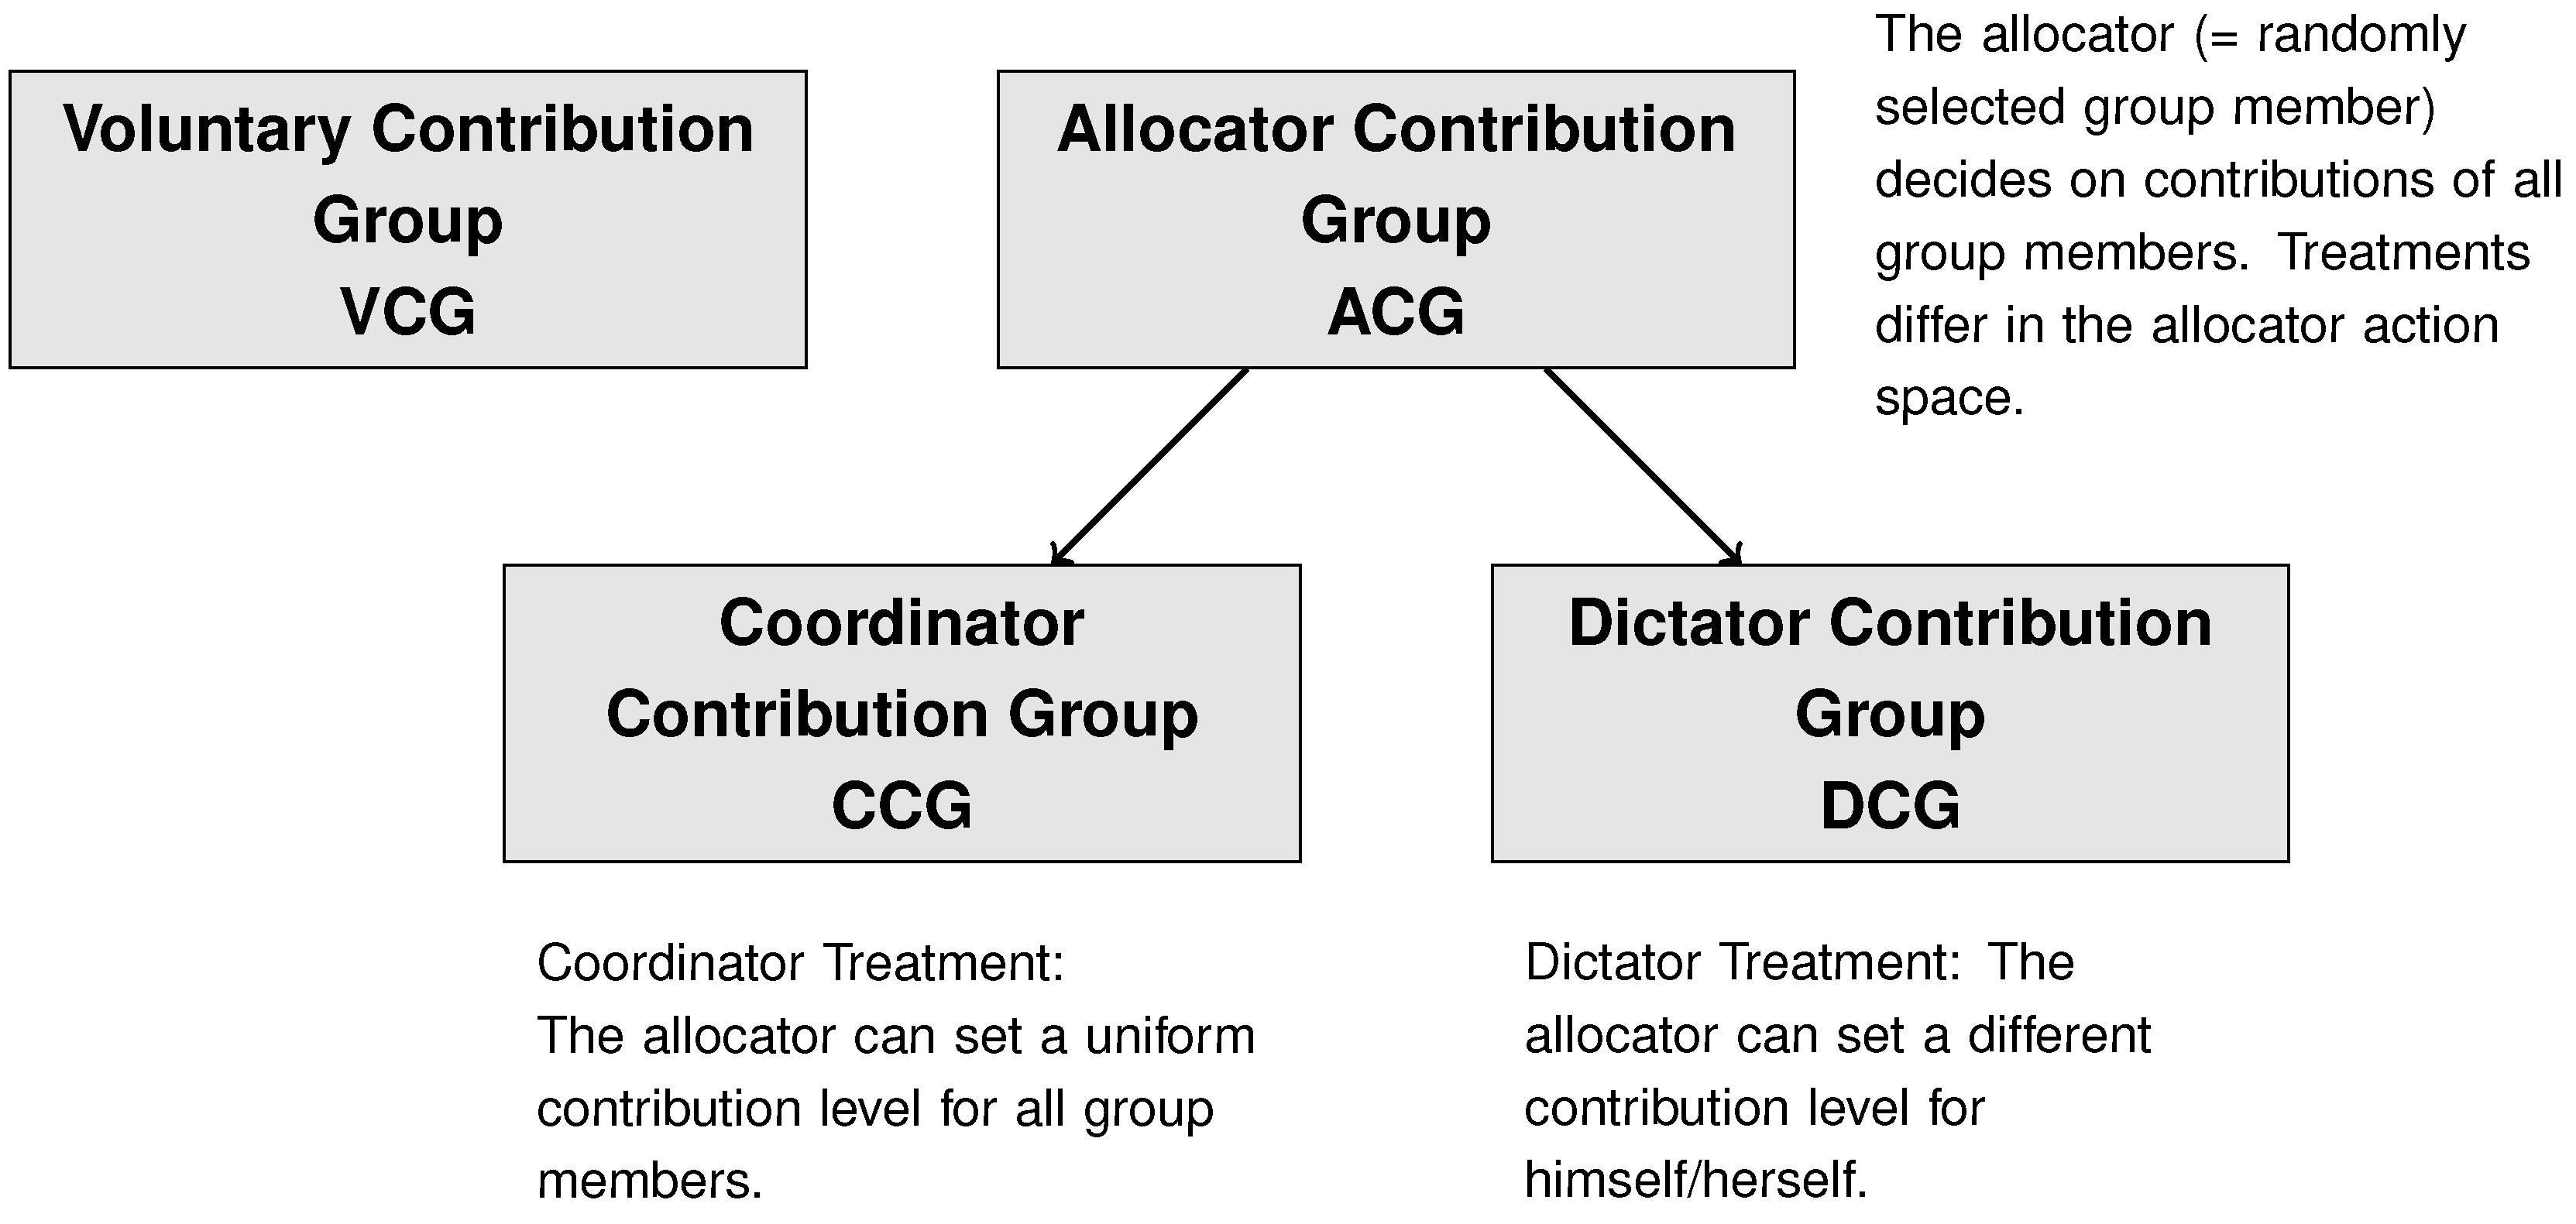
Figure 1.
Treatment design and terminology.
Figure 1.
Treatment design and terminology.
Hamman
et al. [
20] and Bolle and Vogel [
21] implemented the allocator decision in a way that allowed the allocator to set a different contribution for herself than for the other group members. This allows for the rise of “corruption”, which is how we refer to the case where the allocator does not contribute to the public good.
4 Our design expands on this idea by modeling two different types of allocator decision options. We will continue to use “allocator” and ACG as the general terms, but will distinguish between a “coordinator” and a “dictator” treatment in our design. In the former, the coordinator can choose a contribution level, which then applies to all group members, including herself. In the latter, the dictator can choose two contribution levels, one of which applies to all group members excluding herself, while the other applies only to herself. In keeping with the vocabulary just laid out, we will be speaking of two forms of ACGs—the coordinator contribution group (CCG) and the dictator contribution group (DCG).
Figure 1 illustrates this terminology. Finally, we wish to explore the impact of subjects’ social preferences on their behavior in our experiment. For this reason, we elicit their social value orientation using the social value orientation (SVO) slider measure developed by Murphy
et al. [
28].
1.1. Rational Expectations Predictions
To predict the group choice, we have to take a look at the expected contributions and payoffs in each of the two groups. In the VCG, the rationally
5 expected behavior is not to contribute, yielding an expected payoff to every subject equal to her endowment. (This is also the minimax payoff in the VCG.) In the ACGs, there are different predictions for our two treatments. Given that the coordinator can only set one uniform contribution level for all group members, it is immediately apparent that for any
(and assuming
), the profit-maximizing strategy is to set the contribution level equal to the common endowment,
E. The payoff to both the coordinator and the other group members, then, is the payoff from full cooperation:
Given that
and
in our setting, we thus derive the first part of our first hypothesis:
Hypothesis 1a. In the CCG, coordinators always contribute the full endowment.
In the coordinator treatment, the expected payoff as a member of the allocator group is higher
6 than the minimax payoff in the voluntary contribution group, which equals the endowment
E.
7 Under rational expectations, we would therefore expect all subjects to choose the allocator group in the coordinator treatment despite their lack of knowledge, at the time of making the decision, of the subsequently resulting group size. We use this benchmark for the derivation of the second part of our first hypothesis:
Hypothesis 1b. All subjects in the coordinator treatment select into the CCG.
In the dictator treatment, we assert that a rational allocator would set the contribution of all group members equal to their endowments and set a contribution of zero for herself. This yields the following payoffs:
We reflect the incentives induced by this payoff function in the first part of our second hypothesis.
Hypothesis 2a. In the DCG, dictators always contribute nothing themselves and the full endowment for all other group members.
Since every player who joins the DCG has a chance of
to become the dictator, the conditionally expected payoff (assuming full contribution) of joining the DCG, given a group size of
, would be:
where
is the conditional expectations operator assuming equilibrium play (i.e., full contribution in the ACG; no contribution in the VCG). It follows from Equations (
2) and (
4), as well as from our treatment of the special case of a group size of one that
. Thus, even though the resulting group sizes are as yet undetermined when subjects make their group choice, selecting into the VCG is nonetheless a dominant strategy. This is also the case for the worst possible outcome in the DCG when only two subjects join the DCG.
8 This leads to the second part of our second hypothesis:
Hypothesis 2b. All subjects in the dictator treatment select into the DCG.
Despite their theoretical validity, we judge it likely that hypotheses 1a and 1b, as well as hypotheses 2a and 2b will not hold in our experiments. Experimental economists (among others) have shown that people do not behave in an exclusively payoff maximizing manner. In our setting, possible reasons for off-equilibrium behavior include the heterogeneity of social preferences, bounded rationality, salience effects, aversion to risk and/or losses and a dislike of competing per se. Unfortunately, there is a large number of different theories of, e.g., social preferences, such that it is not possible to include all of them with precise predictions. We will therefore formulate some hypotheses regarding expected deviations from perfectly rational behavior based on social value orientation and inequality aversion.
1.2. Social Preference Predictions
Social preference models (and also social value orientation) assume that individuals are not concerned about their own payoff alone, but also about the payoffs to others and the relative sizes of their own and others’ payoffs. One specific form of social preferences is inequality-aversion. Outcome based models of inequality aversion assume that subjects are averse to differences in outcomes (see, e.g., [
29,
30]). This allows us to make a prediction regarding the differences in group choice between the coordinator and dictator treatments. Since no inequality is possible in the CCG, inequality aversion cannot be a cause for subjects choosing the VCG in the coordinator treatment. This is different in our dictator treatment. Here, the dictator can choose different contribution levels for himself and for the other DCG members, thereby increasing his payoff relative to the other group members’. This reduces the utility of inequality-averse subjects and renders the VCG relatively more attractive to them.
9 Since we assume that there likely are such subjects in our subject pool, we reflect this in our next hypothesis:
Hypothesis 3. Subjects are more likely to choose the ACG in the coordinator treatment than in the dictator treatment.
Once we drop the assumption of rational expectations, subjects can be assumed to update their expectations of other participants’ behavior based on their observations of past outcomes. We expect an effect of the amount of the dictator contribution in the previous period on subjects’ group choice in the subsequent period.
Hypothesis 4. Subjects’ likelihood of selecting into the DCG increases in the previous period’s dictator contribution.
As Equation (
3) makes clear, the negative effects of low dictator contributions in the DCG are diluted with increasing group size, since the cost of dictator free riding is jointly borne by more group members. We expect that this dilution effect will make it more likely for dictator treatment subjects to join the DCG when they expect many others to do so.
10 Note, however, that our subjects do not know the group size for the period for which they are currently making their group choice. We conjecture that they will use the group size information from the previous period as a proxy for the current period’s DCG size when forming their expectations of the latter.
11Hypothesis 5. Subjects’ likelihood of selecting into the DCG increases in the previous period’s DCG size.
We also explore the impact of allocators’ social value orientation on their decisions in the experiment. Subjects with a pro-social value orientation not only care about themselves, but also about relevant others (see, e.g., [
31,
32]). On the other hand, pro-self individuals are more interested in their own payoff. Previous experiments show that a pro-social value orientation correlates with cooperative behavior in economic experiments (see, e.g., [
33]).
12 On this basis, we expect pro-social dictators to set a higher contribution level for themselves than do pro-self dictators. In the CCG, pro-social and pro-self coordinators should behave the same way (setting the contribution of everyone equal to the endowment).
Hypothesis 6. Pro-social dictators set their own contribution higher than pro-self dictators.
1.3. Hypotheses about Dynamics
In our final two hypotheses, we explore dynamic behavioral effects, which are not necessarily connected to social preferences. In particular, we expect the previous period’s contribution behavior in the VCG to influence subjects’ group choice. If there are high lagged contributions in the VCG, subjects may be induced to select into this group for two different reasons. First, with high contributions, this group becomes attractive for free riders who want to exploit the contributing members of the VCG. Second, pro-social subjects may be attracted by the high contributions, because they want to participate in the generation of a public good out of their own (and other group members’) free decisions. This conjecture is founded in the work of Sen [
35,
36], who argues that the freedom of choice yields intrinsic value to humans. We summarize this line of reasoning in the following hypothesis:
Hypothesis 7. Subjects’ likelihood of selecting into the VCG increases in the previous period’s average VCG contribution.
Since high contributions in a group generally make this group more attractive, we finally also expect the contribution behavior in the ACG in the previous period to influence subjects’ group choice. This leads to our final hypothesis:
Hypothesis 8. Subjects’ likelihood of selecting into the ACG increases in the previous period’s average ACG contribution.
2. Design and Procedures
Our experiment was part of a larger research program and comprised a total of 11 sessions with 12 subjects each. Sessions 2, 3, 4 and 6 used the coordinator treatment and sessions 7 through 13, the dictator treatment (sessions 1 and 5 used a design that is not the subject of this paper).
13 The experiments were conducted at the Max-Jung laboratory at the University of Graz from April to July, 2012. The participants were recruited from a subject pool consisting mainly of students from the faculty of Social and Economic Sciences. The use of ORSEE [
37] ensured that every subject could only participate in the experiment once. The experiment was programmed and conducted with z-Tree [
38]. All payments were made in Euros, and the conversion rate from experimental currency units to Euros was 25 ECU = 1 EUR. Average earnings were 11.90 EUR, including a show up fee of 2.5 EUR. On average, a session lasted 45 min.
2.1. Treatment Design
Subjects participate in two rounds of ten periods each of a public good game.
14 Before making their contribution decisions, they chose one of two groups to join for the current period. In the coordinator (dictator) treatment, these are the VCG and the CCG (the VCG and the DCG). The choice of group impacts how subjects’ contributions are determined. Furthermore, the earnings for a period depend only on the subjects in the same group. Once every subject has entered her contribution, the payoff for this period is calculated according to Equation (
1). Note that all subjects are informed about the number of subjects in their group at the time of making their contribution decision. At the end of each period, subjects see a results screen, which they can study for a maximum of 60 s (other than for the results screen, there were no time limits anywhere in the experiment). There was no deception involved in the experiment.
2.1.1. Design Features Specific to the Coordinator Treatment
In the coordinator treatment, Equation (
1) applies equally to subjects choosing the VCG and ones choosing the CCG. The difference to the VCG is that in the CCG, one subject is randomly chosen out of all group members to make the contribution decision for the entire group. This coordinator subject enters a contribution, which then applies to all CCG members, including the coordinator herself.
At the end of a period, subjects in the coordinator treatment see a results screen, which informs them about four parameters for each group (VCG and CCG), for the period just completed, as well as for all previous periods. These are (i) the number of subjects in the group, (ii) the average contribution in the group, (iii) the per capita earnings from the public good and (iv) the average ending wealth. In addition to this, they are informed about their personal starting endowment, their contribution, their return from the public good and their ending wealth.
2.1.2. Design Features Specific to the Dictator Treatment
In the dictator treatment, one subject is randomly chosen to assume the role of the dictator, similar to the case of the coordinator just described. However, in the DCG, the dictator subject enters two parameters. The first is the contribution that applies to all group members, except the dictator. The second is the contribution that applies only to the dictator. As indicated in
Section 1, the dictator can, for example, choose to let all other subjects contribute their full endowment of 20 ECU while contributing nothing herself.
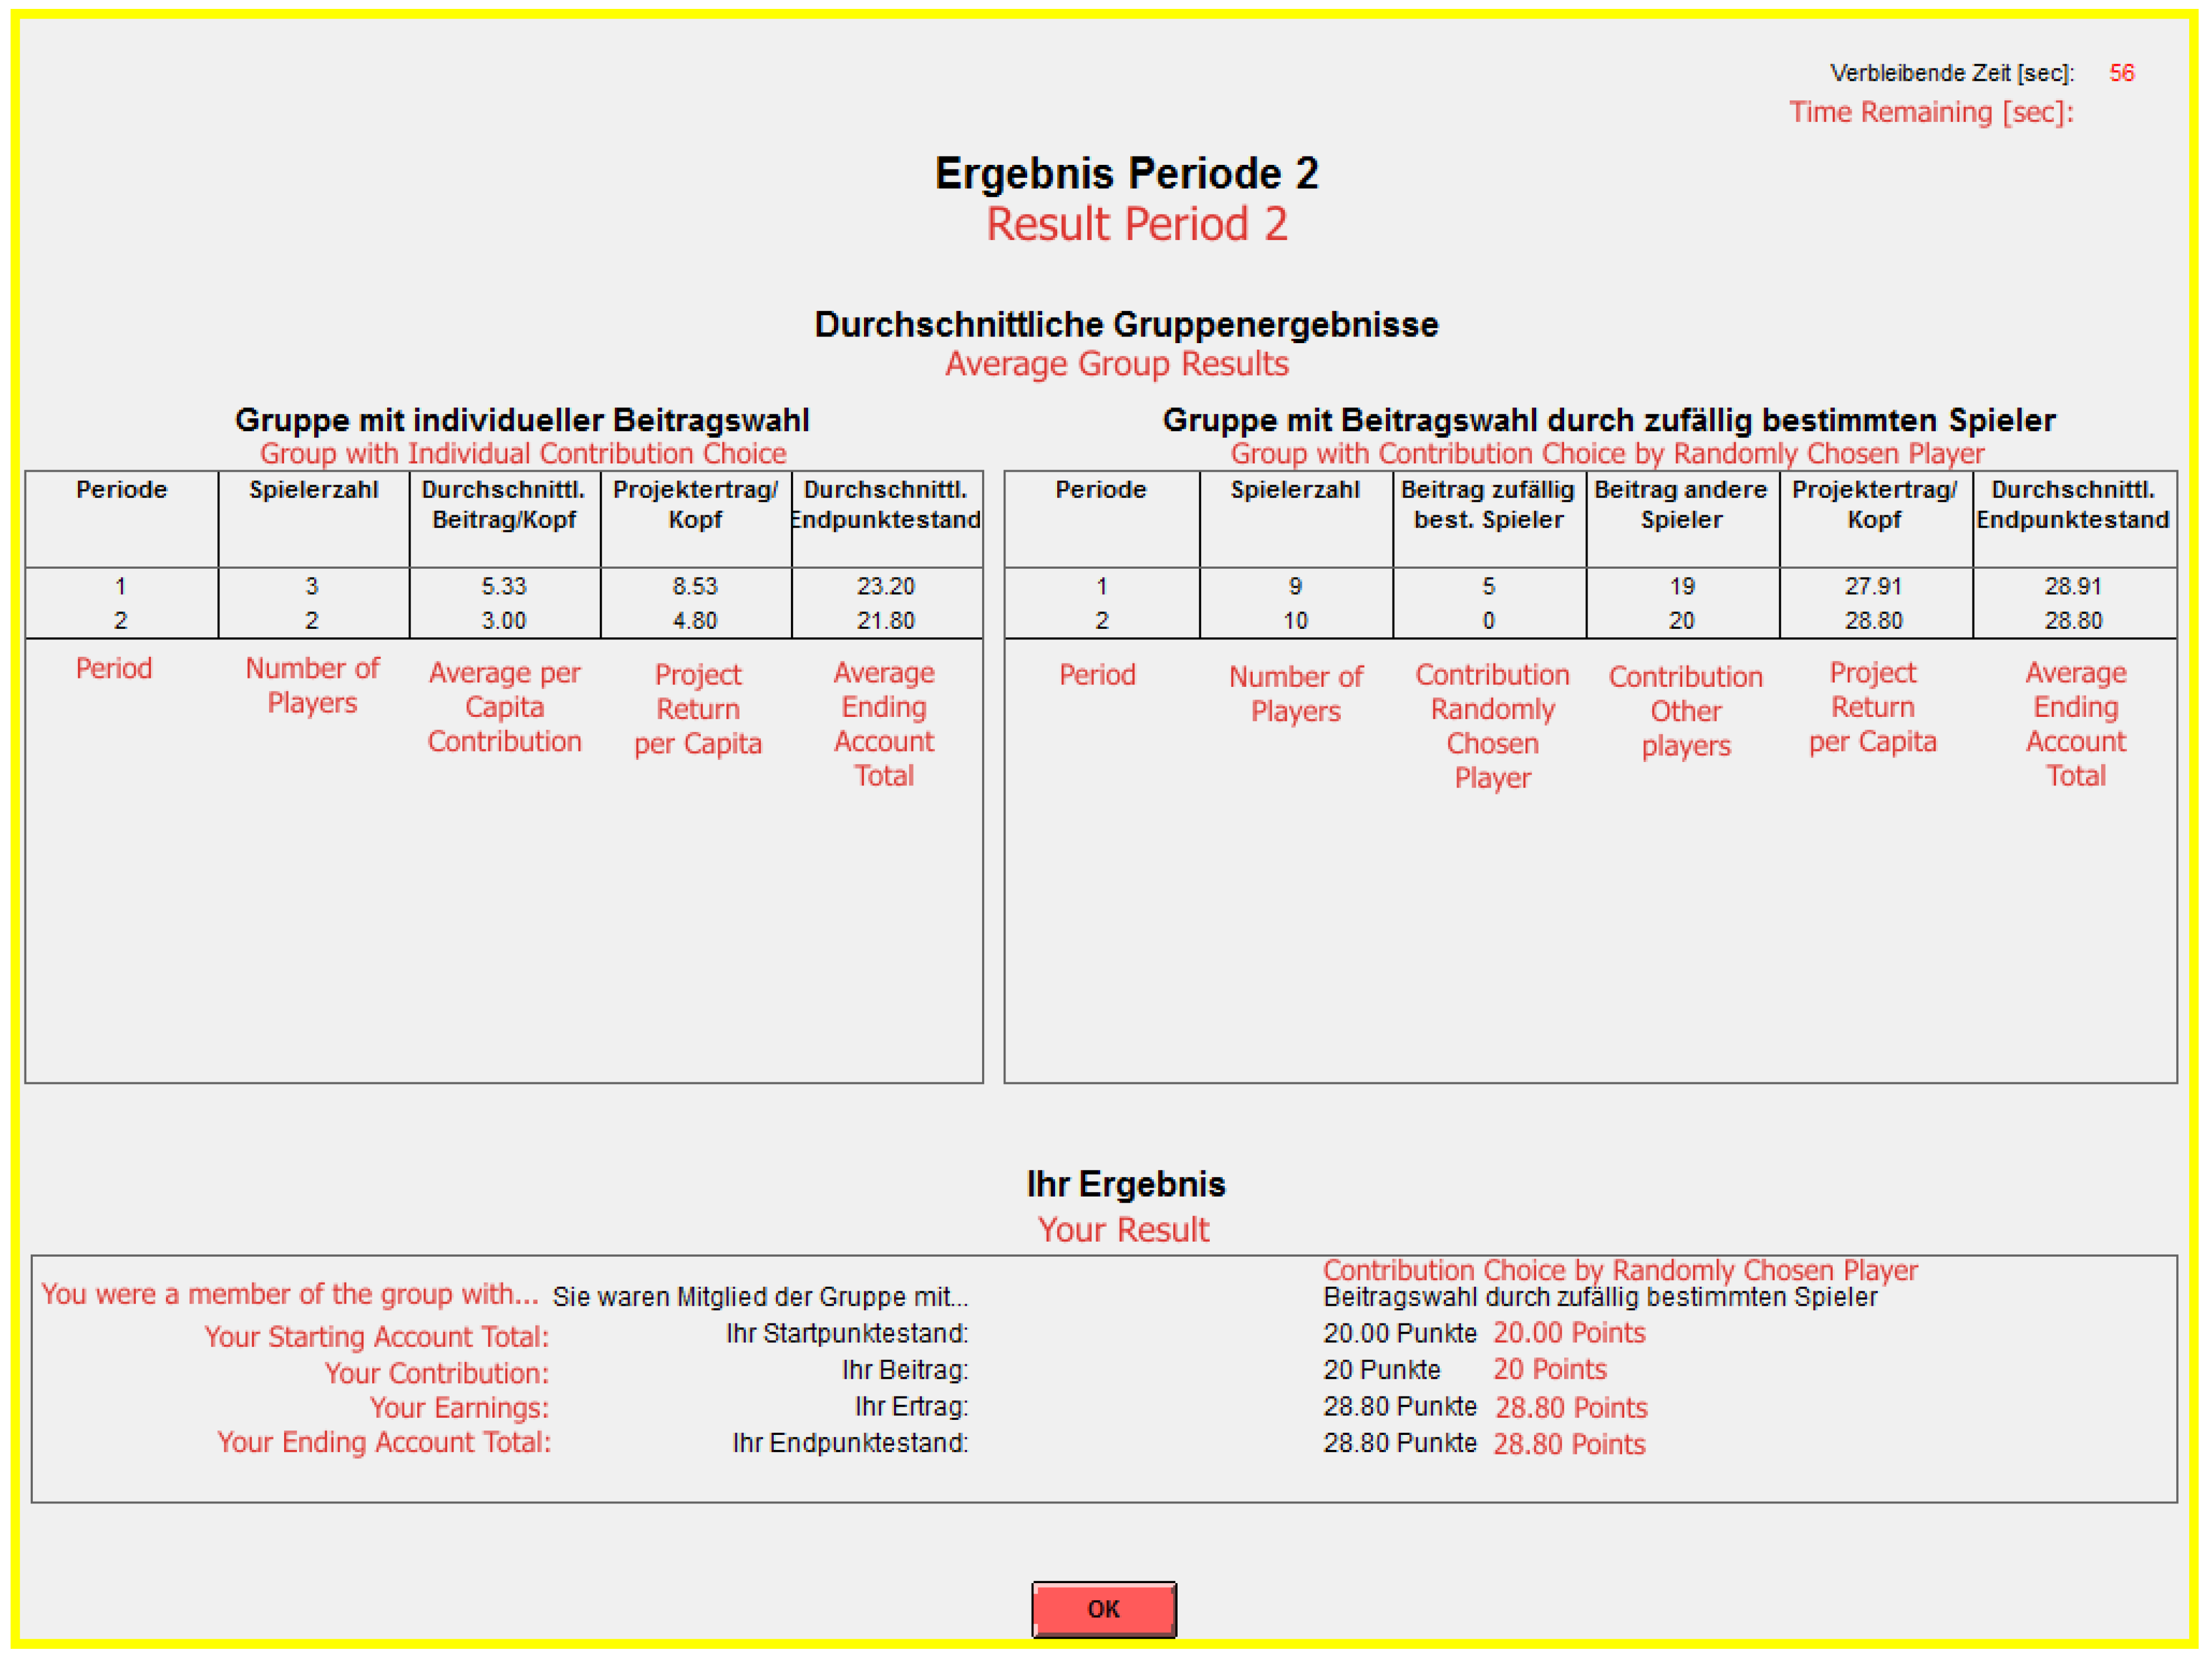
At the end of a period, subjects in the dictator treatment see the results screen displayed in
Figure 2. For the VCG, they learn the same parameters as subjects in the coordinator treatment. For the DCG, they are informed about (i) the number of subjects in the group, (ii) the contribution of the dictator, (iii) the contribution the dictator has chosen for all other DCG members, (iv) the per capita earnings from the public good and (v) the average ending wealth. Furthermore, they also receive information about their own starting endowment, contribution, return from the public good and ending wealth.
Figure 2.
Example dictator treatment results screen. The figure displays an example of the results screen as shown to subjects at the end of each period in the dictator treatment. Text printed in red (grey in greyscale printouts) is a translation of the original German captions.
Figure 2.
Example dictator treatment results screen. The figure displays an example of the results screen as shown to subjects at the end of each period in the dictator treatment. Text printed in red (grey in greyscale printouts) is a translation of the original German captions.
2.2. Session Structure
At the beginning of an experimental session, subjects arrive and wait outside the laboratory. At the designated starting time, subjects are welcomed by the experimenter, draw cards with their computer numbers, are led into the lab and sit down at the workstations corresponding to the numbers on their cards. They there find a printed set of instructions, which the experimenter reads out loud, asking the subjects to read along. After answering any possible remaining questions individually, the experimenter then starts the first round of 10 experimental periods.
In each period, subjects can first choose the group they want to join. If they join the ACG, they then learn whether they have been randomly chosen for the role of the allocator in this period. Following this, coordinator subjects enter the contribution they want every CCG member (including themselves) to make. Dictator subjects enter both a contribution they want to make themselves and a contribution they want their fellow DCG members to make. Subjects in the VCG enter the contribution they want to make. Once all contribution decisions have been entered, a results screen informs subjects of the outcomes of the present and previous periods in the current round. After the first round is over, the experimenter starts the second round, which proceeds analogously to the first. After the second round, one of the two is randomly selected for payoff in order to avoid portfolio effects. This is achieved by letting one of the participants publicly throw a die, the result of which determines the payoff-relevant round for all subjects. Once the experimenter has entered this information into his computer, subjects are informed about their payoffs on their screens.
The experimenter then starts a computerized questionnaire eliciting data on subject demographics and on their experiences and strategies in the experiment. The experimenter furthermore hands out a sheet for the elicitation of the SVO, which he asks every subject to fill in. Subjects who have finished filling in the questionnaire and SVO sheet [
39] step outside the lab to wait until everybody else has also finished. Once this is the case, the experimenter asks subjects to step into the lab one at a time and pays them anonymously.
3. Results
3.1. Summary Statistics
We begin by discussing the summary statistics listed in
Table 1. The first block of three rows already lets us reach a verdict regarding our hypotheses 1b and 2b. A one sample Wilcoxon signed-rank test confirms that the median CCG (DCG) size is significantly different from 12 (both
p-values: 0.000). We can repeat this type of analysis for the second block of three rows in
Table 1 to obtain results for hypotheses 1a and 2a. The median contribution in the CCG is significantly different from 20 (one-sample Wilcoxon signed-rank test
p-value: 0.000). Similarly, we can reject both conjectures in hypothesis 2a: dictators’ median contributions for themselves and for the other DCG members are significantly different from zero and 20, respectively (both one-sample Wilcoxon signed-rank test
p-values: 0.000).
Next, we look at key behavioral patterns in the CCG and the DCG. In the CCG, we observe full contribution by all group members in 85% of all cases. This is a value higher than usually observed in public good games. On the other hand, this means that in 15% of all periods, the coordinator did not choose the full contribution for all members.
15 This is surprising, since full contribution by coordinators maximizes both individual and collective welfare. Possible explanations for this seemingly irrational behavior include antisocial preferences, subject confusion or boredom and the wish to generate an outcome differing from the usual pattern. While we find no correlation between coordinators not fully contributing and their SVO values, thus speaking against the first explanation, further experiments would be needed to determine what is responsible for this inefficiency.
In the DCG, the share of 41% full contributions by all group members is lower than in the CCG. This is of course an effect of our treatment differences, which allowed our dictators to let all other DCG members contribute fully, while themselves free riding. This happened in 26% of the periods. In the remaining periods, we observe other behavioral patterns. In 16% of the periods, the dictator chose full contribution for all other DCG members and contributed an amount larger than zero, but smaller than the endowment herself. In 17% of the periods, the dictator chose a contribution lower than the endowment for the other DCG members.
Table 1.
Descriptive statistics. The table shows summary statistics for the coordinator (C) and dictator (D) treatments, separately for the voluntary contribution groups (VCG) and the allocator contribution groups (coordinator contribution group (CCG); and dictator contribution group (DCG)). Note that in the case where we report on the contributions for the first and the last period in the ACGs, the sample size is rather small, with seven observations for the DCG and four observations for the CCG.
| Group | VCG (C) | VCG (D) | CCG | DCG |
|---|
| Round | 1 | 2 | 1 | 2 | 1 | 2 | 1 | 2 |
|---|
| Average group size n | 2.6 | 1.98 | 2.91 | 1.8 | 9.4 | 10.03 | 9.09 | 10.20 |
| Average contribution | 8.59 | 6.84 | 6.97 | 6.65 | 18.00 | 18.98 | 17.39 | 18.50 |
| Average dictator contribution | | | | | 10.40 | 10.22 |
| Average group member contribution | | | | | 18.26 | 19.40 |
| Average contribution period 1 | 7.88 | 5.23 | 6.90 | 5.36 | 20.00 | 13.71 | 14.93 | 16.51 |
| Average contribution period 10 | 3.43 | 10.00 | 5.62 | 4.75 | 19.41 | 20.00 | 17.86 | 18.08 |
| % zero contribution period 1 | 6.30 | 38.5 | 5.00 | 27.30 | 0.00 | 31.40 | 2.30 | 0.00 |
| % zero contribution period 10 | 57.10 | 0.00 | 38.50 | 50.00 | 0.00 | 0.00 | 2.80 | 3.30 |
| % full contribution period 1 | 12.50 | 7.70 | 10.00 | 9.10 | 100.00 | 68.60 | 63.60 | 50.80 |
| % full contribution period 1 | 14.30 | 0.00 | 7.70 | 8.30 | 80.50 | 100.00 | 83.10 | 75.00 |
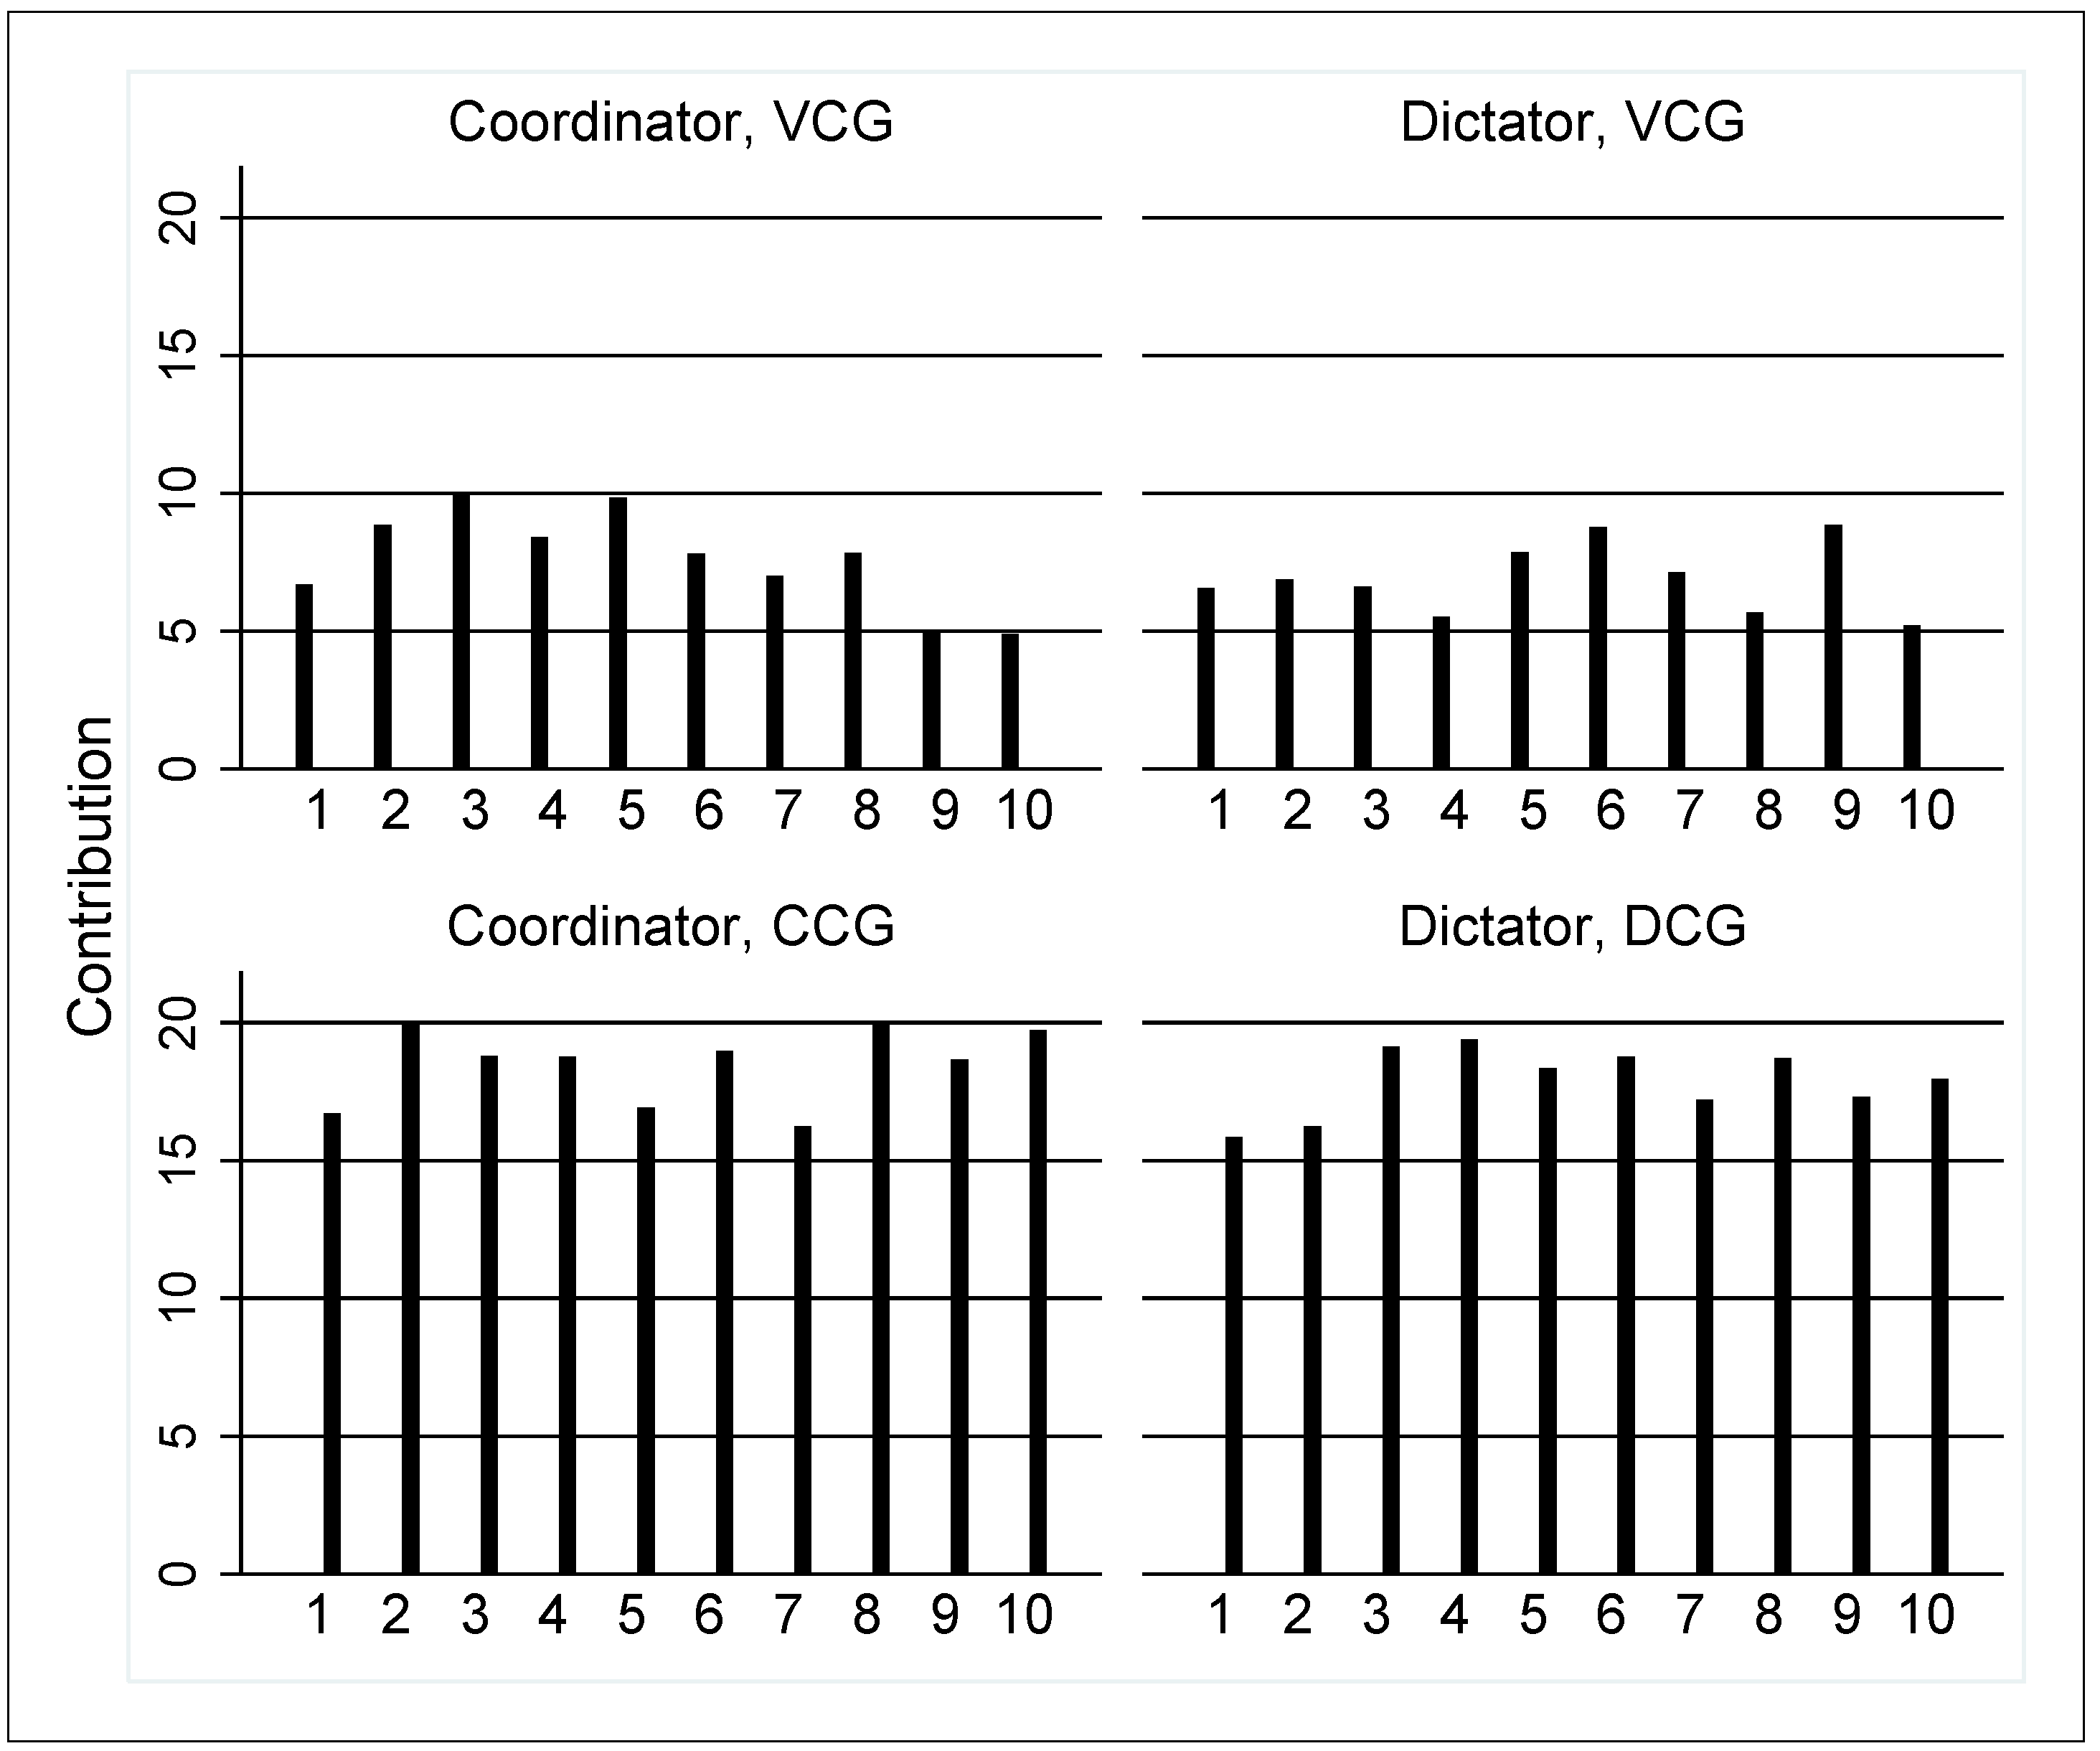
Figure 3.
Contributions. Mean period contributions by treatment and group. The data of rounds 1 and 2 are pooled.
Figure 3.
Contributions. Mean period contributions by treatment and group. The data of rounds 1 and 2 are pooled.
Figure 3 shows the mean contributions for both groups and both treatments. The observed behavioral patterns result in significantly higher contributions in both the DCG and the CCG than in the VCG (both two-sided Wilcoxon rank-sum test
p-values: 0.000). As shown in
Table 1, we observe a median contribution of 20 for the first and the last periods of both rounds in both the CCG and the DCG. On the other hand, we observe median contributions between zero and ten in the VCG in both treatments.
3.2. Group Choice
We continue our analysis with the average group sizes and their development over time.
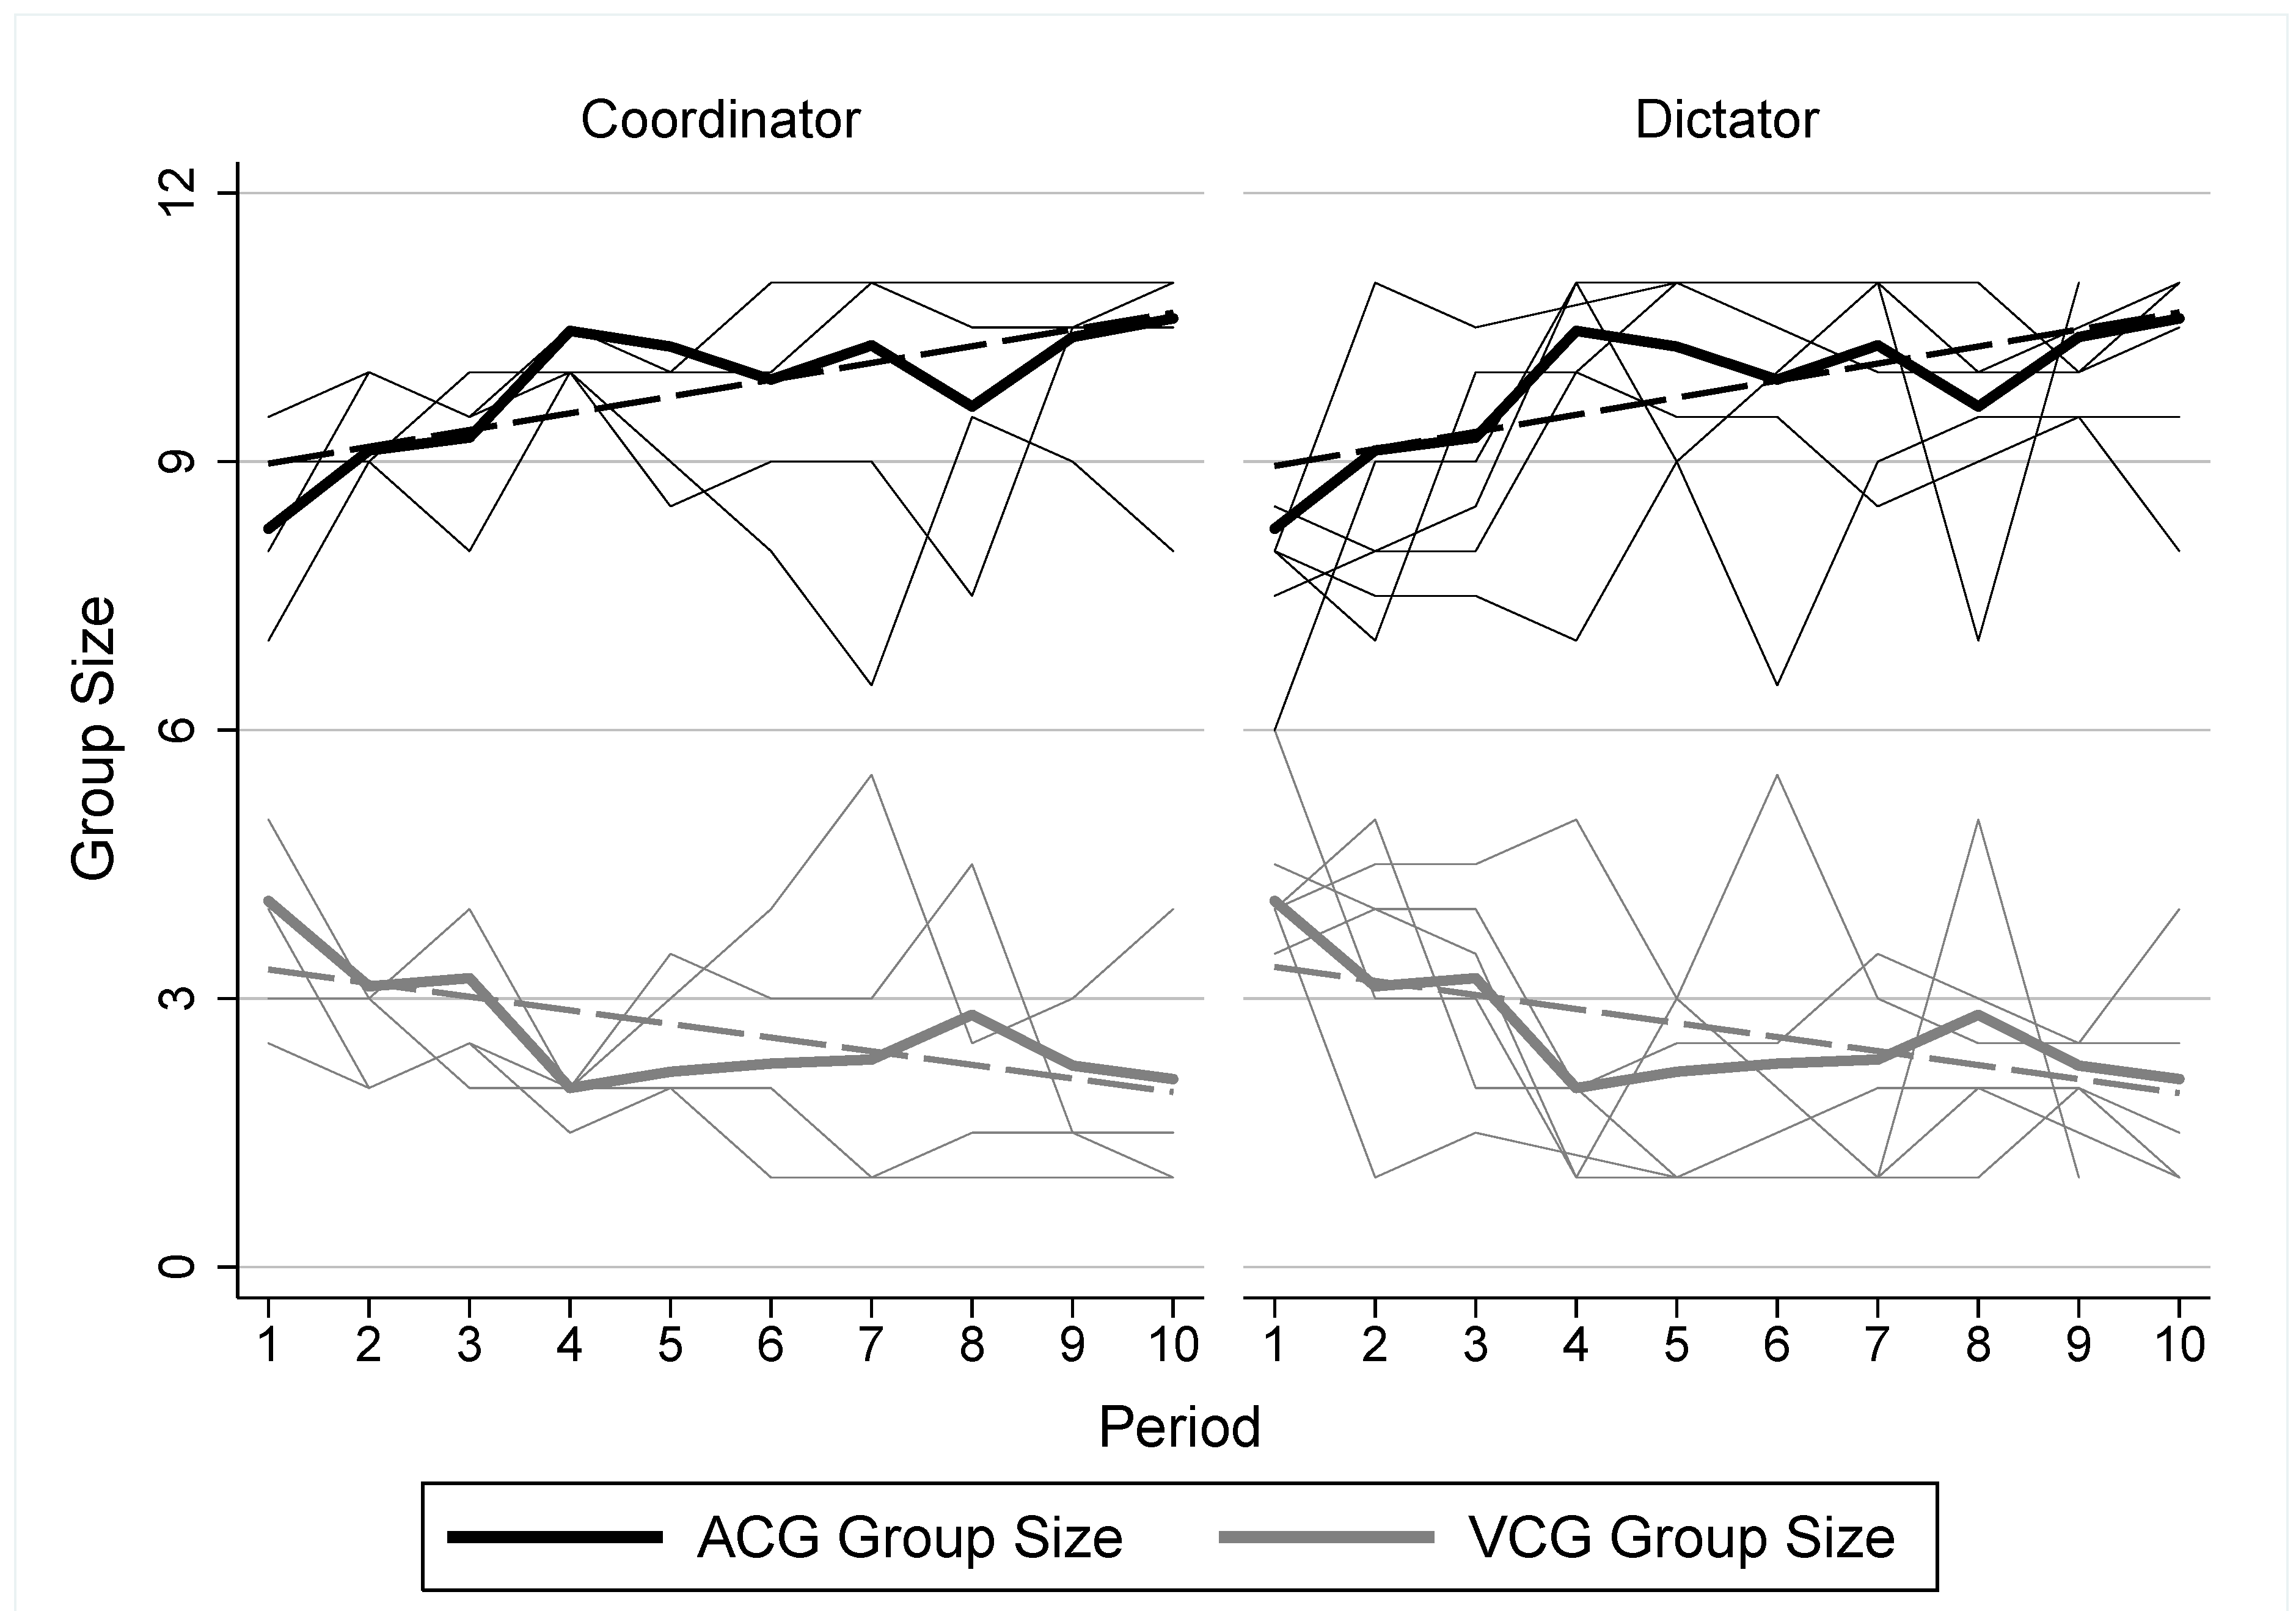
Figure 4 shows that the average group size of the allocator group starts at a very high level and, over time, increases even further in both treatments. Consequently, only a few subjects join the VCG.
Figure 4.
Overall trend in average group size over time in the two treatments. The figure displays the average group size in each of the ten periods separately for the dictator and the coordinator treatments. The data of rounds 1 and 2 are pooled. The dashed lines are linear predictions. The thin lines are average group sizes in individual sessions.
Next, we conduct a regression analysis of the aggregate data, which is presented in
Table 2. In the models (which we fit individually for each treatment), we control for the round, the period and the interaction between the two, allowing the slope of the periods to vary between rounds. We also include previous period data on the average size of, and the average contribution in, the ACG.
Table 2.
Group size. The table shows the results of OLS regressions of the CCG and DCG group sizes on a number of regressors. Round is 1 (2) in the first (second) of the two 10-period sequences. Period2 equals the period number Period in round 2 and zero otherwise. The remaining variables are the lagged average contributions in the ACG and the lagged ACG group size (of the DCG in the regression of the dictator treatment, of the CCG in the analysis of the coordinator treatment) and the lagged contribution of the dictator in the DCG.
| | Model 1 | Model 2 |
|---|
| Regressors | CCG Group Size | DCG Group Size |
|---|
| Round | 0.098 (0.538) | 0.690 (0.516) |
| Period | 0.069 (0.071) | 0.060 (0.056) |
| Period2 | 0.041 (0.104) | −0.078 (0.069) |
| Lagged Average Contribution in ACG | 0.103 (0.016) *** | 0.089 (0.034) ** |
| Lagged Dictator Contribution in DCG | | 0.033 (0.014) * |
| Lagged Group Size in ACG | 0.287 (0.157) | 0.393 (0.059) *** |
| Constant | 4.537 (0.937) ** | 2.942 (0.889) ** |
| R | 0.30 | 0.37 |
| Adjusted R | 0.25 | 0.34 |
| N | 72 | 117 |
Our results show that the time effect visible in
Figure 4 is not significant in either treatment when controlling for the variables that were identified as relevant in our hypotheses in
Section 1. Models 1 and 2 share one statistically significant effect: a larger average ACG contribution in the previous round results in a larger current ACG group size, supporting our hypothesis 8. It also implies that when the allocator contributes relatively little, the group size of the VCG increases in the following period. Furthermore, for the dictator treatment only, we find a significant effect of the DCG group size in the previous period. This provides support for the presence of the dilution effect, as conjectured in hypothesis 5. Finally, we find a significant effect of the dictator contribution in the previous period on the DCG group size (hypothesis 4).
16We continue our analysis by investigating individual subjects’ group choice behavior using Probit models.
17 Table 3 presents the two regression models we believe best reflect the structural relationships in our data. In Model 3, we include the Round and Period variables, a treatment dummy and a variable containing our subjects’ social value orientation as measured using the instrument defined in Murphy
et al. [
28]. Higher values of the SVO measure indicate a greater willingness to give up own income to benefit others. We also include an interaction of SVO with the treatment dummy, as well as variables containing information on the previous period’s average contributions in the VCG and ACG (AvgContribVCG_L and AvgContribACG_L) and on the size of the ACG (and, separately, for the DCG) in the previous period (GroupSizeACG_L and GroupSizeACG_L_x_Dictator).
Table 3.
Determinants of allocator group choice. The table shows the results of Probit regressions of IsACG on a number of regressors. IsACG is a dummy equal to zero (one) if the subject chooses the VCG (ACG) in a period. Dictator is a dummy variable equal to zero (one) in the coordinator (dictator) treatment. Round is 1 (2) in the first (second) of the two 10-period sequences. Period2 equals the period number Period in round 2 and zero otherwise. SVO is the social value orientation of the subjects, measured using the slider-measure from Murphy et al. (2011), and SVO_x_Dictator is SVO interacted with Dictator. The remaining variables are the lagged average contributions in the ACG and VCG, the lagged ACG group size (pooled and in the dictator treatment only) and the lagged contribution of the dictator in the dictator treatment (note that the model that includes this variable solely uses dictator treatment data). Logit estimation and logit panel regression yield similar results. Robustness checks, where we include various questionnaire response items and interaction terms, yield no clear effects from the control variables, but leave the main effects unchanged.
| Regressors | Model 3 | Model 4 |
|---|
| Subsample | All cases | Dictator treatment |
|---|
| Dictator | −1.284 (0.679) * | |
| Round | −0.127 (0.187) | −0.012 (0.303) |
| Period | 0.000 (0.017) | 0.008 (0.026) |
| Period2 | 0.026 (0.027) | 0.010 (0.041) |
| SVO | −0.010 (0.011) | |
| SVO_x_Dictator | 0.020 (0.015) | 0.010 (0.010) |
| AvgContribACG_L | 0.030 (0.008) *** | 0.024 (0.011) ** |
| AvgContribVCG_L | −0.046 (0.012) *** | −0.038 (0.012) *** |
| GroupSizeACG_L | 0.044 (0.061) | |
| GroupSizeACG_L_x_Dictator | 0.085 (0.066) | 0.119 (0.038) *** |
| DictContrib_L | | 0.009 (0.007) |
| Constant | 0.661 (0.594) | −0.750 (0.475) |
| Pseudo R | 0.04 | 0.04 |
| N | 1,358 | 746 |
As predicted in hypothesis 3, we find a negative treatment effect. Subjects are less likely to join the ACG in the dictator treatment. Our model also shows that the likelihood of a subject selecting into the ACG as opposed to the VCG increases in the average contribution in the ACG in the previous period, thus lending further support to our hypothesis 8. Conversely, higher contributions in the VCG in the previous period decrease the likelihood of subjects joining the ACG. This result supports hypothesis 7. We also find that greater social value orientation of a subject cannot be shown to play a role.
18 Finally, the results do not yield any evidence of subjects being more likely to select into the ACG in later periods or in the second round.
Model 4 differs from Model 3 in that it uses only the dictator treatment data and contains the amount of the previous period’s dictator contribution as an additional variable. We find a statistically significant effect of the lagged size of the DCG, but not the ACG in general, lending further support to the dilution effect of hypothesis 5. Model 4 also shows a significant effect of the lagged average contribution in the DCG, but none of the lagged dictator contribution. Hypothesis 4 does not receive support from this result. The average contribution in the VCG in the previous period shows a highly significant negative coefficient, again, in line with our hypothesis 7. Just as in the pooled analysis, there appears not to be a material effect of SVO on group choice.
Table 4.
Determinants of dictator contribution choice. The table shows the results of an OLS regression of the dictator’s own contribution on a number of regressors. Round is 1 (2) in the first (second) of the two 10-period sequences. Period2 equals the period number Period in round 2 and zero otherwise. SVO is the social value orientation of the dictator, measured using the slider-measure from Murphy
et al. [
28]. The remaining variables are the lagged average contribution in the DCG, the concurrent DCG group size and the lagged dictator contribution. The inclusion of the lagged variables leads to the exclusion of the observations from period 1 in rounds 1 and 2. Tobit regression censored at zero and 20 yields similar results. Robustness checks, where we include various questionnaire response items and interaction terms, yield no clear effects from the control variables, but leave the main effects unchanged.
Table 4.
Determinants of dictator contribution choice. The table shows the results of an OLS regression of the dictator’s own contribution on a number of regressors. Round is 1 (2) in the first (second) of the two 10-period sequences. Period2 equals the period number Period in round 2 and zero otherwise. SVO is the social value orientation of the dictator, measured using the slider-measure from Murphy et al. [28]. The remaining variables are the lagged average contribution in the DCG, the concurrent DCG group size and the lagged dictator contribution. The inclusion of the lagged variables leads to the exclusion of the observations from period 1 in rounds 1 and 2. Tobit regression censored at zero and 20 yields similar results. Robustness checks, where we include various questionnaire response items and interaction terms, yield no clear effects from the control variables, but leave the main effects unchanged.
| Regressors | Model 5 |
|---|
| Round | −2.225 (4.214) |
| Period | −0.691 (0.454) |
| Period2 | 0.417 (0.632) |
| AvgContribDCG_L | −0.159 (0.266) |
| GroupSizeDCG | 0.736 (0.486) |
| DictatorContribution_L | 0.325 (0.104) *** |
| SVO | 0.127 (0.060) ** |
| Constant | 5.132 (7.438) |
| R | 0.23 |
| Adj. R | 0.17 |
| N | 107 |
3.3. Contributions
We next focus on dictators’ contribution behavior in the DCG.
Table 4 contains our OLS regression results for the dictator’s own contribution (Model 5). We control for a time trend, the lagged contributions, the group size of the ACG, the lagged dictator contribution and SVO. First, this is the only instance where we detect a significant influence of SVO—in this case, the SVO of the dictator subject—on experimental behavior. This lends support to our hypothesis 6. Second, the dictator’s own contribution increases in the previous period’s dictator contribution.
4. Discussion and Conclusion
The experimental literature on mechanisms fostering cooperation in dilemmas has lately predominantly focused on the effectiveness of punishment and reward. Recent work by Hamman
et al. [
20] and Bolle and Vogel [
21] has extended this field to encompass inequalities in the power over one’s own and others’ decisions. Such asymmetries in the decision-making powers of economic actors are a frequent and important phenomenon outside the laboratory and, as such, merit careful analysis.
Table 5.
Overview of hypotheses and results. The table shows all hypotheses derived in
Section 1 and the corresponding results from
Section 3.
Table 5.
Overview of hypotheses and results. The table shows all hypotheses derived in Section 1 and the corresponding results from Section 3.
| No. | Statement | Result |
|---|
| 1a | In the CCG, coordinators always contribute the full endowment. | Rejected; only in 85% of cases |
| 1b | All subjects in the coordinator treatment select into the CCG. | Rejected; median group size significantly smaller than 12 |
| 2a | In the DCG, dictators always contribute nothing themselves and the full endowment for others. | Rejected; only in 26% of cases |
| 2b | All subjects in the dictator treatment select into the DCG. | Rejected; median group size significantly smaller than 12 |
| 3 | Subjects are more likely to choose the CCG than they are to choose the DCG. | Supported; see Model 3 in Table 3 |
| 4 | Subjects’ likelihood of selecting into the DCG increases in the previous period’s dictator contribution. | Not supported; see Model 4 in Table 3 |
| 5 | Subjects’ likelihood of selecting into the DCG increases in the previous period’s DCG size. | Supported; see Models 2 and 4 in Table 2 and Table 3, respectively |
| 6 | Pro-social dictators set their own contribution higher than pro-self dictators. | Supported; see Model 5 in Table 4 |
| 7 | Subjects’ likelihood of selecting into the VCG increases in the previous period’s average VCG contribution. | Supported; see Models 3 and 4 in Table 3 |
| 8 | Subjects’ likelihood of selecting into the ACG increases in the previous period’s average ACG contribution. | Supported; see Models 1 and 2 in Table 2 and Models 3 and 4 in Table 3 |
Hamman
et al. [
20] and Bolle and Vogel [
21] demonstrate the possible efficiency gains from centralized decision-making in the provision of a public good. We extend their research by analyzing allocator mechanisms with different action spaces. We also implement direct competition between different contribution mechanisms by allowing for endogenous group choice and investigate to what extent social preferences drive contribution and group choice behavior. We find that the vast majority of our subjects is willing to cede decision authority to a central planner in order to reap efficiency gains from improved coordination.
19 We consider this result of great importance, since it clearly shows that human subjects are willing to submit to a randomly selected centralized authority if it leads to higher (expected) average payoffs. This is true both in a setting enforcing equality in payoffs and in one where the subject endowed with decision authority for the entire group can exploit this power to maximize her own payoffs at the expense of her team members’. Nonetheless, subjects are more likely to select into the allocator group in the first than in the second setting, and we investigate the factors driving this decision. Our data shows that subjects condition their group choice on historical group sizes and contribution behavior. Finally, we find that an allocator’s social value orientation plays a role in her contribution choice in the setting where she has the option to exploit her fellow group members.
We summarize our findings in
Table 5. Overall, they show that the allocator mechanism is not only more successful in establishing high contributions than a voluntary contribution scheme, but also wins out in a direct competition. We believe that these encouraging results merit further research into allocator contribution mechanisms for the provision of public goods and the accompanying power asymmetries.

