Article

Social Learning Strategies and Cooperative Behaviour: Evidence of Payoff Bias, but Not Prestige or Conformity, in a Social Dilemma Game

by
Robin Watson
1,2,*,
Thomas J. H. Morgan
3,4,
Rachel L. Kendal
1,2,
Julie Van de Vyver
5 and
Jeremy Kendal
1,2,6,*
1
Durham Cultural Evolution Research Centre, Anthropology Department, Durham DH1 3LE, UK
2
Department of Anthropology, Durham University, Dawson Building, South Road, Durham DH1 3LE, UK
3
School of Human Evolution and Social Change, Arizona State University, 900 South Cady Mall, Tempe, AZ 85287, USA
4
Institute of Human Origins, Arizona State University, 951 South Cady Mall, Tempe, AZ 85287, USA
5
Psychology Department, Durham University, Upper Mountjoy, South Road, Durham DH1 3LE, UK
6
Durham Research Methods Centre, Faculty of Social Sciences & Health Arthur Holmes Building, Durham University, Durham DH1 3LE, UK
*
Authors to whom correspondence should be addressed.
Games 2021, 12(4), 89; https://doi.org/10.3390/g12040089
Submission received: 18 October 2021 / Revised: 14 November 2021 / Accepted: 21 November 2021 / Published: 23 November 2021
(This article belongs to the Special Issue Social Learning and Cultural Evolution)

Abstract

:
Human cooperation, occurring without reciprocation and between unrelated individuals in large populations, represents an evolutionary puzzle. One potential explanation is that cooperative behaviour may be transmitted between individuals via social learning. Using an online social dilemma experiment, we find evidence that participants’ contributions were more consistent with payoff-biased transmission than prestige-biased transmission or conformity. We also found some evidence for lower cooperation (i) when exposed to social information about peer cooperation levels than without such information, and (ii) in the prisoners’ dilemma game compared to the snowdrift game. A simulation model established that the observed cooperation was more likely to be caused by participants’ general propensity to cooperate than by the effect of social learning strategies employed within the experiment, but that this cooperative propensity could be reduced through selection. Overall, our results support previous experimental evidence indicating the role of payoff-biased transmission in explaining cooperative behaviour, but we find that this effect was small and was overwhelmed by participants’ general propensity for cooperation.

1. Introduction

The spread of behaviour that benefits others is difficult to explain through natural selection, as such behaviour risks exploitation from others [1]. Scenarios where prosocial behaviours can be exploited by others are termed social dilemmas [2]. Classic mechanisms to maintain cooperation include kin selection [3], punishment of non-cooperators [4] and reciprocity [5]. Given this, human cooperation is especially surprising because it occurs between unrelated individuals and is often unreciprocated [6,7]. Laboratory studies (usually from WEIRD samples but see [8]) also show that individuals often cooperate at higher levels than would be predicted by game theory [9].
Forms of cooperation may be culturally transmitted within or across social groups through social learning [10,11]. Through social learning, individuals acquire traits or information by observing or interacting with other individuals or the products of their behaviour [12]. Social learning allows individuals to obtain adaptive traits that are difficult to acquire asocially but can also result in the spread of outdated or maladaptive information [13,14]. For this reason, complete reliance on social learning is unlikely to be adaptive [15,16]. Instead, scholars have suggested that selection should favour strategic use of social learning via strategies that influence when, what and from whom individuals socially learn [17,18]. Three strategies have received particular attention: payoff biased transmission (copy traits that yield a high payoff; [16], henceforth payoff bias); conformity (disproportionate propensity to copy common traits; [19]); and prestige biased transmission (copy individuals of high status; [20], henceforth prestige bias). Kendal et al. [21] review evidence for contexts in which these strategies are used, either individually or in combination.
Given that both cooperation and social learning are thought to underpin the massive habitat expansion and the evolution of complex cultural systems characteristic of our species [22,23], it is perhaps surprising that relatively few studies have addressed how they interact. Conformity may be able to sustain cooperation when combined with punishment [24] or when cooperation is already common [25]. In the lab, participants conformed to an external group’s donations [26] or cooperated with a previously cooperative partner [27] but direct reciprocity was an overall stronger influence on behaviour. Henrich and Gil-White [20] suggest that in prestige bias, followers grant voluntary deference towards leaders in exchange for learning opportunities. This could incentivise copying of cooperation among followers and increased cooperation from leaders [28]. Models suggest that prestige can maintain cooperation in a larger range of scenarios than other social learning strategies [28,29,30]. In the lab, participants have exhibited a bias to copy large contributions made by leaders [31]. Furthermore, prosocial leaders (measured by a questionnaire) elicited greater cooperation from their group than selfish leaders and used punishment less than traditional peer sanctioning groups [32]. Likewise, experimental and ethnographic studies suggest that leader fairness and charisma can positively affect cooperation [33]. There is evidence in strictly hierarchical institutions that team performance and information flow is correlated with the degree of informal prestige conferred upon leaders [34,35] although, contrary to common marketing strategy, there is also evidence that real-life cooperative behaviours are not highly influenced by celebrity endorsement [36,37]. Formal status or rank has received little attention, although one social dilemma experiment found participants labelled with stars (indicating a superior quiz performance) were copied more than those without stars [38].
Because payoff-biased social learning results in the adoption of traits proportional to their relative fitness, as formalised in the replicator equation [39,40], it would be expected to spread selfish behaviour. An experimental study showed that participants exhibited a bias to copy their more successful neighbours and reduce their cooperative contributions to a public good [41]. Further experimental evidence suggests that participants are more likely to exhibit a payoff bias than conformity in a cooperation game and reduce their contributions [42,43] and also decrease their contributions when reminded how their behaviour was benefiting others [44]. A recent analysis of 237 PGGs also showed that declines in contributions were most consistent with improving personal payoffs [45]. Furthermore, cooperation was also higher when participants had no information on the behaviour of their group mates [46]. However, payoff biased learning may not be detrimental for cooperation in all cases, for example when defection is less rewarding [47] or when group migration and punishment is possible [48]. Generally, it results in the decline of cooperative behaviour and is the information that is preferentially attended to.
While strategic defection can maximise payoff, the pattern of results points towards payoff biased social learning being the preferred strategy adopted by participants in social dilemmas. While conformity can increase cooperation in some contexts, it appears to be the weakest cue when compared with other social learning strategies [29,42,43]. Prestige (specifically, high status) biased social learning is comparatively understudied in cooperative dilemmas but is predicted to sustain cooperation in a wide array of circumstances [28,30]. Because no experimental study has considered all three strategies simultaneously in a cooperative context, this is the primary aim of our study.
The evolution of cooperation can also be affected by the payoff structure of the social dilemma. Typically, cooperation games assume a prisoner’s dilemma (PD) payoff structure (see Table 1), where game theory always predicts defection as the rational choice [49]. An alternative is the snowdrift game (SD, see Table 1 for payoff structure), also sometimes referred to as the chicken game or the hawk-dove game [50]. Whereas models based on the PD predict defection as the evolutionarily stable strategy [51], SD games predict stable populations of both cooperators and defectors [52,53]. This is because, in the SD game, exploited cooperators still outperform exploited defectors and so cooperation is favoured when defection is common. To clarify, the production of enzymes in the environment by yeast and bacteria equates to a SD game as enzyme producers benefit from their enzyme production as much as defectors. As predicted, while many cells defect by abstaining from enzyme production and freeride on neighbouring cells, the production of enzymes is not extinguished [54,55].
There are fewer experimental studies using the SD game than the PD game, perhaps because the evolution of cooperation is a harder problem in the latter. Nonetheless, both scenarios can be seen in the real world. For example, climate issues are commonly seen as a PD game or dilemmas of collective action [56], whereas scenarios like constructing communal flood defences or watching for predators are more akin to SD games. One experimental study comparing an iterated binary PD with a SD game found higher cooperation in the SD game [57]. Similar patterns have also been found in other experiments, often using one-shot binary decision games [58,59,60]. Payoff structure also affects the spatial patterns by which cooperation is predicted to evolve, where localised clusters and dendritic spines of cooperators form in models of PD and SD games, respectively [50].
Despite these patterns in findings, comparatively little is known about the dynamics of the SD game compared with the PD. While there are many examples of PD models which consider cooperation on a continuum [61], few have considered SD games along these lines [62,63,64,65]. Exact payoff structures vary slightly, but they each follow the characteristic hierarchy shown in Table 1 and described by Doebeli and Hauert [50]. Typical findings in such models are a convergence towards contributions of around 50%. No experiments have considered iterated continuous SD games in a group context or alongside social learning, so addressing this limitation is the second aim of this study.

Research Questions

Our experiment addresses several key gaps in previous research. Rather than forcing participants to adopt a particular social learning strategy across experimental conditions, we adopt a more naturalistic approach by permitting participants free access to the information required for all three (prestige, conformity, and payoff bias) of the major social learning strategies in a cooperative game. We then use statistical models to infer which social learning strategies were used. We compare both the PD and SD games played across 6 rounds in groups of 4. Each round, participants could contribute between 0 and 10 units to a pot which was doubled and split between all participants. In the SD game, participants received no points for the round if the total did not reach 10. This allows a comparison of cooperation rates and social learning strategy use between games beyond a one-shot context and allows participants to express differing degrees of cooperation. To this end, our experiment employs a between participants 2 (social versus asocial) × 2 (PD versus SD) factorial design with a PD and SD condition alongside asocial (no access to social information) and social learning (access to social information) conditions. This experiment addressed 4 research questions (RQ) (Appendix A).
  • How do social learning strategies influence cooperative behaviour?
    1a.
    Which social learning strategies, if any, do participants use?—We predict that payoff biased learning will have the strongest influence on cooperative behaviour [45] followed by prestige and then conformity [38,42,43].
    1b.
    Are the patterns of social learning strategies consistent across the PD and SD game?—Due to a lack of prior studies, we make no predictions over the direction of the interaction between social learning strategy use and payoff structure.
  • What effect does payoff structure have on cooperative behaviour?—We predict higher cooperation in the SD game than the PD [50,57].
  • What effect does access to social information have on cooperative behaviour? We predict lower cooperation with access to social information than when individuals make decisions asocially because we expect a payoff bias to decrease cooperation [45,46].

2. Results

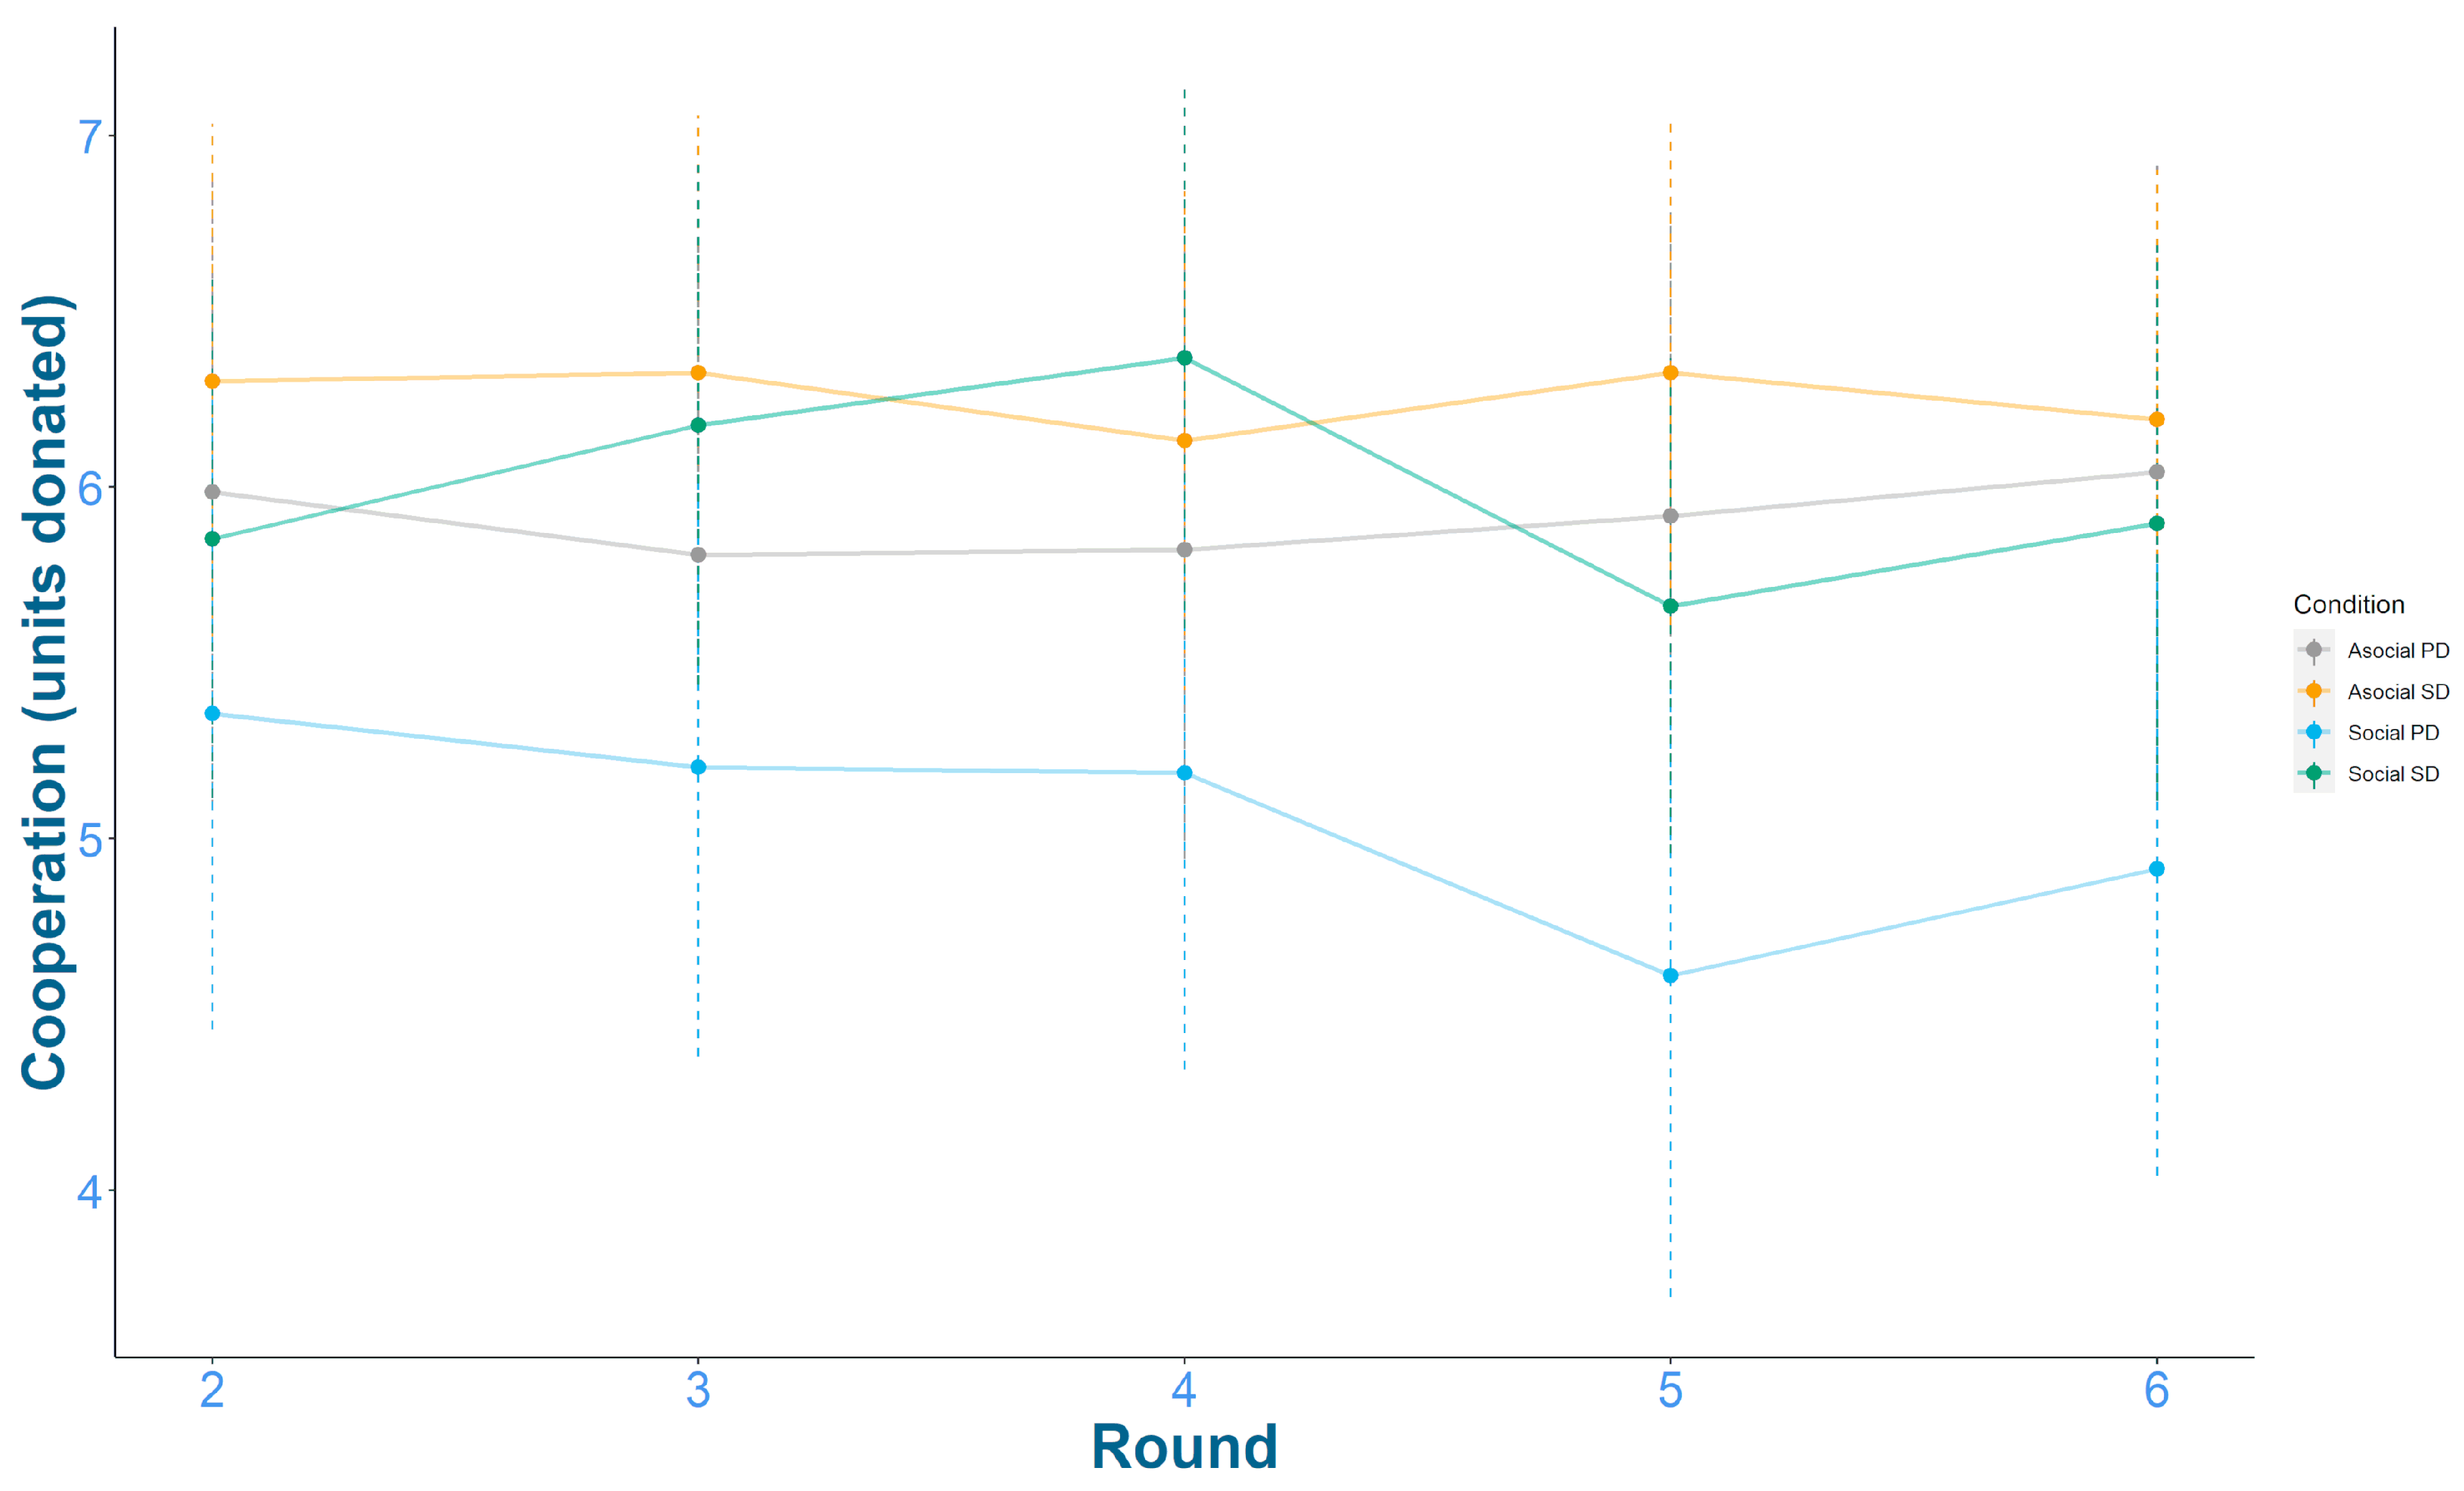
Figure 1 shows the mean cooperation rates from rounds 2–6 for the four experimental conditions. Generally, mean cooperation was around 6 points at round 2 and showed little change across subsequent rounds. This suggests that overall cooperation rates were relatively consistent throughout the experiment. Participants also generally indicated a good understanding (using a scale of 1/poor to 10/good) of how the game worked (Median = 8, IQR = 3).
Although there appears to be little variation between rounds, economic games commonly find declines in cooperation across rounds [46,66]. Therefore, it may still be necessary to control for variation between rounds. Two competing models were compared, one which ignored round (“No round”) and another which added a varying intercept for round (“Round”). No round had a WAIC score of 5502.3 (SE = 76.9, weight = 0.73) and Round had a WAIC score of 5504.3 (SE = 77.0, weight = 0.27), indicating no improvement in out-of-sample predictive ability by varying intercepts by round. The results were similar when round was included as a continuous linear predictor (No round; WAIC = 5501.4, SE = 76.9, weight = 0.71, Round; WAIC = 5504.2, SE = 77.0, weight = 0.29). Therefore, all further models excluded the effect of round.

2.1. Which Social Learning Strategies, If Any, Do Participants Use? (RQ 1a)

Some modelling concerns needed to be addressed before answering this question. Data from the asocial condition were retained in the model for analysis to ensure that parameter estimates for the effects of payoff structure can be evaluated across the social and asocial condition. However, data from the asocial condition cannot be used to estimate the social learning parameters because participants did not view any social information. To address this, we modelled the interaction of the three social learning strategy parameters with the social information condition: the predicted effect is always 0 if the data come from the asocial condition.
A second concern is that, for participants who are themselves either prestigious (having scored highest in a pre-game quiz relating to understanding of how social groups work) or have the highest payoff, the prestige and payoff social information is not strictly social as it refers to their own previous behaviour. To address this, the model used binary variables to exclude each participant from using social learning strategy data about themselves to construct the social learning parameter estimates. Specifically, prestige interacted with a binary variable where a value of one indicates they are not the prestigious individual. Payoff interacts with a binary variable where a value of one indicates they are not currently the highest earner. Accordingly, parameter estimations occur only for cases where the slopes are not inflated by one’s own behaviour.
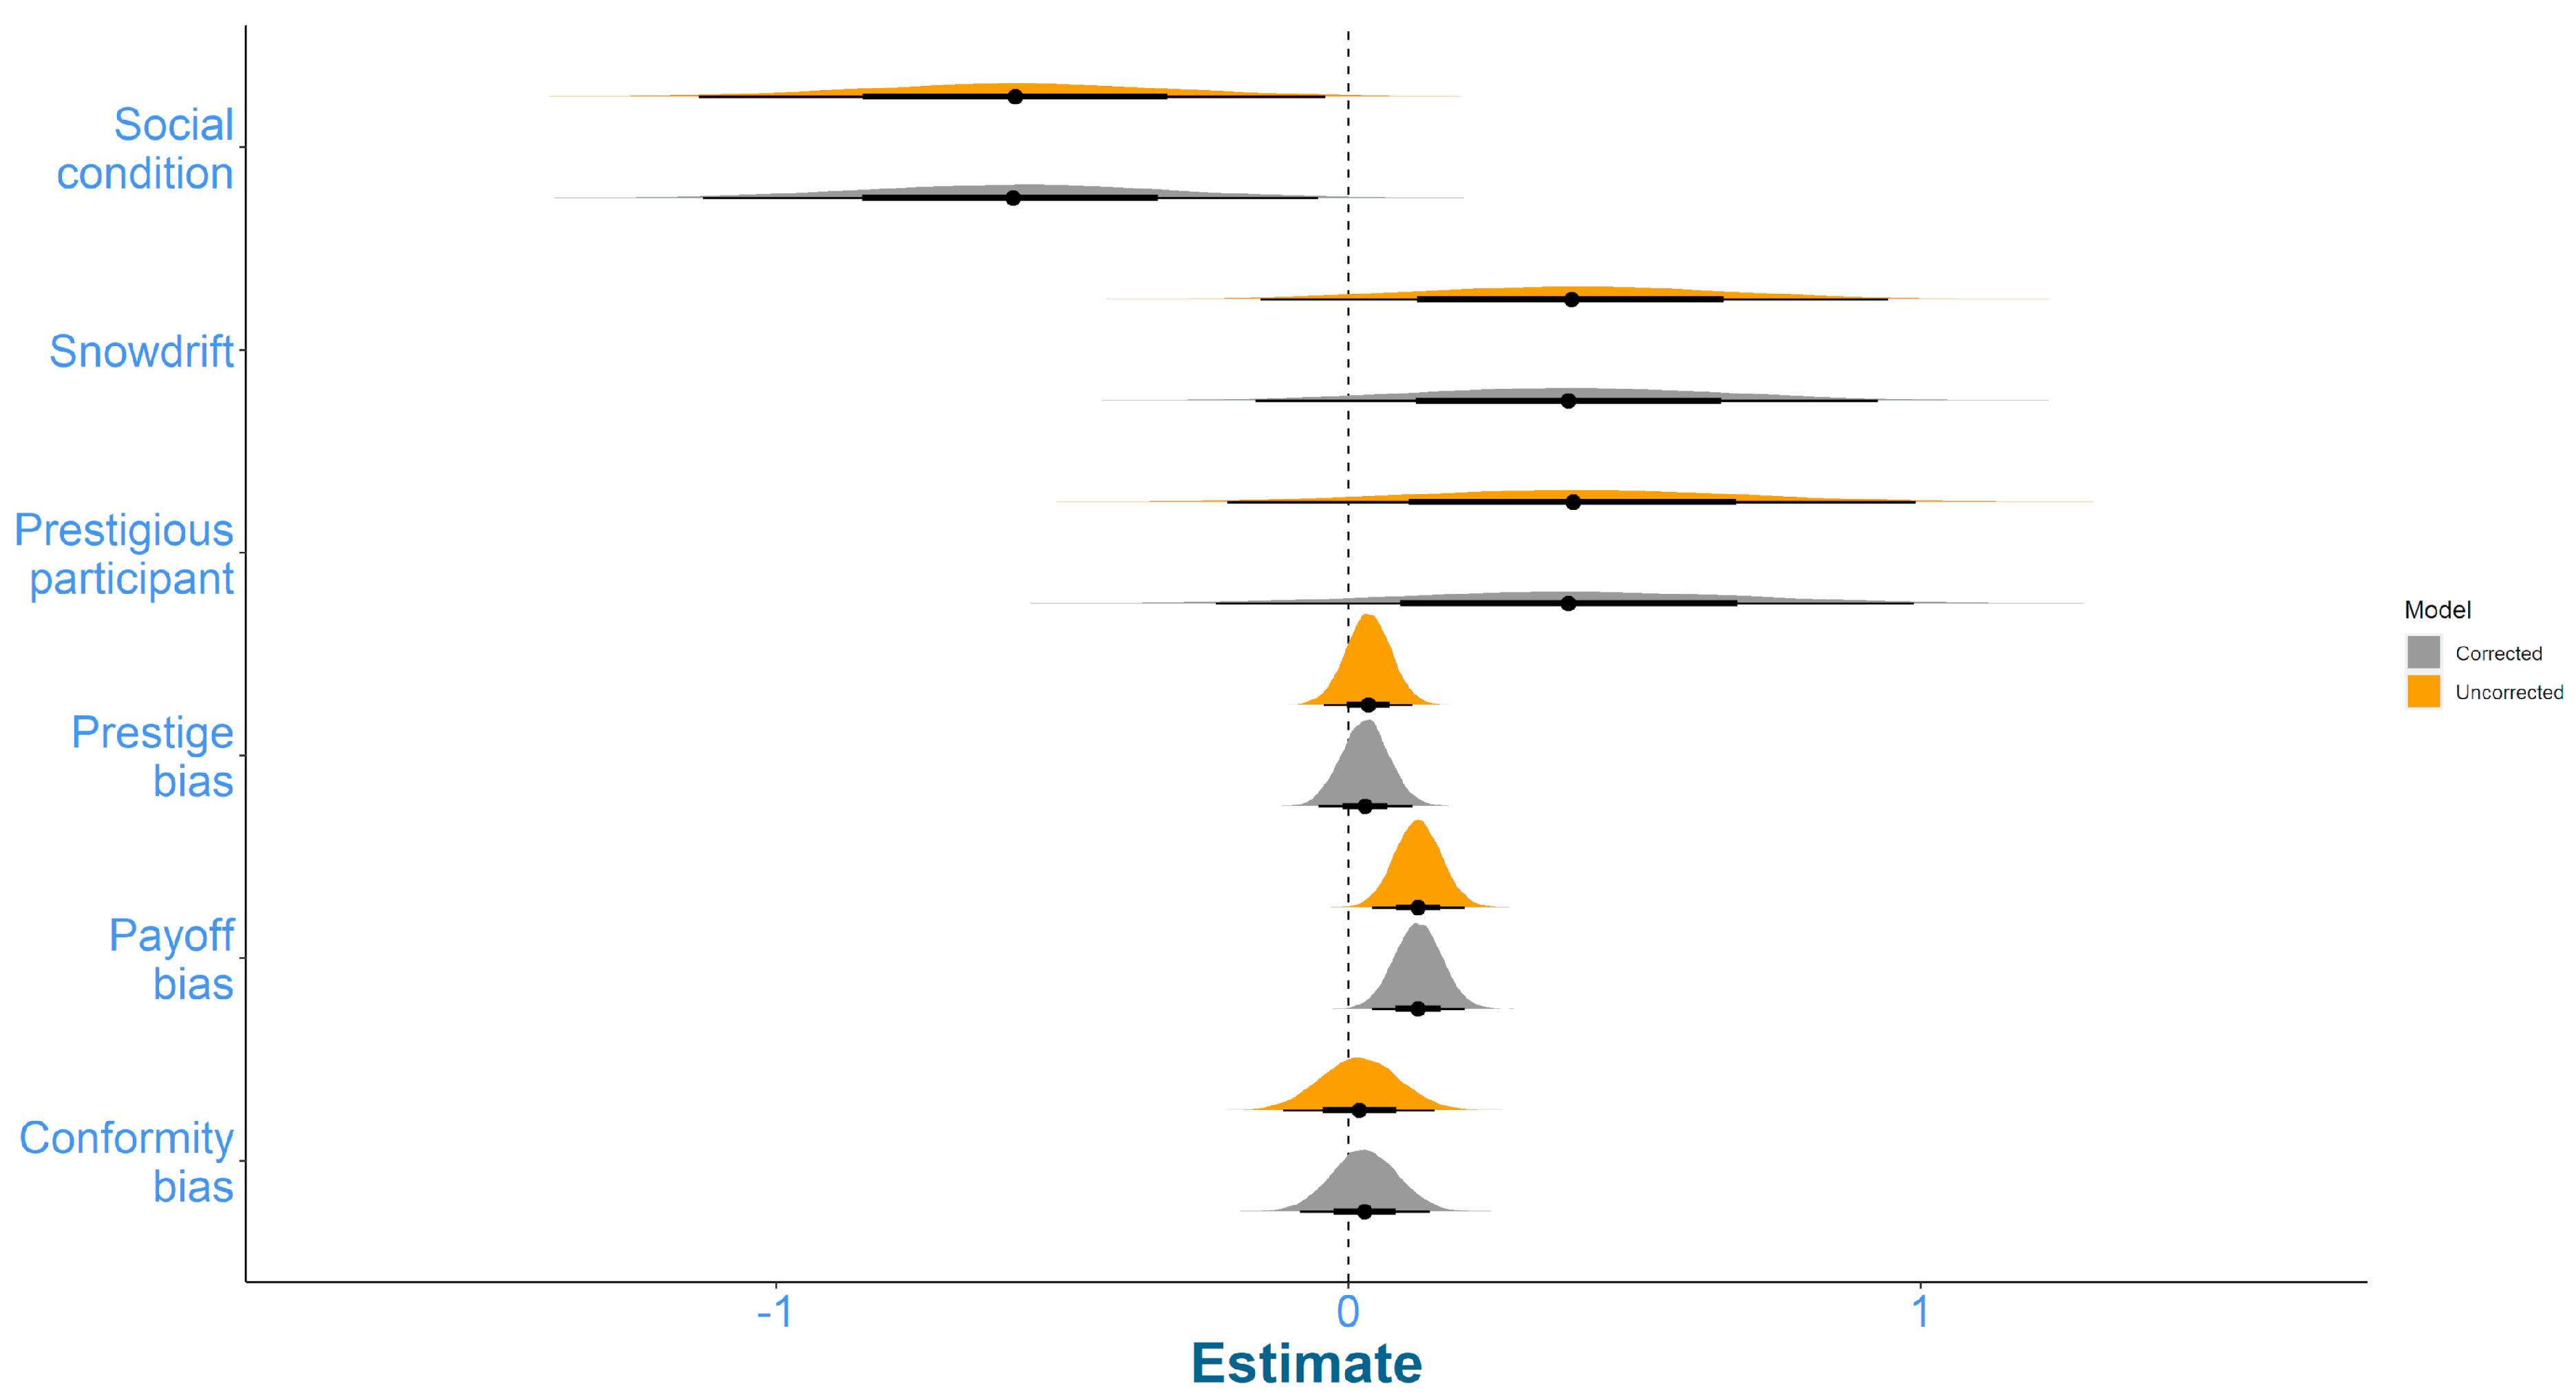
The conformity information presented to participants (average group behaviour) included their own behaviour, but not exclusively. While reconstructing this variable to exclude their own behaviour would correct for this issue, this introduces an inconsistency between the modelled variable and the information participants were presented with in the experiment. Therefore, the proceeding analysis was repeated for uncorrected (includes their behaviour) and corrected (excludes each participant’s own behaviour) conformity information. The main text details the uncorrected analysis while Appendix B shows the main model predictions with the corrected variable and the difference in estimated parameters. Qualitatively, the primary conclusions do not differ from one another.
Eight different models were fit to the data, consistent with the constraints described above, covering all possible combinations of the three social learning parameters (Prestige, Conformity and Payoff). The compared models ranged from a model containing only the control variables of experimental condition (SD/PD and Social/Asocial) and being the prestigious participant, to a model additionally containing all the social learning strategies (Prestige + Conformity + Payoff). The WAIC values and associated model weights are displayed in Table 2.
The pattern of WAIC scores do not provide conclusive support for any particular social learning strategy. Overall, the strongest evidence is for payoff bias as the two top models which are favoured over the asocial model and have a combined weight of 0.61, include payoff bias. Conversely, the four models which include conformity have the lowest overall model weights (0.10), indicating models that include conformity are overfit compared to the asocial model. There appears to be a small effect associated with a prestige bias, as adding prestige to a model containing payoff does slightly improve its out-of-sample predictive ability. However, prestige alone is not favoured over an asocial model, which suggests that it is primarily payoff that is improving the model fit. Additionally, the asocial model is (modestly) favoured over those which do not contain a payoff bias or contain a conformity. This includes the Prestige + Conformity + Payoff model which despite containing payoff, is penalised by WAIC for including conformity and prestige. This further suggests that conformity bias and prestige bias are overfit compared with payoff bias.
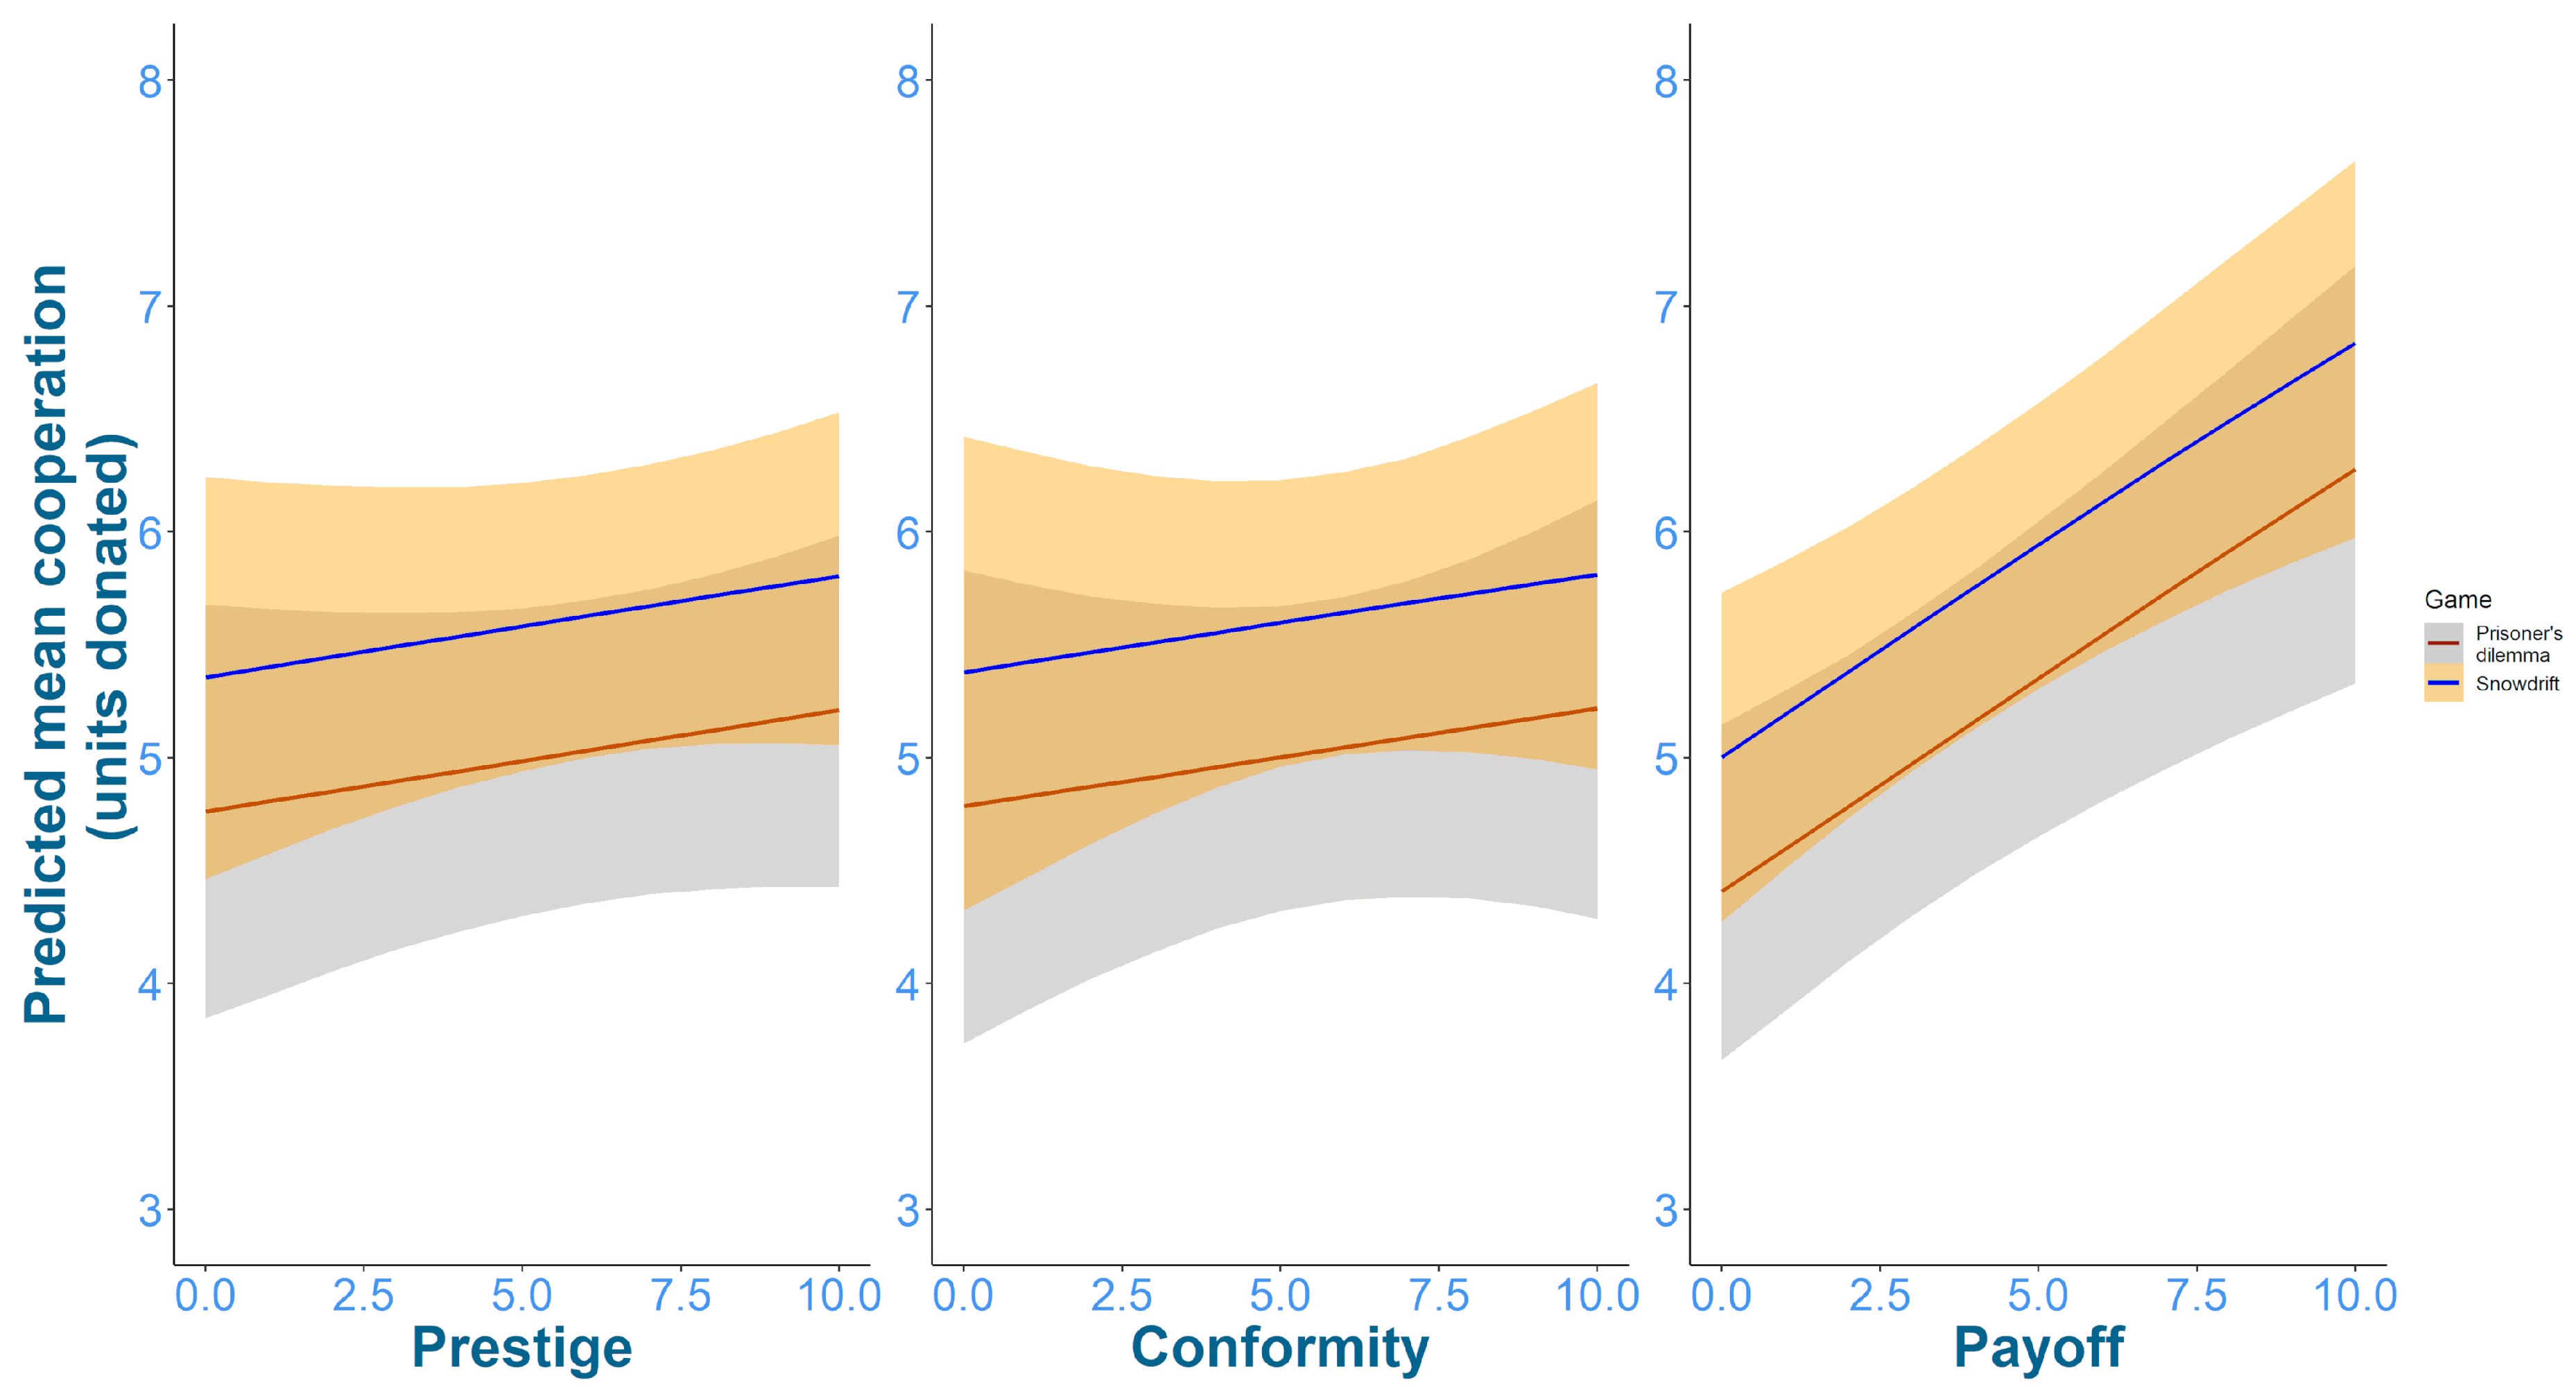
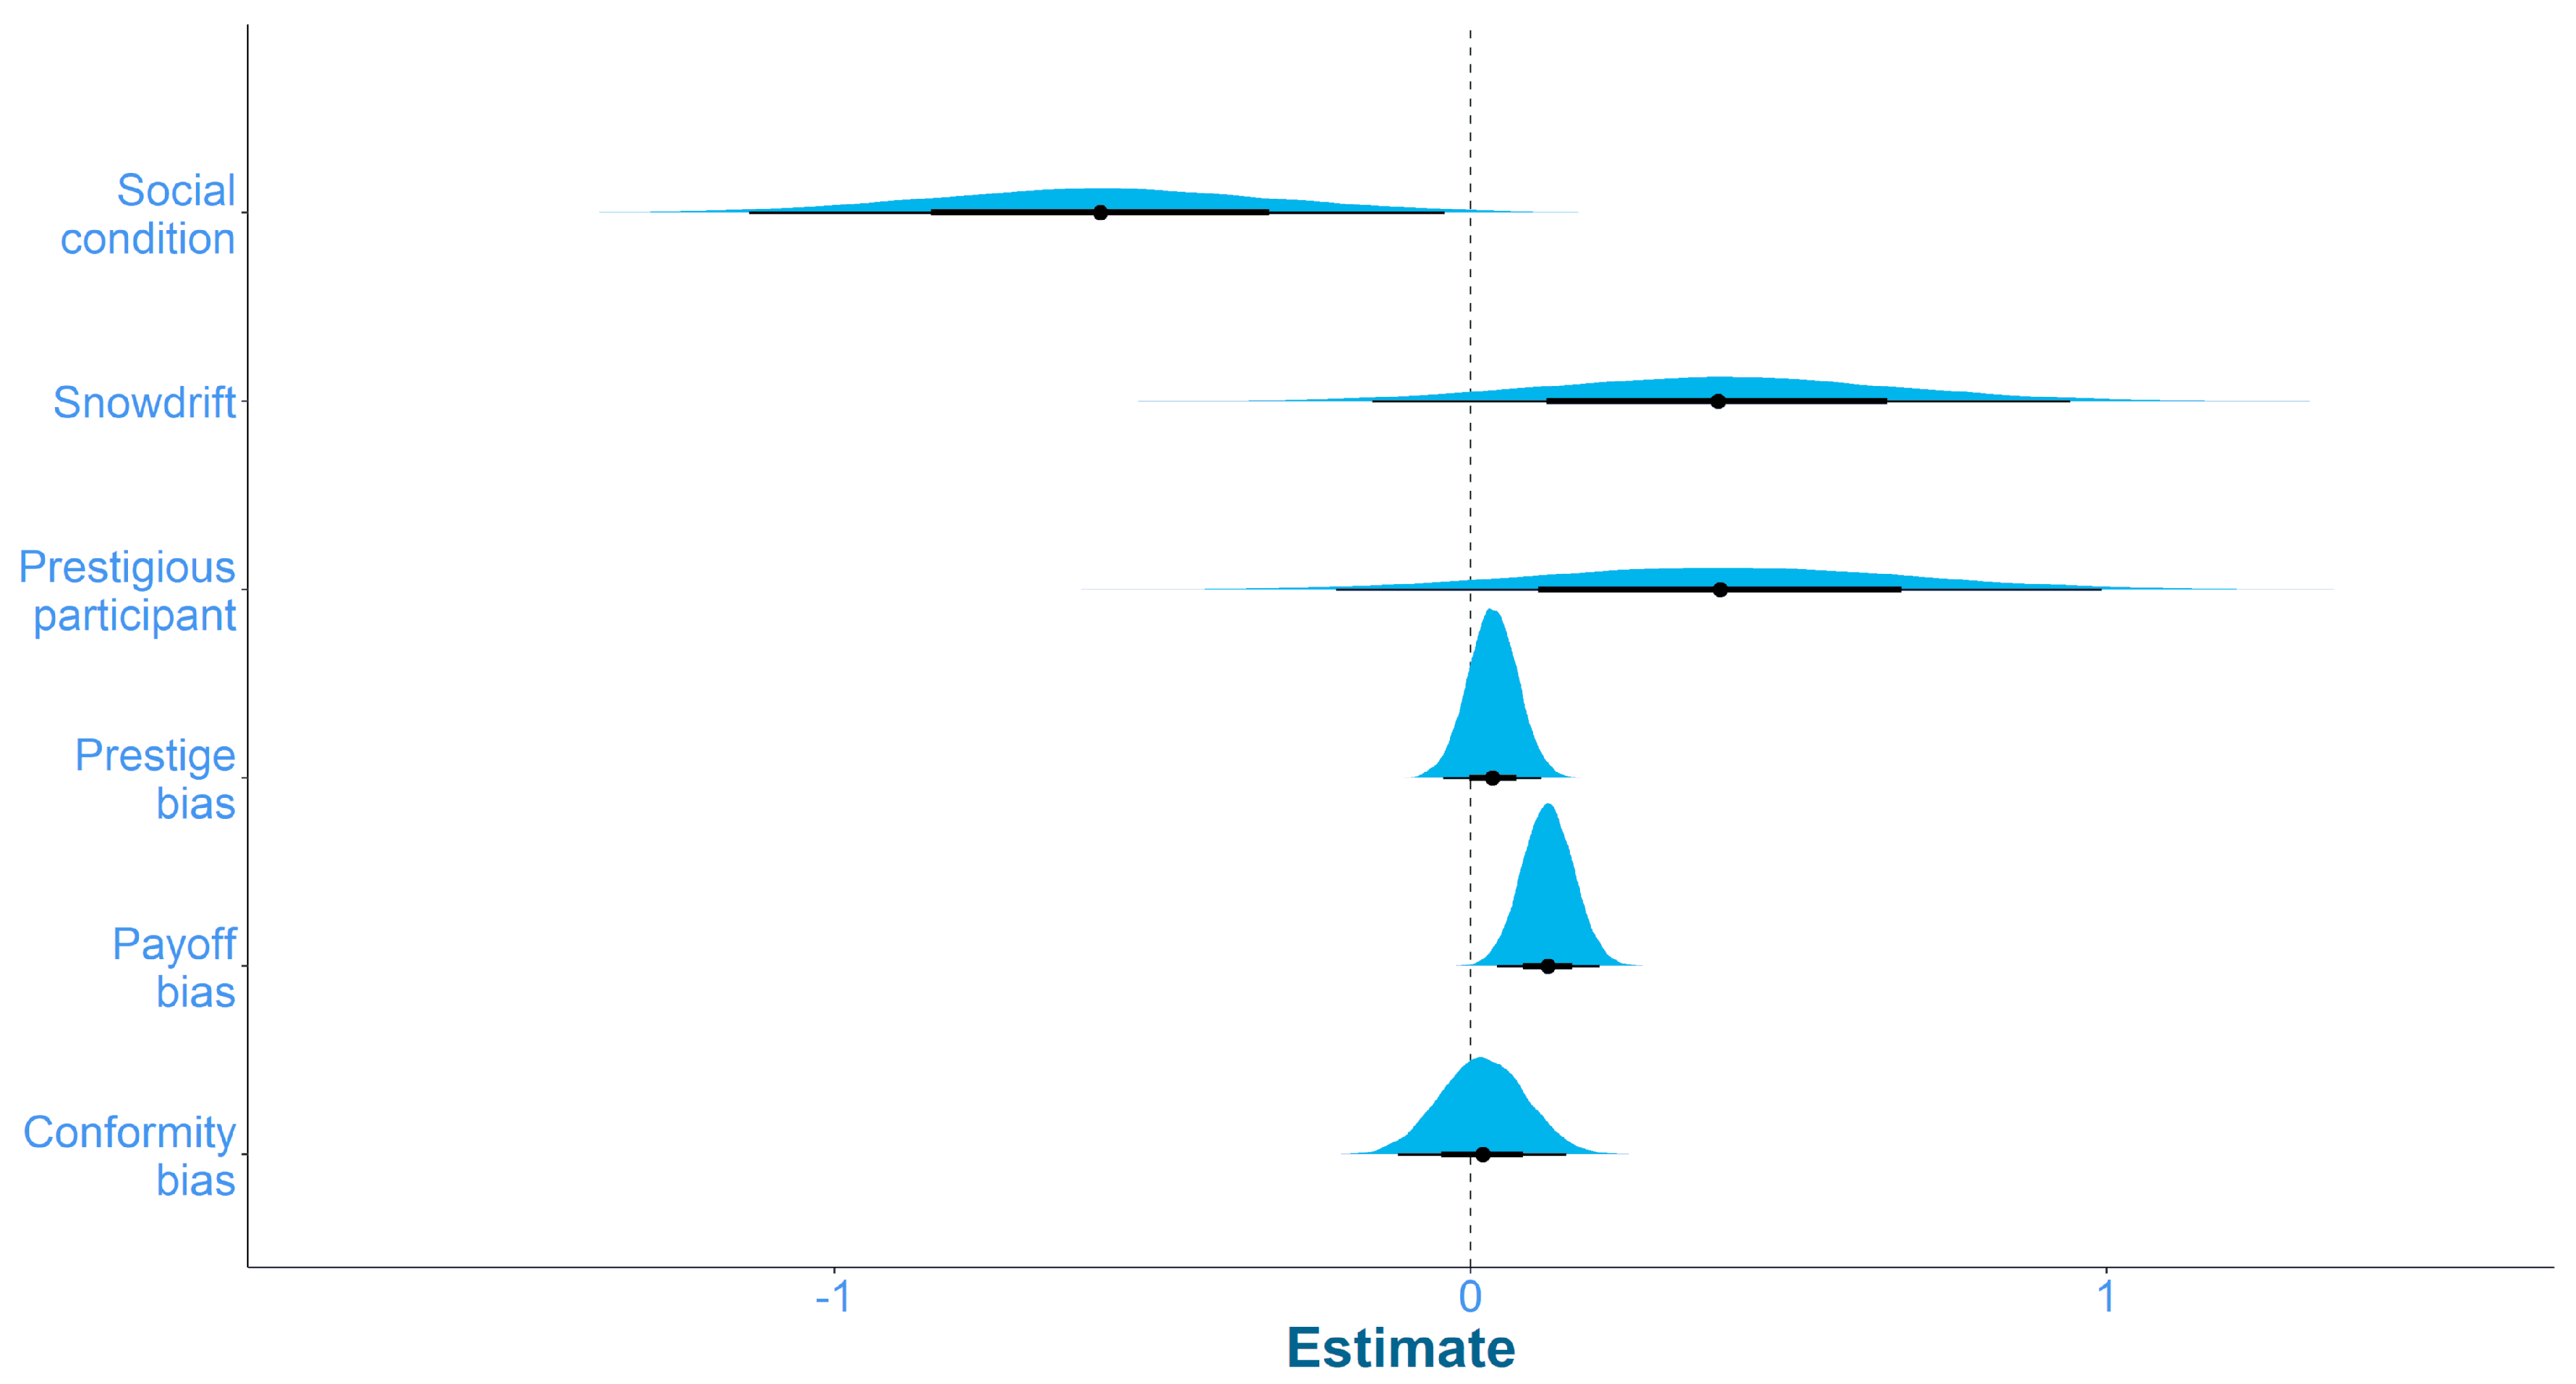
Parameter estimates (
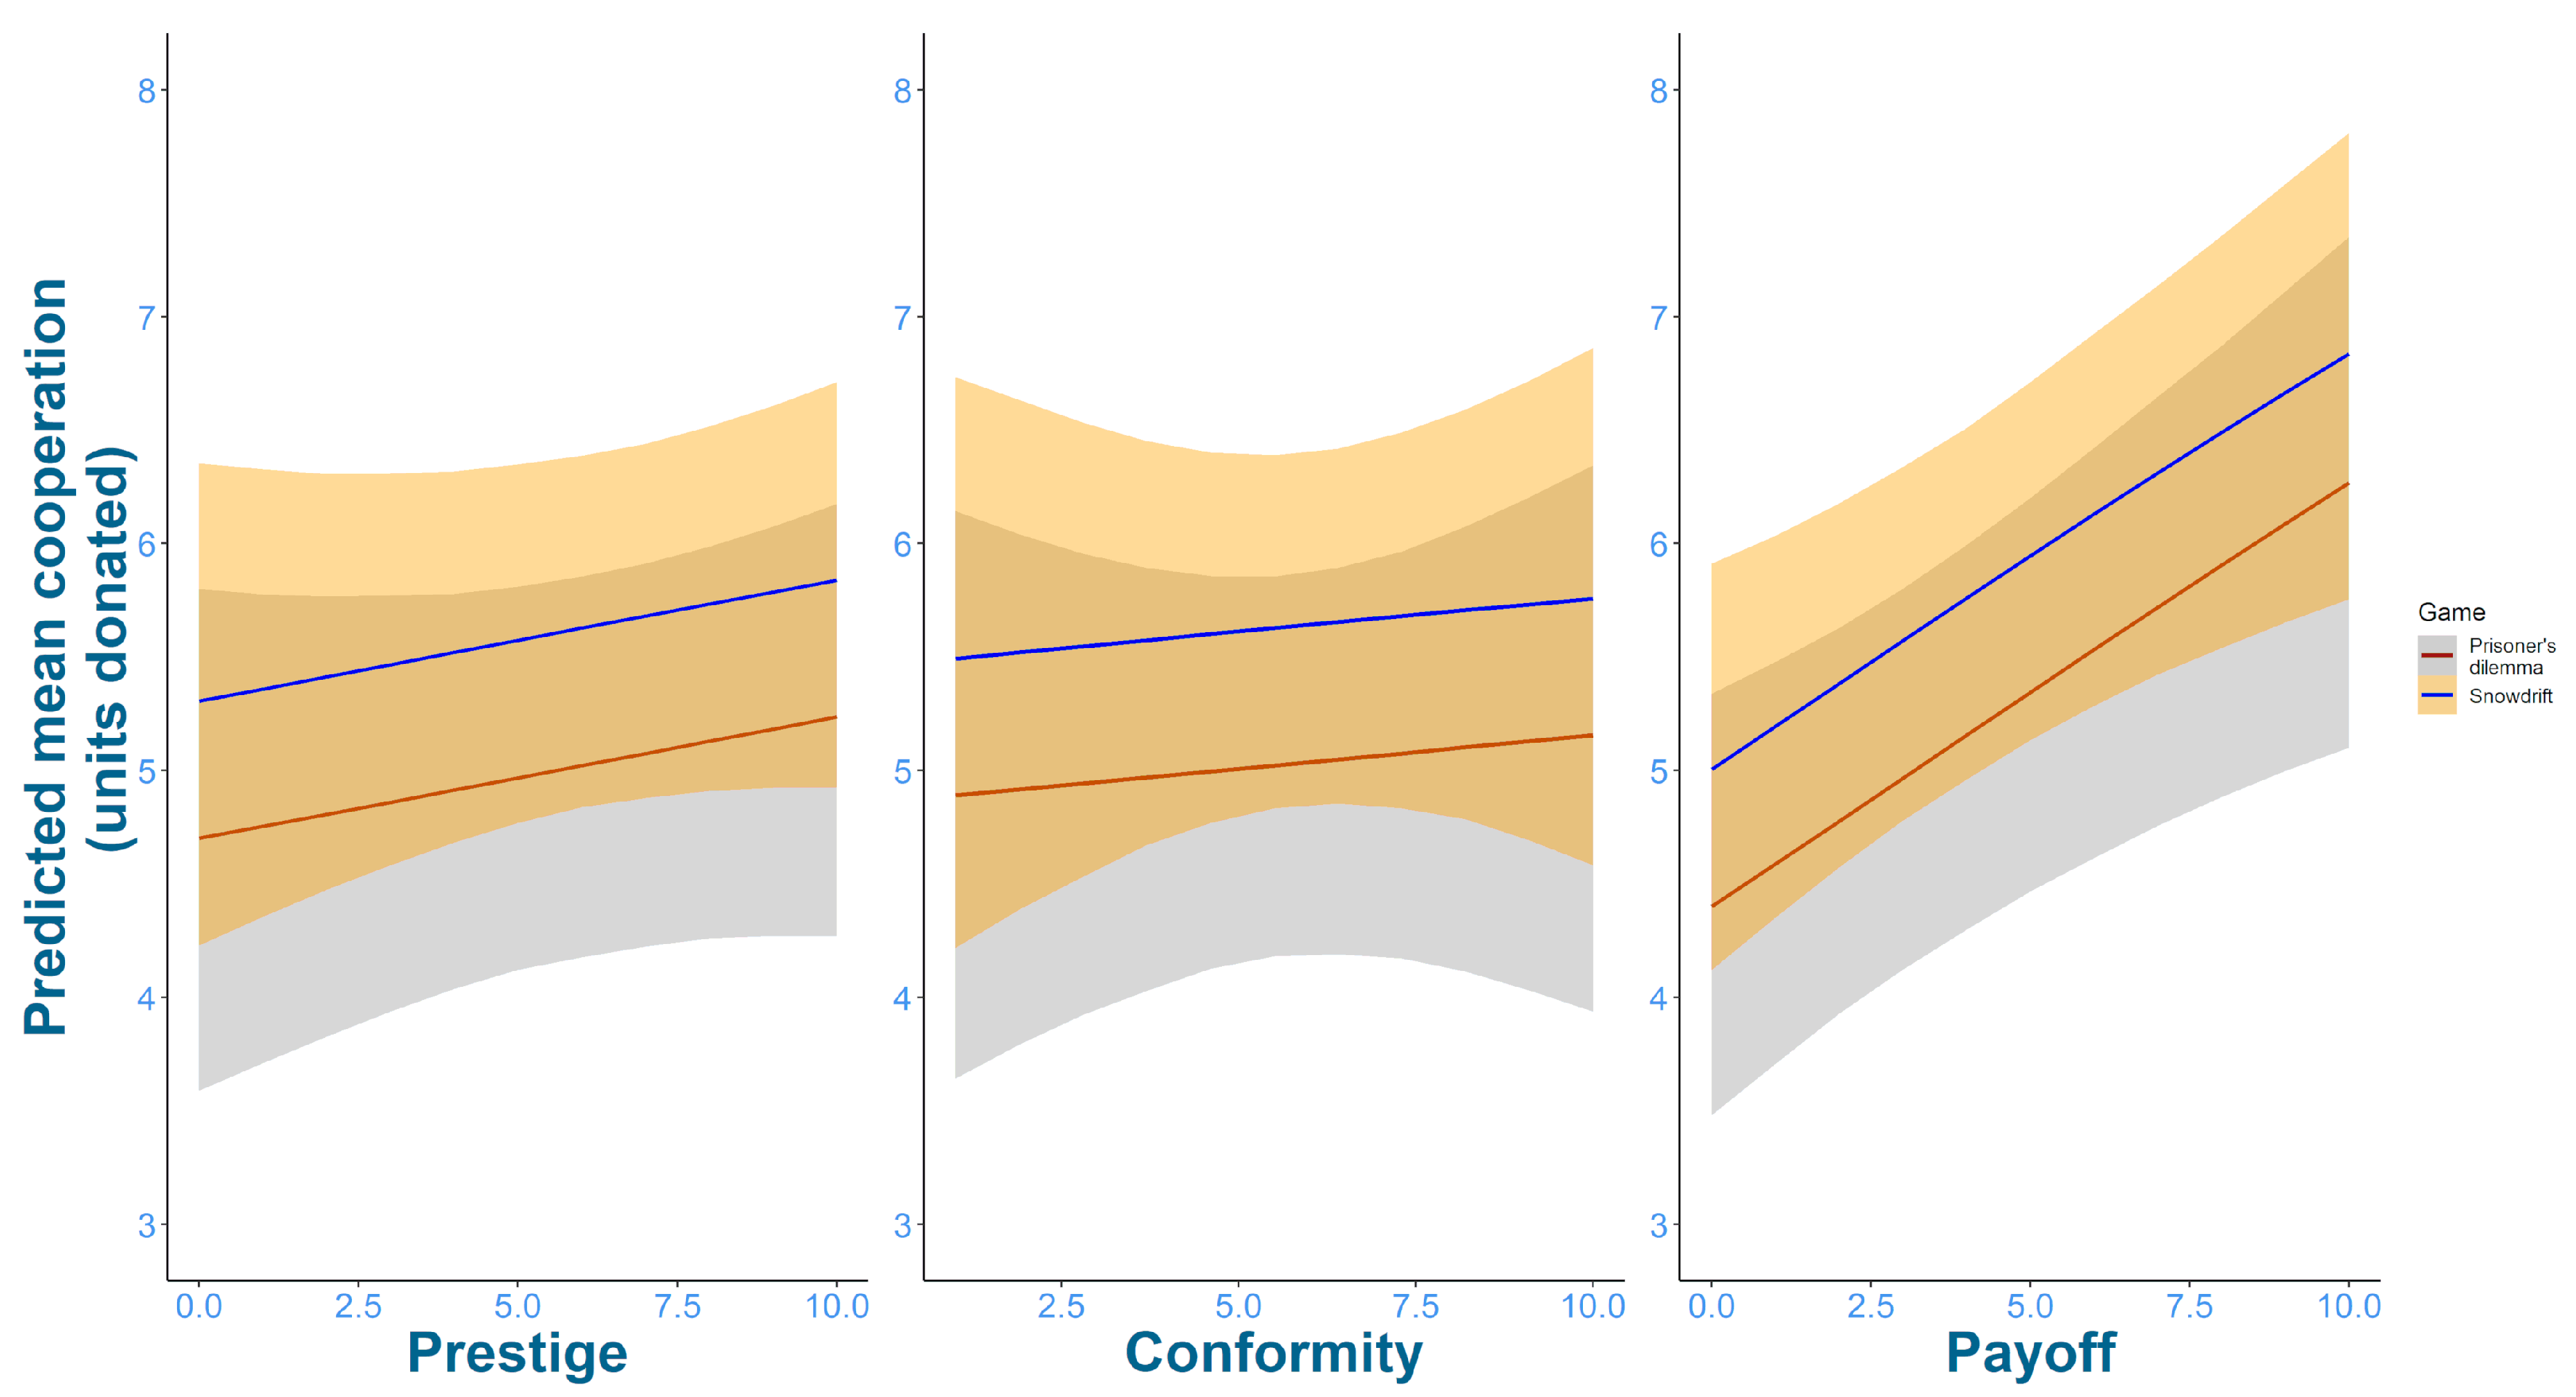
Figure 2) and model predictions (Figure 3) from the Prestige + Conformity + Payoff model are displayed in the plots below. Figure 3 is split between the three social learning strategies and predictions are generated for increases in the respective social learning information while holding all other variables constant. The slope for payoff is positive which indicates that, generally, participants’ behaviour aligned with the direction (increase/decrease) of this social information. The slopes for prestige and conformity are weakly positive but have wider prediction intervals and the parameter estimates overlap 0. This, combined with the distribution of model weights, suggests that out of the three social learning strategies, a payoff bias shows the strongest influence on participant cooperation. Therefore, the changes in cooperation observed are most consistent with a payoff bias.

2.2. Are the Patterns of Social Learning Strategies Consistent across the PD and SD Game? (RQ 1b)

To evaluate any differences in social learning strategy use between PD and SD games (research question 1b), the Prestige + Payoff + Conformity model was compared to a model where the social learning parameters also interacted with game structure. This allowed the model to estimate different slopes for the social learning parameters between the PD and the SD game. This did not improve model fit (Prestige + Conformity + Payoff: WAIC = 5503.7; se = 77.3; weight = 0.77, Interaction: WAIC = 5506.2; se = 77.6; weight = 0.23), indicating that social learning strategy use, or the influence of any social learning strategy, did not differ between the PD and SD games.

2.3. Evaluating the Experimental Conditions (RQs 2 and 3)

To evaluate the effects of game structure and the availability of social information on cooperative behaviour (research questions 2 and 3), model comparisons were run between the Prestige + Conformity + Payoff model and models that dropped different combinations of binary variables pertaining to game structure and social condition or allowed them to interact. This means these effects can be evaluated while controlling for social learning strategy use and remain comparable to the models presented above. Every model also retained the control for being the prestigious participant. The WAIC values and associated model weights are shown in Table 3.
Overall, there was no clear distinction between any of the models. It is therefore unclear whether including either (or both) predictors (or their interaction) benefits out-of-sample model fit or not, though both top models contain the social information condition (combined weight 0.60).
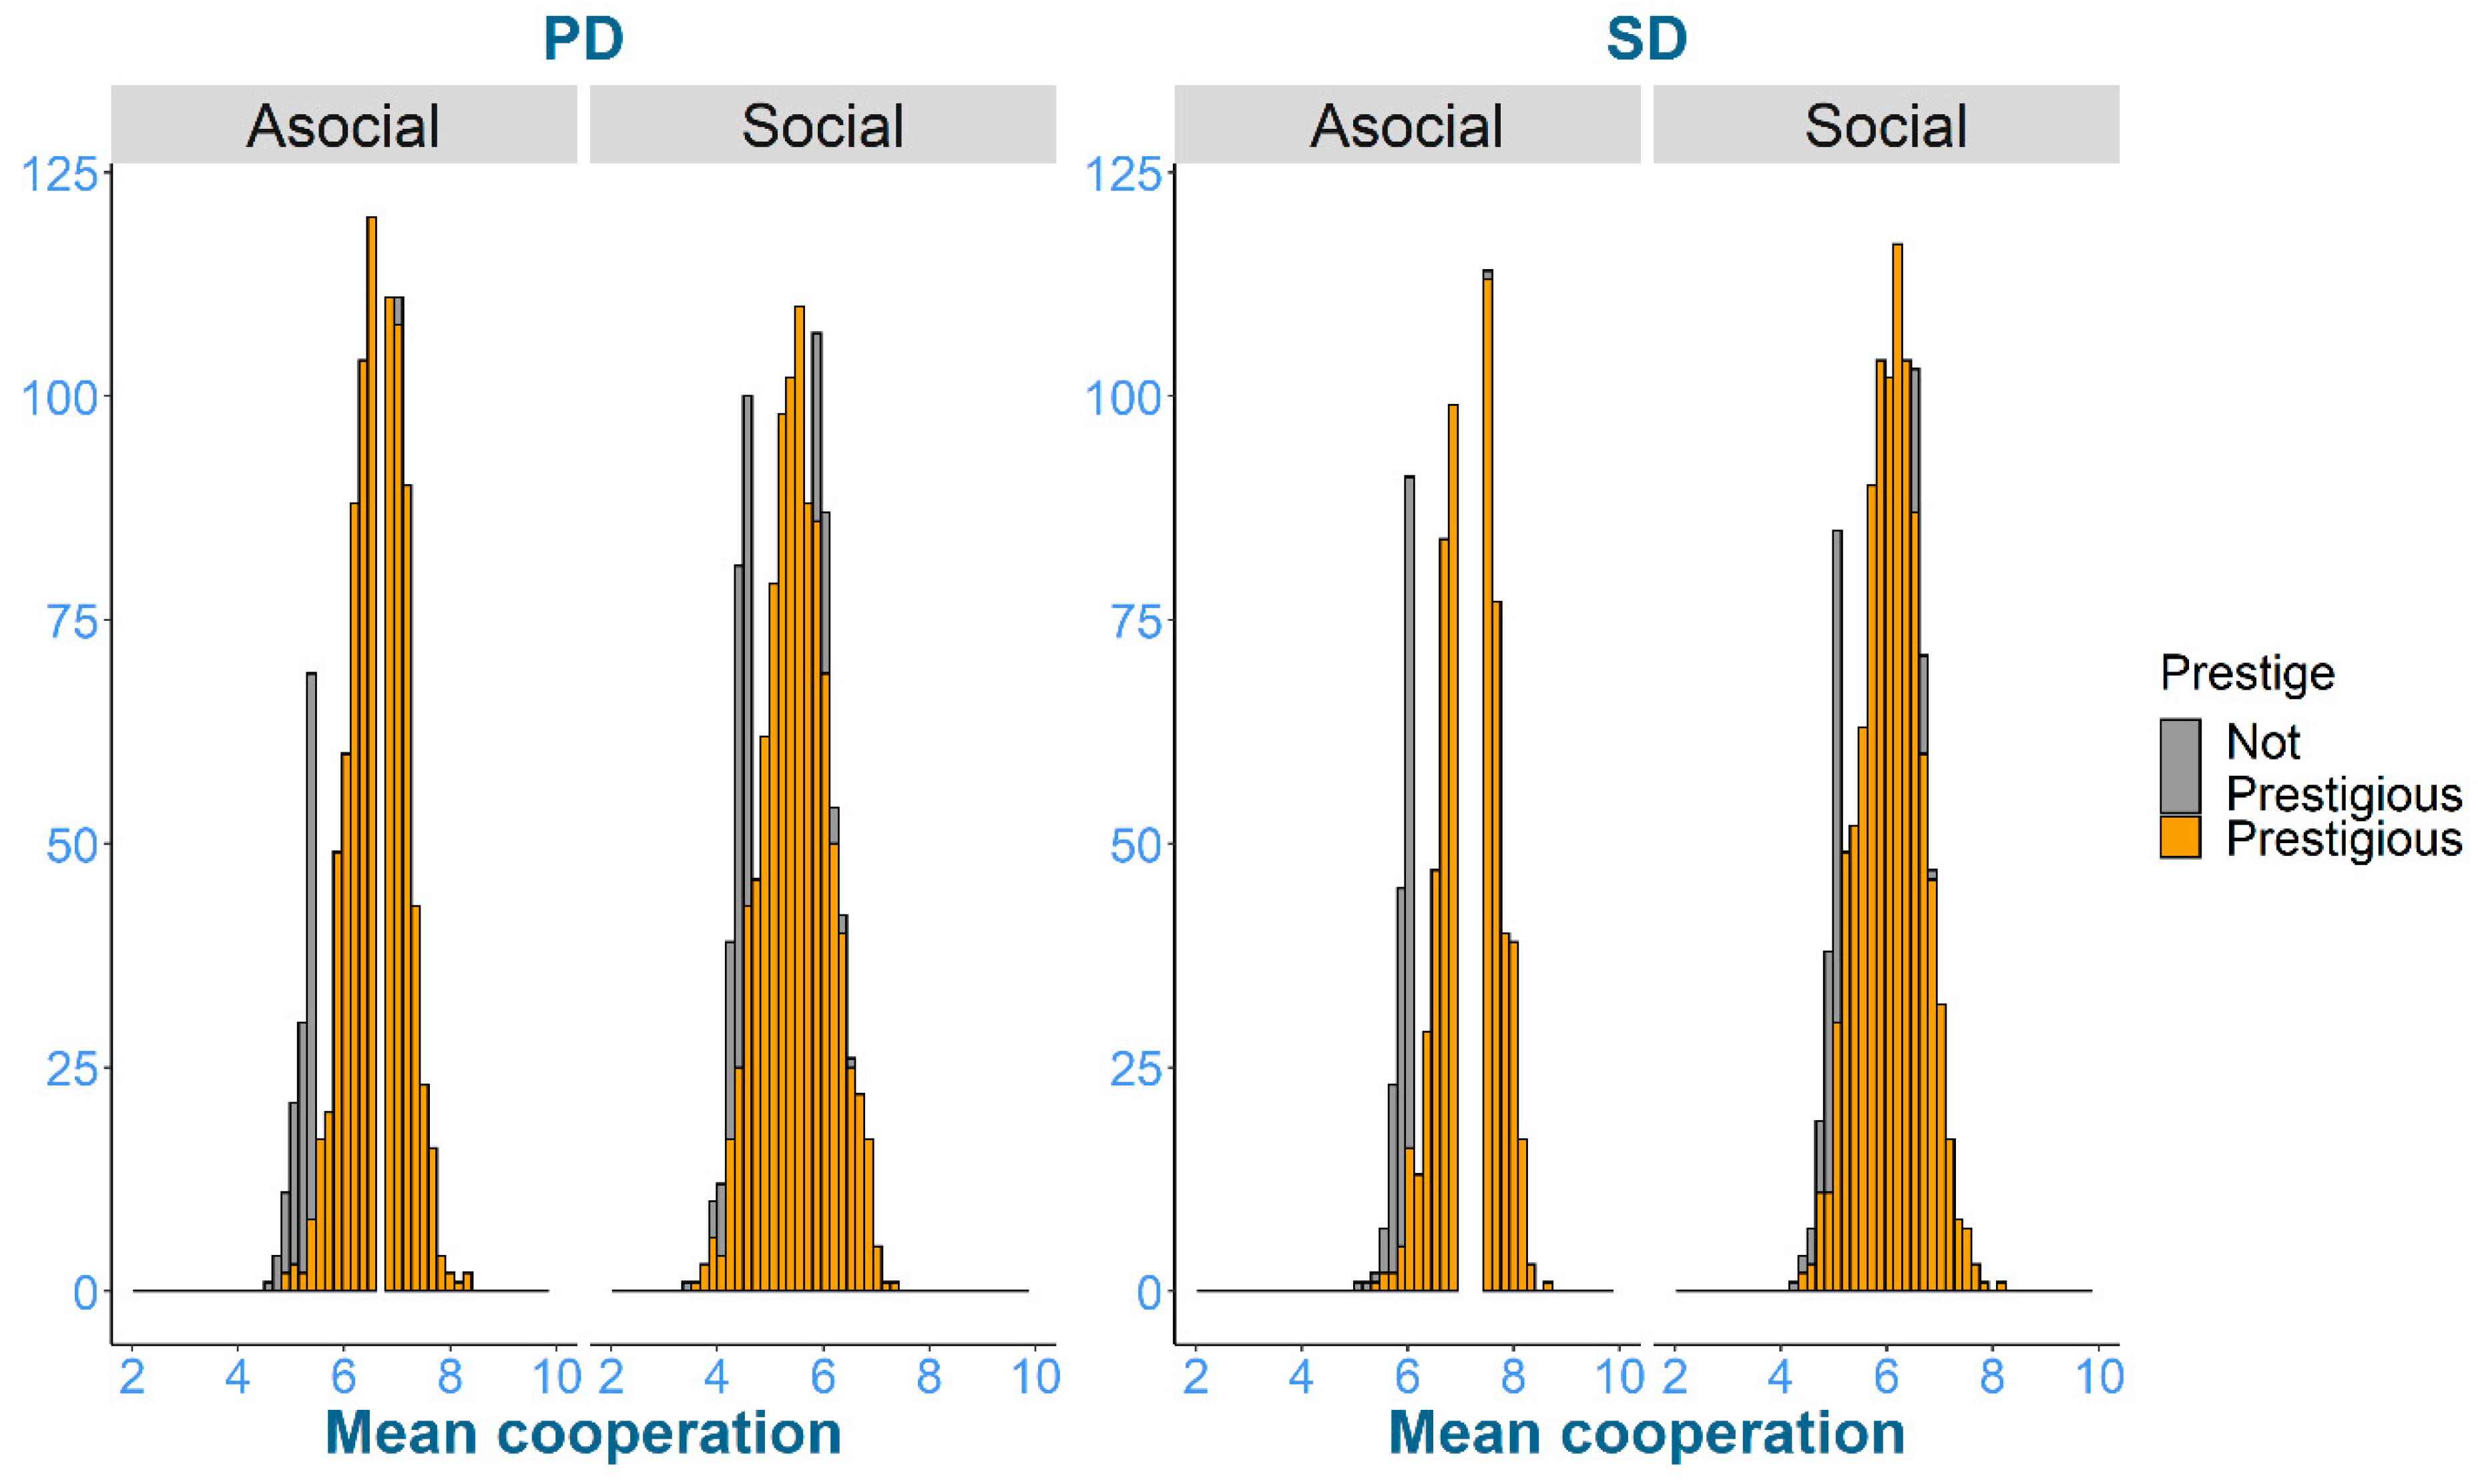
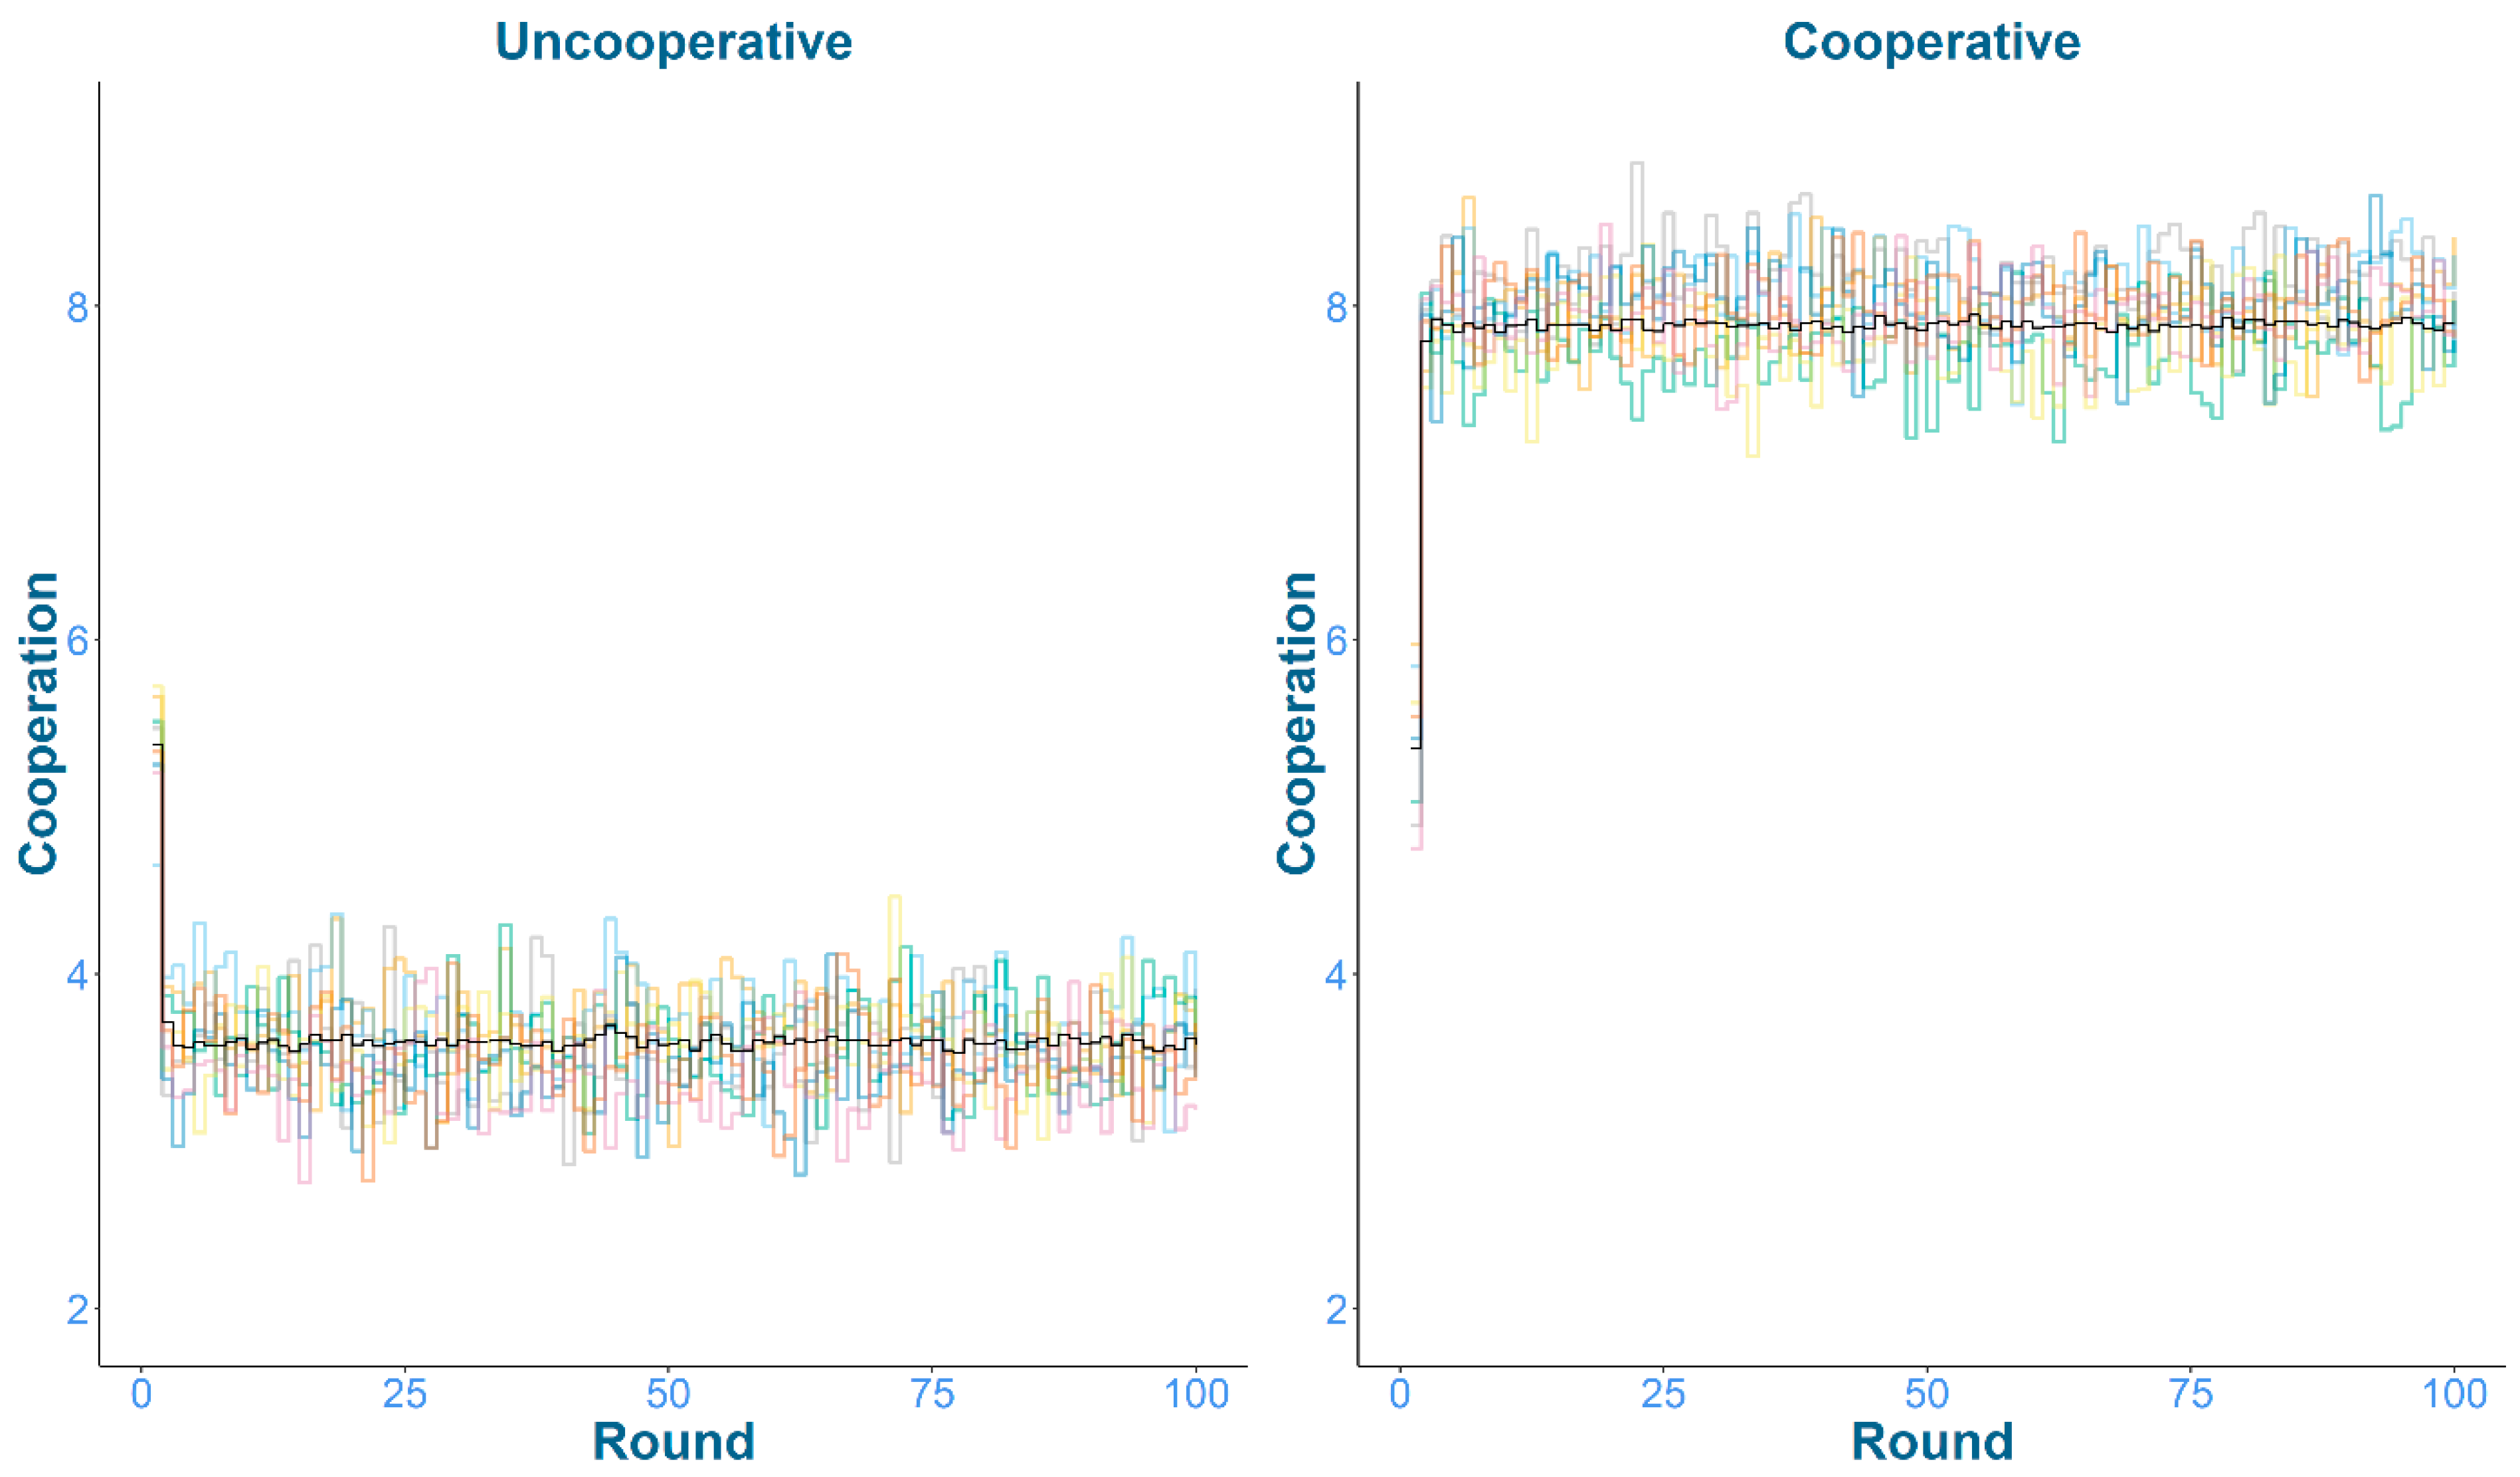
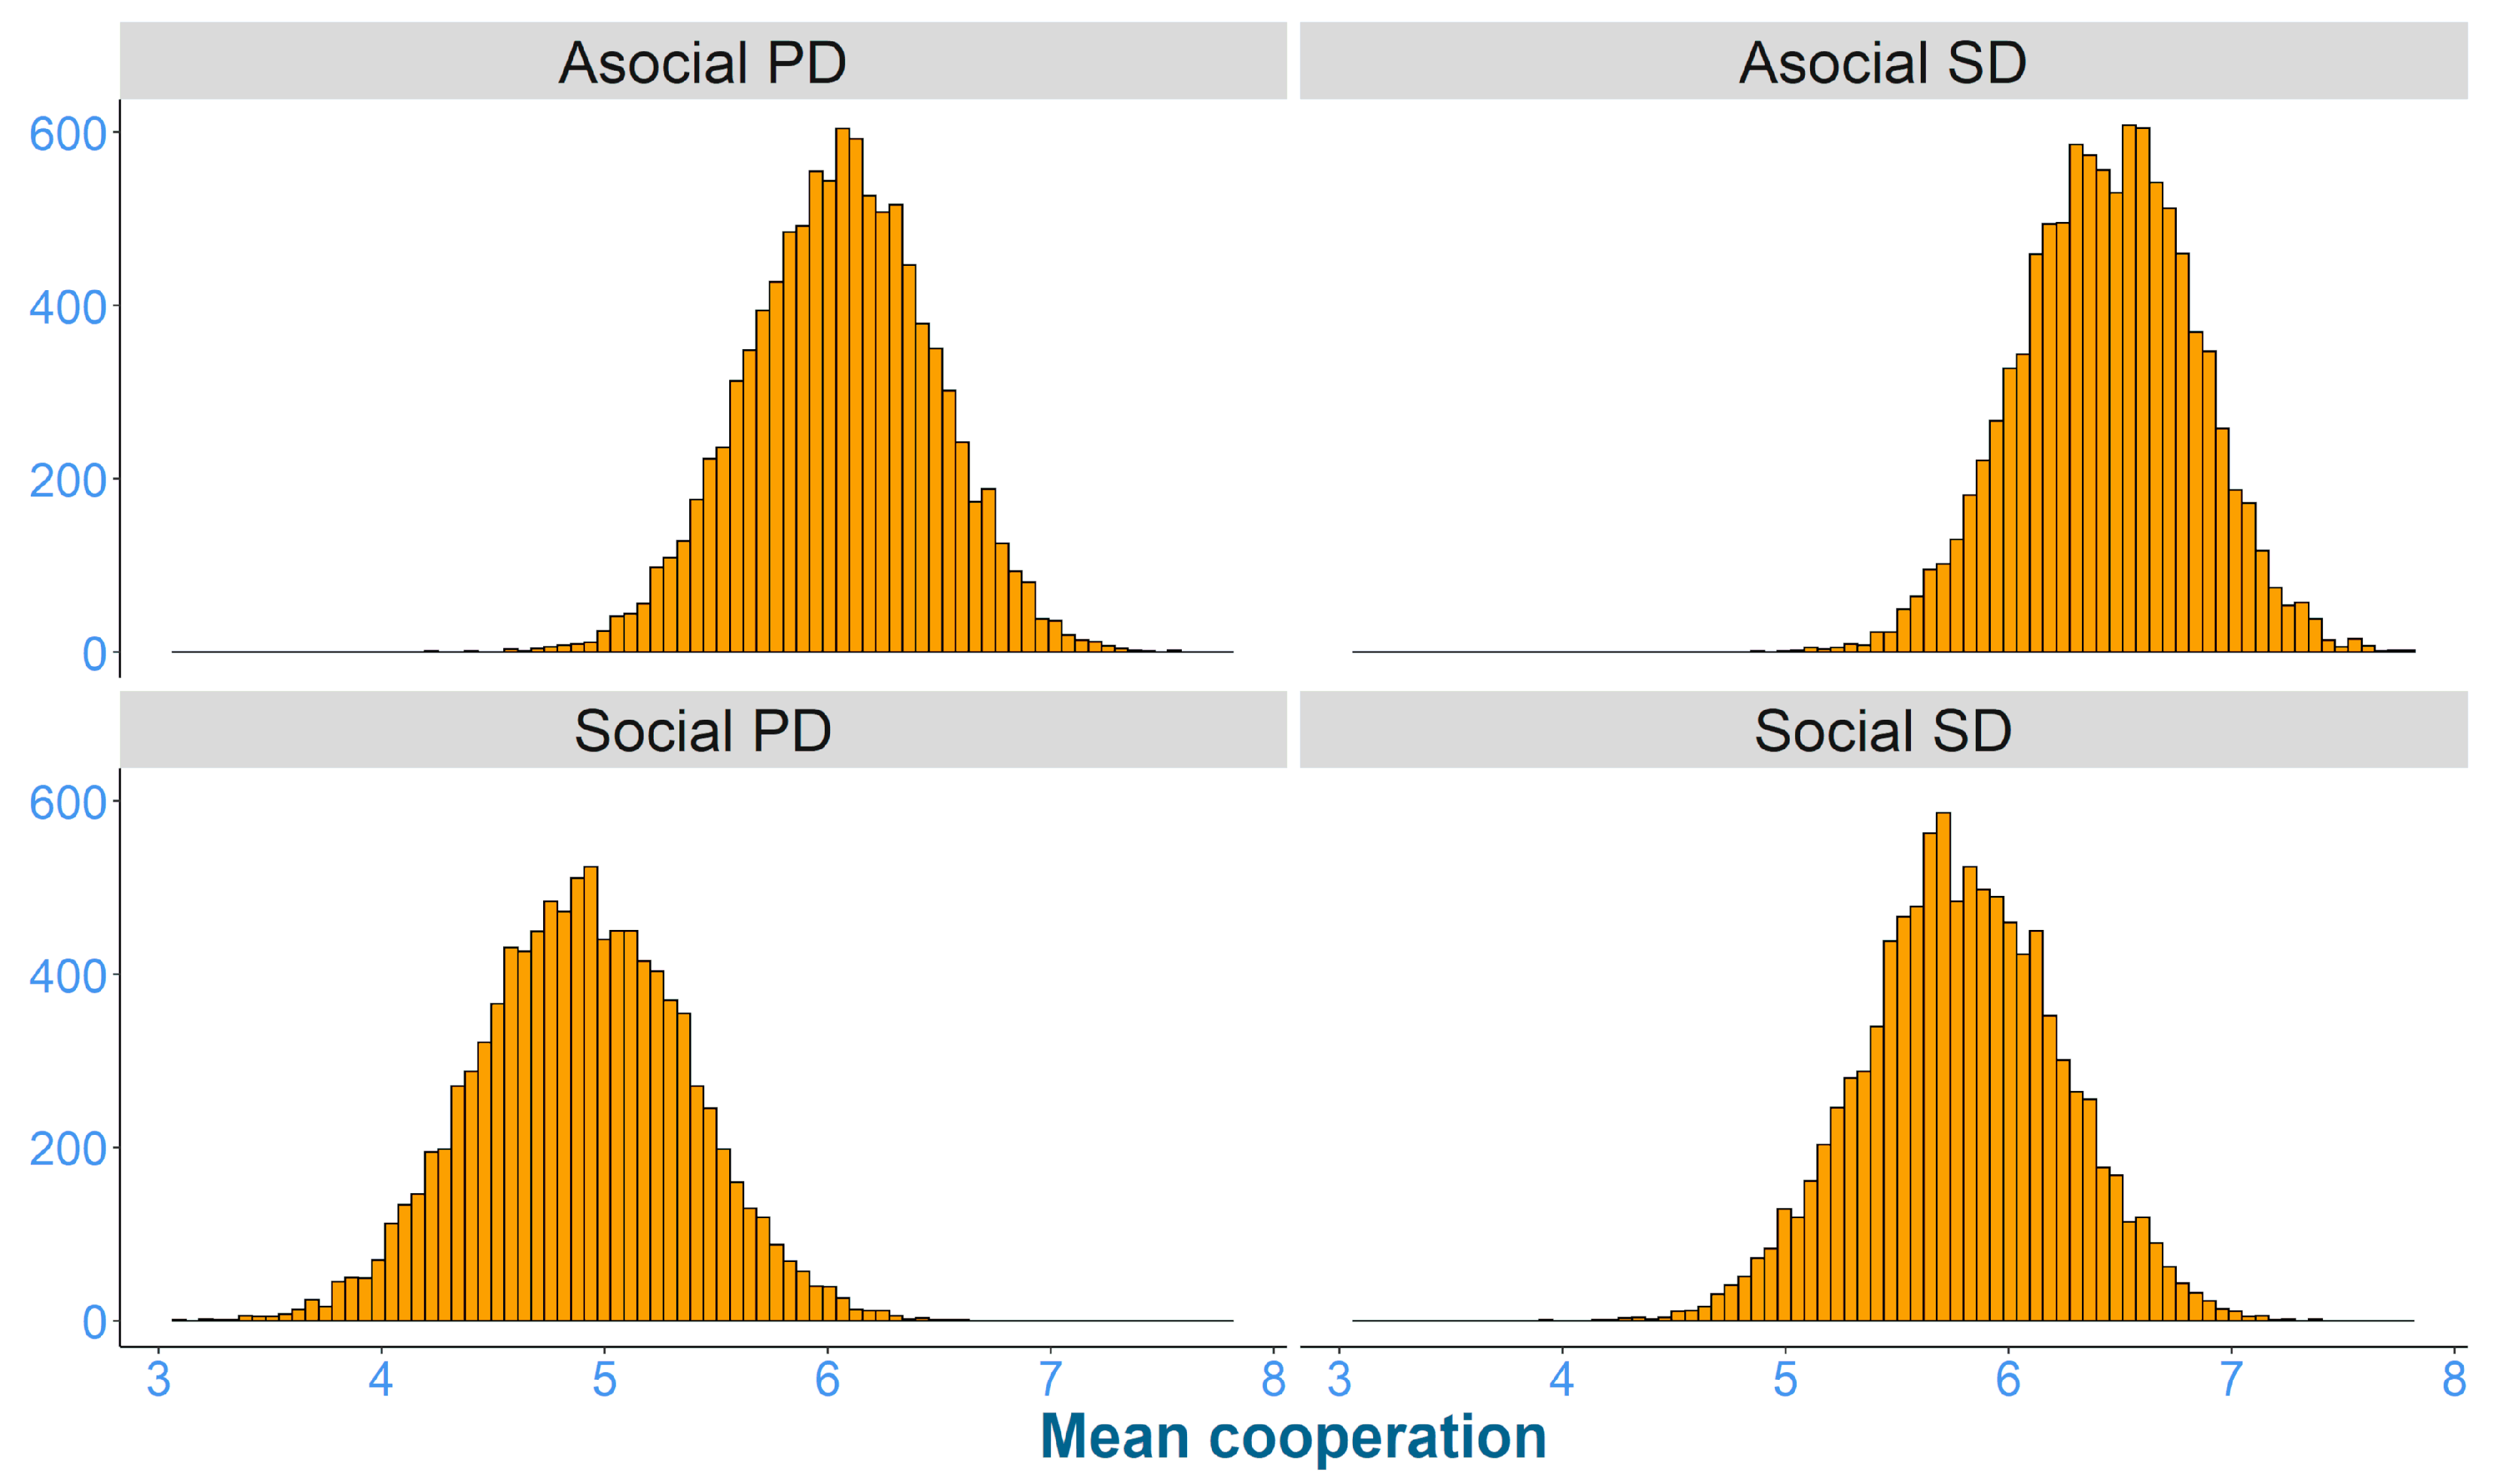
Figure 4 shows model predictions generated from the interaction model. There is some indication that cooperation was lower in the social information condition than the asocial condition and (to a lesser degree) higher in the SD than the PD game (Social = −0.58, 95% PI = −0.04; −1.14, Snowdrift = 0.39, 95% PI = −0.15; 0.94).

2.4. Simulation Model Dynamics

We used a simulation model to evaluate the longer-term consequences of the patterns of behaviour observed in this experiment. This permits the predictions from the Bayesian model (and the role of social learning) to be investigated for larger group sizes and under selection. This model samples from the Bayesian posterior estimates from the Prestige + Conformity + Payoff model to establish each agent’s intercept propensity for cooperation and the influence of the social learning strategies (taking into account that the simulation model considers the PD and social condition). Note that the social learning strategies are assumed to operate non-independently of one another. 
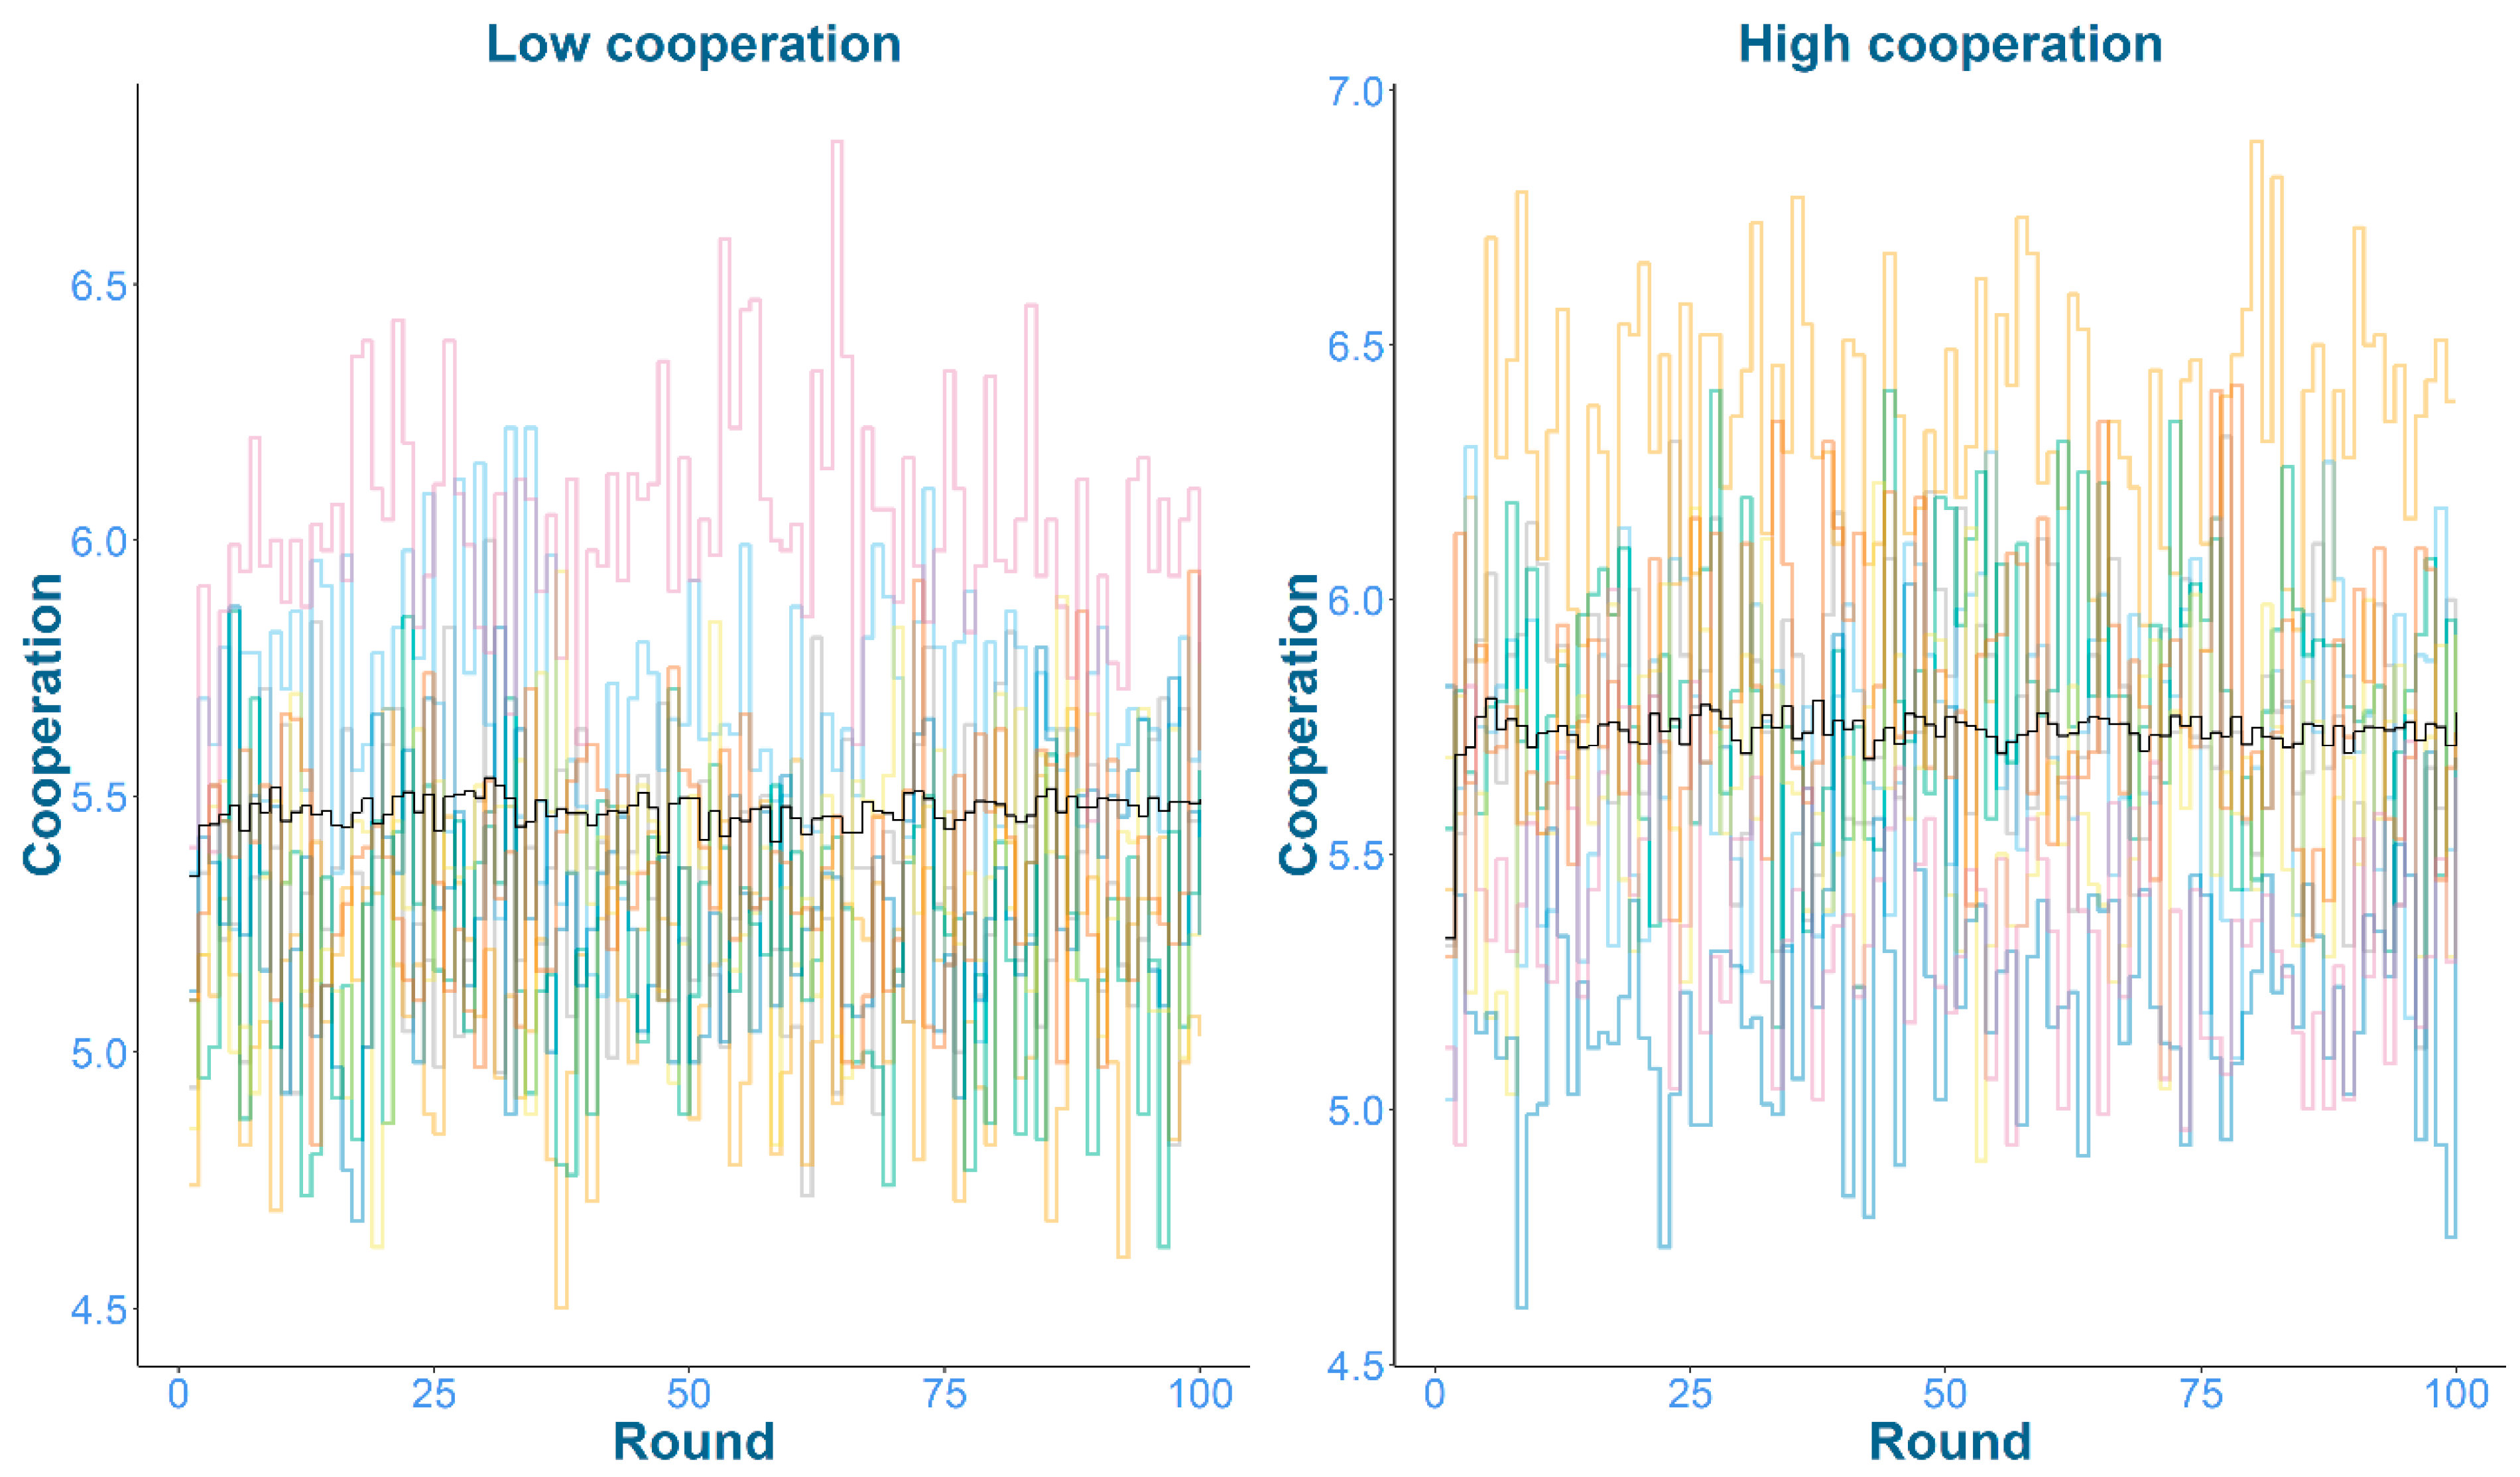
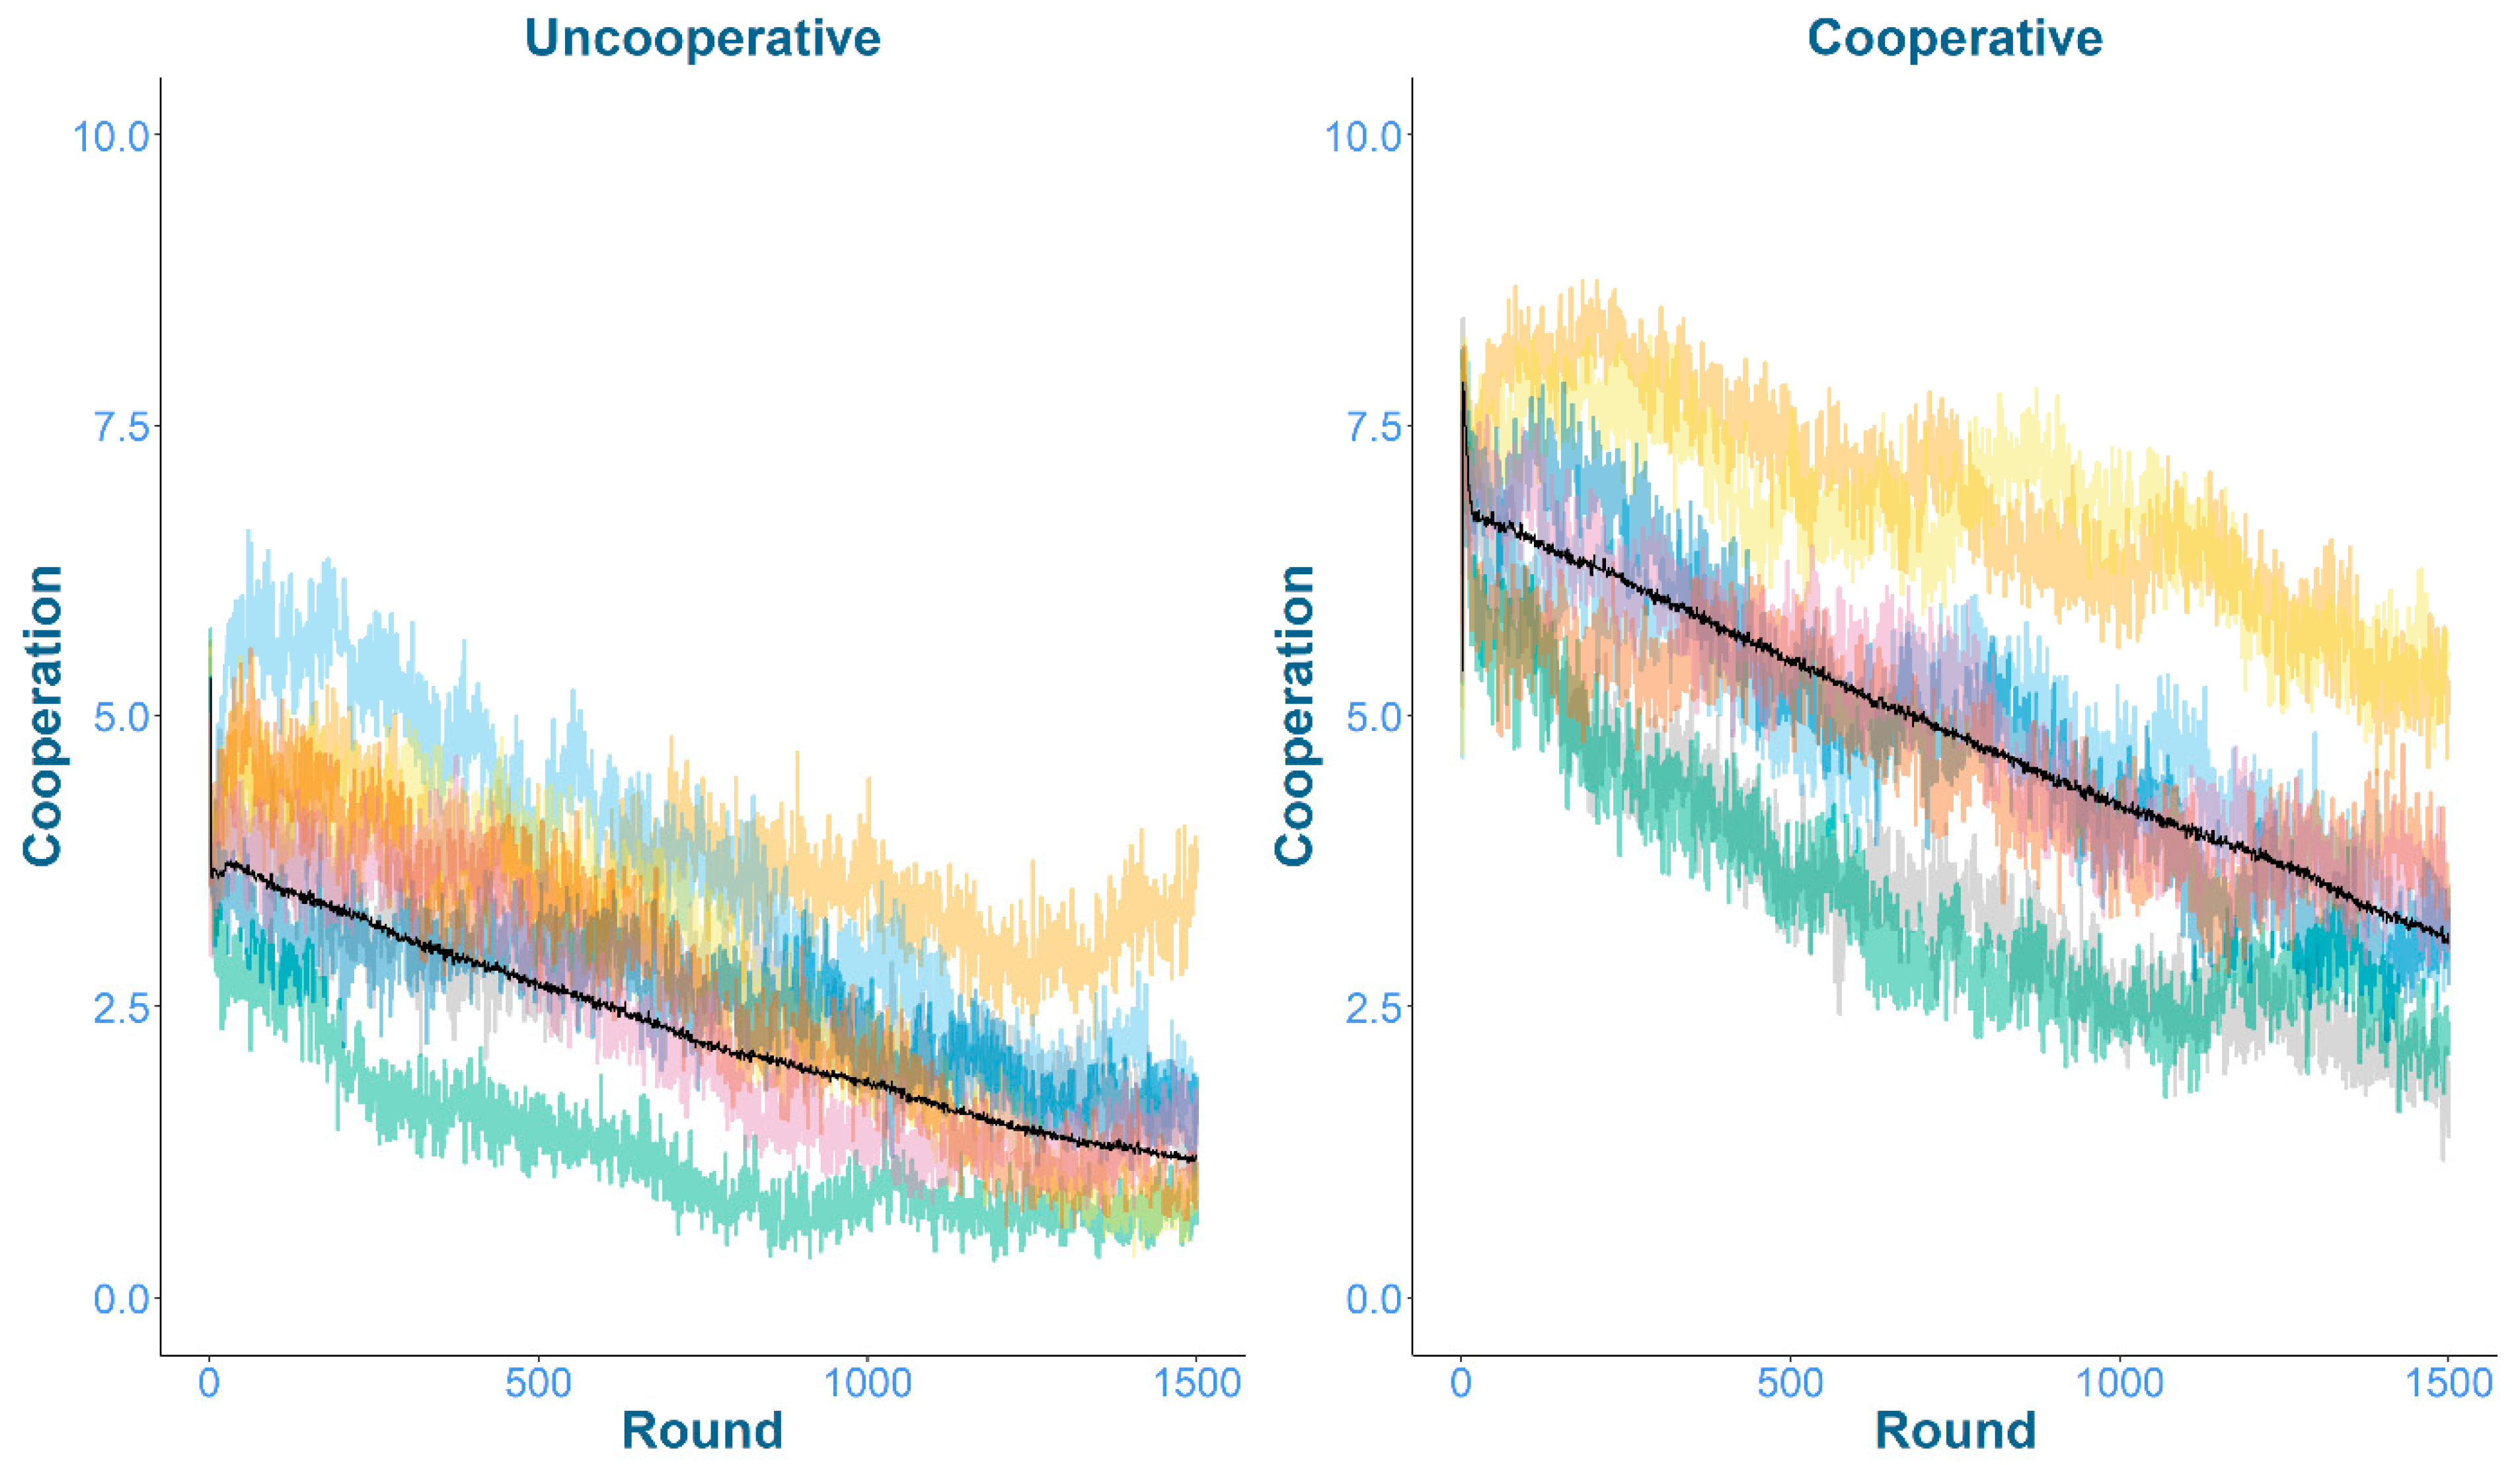
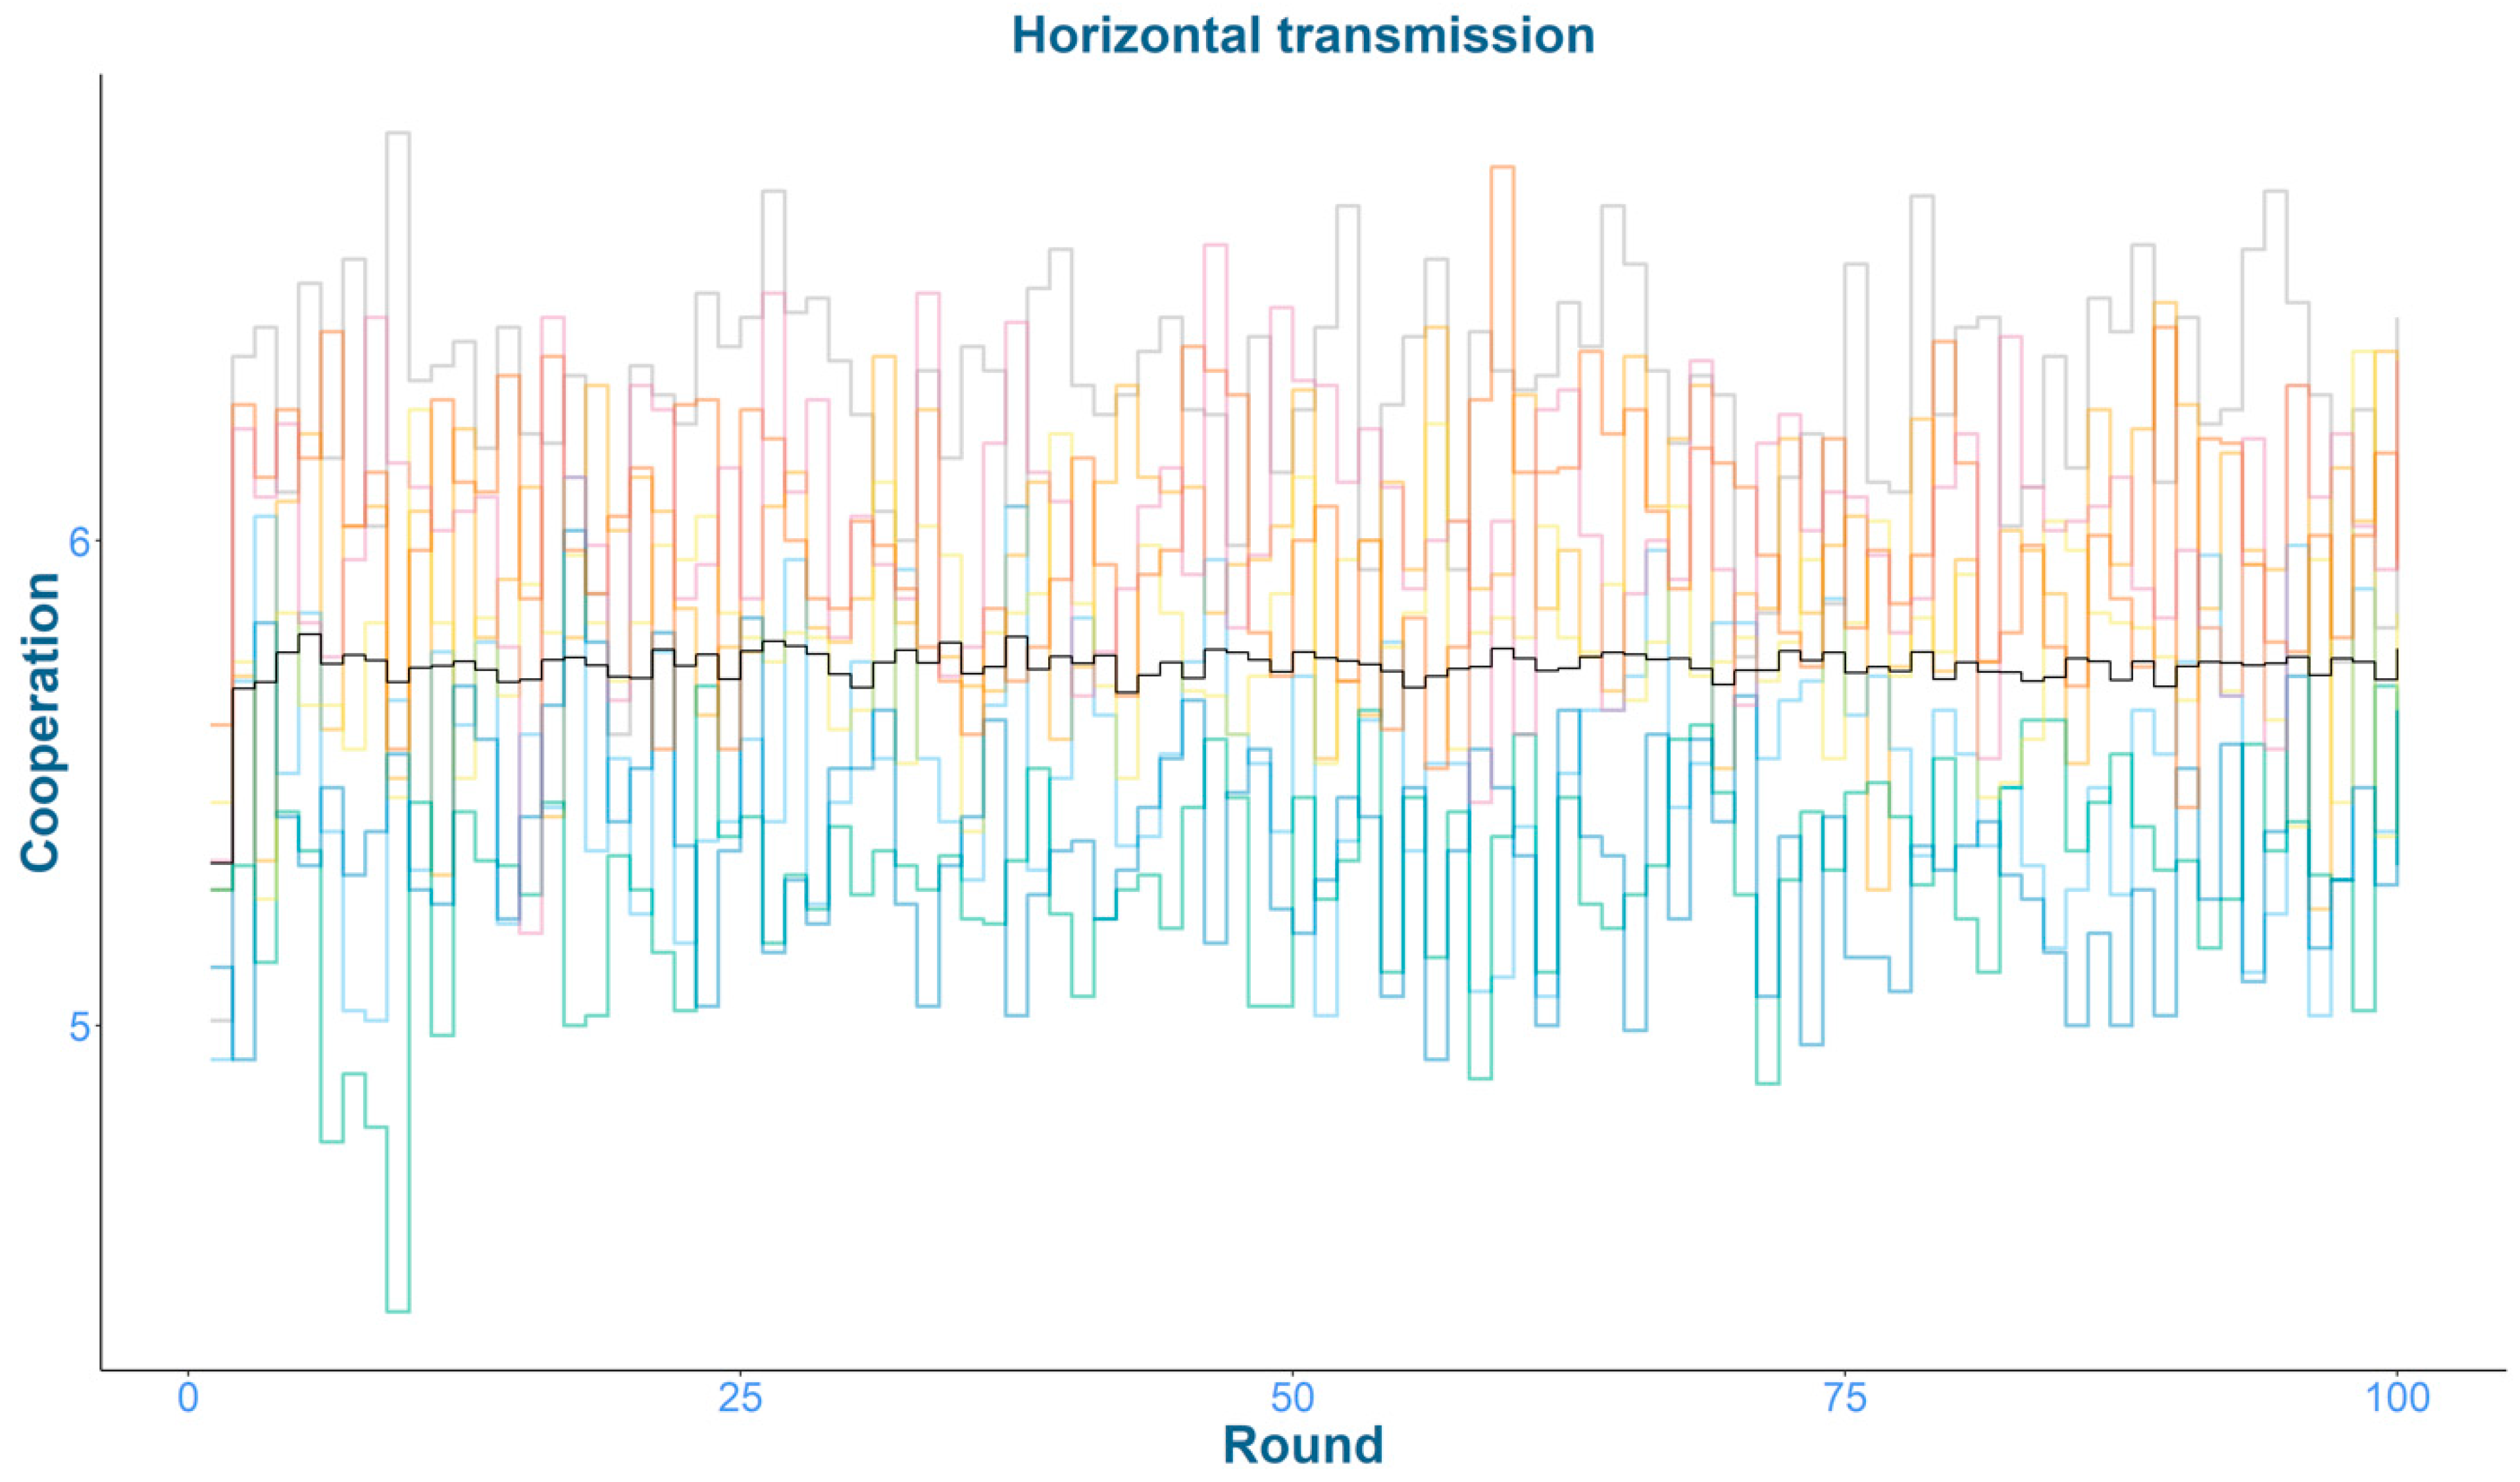
Figure 5 shows that for the basic horizontal-transmission simulation, mean cooperation quickly stabilised to a relatively steady state at around a contribution of 5.7, indicating that social learning strategy use is not predicted to cause long-term change in the frequency of cooperation in a population. By comparison, 
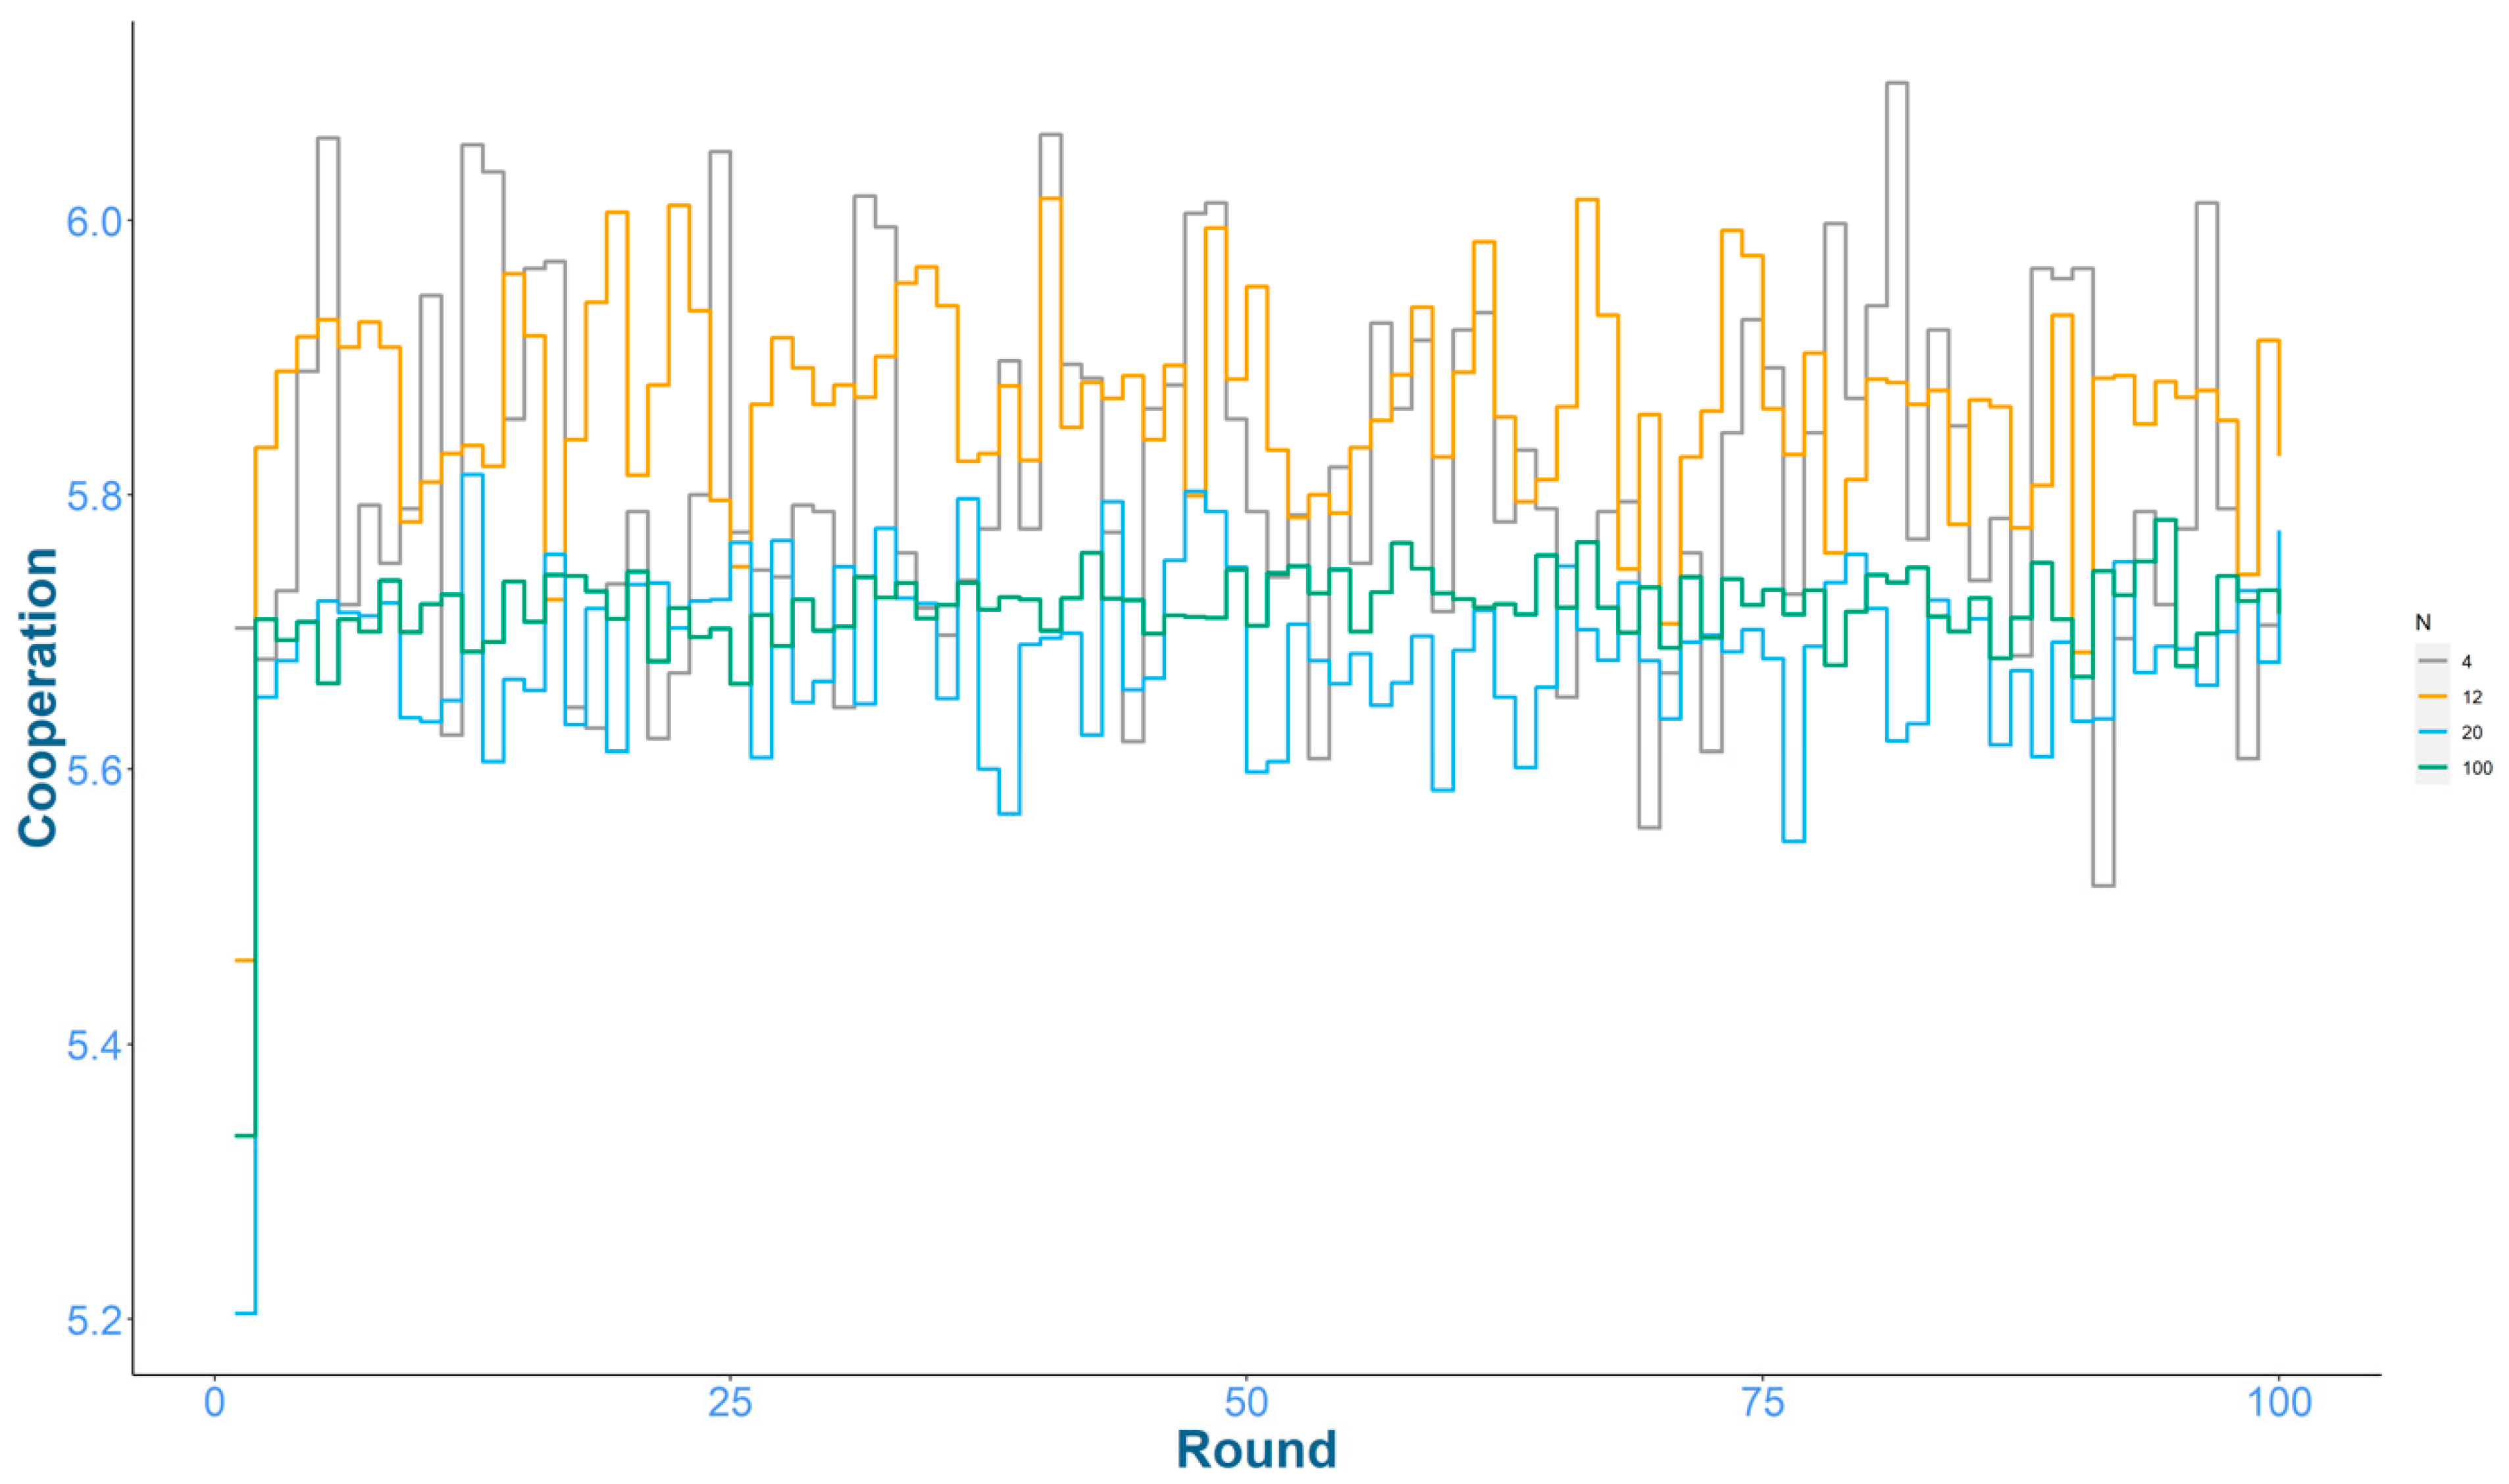
Figure 6 shows that if we force agents to adopt a particular intercept propensity for cooperation (high, low), cooperation stabilises at different levels. Thus, over a long timeframe and provided participants continue to behave on average as they did in the experiment, cooperation levels are far more strongly affected by the intercept propensity for cooperation than by the effects of social learning strategies. We found that group size did not affect these qualitative findings (see Appendix D).
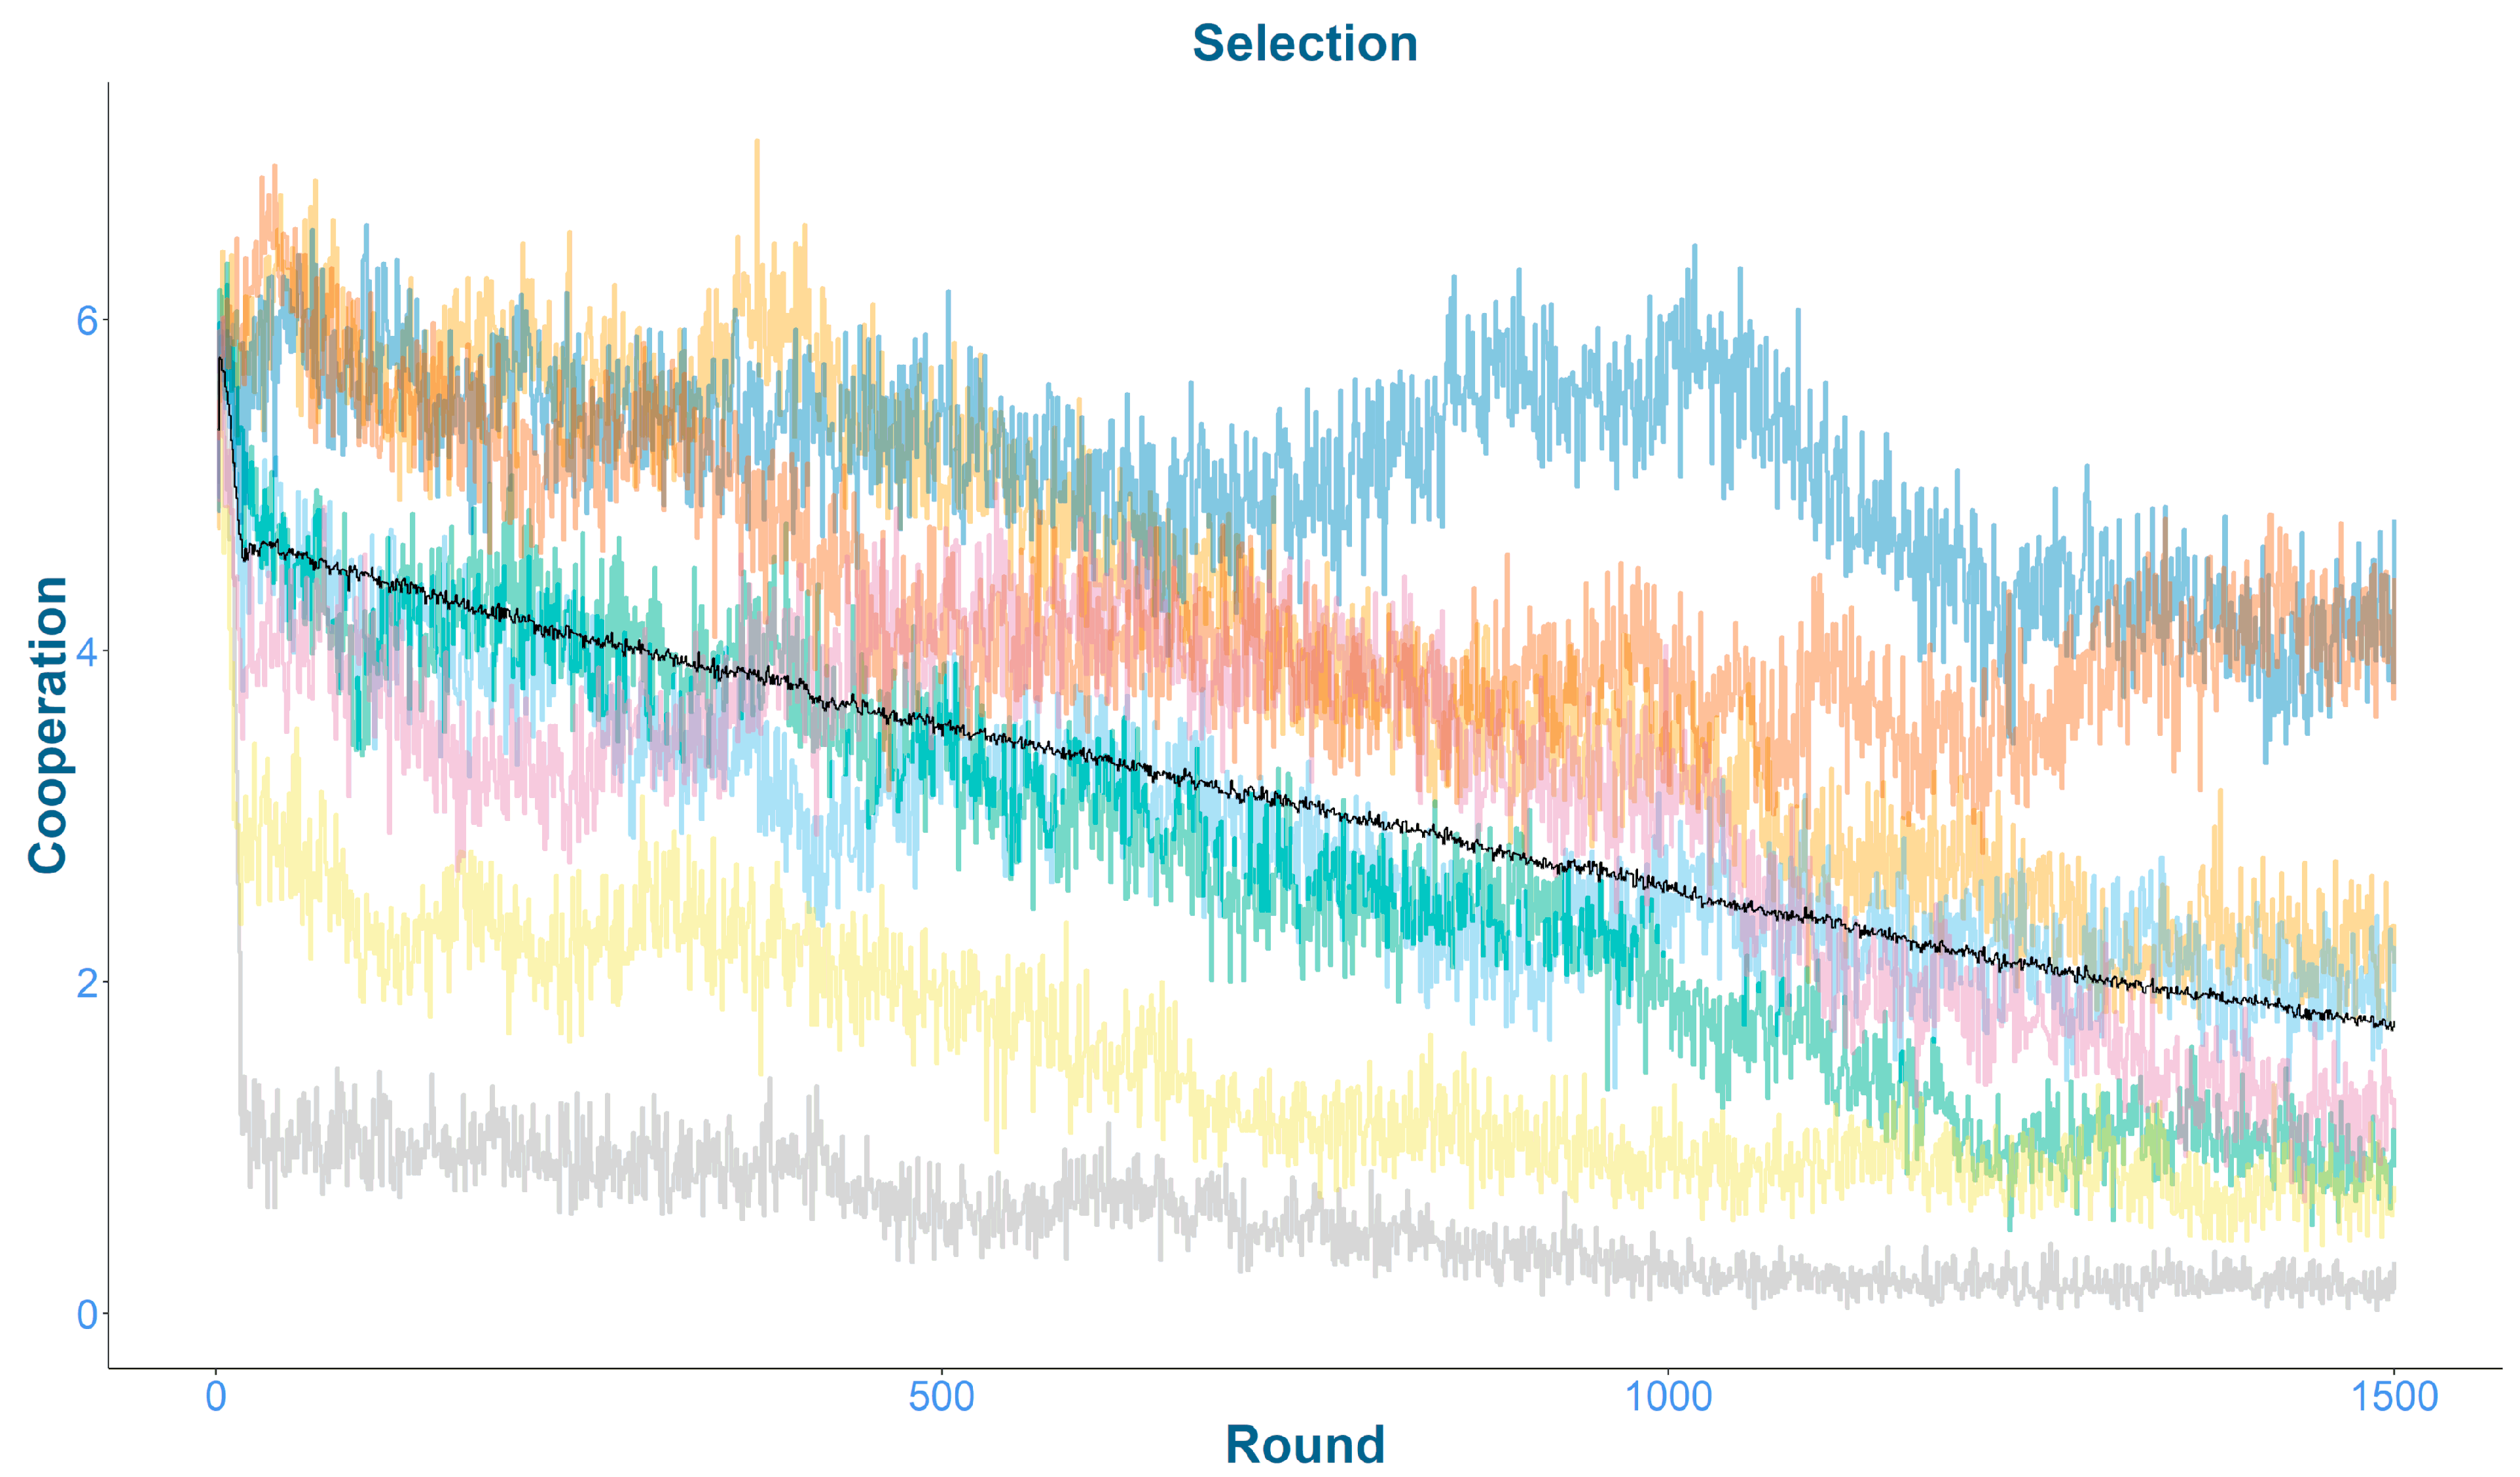
We introduced selection and small random mutation on the intercept propensity for cooperation by assuming intercept values in one round are represented in the next round in proportion to payoffs earned and then altered by a small amount by sampling from a normal distribution around the inherited intercept value. This simulation can either represent selection and mutation across biological generations, or modification of an individual’s propensity for cooperation over time within a generation.
We found that cooperation declined as agents with small intercepts contribute less overall and gain greater payoffs than those with large intercepts (Figure 7). This result illustrates that, as expected for a PD game, the stable degree of cooperation shown in the horizontal transmission model and observed in the experiment is susceptible to selection resulting in evolution towards extinction. For further detail on the simulation model, see Appendix D.

3. Discussion

This experiment sought to test multiple predictions. Specifically, whether there is evidence for the use of social learning in social dilemmas and if so, which social learning strategy between payoff bias, conformity, and prestige bias did participants appear to be following. Further, comparisons were made between Prisoner’s dilemma and Snowdrift public goods games. Finally, the statistical estimates of parameters contributing to behaviour in the experiment were fed into a simulation model to predict long-term trends, examining group size and the effects of selection on the propensity for cooperation.
We found evidence for the use of payoff biased learning in social dilemmas, but little support for prestige or conformity. However, the overall impact of the social learning strategies on cooperative behaviour was small. There was little evidence of an interaction between game structure and social learning strategy use. Payoff biased copying has also been found in previous social dilemma experiments where, in each case, social learning and specifically, payoff biased copying eroded cooperation [43,44]. These findings add to the growing evidence of payoff biased social learning in a variety of other contexts and species [67,68,69,70,71].
In our experiment we found no strong evidence for the use of conformity. Theoretically, conformity may influence patterns of cooperation, but it can often depend on the initial composition of the population [25], or other complementary mechanisms such as network reciprocity [72]. In social dilemma experiments, conformity can sometimes increase cooperation, though it is outperformed by stronger cues such as reciprocity [26,27], is often ignored [43], or increases cheating [73,74]. Outside of cooperative contexts, frequency information is only used if payoff information is unreliable [75], which may explain our findings. Despite this, a null result in our experiment does not necessarily imply conformity is unimportant for the evolution of cooperation. One of the benefits of strong conformity, often absent from experimental research [76], is the spread of shared cultural norms or values, which in turn, can facilitate cooperation [77].
The absence of a strong prestige bias was unexpected. Of the little research available, the effect of prestige or leadership on cooperative behaviour seems overwhelmingly positive [28,29,31,33,38]. While our study suggests that prestige does not influence cooperation as strongly as other research has suggested, there are several possible reasons for this. Like conformity, it may be that prestige was not used because accurate payoff information was available. By definition, prestige serves as a heuristic to be used when payoff information is ambiguous or unavailable [78], which has been demonstrated in an experimental setting [79]. It is also important to consider the way prestige was defined in this experiment. A prestigious individual is defined as someone with either high general skill and knowledge and/or with a large following [20,80]. Our operationalization of prestige using a quiz follows other studies that have successfully used this approach [38,79,81]. Nonetheless, the possibility remains that our participants did not consider the winner of the quiz to be prestigious in the context of the social dilemma. Moreover, high scoring individuals demonstrated skill in the same domain as the context in which they could be copied (the social dilemma game) rather than a potentially less “useful” general knowledge.
It should be noted that, even for payoff bias, the effects sizes associated with social learning strategies were not particularly large and were all associated with a good deal of uncertainty. This was reflected in the patterns of model comparison which showed only small differences in WAIC scores between competing models, which suggests that each model would make roughly similar out-of-sample predictions. In addition, the simulation model indicated that social learning strategies did not cause a significant change in cooperation which, instead, was determined by individual propensities for cooperation (determined by intercepts). Furthermore, when asked, after their participation in the game, whether they used the social information in some way, only 28% of participants (that responded) said yes.
We found lower levels of cooperation in the social information condition than the asocial condition. Although a concern for reputation might suggest that cooperative acts are more common when such behaviour is observable [82,83], overwhelmingly, classic economic games which provide breakdowns of group mates’ behaviours, find free riding to be the dominant strategy [2,9]. In a study which compared playing with and without information about group mates’ behaviour, higher contributions were found in groups where no information was available [46,84]. These, and our, findings suggest that providing social information reduces cooperation. One explanation is that social information is used to update beliefs about how little other group members are contributing [85].
Finally, as predicted, we found evidence of higher levels of cooperation in the SD game compared with the PD. Although the effect was small, this result is consistent with existing theoretical work [50,53] as well as biological [54,55] and experimental evidence [57,59] which predict higher cooperation in SD than PD.
There are several methodological aspects of our study worth addressing. Unlike most other studies which consider SD games using one shot or binary interactions, we allowed contributions on a continuous scale across multiple rounds. The setup of our SD game represented an extremely harsh SD game (e.g., compared to [62,65]) where a failure to meet the public good threshold resulted in a complete loss of all individuals’ payoffs for that round. Many formulations (though often binary cases) consider such an outcome to result in no change in individuals’ payoffs [50]. In that sense, our experiment may be more akin to a Chicken game, where mutual defection (or failure to swerve) produces an actively deleterious outcome. Nevertheless, the formulation of our experiment still conforms to the characteristic payoff hierarchy of the SD game (where cooperating against defector(s) is preferable to defecting) which applies to real life contexts. For instance, the failure of a population to reach the investment necessary for functional flood defences or invest sufficiently in predator defence could result in the collapse of that population. Therefore, we maintain that the setup of this experiment is a useful approximation of real-life cooperative dilemmas.
The mean group donation displayed in this experiment was around six units (of a possible ten), which showed little decline across rounds. This is unusual for PD social dilemma games, which generally show high initial donations which decline sharply towards the end of the game [9] and average contributions of around 37% [66]. One possibility is the relatively low number of rounds in our experiment, though previous experiments have shown declines within this timeframe [32,43]. Alternatively, participants may have been confused about how the game worked [86]. While this is possible, our self-report measure suggested that participants generally believed they understood how the game worked. A more likely explanation for the elevated contribution rate is the multiplication factor of 2 used in this experiment. High multiplication factors have been found to both raise cooperation rates and slow declines across rounds [87,88].
In our experiment, participants could be socially influenced by others taking part in the same iteration of the social dilemma game. This contrasts with other experimental designs which only allow social learning between groups playing different iterations of the social dilemma game [27,43]. The latter approach has benefits, as it allows social learning to be decoupled from other factors such as reciprocity or the possibility of participants attempting to influence their group mates’ behaviour through their own behaviour. Nonetheless, we consider that the within-group social influence design holds greater ecological validity in simulating situations where people may be socially influenced by those that are participating in the same social dilemma. The decision not to manipulate what social information was offered to participants also approximated a more realistic scenario, allowing each participant to adopt one or more social learning strategies [21,42]. Of course, we cannot discount that participants used some other strategy (or combination of strategies) aside from the ones considered here [75].
Future research could address individual differences in social learning strategy use in the context of cooperation [21,68,89]. A larger sample size than was feasible in our experiment would allow the GLMMs to be extended to include an individual slope for each participant and calculate the proportion of participants who employed a given strategy [90]. An alternative might be to allow participants to choose what information they viewed [91]. Further attention should also be given to prestige as we failed to document a strong effect in contrast to clear predictions from theoretical models [28,29]. To address the possibility that our operationalization of prestige was not relevant to participants in this experiment, it would be useful to consider a different definition of prestige, perhaps one based on popularity [79]. Experiments could also investigate other game structures than those considered here, such as the stag hunt game [92,93]. Finally, it would be useful to consider social learning strategies within real-world cooperative scenarios. For example, normative messages are widely used in interventions to reduce household energy use [94] and cultural group selection has been applied to understand the transmission of lobstering practices in Maine [95]. Both our study and the literature suggest that payoff bias may affect cooperative behaviour within applied settings. However, given the overwhelming effect of intercept variation in our study, it may also be important to consider factors such as personality and the socio-cultural environment that shapes the development of inclinations to cooperate.

4. Materials and Methods

4.1. Design

The experiment involved four conditions in a between participants 2 × 2 factorial design. Factor one was the social information condition (Asocial vs. Social) which manipulated whether the participants had access to social information (see below). Factor two was the payoff structure (Prisoner’s dilemma vs. Snowdrift). We used post hoc model selection to infer which social learning strategies had been used.

4.2. Materials and Procedure

The experiment was executed using the experimental automation platform Dallinger [96] which recruits participants via Amazon’s Mechanical Turk. Upon arrival into the virtual environment, participants were assigned to a group and a unique numerical participant ID was generated for them. Once the group contained four participants, the experiment began. It was split into two parts and all participants completed both parts.
Participants first completed a ten-item quiz containing a variety of questions assessing their understanding of how social groups work to act as a proxy for prestige (see Supplementary Materials). Each question had three possible answers with one (pre-determined) correct answer. At the end of the quiz, a public congratulation was displayed on screen for the participant who gave the most correct answers. For the rest of the experiment, this participant’s ID was displayed surrounded by stars (*) and participants were aware this identified the top quiz scoring participant. The questions and scoring were identical across experimental conditions and at no point were participant’s actual scores revealed.
Following the quiz, all four participants took part in a six-round public goods social dilemma game (PGG) with either a PD or SD payoff structure, designed in accordance with typical PGGs found in the literature [97]. Participants did not know ahead of time, how many rounds they would be playing, but received detailed instructions on how the game worked (see Supplementary Materials) and that they would receive a bonus payment depending on their score. In the PD, in each round, participants were granted 10 points and could then decide how much of this to donate to a pot. The pot was then doubled and split evenly between all players. The points received from the pot were then added to what the participant had kept for themselves which formed their total score for that round.
The SD game had the following modification: if the donations to the pot were less than 10, all participants received nothing for that round (including losing whatever points they had kept for themselves). This was motivated by precedent as SD models have previously employed similar payoff structures [53]. Moreover, the snowdrift game requires that defection offers the best payoff against a cooperator but cooperating is favourable to defection against another defector [50]. In a real-life environment, this implies the public good is unreachable without some minimum investment. Therefore, a value of 10 is chosen as this allowed a single participant to meet the necessary threshold in a single round.
In the asocial condition, participants received no information about their groupmates’ behaviour and only received feedback on their own earnings from the round (calculated based on the amount received from the pot and what they kept). In the social information condition, at the end of each round, participants viewed a table showing each group member’s ID, their contribution to the pot for that round, their cumulative score and the average donation across the group. The participant with the most cumulative points was labelled as the current leader with text beside their ID (see Supplementary Materials). The participant who scored the highest in the quiz was also labelled with stars (*) around their name. This information could be used if participants engaged in particular social learning strategies: the average donation for conformity; the identification of the PGG leader for a payoff bias; and the identity of the individual who scored the highest in the quiz as a proxy for prestige.
Once the social dilemma game was completed, participants were debriefed, and basic demographic information was collected. Participants also answered two short free text questions to explain their decisions in the experiment (see Supplementary Materials). Participants were also asked to rate their understanding of the game to ensure they had understood the protocol [86].

4.3. Participants

Participants were recruited using Amazon’s Mechanical Turk and completed the experiment online. After filtering out groups with missing data (exclusion criteria is described below) this left 286 participants in the dataset. Of those participants, for whom demographic information was available, the median age was 32.5 years (IQR = 13 years) with 181 men, 97 women, and 1 non-binary individual. Participants self-identified as White (195), Black (23), Asian (21), Hispanic (11), other (12), or did not report this information (21). The experiment took between 5 and 10 min to complete. Participants earned a minimum of $1 for completing the experiment but could earn a further maximum bonus of $3 dependent upon their cumulative points score. On average, participants earned a bonus of $1.62, resulting in them earning above US federal minimum wage. Despite equal recruitment across conditions, there were unequal completion rates (see Table 4). The required sample size was determined using simulated data (code available at https://osf.io/vx78c/ accessed on: 21 November 2021)

4.4. Data Analysis

All analyses were pre-registered on open science (https://osf.io/vx78c/ accessed on: 21 November 2021), though minor deviations to this are explained below. Analyses were performed in R studio version 4.0.0 [98] using the packages tidyverse, ggplot2, and brms [99]. Though the use of rethinking was pre-registered, brms creates equivalent models and both packages use MCMC (Markov chain Monte Carlo) to construct the posterior distribution. Groups were excluded from analysis if either; the group had fewer than three participants complete the experiment (to avoid 1:1 return from investment and collapse of the social dilemma [2]) or the individual who scored the highest in the quiz had dropped out. This also deviated from pre-registration, where any groups of less than four were planned to be dropped. This was necessary to maintain sufficient power because far more groups than anticipated were incomplete. The analysis excluded the first round’s donation behaviour, as participants in the social information condition had not viewed any social information by this point. Finally, it was pre-registered that only the social condition would be used in models evaluating social learning strategies. Adding the interaction with the binary variable social meant it was not necessary to filter the data in this way.
Cooperation (whole number of points donated between 0 and 10) was treated as a categorical variable for the purposes of the models, so Bayesian ordered probit regressions were fit to the data. An ordinal outcome was appropriate for cooperation, as it is not truly a continuous measure and using a cumulative log odds link function permits non-linearity between the levels of the variable. Bayesian models were fit using the brms package [99] and the posterior distribution constructed using MCMC and main model results validated in JAGS. All models were fit with four chains of 1000 warmup samples and 5500 samples for inference, using weakly regularising priors. Model diagnostics indicated good parameter identification and model convergence (Rhat values between 1.00 and 1.01 and lowest bulk effective sample size > 2500).
Multiple models were fit to evaluate each research question, each containing different combinations of predictor variables. Though each model differed in terms of additional predictor variables (described in the respective sections), all models contained a random effect of participant to account for autocorrelation between repeat observations and variability between participants. The models used to infer the effect of social learning strategies on the degree of cooperation also contained binary variable fixed effects of game structure (snowdrift), social information condition (social) and being prestigious (prestigious participant, see Appendix C) to act as control variables. For social, the integer 1 indicated it was the social information condition, for snowdrift the integer 1 indicated it was the snowdrift condition and prestigious participant the integer 1 indicated they were the prestigious participant.
The structure of the Prestige + Conformity + Payoff model is shown below, where Cooperation is predicted by a vector of probabilities p and each response value k is linked to an intercept parameter ak, with additional deviation from participant level effects ( ε p a r t i c i p a n t )   and slopes for each of the possible predictors (e.g., payoff bias, prestige bias, and conformity). This produced an estimate of the cumulative log odds for all values of cooperation.
C o o p e r a t i o n   ~   C a t e g o r i c a l ( p )
p k = { q k ,     k = 1 q k q k 1 ,     k > 1  
l o g i t ( q k ) = { α k ϕ ,     1 k 10         I n f ,     k = 11
ϕ = β 1 s n o w d r i f t + β 2 p r e s t i g i o u s   p a r t i c i p a n t + S s o c i a l + ε p a r t i c i p a n t
S = ( β 3 + β 4 p r e s t i g e   b i a s + β 5 p a y o f f   b i a s + β 6 c o n f o r m i t y   b i a s )
α 1 : 10   ~   N o r m a l ( 0 ,   1.5 )
β 1 : 6   ~   N o r m a l ( 0 , 1 )
ε 1 : 286 ~ N o r m a l ( 0 ,   σ )
σ ~ E x p o n e n t i a l ( 1 )
The predictive ability of competing models was evaluated using Widely Applicable Information Criteria (WAIC) which is computed from the log likelihoods of models and a parameter penalty to ensure predictive ability is balanced against the risks of overfitting. The calculated value indicates predicted out-of-sample deviance, where lower values indicate lower deviance (and thus, better fit). Following model evaluation, model predictions were plotted to visualise the results. Note that all model predictions were generated using the average of the participant effects. For further discussions on this approach, see [100,101].

4.5. Simulation Model

We simulated the long-term consequences of participant behaviour, as estimated by the Bayesian model (see Appendix D for full details of the simulation). In the basic horizontal-transmission model, agents played repeated PD games. Like the experiment, at each round agents donated between 0 and 10 units and received a payoff according to their donation and the total in the public good. Each agent’s contribution for the next round, was calculated by sampling from the posterior of the Bayesian model that includes all three social learning strategies. Additionally, each agent had an intercept parameter, which can be thought of as their baseline propensity towards cooperation, independent of their social learning strategy use, drawn from the posterior distribution of intercepts estimated from the experiment.
In addition to matching the simulated conditions to those of the experiment, we also examined dynamics across different group sizes (see Appendix D) and varied agent intercept values to establish their influence on dynamics over that of the social learning strategies estimated from the experiment. We also introduced selection to examine what happens if, consistent with the replicator equation [40], the distribution of agent intercept values changes each round (or timestep) in proportion to the payoffs received by the agents.

Supplementary Materials

The following are available online at https://osf.io/vx78c. Table S1: Quiz questions and instructions for part 1, Table S2: Participant interface.

Author Contributions

Conceptualization and methodology, R.W., R.L.K., J.K., J.V.d.V.; resources, R.W., T.J.H.M., R.L.K., J.V.d.V., J.K., software and investigation, R.W., T.J.H.M.; validation and data curation, R.W.; formal analysis, R.W., T.J.H.M., J.K.; writing—original draft preparation, R.W.; writing—review and editing, R.W., T.J.H.M., R.L.K., J.V.d.V., J.K.; supervision and project administration, R.L.K., J.V.d.V., J.K., funding acquisition, R.W. All authors have read and agreed to the published version of the manuscript.

Funding

ESRC PhD studentship awarded to RW (ES/P000762/1).

Institutional Review Board Statement

The study was conducted according to the guidelines of the Declaration of Helsinki, and approved by the department of Anthropology ethics committee of Durham University (25 September 2019).

Informed Consent Statement

Informed consent was obtained from all participants involved with the study.

Data Availability Statement

The data and analysis scripts used in this study are openly available here (https://osf.io/vx78c (accessed on 21 November 2021)).

Conflicts of Interest

The authors declare no conflict of interest.

Appendix A. Free Text Responses

During debriefing and collection of demographic information, participants were asked to provide free text responses (of any length) to two questions. “How do you think most people would say you should behave in this game?” and, “Why did you choose to behave how you did in the game?”. Overall, most responses were comments unrelated to the question such as “good” or were too vague to determine their meaning (for example, “like you normally would behave”). Where possible, comments were grouped according to themes in participant’s responses.
Question 1 (Table A1) sought to identify if there was any pattern in social norms participants felt were associated with the game. Of those that could be grouped, 90 participants either directly suggested cooperative behaviour (or a synonym of this) or made some reference to “fair” or group beneficial behaviour. Twenty-one suggested behaviours should be sensitive to the behaviour of others, which indicates concerns for reciprocity. In this sample, only 11 participants noted selfish behaviour as the expected norm. A further 14 participants indicated they didn’t know or that they expected variability in individuals’ opinions. Nevertheless, the general expected norm for participants in this experiment was for cooperative behaviour.
Table A1. Summed responses from the question “How do you think most people would say you should behave in the game” grouped according to the theme of the response.
ThemeCount
Unrelated/Unclear comments148
Behave cooperatively/alluding to “fair play”90
Reciprocate others cooperation or behave tactically in response to others21
Unsure/provided no strong indication14
Behave selfishly or for your own personal benefit11
Question 2 (Table A2) sought to better understand the conscious decision making made by participants in this experiment. The two most common themes (40 and 39 participants respectively) were comments suggesting maximising earnings or that decisions were based on observing their groupmates. It should be noted that, although 39 participants reported basing their decisions on their group mates, no participant made explicit mention of any social learning strategies. Twenty-six participants claimed to be seeking to actively benefit their group and a further nine did so irrespective of their group’s contributions. This conforms somewhat with findings from experimental games which find most participants can be grouped into strong cooperators/free riders, or conditional cooperators [102]. Seventeen participants referenced attempting to behave “fairly” to their group or that it was the “right thing to do”. Five participants reported following no particular strategy (reportedly choosing randomly, in some cases), two alluded to the warm glow effect [103] and feeling good from donating points and one participant reported wanting to “punish” those withholding points.
Table A2. Summed responses from the question “Why did you choose to behave how you did in the game” grouped according to the theme of the response.
ThemeCount
Unrelated/Unclear comments141
Maximise Earnings40
Influenced by group or levels of trust in their group39
Benefit others26
Fairness/morally right17
Unconditional cooperation9
No particular strategy5
Overall, there was considerable variation in participants self-reported behavioural strategies but (aside from being generally influenced by their group) this did not include any explicit references to the social learning strategies addressed in this experiment. This ties into debates from the social learning literature regarding the conscious or unconscious use of social learning strategies [104]. In this case, the patterns associated with social information in our experiment do not appear to have occurred consciously, though the frequent mention of maximising earnings may imply the use of a payoff bias. Of note, participants made no mention of the highest scoring participant in the quiz (the proxy for prestige), which further supports concerns that this individual was not granted high status by participants.

Appendix B. Conformity Variable

As described in the main text, the conformity information used in the models included participant’s own behaviour. Though this is consistent with what participants saw in the experiment, it means that participants contribute to their own social learning parameter, which may inflate the estimate associated with conformity. Therefore, the conformity information is reconstructed to exclude each participants behaviour from the average and the Prestige + Conformity + Payoff model was rerun with this corrected variable. The prestige and payoff bias variables remain the same. Figure A1 shows plotted model predictions from the new model for varying levels of social information and Figure A2 shows model parameters from the corrected model plotted beside the Prestige + Conformity + Payoff model from the main text (uncorrected). The new conformity variable does not change the pattern of predictions. Payoff bias remains the strongest influence on participant cooperation while conformity and prestige remain weakly positive. The effect associated with conformity is virtually unchanged from that of the uncorrected model.
The parameter values are also virtually unchanged. The effect of the social condition remains negative while the difference between the SD and PD remains weakly positive. The social learning parameters did not change at all, meaning payoff bias remains as the most impactful social learning strategy. Therefore, the qualitative interpretations (and, largely, quantitative results) of the study remain unchanged whichever conformity variable is used in the analysis.
Figure A1. Model predictions for the model with corrected conformity information varying the three social learning strategies and holding the other variables constant and setting the other social information at 0. Shaded regions represent the 95% prediction intervals for the mean. Prestige left; conformity middle; payoff; right.
Games 12 00089 g0a1
Figure A2. Posterior distributions and 95% credible intervals for all main effects in the Prestige+Conformity+Prestige model and the model for the uncorrected conformity information.
Games 12 00089 g0a2

Appendix C. Evaluating the Impact of Being Prestigious on Levels of Cooperation

To evaluate the impact of being prestigious on cooperative behaviour, a similar strategy to that of evaluating social condition and game structure was taken. Note that the goal was to evaluate whether the subset of prestigious participants was more cooperative than non-prestigious participants. This is separate from the question addressed in the main text of whether participants were being influenced by the prestigious individual. The Prestige + Conformity + Payoff model from the main text was compared to an equivalent model which dropped the binary variable for prestige and another which also permitted an interaction with the social condition. This is to assess the possibility that prestigious individuals may have sought to lead their group by example, as is described in theoretical work [28]. If this is the case, it would be expected that increased cooperation would only occur in the social condition (where behaviour is observable). WAIC scores and model weights are reported below (Table A3).
Table A3. WAIC values and model weights for models evaluating the impact of prestige. Standard error difference shows the standard error in the difference between each model and the model with the lowest WAIC value. The * denotes an interaction in the model.
ModelWAICStandard Error DifferenceWeight
Prestige * Social condition5503.100.47
Prestige + Conformity + Payoff5503.70.30.35
No Prestige effect5505.10.60.18
The * denotes an interaction in the model.
As in the evaluation between game structure and social condition, there is similarly no clear distinction between any of the models. The small differences between WAIC indicate considerable uncertainty as to whether prestige should be in the model or not and that each model is likely to make very similar predictions. However, the models which include prestige are slightly favoured over the model that does not, which indicates some improvement in fit (combined weight = 0.82). To help visualise the predicted effects, model predictions from the Prestige * Social condition model are plotted below in Figure A3. There is a slightly greater spread of predicted values for prestigious individuals which is likely explainable by the smaller number of observations. Otherwise, there is little indication of any difference between the prestigious and non-prestigious participants and further, no clear indication of any patterns in the interaction effect. The mean parameter estimate of the fixed effect for prestige in the interaction model was 0.41 (95% PI = −0.18; 1.00) which overlaps 0 quite considerably, indicating uncertainty in the effect. Overall, there is little evidence that prestigious individuals are more cooperative than non-prestigious individuals.
Figure A3. 1000 predictions of mean cooperation drawn from the posterior distribution across all experimental conditions for prestigious (grey) and non-prestigious individuals (yellow).
Games 12 00089 g0a3

Appendix D. Description of the Simulation Model

We constructed a simulation model which emulated the experiment and used the Bayesian posterior distributions and the Prestige + Conformity + Payoff model formula to affect changes in cooperation under various conditions.
At each round, each agent could contribute between 0 and 10 to the public good and then received a payoff calculated from the sum contributions of others divided by group size plus how much they kept (as in the experiment). Agents played in groups of varying sizes (group size is noted for each model below) across 100 rounds. This was repeated for 100 groups. One difference to the experiment was the prestigious agent was assumed to not partake in the public good. Instead, it was assumed that the prestigious agent could only be observed by the population, and their contribution level was set to either 2 or 8 (the value used is specified for each model). This kept the prestige effect consistent between groups as otherwise the prestigious agent’s behaviour would change alongside the other agents. The population was finite and did not change size over time. For simplicity, we simulated only the PD and not the SD payoff structure used in the experiment. Agents change their behaviour using the model formula of the Prestige + Conformity + Payoff model shown below.
C o o p e r a t i o n   ~   C a t e g o r i c a l ( p )
p k = { q k , k = 1 q k q k 1 , k > 1
l o g i t ( q k ) = α k ϕ
ϕ = S + I n t e r c e p t
S = ( β s o c i a l + β p r e s t i g e p r e s t i g i o u s   c o n t r i b u t i o n + β p a y o f f t o p   p a y o f f   c o n t r i b u t i o n n o t   t h e   t o p   e a r n e r + β c o n f o r m i t y a v e r a g e   c o n t r i b u t i o n )
At the start of the simulation, each agent samples from the posterior distribution intercepts ( α k ) from the Bayesian model. These alongside the cooperation values of other agents in the current round are used to calculate S. The exception is the level of cooperation practiced by the prestigious agent, which is always set to 2 (low cooperation) or 8 (high cooperation).
At each round, we calculate a new cooperation value using the model formula above. A vector of probabilities for each level of cooperation (p), comprised of the probability of each individual level of cooperation (k), is used to generate a new value of cooperation from 0–10. p k is calculated by reversing the logit on the vector of cumulative probabilities ( q k ) which is calculated by subtracting the linear model term ( ϕ ) from the cut points ( α k ) sampled from the posterior distribution. ϕ is given by the sum of S (social learning effect) and a varying intercept for each agent which can be thought of as their baseline propensity to cooperate irrespective of social learning. S is calculated using β values sampled from the posterior distribution alongside the social information of the current round. Note that to maintain the degree of parameter uncertainty expressed by the Bayesian model, each agent sampled unique values for the parameters each round when using horizontal transmission.

Appendix D.1. Order of Events

Agents undergo the following steps. Steps 2–3 are repeated 100 times.
  • Determine starting cooperation—An agent’s starting cooperation is determined by sampling from the distribution of cooperation observed in round 2 of the experiment. Additionally, each agent is also assigned an intercept value drawn from the posterior distribution.
  • Public goods game—Agents play in the public goods game and cooperate according to their stored level of cooperation. Like the experiment, the public good is multiplied by 2 and split between all individuals, regardless of contribution. An individual’s payoff for the round is their earnings from the public good + their leftover contribution from 10.
  • Modify behaviour—Agents then independently modify their cooperation for the next round using the model formula shown above. Agents will copy the predicted level of cooperation exactly.

Appendix D.2. Results

See main text for main results.

Appendix D.3. Varying Cooperative Inclination of the Prestigious Individual

Here we compare dynamics across different constant contributions of the Prestigious individual, taking a value of 2 or 8. Figure A4 shows that the mean cooperation is weakly correlated with the degree of cooperation exhibited by the prestigious individual, but does not change the overall pattern of results
Figure A4. Cooperation rates across 100 rounds (N = 100) where cooperation modifies by horizontal transmission only. Low cooperation from the prestigious individual (left) and high cooperation from the prestigious individual (right). Black line shows mean cooperation rates across all groups and coloured lines show cooperation rates for 8 randomly drawn groups.
Games 12 00089 g0a4

Appendix D.4. Varying Group Size

Here we compare the effect of group size upon mean levels of cooperation exhibited across the population. Figure A5 shows that mean cooperation rates stabilise to approximately the same level, irrespective of group size. Though, on average, smaller groups can sustain slightly higher cooperation levels than larger groups.
Figure A5. Cooperation rates across 100 rounds where cooperation modifies by horizontal transmission only for varying group sizes (N = 4 (grey), 12 (gold), 20 (blue), 100 (green)).
Games 12 00089 g0a5

Appendix D.5. Selection Model

The Selection Model assumes there is selection acting on intercept values in proportion to payoffs received, alongside mutation where a value drawn from a normal distribution with mean 0 and standard deviation 0.1 is added to each intercept.
In addition to results reported in the main text, here we report a condition where the initial distribution of intercept values is varied. A cooperative population was one where the population was comprised of intercepts sampled from values in the posterior distribution of above 0. An uncooperative population was one where intercepts were sampled from values in the posterior distribution of below 0. Higher intercept values are more inclined towards higher cooperation and vice versa. The results of this model across 1500 rounds is shown below in Figure A6.
The overall result is unchanged from that of the main text. Both populations trend downwards from their initial starting point at similar rates. Cooperative populations sustain greater cooperation levels on average than uncooperative populations on account of the different starting intercept distributions.
Figure A6. Results from the selection model with varying starting compositions for the intercept values in the population between uncooperative (intercepts < 0, left) and cooperative (intercepts > 0, right). Black line shows mean cooperation rates across all groups and coloured lines show cooperation rates for 8 randomly drawn groups.
Games 12 00089 g0a6

References

  1. Binmore, K. Playing for Real: A Text on Game Theory; Oxford University Press: New York, NY, USA, 2007. [Google Scholar]
  2. Dawes, R.M. Social Dilemmas. Annu. Rev. Psychol. 1980, 31, 169–193. [Google Scholar] [CrossRef]
  3. Hamilton, W.D. The Genetical Evolution of Social Behaviour. I. J. Theor. Biol. 1964, 7, 1–16. [Google Scholar] [CrossRef]
  4. Balliet, D.; Mulder, L.B.; Van Lange, P.A.M. Reward, Punishment, and Cooperation: A Meta-Analysis. Psychol. Bull. 2011, 137, 594–615. [Google Scholar] [CrossRef] [PubMed]
  5. Trivers, R.L. The Evolution of Reciprocal Altruism. Q. Rev. Biol. 1971, 46, 35–57. [Google Scholar] [CrossRef]
  6. Henrich, J.; Muthukrishna, M. The Origins and Psychology of Human Cooperation. Annu. Rev. Psychol. 2021, 72, 1–44. [Google Scholar] [CrossRef]
  7. Kurzban, R.; Burton-Chellew, M.N.; West, S. The Evolution of Altruism in Humans. Ann. Rev. Psychol. 2015, 66, 575–599. [Google Scholar] [CrossRef] [Green Version]
  8. Henrich, J.; Boyd, R.; Bowles, S.; Camerer, C.; Fehr, E.; Gintis, H.; McElreath, R.; Alvard, M.; Barr, A.; Ensminger, J.; et al. “Economic Man” in Cross-Cultural Perspective: Behavioral Experiments in 15 Small-Scale Societies. Behav. Brain Sci. 2005, 28, 795–815. [Google Scholar] [CrossRef] [PubMed] [Green Version]
  9. Fehr, E.; Schurtenberger, I. Normative Foundations of Human Cooperation. Nat. Hum. Behav. 2018, 2, 458–468. [Google Scholar] [CrossRef]
  10. Richerson, P.J.; Baldini, R.; Bell, A.V.; Demps, K.; Frost, K.; Hillis, V.; Mathew, S.; Newton, E.K.; Naar, N.; Newson, L.; et al. Cultural Group Selection Plays an Essential Role in Explaining Human Cooperation: A Sketch of the Evidence. Behav. Brain Sci. 2016, 39, e30. [Google Scholar] [CrossRef] [Green Version]
  11. Smith, D. Cultural Group Selection and Human Cooperation: A Conceptual and Empirical Review. Evol. Hum. Sci. 2020, 2, 1–29. [Google Scholar] [CrossRef] [Green Version]
  12. Heyes, C. Social Learning in Animals: Categories and Mechanisms. Biol. Rev. Camb. Philos. Soc. 1994, 69, 207–231. [Google Scholar] [CrossRef] [PubMed]
  13. Rieucau, G.; Giraldeau, L.A. Exploring the Costs and Benefits of Social Information Use: An Appraisal of Current Experimental Evidence. Philos. Trans. R. Soc. B Biol. Sci. 2011, 366, 949–957. [Google Scholar] [CrossRef] [PubMed] [Green Version]
  14. Mesoudi, A. The Cultural Dynamics of Copycat Suicide. PLoS ONE 2009, 4, e7252. [Google Scholar] [CrossRef] [PubMed] [Green Version]
  15. Boyd, R.; Richerson, P.J. Why Does Culture Increase Human Adaptability? Ethol. Sociobiol. 1995, 16, 125–143. [Google Scholar] [CrossRef]
  16. Schlag, K.H. Why Imitate, and If So, How?: A boundedly rational approach to multi-armed bandits. J. Econ. Theory 1998, 78, 130–156. [Google Scholar] [CrossRef] [Green Version]
  17. Laland, K.N. Social Learning Strategies. Anim. Learn. Behav. 2004, 32, 4–14. [Google Scholar] [CrossRef]
  18. Morgan, T.J.H.; Rendell, L.E.; Ehn, M.; Hoppitt, W.; Laland, K.N. The Evolutionary Basis of Human Social Learning. Proc. R. Soc. B Biol. Sci. 2012, 279, 653–662. [Google Scholar] [CrossRef] [Green Version]
  19. Henrich, J.; Boyd, R. The Evolution of Conformist Transmission and the Emergence of Between-Group Differences. Evol. Hum. Behav. 1998, 19, 215–241. [Google Scholar] [CrossRef]
  20. Henrich, J.; Gil-White, F.J. The Evolution of Prestige: Freely Conferred Deference as a Mechanism for Enhancing the Benefits of Cultural Transmission. Evol. Hum. Behav. 2001, 22, 165–196. [Google Scholar] [CrossRef]
  21. Kendal, R.; Boogert, N.J.; Rendell, L.; Laland, K.N.; Webster, M.; Jones, P.L. Social Learning Strategies: Bridge-Building between Fields. Trends Cogn. Sci. 2018, 22, 651–665. [Google Scholar] [CrossRef] [Green Version]
  22. Powers, S.T.; Van Schaik, C.P.; Lehmann, L. How Institutions Shaped the Last Major Evolutionary Transition to Large-Scale Human Societies. Philos. Trans. R. Soc. B Biol. Sci. 2016, 371, 20150098. [Google Scholar] [CrossRef] [PubMed] [Green Version]
  23. Henrich, J. The Secret of Our Success; Princeton University Press: Princeton, NJ, USA, 2018. [Google Scholar]
  24. Lewis, P.R.; Ekart, A. Social and Asocial Learning in Collective Action Problems: The Rise and Fall of Socially-Beneficial Behaviour. In Proceedings of the Proceedings—2017 IEEE 2nd International Workshops on Foundations and Applications of Self* Systems, FAS*W 2017, Tucson, AZ, USA, 18–22 September 2017; pp. 91–96. [Google Scholar] [CrossRef] [Green Version]
  25. Carpenter, J.P. When in Rome: Conformity and the Provision of Public Goods. J. Socio-Econ. 2004, 33, 395–408. [Google Scholar] [CrossRef]
  26. Bardsley, N.; Sausgruber, R. Conformity and Reciprocity in Public Good Provision. J. Econ. Psychol. 2005, 26, 664–681. [Google Scholar] [CrossRef]
  27. Romano, A.; Balliet, D. Reciprocity Outperforms Conformity to Promote Cooperation. Psychol. Sci. 2017, 28, 1490–1502. [Google Scholar] [CrossRef] [PubMed]
  28. Henrich, J.; Chudek, M.; Boyd, R. The Big Man Mechanism: How Prestige Fosters Cooperation and Creates Prosocial Leaders. Philos. Trans. R. Soc. B Biol. Sci. 2015, 370, 20150013. [Google Scholar] [CrossRef] [PubMed] [Green Version]
  29. Molleman, L.; Quiñones, A.E.; Weissing, F.J. Cultural Evolution of Cooperation: The Interplay between Forms of Social Learning and Group Selection. Evol. Hum. Behav. 2013, 34, 342–349. [Google Scholar] [CrossRef]
  30. Lehmann, L.; Feldman, M.W. The Co-Evolution of Culturally Inherited Altruistic Helping and Cultural Transmission under Random Group Formation. Theor. Popul. Biol. 2008, 73, 506–516. [Google Scholar] [CrossRef] [PubMed] [Green Version]
  31. Gächter, S.; Nosenzo, D.; Renner, E.; Sefton, M. Who Makes a Good Leader? Cooperativeness, Optimism, and Leading-by-Example. Econ. Inq. 2012, 50, 953–967. [Google Scholar] [CrossRef] [Green Version]
  32. Harrell, A.; Simpson, B. The Dynamics of Prosocial Leadership: Power and Influence in Collective Action Groups. Soc. Forces 2016, 94, 1283–1308. [Google Scholar] [CrossRef] [Green Version]
  33. De Cremer, D.; Van Knippenberg, D. How Do Leaders Promote Cooperation? The Effects of Charisma and Procedural Fairness. J. Appl. Psychol. 2002, 87, 858–866. [Google Scholar] [CrossRef]
  34. Offord, M.; Gill, R.; Kendal, J. Leadership between Decks: A Synthesis and Development of Engagement and Resistance Theories of Leadership Based on Evidence from Practice in Royal Navy Warships. Leadersh. Organ. Dev. J. 2016, 37, 289–304. [Google Scholar] [CrossRef] [Green Version]
  35. Offord, M.; Gill, R.; Kendal, J. The Effects of Prestige on Collective Performance and Information Flow in a Strictly Hierarchical Institution. Palgrave Commun. 2019, 5, 1–11. [Google Scholar] [CrossRef]
  36. Wood, N.T.; Herbst, K.C. Political Star Power and Political Parties: Does Celebrity Endorsement Win First-Time Votes? J. Political Mark. 2007, 6, 141–158. [Google Scholar] [CrossRef]
  37. John, P.; James, O.; Moseley, A.; Ryan, M.; Richardson, L.; Stoker, G. The Impact of Peer, Politician, and Celebrity Endorsements on Volunteering: A Field Experiment with English Students. J. Nonprofit Public Sect. Mark. 2019, 31, 328–346. [Google Scholar] [CrossRef]
  38. Kumru, C.S.; Vesterlund, L. The Effect of Status on Charitable Giving. J. Public Econ. Theory 2010, 12, 709–735. [Google Scholar] [CrossRef] [Green Version]
  39. Schlag, K.H. Which One Should I Imitate? J. Math. Econ. 1999, 31, 493–522. [Google Scholar] [CrossRef]
  40. Taylor, P.D.; Jonker, L.B. Evolutionary Stable Strategies and Game Dynamics. Math. Biosci. 1978, 40, 145–156. [Google Scholar] [CrossRef]
  41. Grujić, J.; Lenaerts, T. Do People Imitate When Making Decisions? Evidence from a Spatial Prisoner’s Dilemma Experiment: Do People Imitate When Making Decisions. R. Soc. Open Sci. 2020, 7, 200618. [Google Scholar] [CrossRef]
  42. Molleman, L.; van den Berg, P.; Weissing, F.J. Consistent Individual Differences in Human Social Learning Strategies. Nat. Commun. 2014, 5, 1–9. [Google Scholar] [CrossRef]
  43. Burton-Chellew, M.N.; el Mouden, C.; West, S.A. Social Learning and the Demise of Costly Cooperation in Humans. Proc. R. Soc. Lond. B Biol. Sci. 2017, 284, 10–12. [Google Scholar] [CrossRef]
  44. Burton-Chellew, M.N.; Nax, H.H.; West, S.A. Payoff-Based Learning Explains the Decline in Cooperation in Public Goods Games. Proc. R. Soc. B Biol. Sci. 2015, 282, 20142678. [Google Scholar] [CrossRef] [Green Version]
  45. Burton-Chellew, M.N.; West, S.A. Payoff-Based Learning Best Explains the Rate of Decline in Cooperation across 237 Public-Goods Games. Nat. Hum. Behav. 2021, 5, 36–38. [Google Scholar] [CrossRef] [PubMed]
  46. Neugebauer, T.; Perote, J.; Schmidt, U.; Loos, M. Selfish-Biased Conditional Cooperation: On the Decline of Contributions in Repeated Public Goods Experiments. J. Econ. Psychol. 2009, 30, 52–60. [Google Scholar] [CrossRef] [Green Version]
  47. Szolnoki, A.; Chen, X. Competition and Partnership between Conformity and Payoff-Based Imitations in Social Dilemmas. New J. Phys. 2018, 20, 093008. [Google Scholar] [CrossRef]
  48. Gürerk, Ö.; Irlenbusch, B.; Rockenbach, B. The Competitive Advantage of Sanctioning Institutions. Science 2006, 312, 108–112. [Google Scholar] [CrossRef] [Green Version]
  49. Rapoport, A. Prisoner’s Dilemma—Recollections and Observations. In Game Theory as a Theory of a Conflict Resolution; Springer: Dordecht, The Netherlands, 1974; pp. 17–34. [Google Scholar]
  50. Doebeli, M.; Hauert, C. Models of Cooperation Based on the Prisoner’s Dilemma and the Snowdrift Game. Ecol. Lett. 2005, 8, 748–766. [Google Scholar] [CrossRef] [Green Version]
  51. Axelrod, R.; Hamilton, W.D. The Evolution of Cooperation. Evolution 1981, 211, 1390–1396. [Google Scholar] [CrossRef] [PubMed]
  52. Kun, Á.; Boza, G.; Scheuring, I. Asynchronous Snowdrift Game with Synergistic Effect as a Model of Cooperation. Behav. Ecol. 2006, 17, 633–641. [Google Scholar] [CrossRef]
  53. Souza, M.O.; Pacheco, J.M.; Santos, F.C. Evolution of Cooperation under N-Person Snowdrift Games. J. Theor. Biol. 2009, 260, 581–588. [Google Scholar] [CrossRef] [Green Version]
  54. Gore, J.; Youk, H.; Van Oudenaarden, A. Snowdrift Game Dynamics and Facultative Cheating in Yeast. Nature 2009, 459, 253–256. [Google Scholar] [CrossRef] [Green Version]
  55. Smith, R.P.; Doiron, A.; Muzquiz, R.; Fortoul, M.C.; Haas, M.; Abraham, T.; Quinn, R.J.; Barraza, I.; Chowdhury, K.; Nemzer, L.R. The Public and Private Benefit of an Impure Public Good Determines the Sensitivity of Bacteria to Population Collapse in a Snowdrift Game. Environ. Microbiol. 2019, 21, 4330–4342. [Google Scholar] [CrossRef]
  56. Keohane, R.O.; Victor, D.G. Cooperation and Discord in Global Climate Policy. Nat. Clim. Chang. 2016, 6, 570–575. [Google Scholar] [CrossRef]
  57. Kümmerli, R.; Colliard, C.; Fiechter, N.; Petitpierre, B.; Russier, F.; Keller, L. Human Cooperation in Social Dilemmas: Comparing the Snowdrift Game with the Prisoner’s Dilemma. Proc. R. Soc. B Biol. Sci. 2007, 274, 2965–2970. [Google Scholar] [CrossRef] [PubMed] [Green Version]
  58. Su, W.; Potenza, M.N.; Zhang, Z.; Hu, X.; Gao, L.; Wang, Y. Do Individuals with Problematic and Non-Problematic Internet Game Use Differ in Cooperative Behaviors with Partners of Different Social Distances? Evidence from the Prisoner’s Dilemma and Chicken Game. Comput. Hum. Behav. 2018, 87, 363–370. [Google Scholar] [CrossRef]
  59. Hilbig, B.E.; Kieslich, P.J.; Henninger, F.; Thielmann, I.; Zettler, I. Lead Us (Not) into Temptation: Testing the Motivational Mechanisms Linking Honesty–Humility to Cooperation. Eur. J. Personal. 2018, 32, 116–127. [Google Scholar] [CrossRef] [Green Version]
  60. Reed, L.I.; Best, C.K.; Hooley, J.M. Cooperation with Characters: How a Partner’s Personality Disorder Decreases Cooperation in Two Economic Games. Personal. Individ. Differ. 2018, 126, 33–37. [Google Scholar] [CrossRef]
  61. Roberts, G.; Sherratt, T.N. Development of Cooperative Relationships through Increasing Investment. Nature 1998, 394, 175–179. [Google Scholar] [CrossRef]
  62. Brown, J.S.; Vincent, T.L. Evolution of Cooperation with Shared Costs and Benefits. Proc. R. Soc. B Biol. Sci. 2008, 275, 1985–1994. [Google Scholar] [CrossRef] [PubMed] [Green Version]
  63. Mcnamara, J.M.; Barta, Z.; Fromhage, L.; Houston, A.I. The Coevolution of Choosiness and Cooperation. Nature 2008, 451, 189–192. [Google Scholar] [CrossRef]
  64. Zhong, L.X.; Qiu, T.; Xu, J.R. Heterogeneity Improves Cooperation in Continuous Snowdrift Game. Chin. Phys. Lett. 2008, 25, 2315–2318. [Google Scholar] [CrossRef]
  65. Sasaki, T.; Okada, I. Cheating Is Evolutionarily Assimilated with Cooperation in the Continuous Snowdrift Game. BioSystems 2015, 131, 51–59. [Google Scholar] [CrossRef] [Green Version]
  66. Zelmer, J. Linear Public Goods Experiments: A Meta-Analysis. Exp. Econ. 2003, 6, 299–310. [Google Scholar] [CrossRef]
  67. Kendal, J.R.; Rendell, L.; Pike, T.W.; Laland, K.N. Nine-Spined Sticklebacks Deploy a Hill-Climbing Social Learning Strategy. Behav. Ecol. 2009, 20, 238–244. [Google Scholar] [CrossRef]
  68. Vale, G.L.; Flynn, E.G.; Kendal, J.; Rawlings, B.; Hopper, L.M.; Schapiro, S.J.; Lambeth, S.P.; Kendal, R.L. Testing Differential Use of Payoff-Biased Social Learning Strategies in Children and Chimpanzees. Proc. R. Soc. B Biol. Sci. 2017, 284, 20171751. [Google Scholar] [CrossRef] [Green Version]
  69. Beheim, B.A.; Thigpen, C.; Mcelreath, R. Strategic Social Learning and the Population Dynamics of Human Behavior: The Game of Go. Evol. Hum. Behav. 2014, 35, 351–357. [Google Scholar] [CrossRef]
  70. Barrett, B.J.; McElreath, R.L.; Perry, S.E. Pay-off-Biased Social Learning Underlies the Diffusion of Novel Extractive Foraging Traditions in a Wild Primate. Proc. R. Soc. B Biol. Sci. 2017, 284, 20170358. [Google Scholar] [CrossRef] [Green Version]
  71. Bono, A.E.J.; Whiten, A.; van Schaik, C.; Krützen, M.; Eichenberger, F.; Schnider, A.; van de Waal, E. Payoff- and Sex-Biased Social Learning Interact in a Wild Primate Population. Curr. Biol. 2018, 28, 2800–2805.e4. [Google Scholar] [CrossRef] [Green Version]
  72. Jiang, L.L.; Li, W.J.; Wang, Z. Multiple Effect of Social Influence on Cooperation in Interdependent Network Games. Sci. Rep. 2015, 5, 1–8. [Google Scholar] [CrossRef] [Green Version]
  73. Diekmann, A.; Przepiorka, W.; Rauhut, H. Lifting the Veil of Ignorance: An Experiment on the Contagiousness of Norm Violations. Ration. Soc. 2015, 27, 309–333. [Google Scholar] [CrossRef]
  74. Gino, F.; Ayal, S.; Ariely, D. Contagion and Differentiation in Unethical Behavior the Effect of One Bad Apple on the Barrel. Psychol. Sci. 2009, 20, 393–398. [Google Scholar] [CrossRef]
  75. McElreath, R.; Bell, A.V.; Efferson, C.; Lubell, M.; Richerson, P.J.; Waring, T. Beyond Existence and Aiming Outside the Laboratory: Estimating Frequency-Dependent and Pay-off-Biased Social Learning Strategies. Philos. Trans. R. Soc. B Biol. Sci. 2008, 363, 3515–3528. [Google Scholar] [CrossRef] [Green Version]
  76. Gächter, S.; Thöni, C. Social Learning and Voluntary Cooperation Among Like-Minded People. J. Eur. Econ. Assoc. 2005, 3, 303–314. [Google Scholar] [CrossRef]
  77. Molleman, L.; Pen, I.; Weissing, F.J. Effects of Conformism on the Cultural Evolution of Social Behaviour. PLoS ONE 2013, 8, e68153. [Google Scholar] [CrossRef] [Green Version]
  78. McElreath, R.; Henrich, J. The Evolution of Cultural Evolution. Evol. Anthropol. 2003, 12, 123–135. [Google Scholar] [CrossRef]
  79. Brand, C.O.; Heap, S.; Morgan, T.J.H.; Mesoudi, A. The Emergence and Adaptive Use of Prestige in an Online Social Learning Task. Sci. Rep. 2020, 10, 1–11. [Google Scholar] [CrossRef]
  80. Jiménez, Á.V.; Mesoudi, A. Prestige-Biased Social Learning: Current Evidence and Outstanding Questions. Palgrave Commun. 2019, 5, 1–12. [Google Scholar] [CrossRef] [Green Version]
  81. Brand, C.O.; Mesoudi, A. Prestige and Dominance-Based Hierarchies Exist in Naturally Occurring Human Groups, but Are Unrelated to Task-Specific Knowledge. R. Soc. Open Sci. 2019, 6, 181621. [Google Scholar] [CrossRef] [Green Version]
  82. Kelsey, C.; Vaish, A.; Grossmann, T. Eyes, More Than Other Facial Features, Enhance Real-World Donation Behavior. Hum. Nat. 2018, 29, 390–401. [Google Scholar] [CrossRef]
  83. Yoeli, E.; Hoffman, M.; Rand, D.G.; Nowak, M.A. Powering up with Indirect Reciprocity in a Large-Scale Field Experiment. Proc. Natl. Acad. Sci. USA 2013, 110, 10424–10429. [Google Scholar] [CrossRef] [Green Version]
  84. Burton-Chellew, M.N.; El Mouden, C.; West, S.A. Evidence for Strategic Cooperation in Humans. Proc. R. Soc. B Biol. Sci. 2017, 284, 20170689. [Google Scholar] [CrossRef]
  85. Fischbacher, U.; Gächter, S. Social Preferences, Beliefs, and the Dynamics of Free Riding in Public Goods Experiments. Am. Econ. Rev. 2010, 100, 541–556. [Google Scholar] [CrossRef] [Green Version]
  86. Ferraro, P.J.; Vossler, C.A. The Source and Significance of Confusion in Public Goods Experiments. BE J. Econ. Anal. Policy 2010, 10. [Google Scholar] [CrossRef]
  87. Gunnthorsdottir, A.; Houser, D.; McCabe, K. Disposition, History and Contributions in Public Goods Experiments. J. Econ. Behav. Organ. 2007, 62, 304–315. [Google Scholar] [CrossRef]
  88. van den Berg, P.; Dewitte, P.; Aertgeerts, I.; Wenseleers, T. How the Incentive to Contribute Affects Contributions in the One-Shot Public Goods Game. Sci. Rep. 2020, 10, 8–12. [Google Scholar] [CrossRef] [PubMed]
  89. Rawlings, B.; Flynn, E.; Kendal, R. To Copy or To Innovate? The Role of Personality and Social Networks in Children’s Learning Strategies. Child Dev. Perspect. 2017, 11, 39–44. [Google Scholar] [CrossRef] [Green Version]
  90. Toyokawa, W.; Whalen, A.; Laland, K.N. Social Learning Strategies Regulate the Wisdom and Madness of Interactive Crowds. Nat. Hum. Behav. 2019, 3, 183–193. [Google Scholar] [CrossRef] [PubMed] [Green Version]
  91. Flynn, E.; Turner, C.; Giraldeau, L.A. Selectivity in Social and Asocial Learning: Investigating the Prevalence, Effect and Development of Young Children’s Learning Preferences. Philos. Trans. R. Soc. B Biol. Sci. 2016, 371, 20150189. [Google Scholar] [CrossRef] [Green Version]
  92. Skyrms, B. The Stag Hunt and the Evolution of Social Structure; Cambridge University Press: Cambridge, UK, 2004. [Google Scholar]
  93. Iyer, S.; Killingback, T. Evolution of Cooperation in Social Dilemmas with Assortative Interactions. Games 2020, 11, 41. [Google Scholar] [CrossRef]
  94. Allcott, H. Social Norms and Energy Conservation. J. Public Econ. 2011, 95, 1082–1095. [Google Scholar] [CrossRef] [Green Version]
  95. Waring, T.; Acheson, J. Evidence of Cultural Group Selection in Territorial Lobstering in Maine. Sustain. Sci. 2018, 13, 21–34. [Google Scholar] [CrossRef] [Green Version]
  96. Dallinger Dallinger. Available online: https://dallinger.readthedocs.io/en/latest/index.html/ (accessed on 21 November 2021).
  97. Fischbacher, U.; Gächter, S.; Fehr, E. Are People Conditionally Cooperative? Evidence from a Public Goods Experiment. Econ. Lett. 2001, 71, 397–404. [Google Scholar] [CrossRef] [Green Version]
  98. Team, R.C. R: A Language and Environment for Statistical Computing; R foundation for Statistical Computing: Vienna, Austria, 2021. [Google Scholar]
  99. Bürkner, P.C. Brms: An R Package for Bayesian Multilevel Models Using Stan. J. Stat. Softw. 2017, 80, 1–28. [Google Scholar] [CrossRef] [Green Version]
  100. McElreath, R. Statistical Rethinking; CRC Press: Boca Raton, FL, USA, 2020. [Google Scholar]
  101. Kruschke, J.K. Doing Bayesian Data Analysis: A Tutorial with R, JAGS, and Stan, 2nd ed.; Academic Press: Cambridge, MA, USA, 2015. [Google Scholar]
  102. Kurzban, R.; Houser, D. Individual Differences in Cooperation in a Circular Public Goods Game. Eur. J. Personal. 2001, 15, S37–S52. [Google Scholar] [CrossRef]
  103. Andreoni, J. Impure Altruism and Donations to Public Goods: A Theory of Warm-Glow Giving. Econ. J. 1990, 100, 464–477. [Google Scholar] [CrossRef] [Green Version]
  104. Heyes, C. Who Knows? Metacognitive Social Learning Strategies. Trends Cogn. Sci. 2016, 20, 204–213. [Google Scholar] [CrossRef] [PubMed]
Figure 1. Cooperation across rounds 2–6 (the first round is excluded because participants had not viewed any social information at that point) between all combinations of experimental conditions. Solid points show mean cooperation and dashed lines show the mean standard error. PD = Prisoner’s dilemma, SD = Snowdrift. N for conditions; Asocial PD = 73; Asocial SD = 84; Social PD = 61; Social SD = 68.
Games 12 00089 g001
Figure 2. Mean parameter estimates and 95% prediction intervals for all main effects in the Prestige + Conformity + Payoff model for the six main effects.
Games 12 00089 g002
Figure 3. Model predictions for Prestige, Conformity and Payoff varying the three social learning strategies and holding the other variables constant and setting the other social information at 0. Shaded regions represent the 95% prediction intervals for the mean. Prestige left; conformity middle; payoff; right.
Games 12 00089 g003
Figure 4. 10,000 predicted values of mean cooperation across all experimental conditions generated from the Social condition*Game structure (interaction) model. Sample means and 95% PI are Asocial PD (M = 6.05; 95% PI = 5.23, 6.85), Asocial SD (M = 6.44; 95% PI = 5.65, 7.20), Social PD (M = 4.89; 95% PI = 3.96, 5.80, Social SD (M = 5.79; 95% PI = 4.91, 6.64).
Games 12 00089 g004
Figure 5. Predicted cooperation across 100 rounds (N = 100) for 100 groups, each consisting of 100 individuals, where, following the experiment, cooperation modifies through horizontal transmission only. Black line shows mean cooperation rates across all groups and coloured lines show cooperation rates for 8 randomly drawn groups.
Games 12 00089 g005
Figure 6. Predicted mean cooperation across 100 rounds (N = 100) for different population compositions as determined by the distribution of intercepts (N = 100). Uncooperative population (left) samples from intercepts below 0 and the cooperative population (right) samples from intercepts above 0.
Games 12 00089 g006
Figure 7. Predicted mean cooperation across 1500 rounds (N = 100) where cooperation modifies by horizontal transmission and intercepts modify through selection and mutation. Black line shows average across 100 groups and coloured lines show cooperation rates for 8 randomly drawn groups.
Games 12 00089 g007
Table 1. Payoffs associated with cooperation (C) and defection (D) depending on the behaviour of a partner between a PD and SD game adapted from Doebeli and Hauert [50]. Both tables show benefit (b) compared to the costs (c). Payoff rankings are DC > CC > DD > CD for the PD game and DC > CC > CD > DD for the SD game.
Prisoner’s DilemmaSnowdrift
CDCD
Payoff to Cb − c−cb − c/2b − c
Payoff to Db0b0
Table 2. WAIC values and model weights for models evaluating the impact of social learning strategies. Standard error difference shows the standard error in the difference between each model and the model with the lowest WAIC value. All social learning parameters interact with the social information condition. Model names indicate which social learning strategies are included. All models include the parameters for game structure and social information condition.
ModelWAICStandard Error DifferenceWeight
Prestige + Payoff5499.500.34
Payoff5499.91.30.27
Asocial5501.23.30.14
Prestige5501.23.00.14
Payoff + Conformity5503.61.30.04
Prestige + Conformity + Payoff5503.70.50.04
Prestige + Conformity5506.63.10.01
Conformity5506.73.30.01
Table 3. WAIC values and model weights for models evaluating the impact of binary experimental condition variables. Standard error difference shows the standard error in the difference between each model and the model with the lowest WAIC value. Model names indicate which predictor variables are included in addition to the social learning strategy parameters. The Prestige + Conformity + Payoff model is the full model containing the social learning strategies and the parameters for game structure and social information condition.
ModelWAICStandard Error DifferenceWeight
Social information condition only5502.300.31
Social information condition * Game structure5502.41.70.29
Game structure only5503.61.10.16
Prestige + Conformity + Payoff5503.70.70.15
No binary variables5505.00.90.08
The * denotes an interaction in the model.
Table 4. Distribution of participants and groups across experimental conditions.
Prisoner’s DilemmaSnowdrift
AsocialSocialAsocialSocial
20 Groups (N = 73)17 Groups (N = 61)24 Groups (N = 84)20 Groups (N = 68)
Publisher’s Note: MDPI stays neutral with regard to jurisdictional claims in published maps and institutional affiliations.

