1. Introduction
Modeling the spread of infectious diseases is one method that can help public health decision makers contain epidemic outbreaks. Such models can predict the outcome of different scenarios to control an outbreak and can facilitate the design and implementation of policies that could contain outbreaks and lower public health cost for society.
Moreover, in recent years, there has been reinforced evidence that the number of infectious diseases has increased in North America due to global warming [
1]. In addition, the WHO has reported that globalization and its effects on economic, environmental, demographic, and topological changes in societies is causing a higher risk of confronting infectious disease [
2].
Consequently, there is increasing need for accurate models that describe the behavior of individuals in response to an epidemic outbreak, along with the resulting societal health consequences. Some factors that play a role in modeling epidemics are the number of infected and vaccinated individuals and their distribution in populations, the cost of being infected, vaccination cost and transmission rate of the disease [
3,
4,
5].
There are various methods for modeling the spread of infectious diseases. Classical models rely on differential equations that assume the models to be deterministic and non-networked. More socially oriented models employ the broadly used method of spatial games. This approach can capture the choice of individuals in populations of interacting players based on their payoffs [
6] where each individual seeks to optimize their utility based on a cost function [
7,
8]. These models can be implemented on a population of players in which all players are in contact with each other or when players are connected using a social interaction network. Generally, network-based models are considered more accurate, since, in the real world, not every individual is in contact with all others [
9]. A good review of modeling infectious diseases can be found in references [
10,
11].
Time delay is a factor that should be considered when modeling disease outbreaks and it is intrinsic to various processes of epidemic outbreaks. Such delays can be due to the time that it takes a population to become aware of an ongoing epidemic (awareness time), the epidemiological time delay (incubation period), or an individual’s delayed response to an outbreak [
12,
13,
14].
Epidemiological delay can be classified as (both/either-or?) latency time and incubation time [
15]. Latency is defined as the period in which a person is exposed to a disease without being infectious. On the other hand, the incubation period is the time between exposure to a pathogenic organism and the time that symptoms of the disease are recognized, during which an infected person may or may not be contagious. Some researchers have considered incubation period and time delay in transmitting a disease in mathematical models. Most of them consider the latent period a time delay for an infected individual to become infectious [
16,
17,
18]. In the literature, there are also mathematical models that considered delay in individuals’ response to a disease which can include a delay in reporting the disease or delay in responding with a preventive behavior [
19]. From the modeling point of view, the delay in reporting a disease is very similar to not being aware of an infection.
Some other researchers have focused on the role of the incubation period in epidemic outbreak. Uys et al. [
20] analyzed the consequences of delay to the diagnosis of tuberculosis. They found that typical delays to diagnosis present a major problem for controlling Tuberculosis (TB) epidemics. Carpenter et al. [
21] simulated delayed detection of a foot-and-mouth disease outbreak in California and showed that increasing the detection time to two weeks can cause a dramatic increase in the number of infected cows and the loss of agricultural welfare. Since this type of time delay can affect the dynamics of an epidemic, it is an important factor in modeling infectious disease transmission. However, models that have used game theoretic approach to represent the behavior of individuals when facing an epidemic overlooked this time delay. Considering the incubation period in modeling is critical because, during this period, a disease can be infectious while the symptoms are still not apparent, and people are not aware of their risk of exposure, and thus oblivious to the need to change their behavior.
This paper utilizes an evolutionary game approach with a public goods setting on a spatial structure with four categories of disease status [
22]: susceptible individuals (S), infected individuals (I), recovered individuals (R), and vaccinated individuals (V). The first three categories are known as the SIR model, which is broadly used in studying infectious disease transmission [
9]. The public goods game using evolutionary game theory is utilized to describe the community-based behavior of individuals in a society.
The following section discusses the methodology for calculating payoff functions and updating players’ strategy. Next, the experimental result for a population of players is presented, followed by summary and conclusions.
2. Methodology
To capture the dynamics of responses to time-delayed infections in epidemic outbreaks, this paper constructs a public goods game model. The model considers a corresponding payoff function that consists of two parts [
22]. The first is the cost of living in a community; the second is the individual cost to each player based on its strategy. This work also considers a player and all its immediate neighbors as a community. Therefore, a center cell has a community formed by a three-by-three lattice that includes all its eight immediate neighbors.
The payoff of living in this group is defined in Equation (1).
where
is the total number of members of a group,
is the number of infected individuals in a group,
is the cost of infection,
is the number of vaccinated individuals,
is the cost of vaccination,
is the group of susceptible members,
(Equation (2)) is the probability of getting infected for player
,
is the cost of recovering and
is the number of recovered individuals in the group. In the formulation of
,
is the total number of neighbors of
, and
is the number of infected neighbors of
and
is the disease’s transmission rate. Note that, in these functions, the number of infected individuals is calculated based on the apparent status of the individuals not the actual one, meaning that if a person is infected and their illness is in incubation period, their status is still susceptible.
Finally, the total payoff to player
is equal to the payoff that a player can get from living in a community minus the cost of vaccination or being infected. Equation (3) shows the total payoff to player
:
2.1. Updating Rule
After calculating the payoff to each player, in each iteration of the game, the strategy of susceptible individuals is updated. Thus, a susceptible individual can decide whether to get vaccinated or remain susceptible. In order to update the strategy of susceptible players, at every time step the top s neighbors with the highest payoff in the neighborhood of a player will be selected. If any of them has a higher payoff than that of the player itself, and it is vaccinated, then the player will decide to get vaccinated, borrowing the strategy of that “successful” player; otherwise, the player remains susceptible. This s is referred to as a sensitivity factor which can be controlled by investing in awareness programs regarding the disease, thus raising individuals’ awareness of the risk of being infected [
23].
Following an update of the strategy of all players, the epidemic season advances one step further. At this time the individuals who are still susceptible can be infected based on the probability of infection, which is calculated using Equation (4).
where
is the actual number of infected neighbors of
,
is the total number of neighbors of
, and
is the disease’s transmission rate based on a one-on-one contact.
In this paper two types of updating are considered (normal updating and delayed updating) and the results of updating under each scenario are compared. In normal updating, if an individual becomes infected, their apparent strategy is available right after being infected. In delayed updating, if an individual becomes infected in one period, their apparent strategy will not be released for some time steps, which is equal to the incubation period of the disease (). An infected individual will become recovered and will be immune to the disease after time steps, the duration of the infection period.
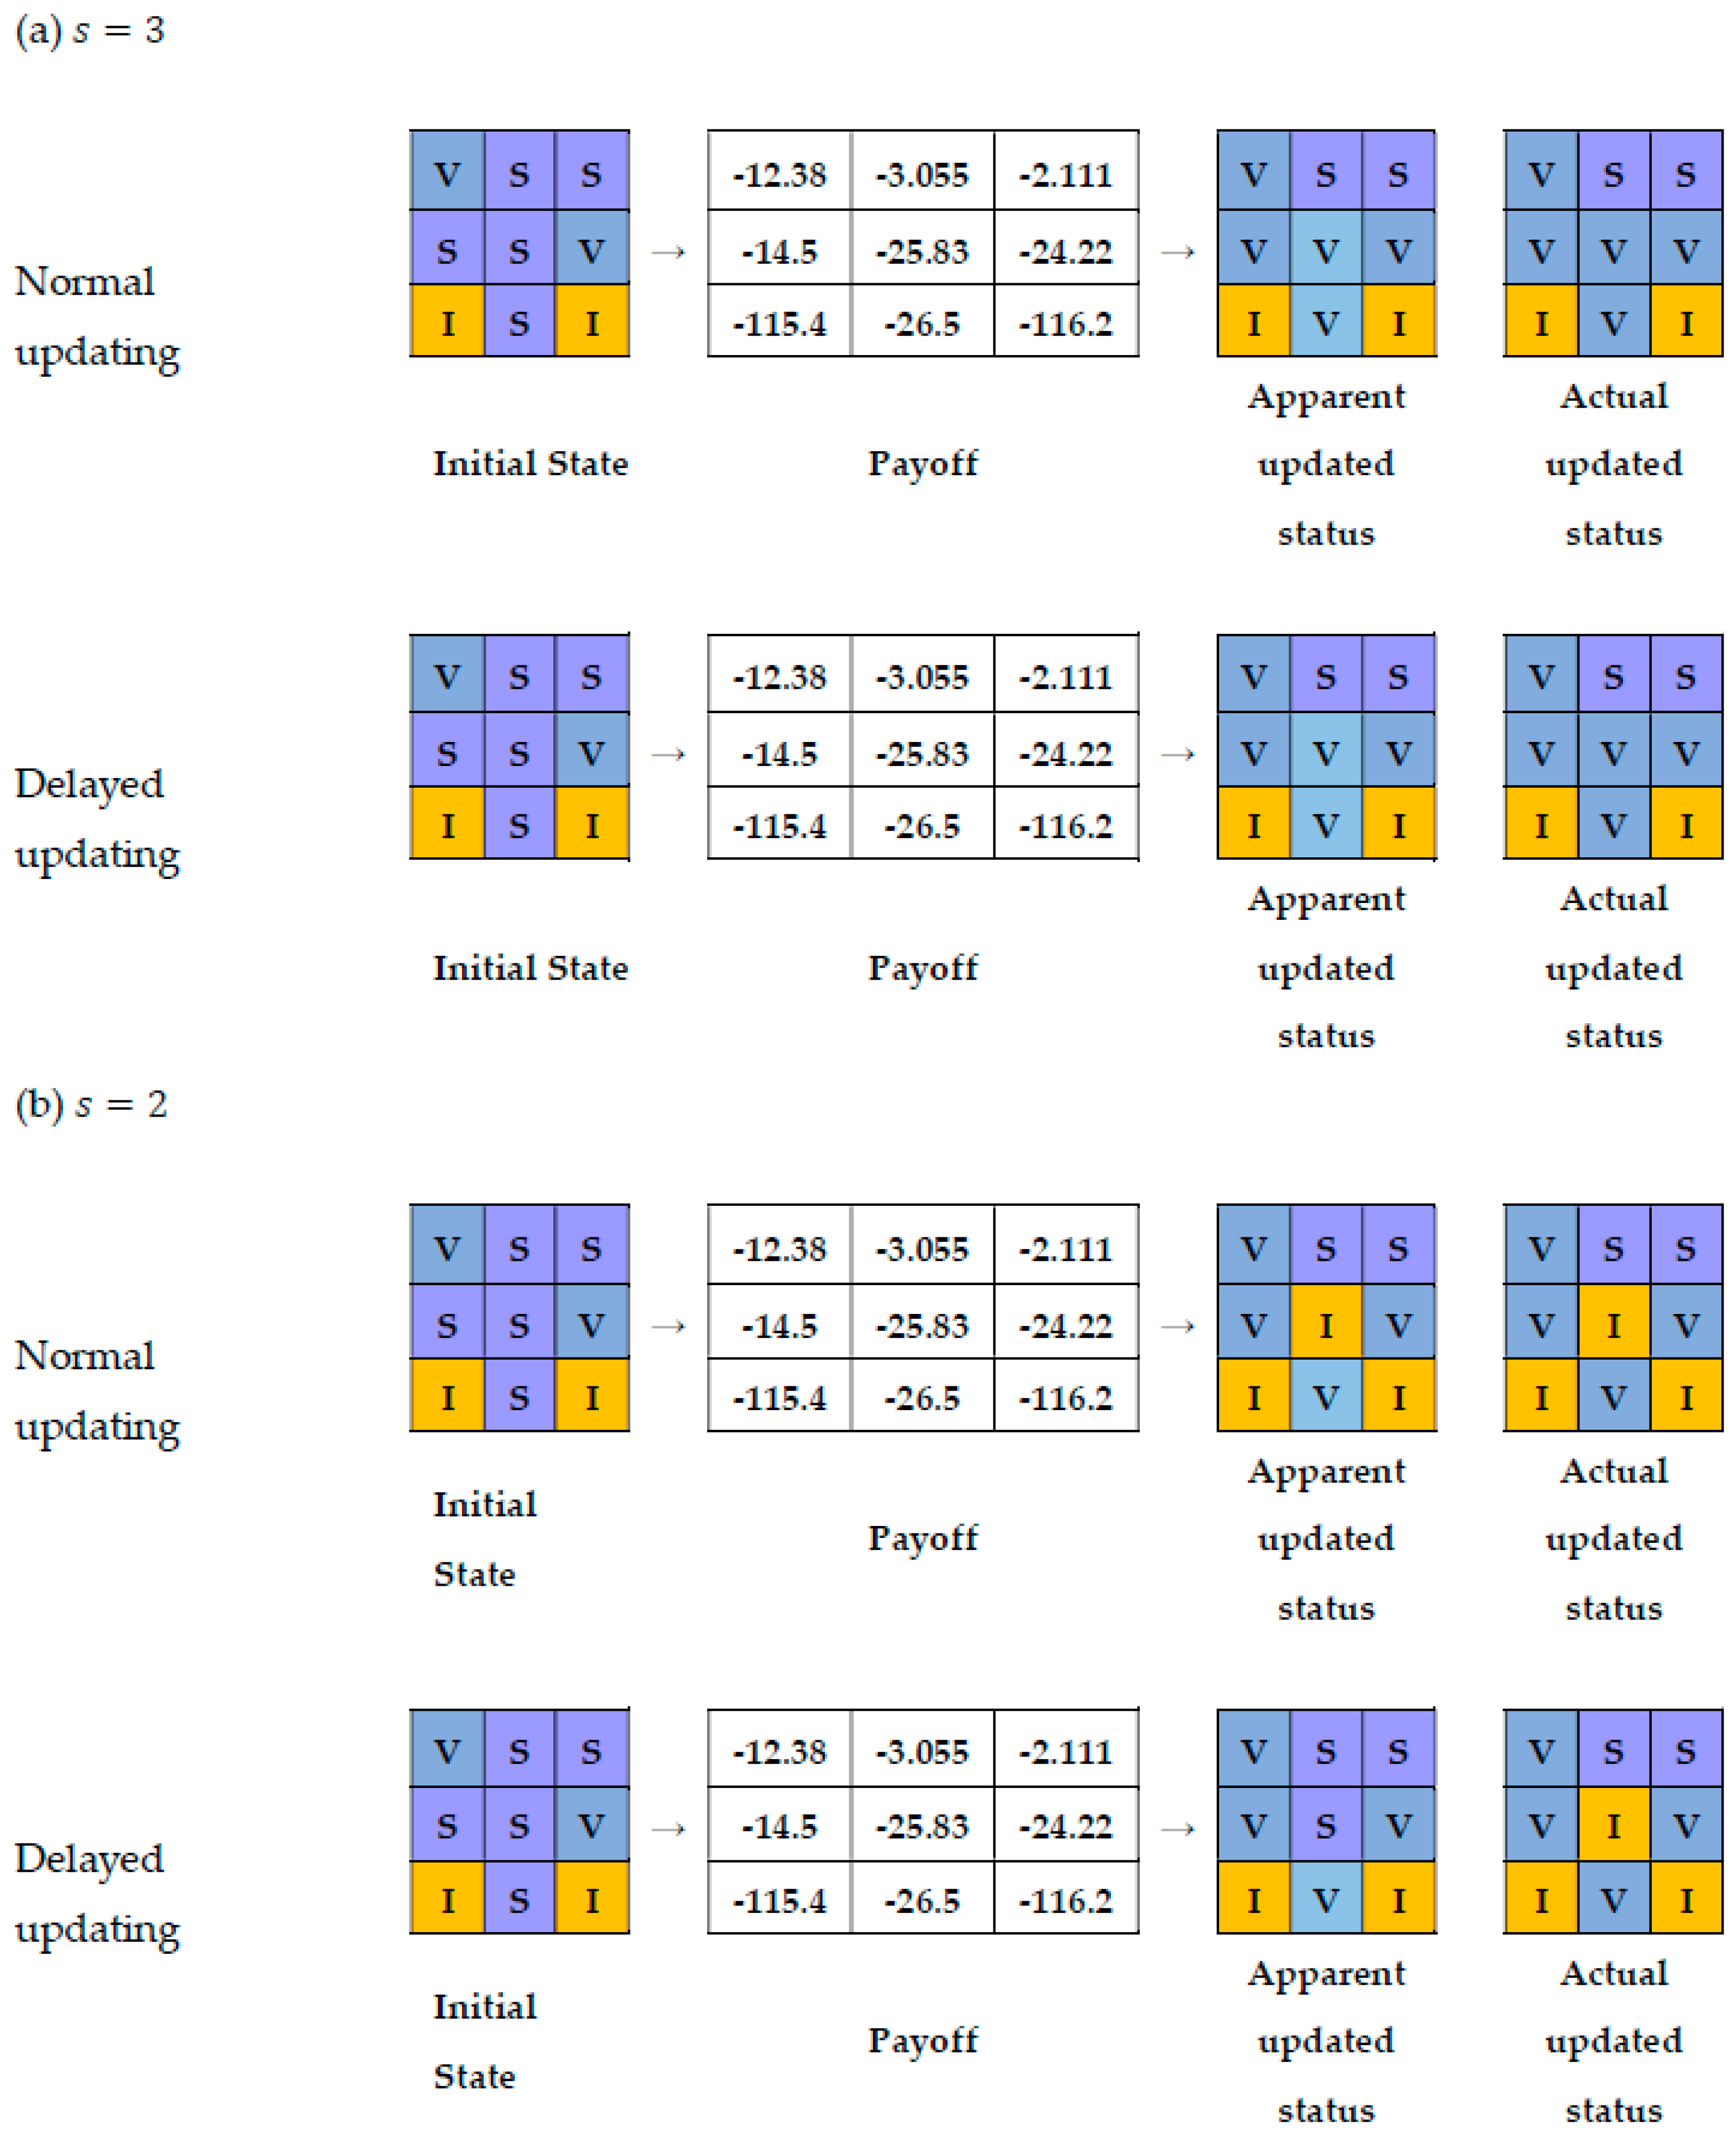
An example of the updating rule is demonstrated below. The payoff for the center player and its neighbors is the numbers in the cells, where the payoff of each neighbor is calculated based on their eight neighbors, some of which are not shown here. The vector of initial values in this example is .
When the sensitivity factor is equal to 3, the set of top three neighbors (ones with highest payoff) will be
(
Figure 1a). This means that the updated strategy of the center player will be to get vaccinated since one of the top three neighbors is vaccinated and has a higher payoff than the center player. A sensitivity factor of 3 has similar results for delayed and normal updating.
When the sensitivity factor is equal to 2, the player will not vaccinate since there is no vaccinated player among the top two players in the neighborhood of the central player, with a higher payoff than the player itself (
Figure 1b). If this player becomes infected during this period (because of an infected neighbor), in delayed updating, its apparent status will not change, so its neighbors cannot learn about this infection, but its actual status will change to infected. Consequently, at this time the disease can be transmitted to other players. This behavior is shown in
Figure 1 as apparent status and as actual status.
3. Experimental Results
This section illustrates the effects of considering incubation period on the dynamics of an epidemic. This example shows a starting five-by-five lattice of individuals with one infected and one vaccinated individual in which the infected individual is at the top-left corner of the inner three-by-three square and the vaccinated individual is at the bottom-right corner of the inner square, thus, all the other players are susceptible to the disease. This starting condition is shown in
Figure 2a. If we model the outbreak using the illustrated? methods on such a lattice we can see that normal and delayed updating will result in completely different outbreaks and outcomes (
Figure 2b,c). In
Figure 2, red cells are infected individuals, blue cells are vaccinated individuals and purple cells represent susceptible individuals. Red cells are those who are recovered from the infection. The vector of the initial values to run the model is
. If we compare
Figure 2b,c, we can see that taking an incubation period into account (delayed updating), the number of infected individuals will increase (more red cells), and fewer people will become immune due to the presence of vaccinated individuals in their neighborhood. The condition of being safe in the presence of an infectious disease without taking any action and as a result of others efforts is known as free-riding (purple cells).
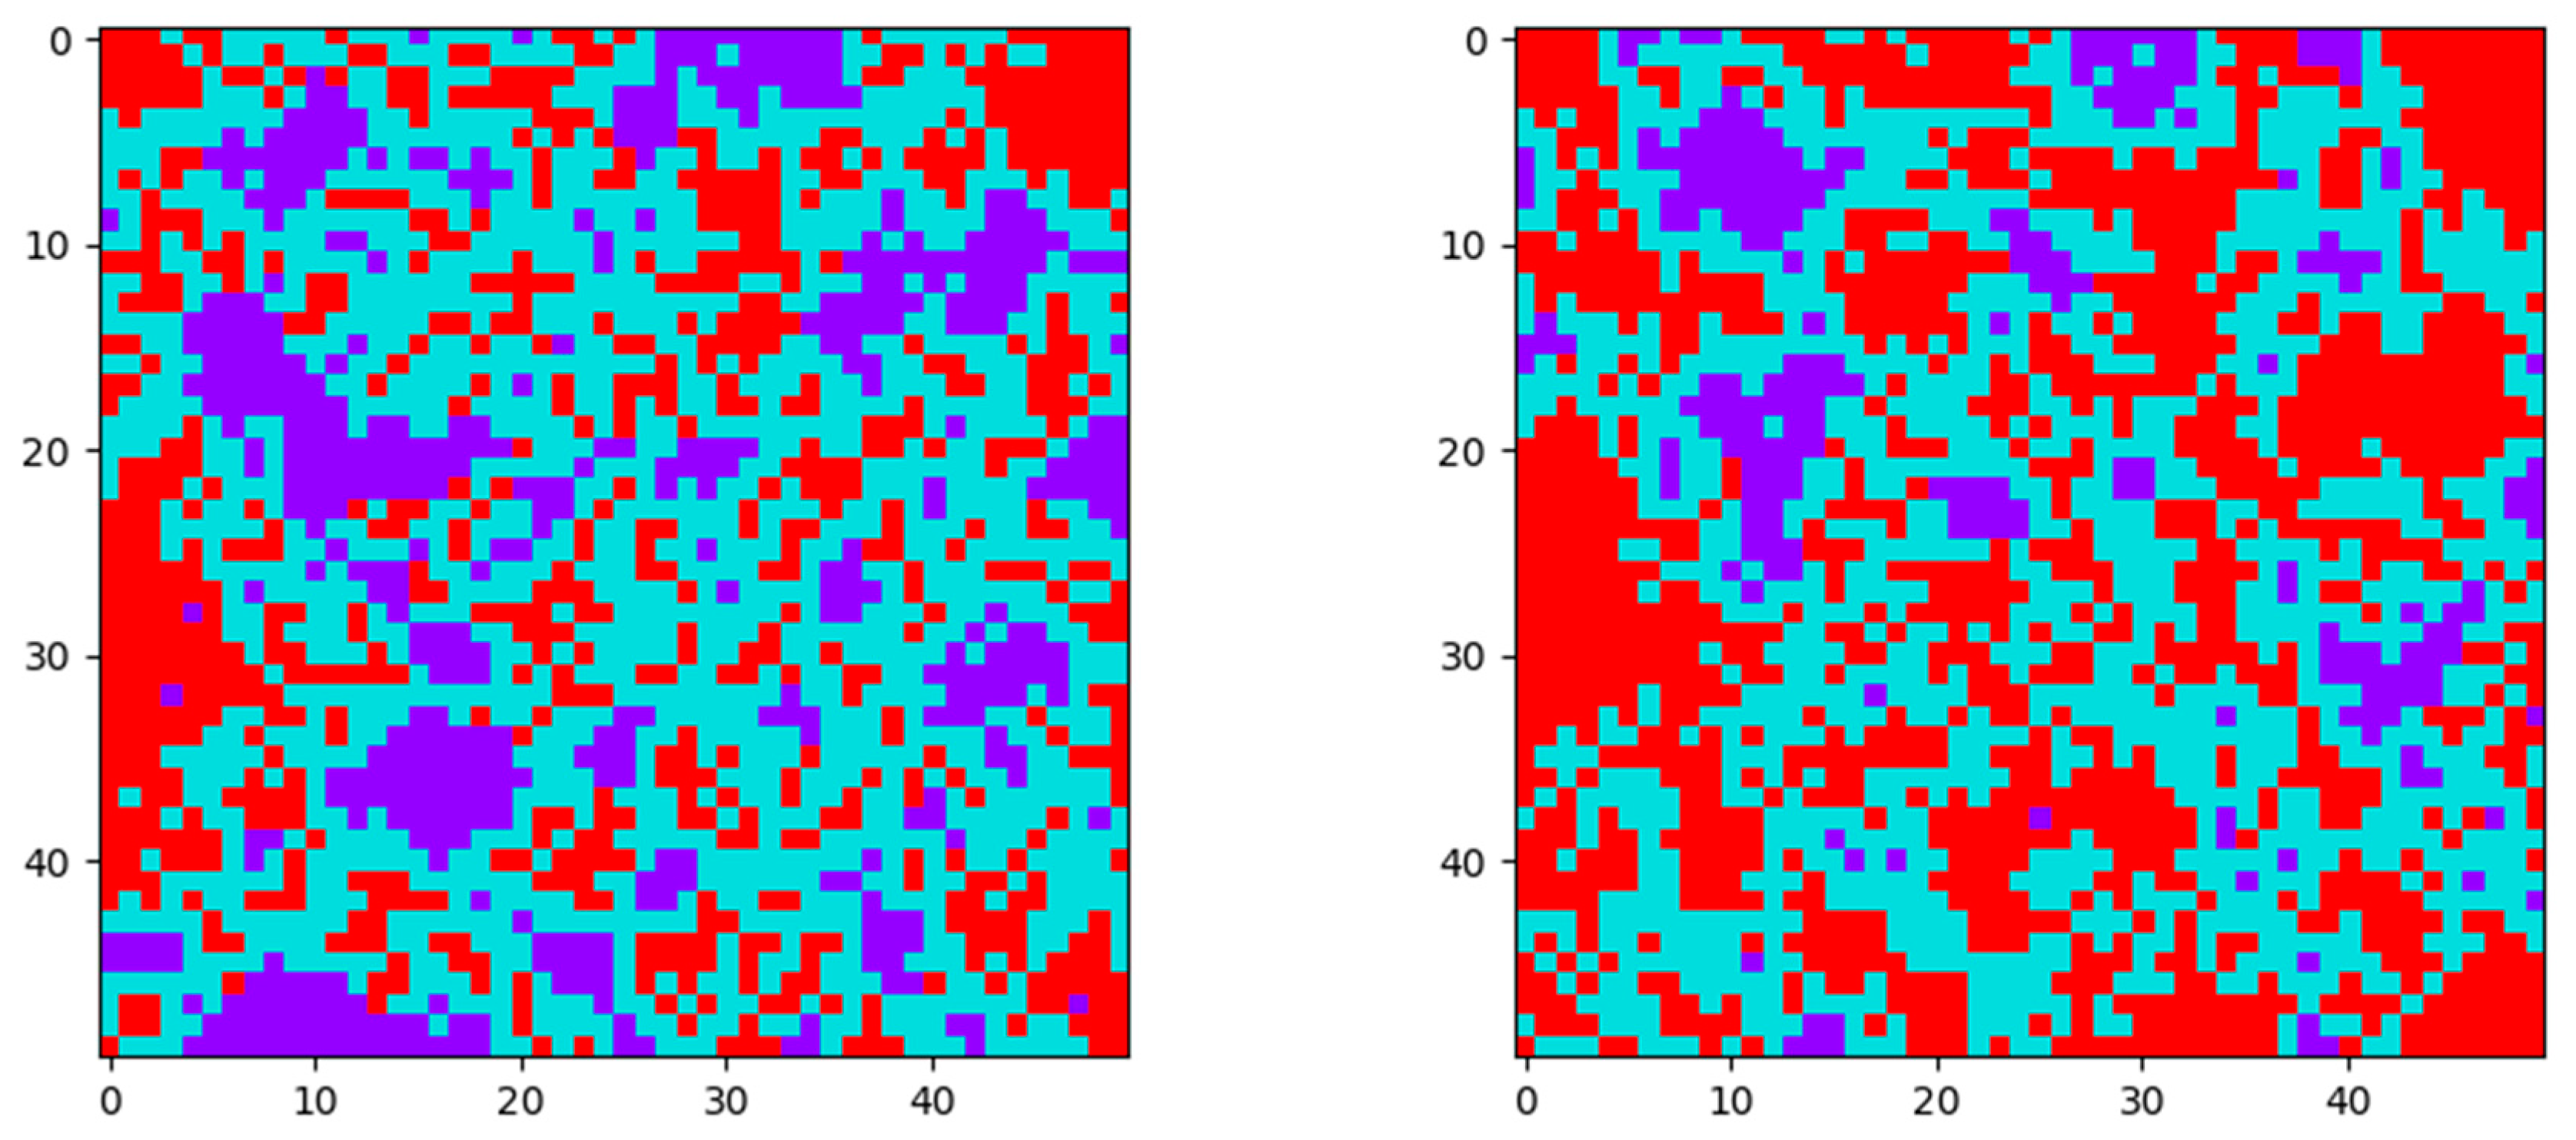
If we repeat this example with a larger lattice, we see a very similar result. The result of normal and delayed updating of a 50-by-50 lattice with random distribution of 5% initially vaccinated and 5% initially infected individuals is illustrated in
Table 1 which is the number of vaccinated, infected and free-riders for each scenario. It shows that, for an epidemic with the parameters in
Table 2, the final number of free-riders and vaccinated individuals is smaller using Delayed updating, and the number of infected individuals is higher compared to Normal updating. This result can also be seen in
Figure 3, where purple cells represent susceptible individuals, red cells are recovered individuals, and blue cells are vaccinated. It is worth noting that not only is the number of infected individuals increased and the number of vaccinated individuals decreased with delayed updating, but also that the number of free-riders decreases due to not having enough vaccinated individuals in the population to provide some protection to their neighbors.
The following section discusses the sensitivity of epidemic dynamics to change in various parameters for both normal and delayed updating. In the graphs below, the blue line shows the result of using normal updating and the orange line shows delayed updating. The parameters used for running the models and their values are shown in
Table 2.
3.1. Effect of Changing Transmission Rate
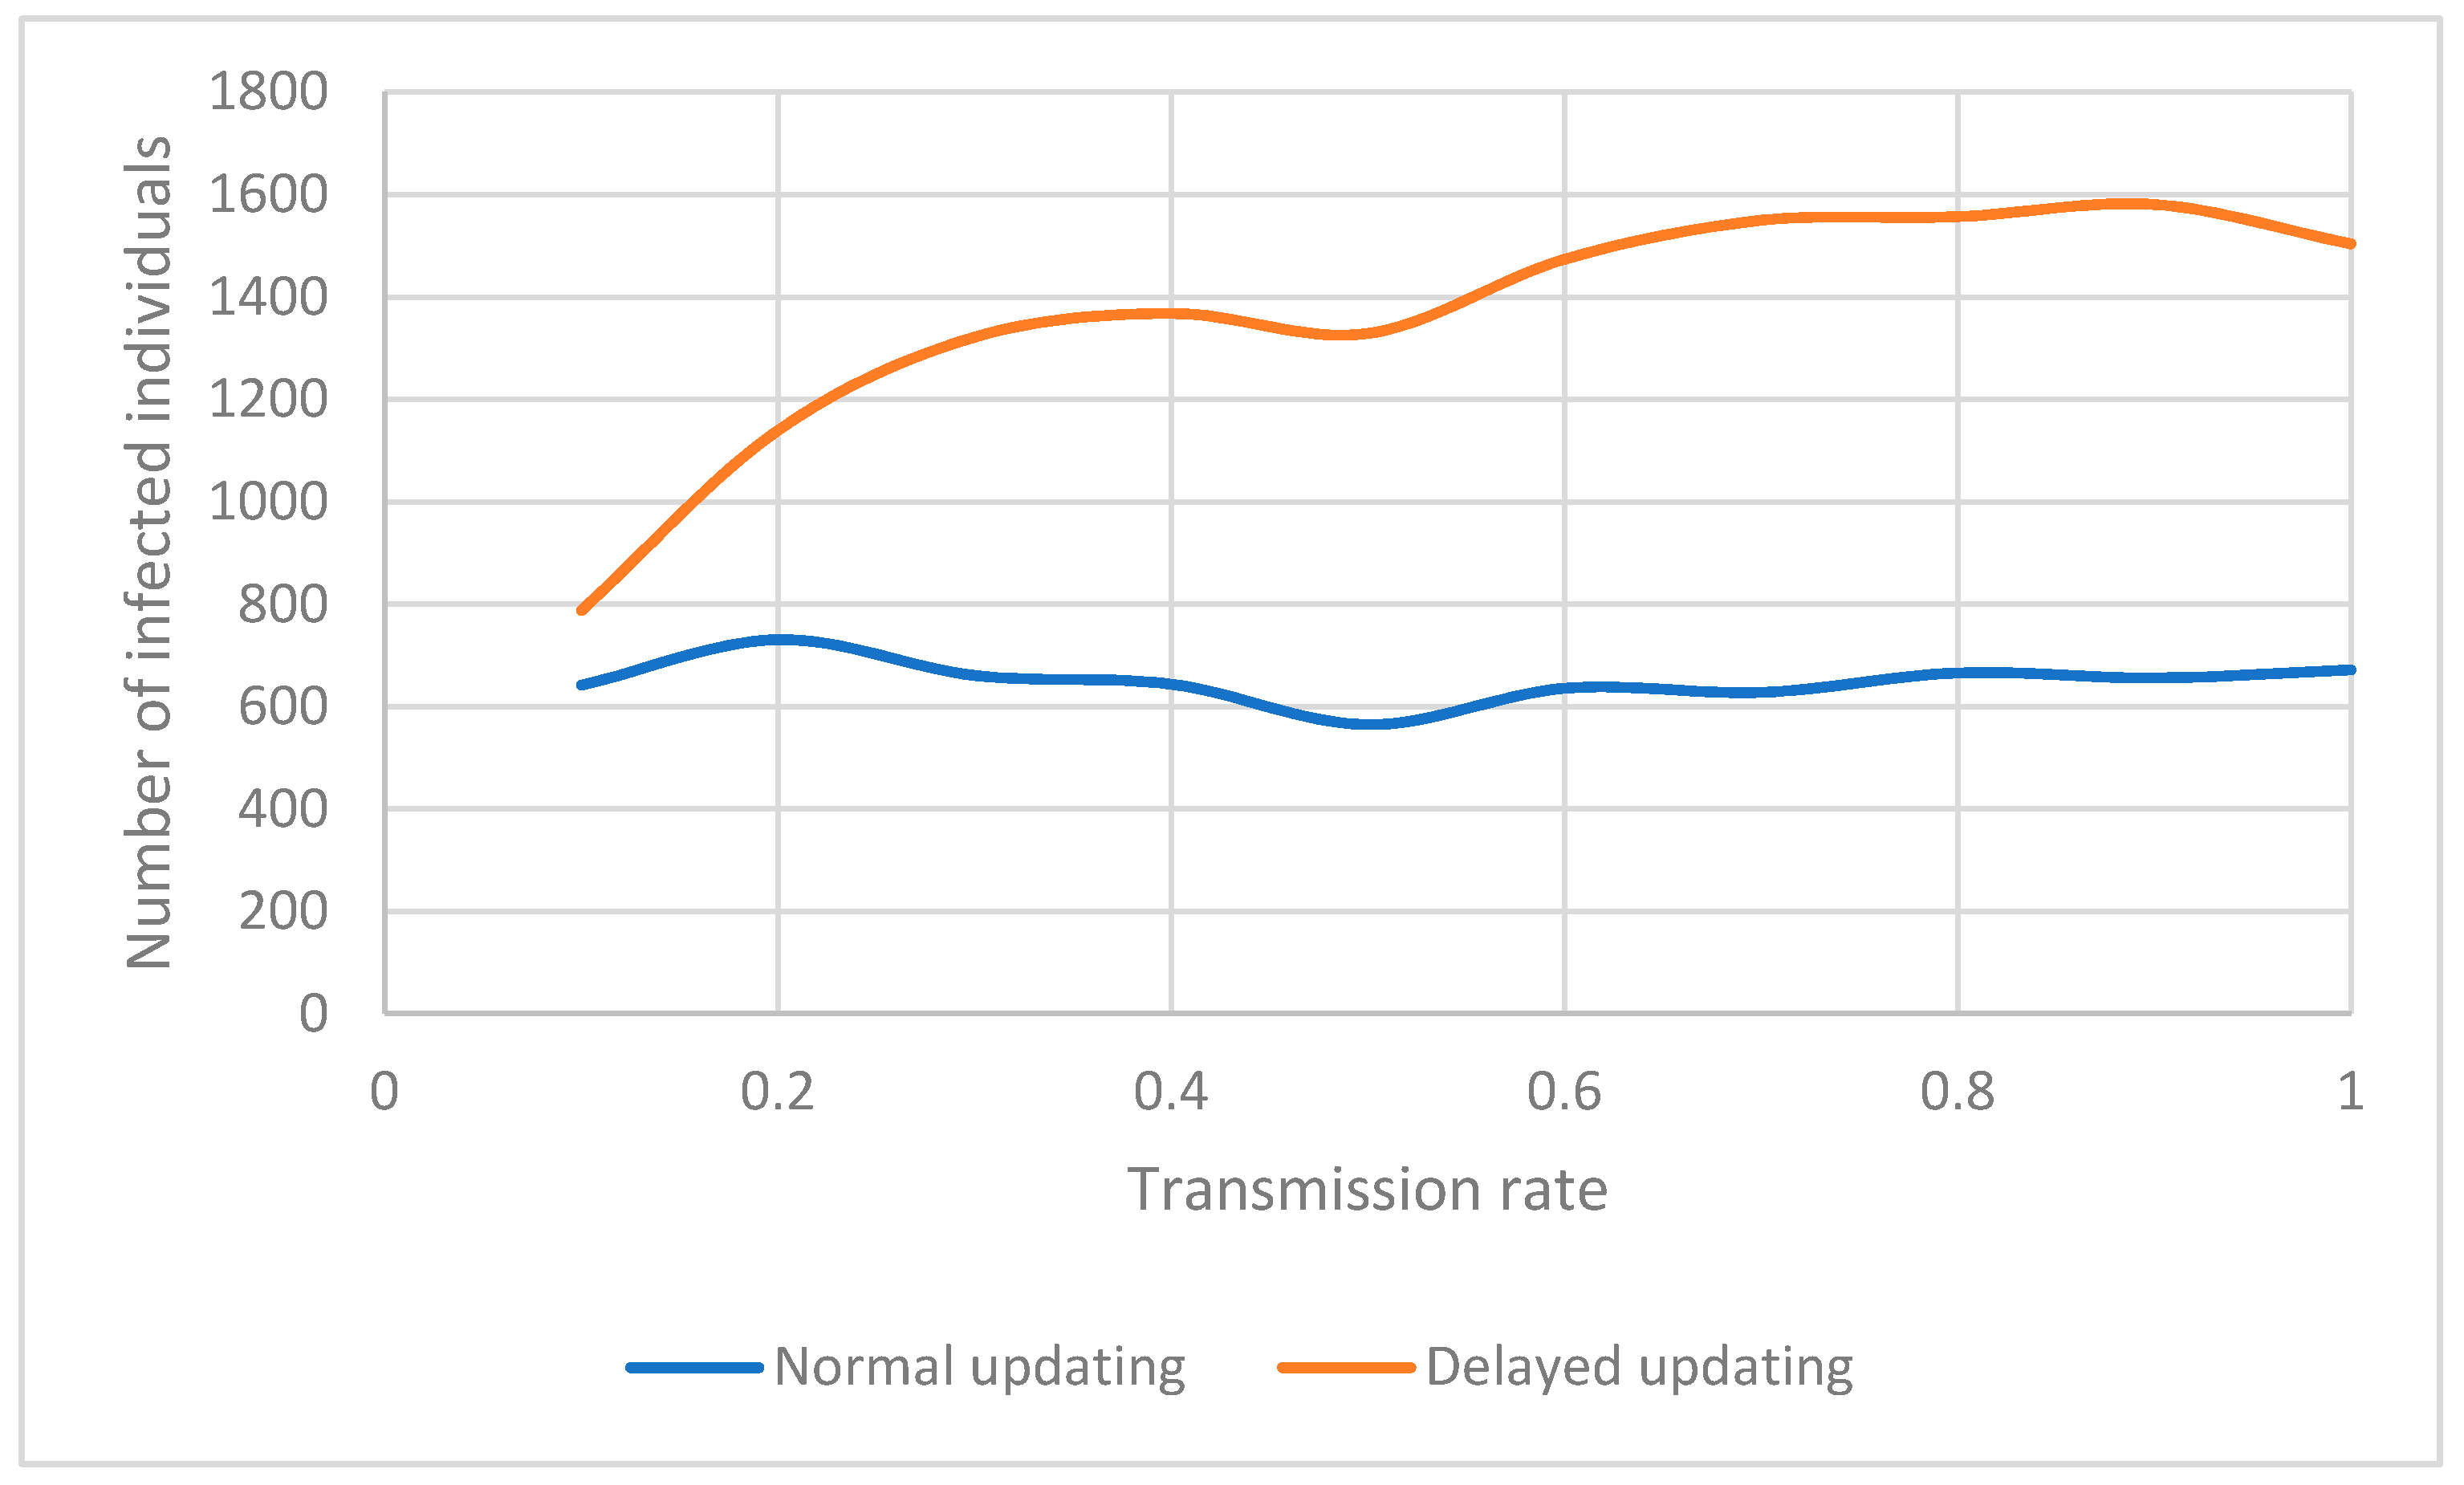
One of the parameters of an outbreak model which can change the dynamics of an epidemic is the transmission rate. Transmission rate is the rate or probability of infection as a result of contact with an infected individual in each time step of the outbreak. If the transmission rate is high, the possibility for a susceptible individual to become infected is higher, causing an increase in the total number of infected individuals. However, this statement is only true if people are not aware of the existence of a highly transmittable infection near them. If people are aware of a highly transmittable ongoing epidemic, they will quickly respond by changing their behavior and getting vaccinated, resulting in a relatively constant number of infected individuals with different transmission rates. This phenomenon can be seen in
Figure 4. Using normal updating, as transmission rate increases, the number of infected individuals does not change significantly. This happens because the response of individuals to an epidemic is faster knowing that they are at a higher risk of becoming infected; information which does not accurately exist in delayed updating. Usually, in real-world outbreaks, with the lack of accurate knowledge of risk of infection, diseases with a higher transmission rate result in more infected individuals. Consequently, fewer people have the chance to remain healthy without being vaccinated. The change in the number of these individuals (free-riders) is illustrated in
Figure 5 for both normal updating and delayed updating (considering the incubation period and lack of knowledge about the risk of infection). Also, the number of vaccinated individuals will increase when the transmission rate increases in general without considering the incubation period, and if we take into account the hidden period of the disease this number will be even lower (
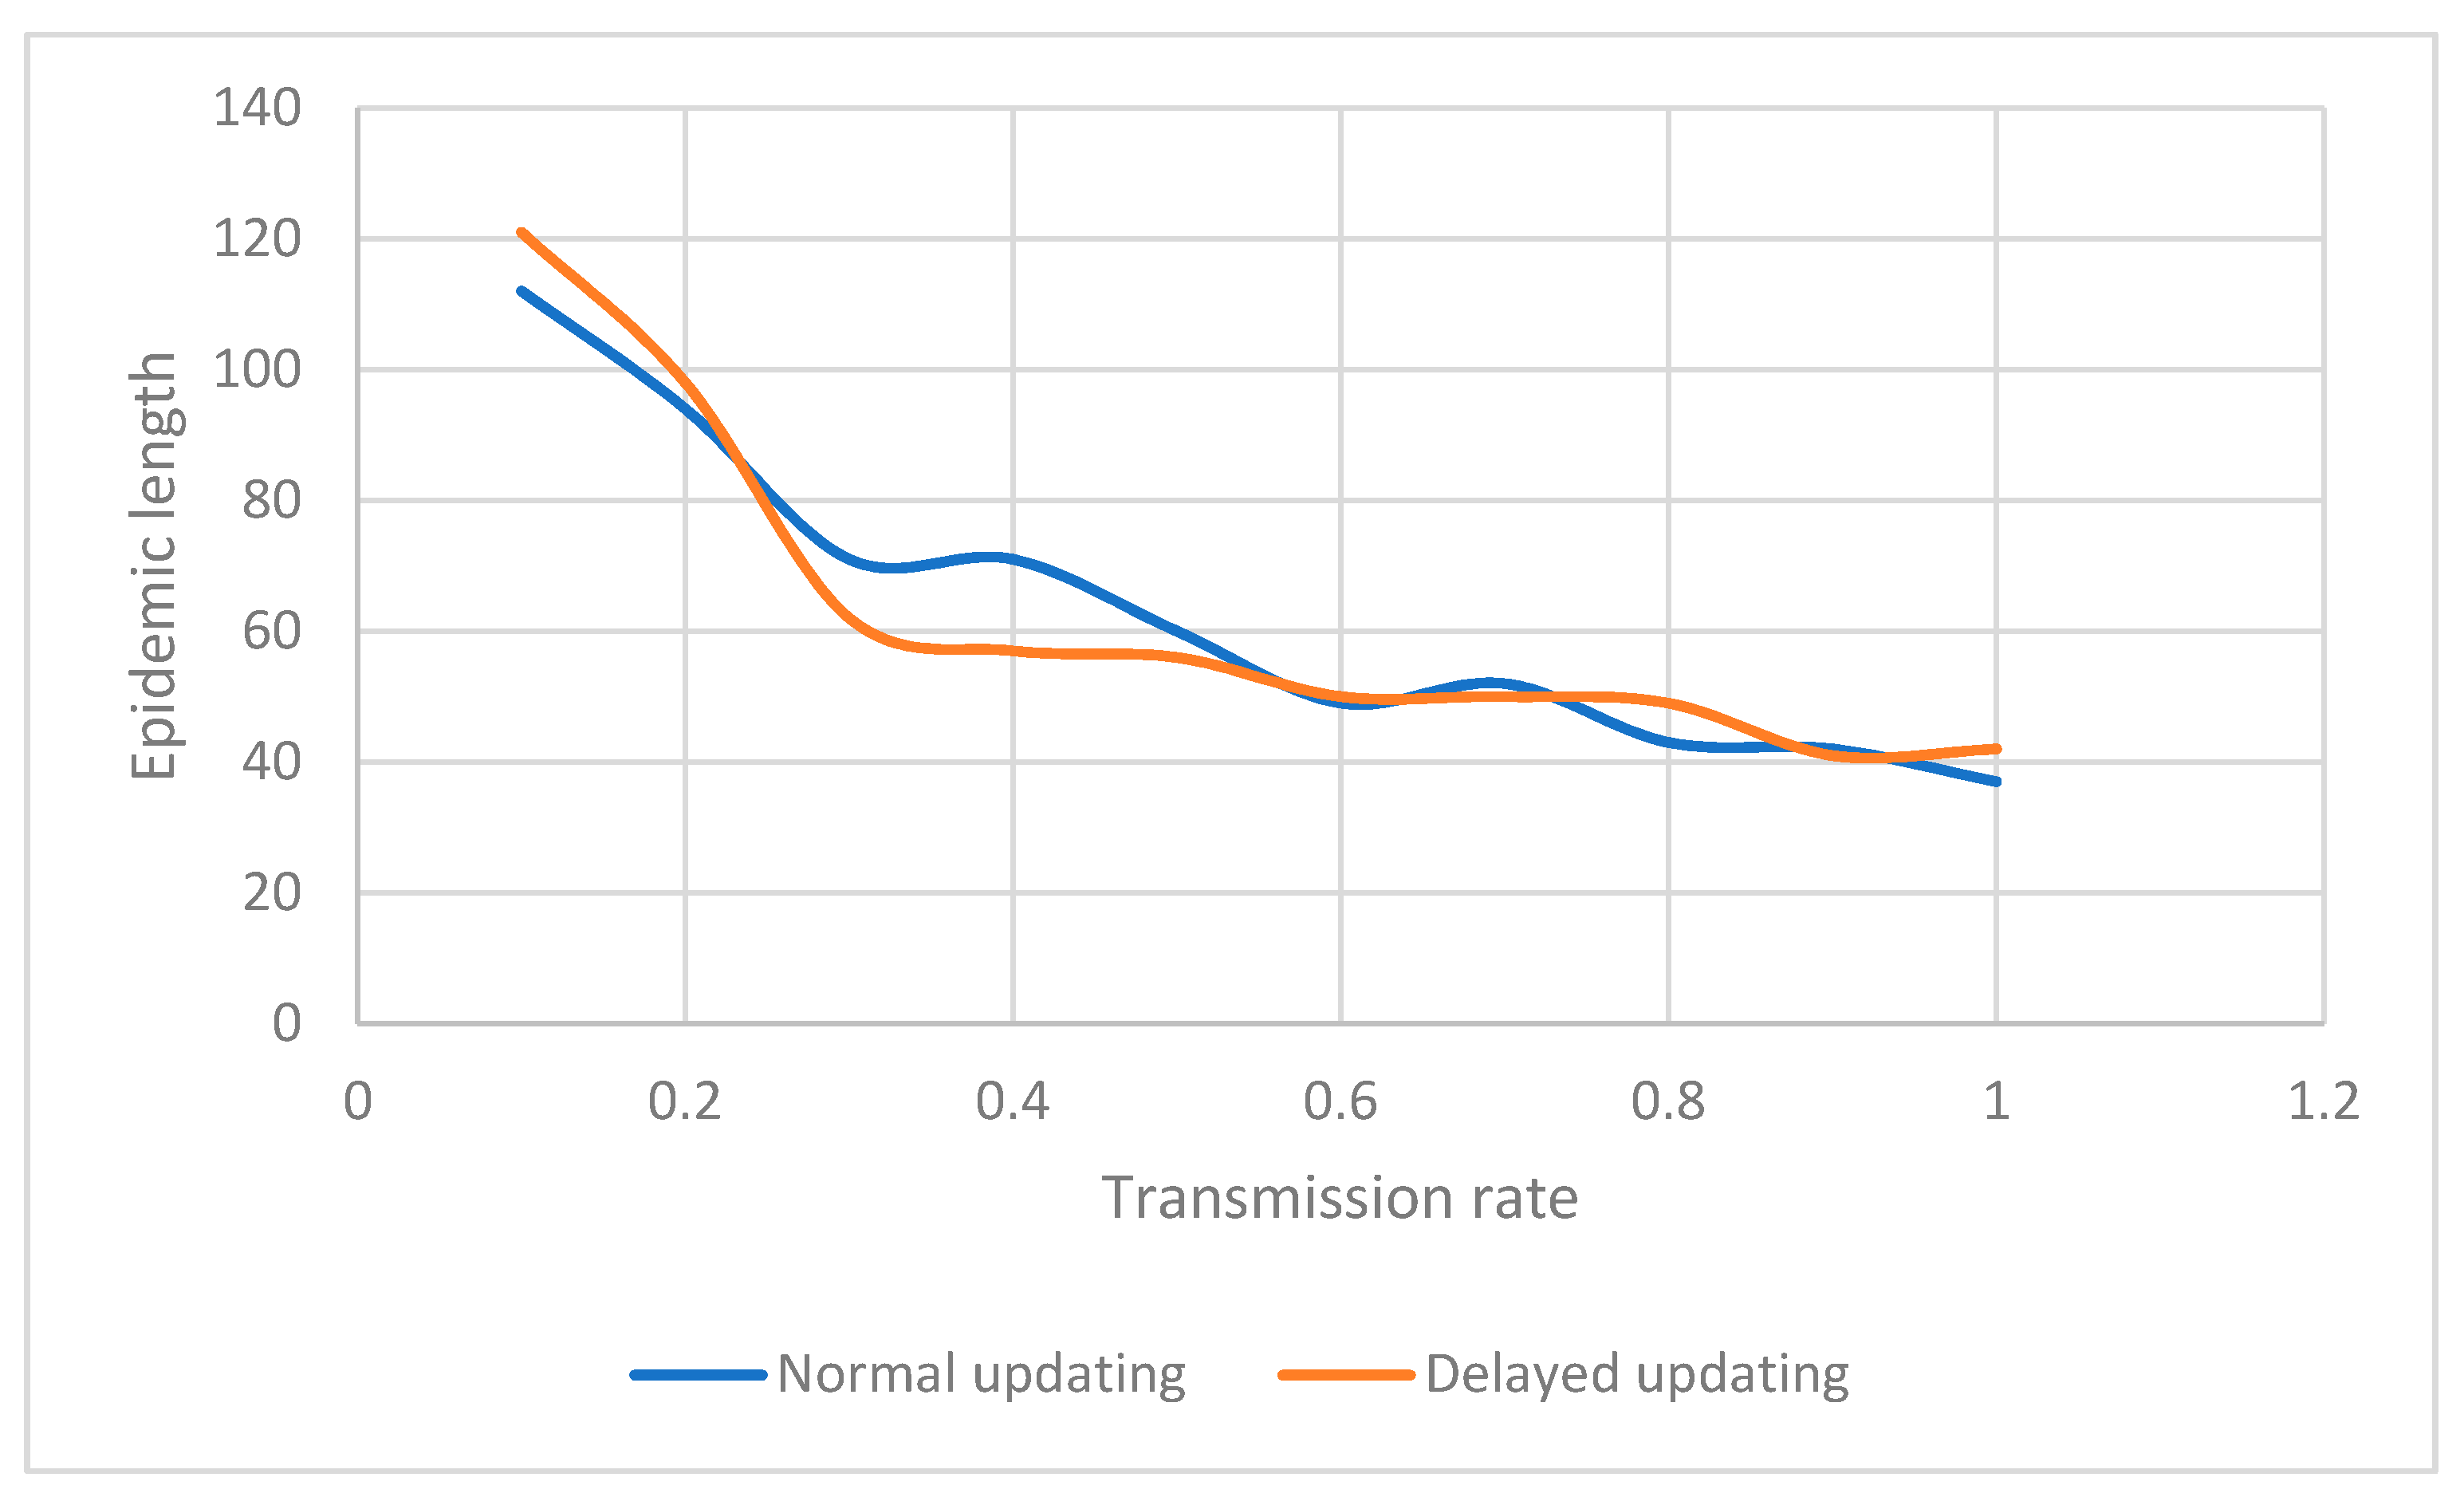
Figure 6 and later in Figure 18). This decline in the number of vaccinated individuals when using delayed updating could be the result of two factors. First, not being aware of an infection and considering an incorrect payoff in deciding whether to vaccinate. Second, an increased risk of being infected by an undiagnosed infected neighbor. Complementing this dynamic is the fact that a higher transmission rate accelerates the course of the epidemic, as shown in
Figure 7. This helps explain the relative insensitivity of the number of infected or vaccinated individuals to the transmission rate.
In general, the delayed updating model always has more infected individuals compared to the normal updating, regardless of the parameters used in the model.
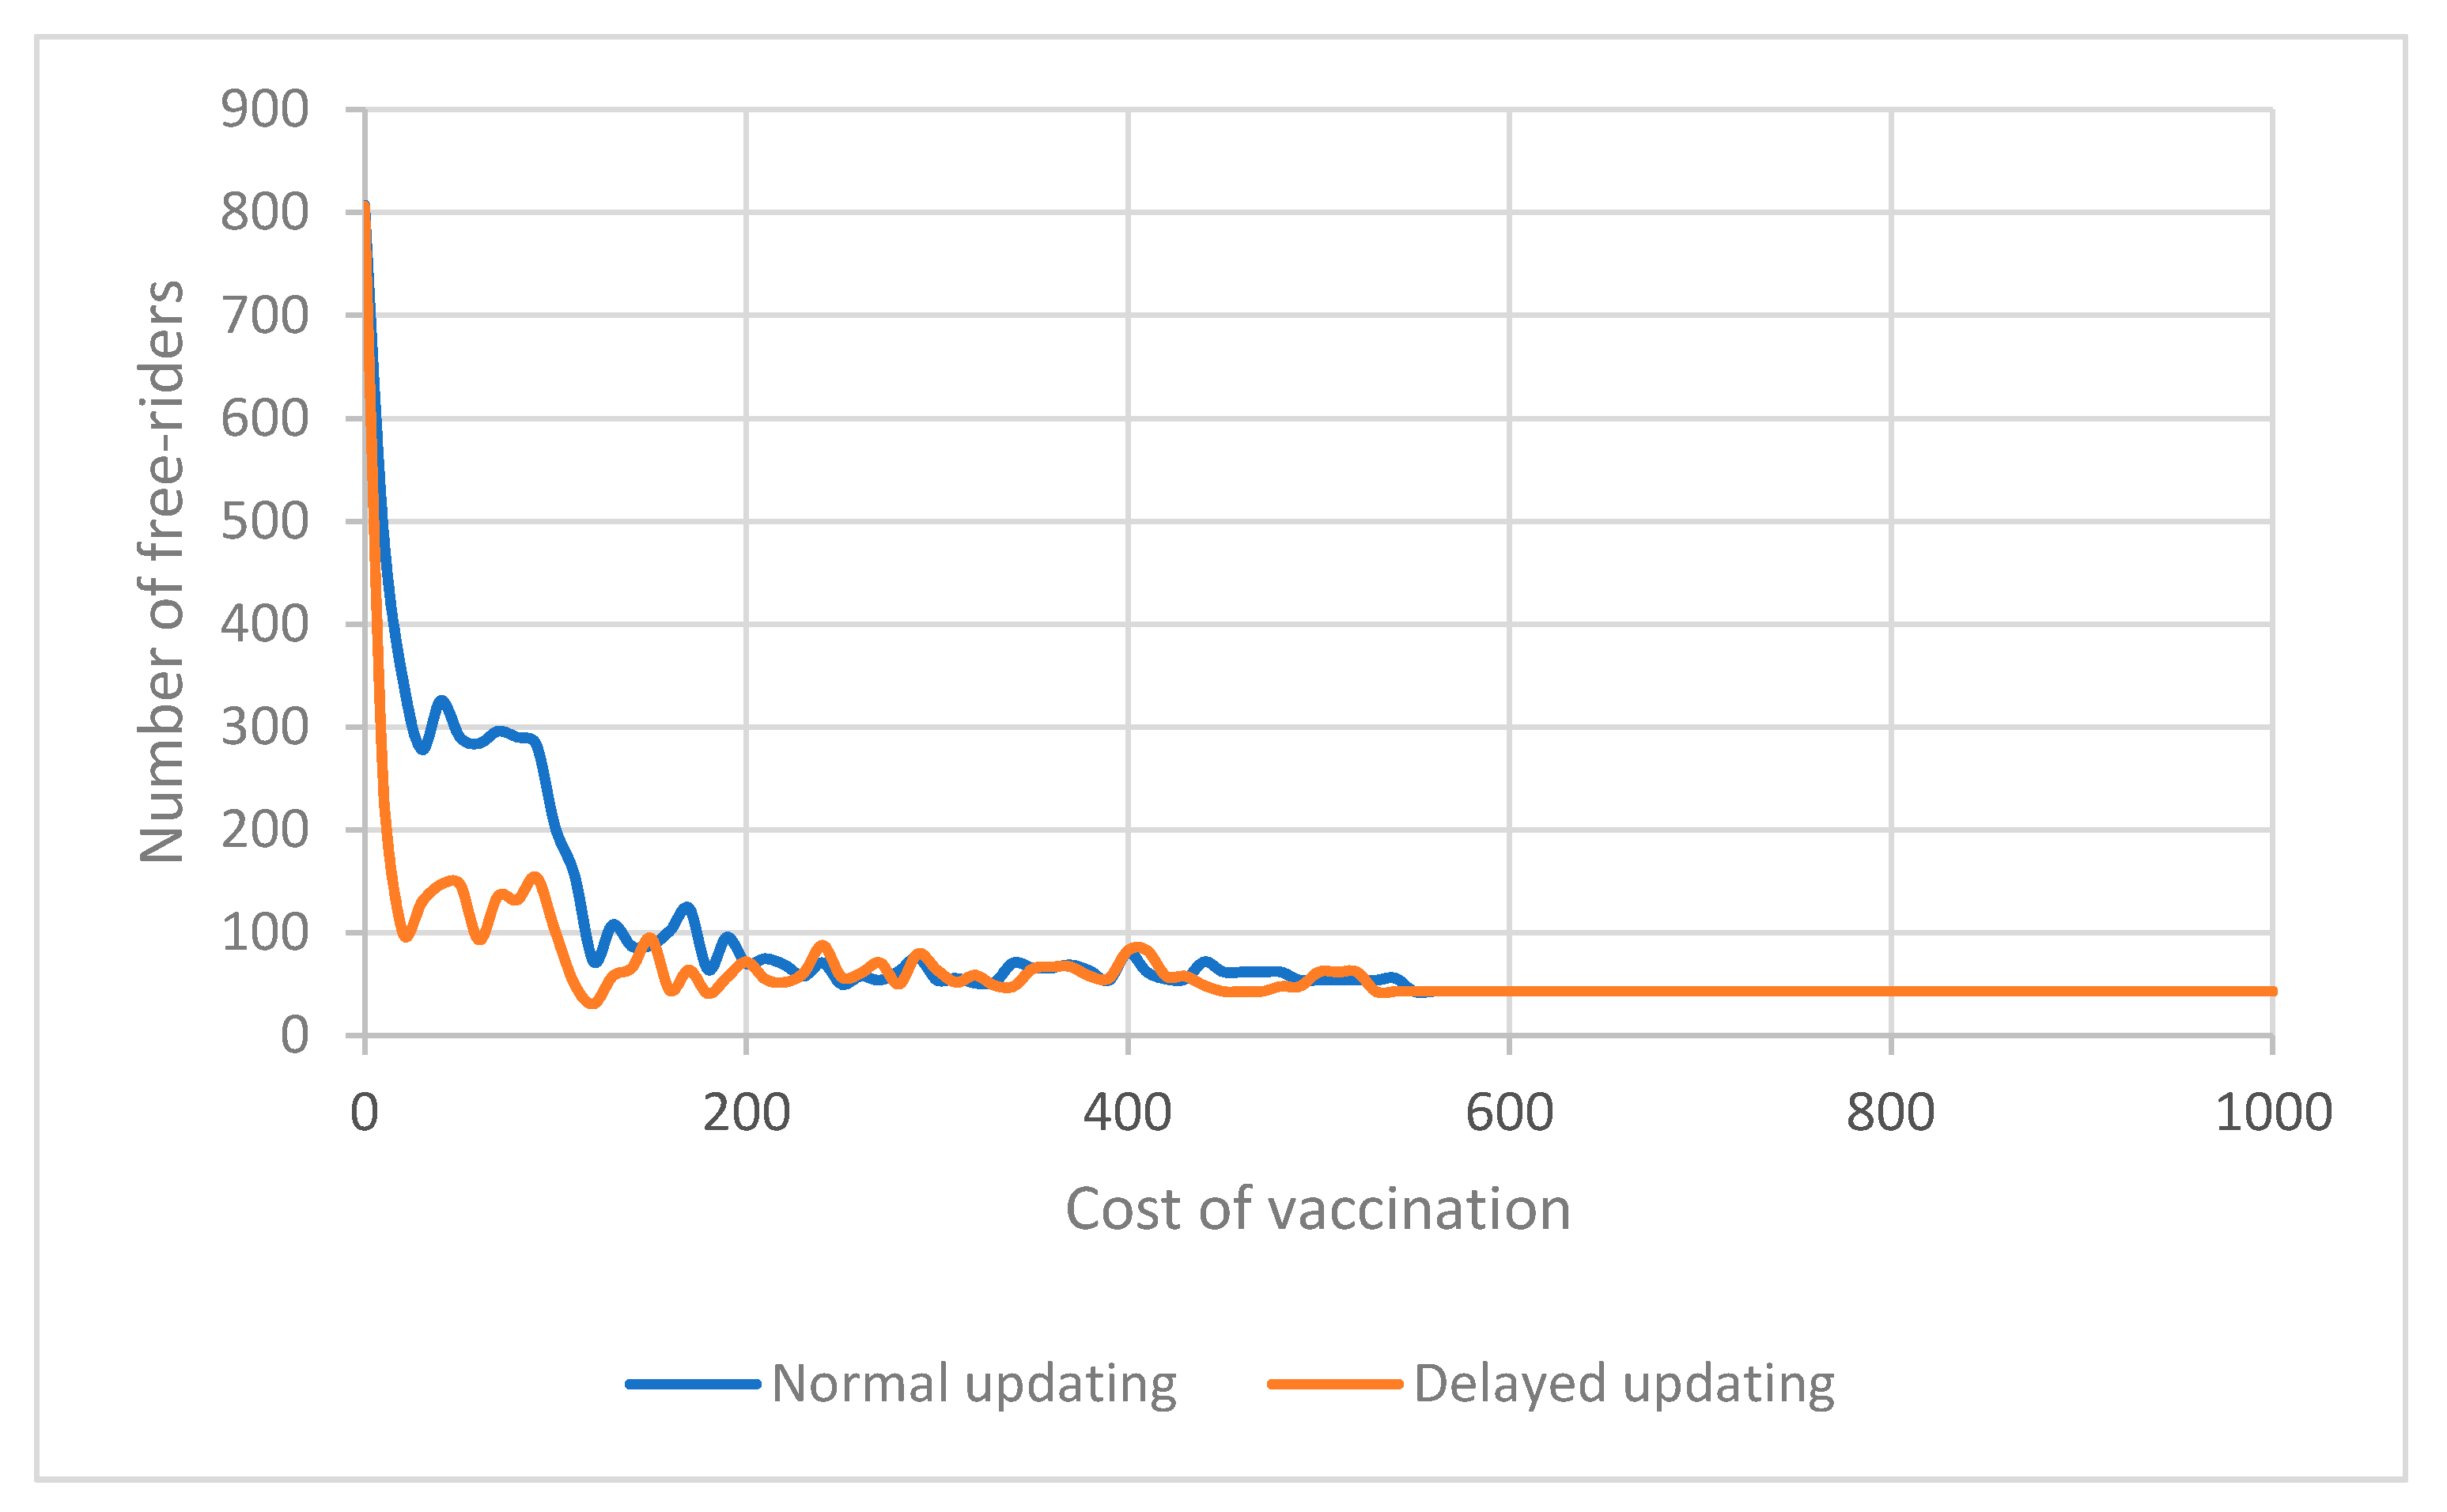
3.2. Effect of Changing Cost of Vaccination
Another parameter that can significantly affect the dynamics of an epidemic is the cost of vaccination. This parameter can affect the decision of individuals to get vaccinated. In general, we expect a higher vaccination cost to cause less desire to get vaccinated.
Figure 8,
Figure 9 and
Figure 10 show the result of changing the cost of vaccination for both delayed and normal updating. Under both scenarios, a lower vaccination cost results in a lower number of free-riders. However, the number is smaller when incorporating the incubation period in the model (
Figure 8). Moreover, the number of vaccinated individuals is also lower with delayed updating, when the time delay in becoming aware of an infection is considered (
Figure 9). This decrease in the number of vaccinated and free-riders is caused by a higher number of infected people not being aware of their status due to the delayed response (
Figure 10).
In general, a change in the cost of vaccination creates a new balance between the number of vaccinated individuals (decreases as the price goes up), the number of infected (goes up as the price goes up), and the free-riders (the lucky ones that did not vaccinate but also did not get infected) in the final state of the epidemic. With higher cost of vaccination (while all other factors remain constant), more individuals will become infected, and there will be fewer free-riders.
3.3. Effect of Changing the Initially Vaccinated Population V0
Controlling the number of initially vaccinated individuals is one method that public health officials can use to influence the spread of an epidemic. The result of the time delay in becoming aware of an infection is more significant when a small percentage of the population is encouraged to get vaccinated, while the alternative of over-vaccinating the population results in people having immunity from the possible threat and reduces the risk of being infected due to unawareness (
Figure 11,
Figure 12,
Figure 13 and
Figure 14). It can be seen in
Figure 11 that the number of free-riders when considering the incubation period (delayed updating) is lower than the number of free-riders without considering the time delay (normal updating). This can be explained by not having enough vaccinated individuals who can provide protection to others when there is an incubation period due to unawareness about the infection and possible risks of being infected.
However, a higher number of initially vaccinated individuals can provide more immune communities and results in a lower number of free-riders for both models. The total number of vaccinated individuals and the number of people who decide to get vaccinated is also lower for a lower initial vaccination rate when the incubation period is taken into account.
In studying the effect of vaccination programs, it is important to consider the change in the number of people who decide to get vaccinated themselves in addition to the total number of vaccinated individuals since some of the total vaccinated individuals were initially vaccinated or were offered free vaccination. This comparison is illustrated in
Figure 12 and
Figure 13.
Figure 12 and
Figure 13 show that the total number of vaccinated individuals and the number of individuals who decided to get vaccinated does not vary much for Delayed and Normal updating for a higher number of initially vaccinated individuals due to the provided immunity resulting from mandatory vaccination, although the number of infected individuals is higher for models with time delay and a lower number of initially vaccinated individuals (
Figure 14). This higher number of infections is the result of the hidden risk of infection and inadequate response to it in the form of preventive behavior (vaccination in this case). The lower number of infections for higher
is similar to the result of provided immunity through mandatory vaccination.
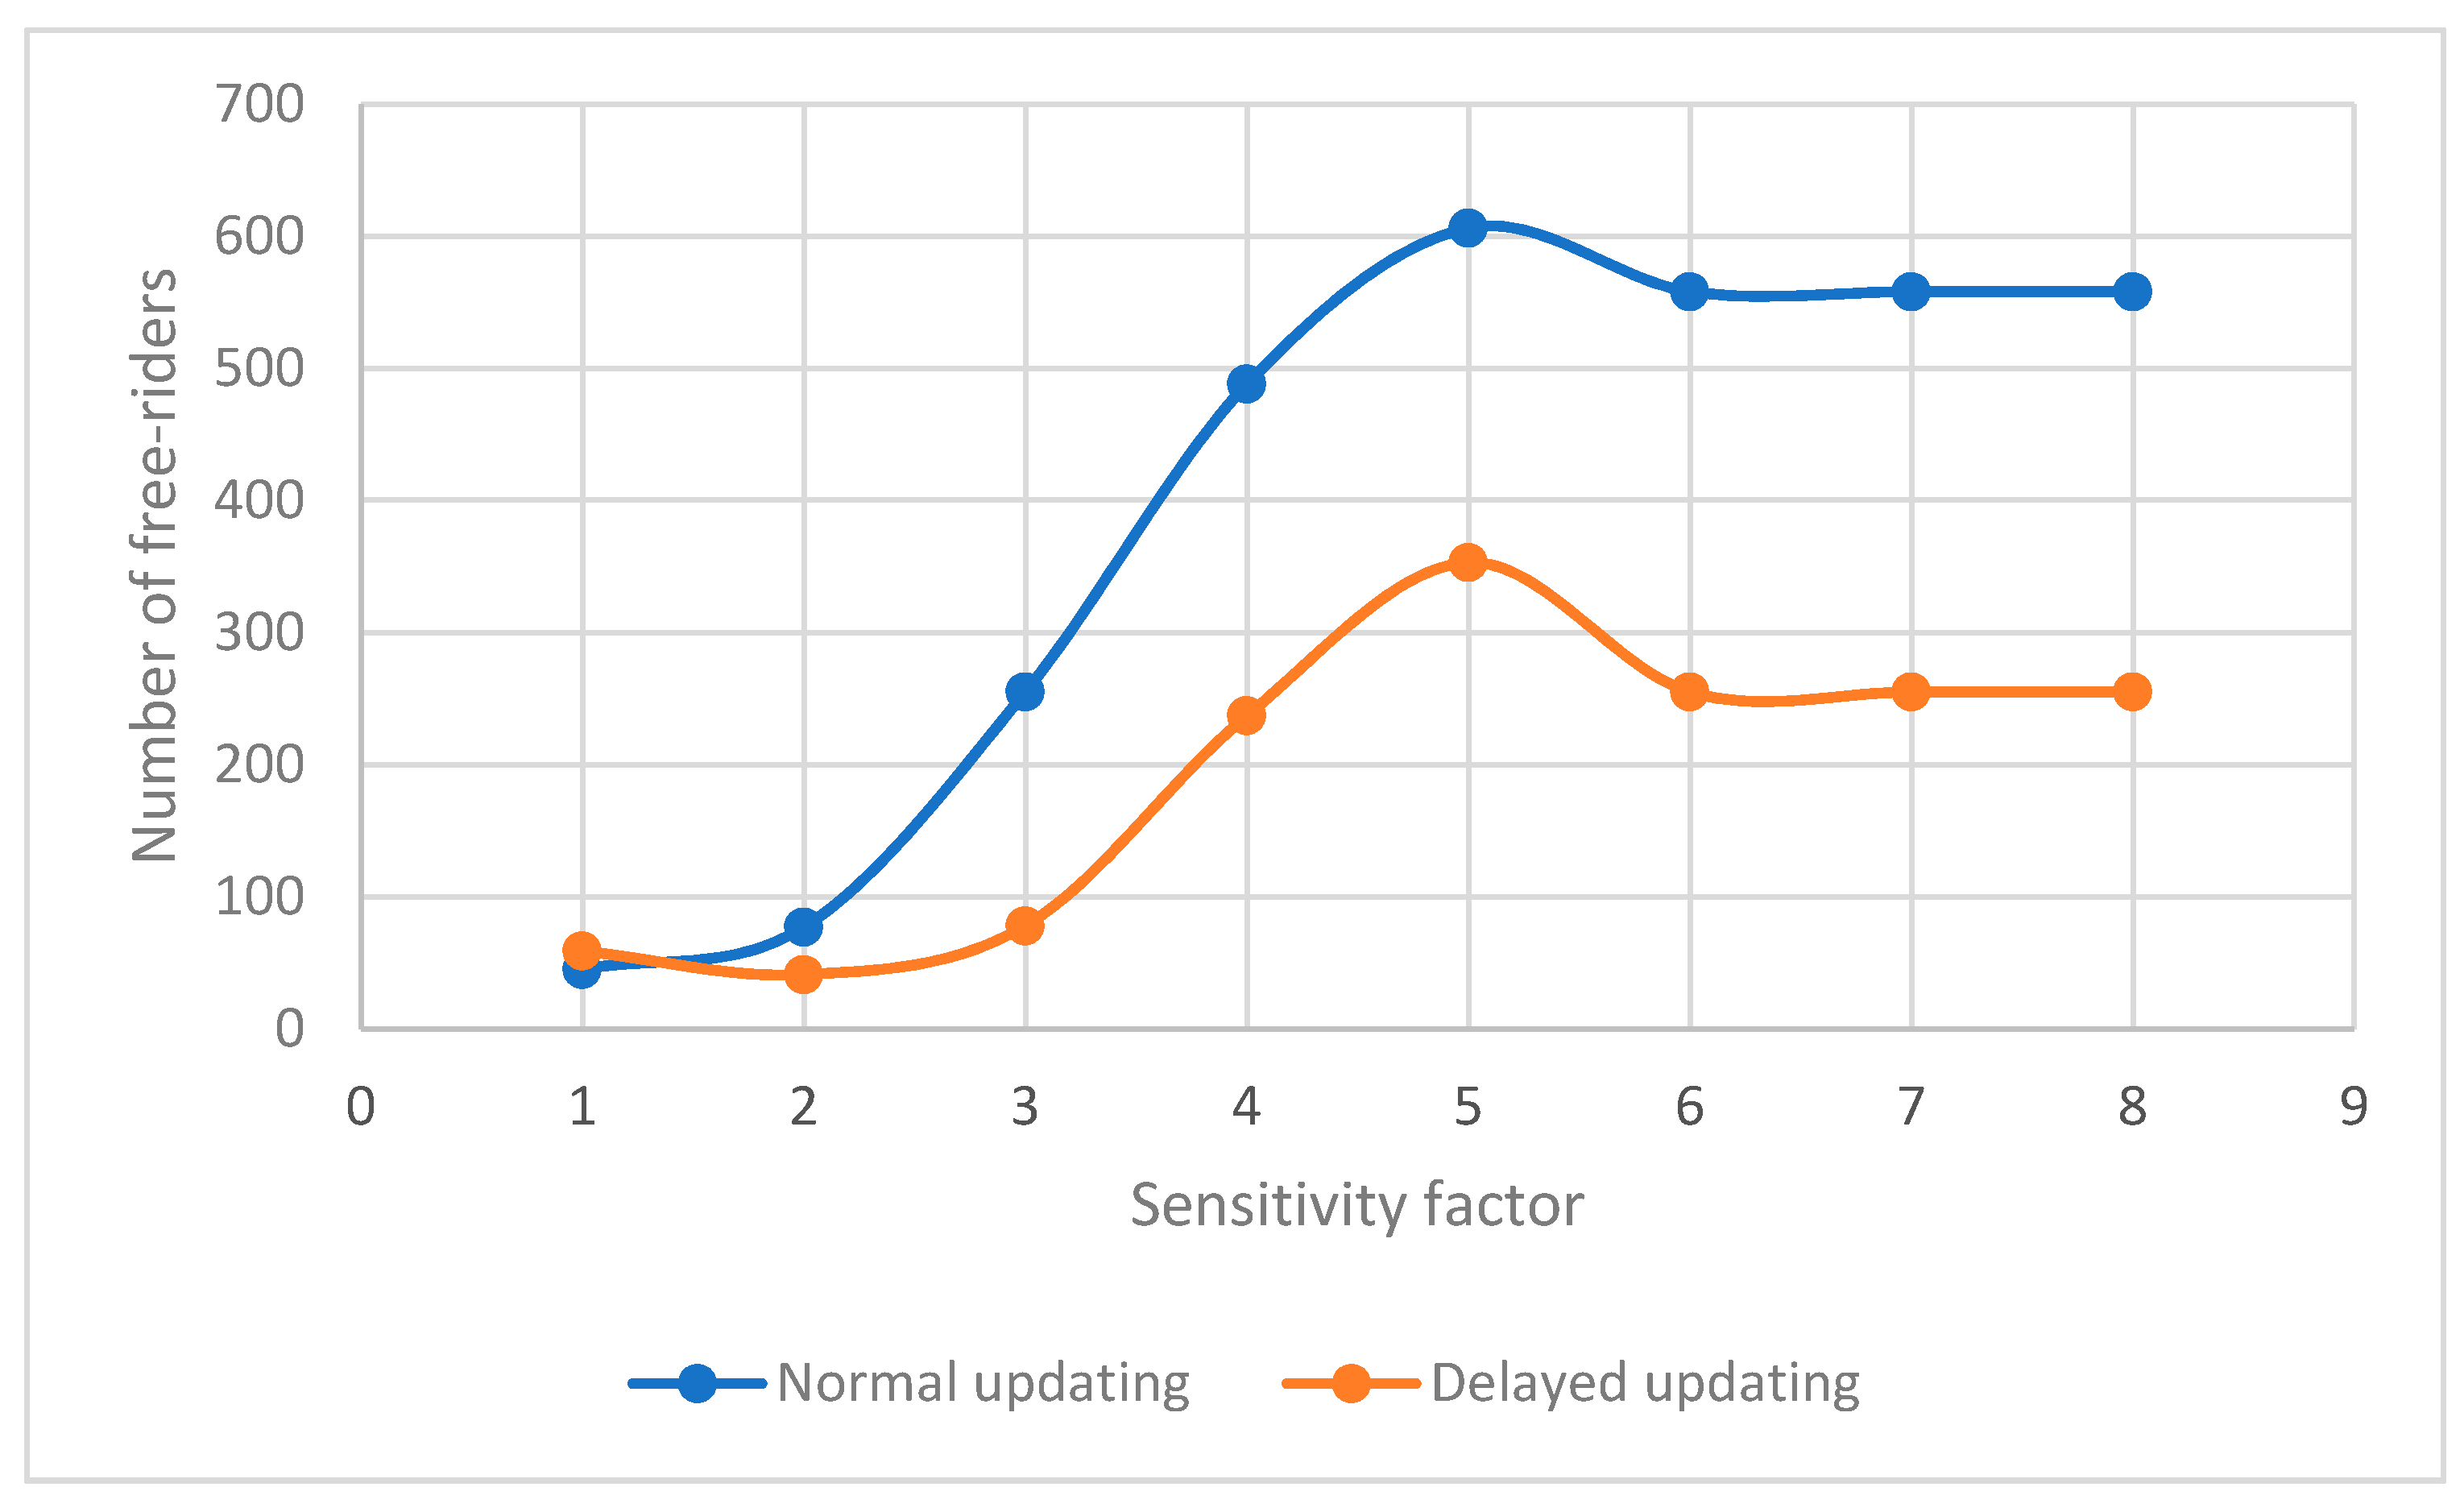
3.4. Effect of Changing Sensitivity Factor S
Sensitivity factor S is another parameter in the model which represents the degree of social awareness and the fear of individuals of the disease. It represents the degree of aversion of individuals to reported infected and vaccinated cases around them and their willingness to change their behavior to protect themselves and their community. This sensitivity and willingness to change a strategy from doing nothing to getting vaccinated can be the result of investment in media campaigns and awareness programs.
Figure 15,
Figure 16 and
Figure 17 show that considering the disease incubation period when modeling epidemics shows fewer numbers of free-riders and vaccinated individuals, but more infected individuals (in the same manner?) for all sensitivity factors above four. However, for sensitivities less than or equal to four, the existence of infection awareness time delay results in fewer vaccinated and free-riders. Increasing the sensitivity causes players to decide to get vaccinated sooner, and if they are not aware of possible threat of a disease, more players choose to defer vaccination. This causes an increase in infection rate among the players in comparison to a similar situation with a higher sensitivity factor.
The effect of different sensitivity factors on the number of free-riders is shown in
Figure 15. It shows that increasing the sensitivity factor results in more free-riders. However, when considering the incubation period, this increase is smaller when there is a time delay in becoming aware of an infection.
Assuming both s and the time delay as types of “responsiveness,” the model with lower “responsiveness” (delayed updating with a lower s) has fewer free-riders, fewer vaccinated and more infected individuals compared to the model with higher “responsiveness” (normal updating with higher s) as shown in
Figure 15 and
Figure 16. The delay in becoming aware of the infection threat can be due to the incubation period or lack of appropriate awareness information. A similar discussion applies to the number of vaccinated individuals, as illustrated in
Figure 16. Increased awareness and sensitivity will result in a higher level of vaccination, and lower sensitivity and awareness will result in fewer vaccinations.
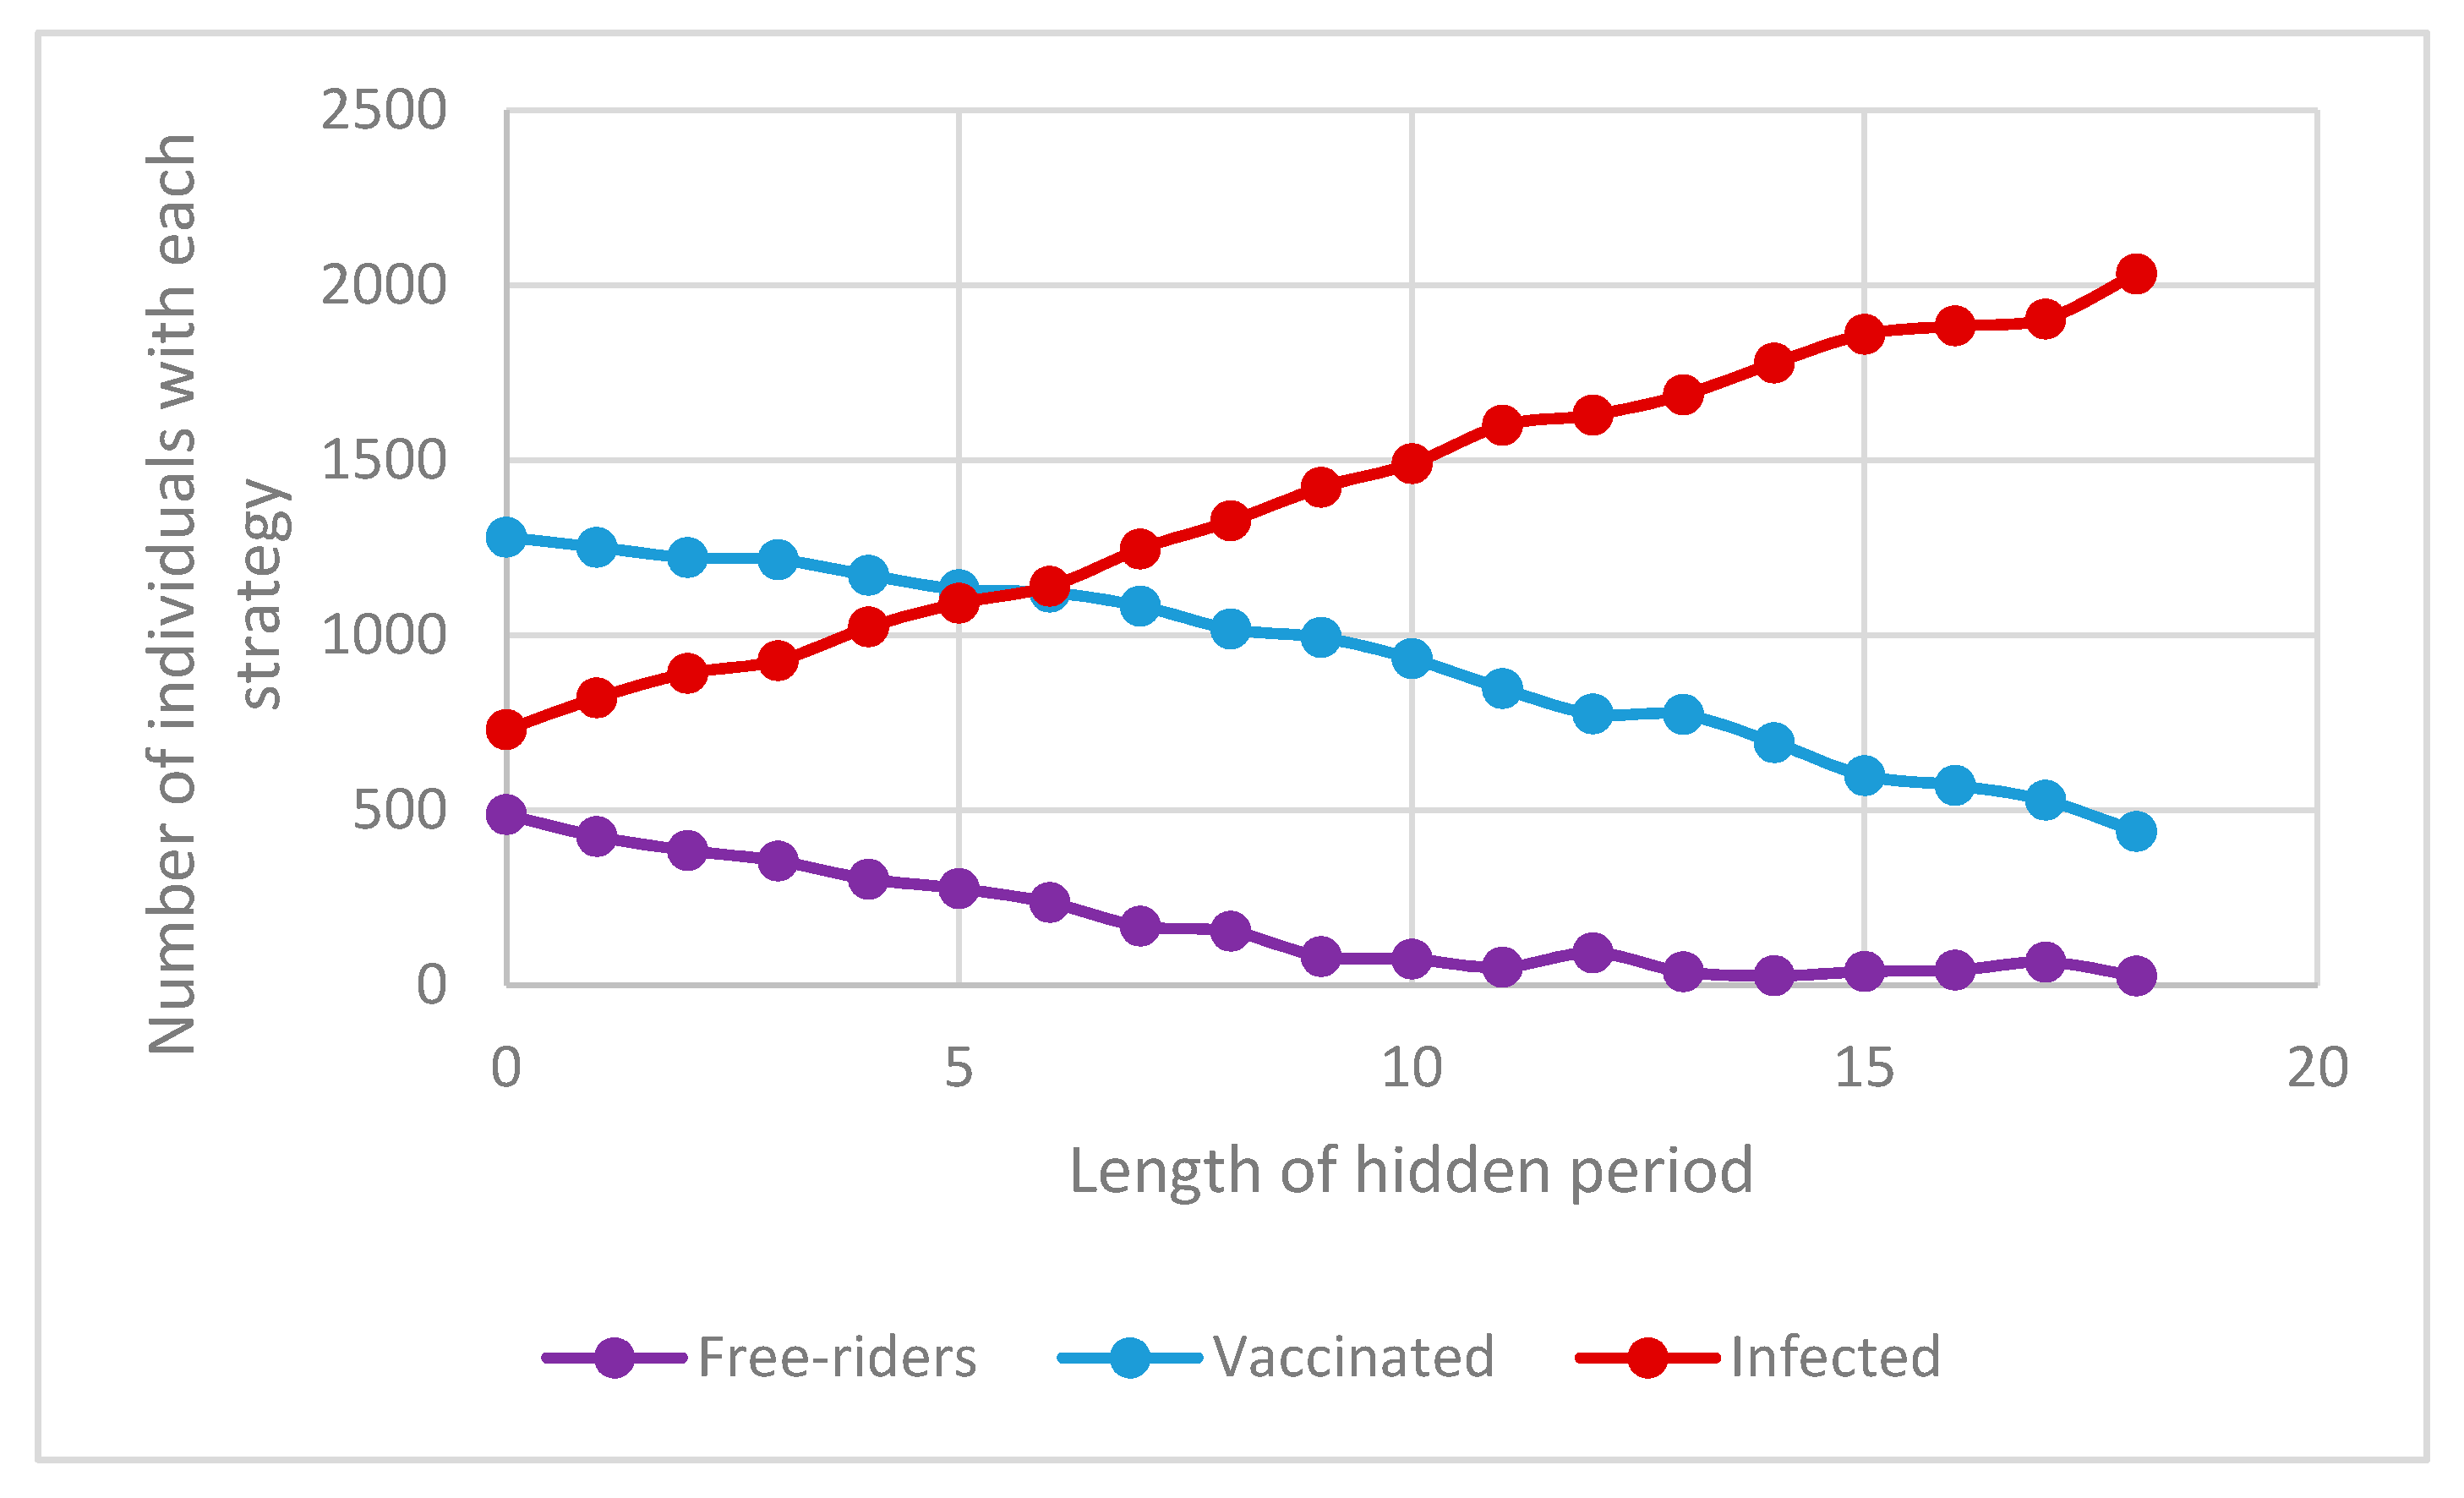
3.5. Effect of Changing the Incubation Period in Delayed Updating
Another factor to study when modeling epidemics is the length of the incubation period and its effect on the dynamic of an epidemic and the number of free-riders, vaccinated and infected individuals in a population. Unfortunately, this parameter cannot be controlled by health officials, but it can dramatically influence the dynamic of epidemics. As shown in
Figure 18, the number of individuals with each vaccination strategy has an approximately linear correlation with the length of the incubation period of an epidemic. Therefore, a longer time delay (incubation period) results in more infected individuals (red line), fewer vaccinated individuals (blue line), and fewer free-riders (purple line).
However, the length of the epidemic does not show a meaningful relationship to the length of an incubation period (
Figure 19). Thus, although an increase in the incubation period results in more infected individuals, fewer vaccinated and free-rider ones, it will not affect the duration of the epidemic. It can be said that, on average, an epidemic with a higher incubation period will not last for a longer time.
One can say that the result of a longer incubation period is similar to the result of lower sensitivity factor, generally indicating lower awareness about the epidemic. Lower awareness will ultimately result in more infected and fewer free-riders and vaccinated individuals.
4. Conclusions
This paper examined the effect of incubation period on the dynamic of epidemics. It is assumed that, during an incubation period, individuals are infectious, but they and their contacts are not aware of the threat of the spread of infection in their communities. This unawareness changes the response of people to an epidemic and consequently can result in different epidemic dynamics. Thus, considering the time delay in responding to an epidemic requires different public health management strategies.
This study analyzes the factors and parameters that can affect epidemic spread, which are the cost of vaccination, initial vaccination rate, transmission rate, and sensitivity of individuals to the threat of a disease. The results show that, in comparison to the same model without considering incubation period, time delay results in fewer vaccinated individuals, fewer free-riders, and more infected individuals. However, this effect is more noticeable when the cost of vaccination is relatively low, transmission rate is high and mandatory initial vaccination is also low. When considering the effect of sensitivity to the threat of a disease, analysis shows that the increased sensitivity of individuals to an ongoing epidemic results in fewer total infected individuals and more free-riders but may not dramatically affect the number of vaccinated individuals. Moreover, the results show that, when the incubation period is longer relative to the total time of an infection, there will be more infected individuals and fewer vaccinated and free-riders.


