1. Introduction
Understanding the evolution of international trade policy requires students to navigate historical processes, institutional changes, and economic data that extend across several decades. In higher education, these topics have traditionally been addressed through narrative or document-based instruction, which often provides limited opportunities for students to work directly with primary evidence. Recent scholarship in digital pedagogy has highlighted the value of integrating data-rich resources and interactive tools into the learning process, enabling students to interpret long-term trends and examine how economic decisions unfold in context [
1,
2,
3]. These approaches encourage analytical engagement and afford learners opportunities to explore how theories, institutions, and historical events intersect.
The case of Ecuador provides a particularly suitable context for designing a data-oriented learning environment. Since the return to democracy in 1979, the country has undergone alternating policy cycles, external shocks, institutional reforms, and periods of greater or lesser trade openness. These dynamics are reflected in the structure of exports, the composition of national production, and the shifting role of the state in economic management. Engaging with this trajectory helps students recognize how economic policy is shaped by political incentives, structural constraints, external market conditions, and long-term development goals. When these elements are combined with digital tools, open datasets, and structured inquiry tasks, the learning environment allows for richer forms of interpretation and comparison.
Despite the expansion of digital tools in economics education, there is a paucity of research integrating multi-decade historical indicators with interactive visualizations to teach international trade policy. Existing studies often examine digital learning from a purely technological perspective, frequently overlooking how students interpret institutional developments when working with historical evidence. Furthermore, in the Latin American context, few contributions analyze how learners connect long-term economic trajectories with policy cycles using data-driven materials.
To address these gaps, the primary aim of this study is to design and implement a data-driven digital learning framework grounded in Ecuador’s trade policy evolution (1979–2024), and to examine how such an environment supports undergraduate students’ interpretive reasoning, data literacy, and contextual understanding of institutional change. Consequently, the research is guided by the following Research Question (RQ): How does a data-driven digital learning environment influence undergraduate students’ ability to interpret long-term trade policy trends and institutional changes?
Although the manuscript refers to the period 1979–2024, the year 2025 was not included in the dataset for methodological reasons. At the time of data collection, complete annual macroeconomic indicators and consolidated trade statistics for 2025 were not yet fully available in the World Development Indicators or in national statistical repositories. Because the instructional design relies on harmonized annual series to ensure longitudinal consistency, the dataset was deliberately limited to 1979–2024 to avoid partial-year distortions. Future iterations of the framework will incorporate 2025 data once validated annual series become publicly accessible.
We posit the following Hypothesis H1: Students who engage with historical data through interactive visualizations and structured analytical tasks are expected to exhibit stronger interpretive engagement with the relationships between trade policy, institutional change, and economic outcomes compared to baseline descriptive competencies.
To provide an initial overview of the material used in the course design,
Table 1 summarizes the core dimensions of Ecuador’s trade trajectory that are incorporated into the digital tasks. These dimensions combine structural indicators with institutional and historical information, allowing students to situate numerical trends within broader policy developments [
4,
5].
Furthermore,
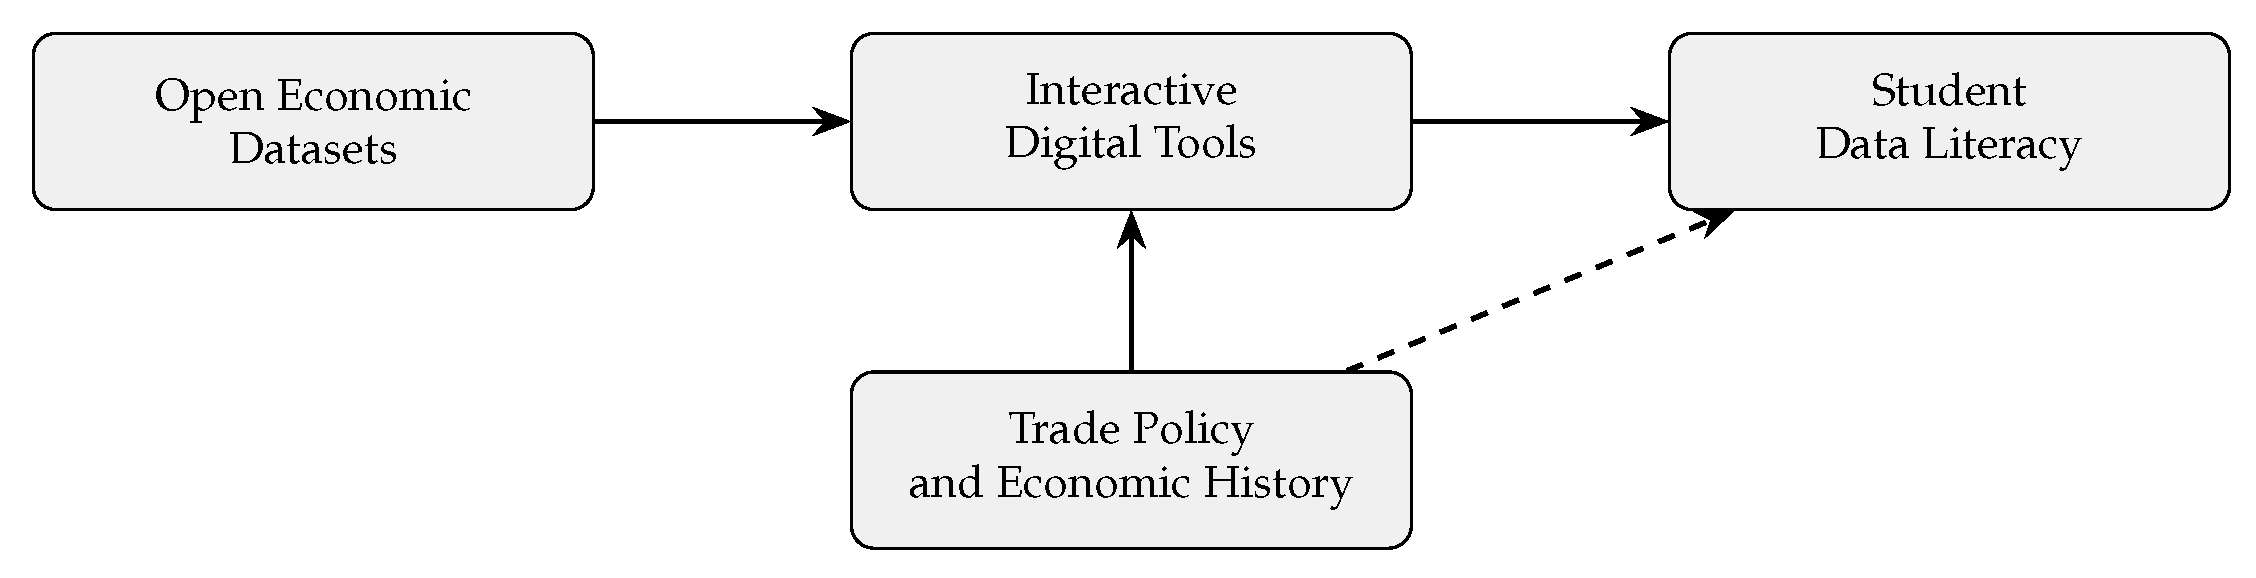
Figure 1 provides a conceptual representation of how these elements were integrated into the digital learning environment. It illustrates the relationship between the historical content, the datasets used in the course, and the analytical tasks supported by digital tools [
6,
7]. The solid arrows represent direct operational interactions within the learning process; namely, how datasets are mediated through interactive tools to foster data literacy, while the dashed arrow indicates a broader conceptual linkage between sustained engagement with trade policy content and the progressive development of analytical competencies, consistent with scaffolded digital learning approaches [
6].
Table 1.
Core dimensions of Ecuador’s trade policy trajectory (1979–2024) used for instructional design.
Table 1.
Core dimensions of Ecuador’s trade policy trajectory (1979–2024) used for instructional design.
| Dimension | Description |
|---|
| Trade Openness | Long-term evolution of export and import ratios, tariff structure, and participation in trade agreements [8]. |
| Export Structure | Variation in primary vs. higher value-added exports across decades, highlighting dependence and diversification challenges. |
| Institutional Cycles | Shifts in regulatory frameworks, state capacity, and political orientation during different administrations. |
| External Shocks | Impact of oil price fluctuations, financial crises, and global market conditions on domestic policy choices. |
| Macroeconomic Indicators | Growth cycles, real exchange rate movements, and income-related variables influencing policy design [9]. |
The remainder of this article is structured as follows.
Section 2 discusses the theoretical foundations, drawing on research in digital learning, inquiry-based instruction, and the role of economic data.
Section 3 outlines the methodology used to construct the digital learning framework, including dataset preparation and task design.
Section 4 reports the results of the classroom implementation, focusing on students’ analytical performance.
Section 5 discusses these results in light of existing literature, and
Section 6 concludes with recommendations for future applications.
2. Theoretical Framework
The present study draws on two complementary bodies of literature: digital learning in higher education and the pedagogy of economic history. Bringing these fields together provides a foundation for designing a learning environment where historical evidence, digital tools, and analytical reasoning interact synergistically.
2.1. Digital Learning, Inquiry-Based Instruction, and Data Literacy
Research on digital learning emphasizes the need to integrate technological, pedagogical, and disciplinary knowledge to support instruction meaningfully. The TPACK framework, introduced by Mishra and Koehler [
2], argues that educators must combine an understanding of the subject matter with knowledge of how technology can mediate learning processes. Although the model was initially conceptualized for teacher education, its emphasis on the thoughtful alignment between content and digital tools has proven highly applicable across various domains of higher education.
Another strand of research concerns cognitive load and guidance during learning tasks. Kirschner, Sweller, and Clark [
1] demonstrated that students benefit significantly from structured guidance when working with complex information, particularly in inquiry settings. Their findings indicate that unguided exploration of data often leads to cognitive overload, limiting opportunities for deeper understanding. This insight is particularly relevant for courses incorporating quantitative data or historical evidence, as the interpretation of such information often demands explicit scaffolding.
From a broader perspective, digital learning intersects with theories of networked knowledge. Siemens [
3] conceptualized learning in digital environments as a process of building and navigating connections between information sources. In this view, students engage in knowledge construction not solely by absorbing content but by interacting with datasets, tools, and representations that help them discern relationships and patterns. Such approaches foreground the role of data literacy: the ability to read, interpret, and make reasoned judgments based on empirical material.
Media and information literacy frameworks likewise emphasize critical engagement with digital resources. Colás-Bravo et al. [
10] underline that learners must not only access information but also evaluate its reliability and situate it within broader social and institutional contexts. When students examine long-term economic trends through open datasets, these competencies become directly relevant, as the data must be connected with policies, institutions, and historical contingencies.
Table 2 summarizes how the digital competencies highlighted in this literature are mapped onto the analytical skills required to study international trade policy in depth. This mapping guided the design of the tasks used in the present study.
2.2. Economic History and Trade Policy as a Learning Context
The second strand of literature examines the study of international trade policy and its link to long-term development trajectories. A considerable body of work has established that what countries export, and how their export structure evolves over time, shapes the possibilities for sustained growth and structural transformation. Hausmann et al. [
8] demonstrated that the sophistication of a country’s export basket is associated with future income growth, as it often reflects underlying capabilities and institutional arrangements.
Other contributions focus on macroeconomic indicators and their relevance for international competitiveness. Ridhwan et al. [
9], for instance, argued that the real exchange rate plays a central role in shaping growth outcomes and influences domestic incentives for productivity, diversification, and policy choice. These insights provide students with a conceptual foundation to understand how external conditions and macroeconomic performance relate to trade policy decisions.
Working with historical data also connects with broader questions of institutional change. Trade policy is not solely the outcome of economic considerations but arises from political negotiations, regulatory reforms, external shocks, and long-term developmental objectives. The availability of open datasets, including the World Development Indicators [
11], allows students to integrate quantitative information with institutional timelines, providing a more holistic view of economic evolution.
In the context of this study, Ecuador’s trajectory between 1979 and 2024 offers a rich case for inquiry-based learning. The sequence of policy shifts, the restructuring of the economy, and the recurrent influence of international markets provide multiple entry points for academic analysis. When combined with digital tools that help visualize patterns and compare periods, these historical processes become accessible for students who may not yet have advanced training in economics.
3. Methodology
The methodological approach adopted in this study was shaped by two central considerations: first, the need to organize Ecuador’s long-term trade policy data into a coherent structure that could support analytical exploration; and second, the importance of designing a digital learning environment that would allow students to work with this material in ways that enhance data literacy and interpretive reasoning. The process, therefore, unfolded along three parallel dimensions: dataset construction, development of digital tools, and the creation of inquiry-oriented learning tasks.
3.1. Dataset Construction and Sources
A longitudinal dataset covering the period 1979–2024 was compiled using publicly available sources, primarily the World Development Indicators [
11] and official national statistical archives. The dataset was organized into several dimensions (trade openness, export structure, institutional changes, external shocks, and macroeconomic indicators) reflecting the analytical perspectives highlighted in
Section 1.
Data preparation involved cleaning, standardizing, and aligning variables whose definitions changed over time. Missing values were retained when no archival material allowed reliable reconstruction. These gaps were made visible in the digital environment so that students could reflect on their significance. This decision aligns with the emphasis on transparency and data awareness advocated in recent studies on digital and personal data literacies [
12].
3.2. Design of the Digital Learning Environment
Before interacting with the dashboard, students participated in a preliminary orientation session explaining the meaning of each indicator, the time coverage of the dataset, and the type of analytical questions they would later address. This preparatory step ensured a common baseline of understanding across participants.
The digital learning environment was constructed around visualizations designed to help students recognize patterns and make comparisons across decades [
13]. Research on technology-enhanced learning underlines that digital tools become pedagogically useful when they structure attention, reduce cognitive load, and support the organization of information [
14,
15,
16,
17]. Building on this insight, the dashboard interface was kept deliberately simple: each view highlighted a specific dimension of the dataset, accompanied by brief explanatory notes that framed the interpretive task.
Visualization design was informed by findings from cognitive studies of graphical representations. Dai et al. [
18] and Alharbi et al. [
19] show that learners are more likely to interpret simulations productively when representations are intuitive and afford meaningful interaction. Similarly, research in visual analytics has demonstrated that clarity and emphasis in graphical encodings can substantially shape how users extract information from complex datasets [
20]. These principles guided the construction of the line plots, categorical timelines, and comparative charts used in the study.
The general workflow for developing the digital materials is summarized in
Figure 2. The diagram illustrates the sequence from data acquisition to the design of inquiry tasks and emphasizes that decisions about visualization and task design were taken only after the structure and limitations of the dataset had been examined. In this way, the technological components were anchored in the pedagogical and empirical requirements of the study, rather than being added as purely decorative features.
3.3. Inquiry-Oriented Task Design
The pedagogical structure of the intervention drew on established principles of inquiry-based learning and data literacy. Studies on university students’ digital competencies [
21,
22] highlight the importance of activities that encourage interpretation, comparison, and critical evaluation of evidence. Building on these ideas, each task in the learning environment was organized around a guiding question and required students to examine one or more visualizations. Examples included:
Recognizing structural shifts: Students examined multi-decade series of export composition to identify moments of diversification or concentration, connecting these patterns to institutional reforms or changes in external conditions.
Assessing policy orientation: Using the timeline of administrative cycles, students compared how different governments approached trade policy, linking their observations to broader discussions on trade and inequality [
23,
24].
Interpreting external shocks: Learners analyzed the timing and consequences of global disruptions, such as commodity price collapses, and reflected on their impact on domestic policy decisions.
These tasks were accompanied by prompts that encouraged students to connect empirical observations with conceptual perspectives on structural transformation and regional dynamics, informed by recent scholarship in international economics [
25]. The intention was to move beyond descriptive analysis towards explanation, helping students articulate how economic patterns relate to institutional, political, and global factors.
3.4. Illustrative Case Example of Classroom Implementation
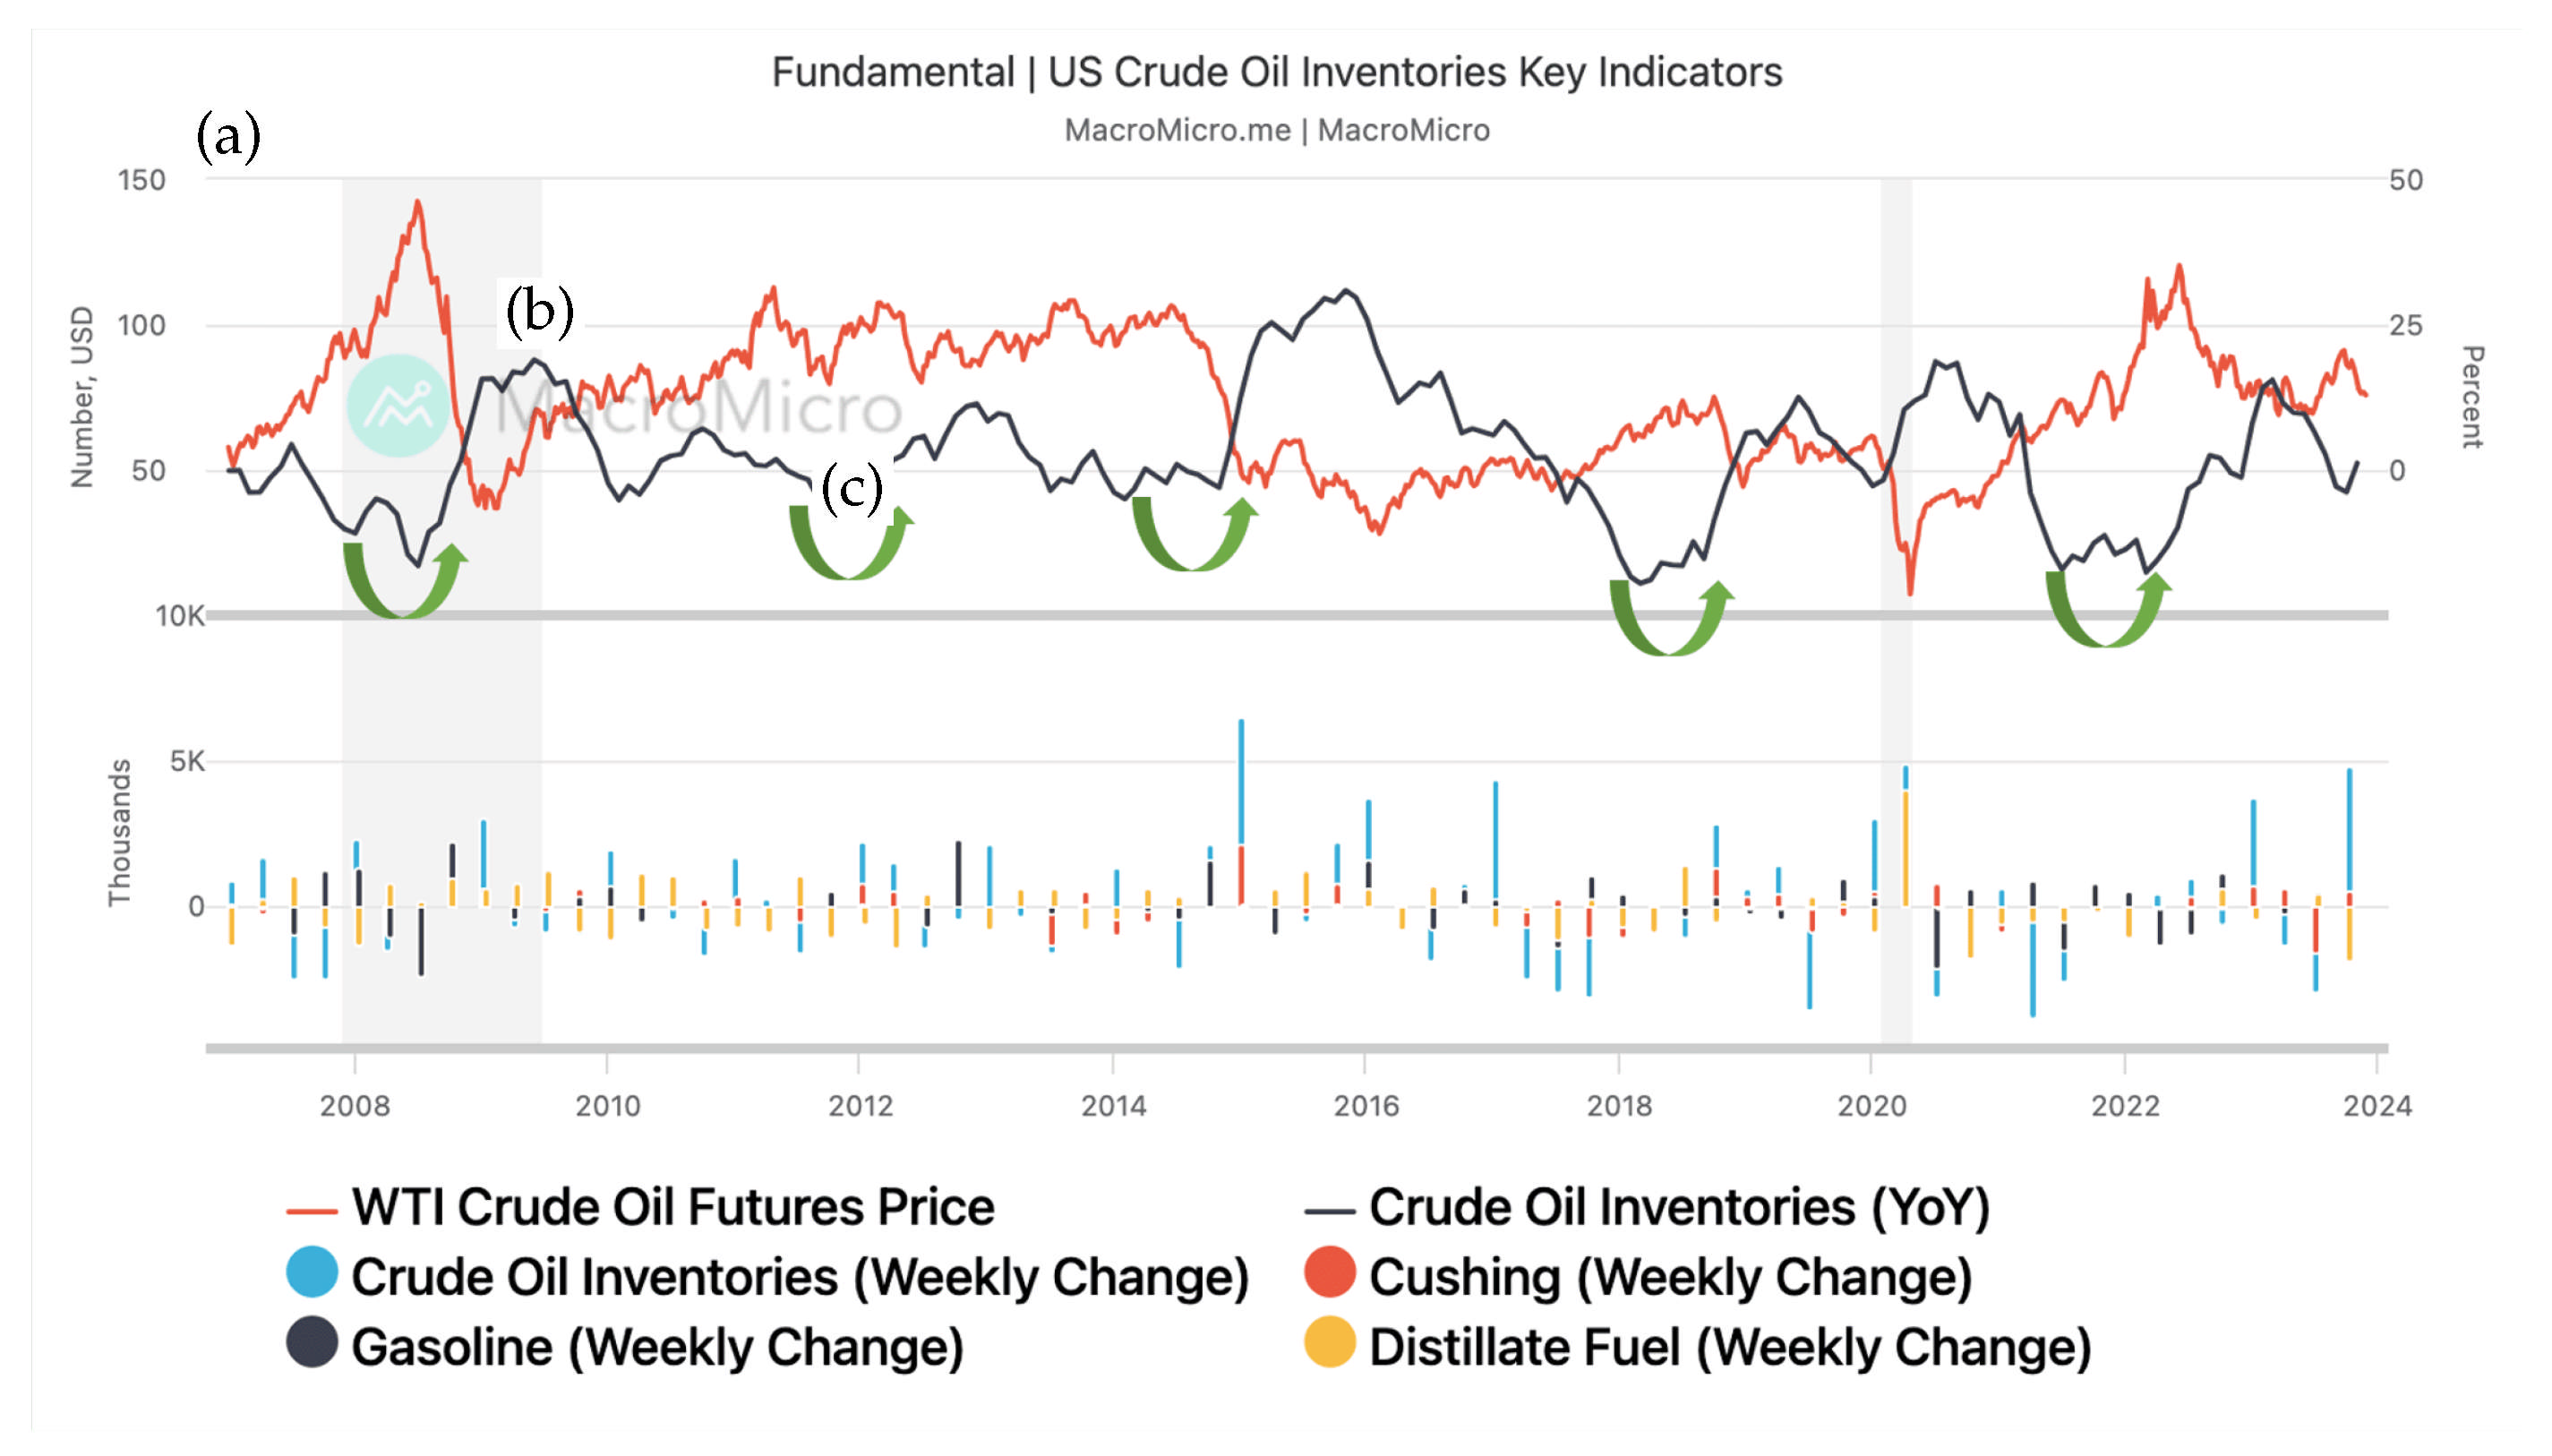
The dashboard interface used in the classroom implementation was developed using Microsoft Power BI (Version 2.126, Microsoft Corporation, Redmond, WA, USA). This business analytics and interactive data visualization platform enabled the construction of synchronized time-series visualizations, indicator overlays, and dynamic filtering mechanisms. Students were able to activate or deactivate specific variables, adjust temporal windows, and compare structural and short-term fluctuations within a unified analytical frame.
Figure 3 presents a representative example of the type of visualization environment employed during the intervention. The interface architecture followed a layered visualization logic: a primary longitudinal trend line (oil prices), a secondary comparative indicator (inventory year-over-year change), and a lower panel representing short-term weekly variation. This dual-scale structure enabled students to contrast structural cycles with high-frequency volatility, supporting multi-level economic interpretation.
3.5. Participants and Implementation
The digital learning environment was implemented in two undergraduate courses in economics and social sciences at a public university. Participants were selected through convenience sampling, as they were enrolled in courses where international trade policy formed part of the official curriculum. Forty-eight students (n = 48), primarily in their second and third academic years, participated in the two-week intervention.
The instructional implementation should be understood as exploratory classroom-based research rather than as a quasi-experimental evaluation of teaching effectiveness. The absence of a control group and the short duration of the intervention limit causal inference. Consequently, the study does not claim that the digital framework “improves” learning outcomes in a statistically generalizable sense; instead, it provides descriptive evidence of how students interact with historical data within a structured digital inquiry environment.
Table 3 presents the analytic rubric used to evaluate responses.
3.6. Assessment Design and Validation
The post-activity assessment was designed to evaluate three analytical dimensions aligned with the instructional objectives: (1) interpretation of longitudinal trends, (2) connection between indicators and institutional events, and (3) formulation of evidence-based explanations.
Content validity was established through expert review. Two faculty members in economics and one specialist in digital pedagogy examined the assessment rubric to verify alignment between tasks, learning objectives, and evaluation criteria. Minor adjustments were made to clarify scoring descriptors and ensure conceptual consistency. A small pilot application (n = 12) in a previous semester was used to test clarity of instructions and approximate difficulty levels. Feedback from this pilot led to refinements in question wording and scoring scale anchors.
Given the exploratory scope of the study, formal psychometric validation (e.g., factor analysis) was not conducted. Instead, the assessment is presented as a structured classroom-based evaluative instrument designed to capture interpretive competencies within a specific instructional context.
Student responses were scored using an analytic rubric with explicit performance descriptors for each level (0–10 scale). All responses were evaluated independently by two instructors. Inter-rater consistency was examined through percentage agreement, which reached 87%. Discrepancies were resolved through discussion to ensure interpretive consistency. Although more advanced reliability coefficients (e.g., Cohen’s kappa) were not calculated, the double-scoring procedure sought to reduce subjectivity in evaluation.
3.7. Transferability and Contextual Boundaries
While the empirical content of this framework is grounded in Ecuador’s economic trajectory, it is important to distinguish between context-specific and transferable components. The historical dataset, institutional cycles, and macroeconomic events are inherently country-specific and cannot be generalized across national settings without adaptation.
However, the instructional design principles are transferable. These include: (1) organizing longitudinal datasets into analytically coherent dimensions, (2) combining visualizations with structured inquiry prompts, (3) scaffolding interpretation of institutional context, and (4) aligning assessment tasks with data literacy competencies.
In countries where data availability, institutional complexity, or economic volatility differ significantly, local datasets and contextual timelines would need to replace the Ecuadorian material. Nevertheless, the pedagogical architecture—data-driven inquiry supported by guided visualization—can be adapted to diverse policy domains and national contexts.
4. Results
It is important to note that the quantitative scores reported in this section are intended as descriptive indicators of student performance rather than inferential measures. Given the exploratory scope of the study, the limited sample size, and the absence of a control group, the numerical results are used to support qualitative interpretation and pattern identification, not to establish statistically generalizable effects.
The implementation results were examined to determine, first, whether students were able to interpret long-term economic patterns more effectively when supported by the digital learning environment, and second, whether their written explanations revealed stronger connections between trade indicators, institutional developments, and external shocks. The analysis drew on three sources of evidence: responses to inquiry tasks, a post-activity assessment, and informal observations made during the learning activities.
4.1. Analysis of Student Performance
Analysis of the students’ written responses indicated a general capability to recognize structural changes in Ecuador’s export composition across decades. Many participants identified sharp increases in commodity dependence during the early 1980s and mid-1990s, as well as moments of diversification associated with specific policy episodes. These observations were frequently accompanied by attempts to relate empirical patterns to external conditions, such as oil price fluctuations or shifts in global demand. This interpretive link is consistent with the type of analytical reasoning that data literacy aims to support [
26].
Table 4 summarizes student performance across the three dimensions assessed in the post-activity evaluation. The scores suggest that students were more proficient in interpreting long-term trends than in formulating explanations that linked economic indicators with institutional reforms. This discrepancy is anticipated, given the complexity of institutional reasoning and the relatively short duration of the intervention. Nevertheless, the overall pattern indicates that the combination of visualizations and inquiry prompts strengthened the students’ ability to extract meaning from the data.
4.2. Patterns Observed in Inquiry Tasks
Distinctive patterns emerged from the students’ responses to the inquiry tasks. When asked to identify periods of structural change, learners frequently noted increases in export concentration or declines in diversification. These responses suggest that the interactive visualizations facilitated the identification of trends that might otherwise remain obscured in traditional tabular data, aligning with prior findings on the efficacy of graphical representations [
20,
27].
To provide greater clarity regarding students’ interpretive depth, two anonymized response excerpts are presented below.
Example of higher-level response: “The increase in oil export dependence during 1994–1998 coincides with declining diversification indicators and institutional instability. The collapse in oil prices constrained fiscal capacity, limiting industrial upgrading policies.”
This response demonstrates explicit linkage between empirical trend (export concentration), external shock (oil price decline), and institutional implications.
Example of lower-level response: “Exports increased in the mid-1990s and then declined. This reflects economic problems.”
While factually correct, this explanation lacks institutional specification and causal articulation. Such patterns were common among students who correctly identified trends but struggled to contextualize them institutionally.
A second task required learners to compare different administrations. Most students successfully identified broad differences between policy orientations; however, their explanations varied significantly in specificity. While some referred to particular trade agreements or regulatory shifts, others provided more generalized descriptions. This variation suggests that interpreting institutional developments remains a challenging skill that requires additional scaffolding and explicit modeling. Excerpts from student responses illustrate this tendency; for instance, while some clearly linked “export concentration in the mid-1990s” to “external shocks and oil price drops,” others recognized policy changes without precisely identifying the responsible institutions.
Table 4 provides a consolidated summary of the assessment results across the three evaluated dimensions.
4.3. Qualitative Observations
Beyond the formal assessment, informal observations conducted during the activities suggested that students engaged actively with the digital visualizations. Several participants asked follow-up questions regarding specific changes in the data or connections to broader trends in international markets, indicating that the environment stimulated forms of exploratory reasoning. Such engagement is consistent with previous reports on the role of interactivity and feedback in fostering deeper learning outcomes [
18,
19,
21,
22].
5. Discussion
The findings elucidated herein illustrate how digital tools can support students’ interpretation of historical economic processes, particularly when engaging with multi-decade datasets. This section interprets the primary results in relation to recent scholarship on digital learning, data literacy, and development economics, and integrates a comparative analysis that situates the intervention within broader trends observed in the literature.
5.1. Interpreting Student Outcomes Through Digital Learning Research
The relatively higher performance observed in trend interpretation suggests that the visual tools may have supported students in identifying structural patterns; however, the evidence remains descriptive and should not be interpreted as proof of causal instructional effectiveness. This is consistent with evidence indicating that well-designed visual representations can enhance learners’ ability to extract meaning from complex information [
28]. Furthermore, the digital environment provided a structured setting that encouraged exploration without overwhelming students, replicating conditions that previous research has identified as conducive to productive inquiry-based learning [
29,
30,
31].
However, gains should not be interpreted as uniform across all dimensions of learning, as students exhibited notable variation when required to articulate institutional mechanisms explicitly. The students’ more modest performance in tasks requiring the connection of indicators to institutional developments aligns with the observation that analytical reasoning develops more gradually than descriptive competencies. This pattern is reflected in research on educational data literacy, which highlights that interpreting data in context requires both conceptual and procedural knowledge [
32]. Our findings suggest that while the digital environment provided a useful foundation, extended engagement may be requisite for the development of more elaborate explanatory reasoning.
5.2. Relevance for Economic Understanding and Trade Policy Education
The intervention afforded students opportunities to draw connections between empirical patterns and theoretical insights from international economics. For example, several students noted how periods of rising commodity dependence were associated with vulnerability to external shocks, an observation that echoes longstanding debates about structural constraints in Latin American economies [
33,
34]. Similarly, students who linked changes in export composition to policy reforms implicitly engaged with ideas about productivity, diversification, and upgrading developed in contemporary trade literature [
35,
36]. These connections, though not always explicit, indicate that digital visualizations can help bridge the gap between descriptive analysis and theoretical reasoning [
4].
5.3. Comparing Findings with Existing Literature
Table 5 summarizes how the outcomes of this study relate to patterns reported in recent research on digital learning and data literacy. The comparison suggests that the intervention performs similarly to other initiatives in terms of descriptive competence, while offering distinctive contributions in its use of historical data and its emphasis on institutional interpretation.
Comparable findings have been reported in Latin American educational contexts, where students tend to recognize long-term economic patterns more easily than institutional drivers. These parallels reinforce the relevance of the present framework for middle-income countries with volatile economic histories.
5.4. Implications for Digital Learning in the Social Sciences
Several practical implications emerge from these comparisons. First, digital environments can make multi-decade economic data more accessible by reducing cognitive load. Second, interpretive skills benefit from explicit scaffolding, particularly when connecting empirical indicators with institutional developments. Third, historical economic data can be effectively transformed into inquiry-oriented learning materials.
Table 6 outlines specific recommendations derived from these findings.
5.5. Limitations and Future Directions
The scope of this study was limited by its short duration and sample size. Although the intervention assisted students in recognizing patterns and articulating basic explanations, a longer implementation period might be requisite to support more complex reasoning. Future work could incorporate interactive simulations or predictive models, allowing students to explore counterfactuals and policy scenarios. Prior research indicates that such tools can deepen understanding by helping students test hypotheses [
18,
19]. Additionally, integrating automated feedback may provide timely guidance during inquiry tasks, as emphasized in learning analytics frameworks [
37].
6. Conclusions
This study explored the implementation of a digital learning environment grounded in historical economic data to support students’ understanding of international trade policy. By integrating longitudinal indicators, structured visualizations, and inquiry-based tasks, the intervention appears to have encouraged learners to engage in interpretive practices that extend beyond purely descriptive reading, although this observation remains bounded by the exploratory design of the study. The empirical results indicate that students developed significant confidence in identifying long-term patterns and, to a more modest extent, in articulating connections between economic indicators, institutional developments, and external shocks.
The study contributes to ongoing debates regarding the role of digital tools in higher education. Rather than positioning technology as an end in itself, the design approach emphasized how visual representations and guided inquiry can fundamentally shape the ways in which students reason with evidence. This resonates with calls in the educational technology literature for more authentic, conceptually grounded uses of digital tools [
29,
30]. Simultaneously, the results highlight that advanced interpretive skills—particularly those involving institutional analysis—require sustained practice, structured guidance, and tasks that actively engage students in comparing competing explanations.
From a disciplinary perspective, the intervention demonstrates that historical economic data can be transformed into pedagogically meaningful materials. Trade policy is a domain where empirical indicators, political decisions, and global markets interact in complex ways. Working with the Ecuadorian case enabled students to recognize these dynamics and consider how long-term trajectories shape development possibilities, insights that parallel economic research on the relationship between trade, productivity, and structural transformation [
33,
34].
The study also identified areas for further development. While students were able to identify patterns reliably, the depth of their explanatory reasoning varied. This suggests that future iterations of the digital learning environment should incorporate more explicit modeling, guided comparisons, or domain-specific scaffolding. Visualizations could be enhanced with contextual texts or interactive annotations to assist learners in navigating institutional history more effectively. Furthermore, future work should explore how these approaches can be extended to other policy domains, incorporate predictive or simulation-based components [
37], and evaluate their effectiveness in diverse educational settings.
Despite previous contributions, the study remains bounded by its instructional context and by the constraints inherent in classroom-based educational research. The results should therefore be read as indicative rather than definitive, highlighting promising directions for further exploration rather than prescriptive solutions.
In summary, this research underscores that digital, data-rich learning environments offer a valuable pathway for enhancing analytical reasoning in applied economics. By enabling students to interact directly with historical evidence and trace economic trajectories across decades, the proposed framework helps bridge the gap between descriptive observation and interpretive explanation, contributing to a deeper, evidence-informed understanding of economic inquiry.