1. Introduction
Advances in technology, in particular in microelectronics, communication systems and knowledge based information systems (IS), have brought a new level of complexity of anthropogenic systems. An example is Cyber–Physical Systems (CPS), which consist of a large number of different natural objects and man-made systems that are considered as a whole. It will be a great simplification to view CPS simply as a more complex system, in comparison with existing, automated systems. In fact, CPS use many different models and many technology simultaneously. CPS have been using for solving real life problems at least for a decade [
1]. On the one hand, it is traditional models and technologies (mechanical, electric, biological, chemical, economic, etc.), and on the other hand, is the computer models and technologies describing the functioning of software components, such as the Internet of Things (IoT), the Internet of People, Internet of Services, industrial Internet, fog and cloud computing. Building CPS requires new cybernetic approaches to system design based on the use of models, as models are the central point in science and engineering [
2]. Cyber–physical approach is intensively used for solving real life problems, particular it is widely used for the solution of the tasks of monitoring [
3,
4,
5,
6,
7,
8,
9,
10,
11,
12]. Really, the model based approach is one of the key ideas on which CPS is based. In the frames of CPS models are used in different ways [
12,
13,
14,
15,
16].
Moving to CPS means, first of all, reaching a new level of complexity, which is expressed not only in the increase of the number of elements and links, but also in the structural dynamics and complexity of the behavior of systems. The task of managing a CPS consisting of a large number of elements and links, the structure of which is constantly changing, is quite a complex problem. The lack of effective methods of solving this problem in the nearest future can limit the complexity of the CPS being created, especially in the case when cognitive CPS are developed [
17]. From the point of view of the management, CPS can be divided into 2 large groups: (i) CPS having static (seldom changeable) structure, constructed on the basis of enough powerful nodes, connected by communication channels with rather high capacity; (ii) CPS, which includes mobile nodes with weak controllers and weak, usually wireless communication channels, with very often limited power consumption. Obviously, these are extreme cases. In the first case, one can use well known solutions, in particular from the field of management of network infrastructure of Corporate Information Systems (CIS) and Business Process Management Systems (BPMS).
However, CPS of the second type are more widely used for real system building in such domains as telecommunications, urban economy, etc. There are a number of examples of such systems [
18]. At the same time, when one wants to build the CPS of the second type, he or she meets a number of serious problems.
Problems that occur with the second type of CPS is the subject of this article. The complexity of Business Process (BP) management is caused by their high structural dynamics, because such systems include multiple big number of elements of different types which can be mobile, elements can appear and disappear, elements of new types can appear. Thus, the task of managing the CPS of the second type is the task of assigning resources, in a situation where the structure of available resources is permanently changing. This leads to the need to solve the task of operational determination of the status of the observed system (OS). In most cases, CPS is a partially observable system, i.e., the determination of the status of its individual elements requires the realization of special procedures, and the structure of these procedures depends on the current status of the observed system (OS). Thus, the task of building monitoring processes of partially OS with dynamic structure appears. The monitoring procedure can be considered as a separate monitoring BP. The CPS network infrastructure and business process management task which includes 2 main subtasks: determination of the OS status (monitoring) and generation of reaction. This article addresses only the task of monitoring.
The main source of information about the current status of the OS are messages sent by both OS infrastructure elements and OS BP in the form of log files or simply logs. Logs from infrastructure elements can be received on request from the monitoring system (MS) or generated by built-in OS monitoring circuits.
Even today existing CPS are very complex heterogeneous distributed systems. Managing such systems is a complex scientific and technical task, which cannot be solved without solving the task of determining the current status of the CPS. This task can be solved by means of effective monitoring procedures usage. At the same time, modern CPS very often are multi-level distributed systems with a dynamic structure consisting of tens of thousands of elements, in which adaptive BP are implemented. Taking into account the growing trend towards expanding the application of cognitive technologies, the task of building effective cognitive CPS monitoring subsystems becomes even more complex.
The following typical private CPS monitoring tasks can be defined: (i) detection of deviations in BP behavior; (ii) detection of BP behavior deviations reasons; (iii) prediction of CPS status and behavior; (iv) reconfiguration of BP; (iv) optimization of BP. Deviation in BP behavior. Deviations may have different forms and may be caused by different reasons: (i) failure of equipment or communication channels; (ii) abnormal loading of equipment or communication channels.
Determination of BP behavior deviations reasons. Unlike the previous task, where it is only necessary to determine the fact of deviation in the OS behavior, in this case it is necessary requires to determine the cause of abnormal behavior.
Forecasting of OS behavior. It is necessary not only to determine the cause of abnormal behavior of OS, but also it is necessary to predict the OS behavior in the future.
Reconfiguration of BP. The need to reconfigure the BP can be caused by several reasons: (i) realization of degradation mechanisms in case of failure of individual sub-systems of the OS; (ii) change of OS functionality, for example, in the case of urgent task appearance, other tasks must be restructured in order to minimize resources.
Optimization of BP functioning. An optimization task occurs when inefficient resource utilization is detected (some resources are under loaded and others are overloaded). There are 2 main types of adaptation: contextual adaptation and content adaptation. In the first case, the BP is adapted to the external environment, and in the second case, it is adopted to the input data.
Effective solution of the above mentioned tasks requires sufficient information not only on the progress of BP implementation, but also on the current structure of OS. As a rule, CPS of the second type are partially observed systems, obtaining full information on the current status of the OS requires additional efforts, in particular, there is often a need to use dynamically generated test procedures. Taking into account structural dynamics and the large number of elements, the generation of such procedures is not a trivial task.
2. Suggested Approach to CPS MS Building
The idea of the developed approach can be formulated in a form of 4 principles.
The CPS is regarded as a partially observable system, with a dynamic structure whose status information is not fully available at some moment of time.
The available information and knowledge about CPS status is stored in the form of a dynamic system model, which includes 3 model groups: models describing structural dynamics, models describing behaviors and models of representation formation. Model relevance is maintained by handling system events as log files or simply logs.
The models are considered as architectural models [
19]. Thus, both CPS and MS can be considered as systems with a dynamic (agile) architecture [
20].
The proposed approach can be positioned as architectural and model. From the point of view of the models used, it can be considered as a polymodel approach in the sense of [
21], based on the use of dynamic models, and from the point of view of implementation, and a flexible (agile) architectural approach, based on the use of many architectural points of view and architectural perspectives in the sense of [
19].
The implementation of the proposed model approach to CPS monitoring assumes building and automatically keeping the OS models which encapsulate information about the current status of the OS. The static (structural) model of the OS system is described in the form of the automata model and the behavior model in the form of the work flow graphs. These model types are chosen due to the fact that algorithms of automatic synthesis of multi-level relatively finite operational automata are known [
22,
23,
24] and the algorithms of BP model synthesis by logs are also known. Other approaches to model synthesis are also known [
25,
26].
3. Practical Benefits of Suggested Approach Usage
This paper proposes a model based approach to building MS where the model of the OS is artifact of the monitoring process.
Usage of the model based approach to building MS allows: (i) reduce traffic between the OS and the MS; (ii) solve a number of problems that are difficult to solve within the framework of classical monitoring approaches, in particular; tasks that require the implementation of logical inference procedures (identification of the initial reasons of errors, error prediction, etc.).
The main problem with using a model based approach is high complexity of the MS building and maintaining because models are most often built manually.
The suggested approach proposes the procedures of the automatic construction and maintenance of an OS structure and behavior models.
One can define 2 distinctive features of the proposed model based approach: (i) models of the OS can be created and corrected with the help of procedures of automatic synthesis of dynamic structure models and business processes models; (ii) for solving monitoring tasks it is suggested cooperative usage of dynamic structure models and dynamic behavior models.
The proposed approach enables: (i) to reduce total cost of ownership by excluding an expert from model build and correction process; (ii) to reduce the time needed to correct the model; (iii) and since the proposed models are multi-level, their use allows reach new levels of complexity of created CPS.
The greatest benefits from the usage of the suggested approach can be received for cognitive CPS systems with dynamic structure and dynamic BP.
4. Existing Approaches and Technologies
Unlike the known, the developed approach is synthetic or as sometimes said umbrella approach. It is based on several technologies. There are 2 moments that the authors assume as the key points. First, the monitoring task under consideration cannot be successfully solved through the use of any one of the existing technologies, and, second, the creation of any new technology to meet this challenge is hardly feasible.
As predecessors of CPS MS, built-in diagnostic systems of various kinds can be considered, in particular, real-time systems, wired and wireless sensor networks [
26], distributed computing systems [
27], Enterprise Information Systems (EIS) also can be mentioned.
Modern CPSs by the most part are distributed systems. The task of managing distributed network infrastructure, especially for EIS, is well known and is realized in the frames of ITIL/ITSM approach, which is supported by a number of available tools [
28]. Network infrastructure management is realized at several levels: business level, business process level, infrastructure level. Business intelligence systems can be used for network infrastructure management, BPMS can be used for BP level management [
29] and a large number of both commercial systems and free systems are available for infrastructure level management.
The main technologies and approaches that can be useful for building CPS MS are: Process Mining, BPMS [
29], structural dynamics support systems [
21], multi-level machine synthesis methodology [
22,
23,
24], data fusion models and systems [
30,
31,
32], Internet of Things [
2,
33,
34,
35,
36,
37] and CPS technology itself [
1,
2], as well as methods and tools for working with knowledge.
5. Requirements to OS Model System
General model system requirements. The general requirements to the OS model system can be described as follows: (i) ability to describe CPS with dynamic structure and adaptive behavior; (ii) be functionally complete, i.e., be able to answer questions from all stakeholders within the scope of their roles; (iii) be executable, i.e., able to operate in run time mode and preferably in non-hard real time mode; (iv) have implementations of acceptable complexity, even for CPS consisting of a large number of elements; (v) the source of information for MS are logs, which can be transmitted to MS input as information about events in OS, as response to MS requests or result of OS polling by MS.
Requirements to structural models. The main requirement to structural models is the ability to describe with their help the dynamic structure of the OS in terms of elements, connections and their current, past and future status of the OS. The main requirements are the following: (i) ability to describe a constantly changing multi-level structure of arbitrary complexity; (ii) possibility to build automatically a structural model on the basis of limited information received in the form of logs.
Requirements for behavior models. The main requirements to behavior models are the following: (i) ability to monitor progress and correctness of BP execution by incoming logs; (ii) ability to correct BP model when BP structure changes; (iii) ability to describe current, past and future BP status.
Representation model requirements. This model is used to form representations and can be conceded as a broker between the model system and stakeholders. The main function of the presentation subsystem is to process requests formulated by stakeholders.
6. Generalized MS Structure
In general, the MS consists of an OS and a monitoring subsystem. The monitoring subsystem receives reports about events occurring in the OS. The monitoring subsystem may provide requests for the status of the OS or its elements. The monitoring subsystem works with models that are generated from status messages (logs) and provides information to users according to their roles and requests. Systems of different nature can be conceded as OS (the subject of this article are CPS). Within the framework of the developed approach, the structure and behavior of the OS have subject of the following main restrictions: (i) from the point of view of the monitoring subsystem, the OS is passive, i.e., it does not react in any way to attempts to pick up logs, it cannot prevent the attempts of pick up logs, it does not change its status and behavior because of logs are picked up; (ii) log sources are linked to certain subsystems and are not connected with each other in any way; (iii) all logs contain structured data which are represented in eXtensible Event Stream (XES) format or can be converted to XES format [
38]; (iv) the OS is not a hard real time system; (v) all control actions are formed on the basis of the OS model; (vi) all logs must be converted to XES format as part of preprocessing; (vii) all noises in logs are to be cleaned at the preprocessing stage.
Thus, the following types of tasks are not solved within the framework of the suggested approach: (i) in the case when logs from the OS encapsulate unstructured data (texts in natural languages, voice messages); (ii) in the case when the OS is an active component, that may prevent the process of logs pick up by suppression or distortion of the logs, or when the OS changes its structure and/or behavior when it detects an attempt to pick up the logs; (iii) if the message semantic is unknown, i.e., when the problem is to understand the languages which is used for communication between OS elements (humans, animals, robots, etc.).
The MS can be considered as a log processing system. On the basis of logs and context information, OS models are built, on the basis of which information is presented to users according to their role and their requests. At the conceptual level MS can be defined as
, where
X is a set of queries about OS status,
Y is a set of reactions to queries,
M is a set of models,
F is a set of functions that implement mappings
, or
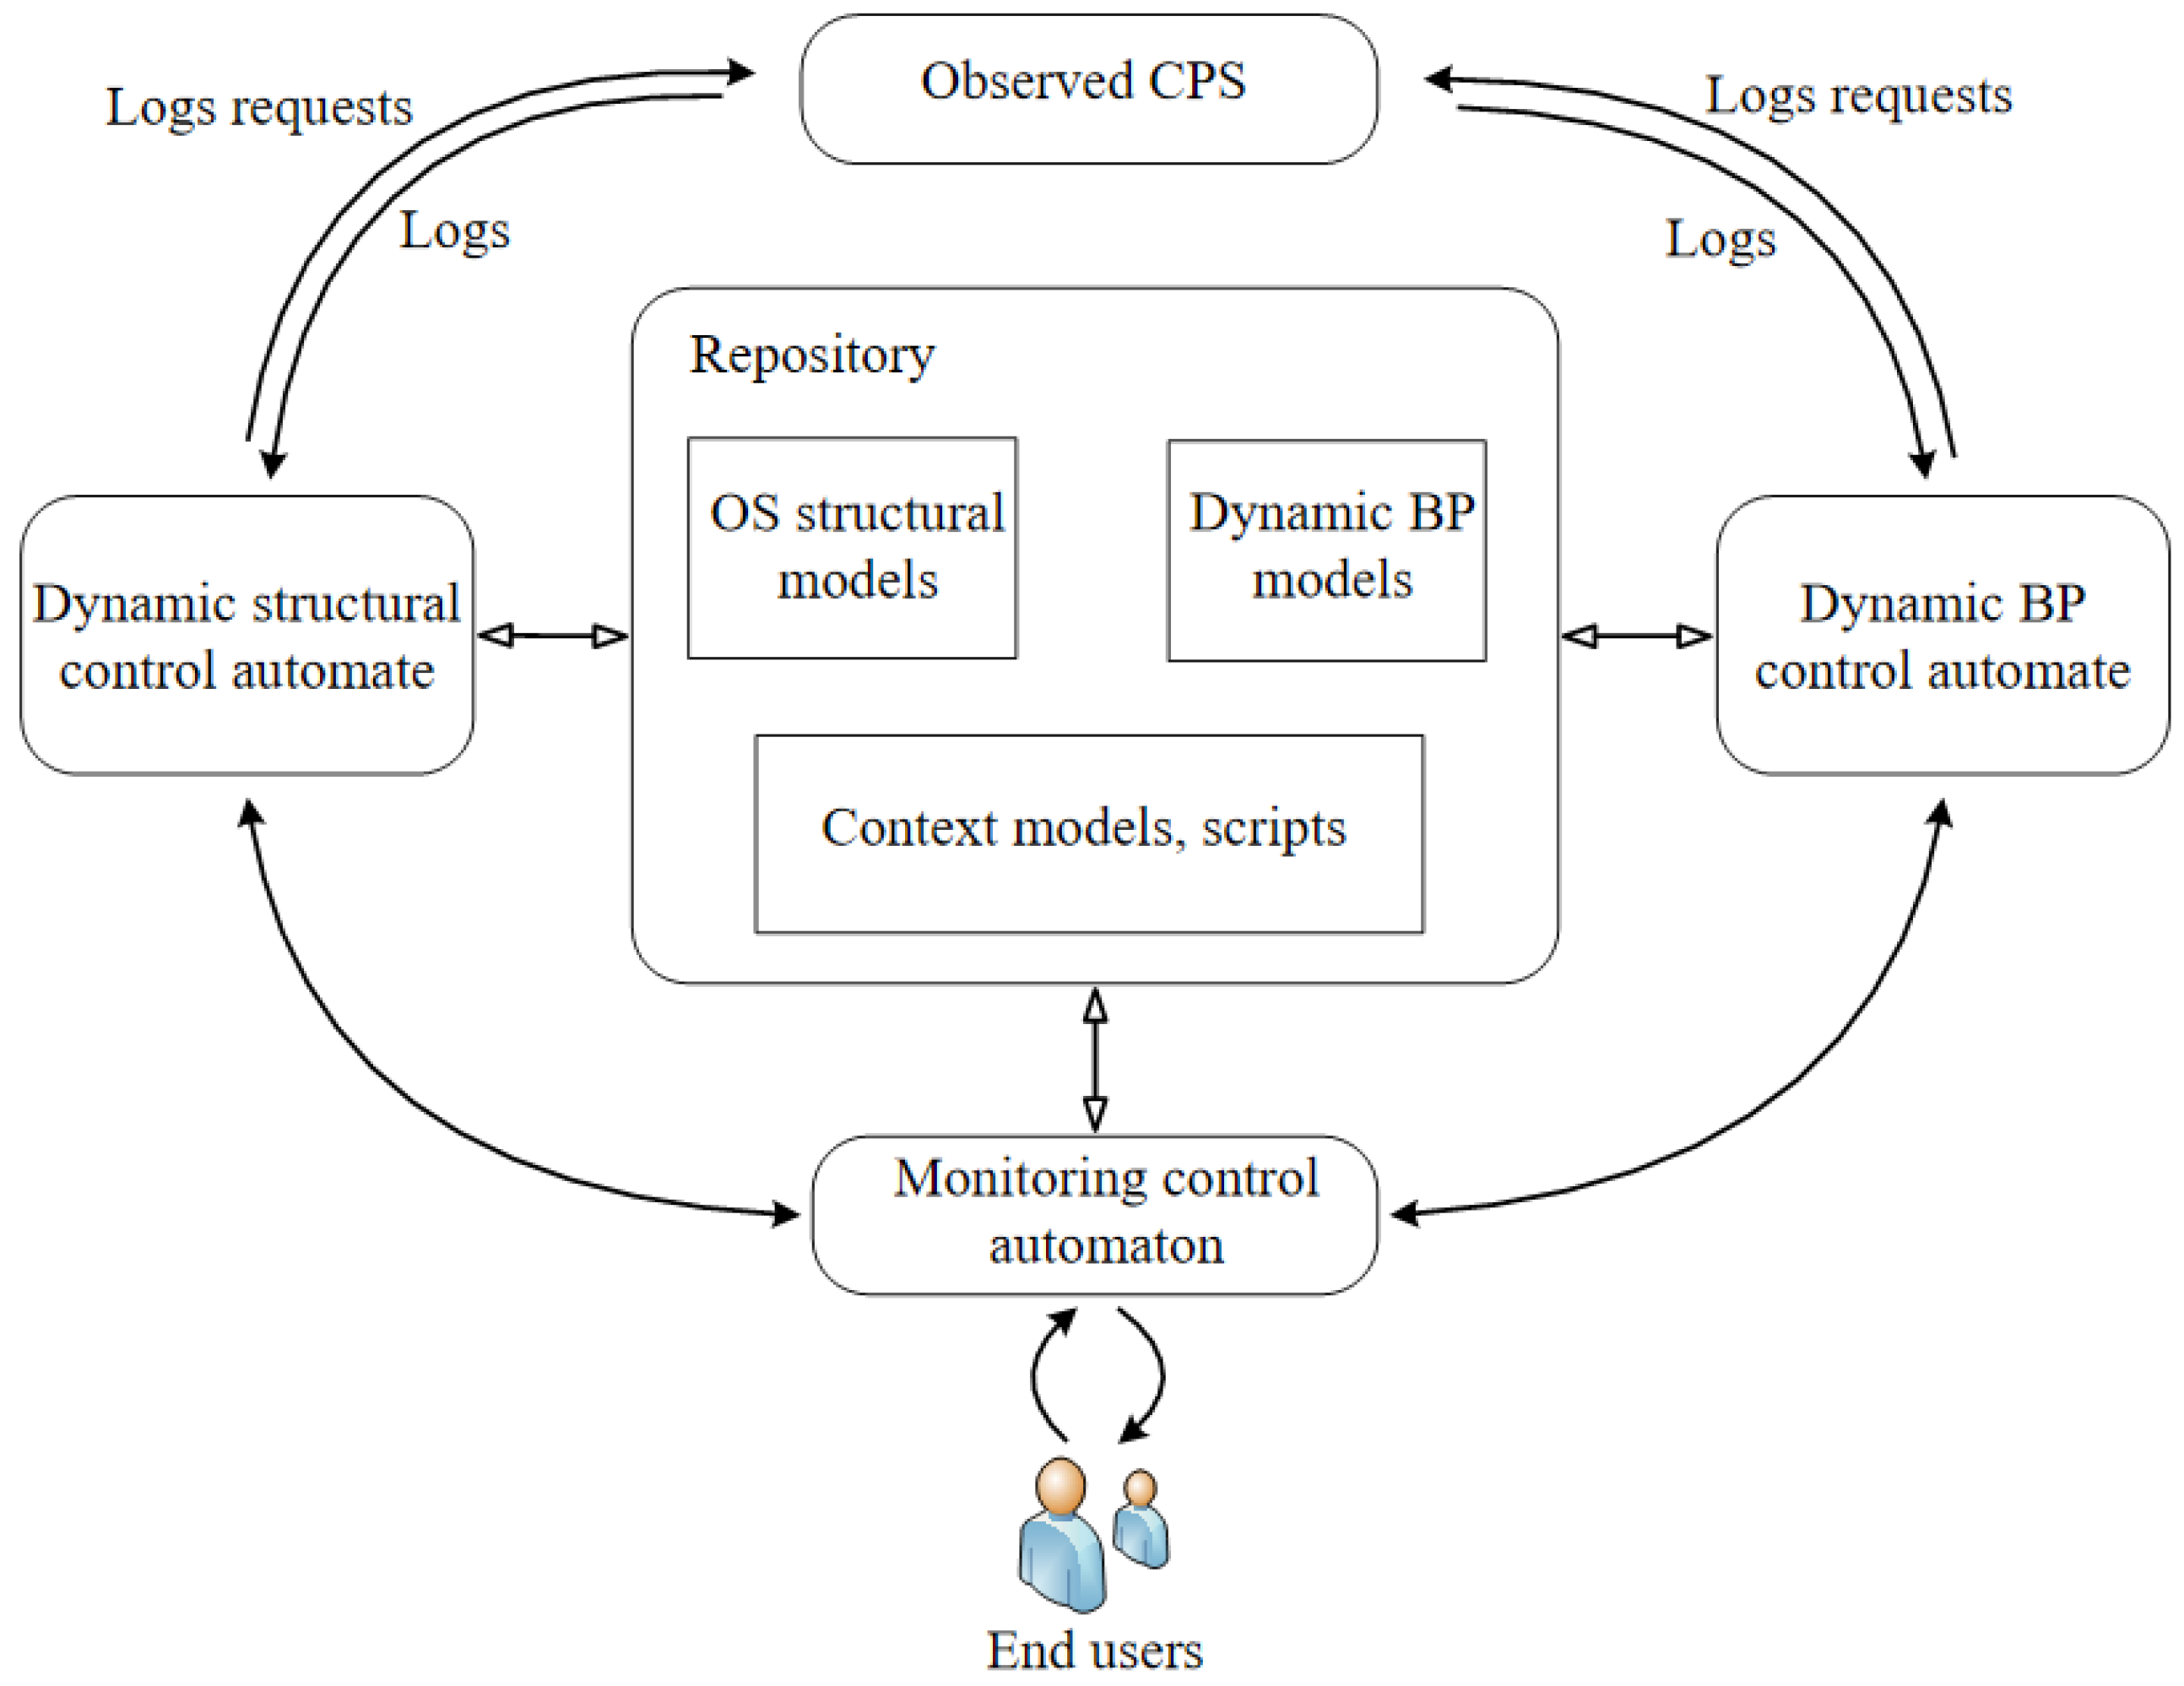
. The generalized structure of the MS, which includes 3 automata, is shown in
Figure 1.
MS includes 4 main elements: , where: R—a repository, SDCA—a structural dynamics control automaton, BPDCA—a BP dynamics control automaton, MCA—a monitoring control . The repository is designed to store models, logs, scripts, contextual and other information.
Generalized algorithm of monitoring realized by MCA:
- Step 1
Start background monitoring processes (polling).
- Step 2
Waiting requests from other automata or a user.
- Step 3
If there is a request from SDCA, then process the request and go to step 2.
- Step 4
If there is a request from BPDCA, then process the request and go to step 2.
- Step 5
If there is a request from a user, then process the request and go to step 2.
Generalized algorithm of SDCA operation:
- Step 1
Waiting for logs from OS hardware or software platform or request from MCA.
- Step 2
If the logs from the OS platform are received, then clean, process the logs and go to step 1.
- Step 3
If a request for MCA is received, process the logs and go to step 1.
Generalized algorithm of BPDCA operation.
- Step 1
Waiting for logs from BP or request from MCA.
- Step 2
If the logs are received, then the logs cleaning, processing and transition of step 1.
- Step 3
If a request for APC is received, processing and transition of step 1.
In the general case, MS can be a part of a monitoring and management system. The generalized structure of such a system is shown in
Figure 2.
The system according to
Figure 2 includes 4 main elements: OS, MS, control signals generation subsystem and users. Monitoring requests can be generated either by a user (manual control) or by the control signals generator (automatic control or mixed mode). MS receives requests from users or from a control signals generator about TS or its elements status in terms of a domain specific language. MS transforms requests into log requests script and on the basis of the models and information from logs generates answers to the requestor.
One can define the following special case of the system as shown in
Figure 2: (i) the system operates in automatic mode (user is absent); (ii) the user can only observe the behavior of the OS; (iii) the user controls the OS manually.
The MS can also be seen as a standalone management system that handles monitoring requests for external systems.
7. OS Models
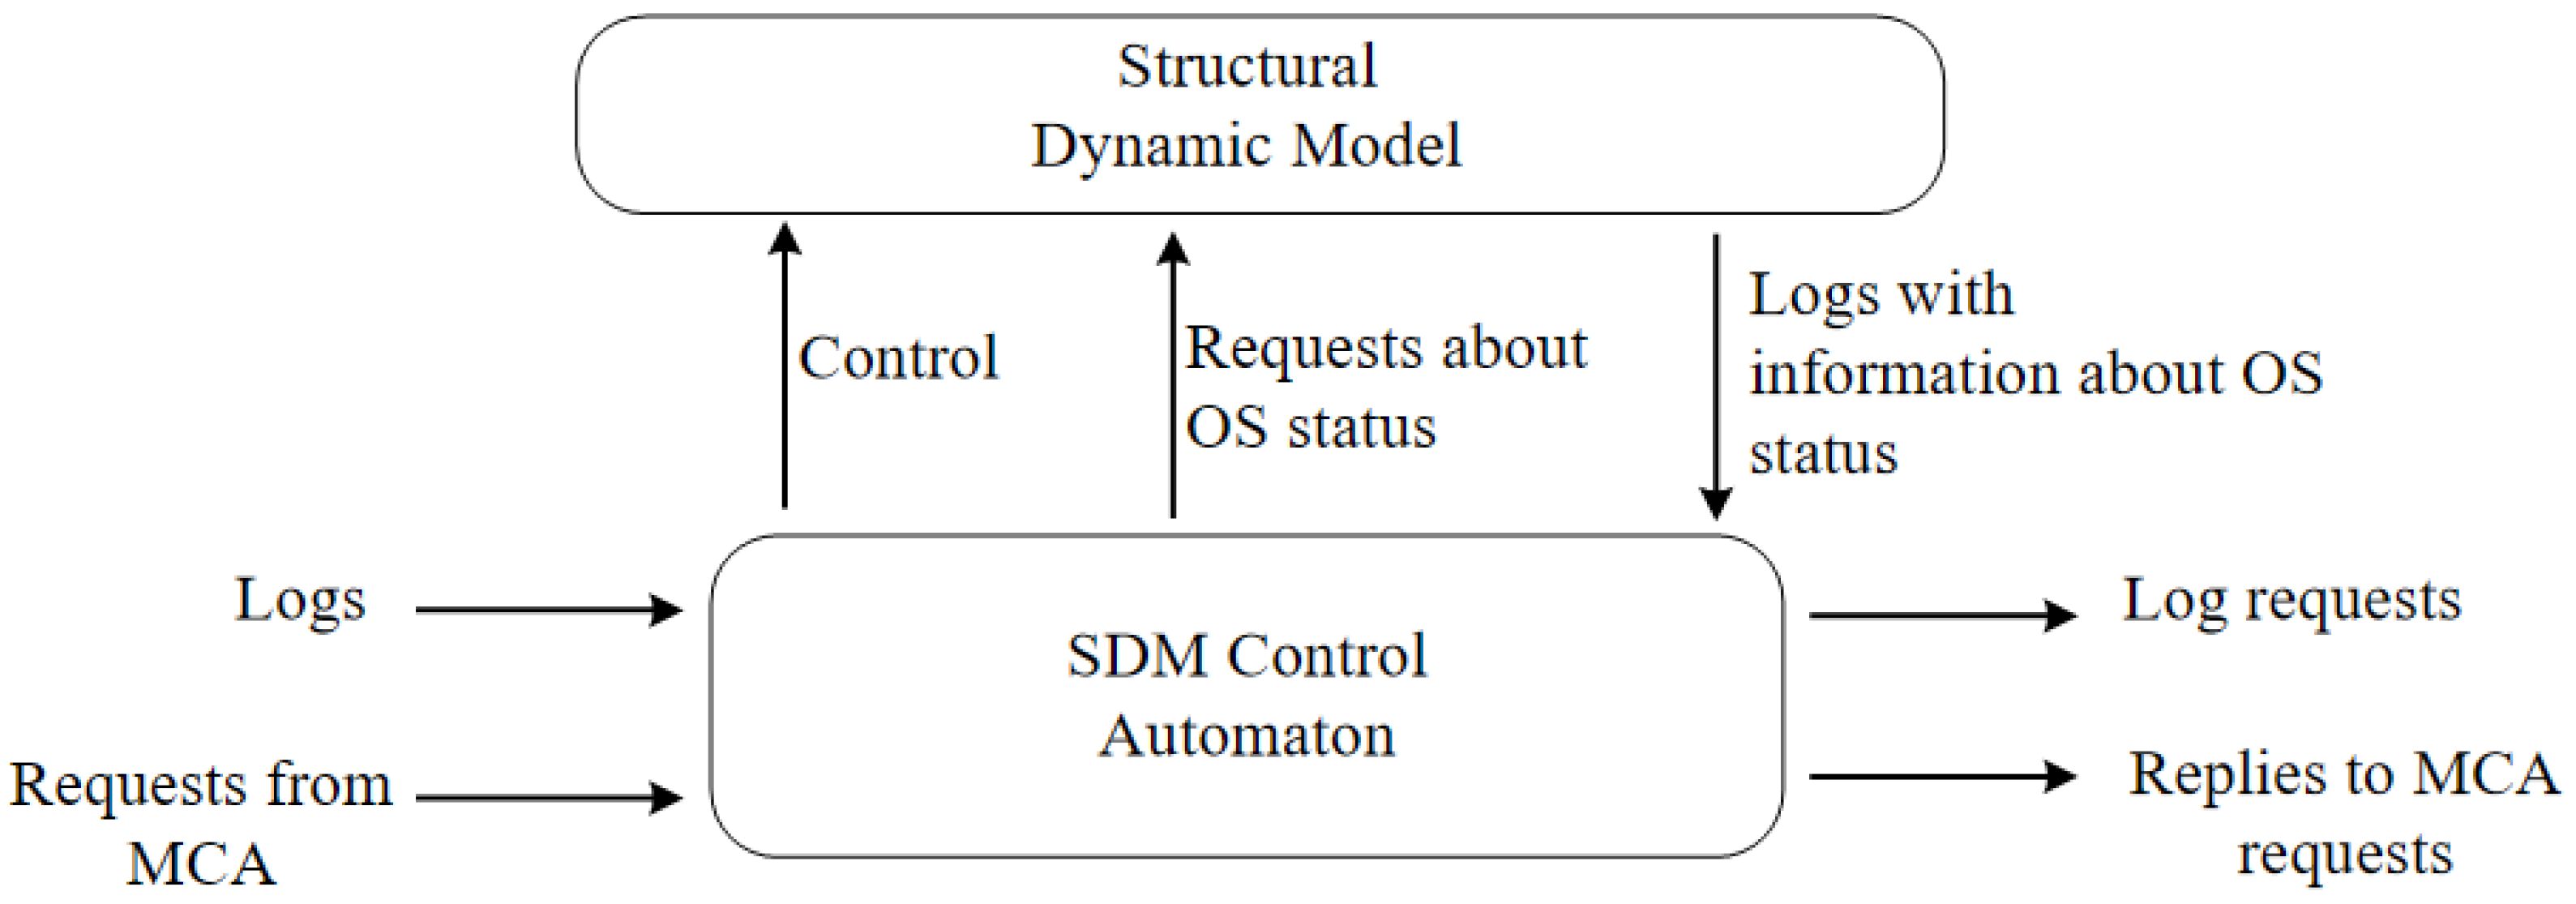
Structural Dynamics Models. The structural dynamics control subsystem at the logical level can be represented by 2 main subsystems: structural dynamics model (SDM) and SDM control automaton (SDMCA) (
Figure 3). The physical implementations of the system according to
Figure 3 can be very different. They can be realized as a distributed system, or as distributed ontologies, SDM and SDMCA can be implemented in the frame of one system or as separate unites.
SDMCA receives information about status of individual OS elements changes, which comes in the form of logs. On the basis of received information model corrections are realized. If it is necessary, then SDMCA sends request for additional information. It can be either simple queries or scripts. The SDMCA may receive requests on the status of the OS elements from the MCA and generate responses to these requests.
This model can be defined as:
where
is a set of sets of graphs,
is a set of graph conversion operators,
is the language of OS status requests. The
graph is a multi-level graph that describes the hierarchical structure of the OS and describes the OS structure in terms of the subsystems and the relationships between them:
where
is the set of vertices belonging to the
i-th level and Li is the set of links belonging to the
i-th level. Through
we will denote the
j-th element belonging to the
i-th level,
-
j-th link belonging to the
i-th level. The set of sets
can be divided into 3 subsets: (i) a subset of fully serviceable
configurations; (ii) a subset of partially serviceable
configurations; (iii) a subset of defective
configurations.
Each subset of includes a countable set of configurations. Each element of the static model is vertex . The link can have an arbitrary number of attributes. The number and types of attributes depends on the specifics of the subsystem to which the vertex or link is mapped.
Attribute values can be received at an arbitrary moment of time in a log format, defined indirectly or with the help of logical inference. The attributes contain parameters characterizing the technical state in terms of “green-yellow-red, GYR” [
21], where “green” means that the element is fully serviceable, “yellow” means that the element is partially serviceable, “red” means that the element is defective. The parameter of an attribute may also be unavailable. In this case, its value can be determined through a logical inference. An arbitrary number of logs available points can be associated with each element. The models can have different attributes.
In particular, the working model describes the OS in the concrete moment of time. The reference model can be linked with to the time interval and the parameters can be colored in the GYR colors. Elements (subsystems) can appear and disappear at an arbitrary moments of time because of different reasons i.e., on/off, break/fix, user login/exit. Models of new elements may be known and stored in the repository, or they not be known. Relationships between elements can also have attributes.
More formally, a model describing structural dynamics represented in the form of multi-level relative finite state operational automaton can be defined as follows.
Automaton = <Set of Input Messages, Set of Output Messages and Logs, Set of Sets of Automaton States, Set of Transition Tables>, Machine State = <General State, Current TS Structure>, General State = <Serviceable, Faulty, Partially Serviceable>, Current Structure = <Elements, Links>, Structure Element = <Attributes, Links>, Attribute = <Set of Name-Value pairs>, Links = <Siblings, Parents, Children>. The following information comes to automaton inputs: (i) requests for OS status (current status requests, past status requests, future status requests); (ii) requests for reconfiguration (requests for reconfiguration in order to improve performance, requests for reconfiguration in case of OS element occurrence or disappearance.
Logs may by generated in different ways: (i) logs generated by built-in monitoring and diagnostics elements of TS subsystems; (ii) logs generated upon request from SDCA; (ii) logs generated by diagnostic scripts launched by SDCA.
SDCA is a processor (engine) providing access to the model by performing a set of operations. SDCA is responsible for monitoring the OS status and control of the OS structural dynamics. The SDCA input receives logs, which can be messages (responses to requests) or signals. The SDCA may provide requests for the status of the OS elements and provide control signals for reconfiguration or parameter adjustment. All end users requests for OS elements status pass through MCA. The SDCA controls the current model using commands of restructuring the current model. The main commands of model management are the following: (i) replace the model; (ii) to remove a vertex; (iii) add a vertex; (iv) to add a link; (v) remove a link; (vi) remove an attribute; (vii) add an attribute; (viii) set an attribute value.
SDCA inputs may receive requests for current, past and future status of OS or its elements. The main types of requests are of the following type: in what status is the i-th element of the OS, in what status was the i-th element of the TS in t moment of time, which subsystems are in a partially serviceable status, etc.
The automaton operation the can be described as follows. The automaton changes its status when new log or a signal, which encapsulates information about the change in the status of the OS element, appears. Automaton has memory for saving information about all previous status and traces. When a request about the status of the OS or OS elements is made by a user, the automaton generates the required representation on the basis of the current status vector and/or historical vectors. The machine can query the status of the OS elements. This action does not change the automaton status.
It should be noted that in general, the number of the automaton states can be infinitely large, for example, in the case of IoT systems. In this case the automaton is to be built in run time mode. In many particular cases, the number of automaton states is finite, for example when we deal with reconfigurable technical systems.
The generalized SDCA algorithm is as follows.
- Step 1
Starting the polling process.
- Step 2
Waiting for input information.
- Step 3
When information about the change in the state of the OS element appears, the following actions are performed:
- Step 3.1
Adjust OS model.
- Step 3.2
Reconfigure OS if necessary.
- Step 3.3
Send restructuring information to BPDCA and to interested users.
- Step 3.4
Adjust and restart the polling process.
- Step 4
If a request about OS status arrives then:
- Step 4.1
If it is possible, the response is generated on the basis on the status vector, and is send to the user.
- Step 4.2
If it is impossible then special diagnostic script is generated and launched. The response is formed on the basis of the script execution results.
- Step 5
If at the input we have a request about the reasons for the incorrect operation of BP, then the diagnostic script is generated and launched, the results of script operation are used to form a response.
Behavior OS models. Dynamic behavior OS models are models of BP running in the OS. A wide range of models and languages, such as Petri networks, automata models, work flow graphs, BPEL, YAWL, etc. can be used [
29]. Information about BP current status can be obtained from logs, in XES format [
38].
Taking into account earlier listed requirements to the behavior models, a workflow graph model has been selected. Three components of the work flow graph are of interest: the control flow graph, the data (object) flow graph and the resource graph. The reference model is a work flow graph which vertices are loaded with information identical to the information present in the logs in the Name-Values form. If possible, GYR intervals can be set. More formally, the pattern of behavior can be described as follows:
The contents of the Parameter-Values field can be specified in 3 ways: one parameter-one value or one parameter—interval of values, one parameter of 3 interval (Green, Yellow, Red).
BPDCA operates as follows. Logs are input of BPDCA. At the output we have BP control signals, which perform BP adjustment. It is assumed that the reconfiguration is realized inside the OS and the OS control unit selects one of the reconfiguration options from the list of possible ones. The BPDCA may request and receive current state information from the SDCA. The BPDCA informs the SDCA about violations in the BP implementation process and receives information about the OS structure change. In addition, the BPDCA input receives requests about the current status of the BP, to which it responds.
Generalized BPDCA algorithm is as follows.
- Step 1
Logs and signals, which are generated by BP, are transmitted to BPCA input.
- Step 2
Logs are compared to reference logs.
- Step 2.1
If all values are in the green zone, then continue.
- Step 2.2
If values are in the red or yellow zone, a message is sent to the SDCA.
- Step 2.3
If the OS restructuring signal is received, the possibility of BP restructuring is considered. If it is possible, then the reconfiguration is performed and a message is sent to the MCA.
Markups are implemented using standard way for workflow methods.
It should be noted that, unfortunately, it is impossible to present the reference model in the form of traces, since for a correctly operating process it is sometimes impossible to determine exactly the order of arrival of logs. This can be done, for example, with the help of data flow models.
Representations formation models. The presentations formation models (PFM) describe how users interact with the MS using Domain Specific Languages (DSL). Formally, the PFM can be defined as , where is a set of models built on the model, and is a set of languages for interaction with MS, focused on different categories of users and .
PFM can be realized as a set of services for translation requests and responses into the DSL of different users. As a model describing the operation of the PFM, it is proposed to use a modified data fusion model based on the well known JDL model [
30,
31,
32], which includes 6 levels.
Level 0. Signal/Feature Assessment. The main task solved at this level is to estimate and predict the values of the individual parameters of TS elements.
Level 1. Entity assessment. The main task solved at this level is to estimate and predict the values of individual parameters and the status of individual entities (objects).
Level 2. Situation Assessment. The main task solved at this level is to assess and predict the status of the structure and parameters of relations between elements of some part of the OS and their impact on the status of the objects themselves.
Level 3. Impact Assessment. The main task solved at this level is the assessment and prediction of the future status of the OS, its parts and formation of alternative variants of the system response.
Level 4. Process Assessment. The main task at this level is to evaluate and predict the performance characteristics of the OS and compare them with the desired performance indicators.
Level 5. Human–machine interaction (HMI). (Cognition Refinement). Functions related to the improvement of the human–machine interaction are implemented at this level. This level is responsible for virtualization and collective decision making.
The JDL model assumes a bidirectional process. Bottom-up movement is a process of information mining from raw data, and then knowledge extraction from information and decision-making. A reverse motion is a stream of queries that are formulated by interested users in terms of the subject area. Note that functions related to different levels can be implemented in an arbitrary order [
30,
31].
In fact, JDL model defines what is “done” rather than “how is it done” i.e., the JDL model is a functional model. It has been never seen as a process model or as a technical architecture model. The classic JDL model is a fairly general model that is not directly related to any of the subject domains.
Visual data fusion model. This model is a further development of the JDL model. The authors solved the following tasks: (i) minimize the amount of information provided to the user saving the needed level of quality; (ii) provide information strictly in accordance with the user request and role; (iii) provide information taking into account the current situation. The main distinguishing feature of this model from classical JDL model is that suggested modified JDL model (MJDL) is a domain oriented model and because of it this model can be populated by concrete services and stakeholders. Suggested MJDL model may be conceded as a functional-process model.
The generalized structure of the proposed MJDL is shown in
Figure 4.
The proposed MJDL model as well as the classic JDL model has 6 levels. The main users (stakeholders) include 4 groups: service engineers (responsible for the technical status of the OS infrastructure), operator (monitoring the status of separate OS subsystems, if necessary, they can realize control actions), managers responsible for the technical status of large subsystems or the OS), business analysts and top managers (who are primarily interested in the overall status of the OS). These user groups work at different levels of the MJDL model. Separate levels of MJDL model realize following functionality.
Level 0. The main task solved at this level is generation of the requests for logs and processing "raw" logs, processing, evaluation and prediction of the values of OS elements individual parameters. It can be said that individual logs are processed at this level. Typical problems solved at this level are the elimination of noise such as random logs, loss of logs, inability to receive the required log, etc.
Level 1. The task of this level is the characteristics evaluation of the status of individual elements of OS and prediction the values of individual parameters and the status of individual OS subsystems. At this level functions related to the generation of information about individual objects are implemented. It may be, for example, information about the technical status of individual subsystems of a CPS, the location of the object, the speed of movement and the direction of movement.
Level 2. Evaluation of the overall OS status. The main task solved at this level is the estimation and prediction of the OS status. This layer implements functions related to generating situation information in a particular context in terms of entities (subsystems), relationships between them and events.
Level 3. Reaction definition. This level is present if we speak about a monitoring and management system. The main task solved at this level is evaluation and prediction of future status of the OS and its parts in terms of utility/cost, generation of alternative versions of control signals. At this level, the situation is assessed, that may include an assessment of the dynamics of the situation, assumptions about possible external actions of external, etc.
Level 4. Efficiency assessment. The main challenge at this level is to evaluate and predict the performance characteristics of both the OS and the MS itself and compare them with the desired performance indicators. At this level, the MS itself is monitored, in particular to improve its timing parameters.
Level 5. Human–machine interaction. Functions related to the HMI are implemented at this level. In addition, this level is responsible for virtualization and collective decision making. Additionaly, knowledge management mechanisms are implemented at this level, i.e., such questions are solved: “Who requests information?”, “Who has access to information?”, “For what purpose the information will be used?”, etc.
The usage of the proposed MJDL model allows solve 2 main problems: creation of common terminology, which can be used in the design of different MS for different subject domains. In this context, the task of harmonizing inter-layer interfaces, that is, standardizing the way information is presented.
CPS MS service view. Service oriented approach and service oriented architectures (SOA) are a popular solution in the IS design, especially for distributed IS. In the most general form, the service representation of the CPS MS can be defined as
, where
is a set of services and
is a set of scripts performing operations in terms of
, each script belongs to a certain level. Service kernel structure is reviewed in
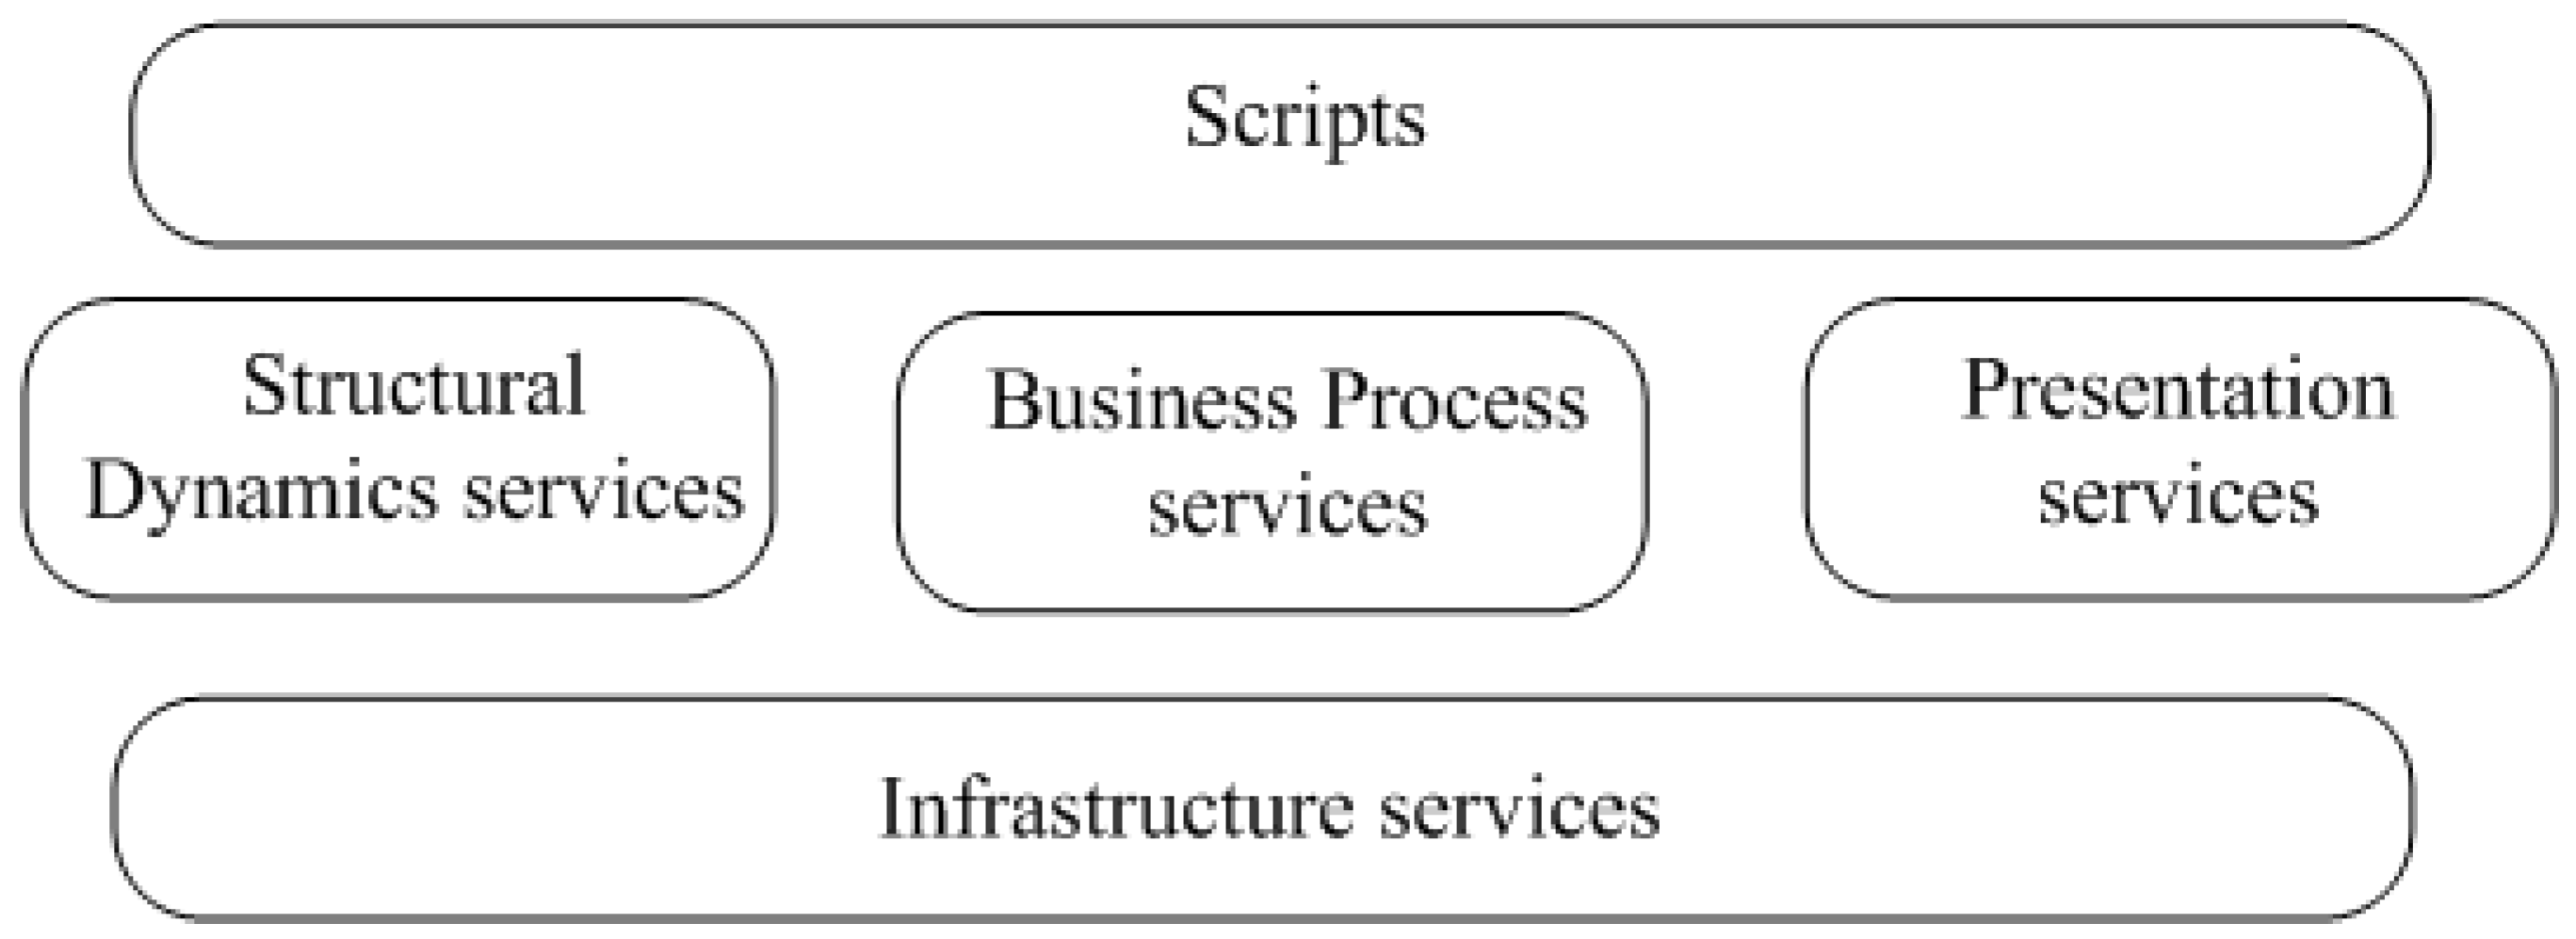
Table 1. In this article there are 2 service levels: infrastructure services (lower level services) and upper level services. Upper level services can access lower-level services, but not vice versa. Scripts can be written with DSL or general purpose languages. A script can be built in static or generated in run time. The generalized structure of the MS services presentation is shown in
Figure 5.
Infrastructure services are mainly focused on logs preprocessing. Services of the upper level are divided into 3 groups: the services focused on information processing, connected with structural dynamics (SD services), services for processing information about BP dynamic and representation services for processing users requests. Scripts can be realized in different ways: they can be DSL scripts, BPEL scripts or scripts written in standard JAVA. Scripts can also be generated in different ways: in static, selected from some set of available scripts, can be configured or they can be generated automatically.
8. Possible Approaches to Implementation
In the case of CPS, the OS and MS are usually conceded a single system, and MS is one of the services, the construction and operation of which can be described in such terms as requirements, size, topology, type of hub nodes, bandwidth of communication channels, location of observers, etc. (
Figure 6). The structure of MS by the most part is determined by functional requirements to the MS. For example, if an MS is a post mortem processing system, it may be a conventional client server system based on a local network or can be realized as a virtual machine. If on-line monitoring is implemented, which results are presented to the users (people). Than very small access time is not required, it is possible to have1-2 seconds delay time. When the results of monitoring are used by a reaction generation subsystem, it is often necessary to support real time and sometimes hard real time. MSs can range in size from the small ones that include dozens of sensors to very large ones that have many thousands of information sources. To date, the average MS can include about several hundred sensors. An important characteristic of MS is the volume of log traffic. From the point of view of topology two moments are important, on the one hand, it is the topology itself, and on the other hand, it is the topology dynamics. Centralized systems, fixed structure distributed systems and variable-structure (dynamic) distributed systems can be distinguished. From the point of view of topology itself, MS by the most part have classical network structures: star, tree, mixed structure. For the simplest MS, it is possible to use a star structure when all logs are fed directly into the log processing system. For a medium sized OS with a slightly variable or unchanged structure, a tree is usually used. For mobile OS and OS using wireless network solutions, network structures such as ad hoc networks are typically used. Large SMs as a rule use hierarchical structures. Distributed MS nodes can contain different types of computers (controllers): low power computers capable to perform only hub functions, medium (limited) power computers, which can realize a limited set of functions, usually related to preprocessing, and unlimited power computers, which are able to realize all necessary functionality that needs to be performed at a given level. It should be noted that to implement the monitoring results processing, computers implementing the OS functionality can be used. Note that distributed MS resources can be virtualized and a virtual environment can be used to create, for example, a distributed file system, or run the required virtual machine. This is quite convenient from the point of view of BP organization, but it is resource intensive (use of virtual machines can reduce performance by several times [
27]).
Distributed MSs can use communication channels between nodes with different bandwidth. From the point of view of the concrete MS, communication channels can be divided into weak channels that are unable to pass all required log traffic, medium throughput channels, under certain conditions capable of passing all log traffic and unlimited bandwidth channels capable of passing all required log traffic with specified QoS characteristics. For building the presentation subsystem, it is necessary to have information about the observers location. In the simplest case, all observers are stationary observers, but very often observers may be in different places and may be mobile.
In fact, the requirements to the CPS define architectural and structural solutions of the MS and the design process. In one case, the requirements can be balanced, i.e., none of the requirements can be identified as key requirement, i.e., the customer of the system cannot clearly rank the requirements. The customer can clearly rank the requirements according to the degree of importance. In the other cases one can distinguish the leading requirement. It can be minimum Total Cost of Ownership (TCO), minimum reaction time, maximum security, minimum bandwidth of the communication channel, minimum power consumption, etc.
9. Basic Variants of CPS MS Organization
In our case system organization is described as a set of pairs of , then one can describe the all possible options for CPS CM organization as
In simplified form, the implemented functionality can be defined in terms of services as follows
Implemented functionality = <Structural Dynamics Support Services, Dynamic BP Services, Display Services, Infrastructure Services>. In this case, the term service is used synonymously with the term function, that is, as understood in service-oriented systems [
39]. It is assumed that the service can be implemented in at least in 4 different ways: as an object (component), as a microservice [
40], as a web service [
39] or as a BP.
It is necessary to take into account the fact that the majority of real CPS SMs implement only part of the listed functionality. Obviously, even with this rather rough approach, the number of possible functional-structural mappings is quite large. Assuming that the CPS CM is under consideration, the number of options can be substantially reduced and it is possible to discuss only basic variants.
10. Basic Types of CPS CM
Taking into account the above considerations, 4 basic types of CPS CM organization can be identified. Other options can be considered as special cases.
Post mortem telemetry based systems.
MS of big multi-level distributed systems with different types of nodes with a stable structure and a centralized observer.
MS of big multi-level distributed systems with different types of nodes with dynamic structure, weak processors in nodes and communication channels of limited capacity.
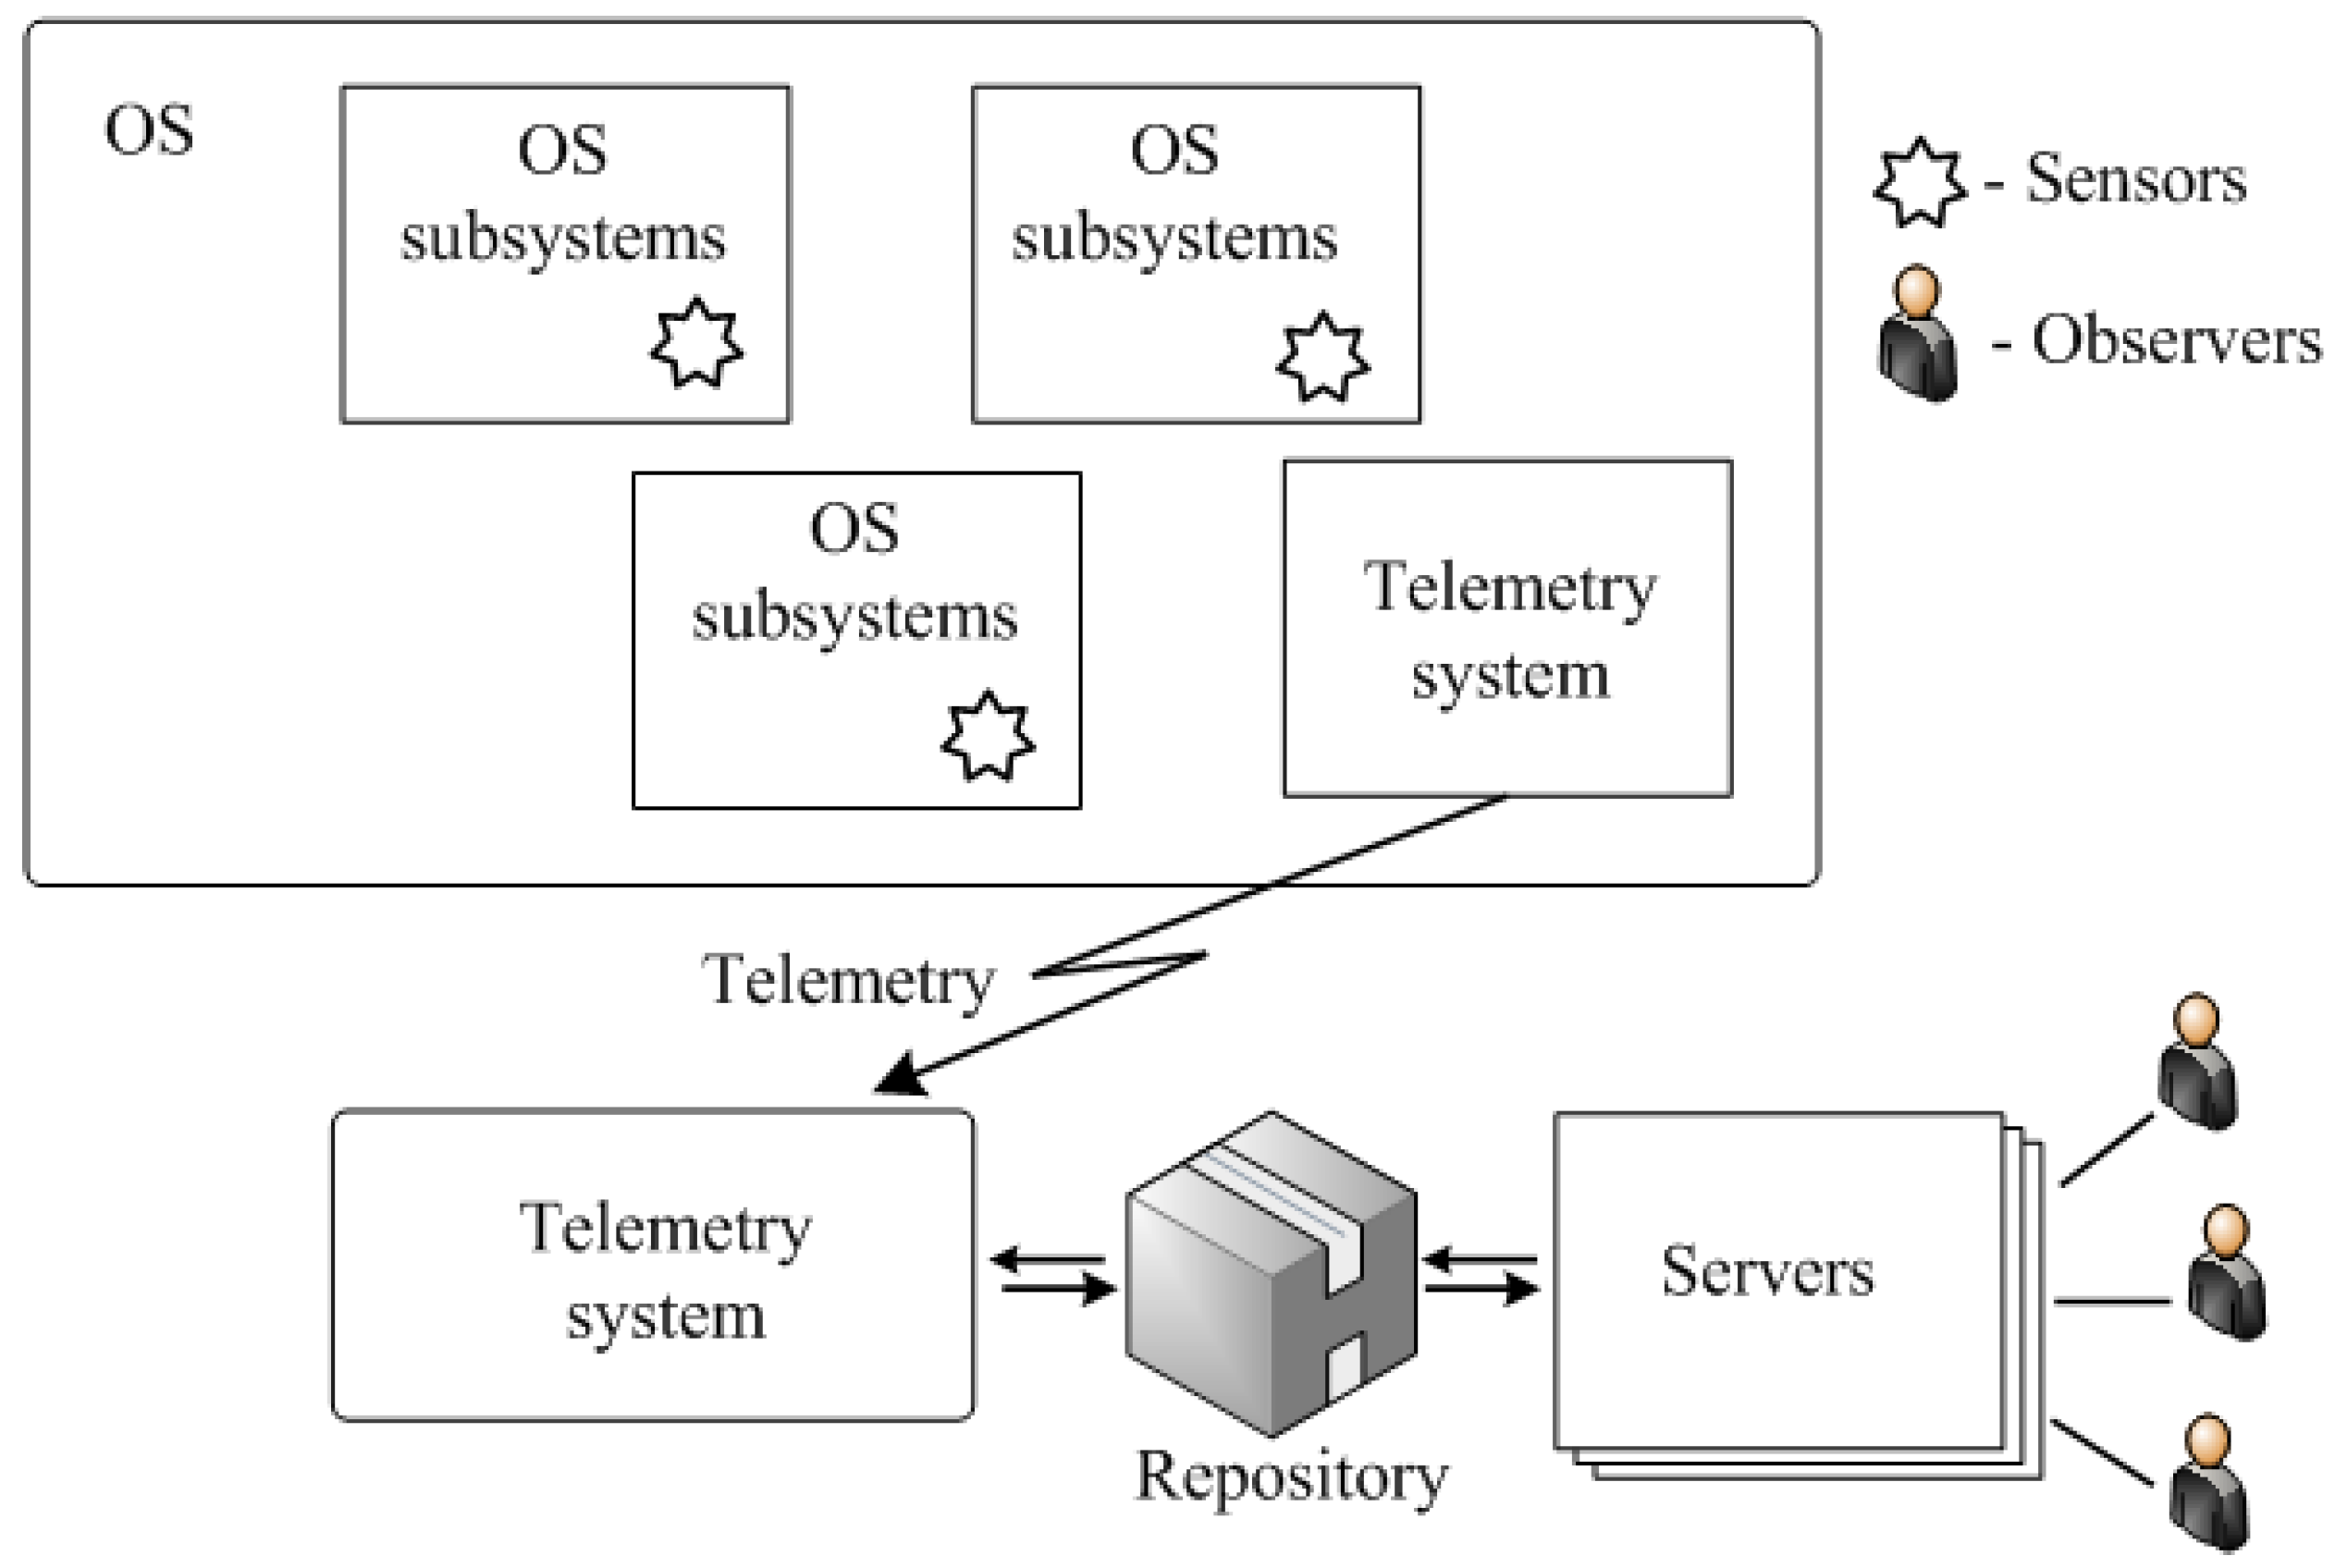
Distributed CPS monitoring and management systems of medium and big size. Post mortem telemetry based systems. The typical structure of such systems is shown in
Figure 7.
A post mortem processing system operates in the following way. Log sources (sensors) are located in OS subsystems (OSS) and can send logs to the repository via telemetry system (TM). Normally, data from the OS are received in the form of "raw data" logs to minimize equipment costs. All processing services are hosted at the servers. Users (observers) work from workstations. Users can work remotely. The implementation of such systems as a rule does not cause problems.
For this type of MS, the main variants of problem statement are the following: (i) minimization of equipment costs on the OS side, (ii) minimization of traffic between OS and MS. In the second case, the preprocessing can be partly or completely implemented on the OS side.
MS of big multi-level distributed systems with different types of nodes with a stable structure and a centralized observer. Typically, such systems have a tree structure. On the upper level there is a Central Server (CS), to which users have access through workstations. OS interacts with C1 upper level controllers, each of which interacts with C2 lower level controllers, which in turn work with sources of logs in OS. In real systems, the number of levels does not exceed 3–4 even for very large systems. As a rule, we have 2 levels (C1 and C2). The bottom level OS elements (OSE) are placed.
MS of big multi-level distributed CPS with different types of nodes with dynamic structure, weak processors in nodes and communication channels of limited capacity. Such systems are most often built as peer-to-peer systems [
27], often based on ad hoc networks [
41] with mobile components. The generalized structure of such a system is shown in
Figure 8. Typically, such systems have about 3–4 hierarchy levels.
MS for distributed CPS monitoring and control systems of medium and big size can be built on both tree and network principles depending on whether the structure is stable or dynamic, as well as on the characteristics of the controllers and communication channels of the OS used.
The structures shown in
Figure 5 and
Figure 7 are extreme cases where the OS structure is stable, high throughput communication channels and powerful controllers are used, and on the other hand (
Figure 9), when the OS structure is dynamic and may be mobile, limited throughput communication channels and weak controllers are used.
Services deployment. When different structural solutions are used, the service system can be organized in different ways. The most important factors from the point of view of service deployment are the following 2 factors: computing capabilities of nodes and bandwidth of communication channels. Let us define 2 levels of performance: strong and weak performance levels. Strong performance is a level of performance that is not a bottleneck when implementing the required functionality. Poor or weak performance is a level of performance that requires minimization, because the performance level of the nodes can be considered as the bottleneck. Most often, strong performance can be achieved using virtual machines. By analogy, the concepts of strong and weak communication channels can be defined.
Thus, we have 4 basic variants of performance and throughput combinations. If one considers the service as an entity, the following attributes are the most important for solving the problem of service deployment: the place of service deployment and the method of service implementation. During the review of the service model, the following service groups were selected: Structural Dynamics Support Services (SPDS), BP Service (BPS), Infrastructure Services (INFOS), Log Preprocessing Services (LPS) and Presentation Services (PS). Services can be hosted on a CS, C1, or C2 and can be implemented in a variety of ways, such as objects (O), microservices (MICS) or web services (WS). Services can be placed in the appropriate location as physical services, can be downloadable or virtual.
As a matter of fact, the task of monitoring services deployment in a distributed environment includes 2 correlated tasks: assignment of services to resources and organization of a distributed repository, i.e., for storage of models. Depending on requirements, the problem of services deployment may take different forms such as minimization of response time, minimization of resources, minimization of power consumption, minimization of the TCO. One can use the following general considerations to services deployment: (i) LPS should be placed as close to log sources as possible, (ii) SPDS and BPS should not be separated from each other, (iii) INFOS must be available for other services, (iv) PS should be located as close as possible to the working stations of observers.
Zones of log collecting. It should be noted that the situation with log processing is not original. A similar problem was solved, in particular, with regard to the construction of a domain name system and a directory systems, so this task can be considered classical. One can use the idea of building zones to solve this problem. With regard to the problem of complex CPS monitoring, the zone can be defined as multiple sources of logs and their means of processing (controllers): <zone>:: = (<controller> <subband> *) (<controller> <sensor> *), i.e., zone includes—this includes several levels consisting of, each level has a controller and an arbitrary number of subzones, and the lower level has a controller and sensors. The sensor can be defined as an element for pick up logs from the OS elements: Sensor>: = < MS side sending log element > < OS side reception log element >. If these pairs forming the sensor are stable, we will say that the zone is static. Otherwise, we will say that the zone is dynamic. Dynamic zones appear when mobile, either MS, OS or both MS and OS are mobile. When working with fixed zones, each zone is responsible for building a specific submodel. A zone is a multi-level concept. As one moves up, the zones merge and form a new zone that is responsible for forming a higher-level model.
Model information. Repository organization. The repository is designed to store both the models themselves and related elements such as logs, business rules and context knowledge. The main requirement for the repository is to realize effective access to the models.
The users of the repository are, on the one hand, the log processing subsystems, and, on the other hand, the representation generation subsystem, to which users make queries about the status of the OS, where the top-level model is M0, M1 is the first level submodel, M2 is the second level submodel (Number of levels may be more), LFS—log forming subsystem, PFM—presentation forming subsystem, L—logs, log requests. Generalized variant of model deployment is shown in
Figure 10.
There are 2 basic approaches to mapping the model structure to the physical structure of the monitoring network: (i) the repository is located on the CS, (ii) the repository is deployed in several levels (usually 2–3 levels).
It will be appreciated that the CS based repository can only be constructed for small sizes MS, at least because of bandwidth limitations. One can build a repository as a virtual file system. This can simplify the programming problem, but will not solve the problems of limited bandwidth.
For middle and big size CPS, creating a distributed repository is the only possible solution. The natural solution is to place the repository possibly closer to the sources of logs, but this will require a fog structure based on powerful controllers with a sufficiently large amount of memory, having their own operating systems. Memory requirements can be reduced by using loadable models and services (on demand computing).
Typical variants of service deployment and repository implementation options for different types of CPS MS are shown in
Table 2.
For the first type of the systems, i.e., post mortem telemetry processing systems, a typical solution is to place all services and repositories on a CS, which can be implemented as a cluster. Presentation services can be deployed on observers workstations.
In the second type of the systems, i.e., MS of big multi-level distributed systems with different types of nodes with a sufficiently stable structure and a centralized observer, software services should be placed on controllers if it is possible. This class of systems is characterized by the usage of sufficiently powerful controllers. In order to reduce the load on the controllers, services can be implemented as loadable modules. It is also desirable to place individual submodels as close as possible to the log sources. Model coherence can be achieved by using replication mechanisms. Virtualization mechanisms for this type of MS can find limited use.
The third type of the systems are big multi-level distributed systems with a different types of nodes with dynamic structure, weak processors in nodes and communication channels of limited capacity MS, by the most part it is mobile systems with relatively weak controllers. For mobile systems, in most cases, there are restrictions on power consumption, besides, such systems have weak communication channels. This limits usage of virtualization, and limits the ability to use loadable modules and models. The way out of this situation is to increase the number of controllers and use, if possible, resident services.
In the fourth type of the systems, i.e., distributed CPS CM and medium and large size controls, it is usually necessary to obtain a short reaction time, so that the modules to be loaded are hardly recommended for use. The same can be said of virtualization mechanisms, which can be used mainly at the top level in limited volumes. The main approach to the performance challenge is to use more powerful controllers.
11. Possible Approaches to the Implementation of the Main MS Subsystems
Structural dynamics support services and dynamic BP services are key elements of MS. Earlier it was mentioned that the following models can be used: for structural dynamics description one can use multi-level relatively finite state automata and for dynamic BP description one can use marked work flow graph.
Let us consider possible implementations, i.e., a machine representation of these models. One can specify the following main requirements to the models: (i) the machine representation should be convenient (not expensive) in the process of generating the model from scratch; (ii) machine representation should be convenient (not expensive) from the point of view of model correction in case of arriving logs; (iii) the machine representation should allow efficient processing of requests from the presentation subsystem; (iv) the must be able to store and extract models from the repository; (v) the model must be effectively serialized for network loading.
There are 3 basic approaches to the model implementation: (i) presentation of the models in memory in the form of object model; (ii) some XML representation of the models; (iii) representation of the models in the form of ontology. Object-oriented representation (OO). OO describes both multi-level machines and multi-level structures and workflow graphs. It is the fastest model. The main problem is that it is a rather complex implementation, as it is necessary to manually implement the model itself and all requests for its construction, correction and generation of requests for model correction and representation, as well as for implementation of mechanisms of model preservation-recovery.
XML-representation of models. This approach also can be used for all three models. XML representation of the models is easier to implement, but slower in comparison with OO. The main advantage is the availability of XML tools such as parsers and XSLT transformations.
Representation of models as ontologies. It is well known fact that working with ontologies does not allow to receive high speed of operation, but allows use quite powerful tools. If the use of ontology for modeling a multi-level structure looks natural enough, the description of BP requires some effort, but these tasks can be solved [
42,
43]. The use of ontology can be seen as the slowest and most resource intensive but most effective option.
One can use 2 approaches for different models representation: representing different models in different formats and representing all models in the same format. The advantages of the second approach are obvious. The main argument for using mixed representations may be the inability to obtain the required speed.
12. Example of Realization
The suggested approach was used for development of a number of real IS. One of such systems is a cable digital television network (CDTVN) MS. The MS were developed by the request of cable television operators and deployed in several large and medium sized network segments in North America and Canada.
Modern CDTVN have hundreds of thousands and even millions of subscribers, and the number continues to grow. The CDTV system itself is a distributed system that includes data networks, server and subscriber equipment. The typical structure of a CDTVN is shown in
Figure 11.
In
Figure 11, the following designations are used: CS—central server; LS—local segments of the network, STB—set top box, which supports basic and extended functionality of user’s TV receivers. Modern CDTVN has a number of specific features: (i) large and very large network size; (ii) high dynamic environment, (iii) heterogeneous network infrastructure; (iv) strict requirements to total cost of ownership, reliability, reaction speed, etc. A CDTVN can be classified as a large multi-level distributed CPS with different types of nodes with stable structure on the upper level, variable low level structure and centralized observer.
Prior to the development of new CDTVN, monitoring tasks were mainly carried out by support specialists. MS can receive data from various devices, as well as send control commands to CDTVN devices. The monitoring systems of large networks can use more complex data processing systems, such as data systems aggregation (Splunk, Datadog, Logstash), as well as systems that provide analytical data processing tools (IBM Telecom Analytics Solutions, Huawei Big Data Analytics, etc.).
Earlier in the case of network failures, support personnel identified the location, time and causes of the faults and restored the health of the devices. A work could be done remotely or locally. Until a certain moment of time, this method of network maintenance was acceptable. However, in recent years there has been a continuous increase in the size of CDTVN, the volume of data transmitted through them, an increase in the level of functional complexity of the services and an increase in their number. At the same time, no modernization of data transmission networks and user devices was carried out, which led to an increase in the frequency of faults in the operation of CDTVN. As a result, the problem of new generation MS development for support MS services became an actual one.
However, the development of new CDTVN MS meets significant problems due to the high structural and behavior complexity of networks and their high dynamics. In such a situation, it was possible to build only MS focused on a limited number of services for limited data sets. Such MS do not meet the support personnel requirements because, for example, it is often not possible to identify the causes of errors and, accordingly, to generate reasonable control effects, as many factors due to restrictions cannot be taken into account. Attempts to expand the list of tasks to be solved or to increase the volume of processed data resulted in an increase of the computational complexity of processes implemented in MS and, accordingly, a decrease in the performance of the MS. The proposed approach made it possible, without limiting data or tasks to the CPS MS, to rebuild it in such a way that at each particular time the CDTVN MS allows solve the target tasks, i.e., to identify, locate, determine the causes of faults and, using the obtained data, to eliminate them.
The software modules of the developed MS are installed on end devices, as well as on CS and LS of the CDTV distributed systems. Existing MS typically include the Application Message Service (AMS) and the AMS database (DB), which are shared by all segments of the network. The AMS DB contains information about the devices of the network. Existing MS also record logs with information about events that occur in the CDTVN, including events that occur in end-user devices. In order to do this, each segment of the network has its own event recorder.
The MS interacts with AMS in order to obtain general network data, as well as with the event recorder to obtain information about recorded events. The system includes server components as well as a web interface for end users. The elements of the developed system are a DB, which contains data on the operation of CDTVN segments, as well as a component that implements the message queue when the system interacts with event recorders. The MS also includes a component that provides processing of received messages and their placement in the system DB. A more detailed description of the system one can find in [
6,
24,
44].
The developed system efficiency can be estimated with the help of 2 main indicators: (i) the number of monitoring tasks solved by the MS; (ii) the computational complexity of the monitoring procedures necessary to solve them.
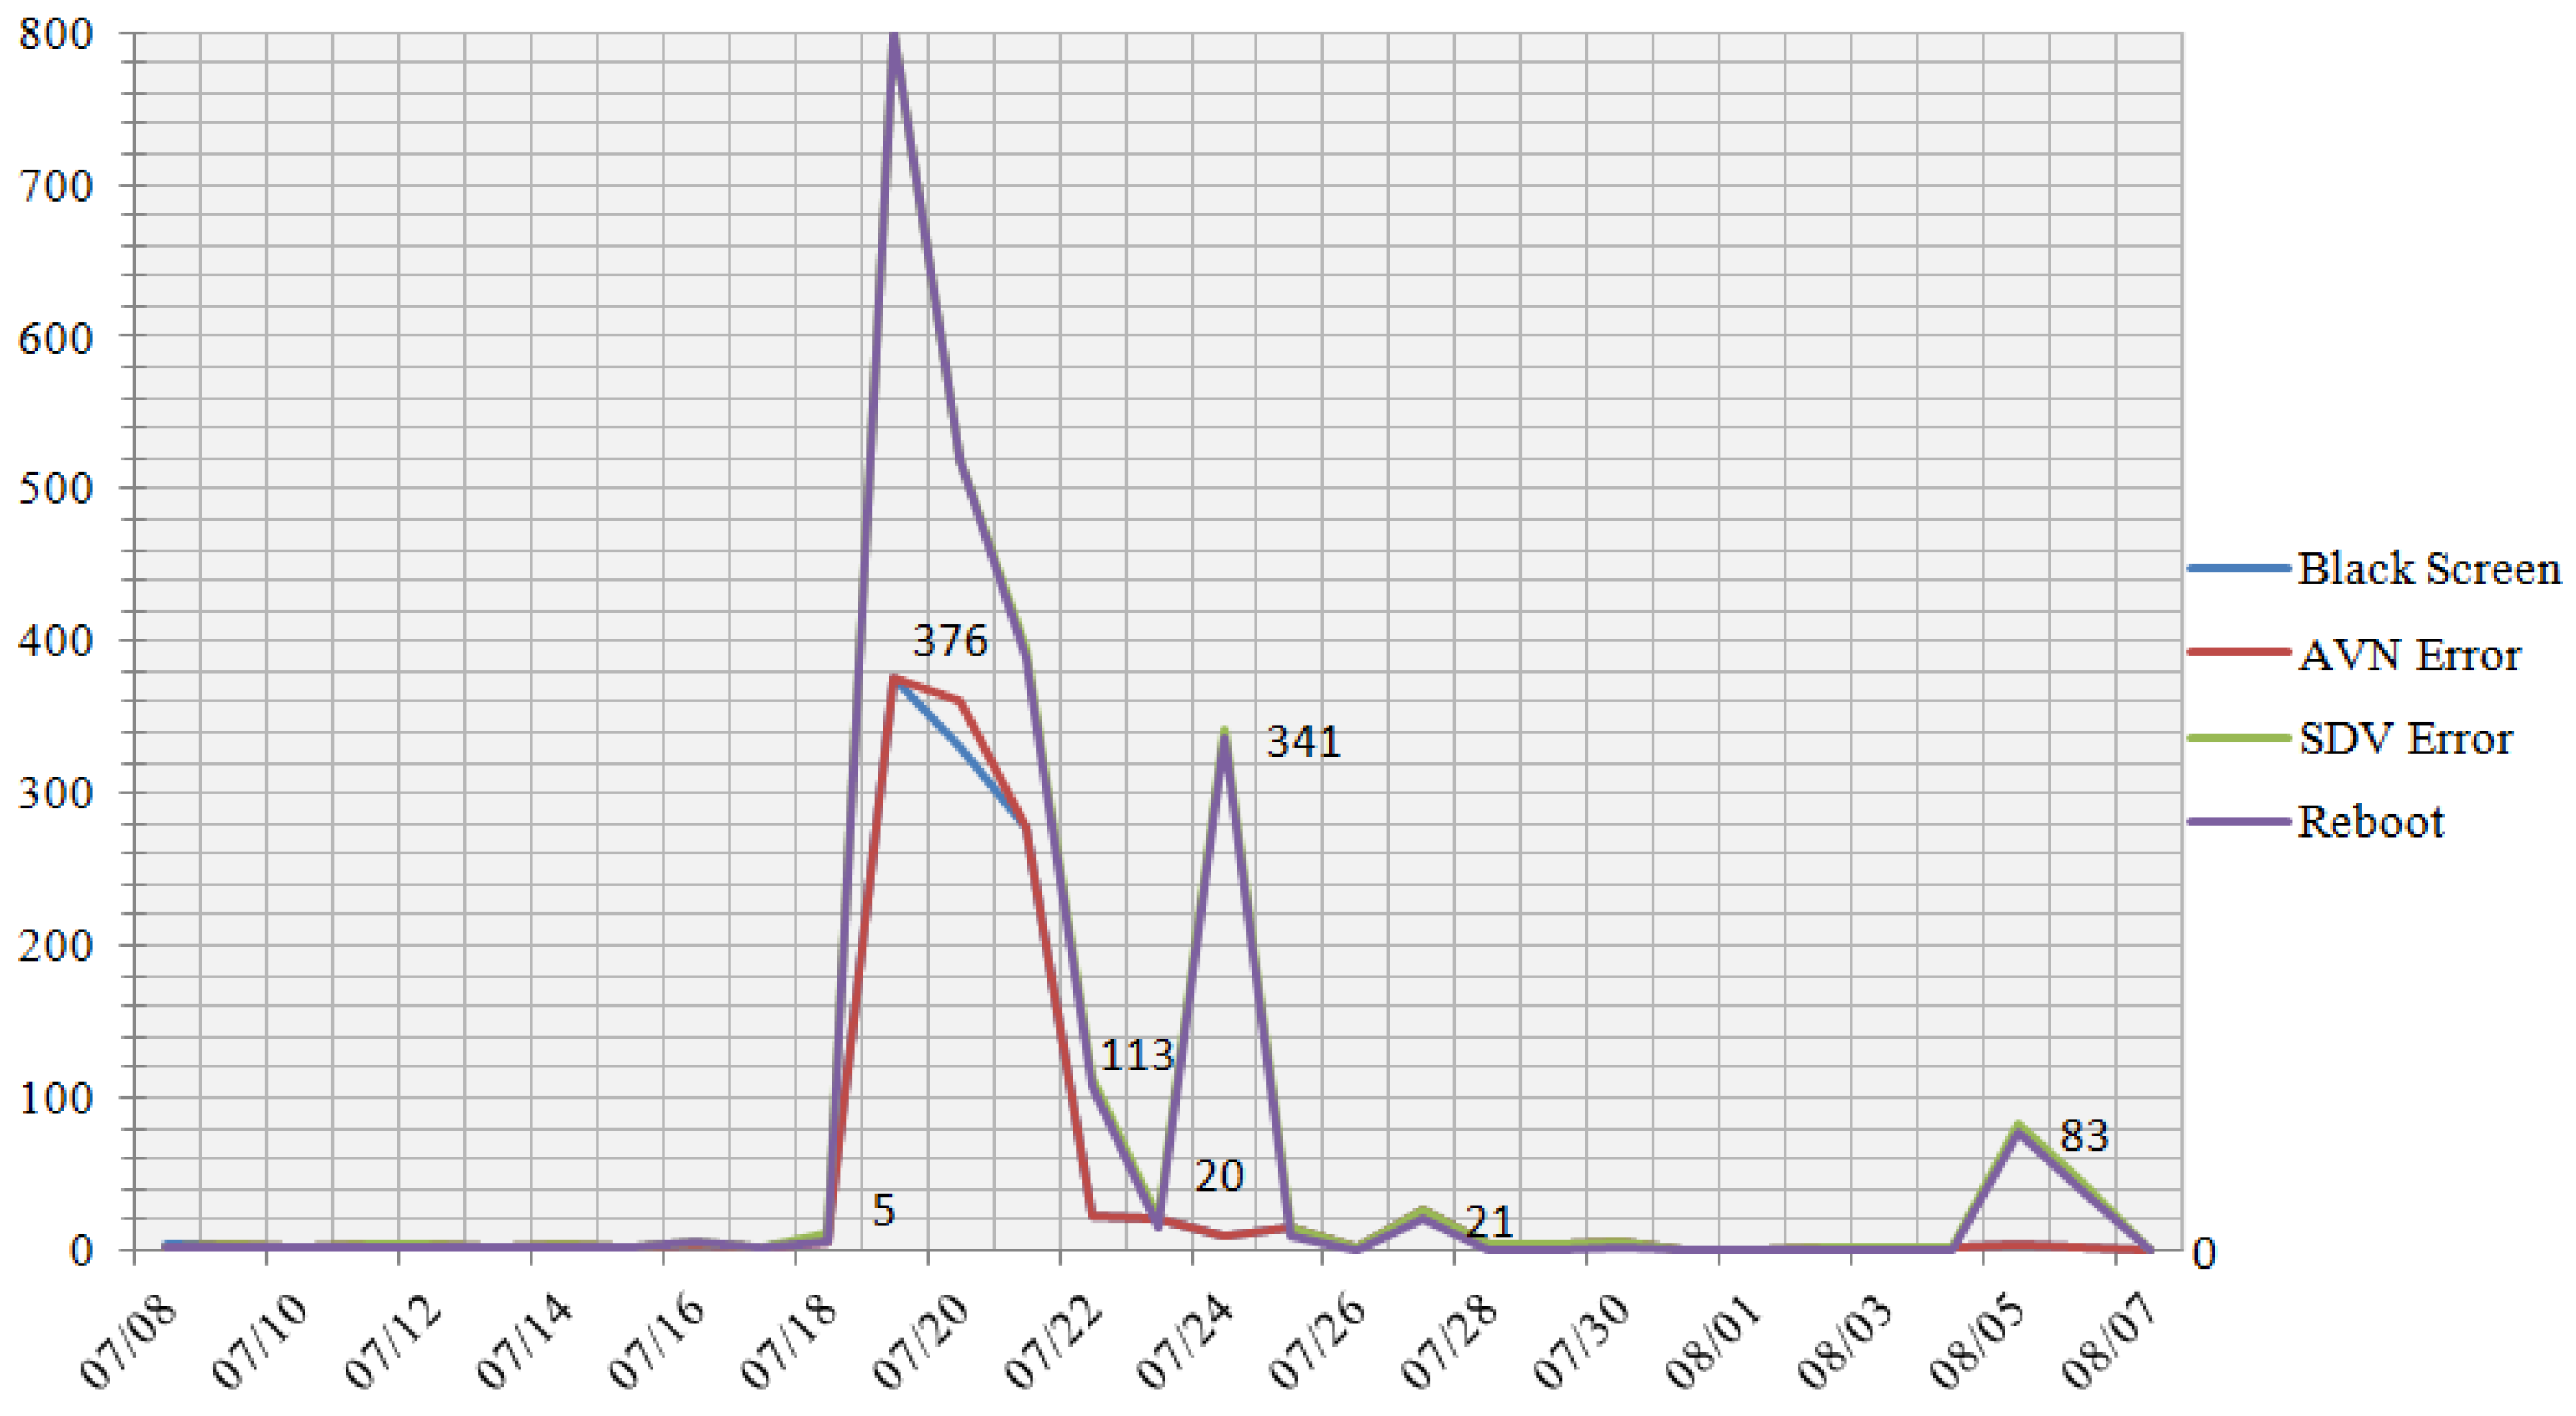
The efficiency of the developed MS was estimated on the real CDTVN which included several million user devices. The number of tasks solved by the MS was determined by comparing the number of errors in the operation of user applications caused by CDTVN failures detected by the MS and the number of errors recorded by CDTVN support specialists. In one of the test periods of one week, the following results were obtained.
The MS could record 4 types of errors on 29 devices from the entire population. The total number of errors identified was 2,422. The distribution of errors over the time of their occurrence over all devices is shown in
Figure 12, the distribution of the reasons of the faults appearance grouped by types is shown in the
Figure 13.
Overall, a comparison of the number of errors detected by the CDTVN system with data for the same period provided by support showed that 98.5% of all errors were detected by the MS.
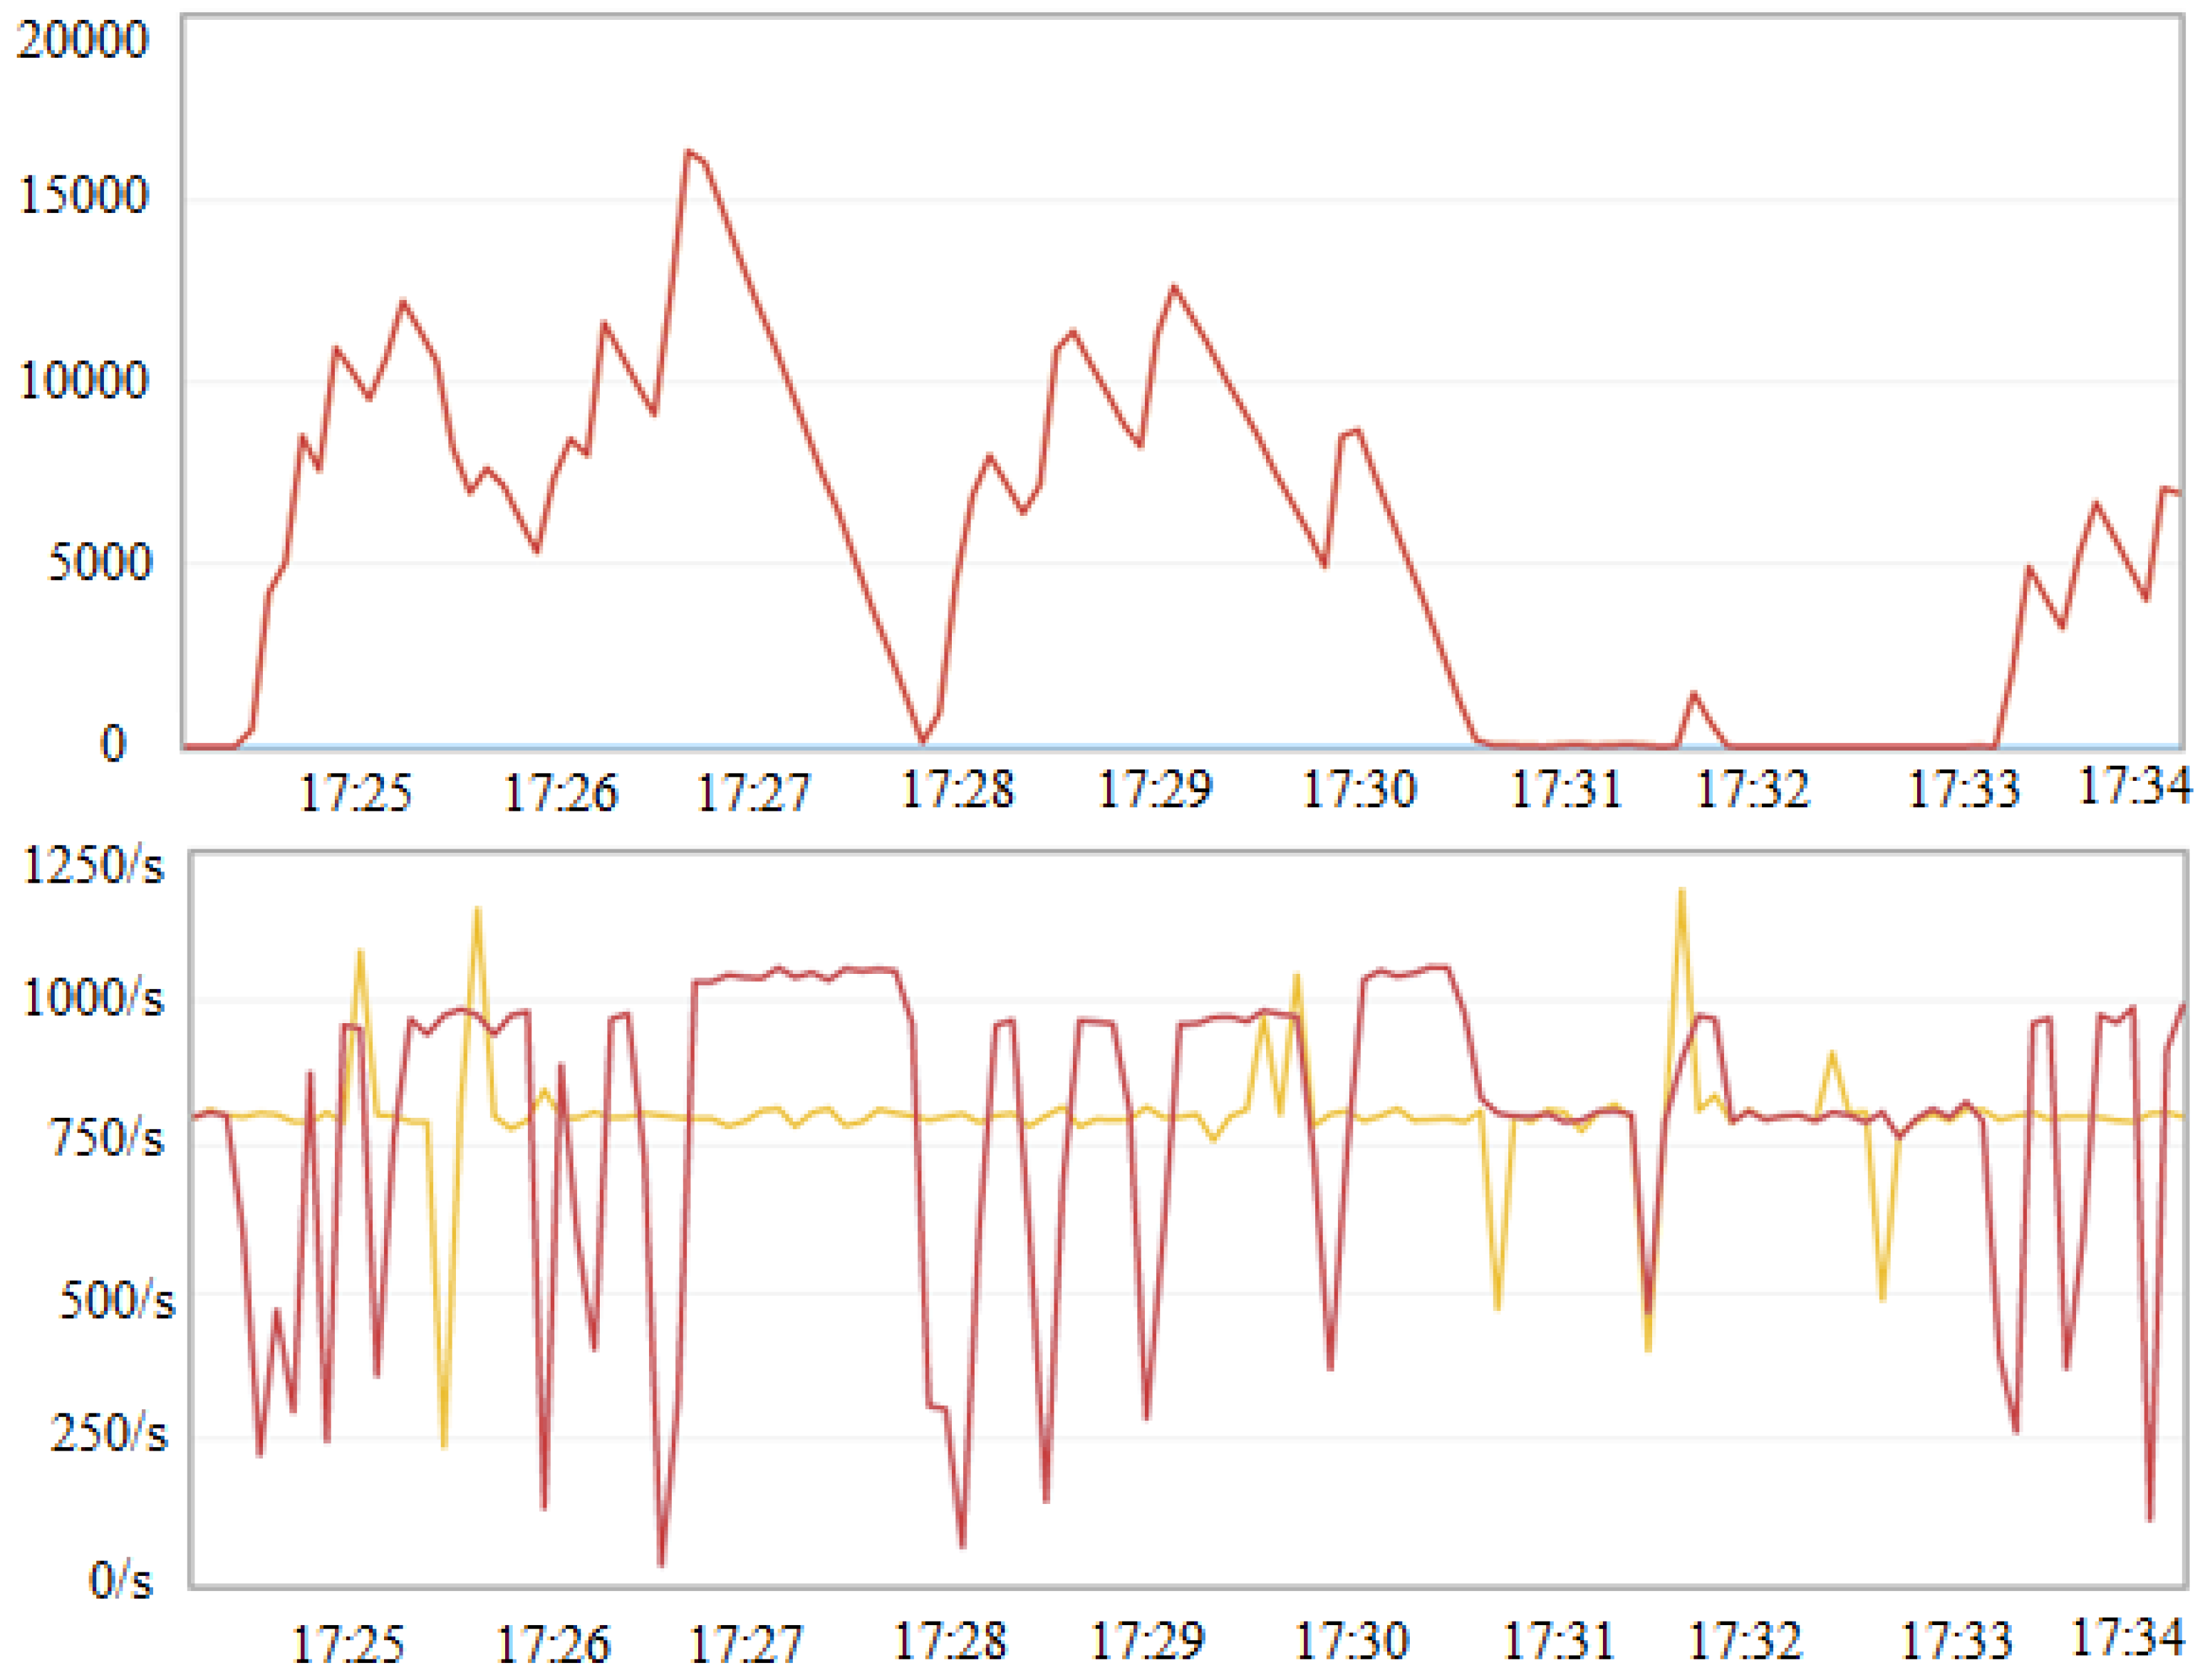
The evaluation of the computational complexity of the processes required to form the solution was evaluated based on the performance of the developed MS. For this purpose, generated messages containing data on events that occurred on user devices were submitted to the system input. Messages were generated at different frequencies from 300 to 1000 message/s (
Table 3). As a result, the maximum allowable load on the system was found to be 800 message/s, which is almost twice the actual load. The observed behavior of the system at a time interval of 15 min at a load of 800 message/s is shown in
Figure 14.
In the
Figure 14 the top graph shows the length of the queue of messages that have entered the system and are waiting to be processed. The graphs at the bottom of
Figure 14 show the message generation rate (yellow plot) and the processing rate (red plot). The behavior of the graphs shows that the system was stable in the time interval under consideration. The MS scalability was also evaluated. The MS were found to be well scalable. In particular, the use of two messages processing module, allows almost double the performance of MS.
13. Conclusions
The task of determining the current status of complex systems of different nature is faced by developers of complex systems in different statements. It can be the tasks of collecting information in IoT structures, determining the status of complex CPS for the purpose of managing, restructuring, implementing the principles of autonomous computing, implementing cognitive behavior in a constantly changing environment and many others.
Models and model knowledge are increasingly used in modern information systems (Model Driving Engineering, Situation Aware Systems, Multi Agent Systems, Architectural Knowledge, etc.). CPS also can be considered as a kind of model based approach to complex systems development.
The use of a the model based approach to solving a monitoring problem can be seen as a process of collecting information about the system structure and status. This information is converted into the model knowledge and accumulated in the system knowledge model. Since the structural and behavior models can be represented in the form of ontology or a knowledge graph, the suggested approach can be defined as a knowledge oriented approach. The principal difference of the proposed approach to the known model approach is the automatic model construction. While the mechanisms for building business process models are well known, the automatic construction of multi-level structural models is hardly investigated. The mutual usage of these two approaches offers new opportunities and allows solve a number of important real life problems.
The suggested approach and models can be successfully used to implement monitoring subsystems of various kinds of multi-level distributed CPS with dynamic structure, CPS built on the principle of the Internet of Things and industrial Internet of Things, etc. The use of a model approach to building CPS CM allows to increase the level of complexity of observed CPS. This is particularly important because there is a clear tendency to increase the level of intelligence of new generation CPS. Appearance of cognitive CPS will make the task of monitoring their status even more difficult and this problem can be solved with the help of the model based approach.
It should be noted that it is not necessary to use the proposed approach in full. For example, one can use dedicated MS i.e., only BP or dynamic structure monitoring system). The proposed approach may be used in conjunction with other approaches, such as neural networks.
Further development of the proposed approach is attributed primarily to its use as build-in subsystems of cognitive CPS. In this case, it is necessary to operate the MS in real time and build the MS according to the OS principles, when each local MS is built into the CPS subsystem. Real time can be achieved, for example, by mean of usage high speed services build on the basis of the neural networks. In this case ontology based approach is used only on top levels.


