Article

A Unified Methodology for Heartbeats Detection in Seismocardiogram and Ballistocardiogram Signals

Dip. Ingegneria e Architettura, Università di Parma, Parco Area delle Scienze 181/A, 43124 Parma (PR), Italy
*
Author to whom correspondence should be addressed.
Computers 2020, 9(2), 41; https://doi.org/10.3390/computers9020041
Submission received: 14 April 2020 / Revised: 15 May 2020 / Accepted: 19 May 2020 / Published: 22 May 2020

Abstract

:
This work presents a methodology to analyze and segment both seismocardiogram (SCG) and ballistocardiogram (BCG) signals in a unified fashion. An unsupervised approach is followed to extract a template of SCG/BCG heartbeats, which is then used to fine-tune temporal waveform annotation. Rigorous performance assessment is conducted in terms of sensitivity, precision, Root Mean Square Error (RMSE) and Mean Absolute Error (MAE) of annotation. The methodology is tested on four independent datasets, covering different measurement setups and time resolutions. A wide application range is therefore explored, which better characterizes the robustness and generality of the method with respect to a single dataset. Overall, sensitivity and precision scores are uniform across all datasets ( p > 0.05 from the Kruskal–Wallis test): the average sensitivity among datasets is 98.7%, with 98.2% precision. On the other hand, a slight yet significant difference in RMSE and MAE scores was found ( p < 0.01 ) in favor of datasets with higher sampling frequency. The best RMSE scores for SCG and BCG are 4.5 and 4.8 ms, respectively; similarly, the best MAE scores are 3.3 and 3.6 ms. The results were compared to relevant recent literature and are found to improve both detection performance and temporal annotation errors.

1. Introduction

Smart-living technologies are changing the way modern living environments are conceived. Smart devices are increasingly populating the home scenario, fostering innovative services. Such services can be aimed at increasing safety and supporting independent life of older adults or people with disabilities, following the Active Assisted Living (AAL) paradigm. Highly heterogeneous technologies converge into the AAL framework, ranging from basic telemedicine services to non-intrusive, continuous monitoring based on simple environmental sensors [1] and behavioral analysis techniques [2,3]. Many technologies can be exploited to compensate for specific impairments, spanning from vocal assistance for people with visual impairment [4] to Brain–Computer Interfaces allowing severely motor-impaired users to achieve communication and home control [5,6] exploiting low-cost and easily deployable solutions [7].
The wide range of smart devices integrated in AAL environments feeds a large, multi-dimensional set of information, providing a multi-faceted view of wellbeing and possible needs of monitored persons. Recent advances in wearable and ubiquitous sensors well fit in this scenario, making simple vital signs such as Heart Rate (HR) or physical activity very easy to collect in a continuous and prolonged fashion, for example, by means of a wrist-worn device. Heart activity, in particular, is of paramount importance in evaluating overall wellness in many different situations and, most notably, in non-communicable chronic diseases frequently affecting the older population. The gold standard for HR estimation is Electrocardiography (ECG), which is, however, scarcely suitable for prolonged monitoring and self-management in daily living contexts. To some extent, even continuative monitoring of HR through photoplethysmography (PPG) may suffer limitations due to wearing comfort and measurement accuracy [8]. Developing alternative or integrative ways to extract such information could therefore be beneficial. An example is provided by seismocardiography (SCG) [9], which studies cardiac activity from mechanical vibrations induced by the heart contractions. By placing an accelerometer over the sternum of a person, it is actually possible to monitor HR and HR Variability (HRV) indeed; extra benefits include the more detailed information about heart valve dynamics and cardiac output that are gathered with this technique. Similarly, ballistocardiography (BCG), can perform non-contact measurements of such quantities by studying the vibration patterns that propagate through an object mechanically coupled to the subject. For example, a bed can be used to track HR of subjects lying overnight [10], thus resulting in a true contactless, non intrusive measurement.
The field of cardiac signal analysis has been extensively studied in recent years. The ECG, involved in this study as ground truth for validation, has indeed received much attention. For example, reference [11] adopts non-linear theory to capture the whole ECG heart dynamics, highlighting that in normal physiological conditions the cardiac activities are chaotic, while in pathological conditions the cardiac activities approach regularity. This technique has then successfully been applied to the electroencephalographic domain as well [12,13]. Deep learning techniques have also been introduced, aimed at identifying abnormal heart rhythms and mechanical dysfunction and possibly supporting healthcare decisions [14]. Recently, SCG and BCG analysis methodology are emerging as a complement and augmentation of electrical heart activity monitoring [15,16]. Similarly to ECG, deep-learning networks were proposed to extract information from the morphology of cardio-mechanical signals [17,18].
In order to process cardiac signals and extract high-level information, it is important to segment each heart cycle. Well-established techniques exist for detecting single heartbeats in the ECG, such as the Pan–Tompkins algorithm [19]. In the same way, methodologies for SCG and BCG segmentation have recently been proposed in the literature [20,21], either leveraging ECG supervision or proceeding in a completely unsupervised fashion. In both scenarios, SCG or BCG waveforms are considered separately in the literature, to the best of our knowledge. This paper, instead, presents a unified, fully automatic and unsupervised methodology to analyze and segment SCG and BCG waveforms. The main contributions of this paper are:
  • The development of a common methodology for the analysis and segmentation of both SCG and BCG waveforms. This is an element of novelty, allowing to treat SCG and BCG waveform segmentation under a unified framework. Higher level models dealing with single SCG/BCG heartbeats could thus benefit from this common extraction routine.
  • Rigorous evaluation of the proposed methodology on a pool of four independent datasets, featuring different measurement setups and time resolutions. This allows to better assess the robustness and generality of the methodology, over a wide set of operating conditions. Results show good heartbeat detection scores, in terms of sensibility and precision. Also, temporal annotation of inter-beat intervals exhibit low RMSE and MAE errors. Such results are shown to be comparable to and improve over related and recent literature.
The rest of the paper is organized as follows. First, related literature is introduced in Section 2.1, whereas Section 2.2 presents the involved datasets and Section 2.3 the proposed methodology. Evaluation metrics are introduced in Section 3.1; results of performance evaluation are presented in Section 3.2 and their interpretation discussed in Section 3.3, whereas Section 3.3 compares the results with other works in the literature. Finally, Section 4 draws the conclusions.

2. Methods

2.1. Related Works

Seismocardiogram and ballistocardiogram are oscillatory signals that originate from heart activity. More precisely, SCG is the result of mechanical vibrations induced by heart contractions, aortic and mitral valve dynamics and the ejection of blood from the left ventricle into the vessels. BCG, instead, is a whole-body vibration process that is related to the recoil forces originating from the propagation of a blood pulse through the cardio-circulatory system. The study of BCG and SCG trace back to the seminal works of Starr [22] and Salerno and Zanetti [23,24], respectively. Recently, though, thanks to the improvements in low-power MEMS (Micro Electro Mechanical Sensors) technology, those fields of study are gaining more popularity [9,15]. Tiny and inexpensive MEMS devices are particularly well suited for AAL environments, fostering low intrusiveness and ease of deployment.
As mentioned, SCG can be acquired by means of an accelerometer sensor placed over the subject’s sternum. Proper mechanical coupling between the sensor and the chest ensures high quality recording; however, direct contact with the skin is not required: reference [25] presents a dedicated textile support, capable of enabling day-long acquisitions. Cardiac dynamics can also be studied with the aid of a gyroscope sensor [26]. This technique was called gyrocardiography (GCG), accordingly. Authors of [27] combined GCG and SCG information to detect many events in the cardiac cycle. By considering the same information, a comparison of heartbeat detection performance in healthy and coronary artery disease patients was conducted in [28]. Moreover, non-contact HR measurements are possible, for example, by using airborne pulse-Doppler ultrasound systems [29], microwave sensors [30] and Doppler radar systems [31].
As far as BCG is concerned, measurement setups are quite different in terms of sensor placement and technology. For example, reference [32] investigates the potential of limb BCG to extract cardiovascular parameters. Instead, authors in [33] use a wrist-worn BCG sensor to compute quantities of interests such as Pulse Transit Time (PTT). On the other hand, BCG can be measured in a non-contact fashion, for example, by means of artificial vision techniques [34,35]. Moreover, BCG can be acquired from objects mechanically coupled to the subject’s body, for example, a bed [36], a chair [37] or a weighting scale [38]. Different sensing technologies are used, including load cells [39], force plates [40], piezoelectric sensors [10] and accelerometers [41].
SCG and BCG provide information about heart and cardiovascular dynamics that enriches and complements the electrical activity information provided by the ECG. Specific events in the SCG traces have been linked with precise cardiac phases by means of ultrasound imaging validation [42]. Also, both SCG and BCG were shown to be suitable for detecting atrial fibrillation (AFib). For example, a classifier was trained on HRV and SCG spectral entropy features to detect AFib [43]. Reference [44] proposes several machine learning algorithms to discriminate between normal, sinus rhythm and AFib in BCG traces. In order to reduce artifacts in the SCG waveforms, authors in [45] compare different denoising techniques. Overall, wavelet thresholding achieved the best results in terms of signal enhancement accuracy and computational efficiency. Similarly, a method based on Empirical Mode Decomposition (EMD) is used in [46] to reduce the noise superimposed to SCG due to walking activity. Reference [47] proposes a methodology for robust temporal annotation of systolic and diastolic SCG complexes based on triple integration of the magnitude of the signal, followed by a probabilistic peak classification approach. Reference [48], on the other hand, extract features from time and frequency domain to train a Support Vector Machine (SVM) model able to classify respiratory phases (i.e., inhale or exhale).
As far as the BCG domain is involved, authors in [49] put efforts into developing an interpretative model for BCG. Such model was demonstrated to be able to simulate the effect of various heart conditions on the BCG waveforms, including the reduction of left ventricle contractility or the increased stiffness of the left ventricle. Posture was shown to influence BCG measurements, as discussed in [50]. In this regard, reference [51] compares different setups and proposes a computational method to reduce this effect. Authors in [52] compare different BCG heartbeat detection methods on two common datasets, featuring subjects lying still on two different bed setups. The measurement technique in both setups is based on load cells placed under each bed leg. The compared techniques use different transformations including Shannon Energy and autocorrelation [53], short-time energy profiles and filtering [36], probabilistic estimates of inter-beats intervals [54]. Overall, the last method scored the best results in terms of detection rate and annotation accuracy. Reference [55], instead, presents a multi-resolution wavelet analysis for processing BCG records from a chair headrest. Authors state that the method produces better noise filtering results with respect to EMD techniques and it also offers a computational advantage over them.

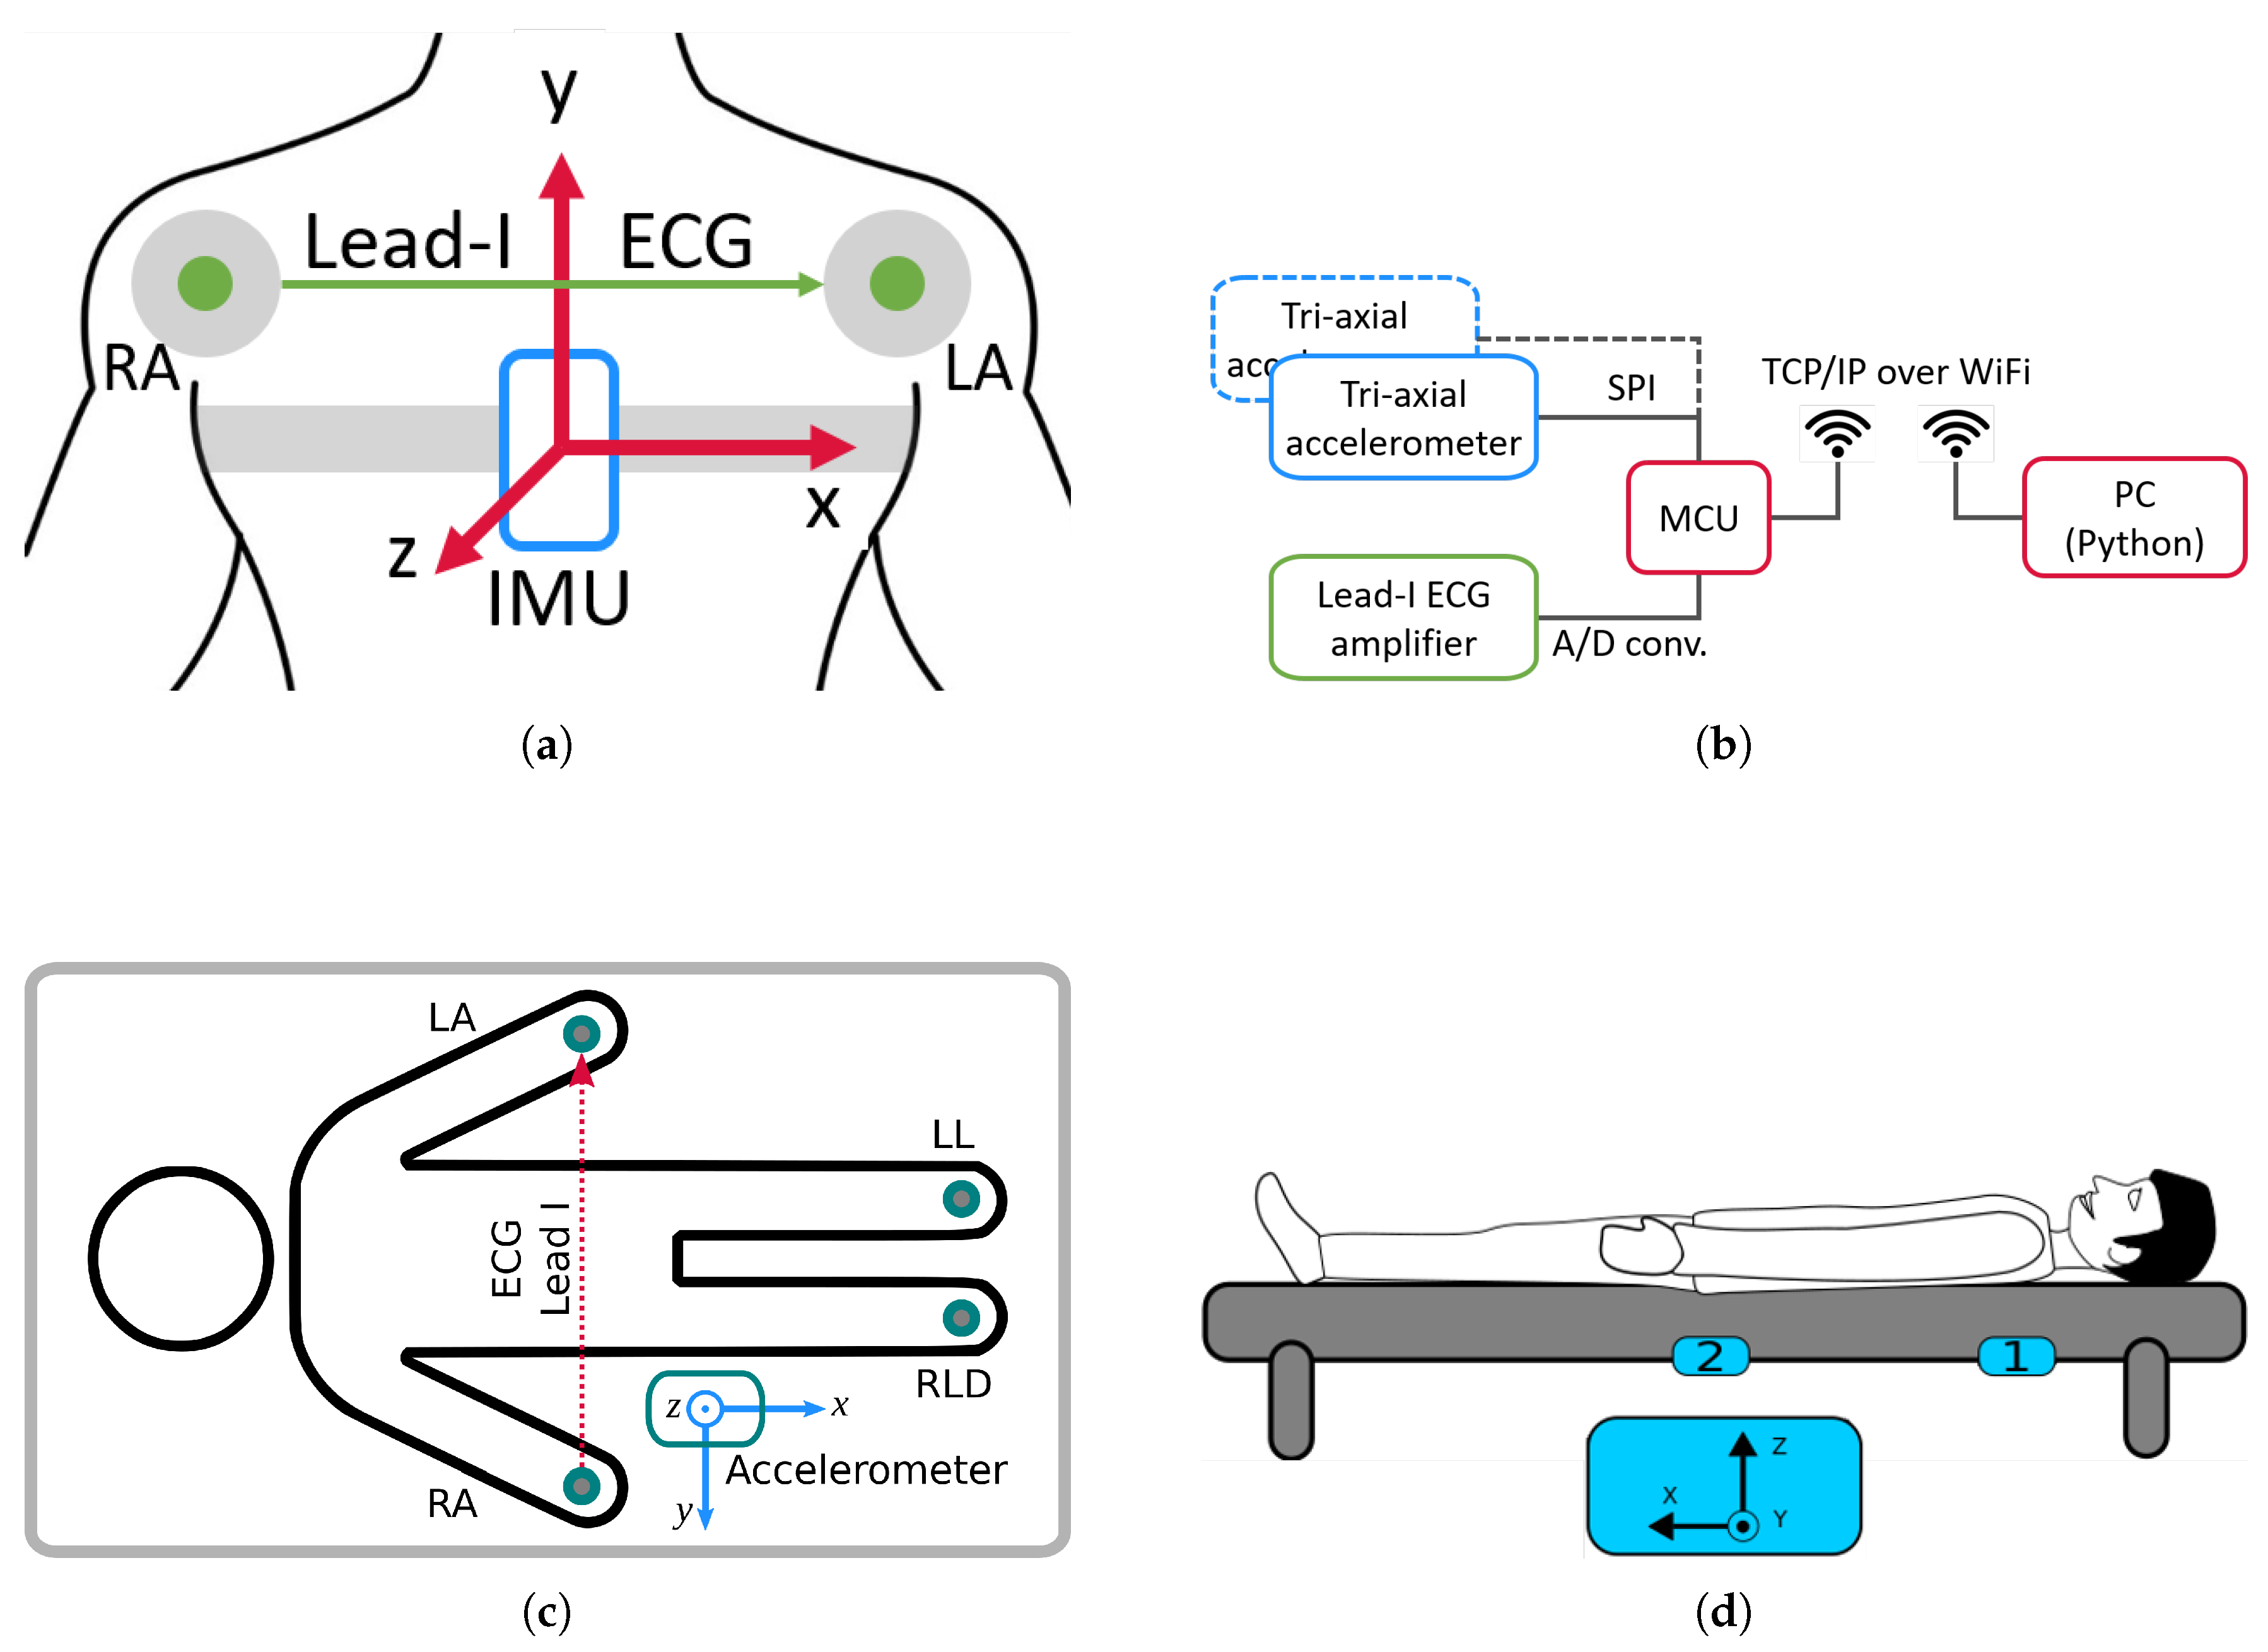
2.2. Datasets Description and Preprocessing

This paper considers four different datasets: two of them involve SCG traces, whereas the remaining ones focus on BCG curves. In all cases, a synchronous ECG record is present, in order to provide the ground truth for cardiac events segmentation. Table 1 provides a summary of the considered datasets, where Nrec is the number of records in the dataset and Fs is the adopted sampling frequency. All subjects involved in the custom-acquired datasets (i.e., SCG-1, BCG-1 and BCG-2) were healthy volunteers, agreeing to participate in the studies, which were conducted following the Helsinki declaration on ethical principles.
Dataset SCG-1 is a collection of 4 min-long SCG traces, acquired from 13 healthy volunteers sitting in an upright position. The acquisition setup is described more in detail in [56]. In summary, vibration patterns were acquired by means of a tri-axial accelerometer (ADXL 355 from Analog Devices, Inc.) placed over the subjects’ sternum, as reported in Figure 1a. Sampling frequency was set to 100 Hz as a compromise between time resolution and low power consumption requirements, looking forward to an embedded SCG device. Simultaneously, for benchmarking purposes only, a lead-I ECG was acquired, shown in the same figure. Acceleration and ECG signals are synchronized by means of a Micro Controller Unit (MCU), which collects data and streams them via TCP/IP over WiFi to a receiving client. Such client is hosted on a desktop computer that stores data for further offline processing. Figure 1b provides an overview of such acquisition chain, which was used for collecting datasets SCG-1, BCG-1 and BCG-2.
Dataset SCG-2 is the publicly available CEBS dataset [57], hosted on PhysioNet [58]. It involves 50 min-long records of 20 subjects lying in the supine position. The records include a respiratory signal, the dorso-ventral acceleration and lead-I and II ECG derivations. In practice, the electrode and accelerometer placement is very similar to the one depicted in Figure 1b for SCG-1. The main differences are the subject’s position (lying in this case, sitting for the other) and the sampling frequency (5000 Hz originally, downsampled to 500 Hz for easier processing and comparison).
The third dataset, BCG-1, is a custom setup, represented in Figure 1c. Overall, 18 healthy volunteers were recorded for 5 min, while comfortably lying in the supine position. The BCG was measured by sensing the micro-vibrations that couple to the bed structure. The sensing element was the same as the setup of the SCG-1 dataset, namely an ADXL355 tri-axial accelerometer. This time, though, the sampling frequency was set to 250 Hz. A lead-I ECG signal was acquired synchronously for performance assessment purposes.
The last dataset, BCG-2, consists of 42 records of BCG traces acquired from 14 healthy volunteers that were asked to lie in bed in three different positions: supine, left side and right side. This dataset features two synchronous accelerometers, placed as reported in Figure 1d, firmly attached to the bed spring frame (different beds were used for BCG-1 and BCG-2 dataset acquisition). The first sensor is located below the subject’s chest, whereas the second one is approximately placed under his/her center of mass. The accelerometer is the ADXL355 device, already used for SCG-1 and BCG-1 datasets; thus, the acquisition scheme is the same as the one reported in Figure 1b, this time featuring two accelerometers. As in the other cases, a synchronized lead-I ECG is acquired to provide accurate cardiac events reference. In this experiment, sampling frequency was set to 500 Hz.
In order to obtain an easier annotation of the waveforms, all signals were preprocessed. As a first step, SCG, BCG and ECG were filtered by means of Finite Impulse Response (FIR) bandpass filters. In particular, a pass-band of [0.5 Hz–45 Hz] was selected for ECG, whereas for the BCG and the SCG it was set to a [2 Hz–14 Hz] range. Processing was performed with zero-phase digital filtering, in order to keep a correct phase relationship between the ECG and the SCG/BCG traces. Successively, data were scaled using z-scoring as follows:
s z s c = s μ s σ s ,
where s is the signal of interest, μ s is its mean, σ s its standard deviation and s z s c the z-scored signal. It is worth underlying again that the ECG signal is used only for algorithm performance evaluation: calibration, beat detection and annotation are performed by using the SCG or BCG waveforms only.

2.3. Proposed Methodology for Unsupervised Heartbeat Detection and Annotation

An SCG or BCG heartbeat is a characteristic, oscillatory pattern that differs from subject to subject, depending on many physiological and anatomical factors. Direct pattern matching without any reference or prior knowledge is, therefore, hard to achieve. On the other hand, templates of heartbeats can be estimated from SCG/BCG data. First of all, a rough estimate on the location of SCG/BCG complexes is given by inspecting local signal energy variations. In fact, in presence of heartbeat patterns, the high oscillatory behavior causes an increase in such energy. The proposed methodology introduces a detection signal ( s D E T ) to discover such events in SCG and BCG waveforms, defined as follows:
s D E T [ n ] = k = 0 M 1 b [ k ] · s z s c 2 [ n k ] ,
where s z s c is the preprocessed SCG signal and b [ k ] , k = 0 , , M 1 are the coefficients of a low-pass FIR filter. In this work M = 256 and the cutoff frequency is set to 2 Hz as highlighted by a parametric analysis. In order to better isolate heartbeats, the s D E T signal is further processed by means of a sliding-window filter, defined as follows:
s S Q R ( i ) = 1 , if s D E T ( i ) μ i : i p + k · σ i : i p 1 , otherwise ,
where μ i : i p is the average computed over the last p points (in this study, in order to have a sufficiently sized sample, p = 4 ms · 30 / T s , where T s is the sample interval), σ i : i p the sample standard deviation and k is a multiplication factor that regulates how much the sample needs to stand out against the computed window statistics. Too low values of k imply that more peaks are discovered, possibly including spurious ones. On the other hand, too high values of k might skip potential heartbeats. The optimal value of k = 2 was chosen after conducting a parametric sweep on the overall detection accuracy. By construction, the s S Q R signal assumes positive values when a candidate heartbeat is considered. Such positive intervals define regions of interest in the s D E T signal: the local maxima in each of them is taken as the approximate location of a heartbeat pattern. In order to reduce the false positives and false negatives, intervals between said maxima are accepted if they fall into a pre-determined range (in this study [400 ms–1500 ms], corresponding to a heart rate within 40 and 150 beats per minute) and the relative variation is lower than 30%. In case one inter-beat interval results higher than allowed, the k parameter in Equation (3) is halved, and the search is performed again.
Once enough candidate beats have been detected, an ensemble is formed to extract a template of the subject’s patterns. In order to do so, the detected beat complexes are aligned one to each other: starting from the mentioned s D E T maxima, phasing is refined by maximizing their cross-correlation. Cross-correlation is performed over a finite set of possible delays, ± τ S = ± 200  ms, i.e., half of the minimum allowable beat-to-beat interval. Restricting the delays to ± τ S reduces the risk of spurious misalignment and better adapts to different subjects. After alignment, a template s z s c , T is finally extracted by computing the median waveform of the ensemble.
After the unsupervised template extraction, the annotation phase follows the same steps: candidates are first identified within positive intervals in s S Q R and successively refined according to the above criteria; then, precise time instants are marked by maximizing cross-correlation between the previously extracted template and the SCG/BCG traces in such intervals. The processing steps are summarized in Algorithm 1, whereas Figure 2 shows a graphical block diagram representation of the methodology phases and the related signals and transformations.
Algorithm 1 Detection of heartbeat events.
Inputs:
  • s z s c : z-scored SCG/BCG signal
Begin:
  • Compute s D E T and s S Q R according to Equations (2) and (3), respectively
  • Calibration:
    • Find positive s S Q R periods such that:
      (a)
      are separated by 400 ms up to 1500 ms
      (b)
      relative variation in separation is not greater than ± 30 %
    • Find s D E T maxima around periods found at point 1
    • Incrementally align sample beats:
      (a)
      align waveforms around time instants found at point 2
      (b)
      refine alignment by performing cross-correlation of s z s c within ± τ S = 200  ms of the time instants found above at point 3a
    • Extract SCG/BCG beat template (median)
  • Annotation:
    5.
    Perform steps 1–2
    6.
    Perform steps 3a–3b by aligning the template s z s c , T and the current s z s c waveforms
    7.
    Mark the maximal alignment point as heartbeat location
Return time instants of heartbeats

3. Results and Discussion

Evaluation of the proposed methodology requires first to describe the key performance indicators. Scores will be computed for each dataset separately, both at the subject and population level. Then, statistical comparisons will be conducted to assess differences in performance over the considered datasets.

3.1. Performance Metrics and Evaluation Procedures

The proposed methodology aims at detecting heartbeats and precisely estimating cardiac cycles. In order to validate these tasks, a regular heart rhythm is assumed: in this way, it is possible to compare the performance of the proposed methodology against the ECG reference (i.e., the absence of ectopic beats or rhythm disturbances in the examined records allow electrical and mechanical activity of the heart to be precisely correlated). In order to assess the performance, let us first introduce some definitions. In particular, given an R peak, it is convenient to define a tolerance window where the target acceleration patterns should be found. Such intervals are subject-dependent and can be estimated from the data by collecting statistics on the delay between the R peak and the heartbeat complexes. The length of the tolerance window was set to ± 100 ms around such expected location. However, it is worth underlying that the tolerance window is used for performance assessment purposes only: none of the R-peak to SCG/BCG complex information was used for beat detection and annotation. With such definition, a detection is considered correct (True Positive, or TP) if it falls within its tolerance window. On the other hand, a missed heartbeat between two R peaks is classified as False Negative (FN); a beat outside the specified tolerance window and between two R peaks is considered as a False Positive (FP), whereas a True Negative (TN) is when no beats are found between two consecutive tolerance windows. Based on these definitions, the following metrics are introduced:
  • Sensitivity, i.e., percentage of correctly identified reference points: Sens = 100 % · T P / ( T P + F N ) ;
  • Precision, i.e., percentage of TP in all detected points: Prec = 100 % · T P / ( T P + F P ) .
In addition, let us define t R R = { t R , i t R , i 1 } , i { 1 , . . . , N 1 } as the time series of R-R intervals, N being the number of detected heartbeats. Also, let t C C = { t C , i t C , i 1 } , i { 1 , . . . , N 1 } be the series of the complex-to-complex intervals (i.e., from SCG/BCG traces), matched to t R R . The annotation errors can consequently be defined as:
e i = t R R , i t C C , i ,
The following performance metrics are then introduced:
  • Root Mean Squared Error (RMSE), RMSE= 1 / ( N 1 ) · i = 1 N 1 e i 2 ;
  • Mean Absolute Error (MAE), MAE= 1 / ( N 1 ) · i = 1 N 1 e i .

3.2. Performance Results

The performance metrics described in Section 3.1 were computed over all available datasets, for each subject in them. Table 2 reports the average score and 10th Lowest Performance Percentile (LPP) for each metric and dataset.
The average sensitivity scores are 98.9%, 98.5%, 98.4% and 98.2% for the SCG-1, SCG-2, BCG-1, BCG-2 datasets, respectively. Furthermore, the 10th LPP performing subjects still score 96.2%, 97.0%, 96.7% and 96.2% in sensitivity on the same datasets. This implies good overall ability to detect the vast majority of heartbeats. The box-plot in Figure 3a summarizes the sensitivity metrics of each dataset population. As far as precision is concerned, the average scores on the SCG-1, SCG-2, BCG-1, BCG-2 datasets are 97.9%, 98.6%, 97.6% and 98.0%, respectively. Performance remains quite stable over the populations involved, as shown in Figure 3b; in fact, the 10th LPP still amounts to 96.3%, 97.2%, 95.0% and 96.4%, respectively. Even in this case, performance remains high, proving that the SCG/BCG complex detections do not include much false positives. Together with the sensitivity scores, such results confirm that the proposed methodology effectively detects heartbeats from SCG and BCG waveforms, without recurring to any ECG information.
The quality of temporal localization of the detected heartbeats can be assessed by means of RMSE and MAE scores. In this regard, the average RMSE performance is 8.1, 4.5, 6.8 and 5.6 ms for the SCG-1, SCG-2, BCG-1 and BCG-2, respectively, whereas the 10th LPP are 8.2, 6.1, 10.6 and 8.8 ms. A slight dependence on the sampling interval T s can be observed, as it will be discussed later: higher T s are associated with higher RMS errors. This is due to the less fine-grained temporal resolution of the SCG-1 and BCG-1 datasets. As far as the MAE is concerned, similar behavior is observed. The average MAE performance is 4.8, 3.3, 5.0 and 3.6 ms, respectively, with the 10th LPP in line with such results (5.7, 4.8, 7.9 and 5.9 ms).
A further visualization of the agreement between ECG and SCG/BCG heartbeat intervals is provided by the statistical characterization of errors ( e i ). The graphs in Figure 4 show a Kernel Density Estimate (KDE) of the distribution of such errors: a Gaussian kernel is used with bandwidth parameter set to one sampling interval T s . Individual subjects’ KDE are drawn as light blue traces, whereas their population-wide aggregation is shown as a ticker dark blue line. In each plot, the ± RMSE bars are reported as well, for an easier comparison. In general, it can be noticed that the stochastic errors e i can be described as a zero-mean process, despite differences in the sampling period T s . Instead, as previously noticed, the spread of errors tends to increase with decreasing sampling frequency. In fact, the 95% Highest Density Intervals of e i , under which 95% of observation lie, are ± 20 ms for SCG-1 ( T s = 10 ms, Figure 4a), ± 16 ms for BCG-1 ( T s = 4 ms, Figure 4c), ± 10 ms for SCG-2 and BCG-2 ( T s = 2 ms, Figure 4b,d, respectively). Furthermore, KDE estimates of BCG-2 are shown in Figure 5, grouped by different lying positions. The behavior is quite stable and, as it will be discussed later, no significant performance differences are observed in relation to different lying positions.
Finally, another useful representation of the agreement between t R R and t C C is shown in the Bland–Altman plots in Figure 6. In these graphs, the measurement errors e i are plotted against the average of the measurements being compared, i.e., ( t R R , i + t C C , i ) / 2 . This allows highlighting patterns in errors i.e., to detect dependencies with respect to the measured intervals. From inspection of such plots, errors are distributed quite evenly around 0, as confirmed by the KDE plots. Similarly to Figure 4, the ± RMSE levels are reported: overall, good agreement can be observed.

3.3. Discussion

The proposed methodology has been evaluated on four different datasets, collected with different aims, measurement protocols and temporal resolutions. Therefore, a wide range of scenarios was sampled, allowing to set up a more accurate statistical characterization. Two statistical tests were used to assess the difference in performance scores:
  • Kruskal–Wallis test, a non-parametric method to asses whether scores from each dataset all belong to the same distribution. In case the test is significant, it is possible to reject such null hypothesis.
  • Mann–Whitney U test, similar to Kruskal–Wallis, but applied to just two populations.
Since multiple comparisons are performed (one per metric for Kruskal–Wallis, one per metric and couple of datasets for Mann–Whitney U tests), the p-values are adjusted using the Benjamini–Hochberg correction: p a d j = p · M / r i , where M is the number of tests conducted and r i is the rank of the i-th p-value in ascending order.
First of all, the BCG-2 dataset was inspected to test whether lying positions have an effect on the performance scores. Table 3 reports the results of Kruskal–Wallis tests on sensitivity, precision, RMSE and MAE. Single asterisk marks indicate significance at the 0.05 level, whereas double asterisks represent the 0.01 level. It can be noticed that the null hypothesis cannot be rejected: therefore, there is not enough evidence to support that scores do not come from a single distribution. Thus, the BCG-2 results can be considered together when comparing its performance to the other datasets.
Table 4 reports, instead, the results of Kruskal–Wallis tests for differences between the performance scores of all presented datasets. From a statistical point of view, sensitivity and precision fail to reject the null hypothesis ( p a d j 0.63 and p a d j 0.07 , respectively). This implies that the proposed methodology exhibits consistent behavior in the ability to detect cardiac events from SCG and BCG traces unsupervised. On the other hand, at least one dataset exhibits a different RMSE and MAE distribution that allows to reject the null hypothesis ( p a d j < 0.01 ). In order to better investigate the differences between couples of datasets, Mann–Whitney tests were performed, as mentioned. The results of such analyses are reported in Table 5. Pair-wise comparisons in terms of sensitivity and precision confirm that no statistically significant difference can be found. On the other hand, some differences emerge in the RMSE and MAE scores: in particular, dataset SCG-1 significantly differs from SCG-2 and BCG-2 ( p a d j < 0.01 for RMSE and p a d j < 0.03 for MAE). The larger sampling interval ( T s = 10 ms for the former, T s = 2 ms for the others) might thus have an impact: this is to be expected, since peak annotation strongly depends on the temporal resolution of the A/D conversion. Other support to this observation is provided by a lower MAE for SCG-2 and BCG-2, compared to that of BCG-1, sampled at T s = 4 ms ( p a d j 0.01 and p a d j 0.03 , respectively); similarly, RMSE is significantly different between BCG-1 and SCG-2 ( p a d j 0.01 ). On the other hand, no statistically significant difference is observed in RMSE or MAE for datasets SCG-2 and BCG-2, both sampled at the highest frequency. It is worth underlying, however, that some application scenarios might need lower sampling rates, in order to promote power saving or to match the little available computational resources.

Comparison with Related Literature

In relation to other works in literature, the proposed methodology exhibits good results. As far as SCG is concerned, reference [59] focuses on the detection of the aortic valve opening patterns: a sensitivity score of 94 % is reported, with 90 % precision. Moreover, reference [60] attempts to isolate systolic and diastolic complexes in the SCG by means of a moving average method; overall, an error rate of 4% is reported for systole events (higher than the 10th LPP in each dataset) and 9% for diastole. Reference [61], instead, quantifies SCG annotation performance during a lower body negative pressure test in lying position. An annotation error of 9 ± 9 ms (mean±standard deviation) is declared. In a similar setting [62], an RMSE of 40, 71, 26, 51, and 27 ms are reported for increasing levels of lower body negative pressure; in turn, the average sensitivity in beat detection is 97.2%, 93.0%, 76.9%, 61.6%, 65.0%, respectively. In [63], a smartphone placed over the sternum of supine-lying subjects was used to acquire 5 min-long SCG traces. Over a cohort of 11 volunteers, one was discarded due to low signal quality (coverage 91 %). On the remaining subjects, the declared sensitivity was 99.5%, with a 97.4% precision; on the other hand, the beat to beat errors exhibited a standard deviation of approximately 17.5 ms, which is higher than the performance reported in all datasets of the present work. Reference [28], instead, combines accelerometer and gyroscope information to detect heartbeats. High accuracy and precision scores are achieved ( 99 . 9 % and 99 . 6 % , respectively). However, approximately 6 . 6 % of data were discarded in preprocessing, to remove potential artifacts. In the present work, no information was discarded from analysis, instead. The same reference presents a mean RMSE of 5.6 ms, with a sampling rate of 800 Hz ( 4 . 5 T s ). In the case of the SCG-2 dataset, which features a comparable sampling frequency ( F s = 500 Hz), a lower RMSE error is achieved (4.5 ms, on average). Similarly, reference [47] achieves a very low RMSE error (less than 3.2 ms); however, the reported heartbeat detection rate varies between 32% and 14% when using the SCG traces only. In [64], authors train several ML algorithms to perform annotation of a subset of the CEBS database (i.e., the same as dataset SCG-2). In particular, they first segment traces based on the concurrent ECG, identifying different regions of interest; annotation is then formulated as a series of binary classification of SCG maxima within such regions. The models are trained on a subset of 6000 cardiac cycles and cross-validated on 3000 (out of approximately 68,000, which are actually fully accounted for in our evaluations). The best reported average sensitivity and precision scores of maxima annotation (9 classes in total) are, approximately, 97% and 95%, respectively. Furthermore, the RMSE error for AO (best performing) and IM are 3.2 and 3.9 ms, respectively. However, RMSE in that work is computed with respect to the reference R peak, whereas in the present work the error is computed between consecutive annotation: this implies an advantage of a 2 factor between the former and the latter (i.e., R M S E A O A O 2 · R M S E R A O ). In light of such considerations, the proposed methodology offers slightly improved annotation performance, accounting for the full CEBS dataset; furthermore, the sensitivity and precision scores of this work were achieved in an unsupervised fashion, i.e., without recurring to the ECG information.
As far as the BCG is concerned, the achieved precision is comparable to other works in literature [65,66]; on the other hand, sensitivity improves over related literature (e.g., a best score of 92.7% reported in [66]). Reference [67] tests the performance of a piezoelectric sensor for a smart chair: an MAE 7.7 ms is reported, higher than the 10th LPP reported in this work. In a similar measurement setting, reference [68] reports an error standard deviation of 14.35 ms at a sampling frequency of 1000 Hz. Furthermore, reference [65] compares different setups in terms of sex, single/double bed and sensor type. For single beds, an MAE of 13.22 ms is achieved at a sample frequency of 300 Hz, higher than the ones reported in our datasets (5.0 ms at F s = 250 Hz on BCG-1 and 3.6 ms at F s = 500 Hz on BCG-2). A similar setup, featuring a commercial, accelerometer-based solution [69], achieved 0.5 ± 1.6 beats per minute (mean± standard deviation, i.e., 8 . 3 ± 26 . 7 ms) in HR estimation accuracy. The best-performing peak detection method described in reference [52] (already mentioned in Section 2.1) scored a 95.0% sensitivity, with a 7.8 ms average standard deviation between real and detected peaks, both resulting in lower performance, compared to the presented methodology.
Overall, the performance comparisons highlighted good behavior of the presented methodology in both SCG and BCG scenarios. Nonetheless, as a final remark, it is worth mentioning some limitations of this work. In particular, this work focuses on solutions suitable for domestic environments, in a continuous, multi-dimensional monitoring scenario. Therefore, the tool is not intended as a replacement for clinical instruments, dealing with heart pathology detection and classification; instead, the purpose is to pick up long-term trends and patterns in a non-obtrusive fashion. Moreover, the emphasis on SCG-1 and SCG-2 datasets is on static or quasi-static conditions. This, however, does not preclude application in real cases: indeed, many motion artifact-free periods can be monitored throughout the full day (e.g., rest or sleep periods), especially in continuous monitoring of senior-users in smart AAL environments. Future developments include training machine learning models to discriminate between motion-intensive and quiet periods. The same sensors will thus allow to assess motion intensity, quantity and quality during “active” periods and SCG heart parameters during “still” intervals. As far as the BCG is concerned, experiments were carried out in lab-controlled conditions. However, long-term, unconstrained measurements scenarios at home are being investigated at the moment. Encouraging preliminary results were observed: data obtained from one subject, recorded for approximately six hours during a nights sleep, are in line with the lab results. Indeed, approximately only 2% of the data was discarded, due to motion artifacts corrupting the ECG (i.e., the ground truth) and thus making validation of BCG not feasible. On the valid data, a 95.4% sensitivity was achieved, with a 94.8% precision and an RMSE and MAE of just 5.12 and 3.54 ms, respectively.

4. Conclusions

This work presented a unified methodology to analyze and segment SCG and BCG waveforms. The main algorithmic features were introduced, organized into two distinct phases: candidate heartbeats detection and local refinements for accurate annotation. The methodology was tested on four datasets, two of which related to SCG waveforms and two to bed-based, BCG ones. Such datasets cover different measurement setups and time resolutions, allowing to explore the performance of the proposed methodology on a wide range of application scenarios. Overall, detection performance is stable across all datasets, as highlighted by statistical tests performed on sensitivity and precision scores. On the other hand, datasets with higher sampling frequency exhibited the lowest annotation errors (in terms of RMSE and MAE). The novel, unified methodology allows for developing common analysis tools suitable for both SCG and BCG signals. Such versatility does not imply any performance loss: on the contrary, detection performance is shown to improve over specific literature work in both cases. The proposed methodology can be easily adapted in the future to operate on streaming data. In this regard, a centralized server can receive compressed time series data, as suggested in [70,71]. Another possible scenario, instead, is to limit the temporal span of the analyses to a few heartbeats and focus on an embedded implementation of the algorithm.

Author Contributions

Conceptualization, N.M.; methodology, N.M. and F.C.; validation, G.M. and P.C.; formal analysis, N.M.; data curation, N.M. and F.C.; writing, N.M. and P.C.; supervision, G.M. and P.C. All authors have read and agreed to the published version of the manuscript.

Funding

This research received no external funding.

Conflicts of Interest

The authors declare no conflict of interest.

References

  1. Guerra, C.; Bianchi, V.; Grossi, F.; Mora, N.; Losardo, A.; Matrella, G.; De Munari, I.; Ciampolini, P. The HELICOPTER Project: A Heterogeneous Sensor Network Suitable for Behavioral Monitoring. In Lecture Notes in Computer Science (including Subseries Lecture Notes in Artificial Intelligence and Lecture Notes in Bioinformatics); Springer International Publishing: Cham, Switzerland, 2015; Volume 9455, pp. 152–163. [Google Scholar] [CrossRef]
  2. Mora, N.; Matrella, G.; Ciampolini, P. Cloud-Based Behavioral Monitoring in Smart Homes. Sensors 2018, 18, 1951. [Google Scholar] [CrossRef] [PubMed] [Green Version]
  3. Debes, C.; Merentitis, A.; Sukhanov, S.; Niessen, M.; Frangiadakis, N.; Bauer, A. Monitoring Activities of Daily Living in Smart Homes: Understanding human behavior. IEEE Signal Process. Mag. 2016, 33, 81–94. [Google Scholar] [CrossRef]
  4. Ho, D.K. Voice-controlled virtual assistants for the older people with visual impairment. Eye 2018, 32, 53–54. [Google Scholar] [CrossRef] [PubMed] [Green Version]
  5. Mora, N.; De Munari, I.; Ciampolini, P. Subject-independent, SSVEP-based BCI: Trading off among accuracy, responsiveness and complexity. In Proceedings of the 2015 7th International IEEE/EMBS Conference on Neural Engineering (NER), Montpellier, France, 22–24 April 2015; pp. 146–149. [Google Scholar] [CrossRef]
  6. Mora, N.; Bianchi, V.; De Munari, I.; Ciampolini, P. A low cost brain computer interface platform for AAL applications. Assist. Technol. Res. Ser. 2013, 33, 946–952. [Google Scholar] [CrossRef]
  7. Mora, N.; De Munari, I.; Ciampolini, P. Improving BCI Usability as HCI in Ambient Assisted Living System Control. In Lecture Notes in Computer Science (including Subseries Lecture Notes in Artificial Intelligence and Lecture Notes in Bioinformatics); Springer International Publishing: Cham, Switzerland, 2015; Volume 9183, pp. 293–303. [Google Scholar] [CrossRef]
  8. Eerikäinen, L.M.; Bonomi, A.G.; Schipper, F.; Dekker, L.; Vullings, R.; De Morree, H.M.; Aarts, R.M. How Accurately Can We Detect Atrial Fibrillation Using Photoplethysmography Data Measured in Daily Life? Comput. Cardiol. 2019. [Google Scholar] [CrossRef]
  9. Inan, O.T.; Migeotte, P.F.; Park, K.S.; Etemadi, M.; Tavakolian, K.; Casanella, R.; Zanetti, J.; Tank, J.; Funtova, I.; Prisk, G.K.; et al. Ballistocardiography and Seismocardiography: A Review of Recent Advances. IEEE J. Biomed. Health Inform. 2015, 19, 1414–1427. [Google Scholar] [CrossRef] [Green Version]
  10. Kortelainen, J.M.; Van Gils, M.; Parkka, J. Multichannel bed pressure sensor for sleep monitoring. In Computing in Cardiology; IEEE: New York, NY, USA, 2012. [Google Scholar]
  11. Wang, X. Relation of chaos activity characteristics of the cardiac system with the evolution of species. Chin. Sci. Bull. 2002, 47, 2042. [Google Scholar] [CrossRef]
  12. Wang, X.; Luo, C. Researches on chaos phenomenon of EEG dynamics model. Appl. Math. Comput. 2006, 183, 30–41. [Google Scholar] [CrossRef]
  13. Wang, X.; Luo, C.; Meng, J. Nonlinear dynamic research on EEG signals in HAI experiment. Appl. Math. Comput. 2009, 207, 63–74. [Google Scholar] [CrossRef]
  14. Mincholé, A.; Rodriguez, B. Artificial intelligence for the electrocardiogram. Nat. Med. 2019, 25, 22–23. [Google Scholar] [CrossRef]
  15. Sadek, I.; Biswas, J.; Abdulrazak, B. Ballistocardiogram signal processing: A review. Health Inf. Sci. Syst. 2019, 7, 10. [Google Scholar] [CrossRef] [PubMed]
  16. Taebi, A.; Solar, B.; Bomar, A.; Sandler, R.; Mansy, H. Recent Advances in Seismocardiography. Vibration 2019, 2, 64–86. [Google Scholar] [CrossRef] [Green Version]
  17. Inan, O.T.; Baran Pouyan, M.; Javaid, A.Q.; Dowling, S.; Etemadi, M.; Dorier, A.; Heller, J.A.; Bicen, A.O.; Roy, S.; De Marco, T.; et al. Novel Wearable Seismocardiography and Machine Learning Algorithms Can Assess Clinical Status of Heart Failure Patients. Circ. Heart Fail. 2018, 11. [Google Scholar] [CrossRef] [PubMed]
  18. Mora, N.; Cocconcelli, F.; Matrella, G.; Ciampolini, P. Detection and Analysis of Heartbeats in Seismocardiogram Signals. Sensors 2020, 20, 1670. [Google Scholar] [CrossRef] [PubMed] [Green Version]
  19. Pan, J.; Tompkins, W.J. A Real-Time QRS Detection Algorithm. IEEE Trans. Biomed. Eng. 1985, BME-32, 230–236. [Google Scholar] [CrossRef]
  20. Kim, C.S.; Ober, S.L.; McMurtry, M.S.; Finegan, B.A.; Inan, O.T.; Mukkamala, R.; Hahn, J.O. Ballistocardiogram: Mechanism and Potential for Unobtrusive Cardiovascular Health Monitoring. Sci. Rep. 2016, 6, 31297. [Google Scholar] [CrossRef] [Green Version]
  21. Shafiq, G.; Tatinati, S.; Ang, W.T.; Veluvolu, K.C. Automatic Identification of Systolic Time Intervals in Seismocardiogram. Sci. Rep. 2016, 6, 37524. [Google Scholar] [CrossRef] [Green Version]
  22. Starr, I. The relation of the ballistocardiogram to cardiac function. Am. J. Cardiol. 1958, 2, 737–747. [Google Scholar] [CrossRef]
  23. Salerno, D.M.; Zanetti, J. Seismocardiography: A new technique for recording cardiac vibrations. Concept, method, and initial observations. J. Cardiovasc. Technol. 1990, 9, 111–118. [Google Scholar]
  24. Zanetti, J.; Salerno, D. Seismocardiography: A technique for recording precordial acceleration. In Computer-Based Medical Systems, Proceedings of the Fourth Annual IEEE Symposium, Baltimore, MD, USA, 12–14 May 1991; IEEE Comput. Soc. Press: Washington, DC, USA, 1991; pp. 4–9. [Google Scholar] [CrossRef]
  25. Di Rienzo, M.; Vaini, E.; Castiglioni, P.; Lombardi, P.; Meriggi, P.; Rizzo, F. A textile-based wearable system for the prolonged assessment of cardiac mechanics in daily life. In Proceedings of the 2014 36th Annual International Conference of the IEEE Engineering in Medicine and Biology Society, Chicago, IL, USA, 26–30 August 2014; pp. 6896–6898. [Google Scholar] [CrossRef]
  26. Jafari Tadi, M.; Lehtonen, E.; Saraste, A.; Tuominen, J.; Koskinen, J.; Teräs, M.; Airaksinen, J.; Pänkäälä, M.; Koivisto, T. Gyrocardiography: A New Non-invasive Monitoring Method for the Assessment of Cardiac Mechanics and the Estimation of Hemodynamic Variables. Sci. Rep. 2017, 7, 6823. [Google Scholar] [CrossRef]
  27. Yang, C.; Tang, S.; Tavassolian, N. Utilizing Gyroscopes Towards the Automatic Annotation of Seismocardiograms. IEEE Sens. J. 2017, 17, 2129–2136. [Google Scholar] [CrossRef]
  28. Kaisti, M.; Tadi, M.J.; Lahdenoja, O.; Hurnanen, T.; Saraste, A.; Pankaala, M.; Koivisto, T. Stand-Alone Heartbeat Detection in Multidimensional Mechanocardiograms. IEEE Sens. J. 2019, 19, 234–242. [Google Scholar] [CrossRef]
  29. Jeger-Madiot, N.; Gateau, J.; Fink, M.; Ing, R.K. Non-contact and through-clothing measurement of the heart rate using ultrasound vibrocardiography. Med. Eng. Phys. 2017, 50, 96–102. [Google Scholar] [CrossRef] [PubMed]
  30. Lu, G.; Yang, F.; Tian, Y.; Jing, X.; Wang, J. Contact-free Measurement of Heart Rate Variability via a Microwave Sensor. Sensors 2009, 9, 9572–9581. [Google Scholar] [CrossRef]
  31. Tu, J.; Lin, J. Fast Acquisition of Heart Rate in Noncontact Vital Sign Radar Measurement Using Time-Window-Variation Technique. IEEE Trans. Instrum. Meas. 2016, 65, 112–122. [Google Scholar] [CrossRef]
  32. Yao, Y.; Shin, S.; Mousavi, A.; Kim, C.S.; Xu, L.; Mukkamala, R.; Hahn, J.O. Unobtrusive Estimation of Cardiovascular Parameters with Limb Ballistocardiography. Sensors 2019, 19, 2922. [Google Scholar] [CrossRef] [Green Version]
  33. Yousefian, P.; Shin, S.; Mousavi, A.; Kim, C.S.; Mukkamala, R.; Jang, D.G.; Ko, B.H.; Lee, J.; Kwon, U.K.; Kim, Y.H.; et al. The Potential of Wearable Limb Ballistocardiogram in Blood Pressure Monitoring via Pulse Transit Time. Sci. Rep. 2019, 9, 10666. [Google Scholar] [CrossRef] [Green Version]
  34. Shao, D.; Tsow, F.; Liu, C.; Yang, Y.; Tao, N. Simultaneous Monitoring of Ballistocardiogram and Photoplethysmogram Using a Camera. IEEE Trans. Biomed. Eng. 2017, 64, 1003–1010. [Google Scholar] [CrossRef] [Green Version]
  35. Lee, H.; Cho, A.; Lee, S.; Whang, M. Vision-Based Measurement of Heart Rate from Ballistocardiographic Head Movements Using Unsupervised Clustering. Sensors 2019, 19, 3263. [Google Scholar] [CrossRef] [Green Version]
  36. Lydon, K.; Bo, Y.S.; Rosales, L.; Enayati, M.; Ho, K.C.; Rantz, M.; Skubic, M. Robust heartbeat detection from in-home ballistocardiogram signals of older adults using a bed sensor. In Proceedings of the 2015 37th Annual International Conference of the IEEE Engineering in Medicine and Biology Society (EMBC), Milan, Italy, 25–29 August 2015; pp. 7175–7179. [Google Scholar] [CrossRef]
  37. Koivistoinen, T.; Junnila, S.; Varri, A.; Koobi, T. A new method for measuring the ballistocardiogram using EMFi sensors in a normal chair. In Proceedings of the 26th Annual International Conference of the IEEE Engineering in Medicine and Biology Society, San Francisco, CA, USA, 1–5 September 2004; Volume 3, pp. 2026–2029. [Google Scholar] [CrossRef]
  38. González-Landaeta, R.; Casas, O.; Pallàs-Areny, R. Heart rate detection from an electronic weighing scale. Physiol. Meas. 2008, 29, 979–988. [Google Scholar] [CrossRef]
  39. Su, J.; Zhu, X.; Zhang, X.; Tang, J.; Liu, L. Ballistocardiogram Measurement System Using Three Load-Cell Sensors Platform in Chair. In Proceedings of the 2009 2nd International Conference on Biomedical Engineering and Informatics, Tianjin, China, 17–19 October 2009; pp. 1–4. [Google Scholar] [CrossRef]
  40. Kim, C.; Carek, A.M.; Inan, O.T.; Mukkamala, R.; Hahn, J. Ballistocardiogram-Based Approach to Cuffless Blood Pressure Monitoring: Proof of Concept and Potential Challenges. IEEE Trans. Biomed. Eng. 2018, 65, 2384–2391. [Google Scholar] [CrossRef] [PubMed]
  41. Meriheinä, U. BCG Measurements in Beds; Technical Report; Murata Electronics: Nagaokakyo, Japan, 2019. [Google Scholar]
  42. Sørensen, K.; Schmidt, S.E.; Jensen, A.S.; Søgaard, P.; Struijk, J.J. Definition of Fiducial Points in the Normal Seismocardiogram. Sci. Rep. 2018, 8, 15455. [Google Scholar] [CrossRef] [PubMed] [Green Version]
  43. Hurnanen, T.; Lehtonen, E.; Tadi, M.J.; Kuusela, T.; Kiviniemi, T.; Saraste, A.; Vasankari, T.; Airaksinen, J.; Koivisto, T.; Pankaala, M. Automated Detection of Atrial Fibrillation Based on Time–Frequency Analysis of Seismocardiograms. IEEE J. Biomed. Health Inform. 2017, 21, 1233–1241. [Google Scholar] [CrossRef] [PubMed]
  44. Bruser, C.; Diesel, J.; Zink, M.D.H.; Winter, S.; Schauerte, P.; Leonhardt, S. Automatic Detection of Atrial Fibrillation in Cardiac Vibration Signals. IEEE J. Biomed. Health Inform. 2013, 17, 162–171. [Google Scholar] [CrossRef] [PubMed]
  45. Sundar, A.; Pahwa, V. Evaluating the Performance of State of the Art Algorithms for Enhancement of Seismocardiogram Signals. In Proceedings of the First International Conference on Intelligent Computing and Communication; Mandal, J.K., Satapathy, S.C., Sanyal, M.K., Bhateja, V., Eds.; Springer: Singapore, 2017; pp. 37–45. [Google Scholar]
  46. Javaid, A.Q.; Ashouri, H.; Dorier, A.; Etemadi, M.; Heller, J.A.; Roy, S.; Inan, O.T. Quantifying and Reducing Motion Artifacts in Wearable Seismocardiogram Measurements During Walking to Assess Left Ventricular Health. IEEE Trans. Biomed. Eng. 2017, 64, 1277–1286. [Google Scholar] [CrossRef]
  47. Khosrow-Khavar, F.; Tavakolian, K.; Blaber, A.; Menon, C. Automatic and Robust Delineation of the Fiducial Points of the Seismocardiogram Signal for Noninvasive Estimation of Cardiac Time Intervals. IEEE Trans. Biomed. Eng. 2017, 64, 1701–1710. [Google Scholar] [CrossRef]
  48. Zakeri, V.; Akhbardeh, A.; Alamdari, N.; Fazel-Rezai, R.; Paukkunen, M.; Tavakolian, K. Analyzing Seismocardiogram Cycles to Identify the Respiratory Phases. IEEE Trans. Biomed. Eng. 2017, 64, 1786–1792. [Google Scholar] [CrossRef]
  49. Guidoboni, G.; Sala, L.; Enayati, M.; Sacco, R.; Szopos, M.; Keller, J.M.; Popescu, M.; Despins, L.; Huxley, V.H.; Skubic, M. Cardiovascular Function and Ballistocardiogram: A Relationship Interpreted via Mathematical Modeling. IEEE Trans. Biomed. Eng. 2019, 66, 2906–2917. [Google Scholar] [CrossRef] [Green Version]
  50. Javaid, A.Q.; Wiens, A.D.; Fesmire, N.F.; Weitnauer, M.A.; Inan, O.T. Quantifying and Reducing Posture-Dependent Distortion in Ballistocardiogram Measurements. IEEE J. Biomed. Health Inform. 2015, 19, 1549–1556. [Google Scholar] [CrossRef]
  51. Yao, Y.; Ghasemi, Z.; Shandhi, M.M.H.; Ashouri, H.; Xu, L.; Mukkamala, R.; Inan, O.T.; Hahn, J.O. Mitigation of Instrument-Dependent Variability in Ballistocardiogram Morphology: Case Study on Force Plate and Customized Weighing Scale. IEEE J. Biomed. Health Inform. 2020, 24, 69–78. [Google Scholar] [CrossRef]
  52. Suliman, A.; Carlson, C.; Warren, S.; Thompson, D. Performance Evaluation of Processing Methods for Ballistocardiogram Peak Detection. In Proceedings of the 2018 40th Annual International Conference of the IEEE Engineering in Medicine and Biology Society (EMBC), Honolulu, HI, USA, 17–21 July 2018; pp. 502–505. [Google Scholar] [CrossRef]
  53. Lee, W.; Yoon, H.; Han, C.; Joo, K.; Park, K. Physiological Signal Monitoring Bed for Infants Based on Load-Cell Sensors. Sensors 2016, 16, 409. [Google Scholar] [CrossRef] [PubMed] [Green Version]
  54. Brüser, C.; Winter, S.; Leonhardt, S. Robust inter-beat interval estimation in cardiac vibration signals. Physiol. Meas. 2013, 34, 123–138. [Google Scholar] [CrossRef] [PubMed]
  55. Sadek, I.; Biswas, J.; Abdulrazak, B.; Haihong, Z.; Mokhtari, M. Continuous and unconstrained vital signs monitoring with ballistocardiogram sensors in headrest position. In Proceedings of the 2017 IEEE EMBS International Conference on Biomedical & Health Informatics (BHI), Orland, FL, USA, 16–19 February 2017; pp. 289–292. [Google Scholar] [CrossRef] [Green Version]
  56. Cocconcelli, F.; Mora, N.; Matrella, G.; Ciampolini, P. Seismocardiography-based detection of heartbeats for continuous monitoring of vital signs. In Proceedings of the 2019 11th Computer Science and Electronic Engineering (CEEC), Colchester, UK, 18–20 September 2019; pp. 53–58. [Google Scholar] [CrossRef]
  57. Garcia-Gonzalez, M.A.; Argelagos-Palau, A.; Fernandez-Chimeno, M.; Ramos-Castro, J. A comparison of heartbeat detectors for the seismocardiogram. In Computing in Cardiology; IEEE: New York, NY, USA, 2013. [Google Scholar]
  58. Goldberger, A.L.; Amaral, L.A.N.; Glass, L.; Hausdorff, J.M.; Ivanov, P.C.; Mark, R.G.; Mietus, J.E.; Moody, G.B.; Peng, C.K.; Stanley, H.E. PhysioBank, PhysioToolkit, and PhysioNet. Circulation 2000, 101. [Google Scholar] [CrossRef] [PubMed] [Green Version]
  59. Choudhary, T.; Sharma, L.N.; Bhuyan, M.K. Automatic Detection of Aortic Valve Opening using Seismocardiography in Healthy Individuals. IEEE J. Biomed. Health Inform. 2018. [Google Scholar] [CrossRef] [PubMed]
  60. Luu, L.; Dinh, A. Using Moving Average Method to Recognize Systole and Diastole on Seismocardiogram without ECG Signal. In Proceedings of the 2018 40th Annual International Conference of the IEEE Engineering in Medicine and Biology Society (EMBC), Honolulu, HI, USA, 17–21 July 2018; pp. 3796–3799. [Google Scholar] [CrossRef]
  61. Khosrow-khavar, F.; Tavakolian, K.; Menon, C. Moving toward automatic and standalone delineation of seismocardiogram signal. In Proceedings of the 2015 37th Annual International Conference of the IEEE Engineering in Medicine and Biology Society (EMBC), Milan, Italy, 25–29 August 2015; pp. 7163–7166. [Google Scholar] [CrossRef]
  62. Laurin, A.; Khosrow-Khavar, F.; Blaber, A.P.; Tavakolian, K. Accurate and consistent automatic seismocardiogram annotation without concurrent ECG. Physiol. Meas. 2016, 37, 1588–1604. [Google Scholar] [CrossRef] [Green Version]
  63. Landreani, F.; Golier, D.; Hossein, A.; Rabineau, J.; Van de Borne, P.; Caiani, E.; Migeotte, P.F. Heartbeat Detection Using Three-Axial Seismocardiogram Acquired by Mobile Phone. In Proceedings of the 2018 Computing in Cardiology Conference (CinC), Maastricht, Netherlands, 23–26 September 2018; pp. 1–4. [Google Scholar] [CrossRef]
  64. Thakkar, H.K.; Sahoo, P.K. Towards Automatic and Fast Annotation of Seismocardiogram Signals Using Machine Learning. IEEE Sens. J. 2020, 20, 2578–2589. [Google Scholar] [CrossRef]
  65. Paalasmaa, J.; Toivonen, H.; Partinen, M. Adaptive Heartbeat Modeling for Beat-to-Beat Heart Rate Measurement in Ballistocardiograms. IEEE J. Biomed. Health Inform. 2015, 19, 1945–1952. [Google Scholar] [CrossRef] [Green Version]
  66. Yu, Y.; Bruser, C.; Pietrzyk, U.; Leonhardt, S.; van Waase, S.; Schiek, M. Model-Based Verification of a Non-Linear Separation Scheme for Ballistocardiography. IEEE J. Biomed. Health Inform. 2014, 18, 174–182. [Google Scholar] [CrossRef]
  67. He, Z.; Wang, M.; Xie, Q.; Wang, G.; Zhao, Y.; Lian, Y.; Meng, B.; Peng, Z. A Heart Rate Measurement System Based on Ballistocardiogram for Smart Furniture. In Proceedings of the 2018 IEEE Asia Pacific Conference on Circuits and Systems (APCCAS), Chengdu, China, 26–30 October 2018; pp. 151–154. [Google Scholar] [CrossRef]
  68. Alvarado-Serrano, C.; Luna-Lozano, P.S.; Pallàs-Areny, R. An algorithm for beat-to-beat heart rate detection from the BCG based on the continuous spline wavelet transform. Biomed. Signal Process. Control. 2016, 27, 96–102. [Google Scholar] [CrossRef]
  69. Nurmi, S.; Saaresranta, T.; Koivisto, T.; Meriheinä, U.; Palva, L. Validation of an Accelerometer Based BCG Method for Sleep Analysis; Technical Report; Aalto University: Espoo, Finland, 2016. [Google Scholar]
  70. Wang, X.; Meng, J. A 2-D ECG compression algorithm based on wavelet transform and vector quantization. Digit. Signal Process. 2008, 18, 179–188. [Google Scholar] [CrossRef]
  71. Wang, X.; Meng, J. Wavelet-based hybrid ECG compression technique. Analog. Integr. Circuits Signal Process. 2009, 59, 301–308. [Google Scholar] [CrossRef]
Figure 1. (a) Electrode and accelerometer placement for datasets SCG-1 and SCG-2; (b) hardware acquisition setup for datasets SCG-1, BCG-1 and BCG-2; (c) BCG-1 dataset measurement protocol; (d) BCG-2 experimental setup, featuring two accelerometers. The reference system of the accelerometers is shown in each setup.
Computers 09 00041 g001
Figure 2. Block diagram of Algorithm 1 with graphical plots of main signals and operations (the example refers to ballistocardiogram (BCG) waveforms).
Computers 09 00041 g002
Figure 3. Box-plots of scored performance metrics: (a) sensitivity, (b) precision, (c) RMSE, (d) MAE.
Computers 09 00041 g003
Figure 4. Kernel Density Estimates (KDE) of annotation errors e i defined in Equation (4): (a) SCG-1, (b) SCG-2, (c) BCG-1, (d) BCG-2.
Computers 09 00041 g004
Figure 5. Kernel Density Estimates (KDE) of annotation errors e i for dataset BCG-2, split by resting position: (a) supine, (b) left side, (c) right side.
Computers 09 00041 g005
Figure 6. Bland–Altman plots of t R R , t C C agreement: (a) SCG-1, (b) SCG-2, (c) BCG-1, (d) BCG-2.
Computers 09 00041 g006
Table 1. Summary of the datasets considered in this study.
IDNrecFsBrief Description
SCG-113100 HzCustom SCG dataset of sitting subjects
SCG-220500 HzCEBS database: SCG of lying subjects
BCG-118250 HzCustom BCG dataset: bed frame 1
BCG-242500 HzCustom BCG dataset: bed frame 2, three lying position per subject
Table 2. Summary of average score and 10th Lowest Performance Percentile (LPP).
DatasetSensitivity (%)Precision (%)RMSE (ms)MAE (ms)
SCG-1
mean98.997.98.14.8
10th LPP96.296.38.25.7
SCG-2
mean98.598.64.53.3
10th LPP97.097.26.14.8
BCG-1
mean98.497.66.85.0
10th LPP96.795.010.67.9
BCG-2
mean98.998.54.83.6
10th LPP96.296.48.85.9
Table 3. Kruskal test for differences between lying positions in dataset BCG-2.
p a d j p a d j < 0.05 p a d j < 0.01
Sensitivity0.9057
Precision0.9677
RMSE0.7842
MAE0.5213
Table 4. Kruskal test for differences between datasets.
p a d j p a d j < 0.05 p a d j < 0.01
Sensitivity0.6290
Precision0.0663
RMSE0.0003***
MAE0.0036***
Table 5. Mann–Whitney significance tests for differences between datasets.
MetricDataset aDataset b p a d j p a d j < 0.05 p a d j < 0.01
SensitivitySCG-1SCG-20.1526
SCG-1BCG-10.2031
SCG-1BCG-20.1630
SCG-2BCG-10.4683
SCG-2BCG-20.4447
BCG-1BCG-20.4268
PrecisionSCG-1SCG-20.1514
SCG-1BCG-10.0534
SCG-1BCG-20.0634
SCG-2BCG-10.0514
SCG-2BCG-20.1591
BCG-1BCG-20.1507
RMSESCG-1SCG-20.0006***
SCG-1BCG-10.1422
SCG-1BCG-20.0083***
SCG-2BCG-10.0117*
SCG-2BCG-20.0686
BCG-1BCG-20.0502
MAESCG-1SCG-20.0121*
SCG-1BCG-10.4762
SCG-1BCG-20.0273*
SCG-2BCG-10.0117*
SCG-2BCG-20.1501
BCG-1BCG-20.0331*

