Abstract
This paper presents an online calculator for bank charges, motivated by information asymmetry in the market for payment accounts. The calculator provides users with a personalized list of the most suitable bank accounts based on required services and monthly fee criteria. This paper outlines the conceptual foundation, workflows, and matrix of the data for the underlying logic of the calculator, as well as the design of the user interface. The proposed calculator was validated by performing an interaction cost analysis. This paper presents a novel methodology for conducting this analysis, including rules for expressing interactions in graphs for the objective evaluation of the usability of the user interface. Scenarios were defined and analyzed with the intended goal of choosing the best bank account. The interaction cost analysis then confirmed the differences in cost between traditional approaches (interacting with various web interfaces) and using a specialized online service (the calculator). The consistency of the layout and navigation contributed significantly to the final results being in favor of the proposed bank charges calculator. These conclusions are applicable not just within the selected market, but also in many others that are prone to problems arising from price information asymmetry.
1. Introduction
In this study, two research areas were combined. The first is the topic of information asymmetry, as demonstrated in the market for payment accounts (PAs). Information asymmetry present in the PA market negatively influences optimal choice [1]. The second area is the issue of the interaction cost experienced when working with web user interfaces. This can be defined as the scope of user action (e.g., mouse clicks or typing) that is necessary to complete a task. Interaction costs negatively impact usability [2]. Therefore, in accordance with user experience (UX) principles, minimizing these costs as much as possible is important. One method of decreasing information asymmetry is through the provision of a specialized service, such as the online calculator presented in this paper. Now, it is possible to evaluate interaction costs in the context of its interface, and thus its usability for consumers.
The selected PA market is unique because information asymmetry exists with regard to the price rather than general product features, such as components, available accessories, or dimensions. Price information asymmetry exists in countries with more complex and opaque PA tariffs, such as the Czech Republic. The Czech banks’ tariffs usually include multiple conditional sales, as well as many items representing separate fees. The possibility of a consumer obtaining a market overview is diminished by natural tariff changes that occur irregularly at least once per year. In this situation, consumers can significantly benefit from comparison tools such as the proposed calculator. This simultaneously provided an excellent opportunity for research, because consumers willingly provide their unique personal usage records in the process. In a previous work, our research was based on such data, and we performed retail consumer segmentation using two-step cluster analysis [3], followed by a choice optimality study [1], considering the varying influence of geographical preference and desired price modeling [4] based on the current price distribution. Other markets share certain characteristics with the PA market, such as mobile tariffs, cloud services, internet connection, and so on. These are, however, usually not as complex. The shared characteristics among these markets indicate that they are homogenous, differing only by price, that is, with respect to price construction, which is usually quite complex or obscure, leading to the problem of price information asymmetry. Price complexity in homogenous markets is a known problem. Producers of retail financial products foster ignorance by making their prices more complex [5]. Price differences and levels have an effect on buyers’ susceptibility to making sub-optimal choices [6].
The purposes of this study were several. The main goal was to revise and validate the original proposal for the banking fees calculator. This unique online service is under development by our university, and was first introduced at the EMCIS conference [7]. The application was launched for the Czech environment [8]. It offers a personalized overview of suitable bank accounts for a particular user based on the aggregated data of the calculator, data input by the user, and calculations performed on these data. As a result, by eliminating the differences with respect to price complexity, the consumer is able to make a well-informed decision regarding the best bank account available to them.
The goal of revision and validation would be considered to be accomplished if the results showed that the new proposal is more usable than the traditional approaches, for example, by saving consumer time and effort when delivering the desired results. The tested hypothesis is that the use of the calculator is less costly, that is, more usable, for consumers in comparison with other approaches. As this hypothesis was confirmed by the testing we conducted, the calculator can be considered a valuable contribution to reducing information asymmetry in the PA market. The principles for the construction of this calculator can be reused in implementations in other sectors that share characteristics with the PA market, as discussed above.
Interaction cost analysis was selected as a method for the purposes of usability testing. This method was first introduced by Hong et al. in their proposal for a low-cost tagging system [9], where “cost” refers to the interaction cost, which was discussed above. We presented an extended version of this analysis to illustrate the high interaction cost of ineffective navigation schemes [10]. For the purposes of this study, the interaction cost analysis was extended even further, thus creating a methodology for determining the possibility of the calculator’s reuse in other scenarios. This can be considered the second main goal and also an accomplishment of this study. Interaction cost analysis is proposed as a tool for the objective evaluation of the usability of a user interface, with rules for expressing interactions in graphs. The analysis can be used to compare the usability of existing interfaces (websites, systems, services, and so on) and new approaches. Higher costs might indicate possible issues related to user interface design, structure, and underlying logic. The methods most widely used for measuring usability include user testing, inspection, and inquiry [11], that is, they are all subjective methods. The proposed analysis can be used for measuring the objective usability of any user interface. This is a significant contribution, as subjective assessments are not always reliable or consistent [12].
Finally, by conducting the proposed interaction analysis, the calculator’s usability was confirmed. Therefore, this service can be recommended for finding the most suitable account for a particular user. The calculator benefited from the unified user interface. The benefit of finding all of the information in one place led to a reduction in the related attention-switching cost. This knowledge can be used to develop similar applications to reduce the information asymmetry present in other markets that exhibit high price complexity.
The rest of the paper is organized as follows. Section 2 introduces the state-of-the-art with respect to both of the main research areas (information asymmetry in the PA market, and usability and interaction cost). The conceptual foundation specifies the goal and the strategies for reaching this goal, resulting in a definition of the scenarios that were tested. The accuracy and completeness of different strategies are considered. The interaction cost analysis is divided into two sections, corresponding to before (Scenario 1) and after (Scenario 2) the introduction of the calculator. The first part includes a comprehensive methodology and cost analysis for Scenario 1. The second part continues with the cost analysis for Scenario 2 and a presentation of all of the results along with a discussion. The paper is concluded by final thoughts and propositions for future research.
2. Background
2.1. Comparison Tools and the Deployment Area Specificity
Online comparison tool applications (CT or CTs in plural) provide the ability to compare and contrast products. This comparison is based on a variety of criteria or using at least one criteria filter—price. Price comparison agents belong to a shopbot applications category along with other similar tools, such as shopping agents and shopping robots, as described by Zhu et al. [13]. However, this methodology deals with applications that are not deployed for a market of services with many tariff items. They can add services to a cart and change various features of a base product, but PAs are a specific case along with services like mobile phone or internet connection providers. Therefore, tools for their comparison differ, as do their designs. Regardless of focus, all such applications have a single purpose: to reduce an information asymmetry.
Information asymmetry is present in the PA market, which negatively influences optimal choice [1]. The mathematical model of a consumer search for the optimal price of a PA under uncertainty [4] shows that the main issue concerning the price search is the marginal return on search. The traditional approach of a user’s own search is a time-consuming task (discussed in Section 3). In general, the problem is not the “digital shopping tour”. The most time and effort is spent on price calculation. Many banks exist in the Czech Republic, including different types of conditional sales. Some tariffs are almost atomized, charging for each service separately. Fees may vary accordingly to the chosen communication channel (phone, Internet, over the counter, and so on) not just when, for example, a standing order service is established, but also when the payment is executed. This is not common in developed countries. The search costs can be expressed as a product of an average minute wage and search time; see the work of [4] for the full methodology. To summarize the specific conditions, aside from consumer’s time value, cognitive and mathematical abilities, and so on, the search costs increase with the following: more PAs available; more complex pricing models; more pricing items, that is, atomization of tariffs; more consumers with maximizing instead of satisficing behavior; and when price distribution is more skewed to the left and consumer demands are lower than average.
The search costs increase drastically if we consider all the above and that all tariffs are subject to an irregular change. On the other side of our equation is savings. They are achieved by finding and opening a cheaper account. The variable that expresses this relationship is the expected net benefit of searching the set of options (as the difference between the expected maximum utility of searching the brands in the set and the cost of searching these brands) [14]. The general maximization rule then states that a user will continue the search until the expected marginal return from the search is greater than the marginal search costs. That is why, from a systematic point of view, shopbots exist—to make a search worthy by minimizing search costs.
Both academicians and legislative bodies admit and acknowledge the impact of CTs. From the academic point of view, shopbots have a positive impact on both price level and price dispersion [15,16]. Another study [17] that focused on pricing behavior by sellers on a price comparison site confirmed a strong negative relationship between the number of sellers monitored by comparison site and price. Legislative bodies of the European Union (EU) rely on CTs in information asymmetry reduction on the retail banking market. The Payment Account Directive (Chap. II/Art. 7, European Parliament) states the duty to offer consumers of each member country at least one CT through a special website list of the local supervisory authority. CTs are one of the main tools used to address another negative effect of information asymmetry: the consumer mobility barrier. The low level of mobility of consumers with respect to retail financial services is, to a large extent, the result of the lack of transparency and comparability with regards to the fees and services on offer [18].
2.2. Comparators and Calculators
Comparators and calculators are both online digital services for end-users who seek help in deciding which bank account would be the best for their needs. These two services are different in both their design and implementation. The characteristics of the consumers who use them are different. On the basis of the definition of maximizers and satisficers, we assume that comparators would be used more by satisficers and calculators by maximizers. Satisficers settle for the “good enough” option (e.g., bank account), whereas maximizers strive to make the best possible choice [19,20]. Although many comparator services exist, calculators are scarce in some countries or even non-existent. However, the population consists of both of these characteristics [21]. Therefore, I would like to promote the use of calculators.
Comparators are only lists of bank accounts from the view of user interface. They are not web applications from the implementation point of view, only static web pages. Some of them, however, provide useful sorting options or predefined lists, so a consumer can quickly acquaint themselves with the essential characteristics and charges of individual accounts. Usually, some basic categorization or filtering is offered, for example, basic, business, students, suitable for an overdraft (i.e., according to the most used service), high interest. Subsequent sorting is conducted, for example, according to the monthly or yearly fee, maximum interest, minimum monthly credit, authorized or unauthorized overdrafts, and so on. Examples of comparators are summarized in Table 1.

Table 1.
Examples of comparators of bank accounts.
Calculators perform a calculation of individual banking fees and, as such, usually provide more detailed, accurate, and personalized information. However, to obtain personalized information, the user has to provide some input data about using their account or choose between several predefined scenarios.
2.3. User-Friendly Web Interfaces
The development of the calculator was based on respecting web design principles, user experience (UX), usability, and similar concepts. UX is commonly recognized in the field of human–computer interaction (HCI), which deals with the user´s entire interaction, feelings, and perception [22] and, as such, overlaps usability concept. It can also be defined as the emotions that the user experiences when using a service, product, or application [23]. Aesthetics, usability, and content are three main design categories that influence each other, and they are all incorporated in the overall user experience and preference [24]. Many studies investigated a connection mostly between usability and aesthetics [25].
Lidwell et al. [26] stated that the designs that help people perform optimally are often not the same as the designs that people find most desirable. The designs that should be preferred largely depend on the type of particular website/web service and its purpose, and on user behavior; particularly, we distinguish between exploratory- and goal-oriented online behavior [27]. Similarly, with web searches, there are two commonly recognized types of search tasks: lookup search and exploratory search [28]. Ellonen et al. confirmed that consumers tend to visit the website in a goal-oriented manner [29]. This trend is even more profound in the case of online services with a usually straightforward process. Goal-oriented is, in the case of web user interfaces, associated with a greater impact on usability. Therefore, web service development should reflect web design principles, which enhance usability. Generally, a user interface should be intuitive and easy to use [30].
The problem of accessibility is tightly connected with usability. The Web Content Accessibility Guidelines (WCAG) is a technical standard with a goal to increase the accessibility of web content for people with disabilities [31]. The last update of this standard was WCAG 2.1, published in 2018, 10 years after WCAG 2.0. The calculator attempts to fulfill these recommendations as well, considering those classified as Levels A and AA. In previous work, we tested a legibility aspect of accessibility as a part of an evaluation of Learning Management Systems (LMS) [32]. With the help of a color contrast checker, we revealed that headings in LMS Blackboard Learn (default scheme) have insufficient contrast according to both Levels AAA and AA. However, many other usability aspects are not considered in accessibility guidelines, for example, concerning readability, line length, or typeface characteristics. Many aspects have been included in the WCAG 2.1 update, such as line height or spacing.
2.4. Usability, Navigation, and Search
Usability can be explained as the ease of web browsing for a user with a specific purpose [33]. Whereas the beauty concept from the UX concept is overall subjective and not measurable (except for purely subjective user´s evaluations), usability can be either objective or subjective [34]. Objective means precise measurements of user performance (e.g., task time, number of errors), whereas subjective means perceived or experienced usability (how easy to work with web/service) [35]. No significant correlation was found between ratings of expected usability and objective usability evaluations [36]. Therefore, objective usability metrics, such as interaction cost, can be considered as more reliable indicators of interaction quality and efficacy regarding online services.
The usability of the user interface depends considerably on its layout. The layout is how all the elements of the interface are arranged. According to Horton, the most important characteristic of a layout is that users find it predictable [37]. This predictability requirement corresponds with consistency, which reduces cognitive effort [38]. A consistent approach to layout and navigation allows users to adapt quickly to design and to predict the location of information [39]. Therefore, I promote online aggregator services in this paper because they gather information from more sources in one consistent environment.
Navigation is another important aspect of the usability of any website [40], user interface, system, or online service. Searching is an alternative to navigation. However, even though web searches are powerful, they are no substitute for a coherent site architecture [39]. Users often do not know what they should look for, or they express it in a way that will not find the desired information. Lookup search is performed to find a specific item and is considered relatively simple. More complicated search tasks are called exploratory and require multiple searches interwoven with browsing and analysis of the information [28]. This indicates that searching alone is often insufficient, and the user still needs to work with the navigation structure. Therefore, I considered both in the interaction analysis.
2.5. Interactions and Interaction Cost
As Lam pointed out, typical user studies seldom explicitly measure or even identify interaction costs [2]. The definition in Lam’s research is thus adopted from an older study of Winograd and Flores: “an interaction cost is when the dialogue between users and system breaks down, or where users face enough difficulty accomplishing tasks to become aware of the user interfaces as obstacles to be overcome” [41]. The interaction itself is defined as “action from a user that causes visible changes in the visualization” [2]. In Lam´s research, only observable interaction is considered, ignoring non-action communications (e.g., eye-gazes) and unsolicited system actions (e.g., alerts).
Later, Hong et al. identified two types of cost in HCI: interaction cost (mouse clicks, button presses, typing) and attention-switching cost (from one window to another) [9]. Both types are similar to the interaction cost types defined by Lam. The interaction cost is a similar concept to Lam´s “physical-motion costs to execute sequences”, whereas the attention-switching cost corresponds to “view-change costs to interpret perception”.
In the preceding research, we specified a range of usability issues related to inefficient navigation schemes, such as broad and vague categories, poor organization of navigation links, deep nesting, duplicities, and many navigation areas [10]. Further issues related to navigation were identified as disorientation, subjectivity, or lack of descriptiveness [42]. All these issues increase interaction cost. Higher interaction cost is associated with longer interaction time and a higher number of errors and, consequently, attention-switching cost is higher as well [10].
3. Conceptual Foundation
3.1. How to Choose the Best Bank Account
We first explore the possible options for a consumer who wants to choose the best bank account. The behavior of this consumer will be goal-oriented, with the goal of finding the most suitable bank account that fits their needs, requirements, lifestyle, and habits. This scenario is specific for the PA market; however, it can be easily modified to fit other segments with similar characteristics, such as mobile tariffs or Internet providers.
Many factors contribute to the label being “the best” in the eyes of the particular consumer at a given time. The objective factors for bank accounts are as follows: availability of required services (i.e., if the bank account offers the service) and parameters of the required services, including a fee for this service
The decision also depends on the search procedure. The means of obtaining information via the Internet about bank accounts can generally be achieved via the following channels: (1) on the individual banks´ websites, repeated for each bank in which a consumer is interested, followed by an analysis and conclusions of gathered information; (2) by online services, specifically comparison tools applications, such as comparators of bank accounts or calculators of banking fees; and (3) other sources—financial advisor websites, online magazines, forums, and so on—that can be classified as electronic word of mouth (e-WOM), which has become an important source of information for consumers, depending on its credibility [43].
The outcomes of all these scenarios depend considerably on invested time and effort. For example, regarding case (1), a difference would exist if inquiring only at one bank´s office or if exploring the offers of 10 banks. The more we extend our research, the more time and effort the process consumes, as is typical for all decision-making tasks. The next sections elaborate more on two selected scenarios. The third option (e-WOM) is omitted from further analysis, as the possibilities are too vast and different from each other simultaneously, that is, they consist of highly unstructured and unorganized data. The amount of these data has grown since it became common for users to share information about individual experiences and opinions via the Internet, for example, via social networks [44]. This information is, however, mostly subjective and not always reliable or useful.
3.2. Scenario 1 Breakdown
Assuming that a consumer uses the internet to find the information they need about bank accounts, let us consider four options discussed in the previous section.
In the first scenario, consumers search for information on banks´ websites, that is, gather information directly from the source without any intermediary. Therefore, this scenario can be considered the most reliable regarding the accuracy and completeness of information, as bank account providers need to keep their websites, including tariffs, up to date. This scenario is consequently included in the interaction cost analysis as “Scenario 1”. This scenario includes three phases of looking for information:
- (1)
- Phase 1: Looking for a price list on the bank´s website, repeated until exploring all considered bank accounts in which the consumer is interested involving two possible strategies, an example, and interaction cost analysis, as shown in Figure 1;
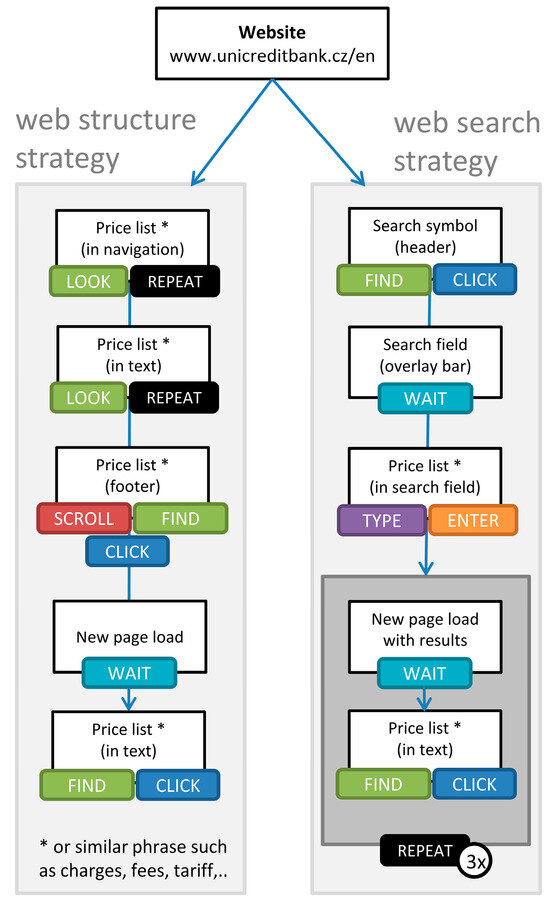 Figure 1. Scenario 1 Phase 1: Looking for a price list on the individual bank´s website, with an example presented from the UniCredit Bank website.
 - (2)
- Phase 2: Looking for availability of services and respective fees in the price list, repeated until finding all considered services and fees, with two possible strategies, an example, and interaction cost analysis, as shown in Figure 2;
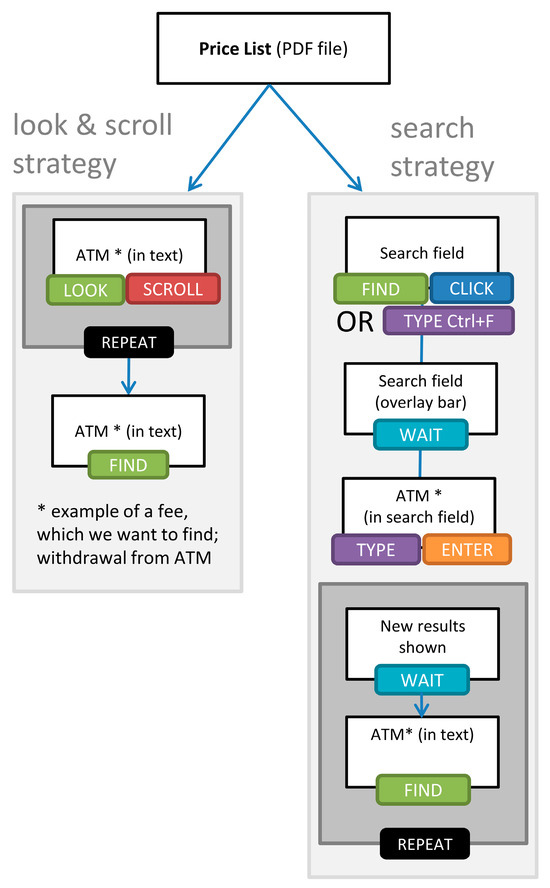 Figure 2. Scenario 1 Phase 2: Looking for particular services and fees in the price list, with an example from the UniCredit Bank price list and Automated Teller Machine (ATM) withdrawal service.
 - (3)
- Phase 3: Performing rough manual calculation to determine which bank account would be the best, that is, the most favorable for the consumer´s needs.
The presented phases have a fixed sequence, and will all be performed to reach the desired information. Phase 1 represents the first necessary step, which is finding the price list on the bank´s website. This price list can be in the form of a PDF document, which can be displayed, downloaded, or printed. Alternatively, the price list is presented as website content with a possible navigation structure. In the Czech environment, a simplified price list is usually provided on the website and the complete document is available for download. Phase 2 follows directly after the first, with the initial condition of the successful retrieval of the price list. In this price list, a consumer can find further information about the desired services including if they are offered and at what price. To do so, a complete price list must be found, not the simplified list. With all the gathered data, the consumer is presumed to firstly exclude the accounts that do not fit their requirements. From the set of satisfactory bank accounts (that offer all the desired services), which are considered homogenous in this context, the consumer is expected to choose according to the price. At this moment, the result largely depends on the invested time and effort, and major differences exist between satisficers and maximizers. To conclude, the maximizers invest more time into the calculation of expected price and, consequently, their choice will be better than that of satisficers.
3.3. Scenario 2 Breakdown
The second scenario is represented by CTs. The importance of comparators and calculators as online services for banking fees is indisputable when consumers are looking for the best account for them. However, the commonly used comparators suffer from several shortcomings. Time and effort can be saved by obtaining a quick overview of available options (i.e., bank accounts) presented by the comparator service. The best option can be selected immediately; however, the user cannot be sure that their decision is grounded on reliable data. The reliability of the information provided depends on each particular comparator provider, as well as the completeness and accuracy of the data. Two possible problems exist: (1) the frequency of updates, that is, how often the comparator data are updated according to changes in conditions offered by individual banks, differing for each bank account; and (2) the range of presented information, that is, how much information can be obtained from the comparator; data that would influence the decision may not be included in the comparator overview.
I analyzed the frequency of updates for comparators listed in Section 2.2. Information on the last update was only available at www.which.co.uk, which was not satisfactory. When last analyzed on 14 July 2019, the last updates occurred between January and May 2019, differing for each subsection under the general section “Best bank accounts”. As with the other comparator services, I could not determine the date of the last update.
Considering the range of presented information, I also present an example, demonstrated on “first direct 1st Account”. Information about this account can be found on various websites. Via Moneysupermarket comparator, a user can learn about £10 account fee per month (unless you pay in £1000+ per month) for this account. On Uswitch, however, a user finds that there is no account fee. Finally, at the official website of Firstdirect, a user can learn about the monthly fee, but also that many more possibilities exist to avoid paying this fee. In conclusion, none of the information provided by the comparator service was entirely correct. Both were missing essential information, thus deepening the problem with information asymmetry, which we attempted to eliminate with the presented calculator service.
In general, if an aggregation service is used, simplification to some extent can be expected, along with the possible distortion of results. Therefore, whereas satisficers might stop here and be satisfied, maximizers continue their search, preferably to the source of the information, that is, exploring all considered bank accounts on individual bank´s websites (Scenario 1).
Calculators can also suffer from inaccuracy. The range of data is usually not the issue because it has to be much wider owing to the performed calculation in comparison with comparators. The problem of regular updates remains, even strongly with calculators, as actual numbers (usually fees) change more often than general conditions, by which comparators are usually limited. Because a calculator is proposed in this study, I chose calculator over comparator for both further analysis and development. The presented calculator aspires to offer precise and personalized results to the consumer.
The second option is consequently specific to the usage of the calculator service, as in Scenario 2. The interaction cost analysis was performed on the calculator presented [7] in this paper, see URL [8]. With the calculator, a consumer can choose between using a metadata strategy or calculation strategy. The strategies are explained in more detail in Section 6.1 after introducing the calculator.
This calculator is not the first of its kind, though calculators of banking fees are rare. The novelty of this calculator lies in its scope, robustness, performance, and range of data useful for a user. On the basis of these data, a consumer can make a well-founded decision about suitable bank accounts. I do not have any knowledge of a calculator as complex as this one, neither in range of administered data nor the extent of useful feedback for the consumer.
4. Interaction Cost Analysis Part 1
In this section, graphs of interaction cost analysis are presented for strategies of Scenario 1 discussed above. Scenario 2 (with a calculator) is presented in Section 6.1, after introducing the calculator itself. The test was whether Scenario 2 is more usable than Scenario 1. The methodology for the performed interaction cost analysis is first considered. Its usage is then demonstrated on a combination of exploratory and search tasks involved in the selected goal, which is answering the question “which bank account is the best for me?” for individual users based on their requirements and needs.
Generally, using this analysis, we can explore available web-based strategies and decide which one is the most efficient. The development of web services can be justified over traditional procedures. In other words, the analysis can be used both during the development process of specific web service and for comparison of existing websites and/or web services. In the previous research, my colleagues and I proposed a web integrated navigation extension [10]. Its main goal was to reduce an interaction cost by providing a united consistent environment.
4.1. Methodology
The interaction cost analysis used in this study was originally based on the concept presented by Hong et al. about interaction cost [9]. The authors presented a simple cost analysis that described an interaction between the user and web interface. In this analysis, only one type of box was used along with text descriptions of the user action, not classified into individual actions. My colleagues and I enhanced several methodology aspects of this simple analysis in our previous study [10]. These aspects can be summarized as follows: (1) each white box represents a navigation link to a new page or view; (2) parentheses in white boxes contain information about the placement of the particular link on the webpage; (3) arrows signify the direction of the user browsing process; and (4) smaller colored oval boxes represent the user action(s): click, scroll, hover, type, and enter (submitting search form either by clicking or pressing a key).
Each page loading requires switching attention, thus increasing the attention-switching cost. Actions, conversely, increase interaction cost, by clicking, typing, or pressing buttons. Scrolling, which was not mentioned in the analysis by Hong et al., could pertain to both as this action requires both interacting and switching [10]. The cost analysis from our previous study does not explicitly depict two actions: “switch attention to the new page” and “look up the right navigation link”. Switching attention to the new page usually follows after clicking the navigation link and pressing “enter” in the search form. Looking up the right link follows after loading a new page if a search is not used instead, and can be performed simultaneously with scrolling.
In this study, I applied some changes and extensions to the previously implemented methodology. Particularly,
- (1)
- Each white box now represents not only a navigation link, but either whole new loaded webpage or some element on this webpage.
- (2)
- Parentheses in white boxes still contain information about the placement of the element on the webpage, but only if applicable.
- (3)
- Arrows still signify the direction of user browsing process; however, I have added the “repeat” action, which signifies repeating the particular action or set of actions before moving to the next action (in the original research by Hong et al., this mechanism was depicted by a round return arrow).
- (4)
- Previously omitted actions of attention switching cost, that is, wait for “switch attention to the newly loaded page/view” and look/find for “look up the right link/text/element/content” were added to the tracked interactions.
The final set of actions is listed in Table 2. To each action, information had been added by which cost is the action defined. Mouse drags (e.g., the work of [2]) are not considered, as the tested interfaces did not offer such a choice.
Table 2.
List of used interactions.
4.2. Cost Analyses for Scenario 1
The general idea of Scenario 1 was already described in previous sections. The breakdown of its phases and strategies is shown in Figure 3. Individual strategies are now discussed in more detail, that is, their interaction analysis. For a demonstration of Scenario 1, the internationally known bank UniCredit was selected. In Phase 1, the interaction analysis began on this Unicreditbank´s website to look for a price list (Figure 1). In Phase 2, the price list found in the previous phase was used to look for particular services/fees (Figure 2). To explore all possibilities, the consumer needs to repeat all three phases for each chosen bank account for consideration in their decision-making, as is depicted in Figure 1. One bank with one website can offer more than one bank account. However, the majority of bank accounts are from different bank institutions, which means different web interfaces and differently designed price lists. As discussed in Section 2, consistency of layout and navigation reduces the effort in finding information. The strategies in Scenario 1 mostly cannot benefit from this consistency. Layout and navigation are usually different for each bank account from different bank institutions. The interaction analyses are displayed in Figure 1 and Figure 2.
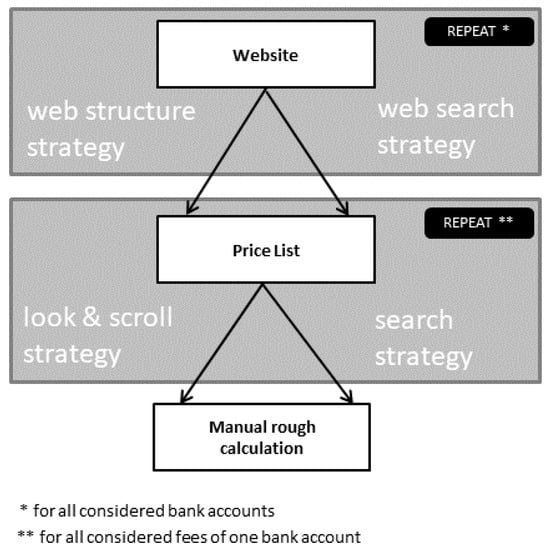
Figure 3.
Scenario 1 with a breakdown of phases and strategies: looking for accounts, services, and fees via banks´ websites.
The figures above show that this scenario is demanding on user time and effort. If conjoint usage of a comparator service is considered, as was described earlier, the costs for a user may be both higher or lower. Costs are higher if a maximizer user wants to explore all accounts individually after obtaining basic information with a comparator. Costs are lower if a satisficer user explores only some accounts in more detail, which they like the best based on the comparator overview.
The next section proposed the novel calculator service. After examining this solution more closely, the interaction cost analysis is demonstrated for the calculator scenario in Section 6.
5. The Calculator Design and Implementation
A new online service for calculating banking fees is introduced in this section, specifically its conceptual design, information architecture, and user interface. This calculator service is being developed at the University of Hradec Králové in the Czech Republic. It was originally implemented for the Czech environment; however, the user interface was translated for the purposes of this study [4]. The main purpose of the calculator is to provide users with logically structured information about all local bank accounts that fulfil their requirements. The bank accounts are sorted by the total sum of fees, which is calculated from data provided by the user. This calculator manages data about all bank accounts on the local market (Czech Republic). The data are regularly revised, which includes adding newly offered accounts, deleting no longer valid accounts, and updating all numbers and other data of each registered bank account.
By introducing workflows in the following section, the multidimensional use of the calculator is stressed. The benefit for each individual user is straightforward—help with reaching the goal of finding the best bank account for their personal needs. Then, all the data input from users can be used for consequent analyses of user behavior regarding bank services. The final result is a user profiling in the area of using bank services.
5.1. Workflow for One User
When considering the calculator from a user´s point of view, the goal is finding the best account for the particular consumer. After loading the calculator website, the calculator form is displayed to the user. Figure 4 shows the user interface of the calculator form. The questionnaire consists of always-displayed and conditionally-displayed sections. The latter are dependent on previously input information, for example, if a user does not use telebanking, the section with questions about telebanking usage is omitted. This was implemented to help users move efficiently through the form. All fields are optional. However, to obtain more precise and complete results, users are advised to fill in as much information as possible. The information asked in the calculator form can be divided into three categories: (1) bank services they use (or want to use), that is, required services; (2) how often they use (or want to use) these services, that is, expected frequency of use, applicable, for example, for ATM withdrawals, not all offered services; and (3) additional questions about a user or their behavior, which could yield benefits or fee discounts in some bank accounts (e.g., discounted monthly fee if the user is under a specified age or if maintains sufficient credit).
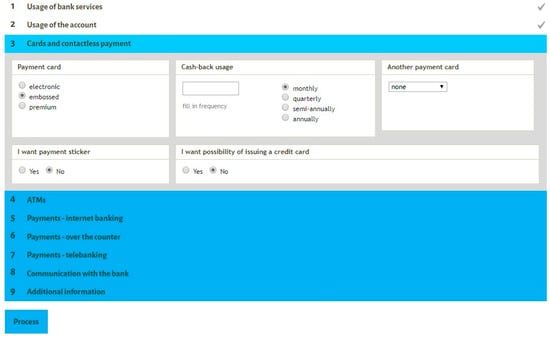
Figure 4.
Screenshot of the user interface of the calculator form.
After the user completes the form, they can submit the form and send filled in data to the server. The calculator then performs an extensive calculation over the accepted data, using both this matrix of user data and data about bank accounts from the database. The data from different types of bank accounts correspond with data required from the user, as shown in Figure 5. Several categories of data can be distinguished, which are managed for each bank account, registered in the calculator: the service availability, which reflects if the particular bank account offers the service; the service fee affected by if the service is available, which contains a specific sum of money, and is either fixed or paid periodically monthly or yearly; and advantageous conditions including discounts and benefits based on a particular condition or set of conditions (and/or).
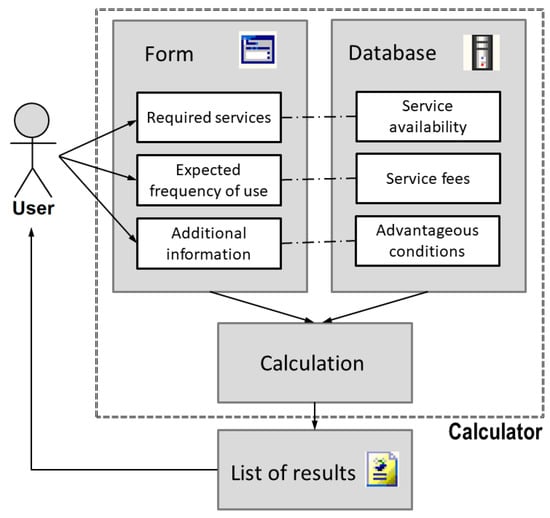
Figure 5.
Simple workflow of interactions between a user and the calculator.
The calculator performs the calculation and provides the user with a list of results. Figure 6 depicts the user interface design. This list presents logically structured information of all bank accounts that the calculator registers. The bank accounts that satisfy all the input requirements are highlighted and sorted by the total sum of monthly fees. Figure 5 depicts the procedure as a workflow of interactions between a user and the calculator.
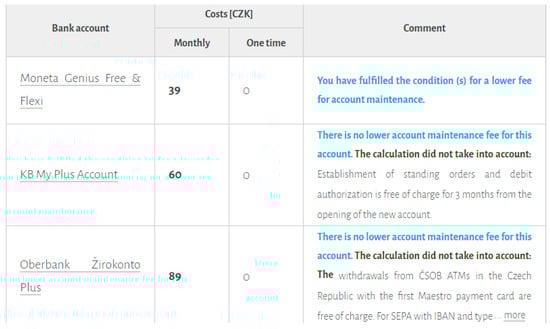
Figure 6.
Screenshot of the personalized list of results of the most suitable bank accounts.
The simple workflow described in the Figure 5 includes interactions of only one user with the calculator. This process accepts user input and combines it with existing bank account data. The result is a personalized list of bank accounts with additional information. For an individual user, the calculator service ends here.
5.2. Consolidation and Post-Processing of Results.
As the next step, workflows of individual users can be combined into the summarized workflow of the calculator service, as shown in Figure 7. Data from all users who used this calculator are saved for later use, such as an export of selected views. This export can be then used for analyses of user behavior (“post-processing”) and finally for useful user profiling in the area of using bank services. This can be used, for example, as feedback for financial institutions in understanding their clients, and hopefully could lead to better-designed services and price lists.
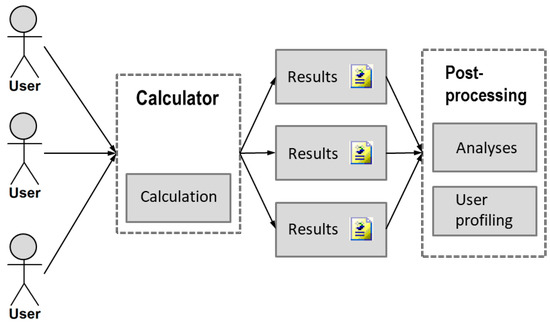
Figure 7.
Post-processing of calculation results from all users.
The post-processing analyses and user profiling can be accomplished in various forms. In previous research, we performed retail consumer segmentation [3], a choice optimality study [1], desired price modeling [4], and examined consumption variability. Exports from the proposed calculator service are designed for easy processing, and especially optimized for the syntaxes we prepared in IBM SPSS (IBM, Armonk, USA) to automatize routine data refining and supportive analyses.
5.3. Data Matrix
Bank account data correspond with data required from a user. However, individual items are only roughly mapped on each other, as summarized in Table 3. User data are extracted from a user via the calculator form. Data about bank accounts are stored in the calculator. Data cannot be downloaded and updated automatically from websites of bank institutions because all have their own website with a different environment, that is, design, navigation, terminology, and so on, and differently structured price lists. Therefore, the calculator has an administrator who manages bank accounts. They make changes according to bank notices and update data about individual bank accounts accordingly. Such manual processing can be viewed as a limitation; however, the conditions are not suitable for automation.
Table 3.
Matrix of data including categories and groups of usage inquiries received via form submission.
Finally, we needed to determine which data are required from users and which data are managed in the calculator for every bank account. The data matrix was constructed based on an extensive analysis of local bank accounts and user data retrieved from the previous research with my colleagues [1,3]. The data required from users are almost exclusively only the necessary data for calculation. Only a brief voluntary survey was added to the end of the questionnaire, which does not benefit the user, but was used with the intent to apply it in future research on this topic. Types of user data needed for the calculation are discussed in Section 5.1 and depicted in Figure 5, along with types of data about bank accounts.
Table 3 summarizes categories of usage inquiries and corresponding categories of bank account data items. Categories are different from the types of data mentioned above. Whereas types of data were aggregated according to their programmed logic, categories represent groups divided by topic. This categorization also reflects the navigational design of the user interface.
For bank accounts data, it is not possible to include all individual conditions, special offers, profitable packages, and unexpected or hidden fees of all bank accounts. A decision needed to be made about whether a given condition, offer, package, or fee would be implemented in the calculator logic or not. Usually, if more than one bank with a particular item occurred in the price list, it was included in the data matrix and, consequently, in the programmed logic. One bank´s specialties were omitted from the calculation; however, those found significant were included in the commentary of the relevant bank account.
Table 3 also shows that the numbers are not the same for each group. What causes this disparity? Every individual calculation requires different data for its course. Some calculations are similar, such as the calculation for common cash withdrawals, cash withdrawals at the counter, and cash withdrawals abroad. However, the majority of calculations are specific for each combination of user data and data about bank accounts. Sometimes, more data items on either side (i.e., either user inquiries or bank account items) are required. For example, regarding basic logic about cards, user data include the type of first card and optionally the type of second card, that is, two user inputs. However, 11 items are related to bank account data, including fixed fee, monthly fee, and number of free cards for every card type in the system (three types), creating nine fields in the database. Another two items are as follows: fixed fee and monthly fee related to the second card, rather than to the specific card type. Table 4 provides examples of user inquiries with answers, associated bank account data, and field values. “Y/N” is used for Yes/No option, “Int” stands for Integer, and “Null” for missing value.
Table 4.
Examples of user inquiries and bank account data.
Table 4 shows that a variety of question answer types are used, ranging from simple Yes/No to more complex. The so-far implemented version of the calculator is deterministic, which means it counts using a fixed number of service uses per month. Users can choose the number of uses for a period of time that they choose (monthly, quarterly, semi-annually, and annually); however, the application converts them into uses per month in accordance with monthly fees. Regarding the user interface and data gathered from users, the calculator was prepared for future upgrade to a stochastic version.
5.4. User Interface Overview
This section outlines an example of the user interface of the proposed calculator in Figure 7. A fully functional calculator service is running in the Czech environment [7,8]; its user interface was translated for this study. After receiving data from the user, the calculator provides this user with their personalized comparison of bank accounts, based on their filled-in values. The results depend on the particular user filling in values based on current usage or future requirements.
The displayed result is a well-organized list of all bank accounts, starting with the most suitable for this particular user (Figure 6). This list is based on the performed comparison of user data and bank account data such as service availability. The combination of service fees and usage patterns provided by the user is then calculated into numbers. The resulting list of bank accounts is then sorted by the final monthly fee for all required services. One-time fees are less frequent; they are used, for example, for issuing a new card or activating some service. The bank accounts that do not have the required services are sorted at the end of the list and distinguished by color and commentary stating that they are accounts that are not suitable.
6. Interaction Cost Analysis Part 2
After an overview of the calculator functioning, the performed interaction analysis is revisited in this section, this time for Scenario 2—use of the calculator service, followed by the detailed result, and comparison of both approaches.
6.1. Cost Analysis for Scenario 2
For Scenario 2 with the use of the calculator, two possible strategies are presented in Figure 8. “Using metadata strategy” involves looking up the information about bank accounts, the same as in previously analyzed strategies. In comparison with Scenario 1, however, this strategy benefits from a consistent interface that the consumer can use to look up the needed information much more efficiently than in the different environments for each bank. This strategy can be viewed as similar to classical comparators with some significant differences. First, the data are the same as required for calculation, and thus are kept as precise and up-to-date as possible. Second, the range of the presented data is much larger than what comparators usually offer.
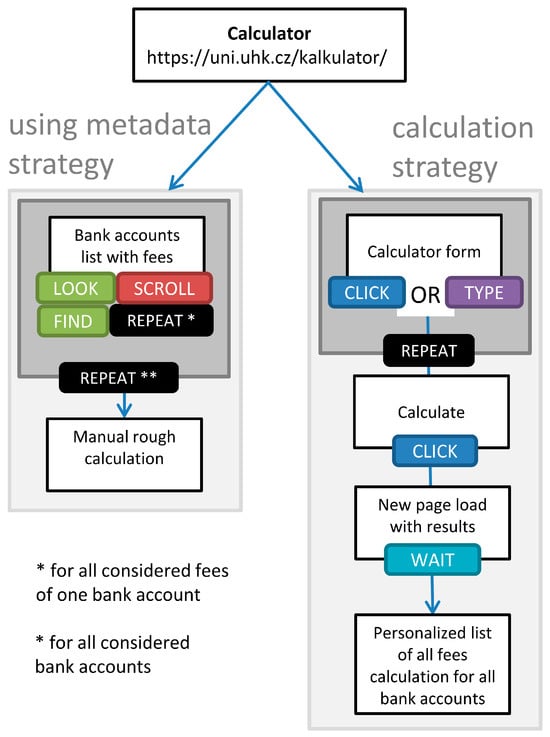
Figure 8.
Interactions for the scenario with the calculator [4].
Even more efficient is the calculation strategy, which is the main purpose of any calculator service. Some calculator providers do not even consider the first possibility, and thus hide processed data from users. To promote transparency of information and reduce its asymmetry, this calculator provides a view of the raw bank account data as well. Therefore, in the following summarizations, only this strategy is compared and the metadata strategy is omitted.
6.2. Conclusions of Performed Analyses
To summarize, two scenarios were suggested here: traditional (Figure 1) and with the calculator (Figure 8). The original hypothesis was that use of the calculator (Scenario 2) is more usable for the user, that is, with less interaction cost. In both scenarios, two possible strategies were proposed, as well as an analysis of performed interactions. In Scenario 1, the web structure and web search strategy in Phase 1, and look and scroll and search strategy in Phase 2, can be combined. In Scenario 2, we can choose between using metadata and calculation strategies. Table 5 combines these strategies to provide an overview of the whole process (i.e., finding which bank account is the best for a consumer). One row represents one method of processing the task, that is, task procedure.
Table 5.
Methods of processing the task “which bank account is the best for me?”.
Determining which strategy is faster or more convenient is challenging because this depends on the particular website and on the particular information being searched. All interactions have different values in terms of their effort and time demands, for example, the “Repeat” action is the most variable of presented interactions. According to Lam, even for simple movements such as mouse clicks, repeated actions can accumulate into measurable costs [2]. The “Repeat” action is not a typical interaction, but a combination of other interactions. The number of repeats depends on the following: (1) the success of the performed action, that is, repeat with slightly changed parameters until the goal has been reached (Figure 1, web structure strategy; Figure 2, both strategies); (2) the particular sequence of needed interactions (Figure 1, web search strategy; Figure 8, calculation strategy); and (3) repeating for every instance of the list/group (Figure 1, both repeats and strategies; Figure 8, metadata strategy).
Despite this ambiguity, some conclusions are still possible. We can divide the task procedures into two main groups according to the result of our efforts, that is, final evaluation of gathered information (Table 5). These evaluations include manual rough calculation and automatic precise calculation, which are different. Manual rough calculation is the expected result from all combined strategies of Scenario 1 (S1) and the using metadata strategy from Scenario 2 (S2). This means that the user has found to the information they need; however, there is too much to process, so they are only capable of a rough calculation. Manual processing consumes a considerable amount of time depending on the user´s requirements (how many services, how much they care about fees, how many accounts they want to choose from). Automatic precise calculation, which is the result of the calculation strategy of S2 (using the calculator service), is automatic and precise. It does not require any more time or effort from the consumer, except for the interactions listed in the Figure 8 calculation strategy, which is much more advantageous.
If the interaction cost analyses of S1 strategies and S2 calculation (S2C) strategy are further compared, several differentiations can be observed. Table 6, Table 7 and Table 8 provide summarized counts of all identified interactions as the basis for the conclusions. The list of used interactions and their classification to interaction cost or/and attention-switching cost in Table 2 should be re-examined. This information is in the column “Type of Cost” in the following Table 6, Table 7 and Table 8.
Table 6.
Used interactions for Scenario 1 Phase 1.
Table 7.
Used interactions for Scenario 1 Phase 2.
Table 8.
Used interactions for Scenario 2 with calculator.
On the basis of the summarized results of the interaction cost for all scenarios, some conclusions can be drawn. In this review, I omit the benefits of automatic precise calculation over manual processing required in manual rough calculation, which was discussed earlier in the text. I was only interested in the cost required for reaching the stated goal, that is, to answer the question “which bank account is the best for me?”. The result cannot be purely objective, but rather subjective, depending mostly on the consumer´s characteristics, needs, and resources, as discussed in Section 3.
Before the final evaluation, Figure 1, which depicts Scenario 1 with the breakdown of phases and strategies, should be reviewed. This graph conveys information that the whole process for Scenario 1 consists of one strategy from Phase 1 and one strategy from Phase 2. This means that for comparison with Scenario 2 (Table 8), the number of interactions for both phases of Scenario 1 needs to be summarized (Table 6 and Table 7). Table 9 outlines the possible combinations of Scenario 1 strategies along with the comparison with Scenario 2 calculation strategy. The strategies considered are web structure strategy (P1A), web search strategy (P1B), look and scroll strategy (P2A), search strategy (P2B), and calculation strategy (S2C).
Table 9.
Combined strategies for Scenario 1 Phases 1 and 2 and Scenario 2 calculation strategy for comparison.
On the basis of the interaction cost analysis data and previously mentioned assumptions, the following two major conclusions regarding costs and efficiency were drawn.
The first conclusion is that only one interaction occurs in S2C, which has attention-switching cost, particularly “wait”. This means that the S2C is a straightforward process and does not require the consumer to process many different interfaces; thus, the attention cost is low. In comparison with S1 strategies, the lowest number of actions with attention-switching cost is 3 + 4 repeat for the P1B + P2A strategy (Table 9). This is a significant difference.
The second conclusion is that the “repeat” action in S2C has many repeats (one for every field filled in by a user). However, these repeated actions are performed in the stable environment/interface with both structural and functional consistency. Conversely, S1 requires interactions with many different interfaces; every bank´s website is different, every price list is structured differently, in addition to the different logic and terminology behind each bank account and its service combinations and fees. This adds a significant amount of attention-switching cost to every action (with otherwise only an interaction cost) for every encountered interface. As a result, this is much more favorable for the S2C task procedure.
7. Conclusions and Future Research
This paper introduced a novel calculator service that provides a comparison of the most suitable bank accounts based on user requirements and preferences [12]. A comparison was conducted with an actual calculation of banking fees, which demonstrated the superiority of this service compared with standard shopbot applications. The presented calculator eliminates differences in price complexities, and thereby reduces the information asymmetry in the payment accounts market. This contribution can be extended outside the PA market as other markets share important characteristics with this market (homogenous, different only by price), such as mobile tariffs, cloud services, internet connection, and so on. Therefore, the principles for this calculator´s construction can be reused in implementation for another segment.
The presented application has been under design and development since the end of 2015. The first release for the public in the Czech environment was April 2018 [8]. The programmatic updates have been mostly functional and sectional; however, a major update is planned based on user and log data retrieved from the application. The calculator is also updated monthly regarding data about bank accounts, which is critical to remain up to date. The service needs to be adapted regularly to changes in a particular environment (Czech Republic), such as new conditions, besides maintaining up-to-date numbers (fees, limits, and so on).
A total of 769 records had been collected by the calculator as of 10 August 2019, which is similar to the number collected by the previous calculator for the same period of time. This may be considered a good result as the first release was experimental, and thus without any promotion of the service. We would like to add more feedback options for users, as well as a measurement of time spent filling in the form, although this figure can be misleading. A user can be engaged in other online activities simultaneously, and thus is inactive during the process or otherwise interrupted. Also, we need to consider that a user spends some time thinking about answers (their account usage), how much depends on too many factors (e.g., how well they remember it, if they are a satisficer or maximizer, and so on).
The interaction cost analysis demonstrated the benefit of the calculator in comparison with the common approaches of gathering information about bank accounts. Therefore, the hypothesis that the calculator is more usable for the user with less interaction cost was supported. Several variations of this analysis were reviewed based on the common problem of finding the best bank account. Limitations can be found both on the conceptual level and in the application to a different scenario than the one discussed here. I hope to address these limitations in the ongoing research on this topic and the actual development of the calculator.
The presented methodology for interaction cost analysis is regarded as another contribution of this study. The most widely used methods for measuring usability are subjective, not always reliable, and inconsistent. The proposed analysis can be used for measuring the objective usability of any user interface. In future research, I would like to explore all the new possible interactions and further refine their supporting methodology, so as to improve the precision and ease of use of the calculation. The actual implementation still has some liberty in interpretation, which can result in marginal subjectivity during the evaluation.
Service design is likely the most usable scenario in which the interaction cost analysis would be most helpful, that is, using the proposed analysis for comparison of existing interfaces (websites, systems, services, and so on) and the new approaches or the ones under development. A higher interaction cost would then reveal possible troubles and delays in processing the expected task and could also indicate if the issue is related to user interface design and structure or the underlying logic. As such, user experience can be improved significantly by reducing interaction and attention-switching cost.
Besides the demonstration of interaction analysis, valuable conclusions were reached about the actual task of finding the best account for a particular user. The specialized online service benefited considerably from the united user interface not only because of an obvious benefit of finding the information in one place, but also because of the reduction in the related attention-switching cost. In the previous research, we only presumed that the use of the calculator is more efficient. In this study, this assumption was confirmed by the interaction cost analysis.
The calculator also has social implications. Firms often apply obfuscation strategies to products so that comparing prices becomes a complicated and tedious process [45]. Obfuscation is a term referring to sales practices that increase the costs consumers pay to search [46]. The calculator removes the obfuscation. By lowering the costs of searching for the ideal product, the market efficiency can increase. This can be applied not only for the PA market, but also for other similar markets mentioned earlier. The service design for the calculator implementation can be considered a valuable contribution to the industry. Every application created following these principles can be consequently validated by the presented interaction cost analysis, among other means of usability testing.
In future research, we would also like to adapt the calculator service to a different environment, which requires adapting to other countries’ banks and policies. This would involve cooperation from the respective country´s researchers to offer a useful up-to-date service. Finally, the new research intention, upon which we have already begun to work, is to address the deterministic approach. We intend to deliver an even more advanced calculator service that would be able to reflect the stochastic nature of user behavior. This would be a significant advance from the usual deterministic concept used in service design.
Funding
This research received no external funding.
Acknowledgments
The study was supported by the specific research project SV (2019) at the Faculty of Informatics and Management of the University of Hradec Kralove, Czech Republic. I would like to thank Aneta Bartuskova, Ph.D., for her work on the calculator´s development and Lucie Elza Knourkova for raw data refinement.
Conflicts of Interest
The authors declare no conflict of interest.
References
- Soukal, I.; Draessler, D. Price Information Asymmetry Impact on Optimal Choice–RCBS Market Case Study. In Liberec Economic Forum 2015. Proceedings of the 12th International Conference, Liberec, Czech Republic, 16–17 September 2015; Kocourek, A., Ed.; Technical University of Liberec: Liberec, Czech Republic, 2015; pp. 145–154. [Google Scholar]
- Lam, H. A Framework of Interaction Costs in Information Visualization. IEEE Trans. Vis. Comput. Graph. 2008, 14, 1149–1156. [Google Scholar] [CrossRef] [PubMed]
- Soukal, I.; Draessler, J.; Hedvičáková, M. Cluster analysis of the demand side of the retail core banking services market. E M Ekon. Manag. 2011, 14, 102–114. [Google Scholar]
- Soukal, I.; Hedvičáková, M.; Draessler, J. Probabilistic model of optimal price search on the retail core banking services market. Int. J. Math. Models Methods Appl. Sci. 2012, 6, 386–393. [Google Scholar]
- Carlin, B.I. Strategic price complexity in retail financial markets. J. Financ. Econ. 2009, 91, 278–287. [Google Scholar] [CrossRef]
- Kalaycı, K.; Kalayci, K. Price complexity and buyer confusion in markets. J. Econ. Behav. Organ. 2015, 111, 154–168. [Google Scholar] [CrossRef]
- Soukal, I. The Novel Online Comparison Tool for Bank Charges with User-Friendly Approach. In Enterprise Information Systems; Springer Science and Business Media LLC: Berlin, Germany, 2019; Volume 341, pp. 211–224. [Google Scholar]
- Bartuskova, A.; Soukal, I.; Draessler, J. Calculator of Banking Fees. Available online: http://uni.uhk.cz/kalkulator (accessed on 1 July 2019).
- Hong, L.; Chi, E.H.; Budiu, R.; Pirolli, P.; Nelson, L. SparTag.us: A low Cost Tagging System for Foraging of Web Content. In Proceedings of the Working Conference on Advanced Visual Interfaces, Napoli, Italy, 28–30 May 2008. [Google Scholar] [CrossRef]
- Soukal, I.; Bartuskova, A. WINE: Web Integrated Navigation Extension; Conceptual Design, Model and Interface. In Computational Collective Intelligence; Nguyen, N., Papadopoulos, G., Jędrzejowicz, P., Trawiński, B., Vossen, G., Eds.; Springer: Berlin/Heidelberg, Germany, 2017; Volume 10448. [Google Scholar]
- Fernandez, A.; Insfran, E.; Abrahão, S. Usability evaluation methods for the web: A systematic mapping study. Inf. Softw. Technol. 2011, 53, 789–817. [Google Scholar] [CrossRef]
- Bartuskova, A.; Krejcar, O. Evaluation Framework for User Preference Research Implemented as Web Application. In ICCCI 2013, LNAI; Springer: Heidelberg, Germany, 2013; Volume 8083, pp. 537–548. [Google Scholar]
- Zhu, H.; Madnick, S.E.; Siegel, M.D. Enabling global price comparison through semantic integration of web data. Int. J. Electron. Bus. 2008, 6, 319. [Google Scholar] [CrossRef]
- Pires, T. Measuring the Effects of Search Costs on Equilibrium Prices and Profits. Int. J. Ind. Organ. 2017, 60, 179–205. [Google Scholar] [CrossRef]
- Tang, Z.; Smith, M.D.; Montgomery, A. The impact of shopbot use on prices and price dispersion: Evidence from online book retailing. Int. J. Ind. Organ. 2010, 28, 579–590. [Google Scholar] [CrossRef]
- Iyer, G.; Pazgal, A. Internet Shopping Agents: Virtual Co-Location and Competition. Mark. Sci. 2003, 22, 85–106. [Google Scholar] [CrossRef]
- Haynes, M.; Thompson, S. Price, price dispersion and number of sellers at a low entry cost shopbot. Int. J. Ind. Organ. 2008, 26, 459–472. [Google Scholar] [CrossRef]
- European Parliament. Directive 2014/92/EU on the comparability of fees related to payment accounts, payment account switching and access to payment accounts with basic features. Off. J. Eur. Union 2014, 214–246. [Google Scholar]
- Brannon, D.C.; Soltwisch, B.W. If it has lots of bells and whistles, it must be the best: How maximizers and satisficers evaluate feature-rich versus feature-poor products. Mark. Lett. 2017, 28, 651–662. [Google Scholar] [CrossRef]
- Schwatz, B. The Paradox of Choice: Why More Is Less; HarperCollins Publishers: New York, NY, USA, 2005. [Google Scholar]
- Besharat, A.; Ladik, D.M.; Carrillat, F.A. Are maximizers blind to the future? When today’s best does not make for a better tomorrow. Mark. Lett. 2014, 25, 77–91. [Google Scholar] [CrossRef]
- Albert, B.; Tullis, T. Measuring the User Experience: Collecting, Analyzing, and Presenting Usability Metrics, 2nd ed.; Morgan Kaufmann: Burlington, MA, USA, 2013. [Google Scholar]
- Dirin, A.; Laine, T.H. User Experience in Mobile Augmented Reality: Emotions, Challenges, Opportunities and Best Practices. Computers 2018, 7, 33. [Google Scholar] [CrossRef]
- Bartuskova, A.; Krejcar, O. Sequential Model of User Browsing on Websites—Three Activities Defined: Scanning, Interaction and Reading. In Proceedings of the International Conference on Web Information Systems and Technologies, Barcelona, Spain, 3–5 April 2014; pp. 143–148. [Google Scholar]
- Lee, S.; Koubek, R.J. Understanding user preferences based on usability and aesthetics before and after actual use. Interact. Comput. 2010, 22, 530–543. [Google Scholar] [CrossRef]
- Lidwell, W.; Holden, K.; Butler, J. Universal Principles of Design Revised and Updated: 125 Ways to Enhance Usability, Influence Perception, Increase Appeal, Make Better Design Decisions, and Teach through Design; Rockport Publishers: Beverly, MA, USA, 2010; pp. 113–122. [Google Scholar]
- Moe, W.W.; Fader, P.S. Dynamic Conversion Behavior at E-Commerce Sites. Manag. Sci. 2004, 50, 326–335. [Google Scholar] [CrossRef]
- Trattner, C.; Lin, Y.L.; Parra, D.; Yue, Z.; Real, W.; Brusilovsky, P. Evaluating Tag-Based Information Access in Image Collections. In Proceedings of the 23rd ACM Conference, Milwaukee, WI, USA, 25–28 June 2012. [Google Scholar]
- Ellonen, H.K.; Wikström, P.; Johansson, A. The role of the website in a magazine business—Revisiting old truths. J. Media Bus. Stud. 2015, 12, 1–12. [Google Scholar] [CrossRef]
- Pavlas, J.; Krejcar, O.; Maresova, P.; Selamat, A. Prototypes of User Interfaces for Mobile Applications for Patients with Diabetes. Computers 2018, 8, 1. [Google Scholar] [CrossRef]
- W3C: Web Content Accessibility Guidelines (WCAG) Overview. Available online: http://www.w3.org/WAI/intro/wcag (accessed on 6 August 2019).
- Bartuskova, A.; Krejcar, O.; Soukal, I. Framework of Design Requirements for E-learning Applied on Blackboard Learning System. Prog. Pattern Recognit. Image Anal. Comput. Vis. Appl. 2015, 9330, 471–480. [Google Scholar]
- Alonso-Virgós, L.; Espada, J.P.; Crespo, R.G. Analyzing compliance and application of usability guidelines and recommendations by web developers. Comput. Stand. Interfaces 2019, 64, 117–132. [Google Scholar] [CrossRef]
- Hornbæk, K. Current practice in measuring usability: Challenges to usability studies and research. Int. J. Hum. Comput. Stud. 2006, 64, 79–102. [Google Scholar] [CrossRef]
- Bartuskova, A.; Krejcar, O.; Soukal, I. Framework of Design Requirements for E-learning Applied on Blackboard Learning System. In Progress in Pattern Recognition, Image Analysis, Computer Vision, and Applications; Springer Science and Business Media LLC: Berlin, Germany, 2015; Volume 9330, pp. 471–480. [Google Scholar]
- Thielsch, M.T.; Engel, R.; Hirschfeld, G. Expected usability is not a valid indicator of experienced usability. PeerJ Comput. Sci. 2015, 1, e19. [Google Scholar] [CrossRef]
- Horton, W. E-Learning by Design, 2nd Edition, Online Chapters. Available online: http://horton.com/books/e-learning-by-design/examples-from-e-learning-by-design/ (accessed on 1 July 2019).
- Malamed, C. Visual Design Solutions: Principles and Creative Inspiration for Learning Professionals; Wiley: Hoboken, NJ, USA, 2015. [Google Scholar]
- Lynch, P.J.; Horton, S. Web Style Guide: Basic Design Principles for Creating Web Sites, 3rd ed.; Yale University Press: New Haven, CT, USA, 2009. [Google Scholar]
- Bartuskova, A.; Krejcar, O. Design Requirements of Usability and Aesthetics for e-Learning Purposes. In Distributed Systems and Applications of Information Filtering and Retrieval; Springer Science and Business Media LLC: Berlin, Germany, 2014; Volume 551, pp. 235–245. [Google Scholar]
- Winograd and, C.F. Flores. Understanding Computers and Cognition; Ablex Publishing Corp: New York, NY, USA, 1986. [Google Scholar]
- Bartuskova, A.; Soukal, I. The Novel Approach to Organization and Navigation by Using All Organization Schemes Simultaneously. In Enterprise Information Systems; Springer Science and Business Media LLC: Berlin, Germany, 2016; Volume 261, pp. 99–106. [Google Scholar]
- Reyes-Menendez, A.; Saura, J.R.; Martinez-Navalon, J.G. The impact of e-WOM on Hotels Management Reputation: Exploring TripAdvisor Review Credibility with the ELM model. IEEE Access 2019, 7, 68868–68877. [Google Scholar] [CrossRef]
- Saura, J.R.; Bennett, D. A Three-Stage Methodological Process of Data Text Mining: A UGC Business Intelligence Analysis. Symmetry (Basel) 2019, 11, 519. [Google Scholar] [CrossRef]
- Ellison, G.; Ellison, S.F. Search and Obfuscation in a Technologically Changing Retail Environment: Some Thoughts on Implications and Policy. Innov. Policy Econ. 2018, 18, 1–25. [Google Scholar] [CrossRef]
- Hämäläinen, S. Competitive search obfuscation. J. Econ. Dyn. Control 2018, 97, 38–63. [Google Scholar] [CrossRef]
© 2019 by the author. Licensee MDPI, Basel, Switzerland. This article is an open access article distributed under the terms and conditions of the Creative Commons Attribution (CC BY) license (http://creativecommons.org/licenses/by/4.0/).