Article

SoS TextVis: An Extended Survey of Surveys on Text Visualization

Department of Copmuter Science, Swansea University, Swansea SA1 8EN, UK
*
Author to whom correspondence should be addressed.
Computers 2019, 8(1), 17; https://doi.org/10.3390/computers8010017
Submission received: 14 January 2019 / Revised: 8 February 2019 / Accepted: 18 February 2019 / Published: 20 February 2019

Abstract

:
Text visualization is a rapidly growing sub-field of information visualization and visual analytics. There are many approaches and techniques introduced every year to address a wide range of challenges and analysis tasks, enabling researchers from different disciplines to obtain leading-edge knowledge from digitized collections of text. This can be challenging particularly when the data is massive. Additionally, the sources of digital text have spread substantially in the last decades in various forms, such as web pages, blogs, twitter, email, electronic publications, and digitized books. In response to the explosion of text visualization research literature, the first text visualization survey article was published in 2010. Furthermore, there are a growing number of surveys that review existing techniques and classify them based on text research methodology. In this work, we aim to present the first Survey of Surveys (SoS) that review all of the surveys and state-of-the-art papers on text visualization techniques and provide an SoS classification. We study and compare the 14 surveys, and categorize them into five groups: (1) Document-centered, (2) user task analysis, (3) cross-disciplinary, (4) multi-faceted, and (5) satellite-themed. We provide survey recommendations for researchers in the field of text visualization. The result is a very unique, valuable starting point and overview of the current state-of-the-art in text visualization research literature.

1. Introduction and Motivation

Text visualization and visual text analysis is a rapidly growing sub-field of information visualization and visual analytics. Therefore, many approaches and techniques are introduced periodically to help users and researchers with a wide range of tasks. The volume of digital text data is multiplying due to the popular demand for digital text and text digitization projects, such as those by Reddy and StClair [1], Andre and Eaton [2], and Mendelsson et al. [3]. Literature and historical documents are digitized for further study and analysis. This volume of digital text data makes understanding and analyzing it extremely challenging. Text documents by their nature bring many challenges such as high dimensionality, irregularity, and uncertainty inherent in natural language. Thus, many advanced techniques are needed to address these challenges.
Currently, Kucher and Kerren [4] review over 400 text visualization approaches in their interactive web-based tool ‘Text Visualization Browser’ (at the time of this writing and the tools are regularly updated). However, the approaches listed in the Text Visualization Browser mainly come from the data visualization community and generally do not include literature from other communities–particularly from the digital humanities. The number of text literature surveys has grown since the first survey was published in 2010 by Šilić and Bašić [5] as shown in Figure 1. Collectively with duplicates, the surveys cite and review 1288 text visualization approaches.
In this review, we provide a meta-survey of the existing surveys that address the exploration, analysis, and presentation of text data.
Our contributions to the field include:
  • the first focus Survey of Surveys (SoS) in text visualization,
  • a novel classification of text surveys in the reviewed literature,
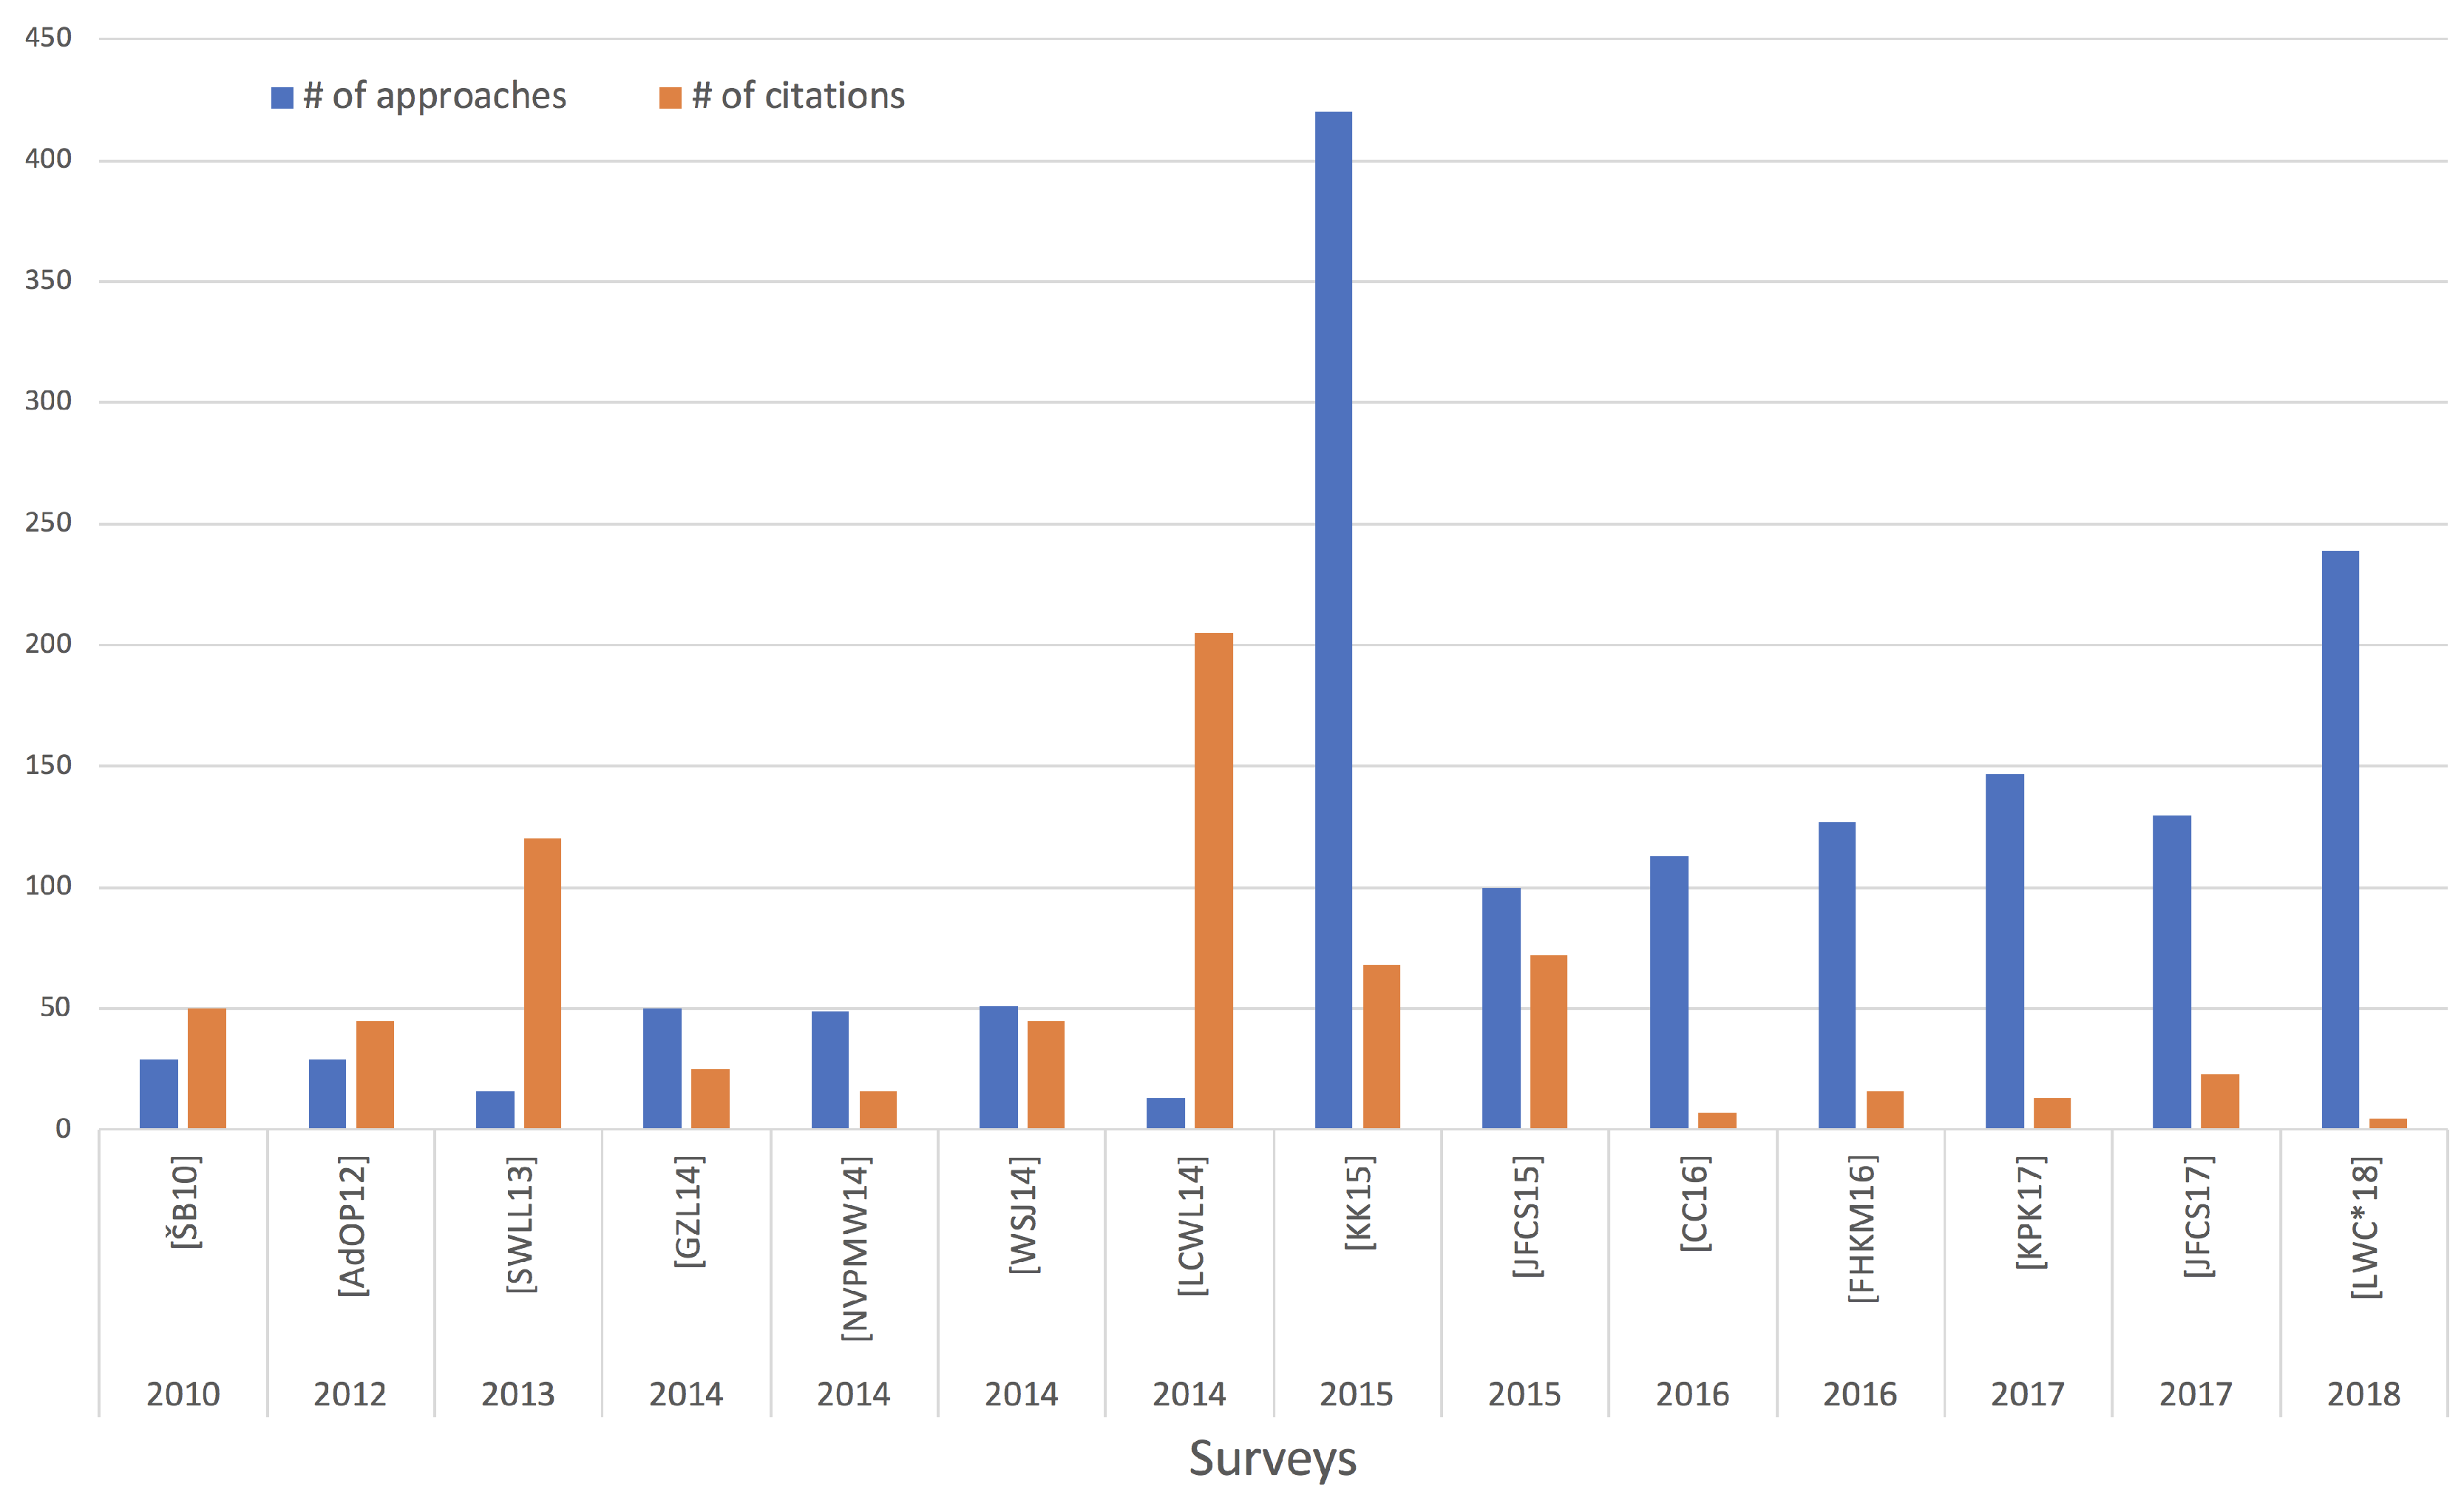
  • helpful survey meta-data in order to facilitate comparison of the surveys, and
  • a unique, valuable starting point and comprehensive overview for both newcomers and experienced researchers in text visualization.
This paper is an extension of our previous conference paper by Alharbi and Laramee [6]. In this extended version, we add a new text visualization survey to the literature. Accordingly, we provide a new and updated meta-analysis of the textual content of the surveys. We enrich this version with more figures to help the reader understand the existing literature. Also, we extend the discussion of both the recommendations and the future challenges sections.
Since we add another survey, Figure 1, Tables 2 and 3 are updated accordingly. Also, we have added the following new figures: Figure 4 (Section 2.3), Figure 6 (Section 2.6), Figure 7 (Section 2.6), Figure 8 (Section 2.6), and Figure 9 (Section 2.6).
We updated Section 2 to discuss the results of the new text analysis methods we apply to the collection of the surveys, such as the bi-grams word clouds visualization in Figure 6.
The rest of this paper is organized as follows: Section 1.1 describes the methodology used to collect related research papers and the scope of the literature. Section 1.3 introduces a previous survey of surveys and how our work differs from it. Section 1.4 presents our classification of the literature. Section 2 discusses and compares the surveys guided by to the classification in Section 1.4. Section 3 summarizes and discusses the future challenges reported within our collection. We finish this article with conclusions and future work directions.

1.1. Literature Search Methodology

Our search methodology is a variant of the work by McNabb and Laramee [7] since they have collected many surveys in the field of information visualization and visual analytics. We also consulted the survey of information visualization books by Rees and Laramee [8]. However, since the publication of the SoS, more recent surveys have been published in the field of text visualization and visual analytics, such as by Kucher et al. [9], Jänicke et al. [10], and the newest one by Liu et al. [11].
In our search of the literature, we started by looking at each individual journal and conference in the data visualization community and performed a keyword search e.g., ‘Text Visualization Survey,’ ‘Text Taxonomy,’ ‘Text Visualization State-of-the-Art,’ or ‘Visual Text.’ We list all the literature sources searched in Table 1. As text visualization is of interest to other communities, we searched the digital humanities (DH) digital libraries to look for surveys, however, we could not find any survey in the main DH venues (shown in Table 1).

1.2. Survey Scope

In scope: We found and collected 14 surveys to include in our text SoS. We include surveys dedicated to text analysis and visualization approaches as well as surveys that explicitly feature a text visualization category in the main literature classification, such as by Sun et al. [15] and Liu et al. [16].
Out of scope: We restrict our literature to surveys that include a review of text visualization approaches. We do not include surveys that review text mining techniques like summarization techniques, such as Gupta and Lehal [17] or text clustering algorithms like Aggarwal and Zhai [18]. Survey papers that focus on text recognition, such as text detection and extraction by Jung et al. [19] are also out of the scope of this survey. Text visualization books are also out of scope.

1.3. Related Work

McNabb and Laramee [7] took the first step towards presenting the landscape of survey papers in information visualization. They present eight surveys which focus on analyzing and visualizing text data. They classify the papers using an adapted information visualization pipeline by Card et al. [20]. They also identify three characteristics of classifications: the dimensions that each classification of survey adopts, the structure of the classification, and the type of mapping schema the survey incorporates. Kucher and Kerren [4] also review five surveys that focus on text visualization and compare the visualization taxonomies used in the reviews with their proposed taxonomy.
In our review, we aim to describe the existing surveys in more depth than McNabb and Laramee [7] and more breadth than Kucher and Kerren [4]. This text SoS includes more referenced text-focused surveys and book chapters than McNabb and Laramee [7] or Kucher and Kerren [4]. It is, to our knowledge, the first comprehensive survey of surveys (SoS) in text visualization.

1.4. Survey Classification

In order to compare each survey, we classify them into five categories. We study each survey’s classification and categorization, and group them based on the main focus themes found in each, see Table 2. Thus, we identify the following five re-occurring themes:
  • Data source: We place all surveys that derive their classification based on the underlying text source in this group; e.g., single text or text stream.
  • Task analysis: We group surveys that mainly categorize their related literature based on the task analysis; e.g., showing similarities between texts.
  • Multi-faceted: Here are surveys that categorize related literature into multi-faceted classifications. In this case, the survey may propose multiple classifications based on a variety of characteristics; e.g., presentation and underlying data mining technique.
  • Cross-disciplinary: We collect surveys that survey visualization techniques to support Digital Humanities.
  • Satellite-themed: This group contains surveys that review existing information visualization literature. We include surveys that only include text visualization as a sub-section within their classification.

2. Summary and Comparison of Surveys

In this section, we discuss the surveys and provide our recommendations. Table 2 shows the classification of the surveys where each column represents a focus category and includes the corresponding surveys.

2.1. Document-Centered Surveys

There are three surveys in this collection by Alencar et al. [21], Gan et al. [22] and Nualart- Vilaplana et al. [23]. Their classifications are centered around document type. This refers to classifying a given document—as the central theme—to a single document, a collection of documents, or a stream of text, etc.
Alencar et al. [21] review visual text analysis approaches. In their classification, there are two main categories. The first is target input material of approaches, either a single document (TagCrowd [28] and Wordle [29]) or a collection of text (Cartographic Maps [30], Galaxies [31], InfoSky [32] and Document Cards [33]). The second category is the focus of the approaches, such as showing relations (CiteSpace [34]), highlighting temporal changes (SparkClouds [35]) and visualizing query results (TileBars [36]). They describe each approach to obtain meaningful text models, how they extract information to produce representative visual designs, the user tasks supported, the interaction techniques applied and their strengths and limitations.
Gan et al. [22] present an overview of the concept of document visualization, the related research, and representative methods in each category of their hierarchical document classification. They classify the literature clearly based on the data source and do not consider representation.
In each main category of their classification, there are detailed sub-classifications. The overview then introduces several representative methods for each category which summarizes and compares each visual design based on four aspects:
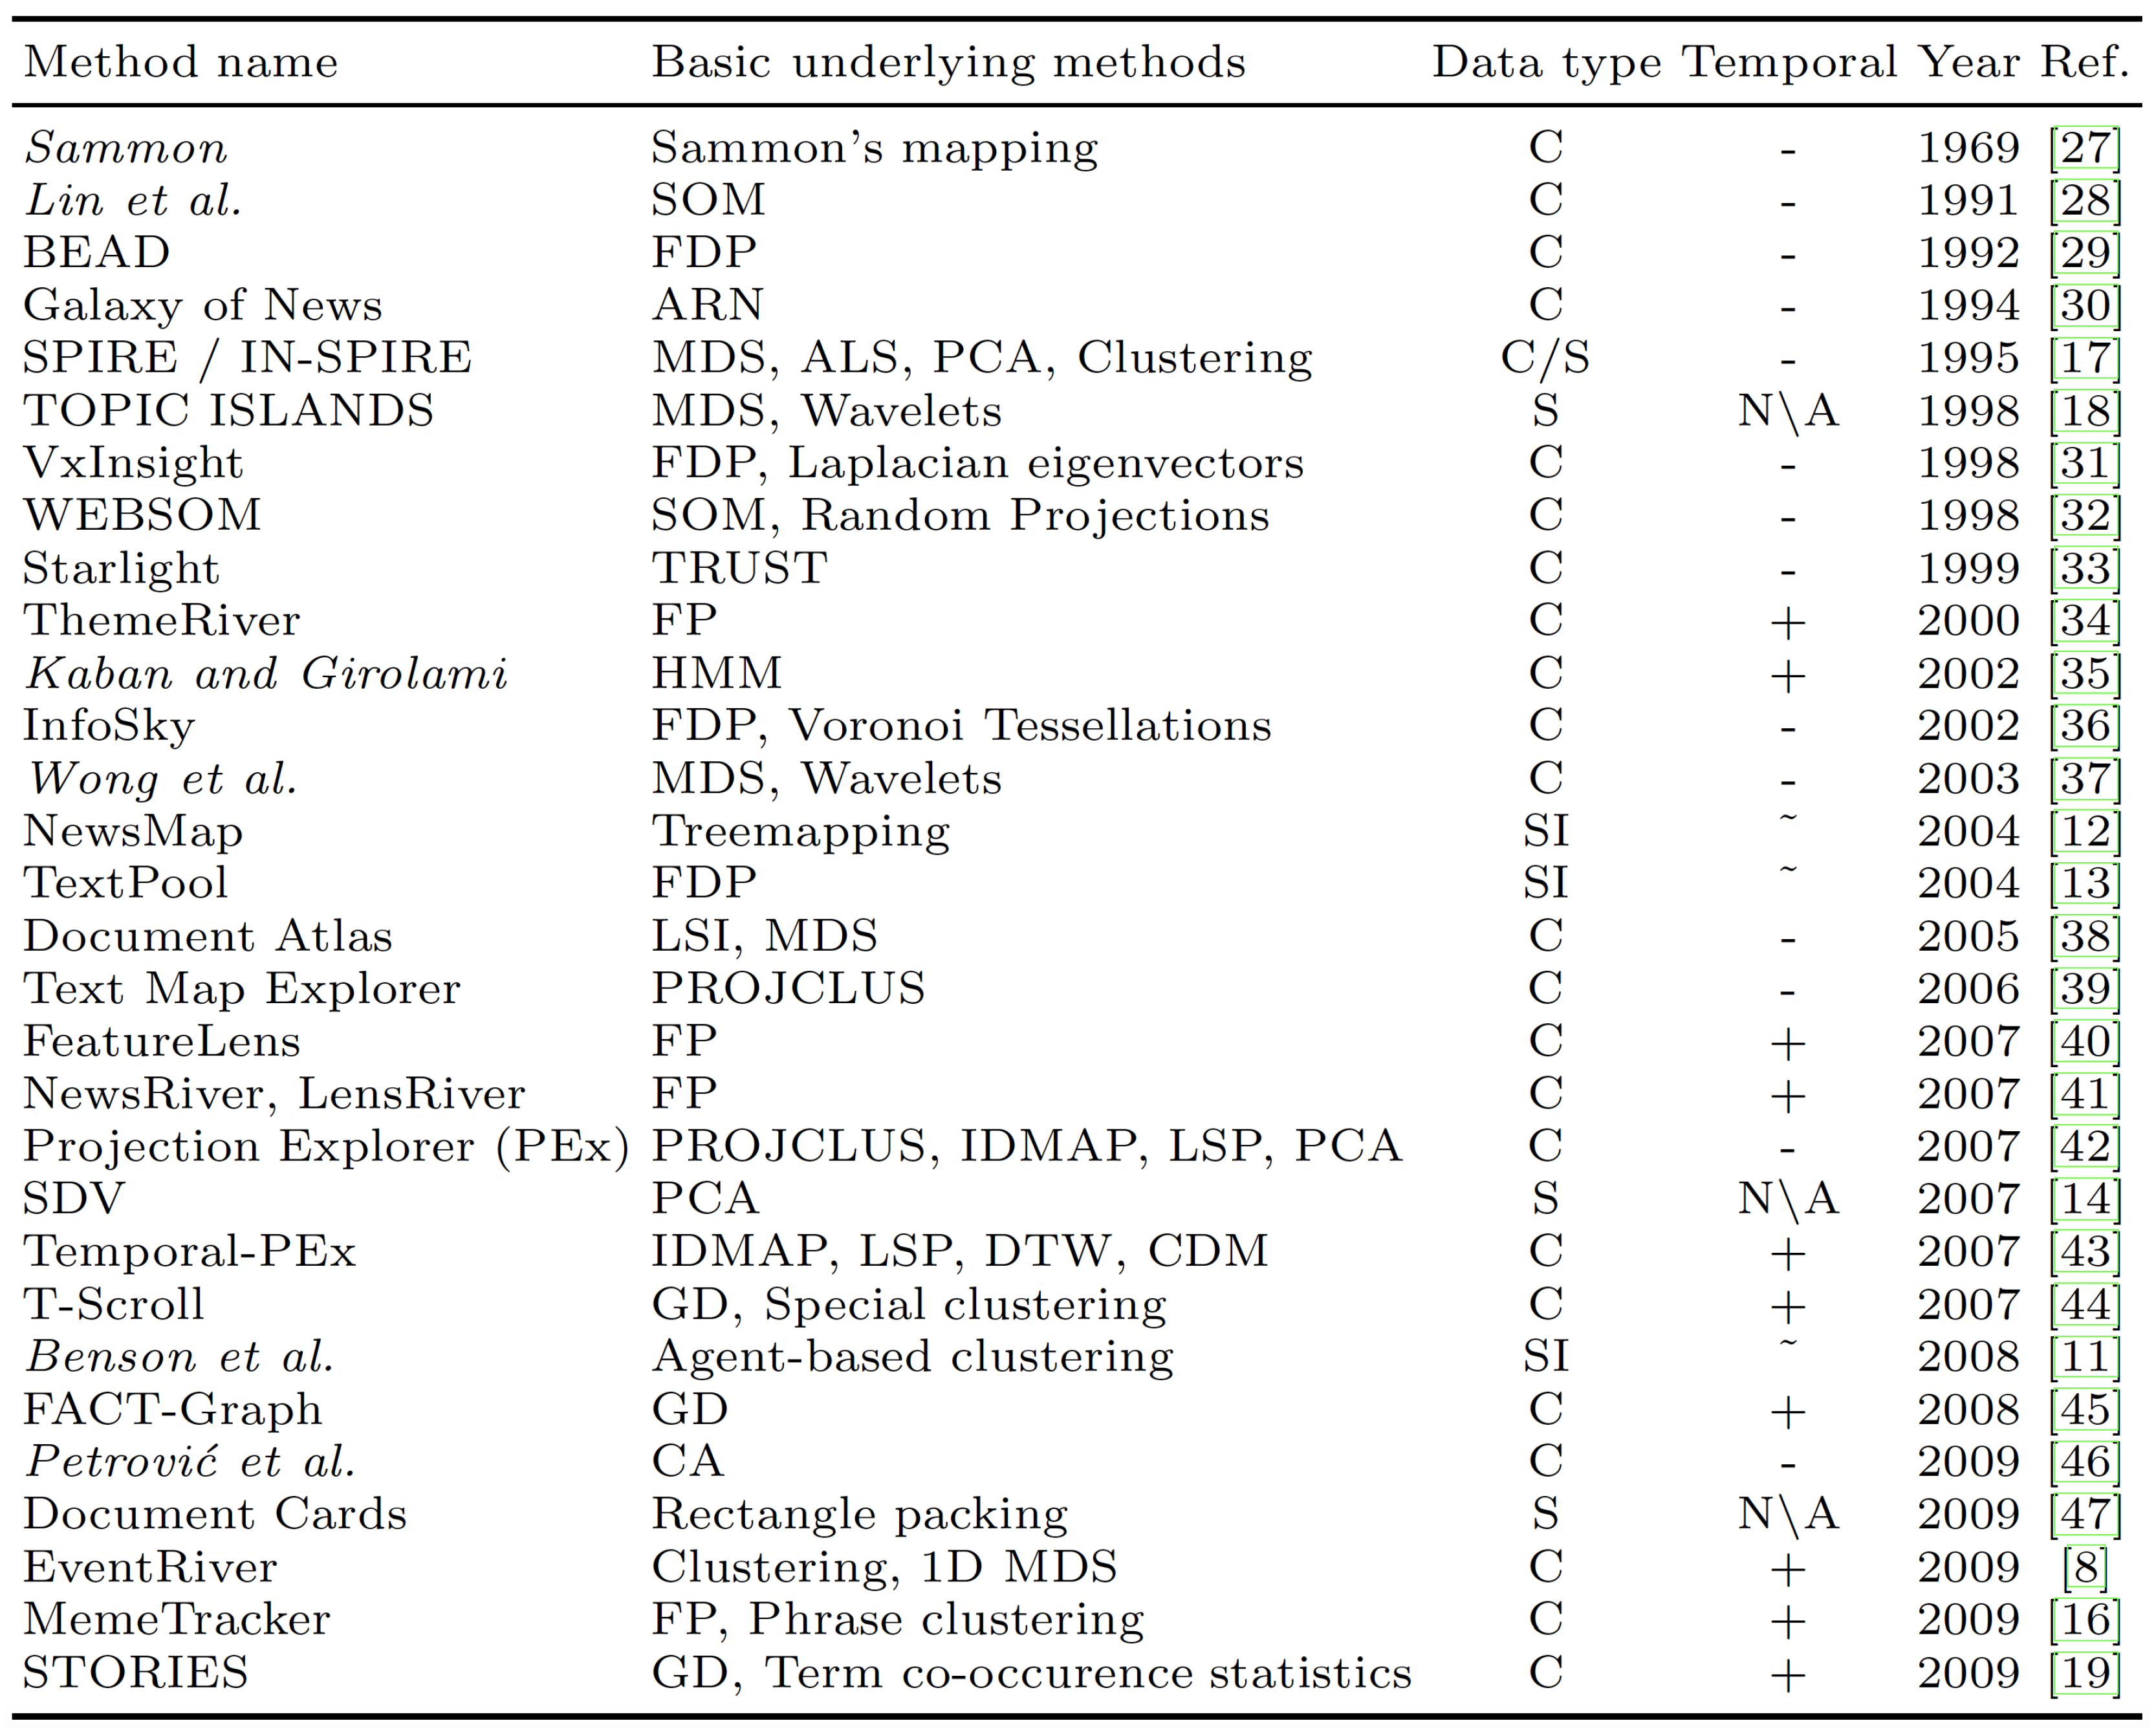
  • Text characteristics depicted as word concordances, semantic relations, contents, or document relations.
  • Design principles satisfied, which refers to the Type by Task Taxonomy (TTT) that Shneiderman proposes [37]. He includes seven tasks which are: Overview, zoom, filter, details-on-demand, relate, history, and extract.
  • Requirements for a document to suit this visual design, such as arbitrary text documents or sequence-based documents.
  • Main features such as interactivity and versatility (designing general visualization models for different tasks).
Nualart–Vilaplana et al. [23] examine 49 approaches to visualize textual data over a 19-year period spanning 1994–2013, in order to provide a classification of text visualization approaches. Similar to Gan et al. [22], Nualart-Vilaplana et al. [23] start their classification with the data source of documents. The classification comprises two main categories: Individual texts and collections of texts. In each category, there are heuristic subdivisions in order to understand and describe the graphs. The subdivision of the single texts and collections categories includes:
  • The sub-divisions for individual texts:
    (a)
    Whole or sub-sets: The visualization process includes the whole text or part of it.
    (b)
    Sequential or non-sequential: The visual layout preserves the same word sequence as that of the original text.
    (c)
    Discourse structure or syntactic structure: The visual design uses elements from discourse structure which refers to using actual parts of the text enabling the viewer to read through visualization or syntactic structure using intrinsic elements of the text such as words and phrases.
    (d)
    Search: The imagery results from a search query.
    (e)
    Time: Text that changes over time.
  • The sub-divisions for collections of texts are:
    (a)
    Items or Aggregations: The items of the collection used individually or there is some aggregation visualized.
    (b)
    Pure data or landscape: The text data in the collection is accompanied by graphical content.
    (c)
    Search: Same as above 1d.
    (d)
    Time: Same as above 1e.

2.2. User Task Analysis Surveys

In this category, we group surveys that mainly categorize their related literature based on user task analysis. There are two surveys in this category by Cau and Cui [24] and Federico et al. [25].
Cau and Cui [24] present a systematic review of existing text visualization techniques. The volume of the approaches cited is over 200. The overview classifies the approaches into two main categories: (1) Visualization and (2) exploration or interaction. They classify the literature in the visualization category based on the tasks of the visualization (what each is developed for), such as showing similarities, contents, and sentiment. For large document collections, the review provides the most common exploration techniques which include distortion based approaches and hierarchical document exploration approaches.
Federico et al. [25] survey interactive visualization approaches that support search and analysis of scientific articles and patents. They classify the visualization approaches according to two orthogonal aspects: Data type and analysis tasks. There are four data types identified: Text, citation, authors, and meta-data. The analysis task breakdown [25] adopts the typology of data analysis tasks by Andrienko and Andrienko [38]. The four analysis tasks include elementary lookup and comparison, elementary relation seeking, synoptic tasks, and temporal patterns. Furthermore, the review also introduces a breakdown of approaches that handle multiple data types.

2.3. Multi-Faceted Text Visualization Surveys

In this category, there are five surveys by Šilić and Bašić [5], Wanner et al. [26], Kucher and Kerren [4], Kucher et al. [9], and Liu et al. [11] that include multi-faceted classifications of text visualization approaches. We consider a survey as multi-faceted if it maps visual text approaches into multiple dimensions, such as, tasks, interaction and presentation.
Šilić and Bašić [5] introduce three categorizations of visual approaches according to the visualization process: Data types, text representation, and temporal drawing as shown in Figure 2. They base their classification on the underlying algorithms and data mining techniques. They provide four user interaction methodologies commonly used when exploring text datasets.
Šilić and Bašić [5] specify three data types: A collection of text, single text, and short intervals of a text stream. Additionally, the survey presents the most popular feature extraction methods used to represent text features as follows:
  • Bag-of-words methods extract text features by counting the term occurrences in the text.
  • Entity recognition aims to extract proper name of entities, such as the names of persons, organizations, places, or countries.
  • Summarization methods shorten the text and present only the most relevant information.
  • Document structure parsing extracts structural information from text, such as titles, authors names, and publication dates.
  • Sentiment and affect analysis is used to identify and quantify the emotional aspects of the text.
The survey classifies the text visualization approaches into two categories:
  • Term trend approaches are based on the term frequency in the text. In such methods, feature selection is used to reduce the number of dimensions.
  • Semantic space approaches facilitate semantic methods to extract features of text(s). In most cases, feature vectors representing text are high-dimensional, so more advanced dimensionality reduction algorithms are used to map these features to 2D or 3D space.
The survey provides four exploration methodologies that help the user extract insight from the given data, as follows: brushing and linking, panning and zooming, focus-plus-context, and magic lenses.
Wanner et al. [26] take a step towards defining the concept of events within text streams. They investigate the existing visual text event detection approaches and provide an event detection and exploration pipeline. An event in a text stream, as defined by Wanner et al. [26], is a valuable, unexpected and unique pattern extracted from the text. They classify 51 papers into different categories based on the event detection and exploration pipeline: Text data sources, text processing methods, event detection methods, visualization methods, and supported analysis tasks. Also, the survey classifies the evaluation techniques applied in each paper.
Wanner et al. [26] derive twelve main data sources. Since 2010, micro-blogging is the most common data source for visual event detection. In contrast, there is only one paper that detects and visualizes events in online customer feedback. Tables 4 and 6 in [26] shows the visualization approaches used within the investigated literature and these approaches along with event detection techniques applied. We can observe that all of the clustering based techniques are mainly presented using the river metaphor. Most of the papers in Wanner et al. [26] rely on use cases for evaluation (35 out of 51). On the other hand, only four papers present user studies. They suggest that more involvement from end users is encouraged.
Kucher and Kerren [4] present a visual survey of text visualization techniques. They classify text visualization into five top-level categories as shown in Figure 3:
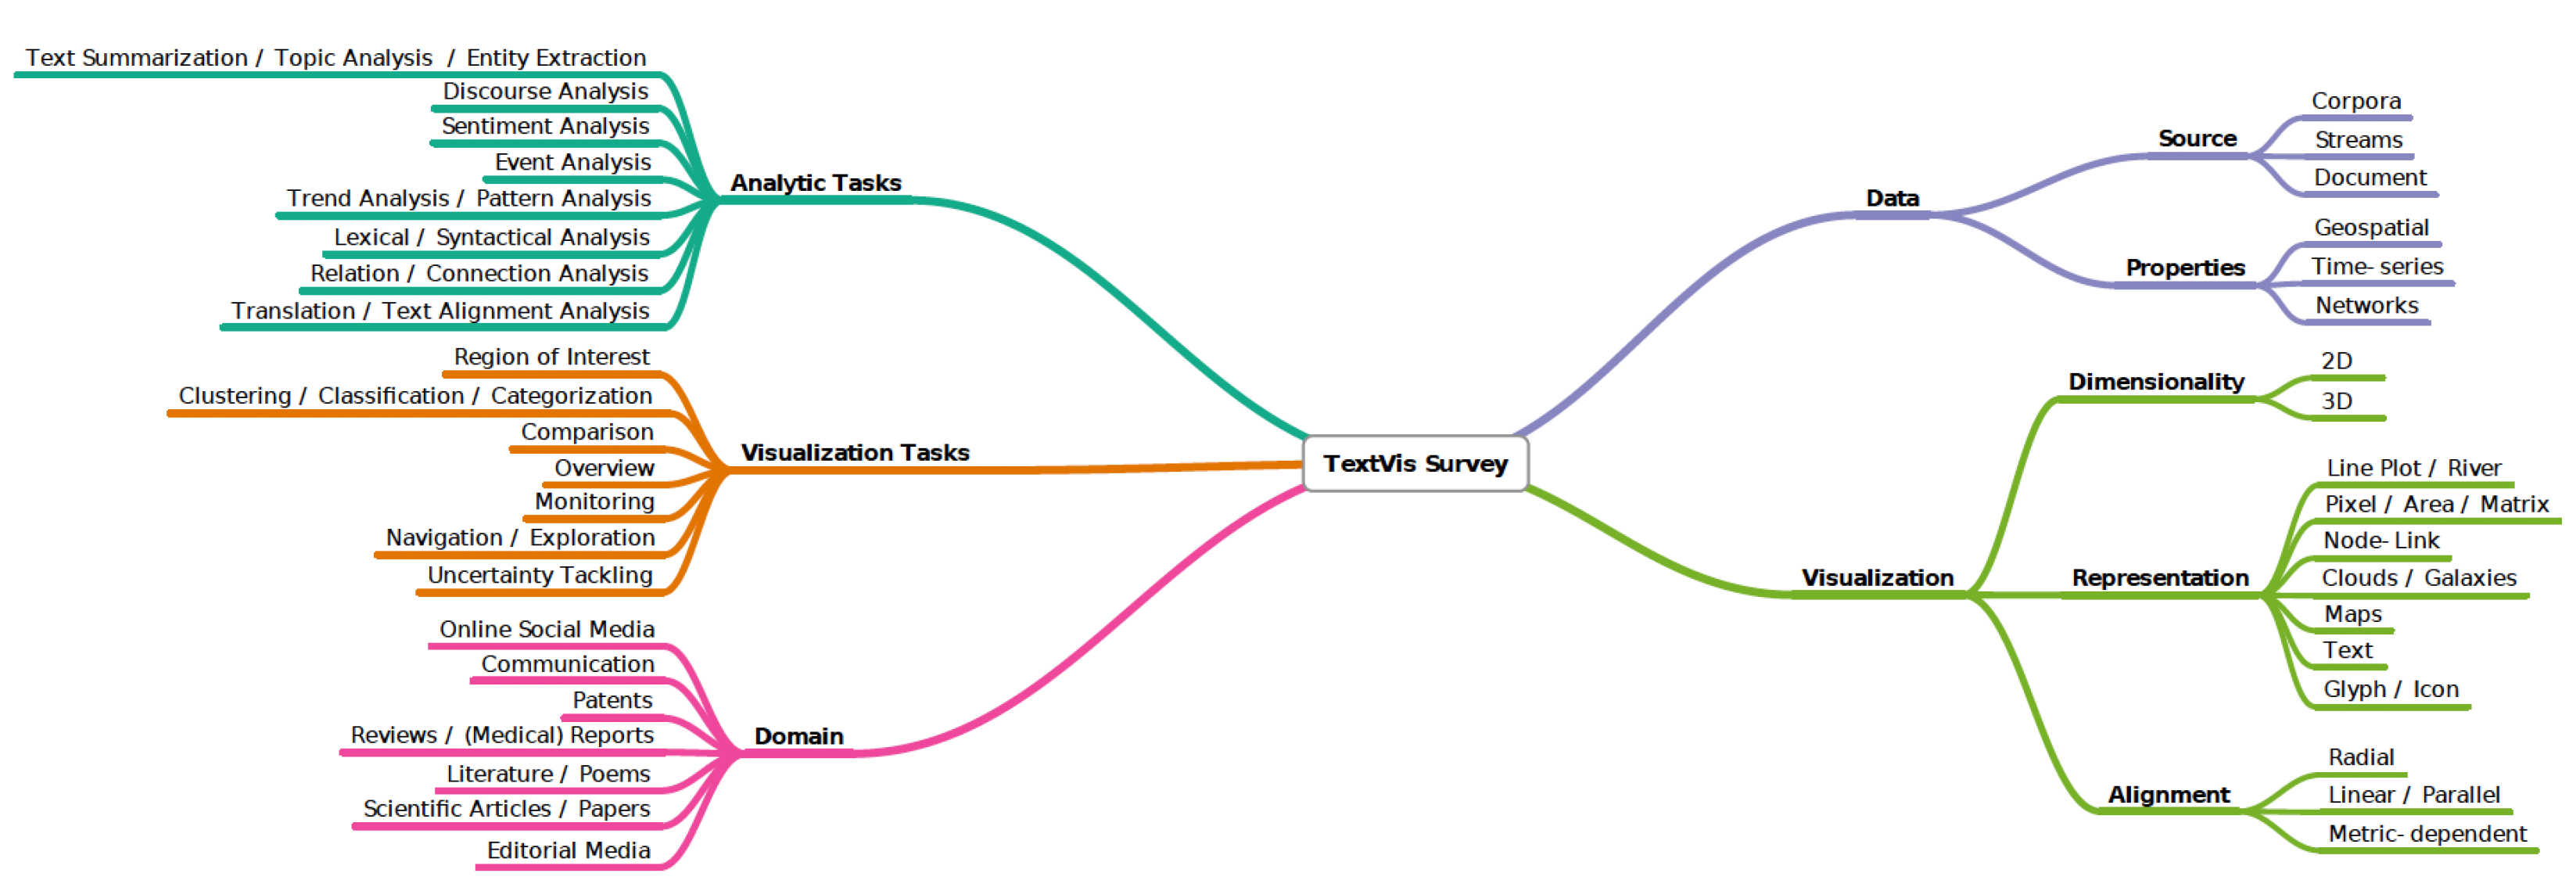
  • Analytic tasks include the techniques that support high-level analytic tasks.
  • Visualization tasks include techniques that support lower-level representation and interaction tasks.
  • Domain describes the techniques that are developed for a specific application.
  • Data consists of two subcategories, source and properties, that describe the data source and the special properties of data used by the techniques.
  • Visualization contains three subcategories to describe the properties of visual representations, dimensionality, representation, and alignment.
Recently, Liu et al. [11] present a survey that analyzes 263 visualization papers, and 4346 data mining papers to extract about 300 concepts in both fields and also analyzes the tasks they support. They provide three multi-level taxonomies, for text visualization, data mining, and analysis tasks. The paper also contributes an interactive web-based visualization of the literature and taxonomies. It enables the user to interactively find the co-occurrence relationship between the concepts and identify potential research gaps (Figure 4).
In this section, we also include the survey by Kucher et al. [9] which generally uses the same taxonomy as [4] with a focus on techniques that visualize sentiment and opinions from text data.

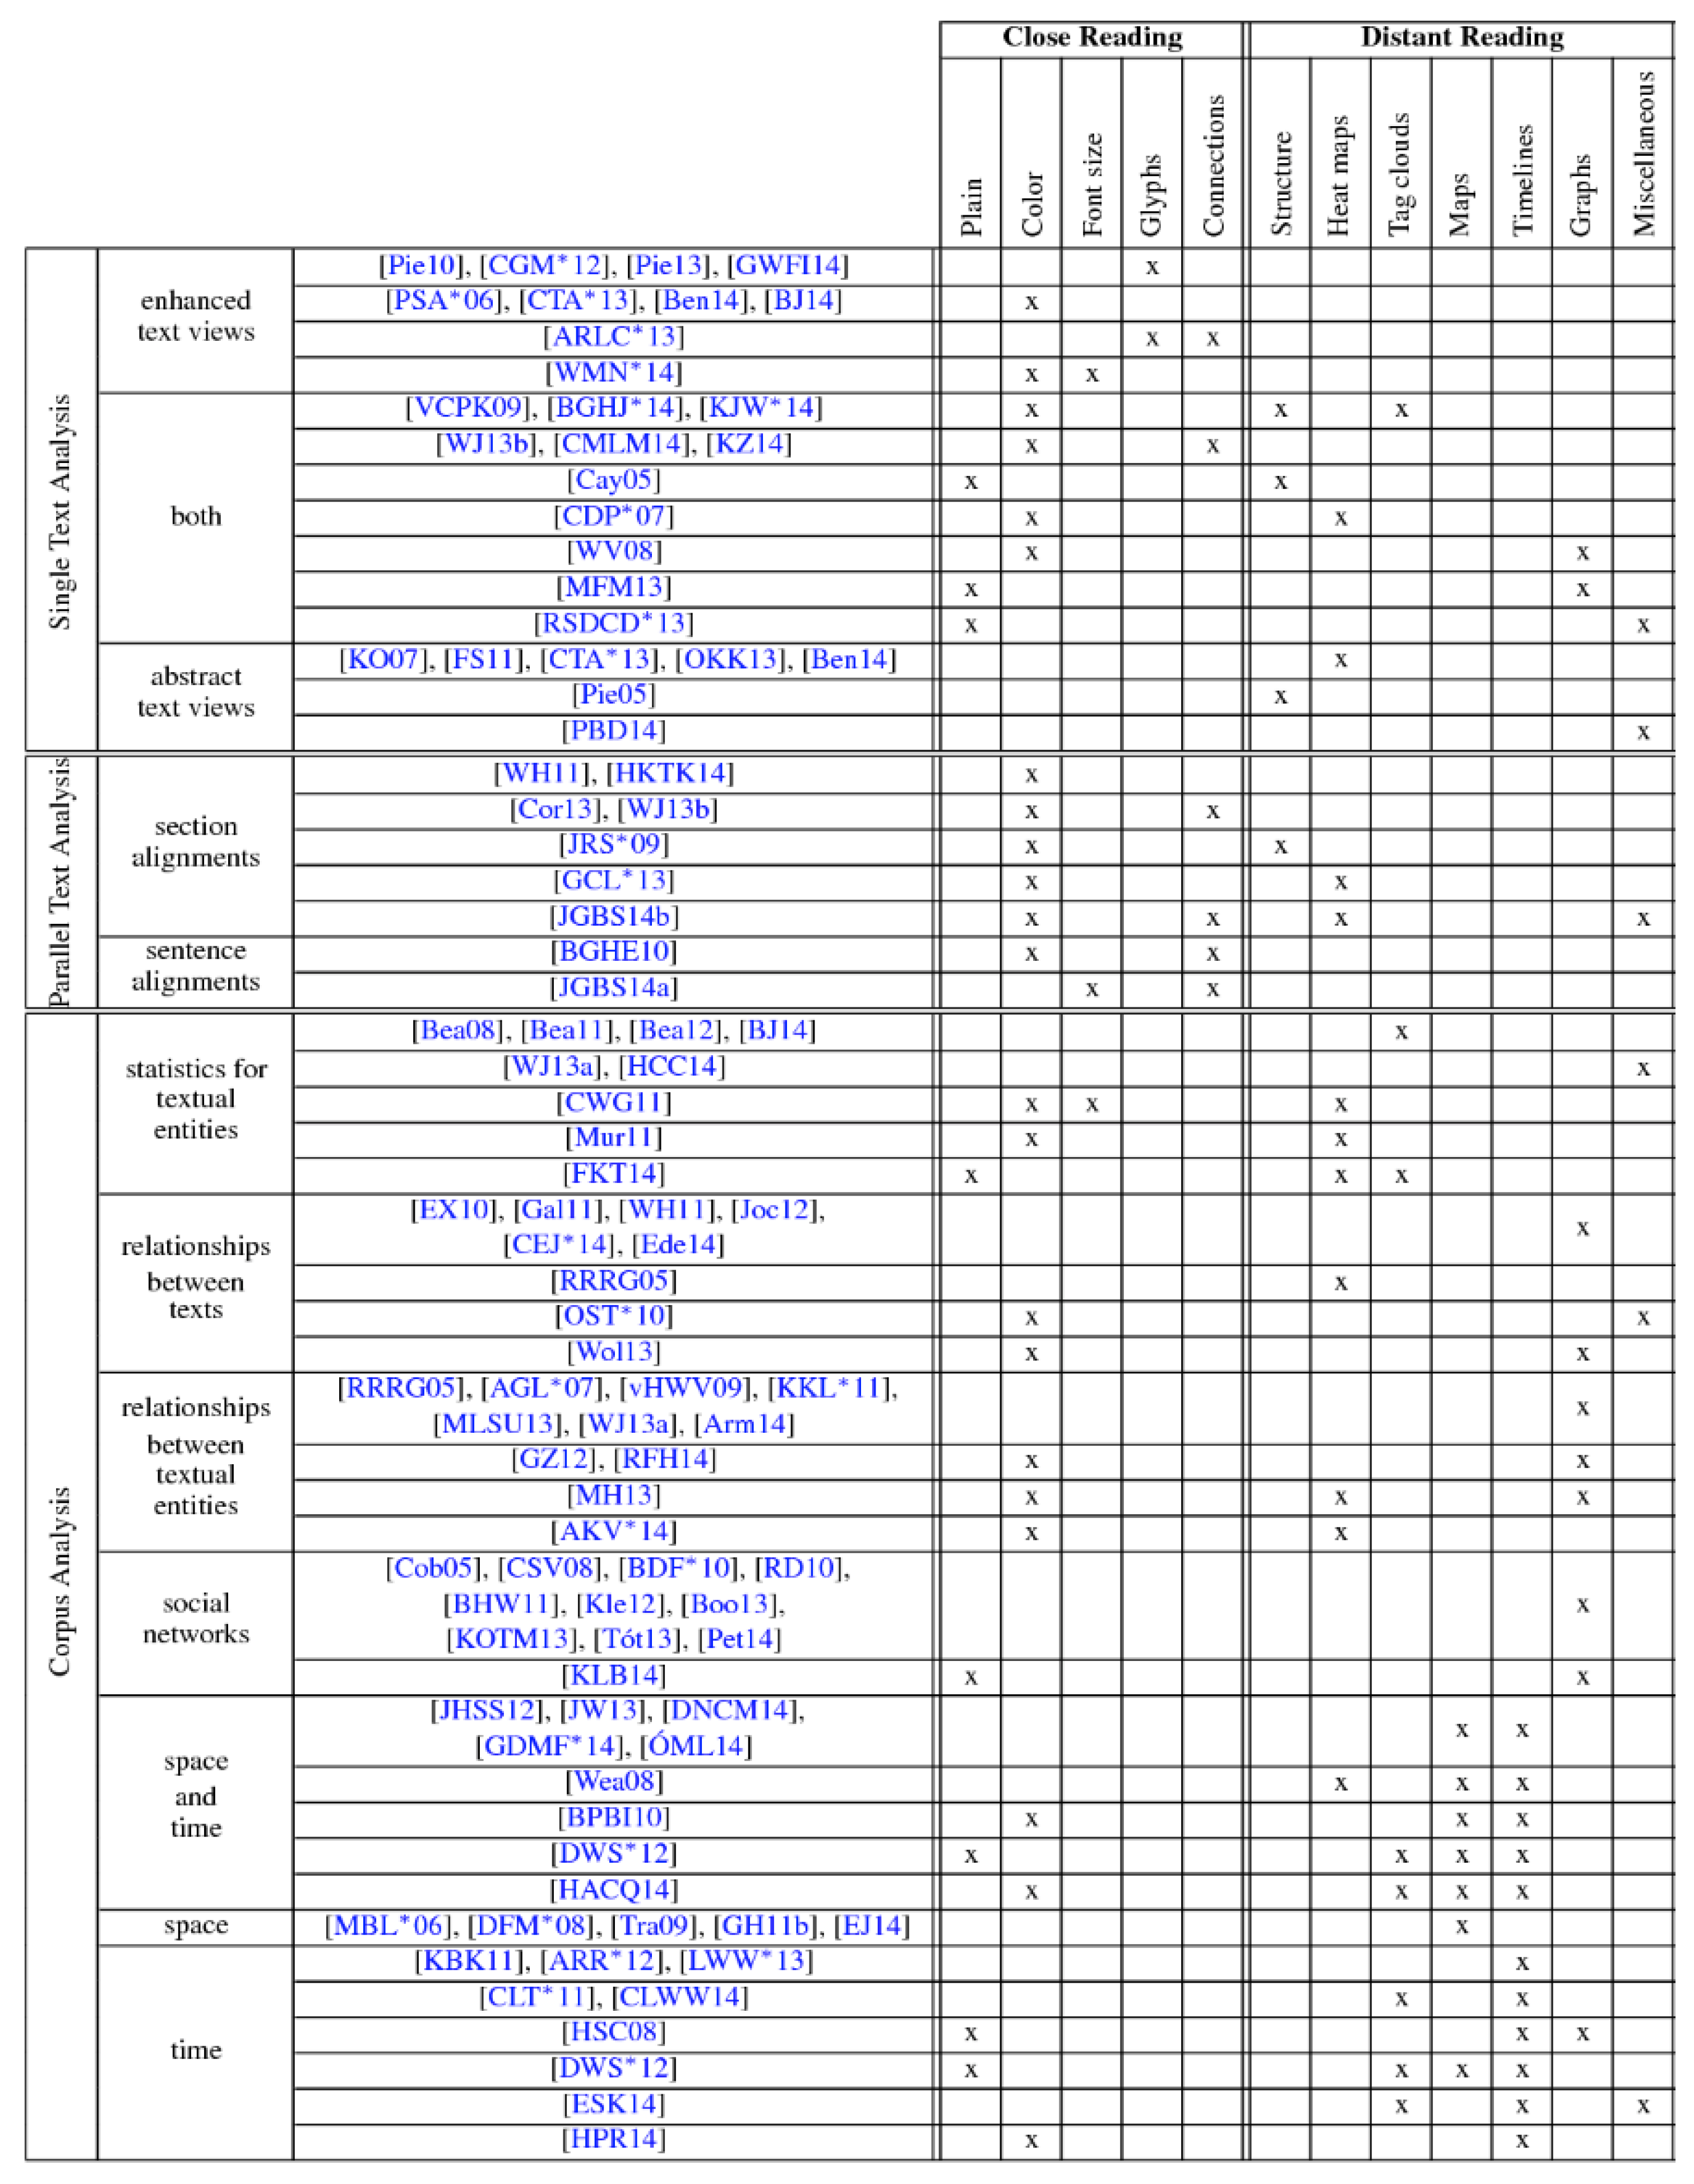
2.4. Cross-Disciplinary Text Visualization Surveys

In this section, we present surveys that support Digital Humanities tasks. There are two surveys which review the literature in the field of visualization that supports close and distant reading of textual data by Jänicke et al. [27] and an extended version of this survey by Jänicke et al. [10].
Jänicke et al. [27] provide an overview of the last ten years of advancements in the field of visualization that support Digital Humanities tasks. They classify the literature based on the representation: Whether it supports close reading or distant reading as proposed by Moretti [39]. Close reading attempts to provide direct access to the original textual content in its sequential order while distant reading does not retain the source text and provides an overview of its global features. The large availability of digital texts introduced by web portals such as Google Books [40] opens new avenues for close reading techniques and collaborative tools.
Jänicke et al. [27] classify the methods found in their collection based on task supported (close, distant or combined) reading. Furthermore, the review classifies each paper based on the underlying source text (single text, parallel, and corpus) with an extended subdivision in each category. Figure 5 shows a summary table of the proposed classification. In the following, we summarize the classification proposed.
Close Reading Techniques: There are a number of techniques that have been applied in the 46 papers included in the research paper collection that provide visual support for close reading visualization as follows:
  • Color is used to show a great variety of features, e.g., classification, similarity or importance.
  • Font size is also used to convey text features, e.g., word frequency or significance.
  • Glyphs are used to present some aspects of the text that are difficult to express using other techniques and are mostly used in poems to draw phonetic units.
  • Connections help illustrate the relationship between text entities, e.g., to show subsequent words to track variation among various text editions or to convey sentence structure.
Distant Reading Techniques: Eighty-one research papers in the collection provide an abstract distant reading view of text. There are several approaches used to visualize summarized information as the following:
  • Structural overviews illustrate the hierarchy of document or collection of documents.
  • Heat maps are usually used to show textual patterns such as similarities.
  • Tag clouds encode word occurrence frequency within a text using variable font size.
  • Maps display geospatial information contained in a text.
  • Timelines are used to visualize text that conveys temporal information. Such a technique could use the text’s meta-data and support the temporal analysis of the use of a word over time.
  • Graphs usually use nodes and edges to visualize certain structural features of a text corpus.
  • Miscellaneous methods are used to explore specific aspects within text interactively.
Techniques for Combining Close and Distant Reading: There are still some visual designs that provide both close and distant reading by preserving direct access to the source text. The 26 papers in the collection that use hybrid techniques and serve this purpose are grouped into three categories as follows:
  • Top-down approaches implement the information seeking mantra, ‘overview first, zoom and filter, details-on-demand’ [37]. Initially, an overview of the textual data is shown, and then the user interacts with the graphics by filtering or zooming, and finally, clicking on the interesting sub-set to obtain details-on-demand.
  • Bottom-up methods start with the desired text or part of it and then generate an overview layout which relates to the given section or text.
  • Top-down and bottom-up methods provide a mechanism of switching between close (text view) and distant reading (structural overview).
Jänicke et al. extend the survey in 2017 [10]. In terms of classification, they add a categorization of the text analysis techniques which includes 22 more papers than the original version. The text analysis taxonomy has five main categories: Named entities, topics, similar patterns, text of interest, and corpus analysis. They also, extend the discussion of collaboration experiences and future challenges.

2.5. Satellite-Themed Text Visualization Surveys

There are two surveys that review the broader information visualization literature and consider text visualization as a sub-section in their overview classification by Sun et al. [15] and Liu et al. [16]. This is in contrast to focusing on text only like the previous surveys.
Sun et al. [15] review the recent developments in the field of visual analytics. They propose a 2D classification which they call Analytics Space.
The first dimension is an applications category which includes: Space & time, multivariate, text, graph and others. The second dimension is motivated by the visual analytics model proposed by Keim et al. [41] which includes: Visual mapping, model-based analysis, and user interaction. With respect to text classification, Sun et al. provide two categories to organize methods that process text data. The first category includes topic-based approaches which mostly leverage algorithms from Natural Language Processing (NLP). In this category, the methods that involve topics or event extraction from the text data are included e.g., TextFlow [42] and EventReader [43]. The second category is feature-based approaches which use text features to visualize text e.g., Wordle [29] and FacetAtlas [44].
Similarly, Liu et al. [16] include a category of application within their information visualization taxonomy that includes four categories: Empirical methodologies, interactions, frameworks, and application. In the application category, they [16] include four applications to classify: Graph, text, map and multivariate data visual designs. There are two categories assigned to the text visualization collection. The first category is applications that visualize static textual information. In this category, they discuss and classify techniques that visualize the time-invariant content of the document(s). The second category is the visualization of dynamic textual information. In this category, they present designs that visualize temporal changes within a document or collection of documents. In both categories, Liu et al. group the techniques, similarly to Sun et al. [15], into two categories: Feature-based and topic-based approaches.

2.6. Survey Recommendations

As a starting point, we think that the multi-faceted surveys are a good place to begin. Wanner et al. [26] and Kucher and Kerren [4] provide well-crafted taxonomies. The former survey provides a guide for researchers interested in extracting events from text. The taxonomy itself is not complicated and is built on the literature they collected. It also provides a classification of the evaluation techniques that are used in each approach. Wanner et al. identify trends, research directions, and untouched areas in the discussion of their taxonomy which may also be beneficial for readers.
On the other hand, the Kucher and Kerren [4] classification covers many aspects of text visual analytics. We recommend it for researchers who would like to explore or contribute to the field of text visualization. It provides the most comprehensive and up-to-date summary of text visualization [24] out of the surveys. The survey’s associated text visualization browser enables the user to explore and filter the collection based on the classification.
Liu et al. [11] try to bridge the gap between the text mining and visualization approaches. Their web-based, interactive visualization is a useful tool that integrates both text mining and text visualization with the analysis tasks abstraction.
For researchers interested in the digital humanities we recommend Jänicke et al. [10]. They provide a comprehensive overview and discussion of text visualization techniques in a humanities context.
Figure 6 illustrates the most frequently occurring bi-grams. In the preprocessing phase, the stopwords are removed and then lemmatization is applied to consolidate inflected words. After that, we create the word clouds using the script by Müller [45]. The figure clearly illustrates the theme of each paper. Wanner et al. [26] surveys shows (Figure 6a) a significant use of words such as detection, event in a context like ‘event detection’, ‘detect event’, and ‘text event’. Also, Wanner et al. is the first survey to consider microblogging as a data source which can be seen in the figure as well. In Kucher and Kerren [4], as shown in Figure 6b, multiple term pairs are used often such as, ‘text visualization’, ‘visualization technique’, and not surprisingly ‘survey browser’, and ‘proposed taxonomy’. On the other hand, an obvious change of vocabulary in Jänicke et al. [10] (Figure 6c) which discuss the approaches within a different context. There is a more frequent occurrence of bi-grams that convey digital humanities goals such as ‘distant reading’, ‘close reading’, and ‘digital humanities’. Figure 6d shows the bi-grams that most often appear in Liu et al. [11] survey. The words ‘mining’, ‘task’, and ‘visualization’ are the most shared among the term pairs and that clearly the theme of the survey to fill in the gap between visualization and mining literature via the abstracted analysis tasks.
Also, Figure 7 provides a list of the top bi-grams using TF–IDF (Term Frequency—Inverse Document Frequency) to measure the significance of each pair across the collection [46]. We follow the same preprocessing steps to generate word cloud in Figure 6, except we use the weighting factor of each pair in the corresponding survey with respect to the other surveys. The topics ‘document collect’, ‘document visual’, and ‘text collect’ are featured in the three ‘Data Source’ classified surveys, Alencar et al. [21], Gan et al. [22], and Nualart-Vilaplana et al. [23] respectively, with the exception of the Cau and Cui [24] survey which features the topic ‘document collect’ quite often. On the other hand, Cau and Cui [24] survey features the topic ‘document similar’ which support our classification. However, the top words of the second survey in the task analysis group Federico et al. [25] shows a topic pattern that does not align with our classification, e.g., ‘data type’, and ‘node link’. The topic ‘event detect’ is featured highly in the survey by Wanner et al. [26] as expected. Also, other taxonomy words appear, such as ‘text process’ and ‘data source’ which support that they provide multiple classifications of the approaches, and that applies for must of the multi-faceted surveys.
We developed a web-based parallel coordinates plot to interactively explore the vocabulary of the surveys, and to further examine correlation and overlap among them [47]. In Figure 8, the most common vocabulary (>1%) between the two surveys from the cross-disciplinary group (Jänicke et al. [27] and Jänicke et al. [10]) are shown. Obviously, the two surveys complement each other. Distinctive words like ‘human’-ity, ‘digit’-al, ‘read’-ing, and ‘close’ are shared distinctively between them.
The illustration in Figure 9 shows the number of papers reviewed by each survey. We can see that there is a clear increase of reviewed approaches between 2012 and 2016 which are cited mainly by Kucher and Kerren [4] and Liu et al. [11]. Also, the satellite-themed surveys share the same time span of literature (2009 to 2013). The two cross-disciplinary surveys shares almost the same literature, however, the later covers two additional years (2015 and 2016) which include 30 extra papers.

3. Discussion of Future Challenges

In this section, we summarize the future challenges that are identified in the collection. In Table 3 we list the challenges along with the surveys. We add the McNabb and Laramee survey [7] to identify the overlapping challenges reported by them. We identify four unique challenges that are not reported by McNabb and Laramee since their challenges are derived from a wider perspective. These challenges are adopting advanced text mining techniques, lacking the cognitive and/or psychological analysis, lacking clear boundaries of concepts, and the need for a collaboration framework between multidisciplinary scholars.
Nine challenges are common to two or more surveys. Federico et al. [25] identify 10 future challenges, three of which are unique. The eldest two surveys by Šilić and Bašić [5] and Alancer et al. [21] and the two multi-faceted surveys Wanneret al. [26] and Kucher and Kerren [4] do not feature unique future challenges. This reflects that these surveys do not focus on a specific discipline or task. On the other hand, Jänicke et al. [10,27] identify two unique future challenges which indicate that they feature a distinctive theme.
One of the most common future challenges is the need for an in-depth, effective quantitative or qualitative evaluation. This challenge is mentioned in nine surveys of the collection. Most of the surveys report a lack of in-depth evaluation of the proposed approaches. Advanced and formal evaluation provide valuable user feedback and facilitate identification of the potential problem with the systems [15]. Wanner et al. [26] expect a rise in user study evaluation to verify the strength and weakness of novel visual designs. We believe that further research in the effectiveness of text visualization evaluation is encouraged.
Scalability and handling huge volumes of data is one of the most reported challenges. Approaches usually use various aggregations, projections, or multiple views to address this issue. However, further investigation is needed to validate the usefulness and effectiveness of such approaches, especially for scientific literature [25]. This challenge is generally associated with the challenge of adopting advanced text mining and linguistics algorithms.
Because natural language often comes with ambiguity, uncertainty, and/or errors, five surveys report this as a challenging task. Many approaches do not consider uncertainty and that could affect the analysis results. Appropriate uncertainty visualization approaches should be developed [25]. In the Text Visualization Browser [4], there are 25 articles that include visualization of uncertainty and ambiguity, 12 of them were published in 2016 and 2017. Jänicke et al. [10,27] specifically consider the temporal and geospatial uncertainty in literature as an important future challenge. Uncertainty modeling and visualization research is expected to rise.
Another common challenge is the lack of user interaction in order to support the analysis process. Many approaches represent the outcome of the analysis process visually and do not provide means for the user to steer the underlying algorithms to further analyze the data [25,26]. We expect future work in the interactivity of visual analytics.
Jänicke et al. [10,27] and Federico et al. [25] reported multidisciplinary as a challenging research topic. They suggest a systematic approach that guides and steers the work between scientist and domain experts. The former two surveys by Jänicke et al. summarize the experiences reported regarding collaborations between visualization scientist and humanities scholars.
Lacking the cognitive and/or psychological analysis that verifies how users perceive and preserve information and incorporate it into the decision-making process is a challenging task reported in two surveys Šilić and Bašić [5] and Alencar et al. [21].
Many of the visual designs are targeted towards a specific point and do not support multiple tasks. Gan et al. [22] believe that it is essential to design general visualization models for different tasks. Alencar et al. [21] confirm that it is challenging to approach a problem without a domain-specific solution. However, users might have different goals or needs and the visual design should accommodate that.
In the text visualization community, experts always face the challenge of an ill-defined concept of ‘event’ and other general elements of textual data [26]. Such a problem may distract the devoted effort of experts. Nualart–Vilaplana et al. [23] also believe that the boundaries of the discipline in data visualization are not well-defined yet.
Since the surveys vary in terms of global goals and targets, there are specific challenges reported within a given context. Jänicke et al. report the lack of visualization approaches that represent a transposition of textual entities on all text hierarchy levels using close and distant reading. Federico et al. [25] expect a rise in the approaches that integrate citation analysis and other text mining techniques such as sentiment analysis in order to understand the citations and enrich the analysis. Nualart–Vilaplana et al. [23] pose an interesting question about the long-term availability of the tools. They argue that if the tool is no longer available and is not maintained for use, perhaps the tool is not effective.

4. Conclusions

In this text visualization SoS, we present an extended meta-survey of the reviews of literature in the field of text visualization. We classify the survey collection based on five themes. We summarize each survey classification and its features in order to facilitate comparisons of the surveys. Then, we provide survey recommendations for researchers in the field of text visualization. The survey discusses and compares the field challenges reported within the collection, and examines potential future trends. This review offers a unique, valuable starting point and comprehensive overview for both newcomers and experienced researchers in text visualization.

Author Contributions

Conceptualization, M.A. and R.S.L; methodology, M.A. and R.S.L; software, M.A.; validation, R.S.L.; formal analysis, M.A. and R.S.L; investigation, M.A.; resources, R.S.L; data curation, M.A.; writing—original draft preparation, M.A. and R.S.L; writing—review and editing, M.A. and R.S.L; visualization, M.A.; supervision, R.S.L; project administration, R.S.L; funding acquisition, R.S.L.

Funding

The authors gratefully thank the funding from the Technical and Vocational Training Corporation (TVTC) and the Saudi Cultural Bureau.

Acknowledgments

We also thank Richard Roberts, Liam McNabb, and Dylan Rees for providing valuable feedback and proofreading the manuscript.

Conflicts of Interest

The authors declare no conflict of interest. The funders had no role in the design of the study; in the collection, analyses, or interpretation of data; in the writing of the manuscript, or in the decision to publish the results.

References

  1. Reddy, R.; StClair, G. The million book digital library project. Comput. Sci. Present. 2001. Available online: www.rr.cs.cmu.edu/mbdl.doc (accessed on 18 February 2019).
  2. Andre, P.Q.; Eaton, N.L. National agricultural text digitizing project. Libr. Hi Tech. 1988, 6, 61–66. [Google Scholar] [CrossRef]
  3. Mendelsson, D.; Falk, E.; Oliver, A.L. The Albert Einstein archives digitization project: Opening hidden treasures. Libr. Hi Tech. 2014, 32, 318–335. [Google Scholar] [CrossRef]
  4. Kucher, K.; Kerren, A. Text visualization techniques: Taxonomy, visual survey, and community insights. In Proceedings of the 8th IEEE Pacific Visualization Symposium (PacificVis 2015), Hangzhou, China, 14–17 April 2015. [Google Scholar]
  5. Šilić, A.; Bašić, B. Visualization of text streams: A survey. In Proceedings of the International Conference on Knowledge-Based and Intelligent Information and Engineering Systems, Cardiff, UK, 12–14 September 2010. [Google Scholar]
  6. Alharbi, M.; Laramee, R.S. SoS TextVis: A Survey of Surveys on Text Visualization. In Proceedings of the Computer Graphics & Visual Computing (CGVC), Wales, UK, 13–14 September 2018. [Google Scholar]
  7. McNabb, L.; Laramee, R.S. Survey of Surveys (SoS)—Mapping The Landscape of Survey Papers in Information Visualization. Comput. Graph. Forum 2017, 36, 589–617. [Google Scholar] [CrossRef]
  8. Rees, D.; Laramee, R.S. A Survey of Information Visualization Books. Comput. Graph. Forum 2019. [Google Scholar] [CrossRef]
  9. Kucher, K.; Paradis, C.; Kerren, A. The State of the Art in Sentiment Visualization. Comput. Graph. Forum 2018, 37, 71–96. [Google Scholar] [CrossRef]
  10. Jänicke, S.; Franzini, G.; Cheema, M.; Scheuermann, G. Visual text analysis in digital humanities. Comput. Graph. Forum 2017, 36, 226–250. [Google Scholar] [CrossRef]
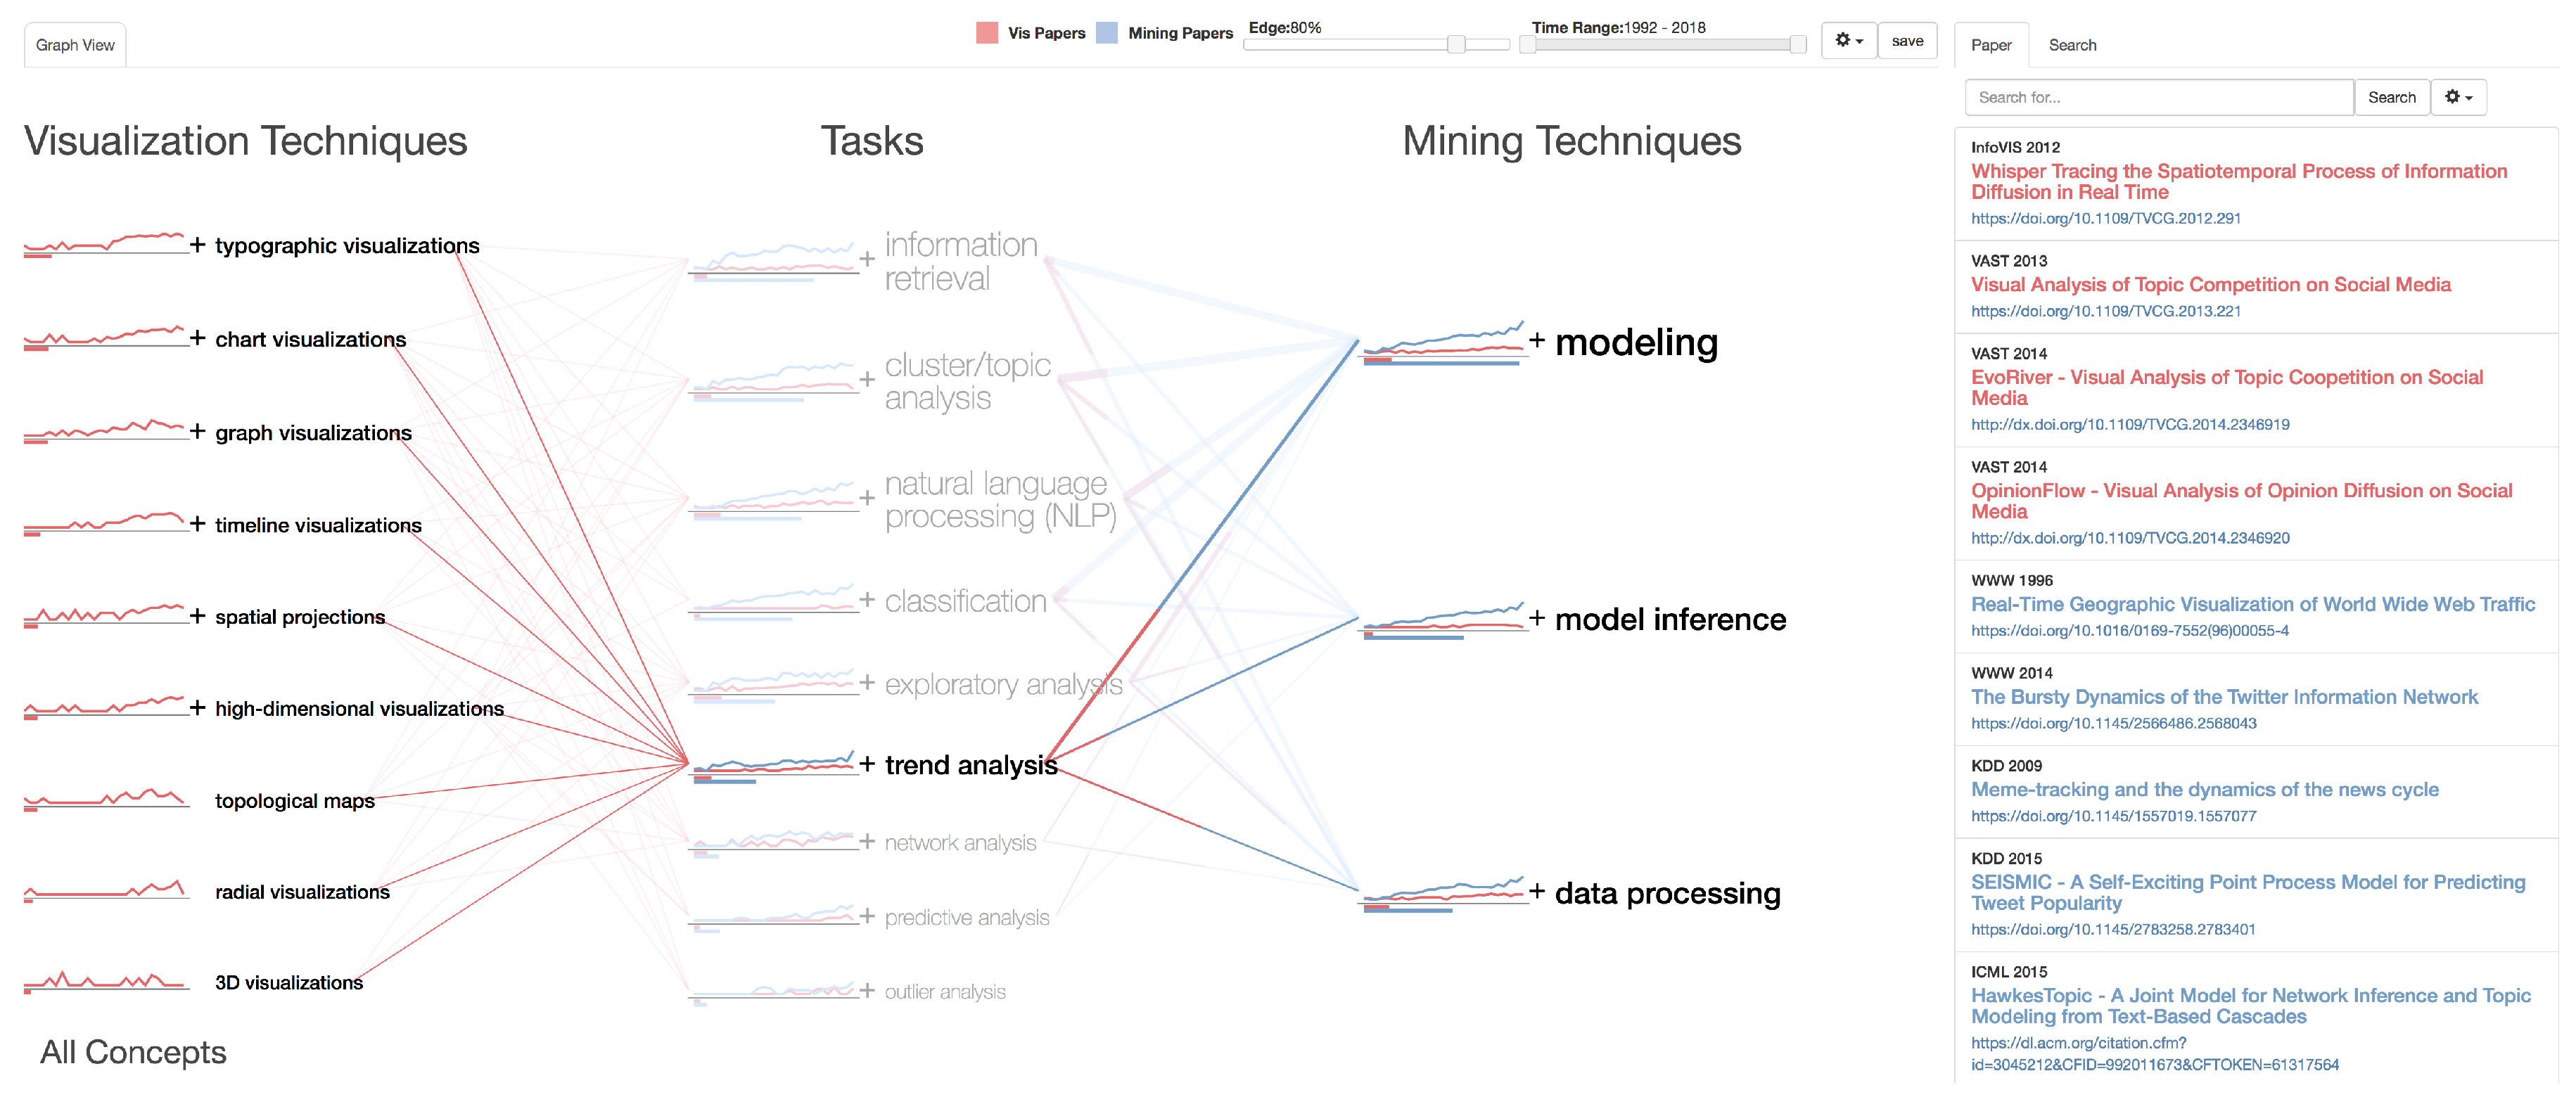
  11. Liu, S.; Wang, X.; Collins, C.; Dou, W.; Ouyang, F.; El-Assady, M.; Jiang, L.; Keim, D. Bridging text visualization and mining: A task-driven survey. IEEE Trans.Vis. Comput. Graph. 2018. [Google Scholar] [CrossRef]
  12. IEEE Xplore. Available online: http://ieeexplore.ieee.org/Xplore/home.jsp (accessed on 26 February 2017).
  13. ACM Digital Library. Available online: http://dl.acm.org/ (accessed on 26 May 2017).
  14. Google Scholar. Available online: https://scholar.google.co.uk/ (accessed on 20 January 2017).
  15. Sun, G.D.; Wu, Y.C.; Liang, R.H.; Liu, S.X. A survey of visual analytics techniques and applications: State-of-the-art research and future challenges. J. Comput. Sci. Technol. 2013, 28, 852–867. [Google Scholar] [CrossRef]
  16. Liu, S.; Cui, W.; Wu, Y.; Liu, M. A survey on information visualization: Recent advances and challenges. Vis. Comput. 2014, 30, 1373–1393. [Google Scholar] [CrossRef]
  17. Gupta, V.; Lehal, G.S. A survey of text summarization extractive techniques. J. Emerg. Technol. Web Intell. 2010, 2, 258–268. [Google Scholar] [CrossRef]
  18. Aggarwal, C.C.; Zhai, C. A survey of text clustering algorithms. In Mining Text Data; Springer: Berlin/Heidelberg, Germany, 2012. [Google Scholar]
  19. Jung, K.; Kim, K.I.; Jain, A.K. Text information extraction in images and video: A survey. Pattern Recognit. 2004, 37, 977–997. [Google Scholar] [CrossRef]
  20. Card, S.K.; Mackinlay, J.D.; Shneiderman, B. Readings in Information Visualization: Using Vision to Think; Morgan Kaufmann Publishers: Burlington, MA, USA, 1999. [Google Scholar]
  21. Alencar, A.B.; de Oliveira, M.C.F.; Paulovich, F.V. Seeing beyond reading: A survey on visual text analytics. Wiley Interdiscip. Rev. Data Min. Knowl. Discov. 2012, 2, 476–492. [Google Scholar] [CrossRef]
  22. Gan, Q.; Zhu, M.; Li, M.; Liang, T.; Cao, Y.; Zhou, B. Document Visualization: An Overview of Current Research. Wiley Interdiscip. Rev. Comput. Stat. 2014, 6, 19–36. [Google Scholar] [CrossRef]
  23. Nualart-Vilaplana, J.; Pérez-Montoro, M.; Whitelaw, M. How we draw texts: A review of approaches to text visualization and exploration. El Prof. Inf. 2014, 23, 221–235. [Google Scholar] [CrossRef] [Green Version]
  24. Cao, N.; Cui, W. Overview of Text Visualization Techniques. In Introduction to Text Visualization; Springer: Berlin/Heidelberg, Germany, 2016; pp. 11–40. [Google Scholar]
  25. Federico, P.; Heimerl, F.; Koch, S.; Miksch, S. A Survey on Visual Approaches for Analyzing Scientific Literature and Patents. IEEE Trans. Vis. Comput. Graph. 2016, 23, 2179–2198. [Google Scholar] [CrossRef] [PubMed]
  26. Wanner, F.; Stoffel, A.; Jäckle, D.; Kwon, B.C.; Weiler, A.; Keim, D.A. State-of-the-art report of visual analysis for event detection in text data streams. Comput. Graph. Forum 2014, 33, 1–15. [Google Scholar]
  27. Jänicke, S.; Franzini, G.; Cheema, M.F.; Scheuermann, G. On close and distant reading in digital humanities: A survey and future challenges. In Proceedings of the Eurographics Conference on Visualization (EuroVis) 2015, Cagliari, Italy, 25–29 May 2015. [Google Scholar]
  28. Steinbock, D. TagCrowd. Available online: http://www.tagcrowd.com/blog/about/ (accessed on 13 Feburary 2018).
  29. Viegas, F.B.; Wattenberg, M.; Feinberg, J. Participatory visualization with wordle. IEEE Trans. Vis. Comput. Graph. 2009, 15, 1137–1144. [Google Scholar] [CrossRef]
  30. Skupin, A. A cartographic approach to visualizing conference abstracts. IEEE Comput. Graph. Appl. 2002, 22, 50–58. [Google Scholar] [CrossRef]
  31. Wise, J.A. The ecological approach to text visualization. J. Assoc. Inf. Sci. Technol. 1999, 50, 1224. [Google Scholar] [CrossRef]
  32. Andrews, K.; Kienreich, W.; Sabol, V.; Becker, J.; Droschl, G.; Kappe, F.; Granitzer, M.; Auer, P.; Tochtermann, K. The infosky visual explorer: Exploiting hierarchical structure and document similarities. Inf. Vis. 2002, 1, 166–181. [Google Scholar] [CrossRef]
  33. Strobelt, H.; Oelke, D.; Rohrdantz, C.; Stoffel, A.; Keim, D.A.; Deussen, O. Document cards: A top trumps visualization for documents. IEEE Trans. Vis. Comput. Graph. 2009, 15, 1145–1152. [Google Scholar] [CrossRef] [PubMed]
  34. Liu, J.W.; Huang, L.C. Detecting and Visualizing Emerging Trends and Transient Patterns in Fuel Cell Scientific Literature. In Proceedings of the International Conference on Wireless Communications, Networking and Mobile Computing, Dalian, China, 19–21 September 2008. [Google Scholar]
  35. Lee, B.; Riche, N.H.; Karlson, A.K.; Carpendale, S. Sparkclouds: Visualizing trends in tag clouds. IEEE Trans. Vis. Comput. Graph. 2010, 16, 1182–1189. [Google Scholar] [PubMed]
  36. Hearst, M.A. TileBars: Visualization of term distribution information in full text information access. In Proceedings of the Human Factors in Computing Systems, CHI ’95 Conference Proceedings, Denver, CO, USA, 7–11 May 1995. [Google Scholar]
  37. Shneiderman, B. The eyes have it: A task by data type taxonomy for information visualizations. In The Craft of Information Visualization; Elsevier: Amsterdam, The Netherlands, 1996. [Google Scholar]
  38. Andrienko, N.; Andrienko, G. Exploratory Analysis of Spatial and Temporal Data: A Systematic Approach; Springer Science & Business Media: Berlin/Heidelberg, Germany, 2006. [Google Scholar]
  39. Moretti, F. Graphs, Maps, Trees: Abstract Models for a Literary History; Verso: New York, NY, USA, 2005. [Google Scholar]
  40. Google Books. Available online: https://books.google.com/ (accessed on 17 April 2017).
  41. Keim, D.; Ellis, G.; Mansmann, F. Mastering the information age solving problems with visual analytics. Eurographics 2010, 2, 5. [Google Scholar]
  42. Cui, W.; Liu, S.; Tan, L.; Shi, C.; Song, Y.; Gao, Z.; Qu, H.; Tong, X. Textflow: Towards better understanding of evolving topics in text. IEEE Trans. Vis. Comput. Graph. 2011, 17, 2412–2421. [Google Scholar] [CrossRef] [PubMed]
  43. Luo, D.; Yang, J.; Krstajic, M.; Ribarsky, W.; Keim, D. Eventriver: Visually exploring text collections with temporal references. IEEE Trans. Vis. Comput. Graph. 2012, 18, 93–105. [Google Scholar] [PubMed]
  44. Cao, N.; Sun, J.; Lin, Y.R.; Gotz, D.; Liu, S.; Qu, H. Facetatlas: Multifaceted visualization for rich text corpora. IEEE Trans. Vis. Comput. Graph. 2010, 16, 1172–1181. [Google Scholar] [PubMed]
  45. Mueller, A. Word_cloud: A Little Word Cloud Generator in Python. Available online: https://github.com/amueller/word_cloud (accessed on 15 December 2018).
  46. Salton, G.; Wong, A.; Yang, C.S. A vector space model for automatic indexing. Commun. ACM 1975, 18, 613–620. [Google Scholar] [CrossRef] [Green Version]
  47. Alharbi, M.; Laramee, R.S. Parallel Coordinates of SoS. Available online: http://cs.swan.ac.uk/~msalharbi/pc_public/ (accessed on 15 November 2018).
Figure 1. The text visualization surveys from 2010 to 2018. Blue bars indicate the number of methods reviewed in each survey. Orange bars show the number of citations each survey attracts. In term of the number of surveys, 2014 dominates with four surveys. However, with the respect to the number of techniques, surveys from 2015 review 480 methods collectively.
Computers 08 00017 g001
Figure 2. Text visualization methods presented by Šilić and Bašić [5]. The table summarizes the methods, their underlying algorithms, the publication year, whether the method includes a temporal presentation or not, and the data type that the method operates on (C: Collection of text, S: Single text, SI: Short intervals). In the ‘Temporal’ column, if the method conveys time, it has (+), (−) if it does not, and (N/A) if not applicable. Reproduced with permission from the author, Knowledge-based and intelligent information and engineering systems; published by Springer, 2010.
Computers 08 00017 g002
Figure 3. The classification of text visualization techniques used in the survey by Kucher and Kerren [4]. Reproduced with permission from the author, IEEE Pacific Visualization Symposium; published by IEEE, 2015.
Computers 08 00017 g003
Figure 4. A snapshot of the recent web-based visualization tool developed by Liu et al. [11]. The visualization and text mining techniques are connected by their shared analysis tasks. On the right, a list of the corresponding literature that matches user preference. The red and blue colors correspond to the fields, visualization and data mining respectively.
Computers 08 00017 g004
Figure 5. Hierarchical classification of research papers reviewed by Jänicke et al. [27]. At the top-right, the intended tasks supported by the visual design and the techniques implemented. On the left, the rows show the paper classification organization. Reproduced with permission from the author, Eurographics Conference on Visualization (EuroVis)-STARs; published by The Eurographics Association, 2015.
Computers 08 00017 g005
Figure 6. A bi-gram word cloud representation of the surveys [4,10,11,26] to illustrate the vocabulary used in each one. We apply the word clouds using the script by Müller [45]. (a) Wanner et al. [26]; (b) Kucher and Kerren [4]; (c) Jänicke et al. [10]; (d) Liu et al. [11].wc1
Computers 08 00017 g006
Figure 7. A list of the most common bi-grams extracted from the collective surveys. The color mapping of the cells indicates the weights of the corresponding bi-gram.
Computers 08 00017 g007
Figure 8. A snapshot of the web-based parallel coordinates plot that is developed to explore the vocabulary of the surveys interactively. Each vertical line represents a survey except the first dimension on the left which corresponds to the occurrence frequency. Each colored line represents a word. The intersection between the word line and the survey vertical line depicts the word weights in that survey. Here, the user selects the most common vocabulary (>1%) between the two surveys from the cross-disciplinary group [47].
Computers 08 00017 g008
Figure 9. Visualization of the number of approaches reviewed by the surveys. Each row represents a survey and each cell represents the number of references in the corresponding year (columns). The color mapping of the cells indicates the number of approaches cited within each survey in the corresponding year. The last column shows the total methods each survey includes.
Computers 08 00017 g009
Table 1. A list of literature sources searched for text visualization surveys. We mainly use IEEE Xplore [12], the ACM Digital Library [13], and Google Scholar [14] to search for literature.
Conferences & JournalsPapers
Springer4
The Annual EuroVis Conference/Computer Graphics Forum3
Wiley Online Library3
IEEE Transactions on Visualization and Computer Graphics2
El profesional de la información1
Journal of Visual Languages & Computing0
Information Visualization Journal0
ACM Computing Surveys0
Proceedings of the Annual Conference of the Alliance of Digital Humanities Organizations0
Literary and Linguistic Computing0
Digital Humanities Quarterly0
Total14
Table 2. Classification of our collection of 14 text visualization surveys. There are five categories: Data source, task analysis, multi-faceted, cross-disciplinary, and satellite-themed in to which the literature is grouped.
Document-CenteredUser Task AnalysisMulti-FacetedCross-DisciplinarySatellite-Themed
Alencar et al. [21]
Gan et al. [22]
Nualart-Vilaplana et al. [23]
Cau and Cui [24]
Federico et al. [25]
Šilić and Bašić [5]
Wanner et al. [26]
Kucher and Kerren [4]
Kucher et al. [9]
Liu et al. [11]
Jänicke et al. [27]
Jänicke et al. [10]
Sun et al. [15]
Liu et al. [16]
Table 3. Summary of the future challenges reported in our collection of surveys. This list contains the common challenges among the text visualization surveys.
Future ChallengesSoS [7][5][21][15][22][23][26][16][4][27][25][24][9][10][11]Total
Scalability9
Lacking in-depth/effective quantitative or qualitative evaluation9
Adopting advanced linguistics techniques8
Natural language ambiguity and uncertainty6
Lacking user interactivity that support the analysis tasks5
Designing general models for different tasks (versatility)4
Multidisciplinary framework3
Lacking of cognitive and/or psychological analysis2
Lacking well-defined general concepts2

