5. Development
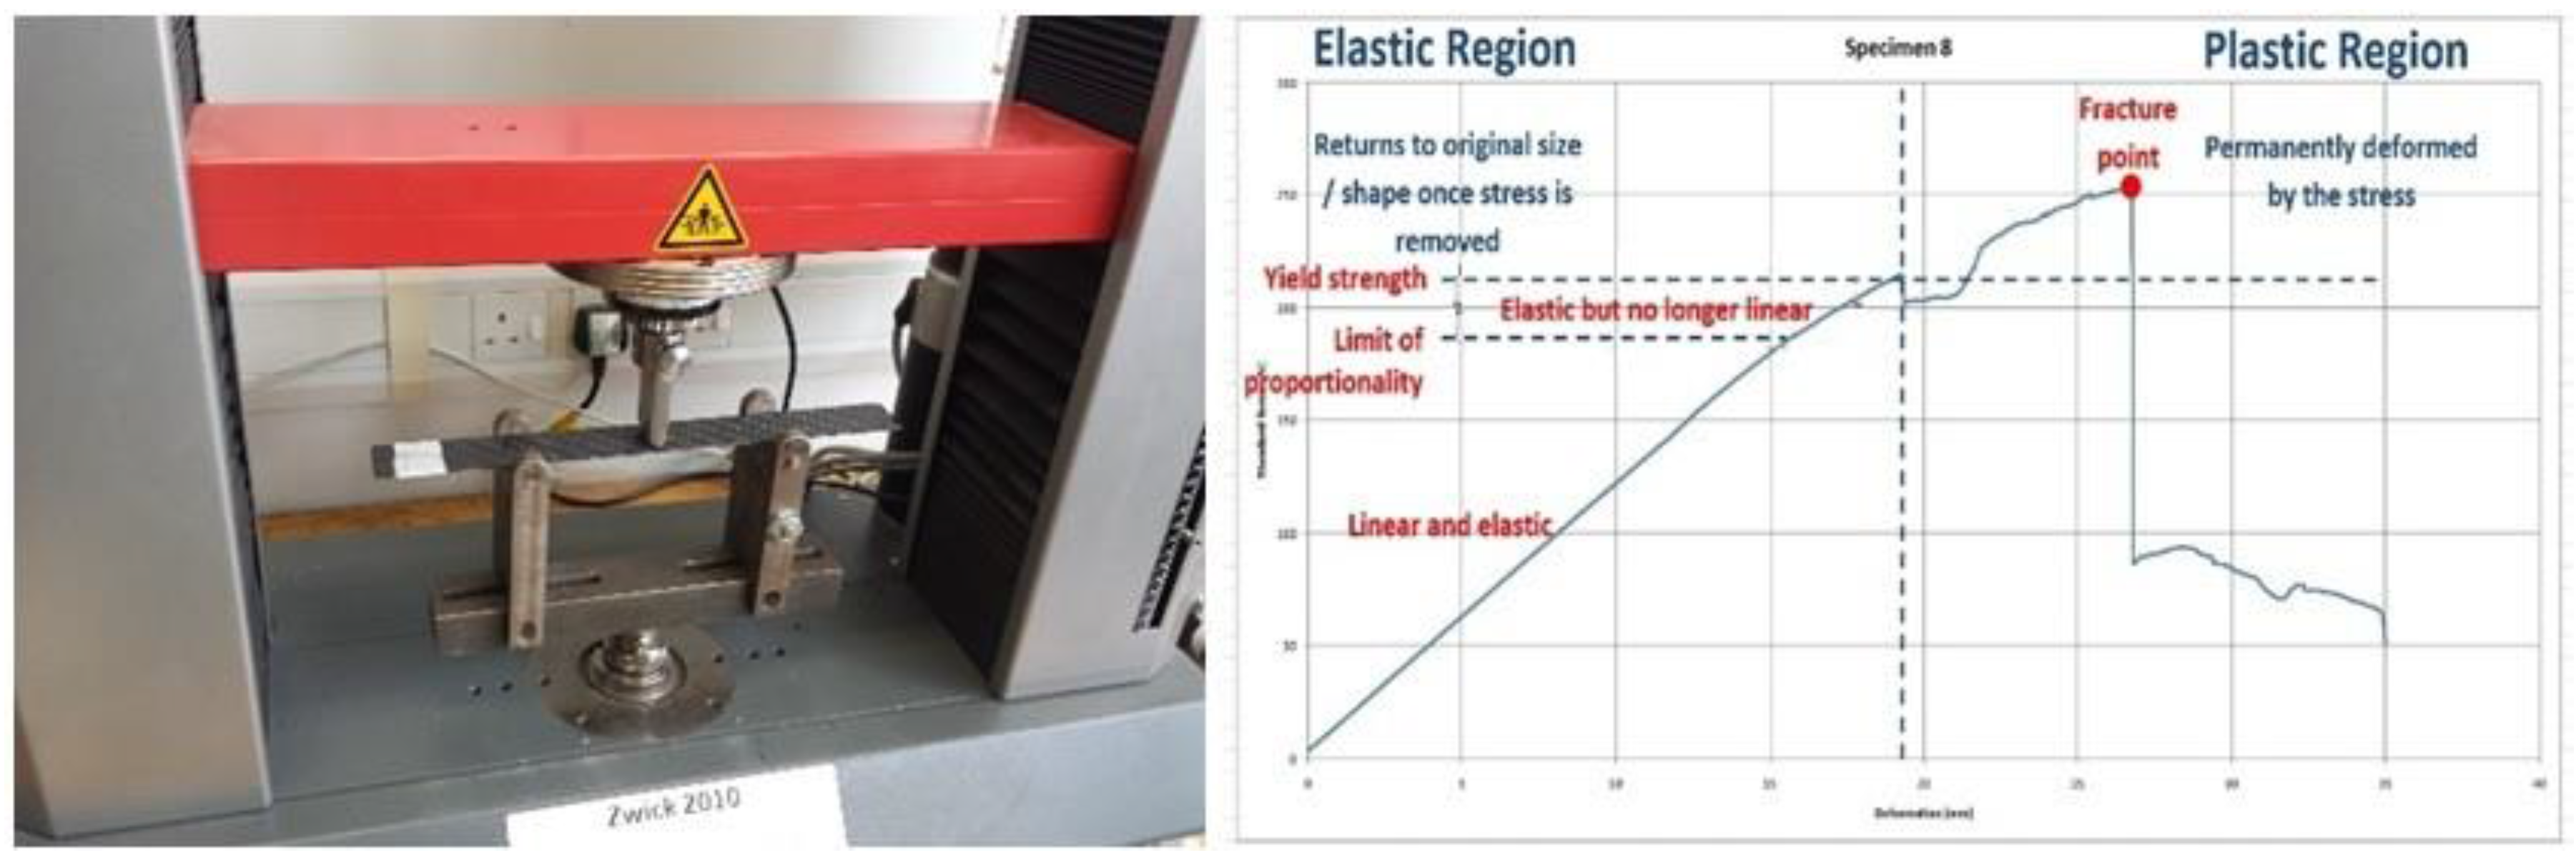
Currently, tests have been conducted on multiple carbon fibre samples with a 4-ply stack of 30 × 300 mm dimension with promising results for the mesh structure consistent with the implementation in the drone application in the paper. With reference to
Figure 4, a specimen test setup on a Zwick Z010 machine (Ulm, Germany) (left) can be seen for a 3-point flexural test with the corresponding data (right), and regions of interest have been added to the graph to aid analysis.
From the batch samples tested, there was approximately a 50% success rate at detecting damage when the sample transitioned between the elastic region to the plastic region. As can be shown in the above chart, considerable damage occurs in this area, although there may be no observable signs of degradation. Results for this batch sample include the mesh system embedded within each ply stack of the sample, which consists of enamelled copper wire of 0.22 mm diameter. The limited detection rate at this transition stage has been concluded to be the result of inadequate coverage of the wire mesh within the plies, coupled with the mesh material being copper and its large diameter. The reason for this is that the fracture lines are not always located at the imbedded mesh location. It is also possible to not be detected due to the elastic modulus of copper. This is more easily recognised with the magnified image of a specimen sample as shown in
Figure 5.
The left image shows the three mesh wires embedded between the plies, the upper wire would be ply 1 and 2 the middle wire ply 2 and 3 and the lower wire ply 3 and 4, which completes the 4-ply carbon sample makeup. It can be seen that the wire mesh almost identically aligns on the vertical plane, which allows for a large area of the carbon fiber to be absent with the detection method. The image on the right (
Figure 5) shows necking in the copper wire. Due to the cured carbon epoxy composite being more rigid than the enameled copper wire, it is possible for the carbon to suffer damage before the copper wire becomes severed. The result is that copper is a less than optimal material choice, and this effect is expected to be minimized by reducing wire diameter. However, under no circumstance has the system failed to trigger a damage event when substantial damage has occurred in the sample specimens under flexural tests. Further work is required to perfect the mesh system, which will allow for increased damage detection rates before catastrophic failure. Works are focusing on detection materials that are more closely aligned with carbon fibers’ Young’s modulus and indeed carbon fiber itself is being used with various methods to insulate the carbon mesh from the structure without reducing the structural integrity of the specimen.
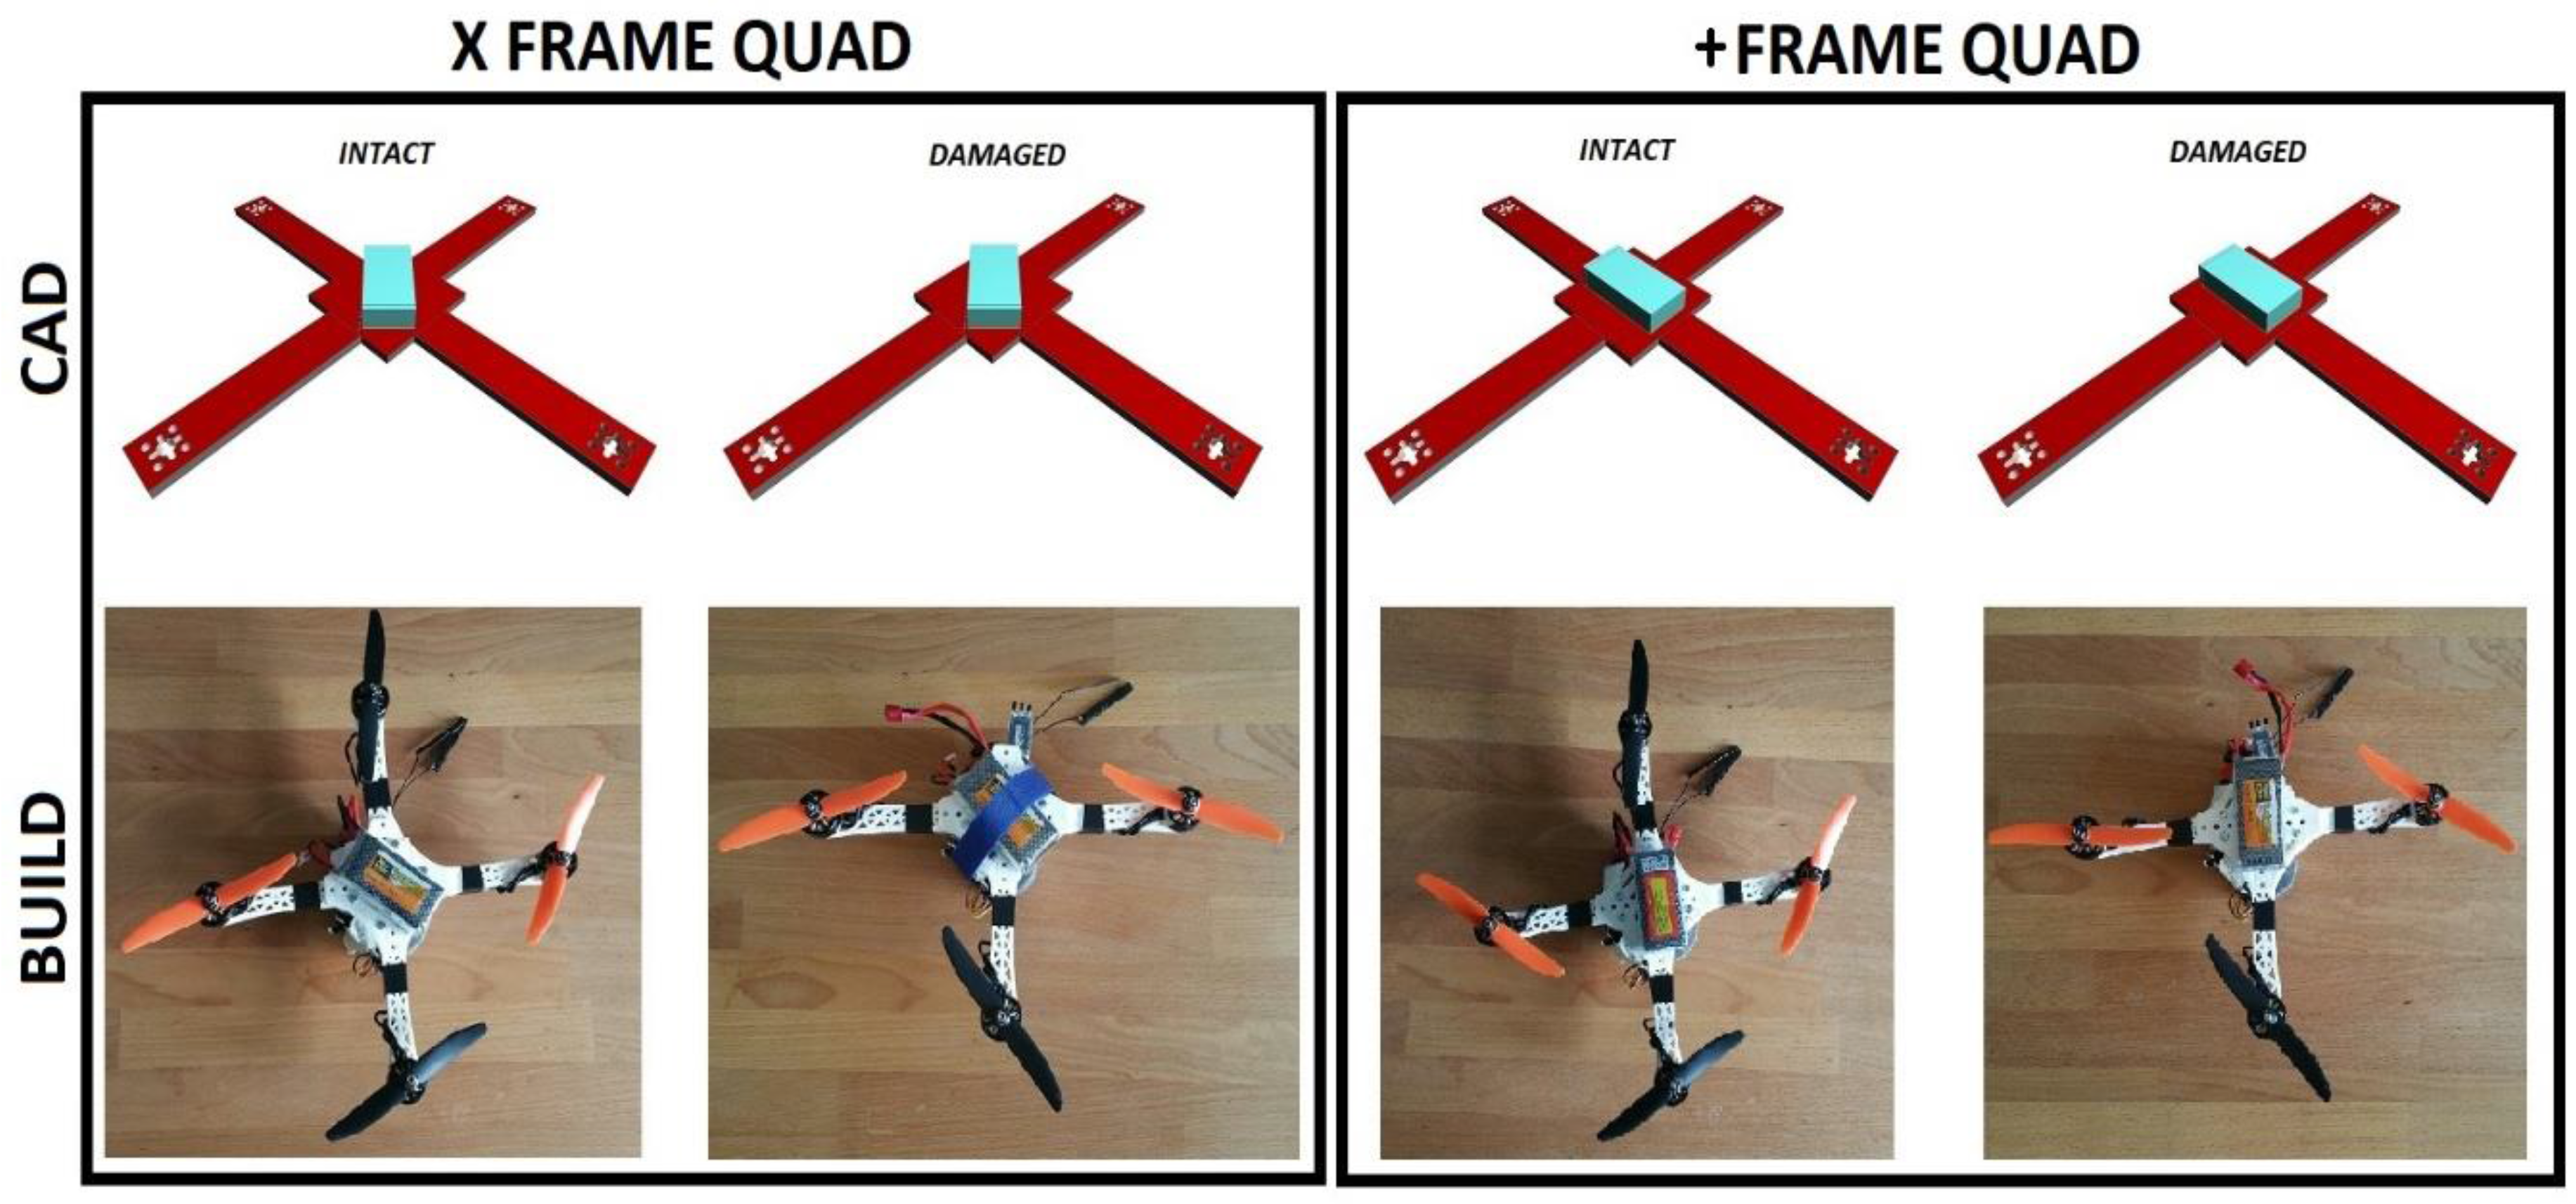
Drone testing on a hybrid-X frame structure with a missing flight arm/rotor has shown that altering the flight controller to a tricopter setup has reduced impact when in a crash scenario. The hybrid-X frame that strongly resembles the H frame where weight distribution is concerned is difficult to control and spirals downward in an uncontrolled descent at a lower velocity than would otherwise occur if the flight controller was operating as a quadcopter. It is expected that improvements in the flight controller source code would allow for controlled descent but would prove extremely difficult to allow for such a frame with a damaged rotor arm/rotor to achieve operation in that controlled flight is maintained; however, this has not been tested further due to the availability of more advantageous approaches. An altitude of 2 m was used for the drop tests and no further tests are expected on the hybrid-X due to the preferred frame setup of a true X quadcopter, which allows for a more ideal weight distribution and therefore more forgiving. Although an xFrame is mentioned, tests have also been conducted on a +Frame, as its frame is identical, and it is only the flight orientation that alters with respect to the rotor arms. This is more easily seen with reference to
Figure 6. The figure shows the CAD representation at the top and the corresponding test build directly below (there is a visual offset of 45 degrees in the figure due to photography orientation). It is further divided with the left image showing the xFrame and the right image showing the +Frame, and it should be visually apparent from this that the frame is indeed identical. It is more easily recognized by observing the CAD frame the battery placement. This is considered the key component due to its weight when compared with the remaining components required for flight. The symmetry of both quads is visually apparent, the only discrepancy is the battery, and the flight controller is considered negligible as the weight of this component is 21 grams.
When looking at the CAD xFrame quad, the flight path is directly up as the page is read. If damage occurs and an arm is lost, then the forward flight path is reoriented to the direction of the lost arm. This offers the best physical setup for flight. It can be seen that the weight distribution is slightly off due to the lithium battery pack, although successful takeoff and landings are achieved with this setup. The flight controller software for the “INTACT” version and the “DAMAGED” version as labeled in the figure differs. The intact version runs on a quadcopter and the damaged version on tricopter software. It should be noted that tests between have been programmed manually and initial flights are taken from the ground level. As such, dynamic flight switch over of software from quad to tri has not been tested and is under development with a larger build frame and accompanying test rig. The flight controller must have an offset of 45 degrees in the case shown below to take into account the new forward flight path. Similarly, the +Frame quad operates on the same principle and differs only in its original forward flight path and that of the weight distribution from the lithium battery source. This setup has also been successfully tested for takeoff and landings. It should be acknowledged that takeoff and landings are completely ineffective when operating in quadcopter configurations with a missing rotor arm. Both methods can be seen to be almost operationally identical. To make the similarities more closely matched, the lithium battery will be physically square on future builds and have a symmetrical weight distribution across its central point. The test frame for experiments mentioned is seen in
Figure 6. This is three-dimensional (3D) printed with Polylactic Acid (PLA) with a 100% infill and detachable arms via m3 bolts/nuts, allowing for a convenient switch between intact and damaged frame types without the need to constantly rebuild frames due to damaging the arm for each experimental test.
It is of significant importance to note the rotor operating direction for the proposed frame types, in a similar arrangement as
Figure 6;
Figure 7 shows rotor direction of both intact and damaged setups. For the flight controller used, the rotor direction of the xFrame and +Frame quad setup meets the requirement and this rotor operating direction is typical of such frames. The rotor direction is arbitrary for the tricopter and this allows a seamless switch over of flight controller programs when falling back to a tricopter operation in a damage situation regardless of which arm is damaged. This effectively gives complete symmetry when in tricopter mode. This is important as change of rotation is not possible for these builds, as the propellers produce lift in one direction only i.e., clockwise (CW) or counter clockwise (CCW). Rotor direction (i.e., CW/CCW) is shown in
Figure 7, with an accompanying arrow indicating the forward flight path for each frame type. This helps understanding of the transition between intact quadcopter frame to damaged quadcopter frame. It can so far be seen that a damaged rotor arm can be detected through the failure mechanism with a tricopter software switchover and a directional offset applied to create a new flight structure. As referred to in
Figure 7, the intact xFrame Quad has a lost rotor arm 1 (10 o’clock position); therefore, an offset of −45 degrees is introduced to the sensor data and the software fallbacks to tricopter control mode. As the frame is pre setup in both quad and tricopter with its corresponding software, the PID controller values are already set correctly ensuring that, once damage does occur, the most applicable version of software and tuning is pre incorporated giving continued unaltered flight. This has historically not been achieved in quadcopter designs.
Empirical evidence delivers extremely promising results for the xFrame and +Frame setups for both quad and tri frame i.e., intact and damaged. As previously mentioned, further work is ongoing to dynamically switch flight controller profiles and PID values as a result of inflight damage, from here it can be determined how successfully the damaged quadcopter transfers to a tricopter flight mode live. It is expected that the quadcopter will need a margin of ground clearance to allow for altitude loss during such a transition as the tricopter attempts to reestablish control from an uncontrolled descent back into a steady flight. If already operating at low altitude, then damage as a fall would be highly unlikely and a takeoff would be possible provided an upright position was maintained at ground level. It may also be possible with the advent of recent advancements in accelerometer methods [
17] to predict a detached rotor arm or ill performing rotor due to the lack of lift in that quadrant of the drone. It therefore maybe possible to replace the mesh damage detection system and use accelerometer metrics to detect damage; however, this would require the use of high computation algorithms to which an assumption must be made. The response time would be drastically increased to that of the embedded mesh technique but could prove an alternative or enhance the system in place. No work in this area has been carried out to date but will be considered in future works and is worthy of recognition.
The flow diagram for the novel quadcopter is shown in
Figure 8. This shows the functional activities required in order to implement a robust corrective flight controller response in order to maintain flight when damage has been sustained to a motor arm or boom. The flowchart relates to a PCB quadcopter frame with four lines of damage detection per rotor arm. If minor damage occurs, then the maximum number of faults can be three of the four tracks. In the event of 4-track damage on the one motor arm, then it can be taken that the arm is detached from the quadcopter main body. For purposes of explaining the flow chart, an example scenario is presented that allows explanation of each flow chart block.
The scenario is an xFrame quadcopter that is inflight and performing under normal operating conditions. During the flight, a small fracture occurs on a rotor arm, flight is continued and the fracture perpetuates further until the entire rotor arm detaches from the main body. The rotor arm and associated motor is hanging underneath the damaged quadcopter by the ESC wiring as an underslung load. Eventually, the ESC wires become disconnected by the connectors and separates from the quadcopter entirely.
Following this scenario through the flow chart, under normal operating conditions, the flow chart endlessly loops around blocks 2 and 3 poling for damage. A small fracture occurs on the rotor arm and the flow chart permanently exits the damage poling. The damage location references the track to the corresponding arm in block 4. As the damage arm count is less than 4 (determined by block 5), the restricted flight envelop is initiated, which limits G-Force, bank angles and acceleration, etc. ensuring less stress on the damaged rotor arm. The flow diagram loops between blocks 5 and 6, keeping the quadcopter in “restricted flight envelope” (block 6). Flight is continued and the fracture perpetuates further until the entire rotor arm detaches from the body. This is determined by block 5, which now progresses to block 9 and poles for motor detachment. As the arm is still connected to the motor wires, we progress to block 10 and the quadcopter now operates in a tri-copter with underslung load (the motor hanging from motor wires). Whilst in this state, an endless loop exists where the motor wires are poled for connection and the flight controller is kept in tri-copter with underslung load operation. To continue with the situation, the ESC wires become disconnected by the connectors and separate from the quadcopter entirely. Block 9 flags that the rotor arm is detached and this decision is called by block 7 to enter the final block 8, whereby the quadcopter is now a tri-copter. The flow charts ends here. It is possible to continue monitoring the remaining rotor arms and again adjust the flight controller to a restricted flight envelope, but this will be considered in future works.
Test flights have been conducted with telemetry data collected on the 3D printed +Frame operating with three arms (shown as “damaged” in
Figure 6). The tests were conducted in unfavorable environmental conditions, in an exposed and open field with no shelter from the elements. Weather reports by the met office at the location and time of flights state that 4.4 mm of rainfall, northwesterly winds of 13 miles per hour (mph) with gust speeds of 22 mph, air temperature of four degrees centigrade and relative humidity of 95%. The drone setup is not tuned when relating to the PID controller and is deliberately operating with poor flight controller response. Oscillations are present in the motors as it attempts to stabilize with the ill configured PID profile. When operating under these conditions, motor coils produce excess heat that will eventually burn out and cause complete motor failure as the insulating material burns off and conducts current between the windings. Flight controller stabilization is manual only, 2D hold and GPS coordinate locking, and wind rejection is inactive. The test is intended to deliver telemetry data in the most unfavorable conditions to deem if the method is adequate for minimizing damage from uncontrolled landings resulting from inflight damage. The drone remote control is unaltered and operating as would be in a quadcopter setup (
Figure 6 “intact” frame). A total of ten flights were taken with small after flight rests of several minutes to allow motor temperatures to return to normal operating conditions.
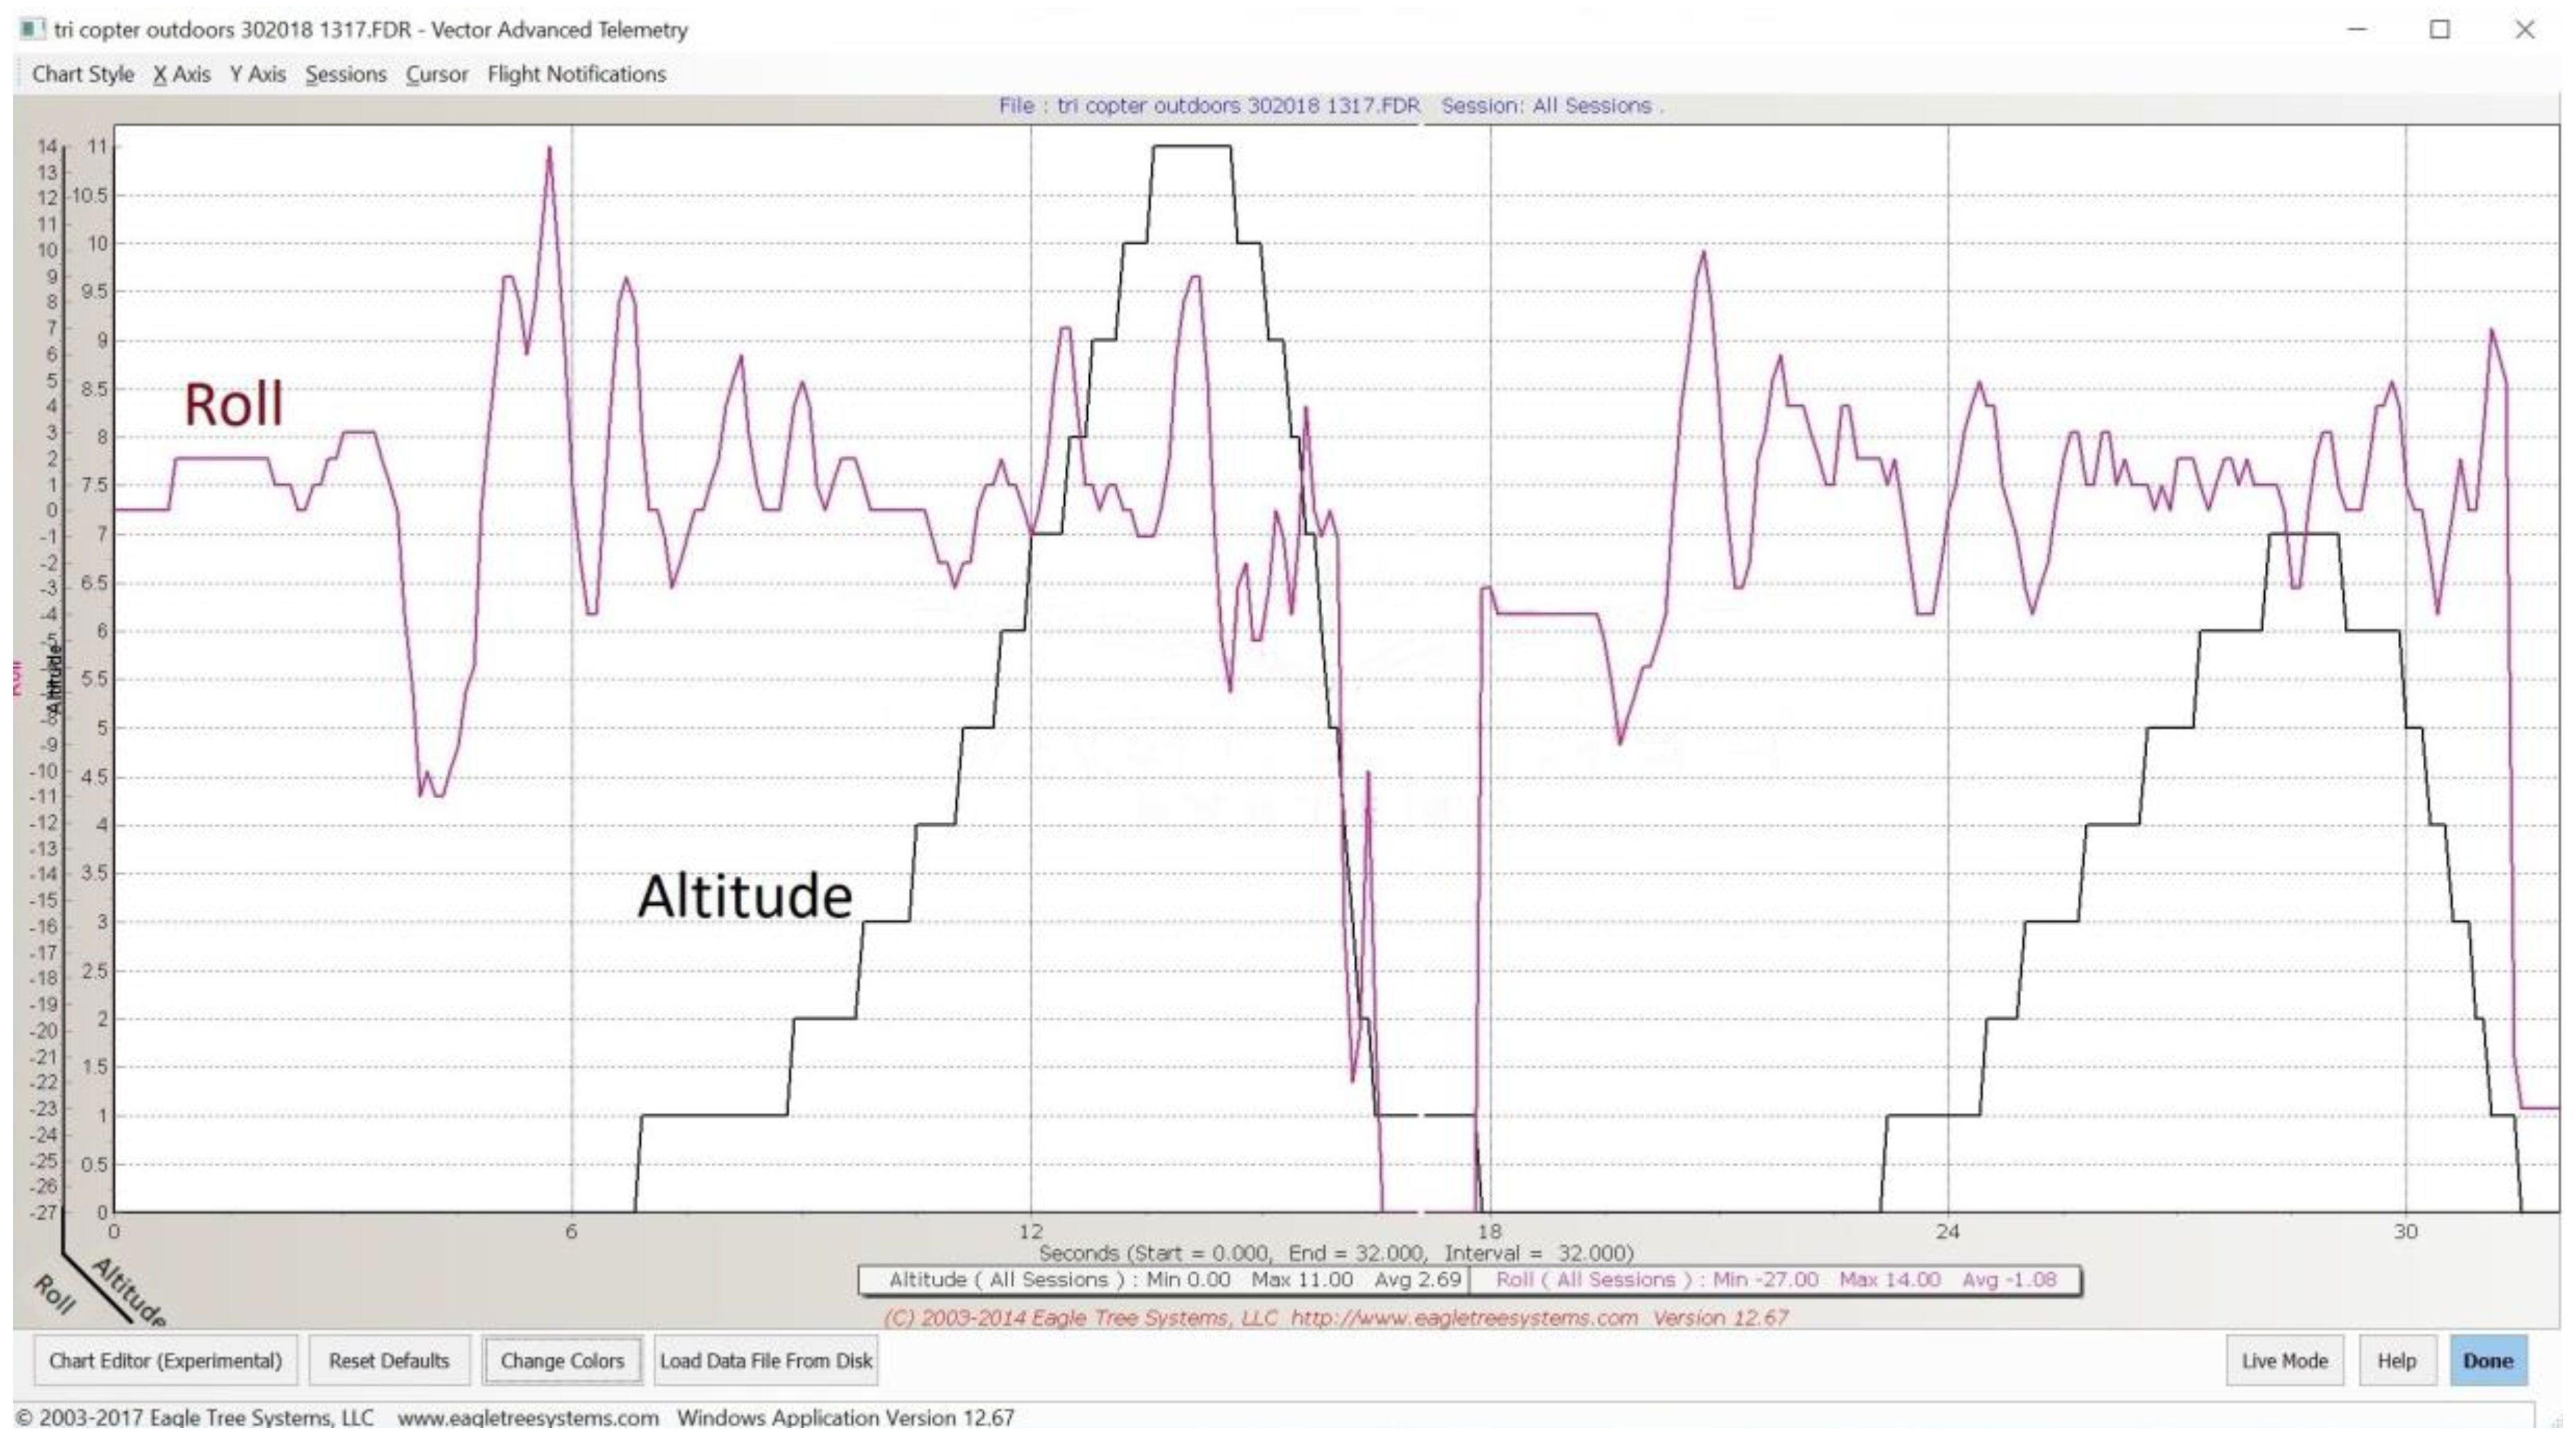
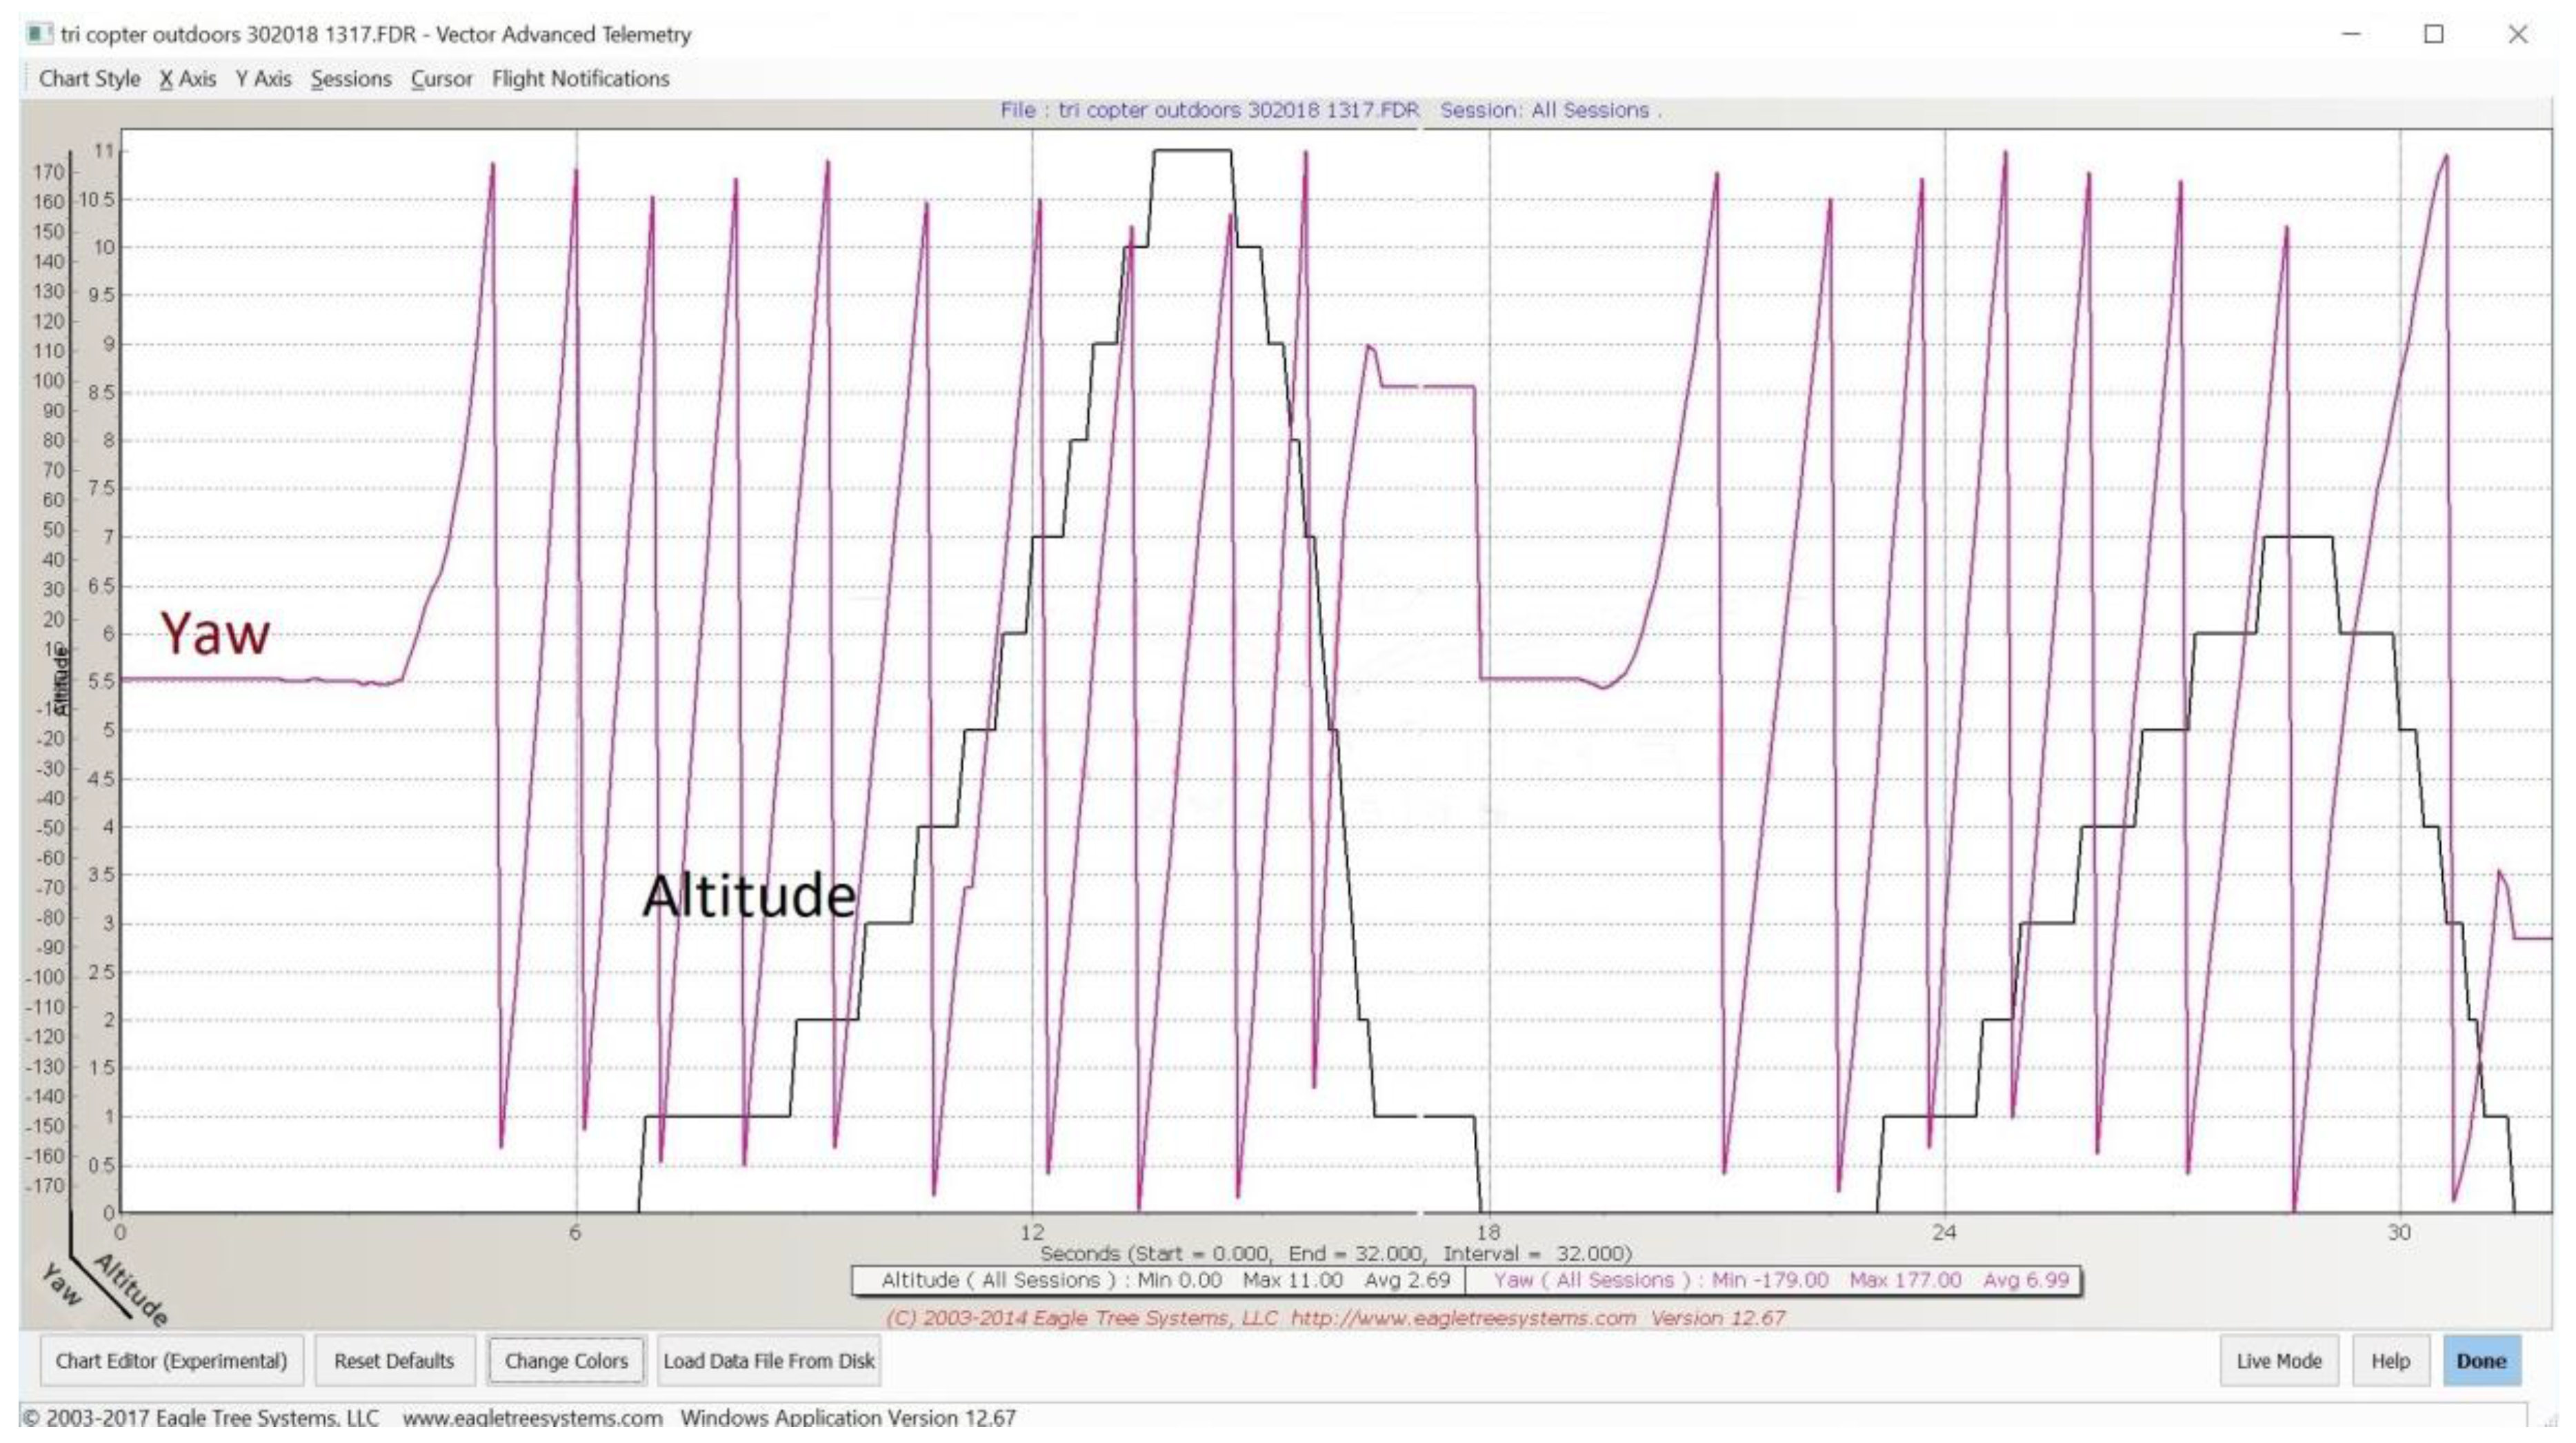
All flights were successful, and two successive flight telemetry data are examined in this paper. Due to the large amount of data present, the four graphs have been plotted independently to allow ease of viewing. All graphs show altitude in meters on the
y-axis with the
x-axis showing time in seconds. The graphs display separately throttle gain (
Figure 9), roll (
Figure 10), pitch (
Figure 11) and yaw (
Figure 12) to demonstrate flight dynamics and the stability of the system. Although additional data is logged, these parameters are most valuable for illustration of the system. Data for each parameter are logged at a frequency of 1 Hz in this instance.
With reference to
Figure 9, throttle gain can be seen with the drone altitude. It can be seen that two short flights are present. Peak altitude is marked on the graph by “Flight 1” and “Flight 2”, which achieve altitudes of 11 m and 7 m, respectively, with a small rest in between flights. Response in throttle is as expected with altitude gain, and a steady rate of climb and descent is achieved with no difficulties.
Figure 10 shows the corresponding pitch data again with altitude shown as to allow easier reference points across the graphs (throttle, pitch, roll, yaw).
Responses to pitch are also stable and within the default flight envelope set to a maximum 25 degrees bank angle. Fluctuations are typical especially under the wind and rain conditions of the flights. The sharp change in pitch seen at the end of flight 1 and start of flight 2 shows where the drone was picked up at the end of the flight to toggle power, which allows logging of separate flights. Roll data is seen in
Figure 11.
The start of the flight induces a rather significant roll factor, which could be accounted for by uneven motor spin up. This smooths out and maintains the flight envelope default settings of maximum bank angles of 25 degrees. Overall, the data shows adequate response for sustained flight especially when considering wind and gust speeds. Again, excessive roll spikes at the end of flight 1 can be attributed to the manual handling of the drone to toggle a new flight and perfectly aligns with the graph showing pitch of
Figure 10. Accompanying yaw data can be shown in
Figure 12.
Similarly, yaw data is also as expected, and the yaw rate is consistently steady and stable in both flights. The graph shows yaw at the start of both flights at 0 degrees, yaw continues to increase to 180 degrees and then transitions to −180 degrees, before steadily returning through 0 degrees, returning to 180 and repeating as expected. From the graph, the yaw rate can be seen to transition approximately five times in 6 s giving a rotational frequency of 0.83 Hz. If the yaw sensor data was organized so that it was incremental through positive and negative as it rotates, then the yaw graph of
Figure 12 would show an almost perfect sinewave showing stability in yaw. This is expected in the tri drone due to an uneven number of motors, which therefore gives unequal torque across the drone, which is cancelled out in the quadcopter setup by having the motors counteract each other i.e., 2 clockwise and 2 counterclockwise. The rotation in these test flights is clockwise due to the loss of the rotor arm. It is therefore clear that the tri drone can also rotate counterclockwise depending on which rotor arm is damaged. However, for the purposes of the telemetry flight tests, this is considered irrelevant, as we simply want to prove that steady and sustained flight is achievable. Conventionally, tri-copters cancel this torque imbalance by utilising a servo motor that rotates the tail rotor to compensate. This approach is not dissimilar to the helicopter solution of a rear prop, although this is typically fixed for such vehicles.
Due to the restrictive size of the first stage trial drones (
Figure 6), a larger drone is being constructed that more accurately represents professional UAVs. Additional equipment will be fitted such as flight telematics to display and log flight data such as motor voltages and current, altitude, speed, rpm, G-force X, G-force Y, Amp-Hours, climb rate, Airspeed and more at a rate of 40 Hz. The phase 2 drone will also serve as the master quad, which will carry the slave drone as an underslung load in the dual drone setup shown in
Figure 3. The master drone progress is shown in
Figure 13. When observing the graphs, it can be seen that stable flight is achieved that is within the defined control parameters of the flight controller, which would allow for continued flight. This extended flight time for the drone offers a valuable safety margin to allow the drone to come to a soft and controlled landing that conventionally would not be present.
6. Conclusions
In this paper, a novel early failure detection method for composite materials is discussed. This offers a low cost and minimal overhead approach by flexible design that allows for multiple implementations that can be tailored to the task. Tests conducted on sample specimens prove 100% successful when critical failure occurs. Pre catastrophic failure detection rates currently stand at 50% for the test specimens, although sufficient evidence is provided by the test results to allow this to be optimised further, which will result in higher detection rates. For the purpose of the drone system proposed in the paper, the method is perfectly adequate to allow the implementation of a corrective response in the flight dynamics. This failure method can also be implemented in FR4 PCBs as used throughout the drone electronics. Other than serving as a warning sign, the failure detection in PCBs would offer little advantage unless redundant components were available on the drone. However, the approach would prove extremely effective on FR4 PCB drone frames and this method is suitable for mass production as conventional routes of PCB supply can be used. Benefits of damage detection are also discussed as new opportunities become available for maintaining flight and at reducing damage on drone crash landings when compared to non-damage detection capable drones.
A dual drone configuration is explored and shares similarities with drone failure modes. Therefore, works in this area are shared across topics and offer an increasingly robust system. The dual drone system furthermore offers a reduced risk configuration when compared to a single high cost drone such as in the areas of search and rescue, scientific research and military applications. Currently, the master drone is in the prototype build stages and will allow further development of the underslung load model in the flight controller, which can also be used in the slave drone whereby a detached rotor arm hangs under the frame by ESC cables.
Drone frame structures have been built and tested to determine the ideal frame format when coupled with the mentioned damage detection and flight controller fallback mechanisms. Tests indicate that the xFrame format with symmetrical weight distribution is favourable. While low height drop tests of 2 m on the H frame format proved that damaged was minimised on ground impact, it failed to maintain flight. No further tests were conducted on the H frame due to the favourable symmetrical format of the xFrame. Tests on the xFrame proved entirely successful over ten successive full flight tests when the flight controller was implemented with tricopter configuration. Tests on this frame were deliberately conducted with ill performing PID implementations in unreasonable weather conditions to determine the flight dynamics in demanding situations. Test flights were short in duration—of less than 20 s—to prevent motor burn out, although a maximum height of 15 m was achieved. Although arguably test flight times are short, it is deemed sufficient for such flying structures as they are inherently unstable and provide no lift from the structure itself as would be the case in fixed wing vehicle flights that produce lift from air speed.
Visual observations of the drone during flights were stable and maintained controlled takeoff and landings appropriately. This relates accordingly with flight telemetry gathered during flights. The drone yaw rate was seen to be almost 1 revolution per second and this is due to the lack of counter measures to the torque produced in the rotors. This is as predicted and would prove extremely difficult to navigate to a target co-ordinate, although it provides a sufficient means of recovery from an otherwise complete failure. Tests were also conducted with no electronic assistance that is commonly found in mid-range flight controllers such as wind rejection, 2D hold and the like. When considering this stage where no yaw control exists, the logged flight dynamics prove that the method is capable of damage reduction in the result of a physical failure where previously the drone would have absolutely no possibility of maintaining a controlled descent and would crash to the ground causing significant damage to the drone and objects it would come in contact with. It is also worth noting that the xFrame drone is 3D printed with PLA filament with characteristics that are classed as medium for strength and durability, making it a sub optimal material choice. To summarise, regardless of the tough conditions imposed on the test xFrame drone, stable flight is achieved.
The flow diagram of controller response has been tested and confirmed good. The only element untested is block 10, which is the underslung load implementation that will be part of future work and considered as phase 2 of the project along with the master drone, which is also in development. Live implementations will also be developed to allow a 2-stage flight controller, which is considered a separate topic. Future work will be carried out on the master drone frame, as its size allows for enhanced data logging rates of 40 Hz. Overall, phase one of the research as shown in this paper has given sufficient conclusive results to upscale the work and incorporate further enhancements and refinements.
