1. Introduction
Multimodal large language models (MLLMs) remain unreliable when a problem requires more than recognizing objects or retrieving an isolated fact. Their performance often deteriorates when visual and textual evidence must be interpreted jointly, several indirect clues must be connected, or an initially plausible hypothesis must be reconsidered in light of the remaining evidence [
1]. Quiz questions provide a particularly revealing setting for studying these limitations: they deliberately combine incomplete, ambiguous, and sometimes metaphorical clues, while requiring a single precise answer [
2]. Team-based inference may help address this difficulty by allowing several models to propose complementary interpretations and combining them into a final response.
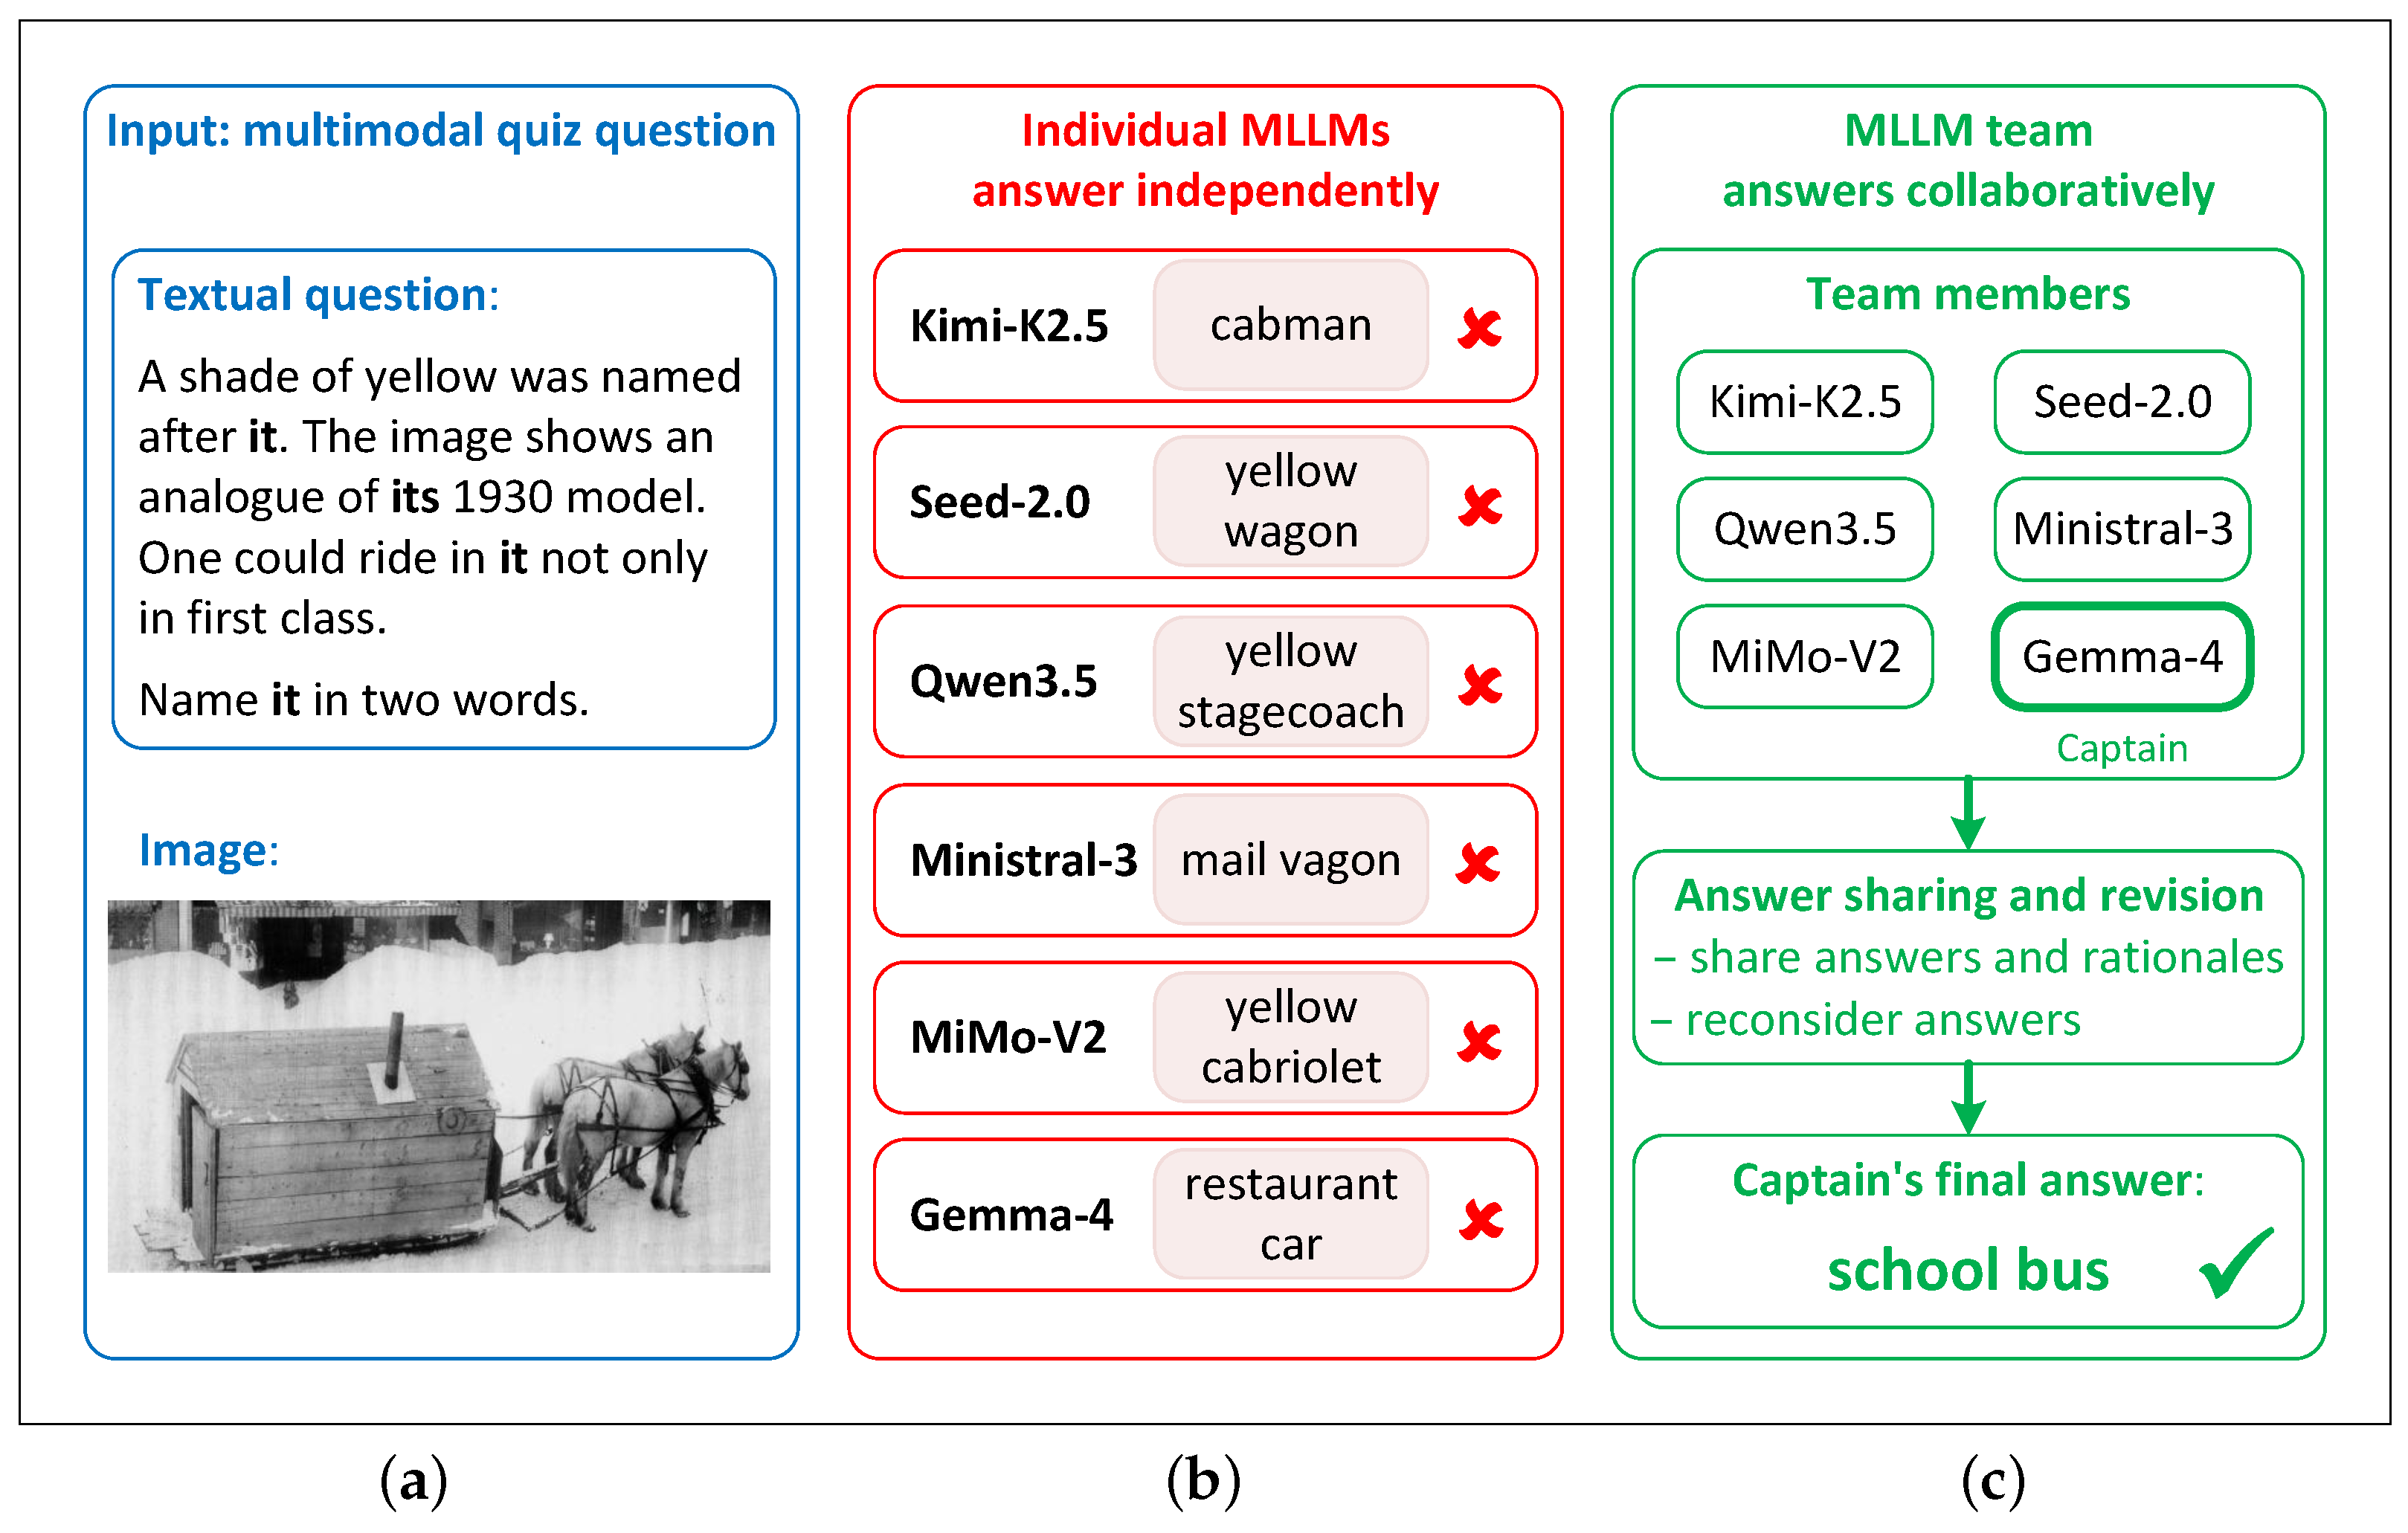
Consider the multimodal quiz question shown in
Figure 1. It combines an archival photograph with a textual clue and requires a two-word answer. The photograph depicts a horse-drawn predecessor of the target object, while the text states that a shade of yellow was named after it and that one could ride in it not only in “first class.”
When answering independently, none of the six evaluated MLLMs identifies the intended answer. Instead, they produce plausible but incorrect responses such as yellow wagon, yellow stagecoach, mail wagon, and restaurant car. Each response reflects only part of the available evidence, including the vehicle shown in the image, its apparent function, the reference to first class, or the color mentioned in the question. In contrast, a team using a debate-based strategy with Gemma 4 as captain combines all these clues into a consistent interpretation and correctly answers school bus.
This example illustrates two challenges of multimodal question answering. First, the relevant evidence is distributed across the textual and visual modalities and must be interpreted jointly. Second, individual models may generate useful but incomplete hypotheses without identifying the connection that resolves the question. Team-based inference may help combine these partial interpretations, compare competing hypotheses, and select a more coherent final answer.
Motivated by this observation, we investigate whether team-based inference can systematically improve MLLM performance on questions requiring the integration of visual evidence, indirect textual clues, and background knowledge. We study this problem using Russian-language multimodal
What? Where? When? questions (Russian:
Chto? Gde? Kogda?) (
https://en.wikipedia.org/wiki/What%3F_Where%3F_When%3F, accessed on 1 August 2026), which we abbreviate as MChGK (
Multimodal Chto? Gde? Kogda?) throughout the paper. We compare single-model baselines with six team strategies that differ in their aggregation mechanisms, the information exchanged among team members, and the number of interaction rounds.
Existing work has demonstrated the potential of model ensembles, multi-agent debate, and role-specialized multimodal systems [
3,
4,
5,
6]. However, several aspects of team-based multimodal reasoning remain insufficiently understood. First, most evaluations focus on standard reasoning benchmarks, conventional visual question answering, or domain-specific tasks rather than open-ended quiz questions that may require indirect linguistic clues, visual evidence, cultural knowledge, and answer-form constraints to be resolved jointly. Second, many team architectures combine several collaboration mechanisms, making it difficult to attribute performance gains to aggregation, rationale exchange, or iterative revision. Third, comparatively little empirical attention has been paid to how interaction reshapes the set of candidate hypotheses and affects the final decision maker’s selection.
To address these gaps, we organize six team strategies into matched configurations that enable systematic comparisons of majority voting, captain-based aggregation, rationale sharing, and an additional discussion round. We address the following research questions:
- RQ1.
To what extent does team-based inference improve answer accuracy relative to the same MLLMs used independently?
- RQ2.
Which collaboration mechanisms—majority voting, captain-based aggregation, rationale sharing, and an additional discussion round—yield statistically reliable improvements?
- RQ3.
How does the best-performing MLLM team compare with human teams across question topics and image types?
- RQ4.
How do the captain’s selection behavior and debate-induced changes in the candidate-answer set help explain the gains of the best-performing team configuration?
To answer these questions, we conduct a systematic empirical study on a newly constructed MChGK dataset. Our main contributions are as follows:
We systematize established team-design choices into a nine-dimensional design space and link them to a seven-stage generic reasoning pipeline. Together, these complementary views form a unified framework for specifying MLLM team strategies and identifying the design choices varied in our experimental comparisons.
We instantiate this framework in six team strategies and use matched configurations to systematically compare majority voting, captain-based aggregation, rationale sharing, and additional interaction.
We construct, annotate, and publicly release a dataset of 1170 Russian-language multimodal ChGK questions with topic labels, image-type labels, and human success rates. The accompanying repository provides the prompts and source code for team inference, evaluation, and analysis.
We analyze how debate changes the candidate-answer set and how these changes relate to the captain’s final selection. For Talkative Debate with Gemma 4 as captain, the candidate-transition analysis shows that successful outcomes primarily depended on preserving or introducing correct hypotheses and strengthening their support before aggregation, while correct final answers were rare when no correct candidate remained after discussion. We complement this analysis with answer-source decomposition, comparisons with human teams across question characteristics, and qualitative error analysis.
We provide a large-scale evaluation across six heterogeneous MLLMs on MChGK and show that, in the evaluated configurations, rationale sharing yields the most consistent performance gains, whereas additional interaction is beneficial primarily when rationales are exchanged.
2. Previous Work
2.1. LLM Ensembles and Multi-Agent Reasoning
Ensemble and multi-agent methods seek to improve LLM reliability by combining heterogeneous model outputs or enabling models to exchange and revise candidate hypotheses. Existing approaches can be broadly grouped into answer-aggregation and model-selection methods, interactive debate protocols, and role-specialized multimodal architectures.
2.1.1. Answer Aggregation and Adaptive Model Selection
Simple majority voting may be suboptimal in heterogeneous ensembles because it treats all models and responses as equally informative. Ref. [
3] distinguishes candidate answers from higher-order information about model competence and response dependencies, showing that the latter can improve aggregation in heterogeneous model pools. Ref. [
7] similarly proposes DFPE, which clusters models according to semantic similarities among their responses, retains representative models, and applies validation-based weighted voting.
Other methods exploit model confidence or response consistency. Ref. [
8] used calibrated log-likelihood estimates to resolve voting ties, substantially outperforming random tie-breaking. Ref. [
9] introduced ModelSwitch, an adaptive sampling method that terminates when outputs from the current LLM are sufficiently consistent and switches models when response variability remains high. These approaches improve aggregation or model selection without requiring agents to exchange generated rationales.
These methods address important limitations of unweighted voting, but aggregation and model selection alone do not enable participants to revise their interpretations using explanations supplied by other models. This distinction is relevant to multi-step quiz questions, where independently generated answers may reflect different, incomplete interpretations of the available clues. Selecting among such answers does not necessarily combine the partial evidence underlying them. Moreover, response consistency does not guarantee correctness, since several models may share the same misconception. These considerations motivate comparing answer-only aggregation with rationale sharing and examining whether an additional interaction round improves the candidate set.
2.1.2. Multi-Agent Debate and Agreement Protocols
Interactive debate allows agents to evaluate competing hypotheses and revise their answers, but response sharing can also introduce conformity, sycophancy, and false consensus. CONSENSAGENT addresses these effects through prompt optimization when interaction becomes unproductive or sycophantic [
10]. Ref. [
11] reduced identity-related biases by anonymizing agent contributions.
Other protocols reconsider how debate outcomes should be aggregated. FREE-MAD removes the requirement that agents reach consensus and evaluates candidate answers using the complete interaction trajectory [
12]. ACE adaptively selects discussion acts according to the current set of hypotheses [
13]. Ref. [
14] combined diversity-oriented response selection with confidence-aware revision, obtaining stronger results than standard debate and majority voting across several reasoning benchmarks. Ref. [
4] systematically compared voting- and consensus-based protocols and showed that their effectiveness is task-dependent: voting is more advantageous for logical reasoning, whereas consensus can be preferable for knowledge-intensive tasks. Their results also indicate that mechanisms encouraging independent drafting and collective revision can improve answer diversity and overall accuracy.
This task dependence cautions against assuming that a successful debate protocol will transfer unchanged to multimodal quiz questions. Results on text-based reasoning benchmarks do not by themselves establish effectiveness when models must jointly interpret incomplete or ambiguous textual and visual clues. In such settings, discussion may help combine complementary interpretations, but it may also propagate an incorrect reading of the image or reinforce a plausible but unsupported hypothesis. Consequently, final agreement and accuracy should be complemented by an analysis of whether discussion preserves, introduces, or eliminates correct candidates.
Our earlier work established text-only ChGK as a challenging benchmark for open LLMs by evaluating individual models across question topics and structural types and comparing their performance with human teams [
15]. A subsequent study examined several team-based inference configurations with different aggregation and information-sharing mechanisms, showing that collaboration can substantially improve upon individual-model performance and that access to peer rationales is particularly beneficial under strong inter-model disagreement [
16]. The present work extends this line of research to multimodal ChGK questions, provides a unified framework covering a broader range of collaboration strategies, and uses matched configurations to examine aggregation, rationale sharing, and additional interaction through systematic strategy comparisons. It further examines changes in correct-candidate availability and the captain’s final selection, providing a more detailed account of the mechanisms associated with the observed gains.
2.1.3. Specialized Multimodal Multi-Agent Architectures
Multimodal tasks have also motivated architectures in which agents specialize in different modalities or reasoning functions. MAMMQA [
5] separates modality-specific evidence extraction, cross-modal synthesis, and final answer aggregation. Its aggregator selects among the answers and arguments produced by specialized agents without directly accessing the original inputs, and the framework outperforms the baselines evaluated on MultiModalQA [
17] and ManyModalQA [
18]. This separation makes the final decision dependent on the quality and completeness of the evidence communicated by the specialized agents, since the aggregator cannot directly inspect information omitted from their outputs.
Ref. [
6] applied a related role-based design to visual question answering over chest radiographs. Their system combined context retrieval, multimodal reasoning, and answer validation, substantially outperforming the strongest single-model baseline. These results demonstrate the potential of role specialization, although the resulting architectures are tailored to particular domains or input structures.
Their reported evaluations do not establish how well these architectures transfer to multimodal intellectual quiz questions, which may require visual interpretation, cultural knowledge, wordplay, and answer-format constraints to be resolved jointly. Furthermore, when retrieval, specialized roles, and validation are combined within one system, overall performance improvements do not by themselves identify the contribution of each component. In contrast, our study holds the set of general-purpose MLLMs fixed and varies the collaboration mechanism through systematic strategy comparisons. This design supports a focused analysis of aggregation, rationale sharing, and additional interaction, while leaving comparison with specialized architectures as a separate empirical question.
2.2. Multimodal Reasoning Benchmarks
Recent multimodal benchmarks show that current MLLMs continue to struggle when answering requires multi-step reasoning, external visual knowledge, or explicit grounding in both textual and visual evidence.
MMReason [
1] evaluates open-ended multimodal multi-step reasoning on questions designed to require interaction between visual and textual evidence. Its results reveal substantial limitations in both final-answer accuracy and the correctness of intermediate reasoning steps, motivating further study of mechanisms that can combine and revise partial interpretations.
MRAG-Bench [
19] evaluates multimodal models in settings where retrieved visual evidence is essential to answering the question. Its results show a substantial gap between the ability of models and humans to benefit from additional visual information.
MAVIS [
20] evaluates whether multimodal retrieval-augmented systems can produce detailed answers while identifying the visual or textual sources supporting their conclusions. The benchmark shows that apparently well-supported model responses remain grounded less reliably in visual documents than in textual evidence.
For Russian-language evaluation, Ref. [
21] introduced MERA Multi, an open framework spanning textual, visual, video, and audio tasks. The benchmark addresses the predominance of English-language multimodal evaluation and extends earlier Russian benchmarks that were limited primarily to text.
These benchmarks address complementary evaluation goals. MMReason emphasizes multi-step reasoning, MRAG-Bench and MAVIS examine the use and grounding of retrieved evidence, and MERA Multi provides broad coverage of Russian-language multimodal capabilities. Their results are informative about different sources of model failure but do not by themselves determine which collaboration mechanisms are most useful for interpreting a fixed quiz question and its accompanying image.
Taken together, these benchmarks highlight persistent limitations in multimodal reasoning, visual grounding, and the use of external knowledge. However, they do not target open-ended Russian-language quiz questions that jointly require visual interpretation, indirect textual reasoning, and broad background knowledge. The MChGK dataset introduced in this work complements existing benchmarks by providing such a setting and enabling comparison with human team performance. Beyond introducing this benchmark, we systematically compare collaboration mechanisms and examine how interaction changes the candidate-answer set and the captain’s final selection. The resulting specialization supports detailed analysis within this task setting, while limiting the extent to which the findings can be generalized to other languages and multimodal applications.
3. Materials and Methods
3.1. Design Space of LLM Team Strategies
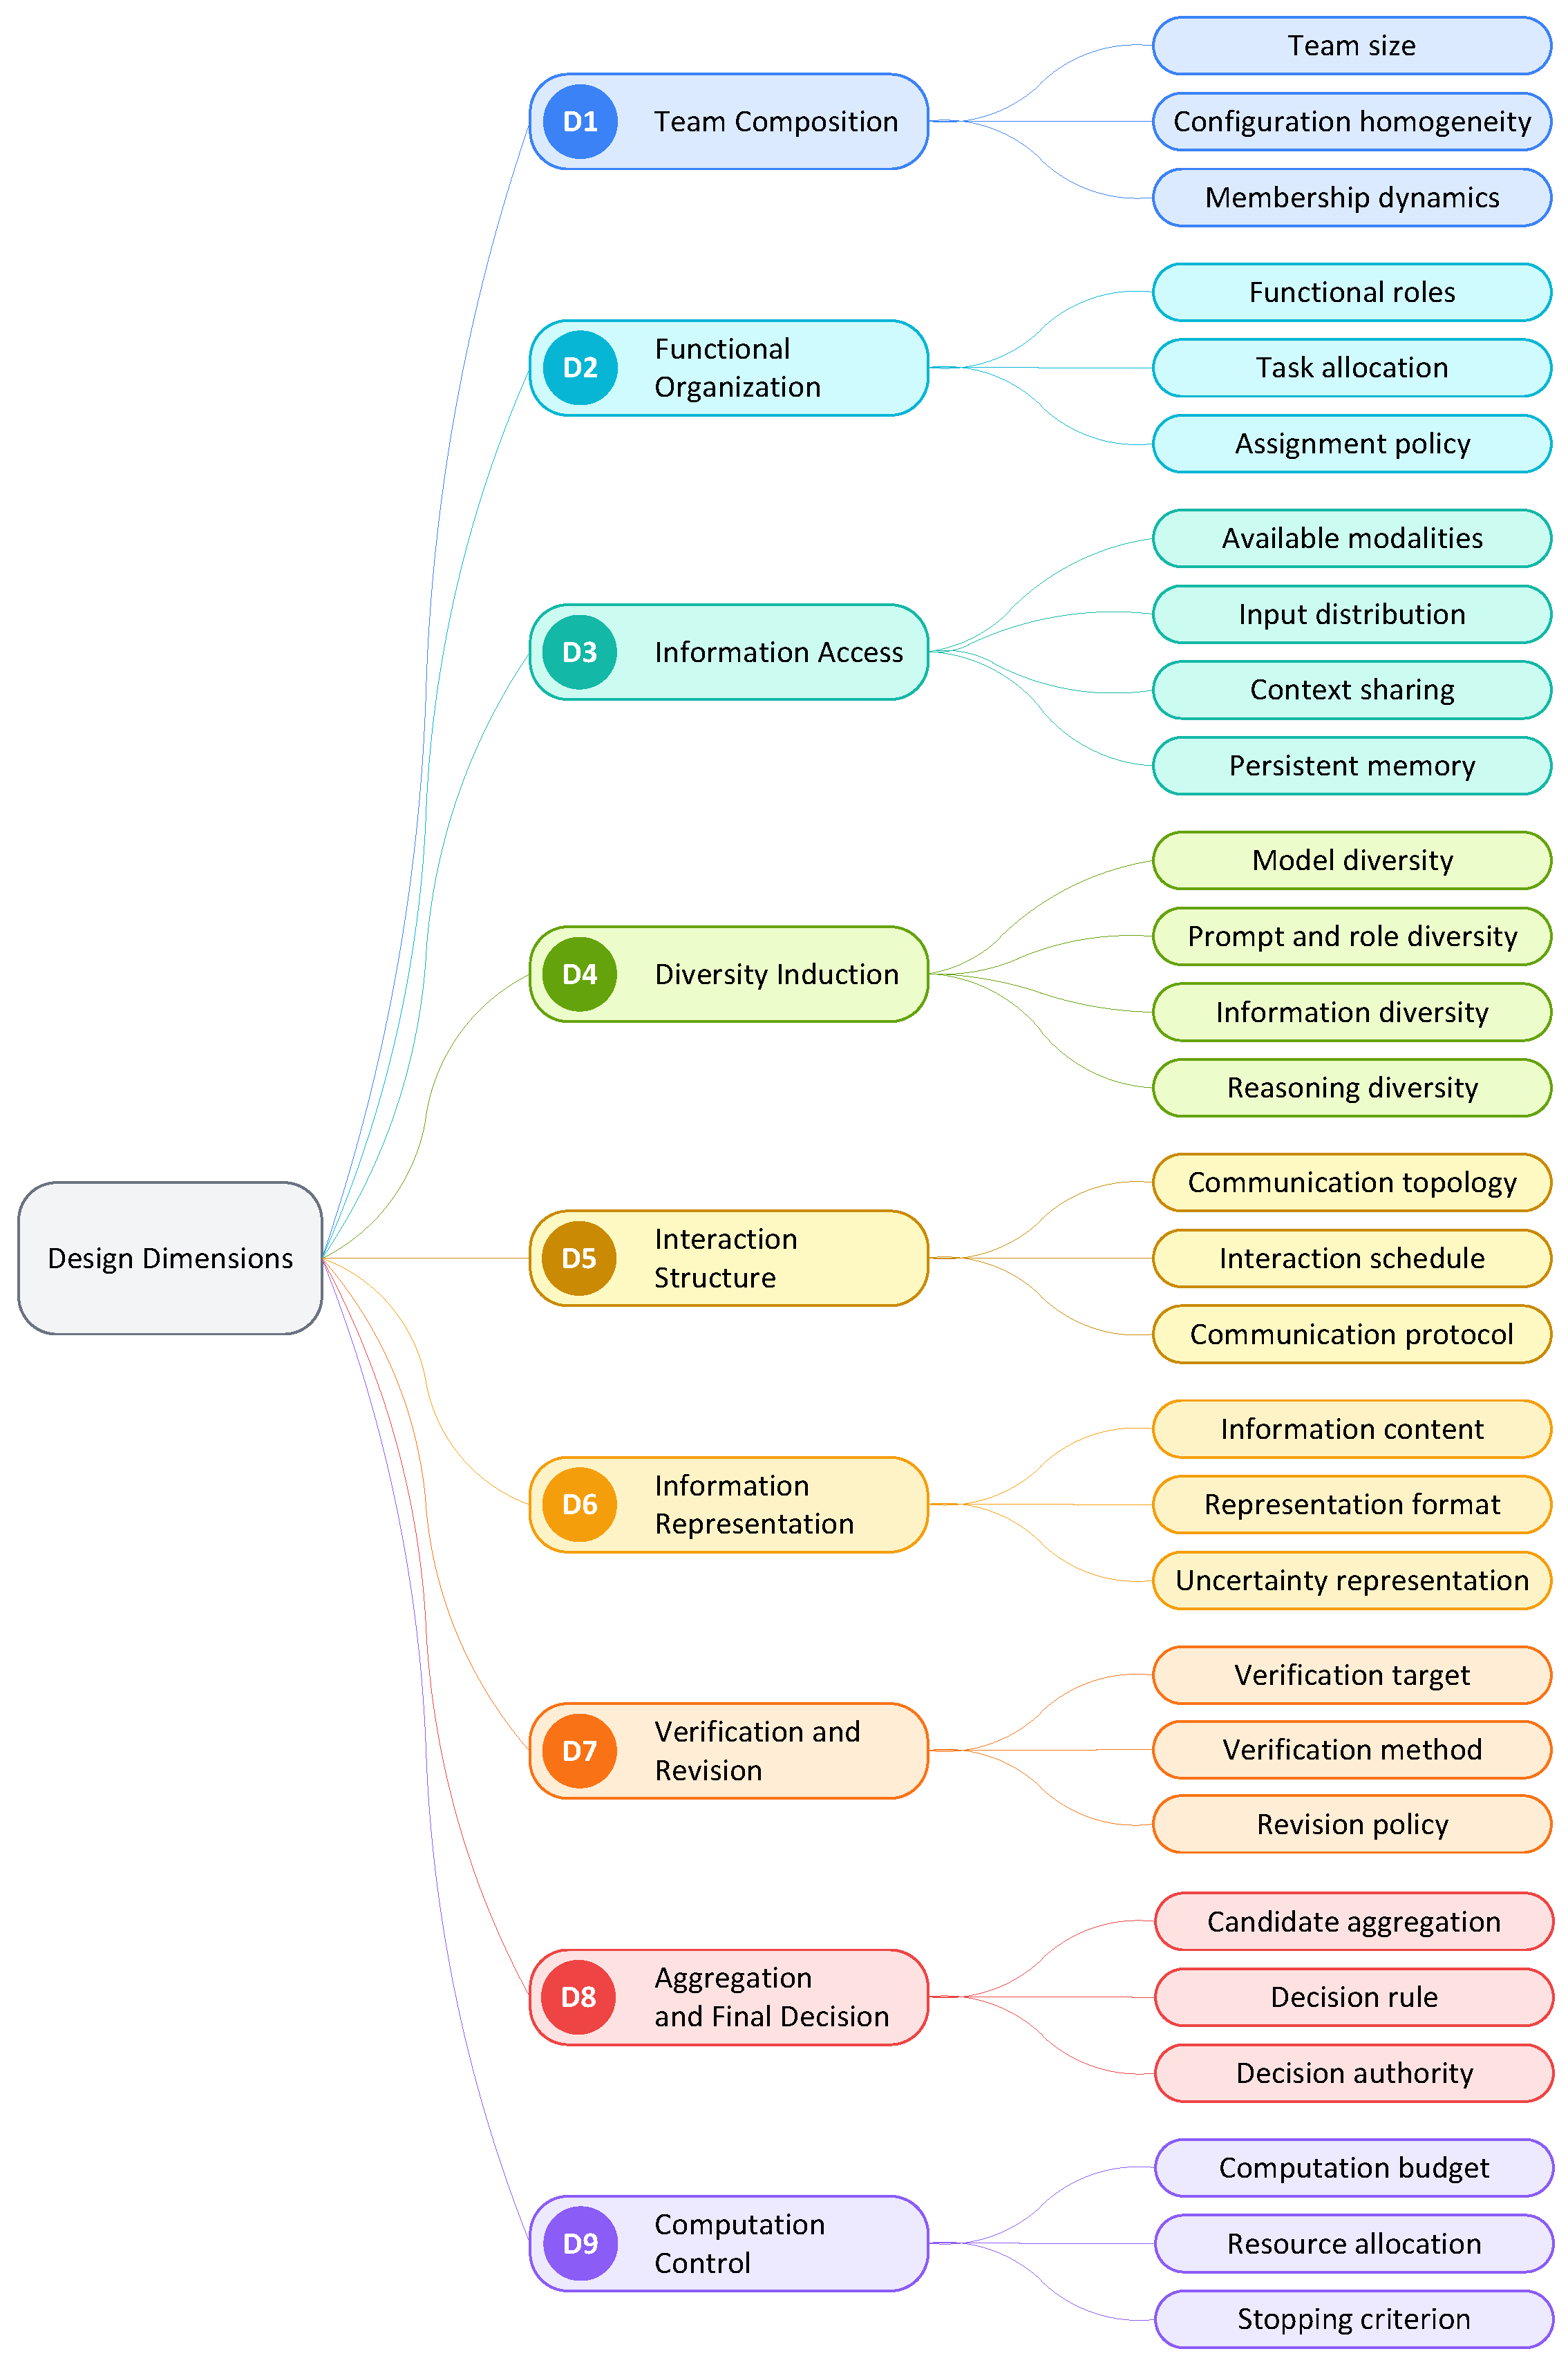
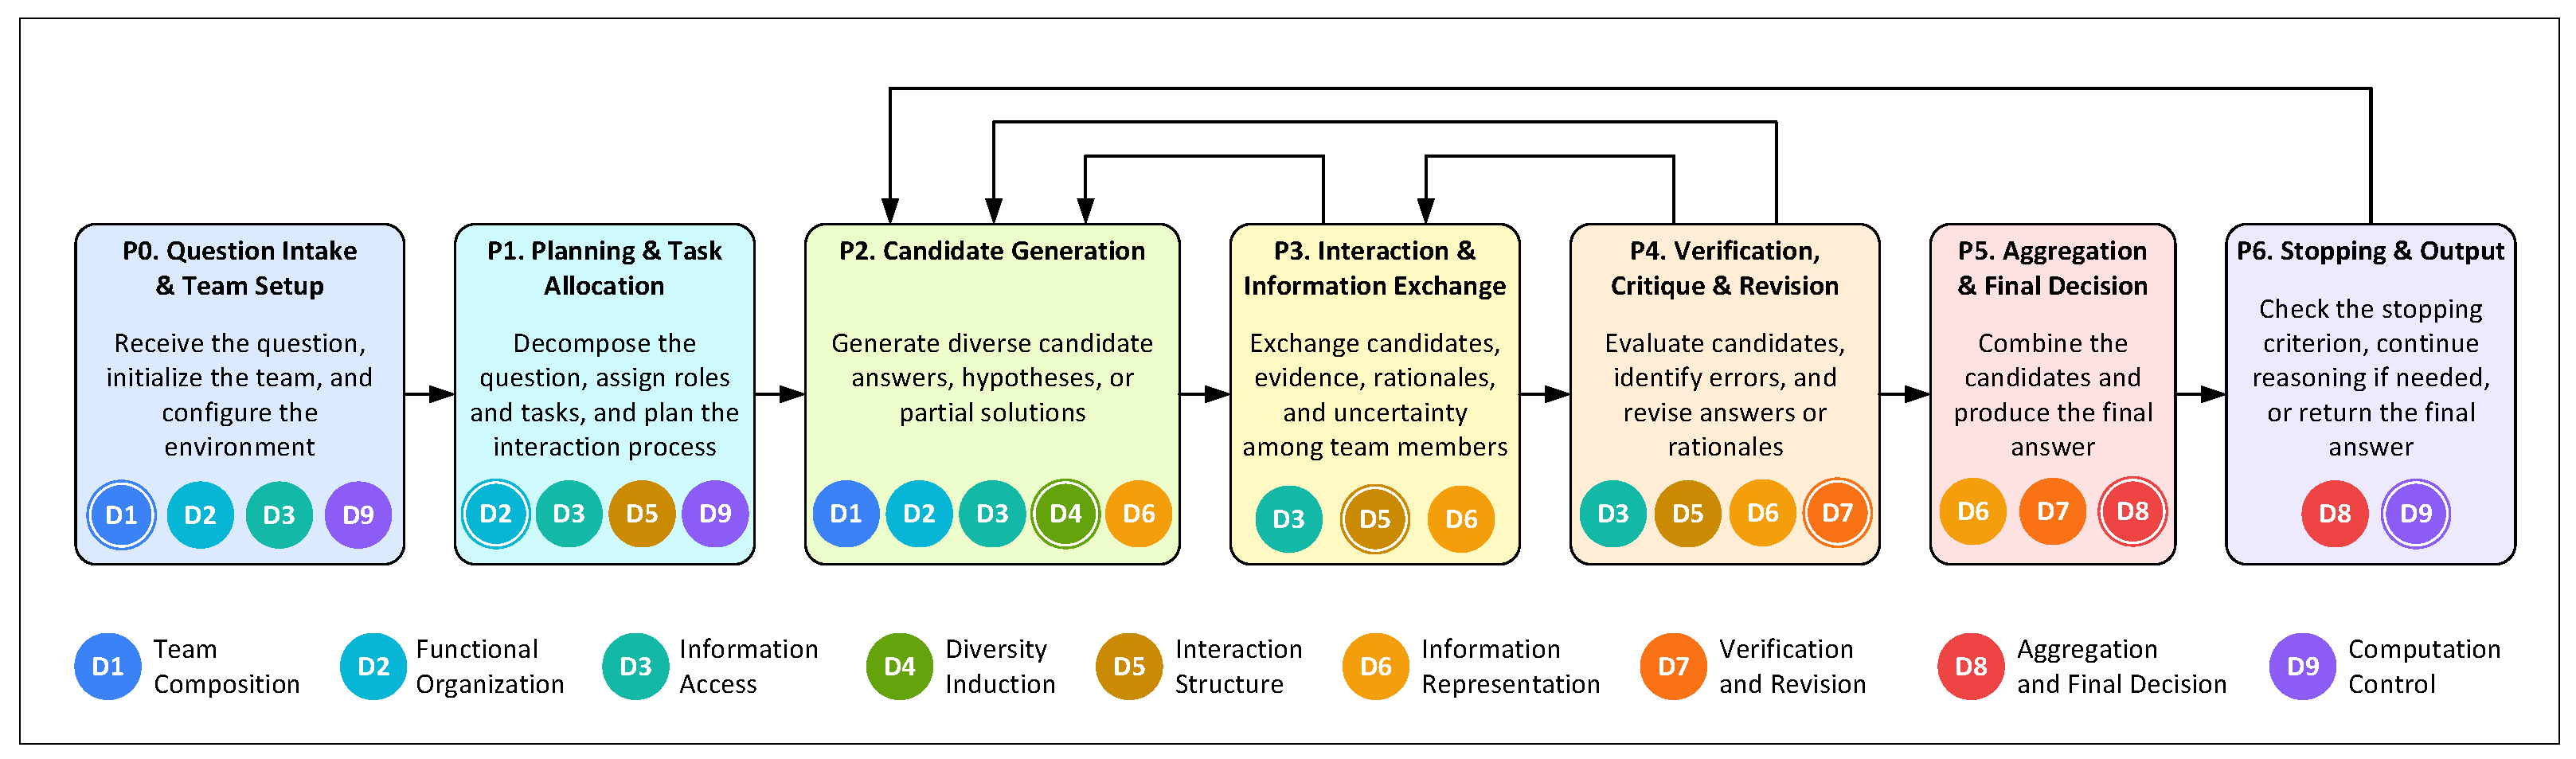
To systematically characterize LLM team strategies and support the design of new ones, we organize the principal design choices into nine dimensions, as shown in
Figure 2. These dimensions cover team composition, functional organization, information access, diversity induction, interaction structure, information representation, verification and revision, aggregation and final decision making, and computation control. They are conceptually distinct but may interact in concrete systems. For example, restricting the information available to individual team members may also serve as a mechanism for inducing diversity. The framework accommodates both text-only and multimodal teams, with modality-specific choices represented explicitly within the information access dimension. Different instantiations of these dimensions allow a broad range of team strategies to be described within a common conceptual framework.
The contribution of this design space lies in the joint organization of established choices and their explicit connection to the workflow described below. For example, Ref. [
4] systematically examines decision-making protocols, while MAMMQA [
5] organizes multimodal question answering around specialized agent functions. Our design space places such choices alongside information access, the content exchanged between agents, revision mechanisms, and computation control within a common descriptive scheme. In particular, separating information access, information representation, and interaction structure makes it possible to distinguish what evidence agents receive, what they communicate, and how communication is organized. The resulting framework supports the specification of concrete strategies and the identification of similarities and differences between them. The six strategies evaluated in this study instantiate a selected subset of these design choices, enabling focused comparisons of aggregation, rationale sharing, and additional interaction.
The nine dimensions are described below.
- D1.
Team Composition (Who participates?)
Specifies the number of team members, whether their configurations are homogeneous or heterogeneous, and whether team membership remains fixed or changes dynamically during problem solving. Configuration differences may involve the underlying models, prompts, inference settings, or other system components.
- D2.
Functional Organization (Who does what?)
Describes how responsibilities are distributed across the team. Team members may assume different functional roles, such as planner, solver, retriever, critic, verifier, or captain. Tasks may be assigned uniformly to all members, partitioned among specialized members, or allocated adaptively according to the current reasoning state. Roles and task assignments may be predefined, determined dynamically, or revised during reasoning.
- D3.
Information Access (Who has access to what?)
Specifies the information available to each team member. This includes the modalities accessible to individual members, such as text, images, audio, or video; the distribution of the input across the team; the extent to which intermediate outputs and interaction history are shared; and whether persistent memory across questions or tasks is available. Information may be shared globally, restricted to selected members, or revealed progressively.
- D4.
Diversity Induction (How are different perspectives generated?)
Captures the mechanisms used to promote diverse hypotheses and reasoning trajectories. Diversity may be induced through the use of different models, prompts, or functional roles; by exposing team members to different inputs or retrieved evidence; or through stochastic sampling and adaptive exploration of alternative reasoning paths.
- D5.
Interaction Structure (Who communicates with whom, and when?)
Characterizes how communication is organized within the team. This includes the communication topology, such as no direct communication, captain-mediated communication, or peer-to-peer exchange; the interaction schedule, such as single-pass or multi-round discussion; and the communication protocol, which may remain fixed or adapt to the evolving reasoning process.
- D6.
Information Representation (In what form is information exchanged?)
Determines how information is represented during collaboration. It specifies the exchanged content, such as candidate answers, explanations, intermediate rationales, or retrieved evidence; the representation format, such as free text, structured records, symbolic expressions, or visual annotations; and the representation of uncertainty, such as confidence scores or probability estimates.
- D7.
Verification and Revision (How are candidate answers checked and improved?)
Covers the procedures used to evaluate and refine candidate answers. Verification may target intermediate rationales, retrieved evidence, or final answers and may rely on self-checking, peer critique, consistency analysis, evidence validation, tool execution, or dedicated verifier agents. The revision policy determines whether detected problems trigger correction, regeneration, or additional reasoning.
- D8.
Aggregation and Final Decision (How is the final answer selected?)
Specifies how candidate answers and their supporting evidence are combined into the final output. Candidate aggregation may involve grouping equivalent answers, merging partial hypotheses, or comparing their associated rationale and evidence. The final decision may follow majority voting, confidence-weighted aggregation, a rule-based procedure, or model-based judgment, and decision authority may be collective or delegated to a designated captain.
- D9.
Computation Control (How is computational effort allocated?)
Defines how computational effort is managed throughout the reasoning process. This includes the computation budget, such as fixed or adaptive limits on model calls, tokens, or interaction rounds; the allocation of resources among candidate generation, interaction, and verification; and the stopping criterion used to determine when the reasoning process should terminate.
These dimensions provide the terminology used below to describe the generic reasoning pipeline and the six team strategies evaluated in this study.
3.2. Generic Pipeline for LLM Team Reasoning
To provide a unified view of team-based reasoning workflows, we organize the main stages of LLM team problem solving into a generic seven-stage pipeline (
Figure 3). The pipeline serves as a descriptive process model: individual systems may omit, merge, repeat, or reorder stages. Its contribution is the explicit mapping between workflow stages and the design dimensions introduced above. The design space describes which choices define a team strategy, whereas the pipeline describes where these choices enter its execution and how generation, interaction, revision, and aggregation are connected. Together, these complementary views support the specification and systematic comparison of concrete team strategies within a common framework.
The pipeline stages are described below.
- P0.
Question Intake and Team Setup (How is processing initialized?)
Initializes the reasoning process by receiving the question and preparing the execution environment. Depending on the system design, this stage may instantiate team members, load their configurations, establish initial information access, and initialize the computation budget.
- P1.
Planning and Task Allocation (How is the work organized?)
Organizes the reasoning process before candidate answers are generated. Typical planning activities include question decomposition, assignment of functional roles and tasks, selection of the interaction strategy, and distribution of available information across the team.
- P2.
Candidate Generation (How are candidate answers produced?)
Generates diverse candidate answers, hypotheses, or partial solutions through independent or collaborative reasoning. Diversity may arise from different models, prompts, information sources, reasoning strategies, or information representations, enabling broader exploration of the solution space.
- P3.
Interaction and Information Exchange (How do team members collaborate?)
Supports communication between team members during reasoning. Participants may exchange candidate answers, retrieved evidence, arguments, uncertainty estimates, or other intermediate information through one or multiple communication rounds.
- P4.
Verification, Critique, and Revision (How are candidate answers improved?)
Evaluates candidate answers to identify errors, inconsistencies, or weak supporting evidence. Verification may target intermediate rationale, supporting evidence, or final answers, and detected issues may trigger revision, regeneration, or additional reasoning.
- P5.
Aggregation and Final Decision (How is the final answer produced?)
Integrates the available candidate answers and their supporting information into a final answer. This may involve voting, confidence-weighted aggregation, consensus building, or synthesis by a designated captain.
- P6.
Stopping and Output (When does reasoning terminate?)
Determines whether the current solution is sufficient or additional reasoning is required. The process may terminate after reaching a predefined computation budget or satisfying confidence or consensus criteria; otherwise, it may return to earlier stages for further candidate generation, interaction, verification, or refinement.
Team reasoning is often iterative rather than strictly linear. Information exchange may stimulate the generation of new candidate answers (P3 → P2), while verification may trigger either candidate regeneration (P4 → P2) or additional discussion (P4 → P3). After aggregation, the stopping mechanism determines whether the current solution is sufficient; otherwise, the process may return to candidate generation for another reasoning cycle (P6 → P2).
3.3. MLLM Team Strategies
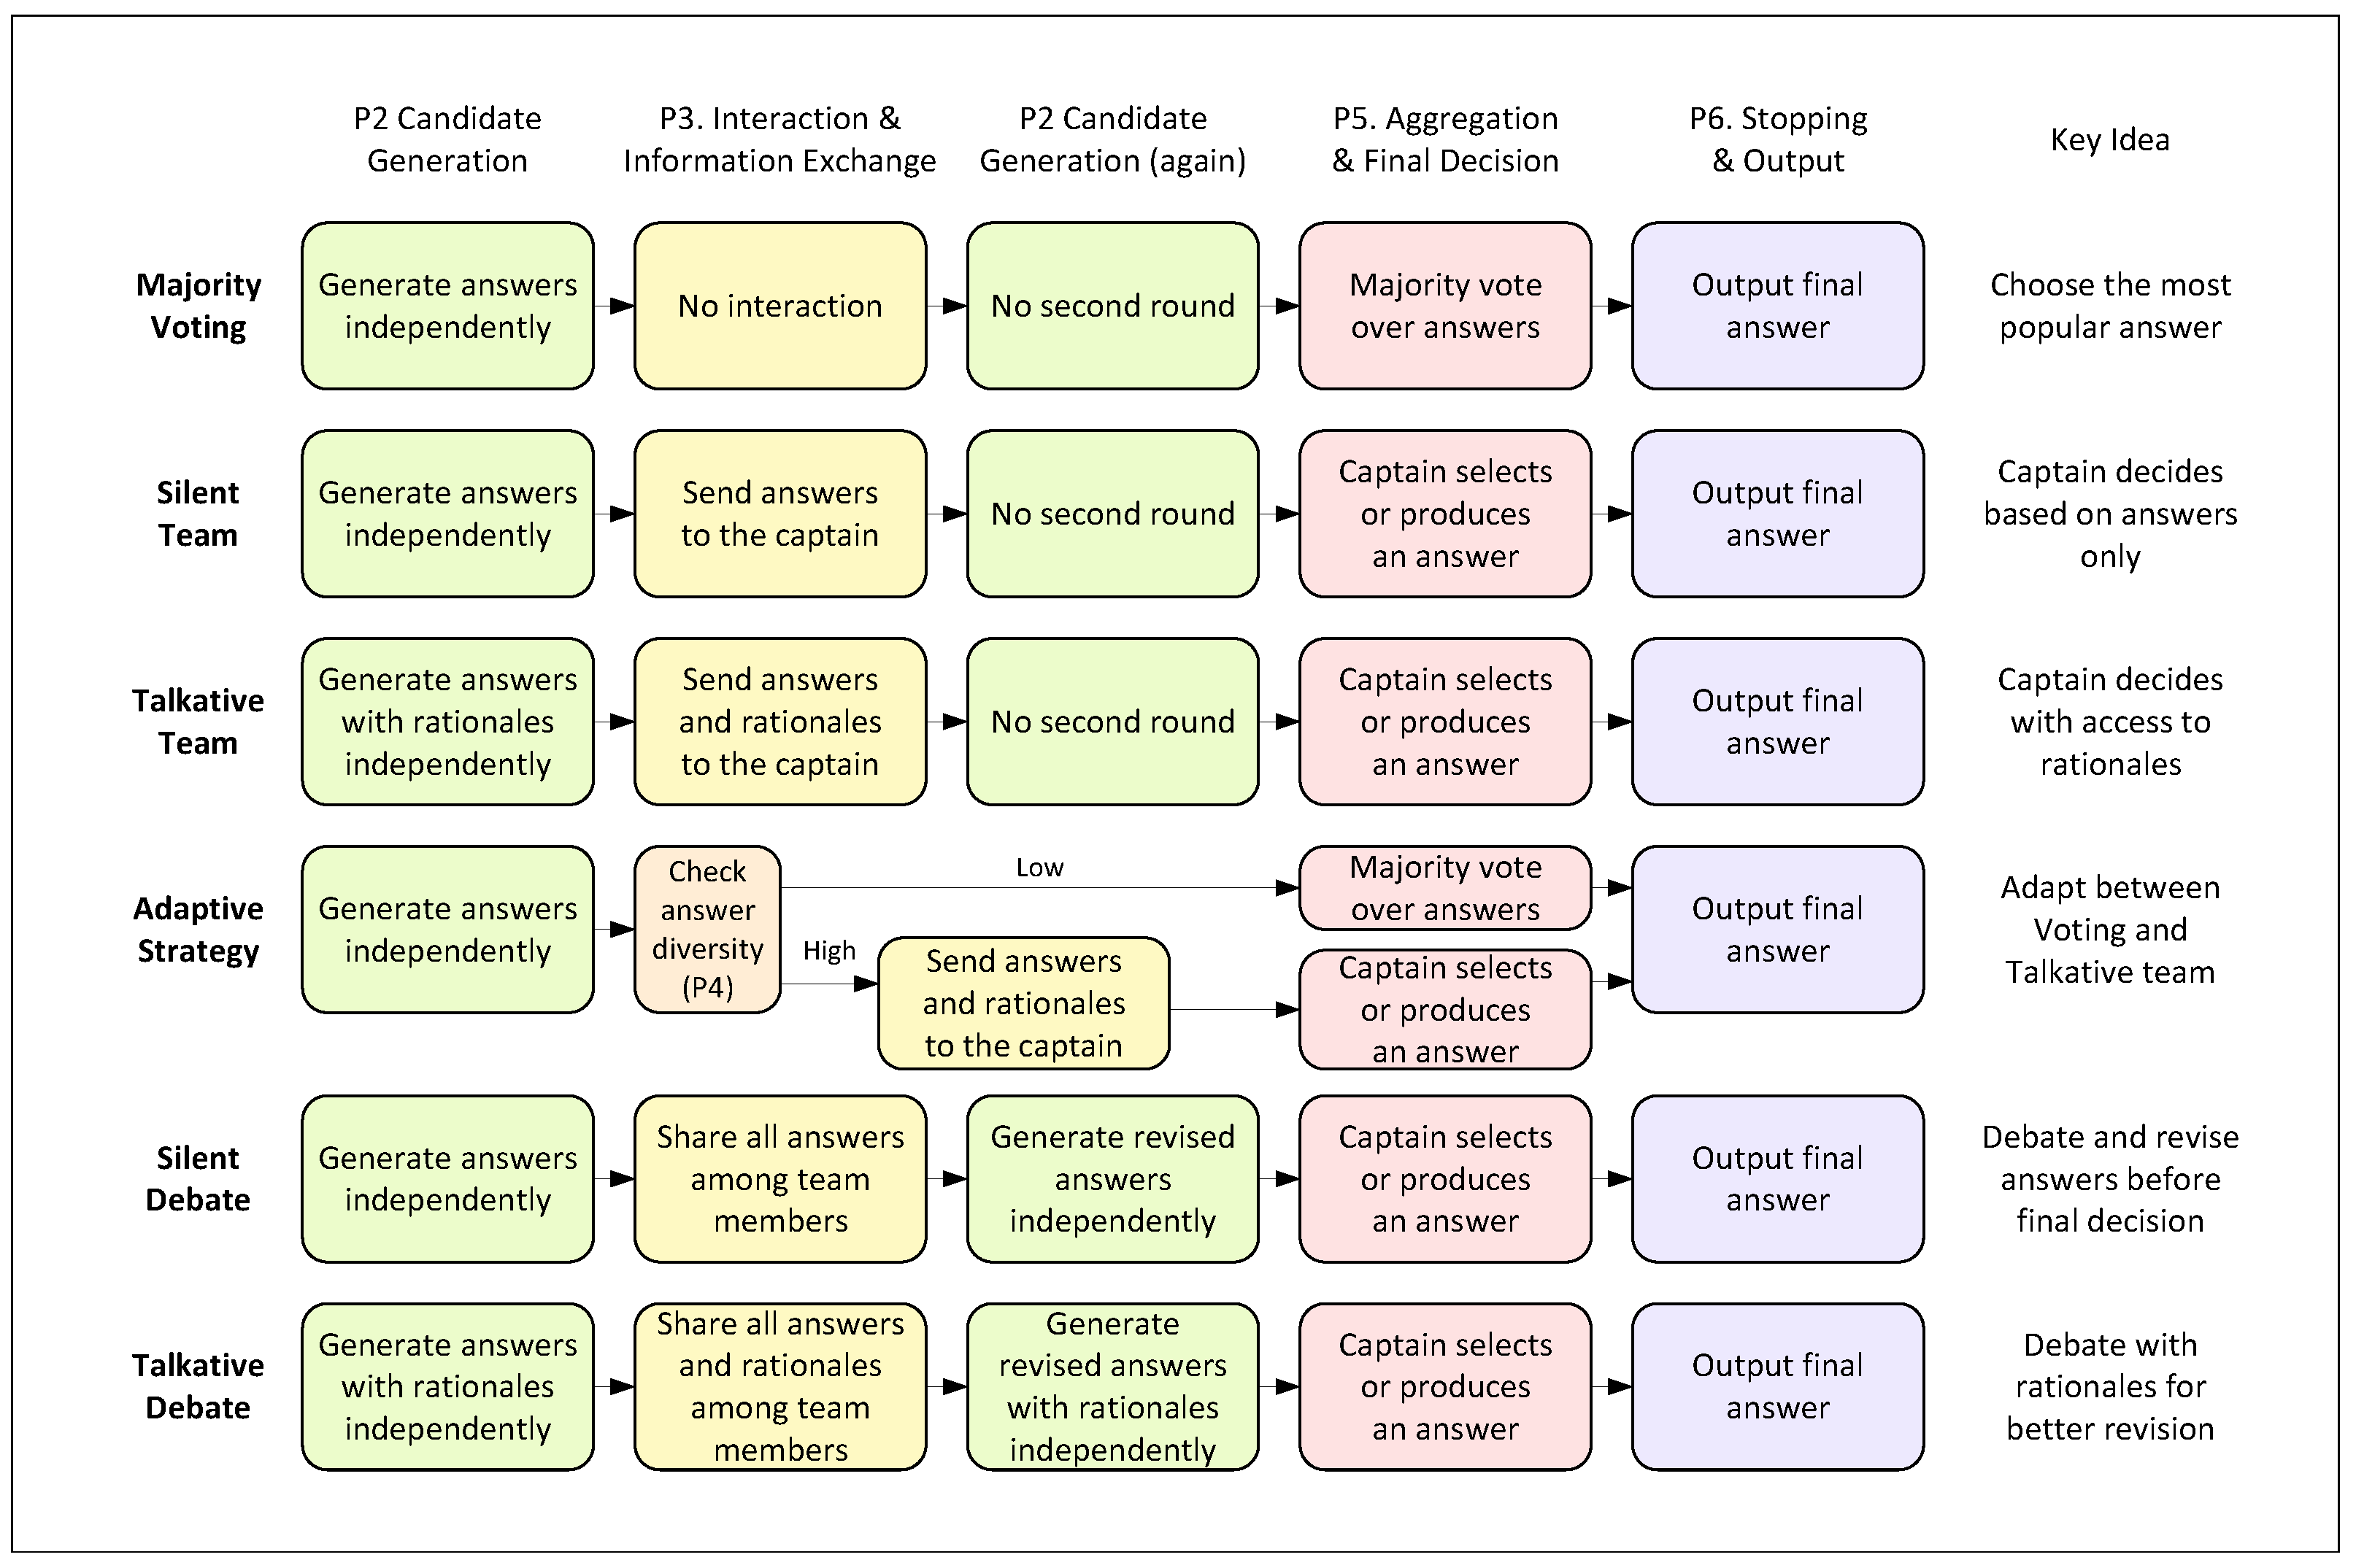
Building upon the proposed design space and generic reasoning pipeline, we instantiate and evaluate six MLLM team strategies for MChGK question answering (
Figure 4). The strategies are organized as a set of matched configurations rather than as a single linear sequence. Five fixed strategies support systematic comparisons of decision authority, rationale sharing, and an additional candidate-generation round, while the Adaptive Strategy conditionally selects between two aggregation paths based on answer diversity. Here, a rationale is a brief model-generated explanation accompanying an answer, not a record of the model’s internal reasoning process. Across the configurations, the principal differences concern how information is exchanged, what information is made available to the captain and other team members, how the final answer is selected, and whether an additional reasoning round is performed.
Majority Voting: Majority Voting serves as the baseline team strategy and includes a designated captain, whose role is limited to resolving ties. Team members generate candidate answers independently and do not exchange information. Semantically equivalent formulations are grouped into answer variants, and the frequency of each variant is counted. An answer variant with the highest frequency is referred to as a modal answer. If there is a unique modal answer, it is selected as the final answer. If several answer variants are tied for the highest frequency, the captain’s answer is returned as the final answer.
Silent Team: Silent Team replaces majority voting with captain-based aggregation. The independently generated candidate answers are forwarded to a designated captain, which may select one of them or produce a new answer. The captain receives no intermediate rationale, and the other team members do not observe one another’s outputs.
Talkative Team: Talkative Team extends Silent Team by providing the captain with both the candidate answers and their associated rationales. This additional context supports a more informed final decision while preserving the same single-pass workflow, with no second candidate-generation round.
Adaptive Strategy: Adaptive Strategy uses answer diversity to select between two aggregation paths. After team members independently generate candidate answers and associated rationales, the number of distinct answers is computed. If it does not exceed half the team size (three answers in our six-member teams), the final answer is selected by majority voting. Otherwise, the answers and rationales are forwarded to the captain, following the Talkative Team workflow. Thus, answer diversity serves as a routing signal for choosing between majority voting and rationale-aware captain aggregation.
Silent Debate: Silent Debate extends Silent Team by introducing an additional candidate-generation round. After the initial answers are generated, they are shared among all team members. Each member then independently produces a revised answer after considering the other candidates. The revised candidate set is subsequently forwarded to the captain, which selects or produces the final answer. No rationale statements are exchanged among the team members.
Talkative Debate: Talkative Debate extends Silent Debate by sharing both candidate answers and their associated rationales during the interaction stage. Team members then independently produce revised answers and rationales using the information provided by the other participants. The captain makes the final decision from these revised outputs. This is the most communication-intensive strategy evaluated in the study.
For comparability, the initial P2 candidate responses were generated once for each model and question and reused across all team strategies. All subsequent strategy-specific model calls, including captain aggregation and the optional second P2 round in the debate configurations, were generated separately for each configuration.
These strategies yield four principal matched comparisons: Majority Voting versus Silent Team evaluates captain-based aggregation; Silent Team versus Talkative Team evaluates rationale sharing with the captain; Silent Team versus Silent Debate evaluates an additional answer-only discussion round; and Talkative Team versus Talkative Debate evaluates an additional discussion round with rationale exchange. The Adaptive Strategy is considered separately as a conditional routing mechanism.
3.4. Dataset
3.4.1. Dataset Source and Overview
The dataset used in this study was constructed from questions available on the IQ Game platform (
https://iqga.me, accessed on 1 August 2026). Data preprocessing involved extracting questions with supplementary handout material from the source website, organizing the question text and associated metadata into JSON records, and removing duplicates. The corresponding image files were downloaded locally and encoded in Base64 for submission to the models.
Each dataset instance consists of the original Russian question text, the associated image, and the reference answer. The accompanying image forms part of the question context and may provide information required for answering the question rather than serving as a decorative illustration. An illustrative example of such a question is presented in
Figure 1 in the Introduction.
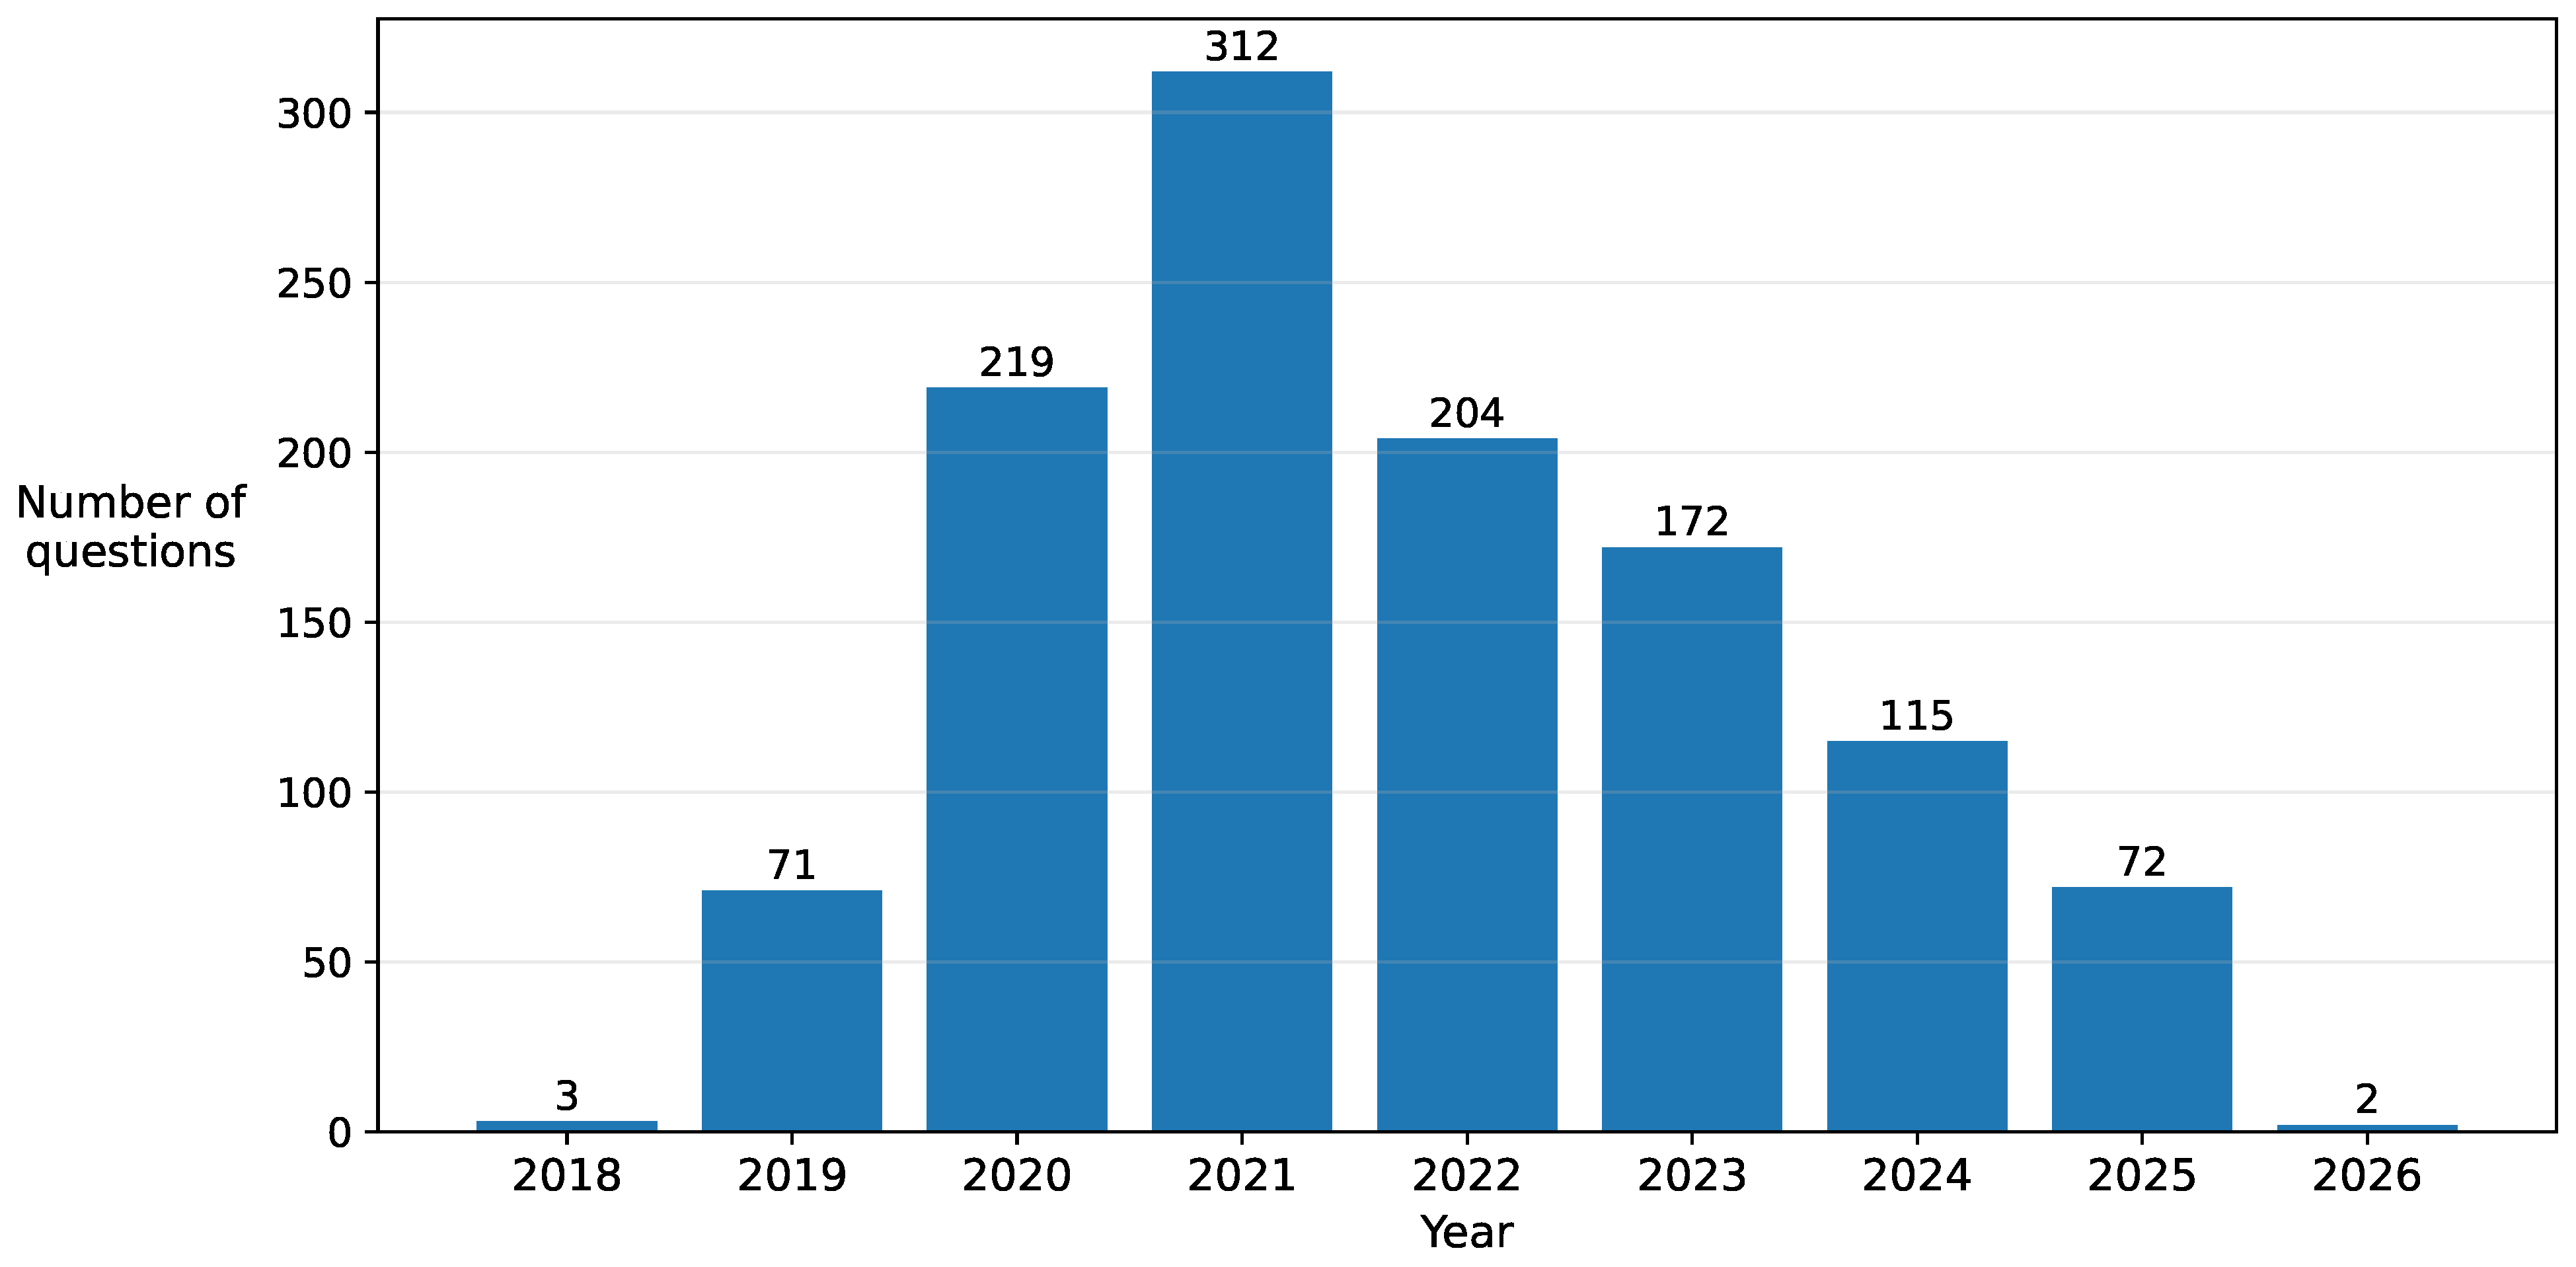
The initial collection contained all image-based questions available on the IQ Game platform at the time of data collection, comprising 1179 multimodal questions spanning the period from 2018 to 2026. Nine questions were reserved exclusively for prompt development and excluded from all subsequent experiments (
Appendix A), resulting in a final evaluation dataset of 1170 questions. The distribution of questions by year is provided in
Appendix B.
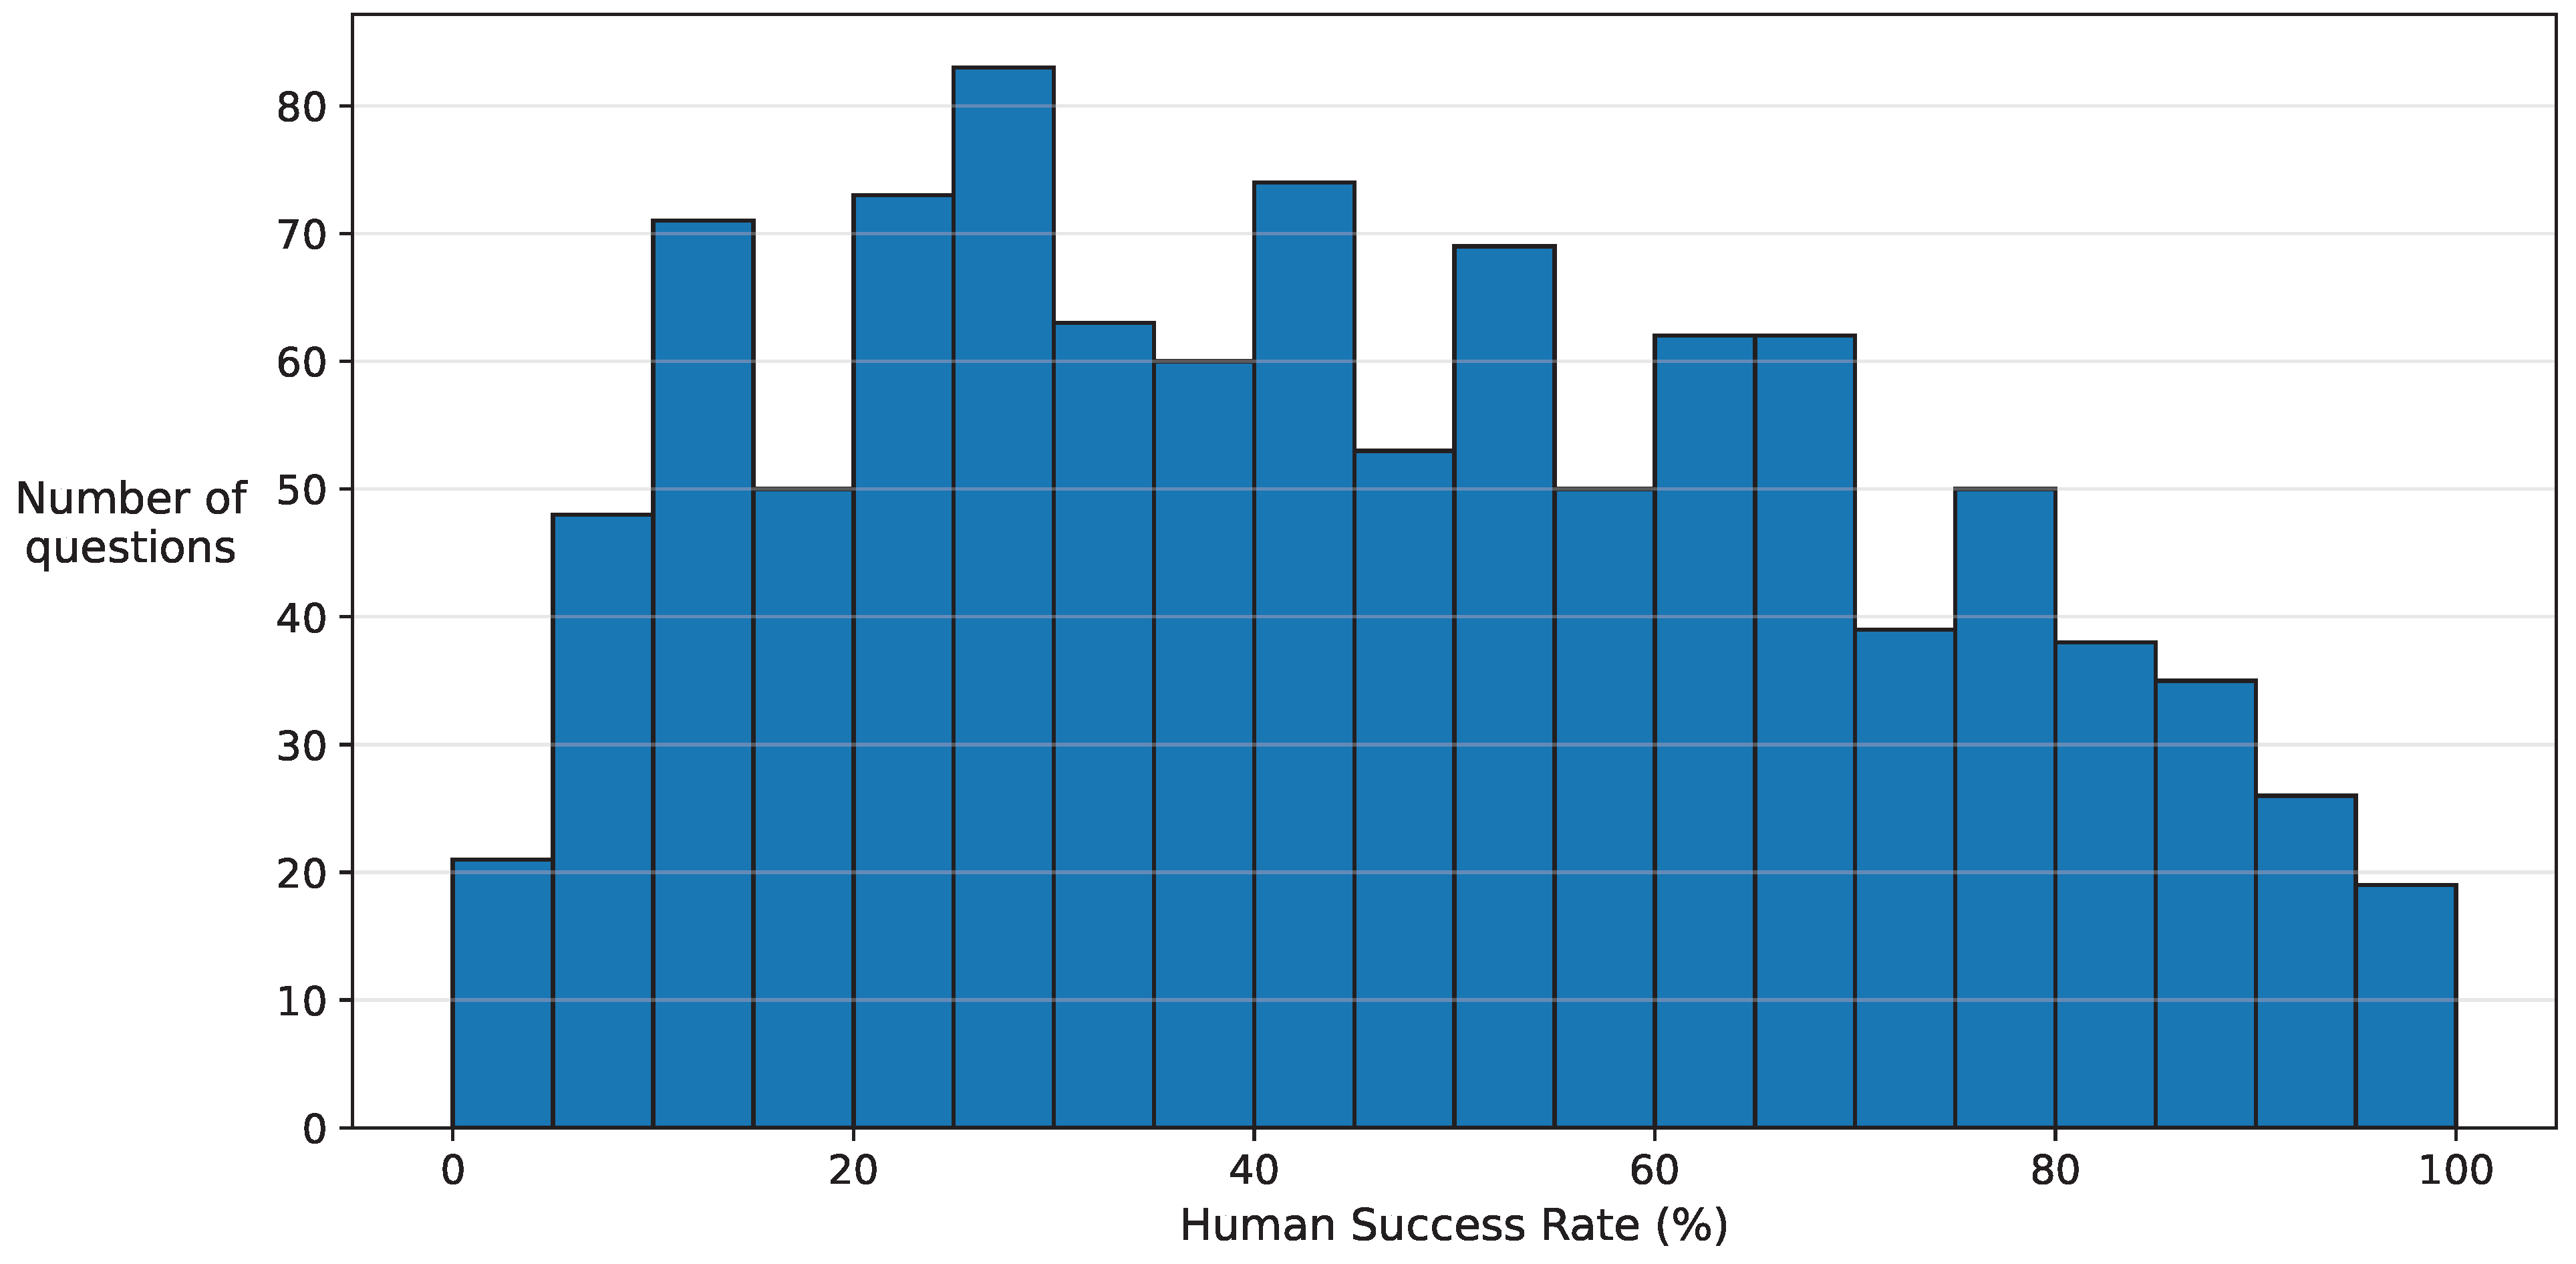
For 1046 questions (89.4%), the dataset also includes a human success rate, defined as the percentage of participating human teams that answered the question correctly. This value provides an empirical estimate of question difficulty for human players. Its distribution is shown in
Appendix C.
Table 1 summarizes the main characteristics of the evaluation dataset. In addition to the original question–image–answer triples, we provide topic and image-type annotations described in the following sections.
3.4.2. Topic Annotation
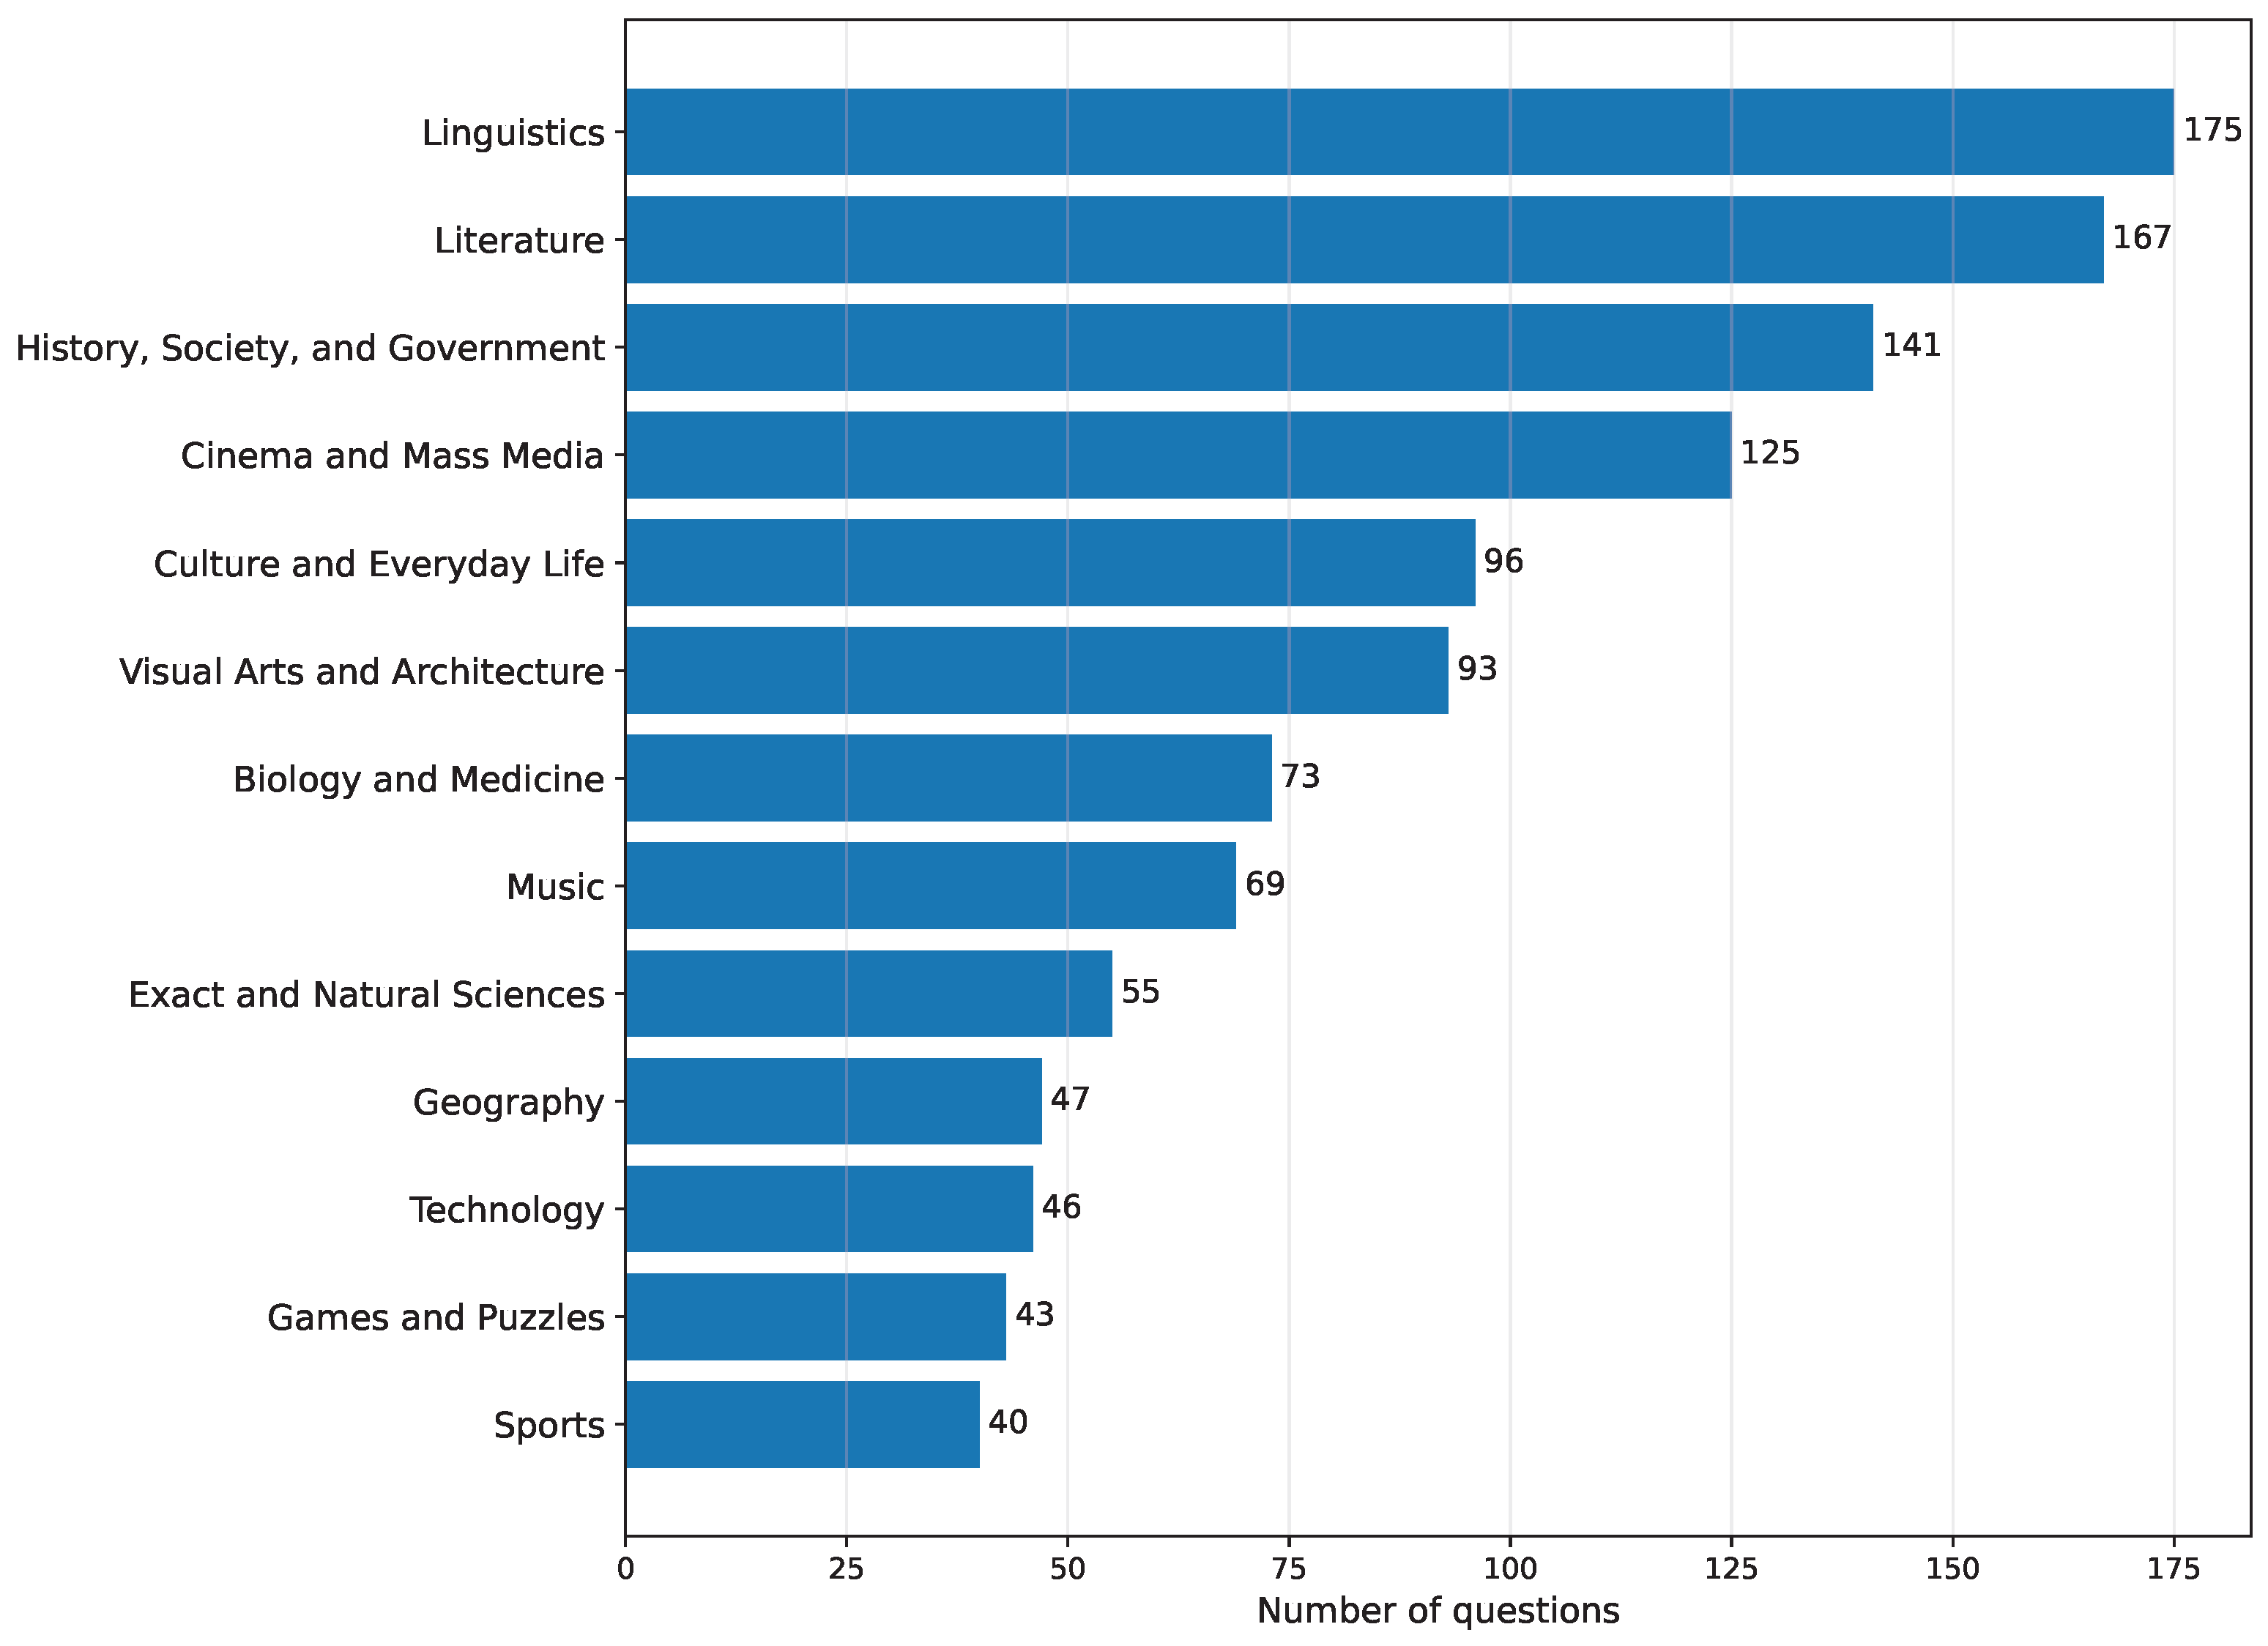
To characterize the thematic composition of the dataset, each question was assigned exactly one topic label. We used an LLM-assisted clustering approach inspired by prior work on LLM-guided text clustering [
22].
The annotation pipeline used Gemini 2.5 Flash to generate initial topic labels, consolidate semantically related labels into a shared taxonomy, and assign each question to one final category. Human validation was performed throughout the procedure, and rare or overlapping categories were manually merged. The resulting taxonomy contains 13 topic categories. Further methodological details and the complete topic distribution are provided in
Appendix D.
3.4.3. Image-Type Annotation
To characterize the form in which visual information is presented, each image was assigned one of three image types:
plain-text image (text whose visual presentation is not informative),
visual-text image (text whose layout or graphical presentation provides a relevant clue), or
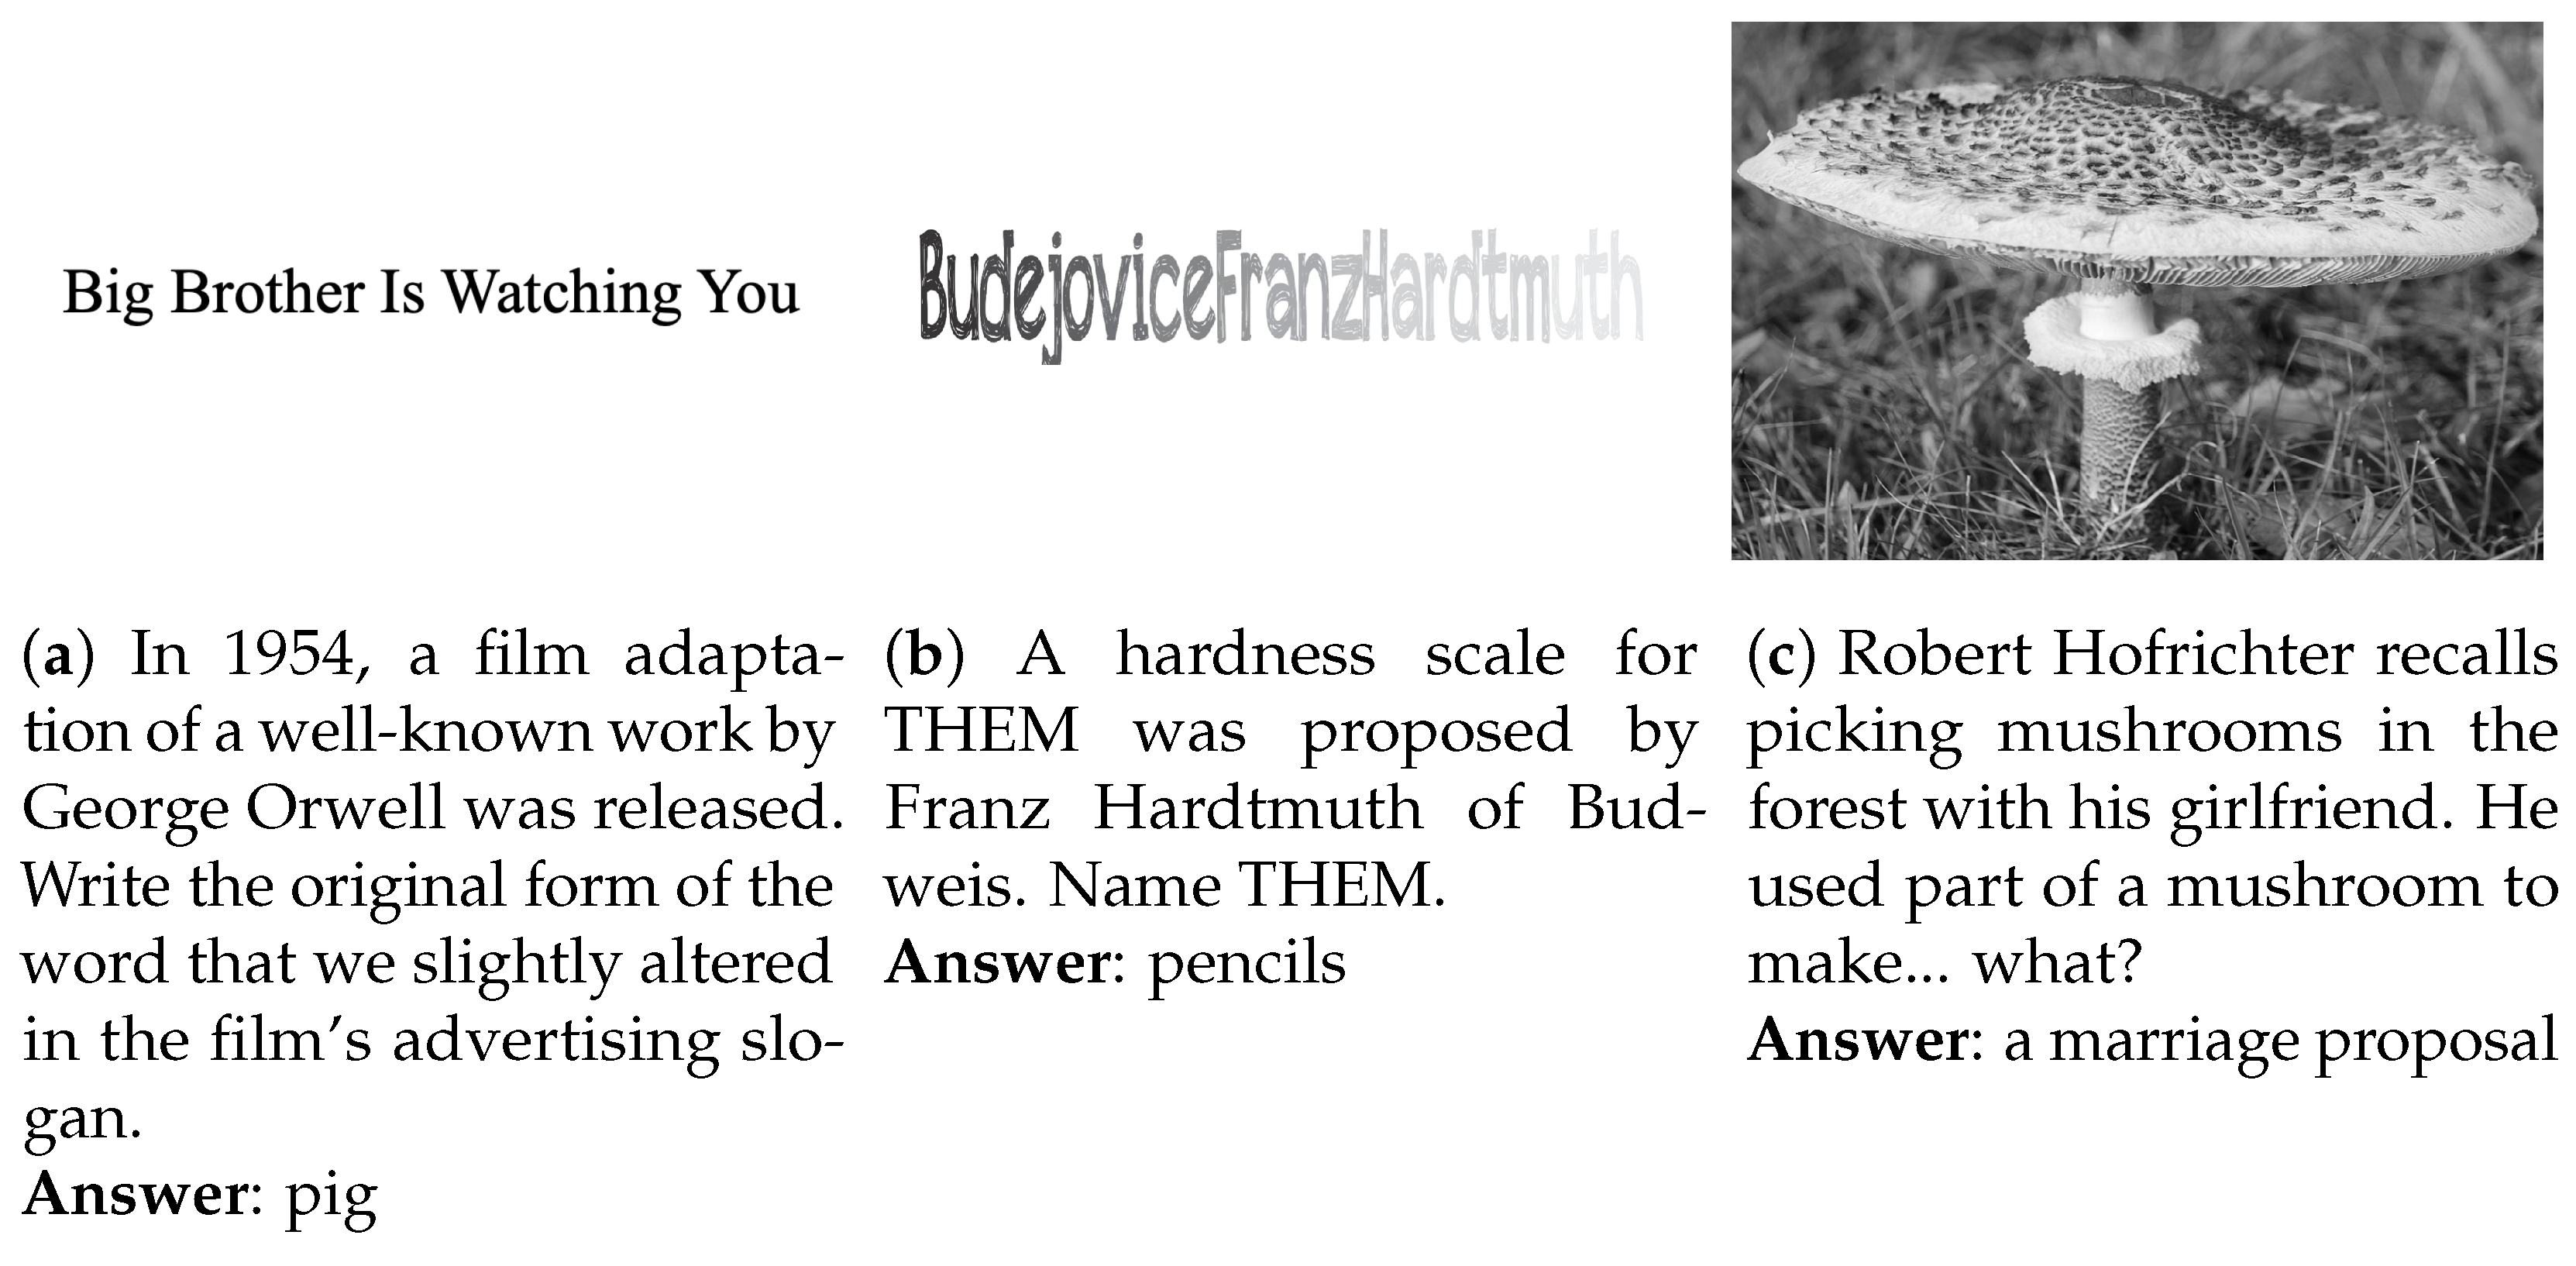
pictorial image (non-textual visual content). The annotation was performed using Gemini 2.5 Flash with manual validation; further details are provided in
Appendix E.
The distribution of image types is reported in
Table 2, while representative examples are shown in
Figure 5.
3.5. Models
We evaluated six recent MLLMs, representing both open-weight and API-only systems. The models were selected from different developers and model families to provide architectural and behavioral diversity, while prioritizing sufficiently capable and cost-efficient systems that enabled large-scale evaluation of multiple team strategies. The goal was not to benchmark the strongest available individual models but to study collaboration mechanisms across heterogeneous MLLMs under a computationally feasible evaluation setting.
Kimi-K2.5 (January 2026): an open-weight, natively multimodal Mixture-of-Experts model with 1T total and 32B activated parameters [
23].
Seed2.0 Lite (February 2026): an API-only general-purpose multimodal model developed by ByteDance Seed, designed to balance response quality and inference speed [
24].
Qwen3.5-397B-A17B (February 2026): an open-weight, natively multimodal Mixture-of-Experts model with 397B total and 17B activated parameters [
25].
Ministral 3 14B Instruct (December 2025): an open-weight dense multimodal instruction model with 14B parameters [
26].
MiMo-V2-Omni (March 2026): an API-only omni-modal model developed by Xiaomi that supports text, image, video, and audio understanding [
27].
Gemma 4 31B IT (April 2026): an open-weight dense instruction-tuned multimodal model developed by Google DeepMind with approximately 31B parameters [
28,
29].
All models were evaluated using their publicly available inference configurations without additional fine-tuning. Default decoding settings were used, with the temperature fixed at zero to improve the reproducibility of the generated outputs. The operational prompts were written in Russian and kept identical across models;
Appendix F provides their English translations and describes how the prompt templates were used in the individual and team strategies. The selected models differ in scale, architecture, and deployment mode, providing a diverse set of capabilities in multimodal instruction following, long-context processing, and reasoning.
Each model call could be retried up to three times only in the event of a request or generation failure or an invalid output format. The same prompt and inference settings were used for every retry. Semantically incorrect but correctly formatted answers were not regenerated. If no valid response was obtained from the model after three attempts, the attempt was recorded as unanswered and counted as incorrect.
3.6. Evaluation Protocol
Generated answers were evaluated using a three-stage procedure consisting of automatic matching, independent verification by two LLM judges, and human adjudication of cases in which the judges disagreed.
3.6.1. Stage 1: Automatic Matching
Each generated answer was normalized by converting it to lowercase, removing punctuation, diacritics, and redundant whitespace, and applying lemmatization where permitted by the dataset annotations. For questions allowing arbitrary word order, normalized tokens were compared independently of their original order. The processed response was then matched against the canonical answer and all accepted answer variants. A successful match was classified as correct without further verification.
3.6.2. Stage 2: Dual LLM Verification
Responses not accepted during automatic matching were independently evaluated by two LLM judges, Gemini-2.5-Flash [
30] and DeepSeek-V4-Flash [
31]. The rationale for selecting these models and the complete evaluation prompt are provided in
Appendix G. Each judge received the question, the generated answer, the canonical answer, and the accepted answer variants, and independently assigned a binary correct-or-incorrect label. When both judges assigned the same label, their decision was accepted as final. The judges disagreed on 3.24% of the responses evaluated at this stage, and their agreement measured using Krippendorff’s
was 0.7226.
3.6.3. Stage 3: Human Adjudication
Responses for which the two LLM judges assigned different labels were reviewed by a human evaluator (1068 answers). The evaluator examined the question, the generated answer, the canonical answer, and the accepted variants and assigned the final binary label.
3.6.4. Evaluation Metric
Performance was measured using accuracy, defined as the proportion of correctly answered questions among all evaluated questions. Questions for which the model failed to produce a valid response were counted as incorrect.
4. Results
4.1. Overall Performance of Team Strategies
Table 3 reports the accuracy of the single-model baseline and the six evaluated team strategies. For each row, the indicated model is used either independently in the single model configuration or as the team captain in all team-based configurations.
Every team-based configuration achieved higher accuracy than the corresponding single-model baseline for every captain. On average, Majority Voting produced the smallest improvement over the baseline, at 4.57 percentage points (p.p.), whereas Talkative Debate produced the largest, at 16.08 p.p. Talkative Debate was also the highest-performing strategy for every captain, with accuracy ranging from 24.44% for Ministral-3 to 31.20% for Gemma 4. The latter was the highest accuracy among the evaluated team configurations. Depending on the captain, Talkative Debate exceeded the corresponding single-model baseline by 9.40–20.00 p.p.
The Adaptive Strategy achieved a mean accuracy of 23.25%, compared with 19.69% for Silent Team and 25.60% for Talkative Team. This intermediate pattern was consistent across all six captains: the Adaptive Strategy always outperformed Silent Team but remained below Talkative Team.
For additional context, we evaluated GPT-5.5 in the single-model configuration using the same answering and evaluation protocol. It achieved an accuracy of 35.47%, providing a strong external reference point for interpreting the results of the main experiment. Talkative Debate with Gemma 4 as captain reached 31.20%, narrowing the difference from this demanding single-model reference to 4.27 p.p.
To determine which components of the team strategies contributed reliably to performance, we conducted six prespecified pairwise comparisons for each captain.
Table 4 reports the corresponding differences in accuracy and the results of exact McNemar tests after Holm correction applied jointly across all 36 prespecified pairwise comparisons.
Majority Voting achieved higher accuracy than the single-model configuration for all six models, although the improvement remained statistically significant for four captains: Seed-2.0, Ministral-3, MiMo-V2, and Gemma 4. Replacing majority voting with captain-based aggregation through Silent Team improved accuracy for five of the six captains. These gains were significant for Kimi-K2.5, Seed-2.0, Qwen3.5, and Gemma 4. The positive difference for MiMo-V2 was not significant, while Silent Team performed 2.74 p.p. worse than Majority Voting with Ministral-3 as captain, although this decrease was also not significant.
Sharing rationales in addition to candidate answers produced the strongest and most consistent statistical effects. Talkative Team significantly outperformed Silent Team for every captain, with improvements ranging from 4.79 to 7.26 p.p. and a mean improvement of 5.91 p.p. Similarly, Talkative Debate significantly outperformed Silent Debate for all six captains by 5.90–14.44 p.p. (mean: 8.06 p.p.). Thus, the advantage of rationale sharing was observed in both the single-round team setting and the debate setting.
An additional interaction round was also beneficial when both candidate answers and rationales were exchanged. Talkative Debate outperformed Talkative Team for every captain, producing an additional gain of 0.77–4.62 p.p. (mean: 2.74 p.p.). The improvement was statistically significant for Qwen3.5, Ministral-3, MiMo-V2, and Gemma 4, but not for Kimi-K2.5 or Seed-2.0. By contrast, the effect of an additional round was not consistent when only candidate answers were shared. Silent Debate significantly improved upon Silent Team only with MiMo-V2 as captain, by 2.99 p.p., while it significantly reduced accuracy with Ministral-3 as captain by 2.65 p.p. No significant difference was found for the other four captains.
Interestingly, the best-performing captain under most team strategies was not the strongest model in the single-model setting. Qwen3.5 achieved the highest single-model accuracy and also led under Majority Voting, whereas Gemma 4 achieved the highest accuracy under each of the other five team strategies. At the same time, comparatively weak single-model performance did not necessarily imply weak team performance. The clearest example is MiMo-V2: despite having the second-lowest single-model accuracy, at 8.12%, it reached 28.12% under Talkative Debate. This increase of 20.00 p.p. was the largest improvement over the single-model baseline observed among the six captains.
Overall, across the evaluated configurations on MChGK, the most robust improvements were associated with rationale sharing. Additional interaction further improved performance in the talkative setting, although its effect was smaller and was not statistically significant for every captain. In contrast, an additional answer-only round did not provide a consistent improvement across captains and could either improve or reduce accuracy depending on the captain. We further examine the effect of increasing the number of interaction rounds in
Section 5.2.
4.2. Performance Across Question Characteristics
4.2.1. Topic
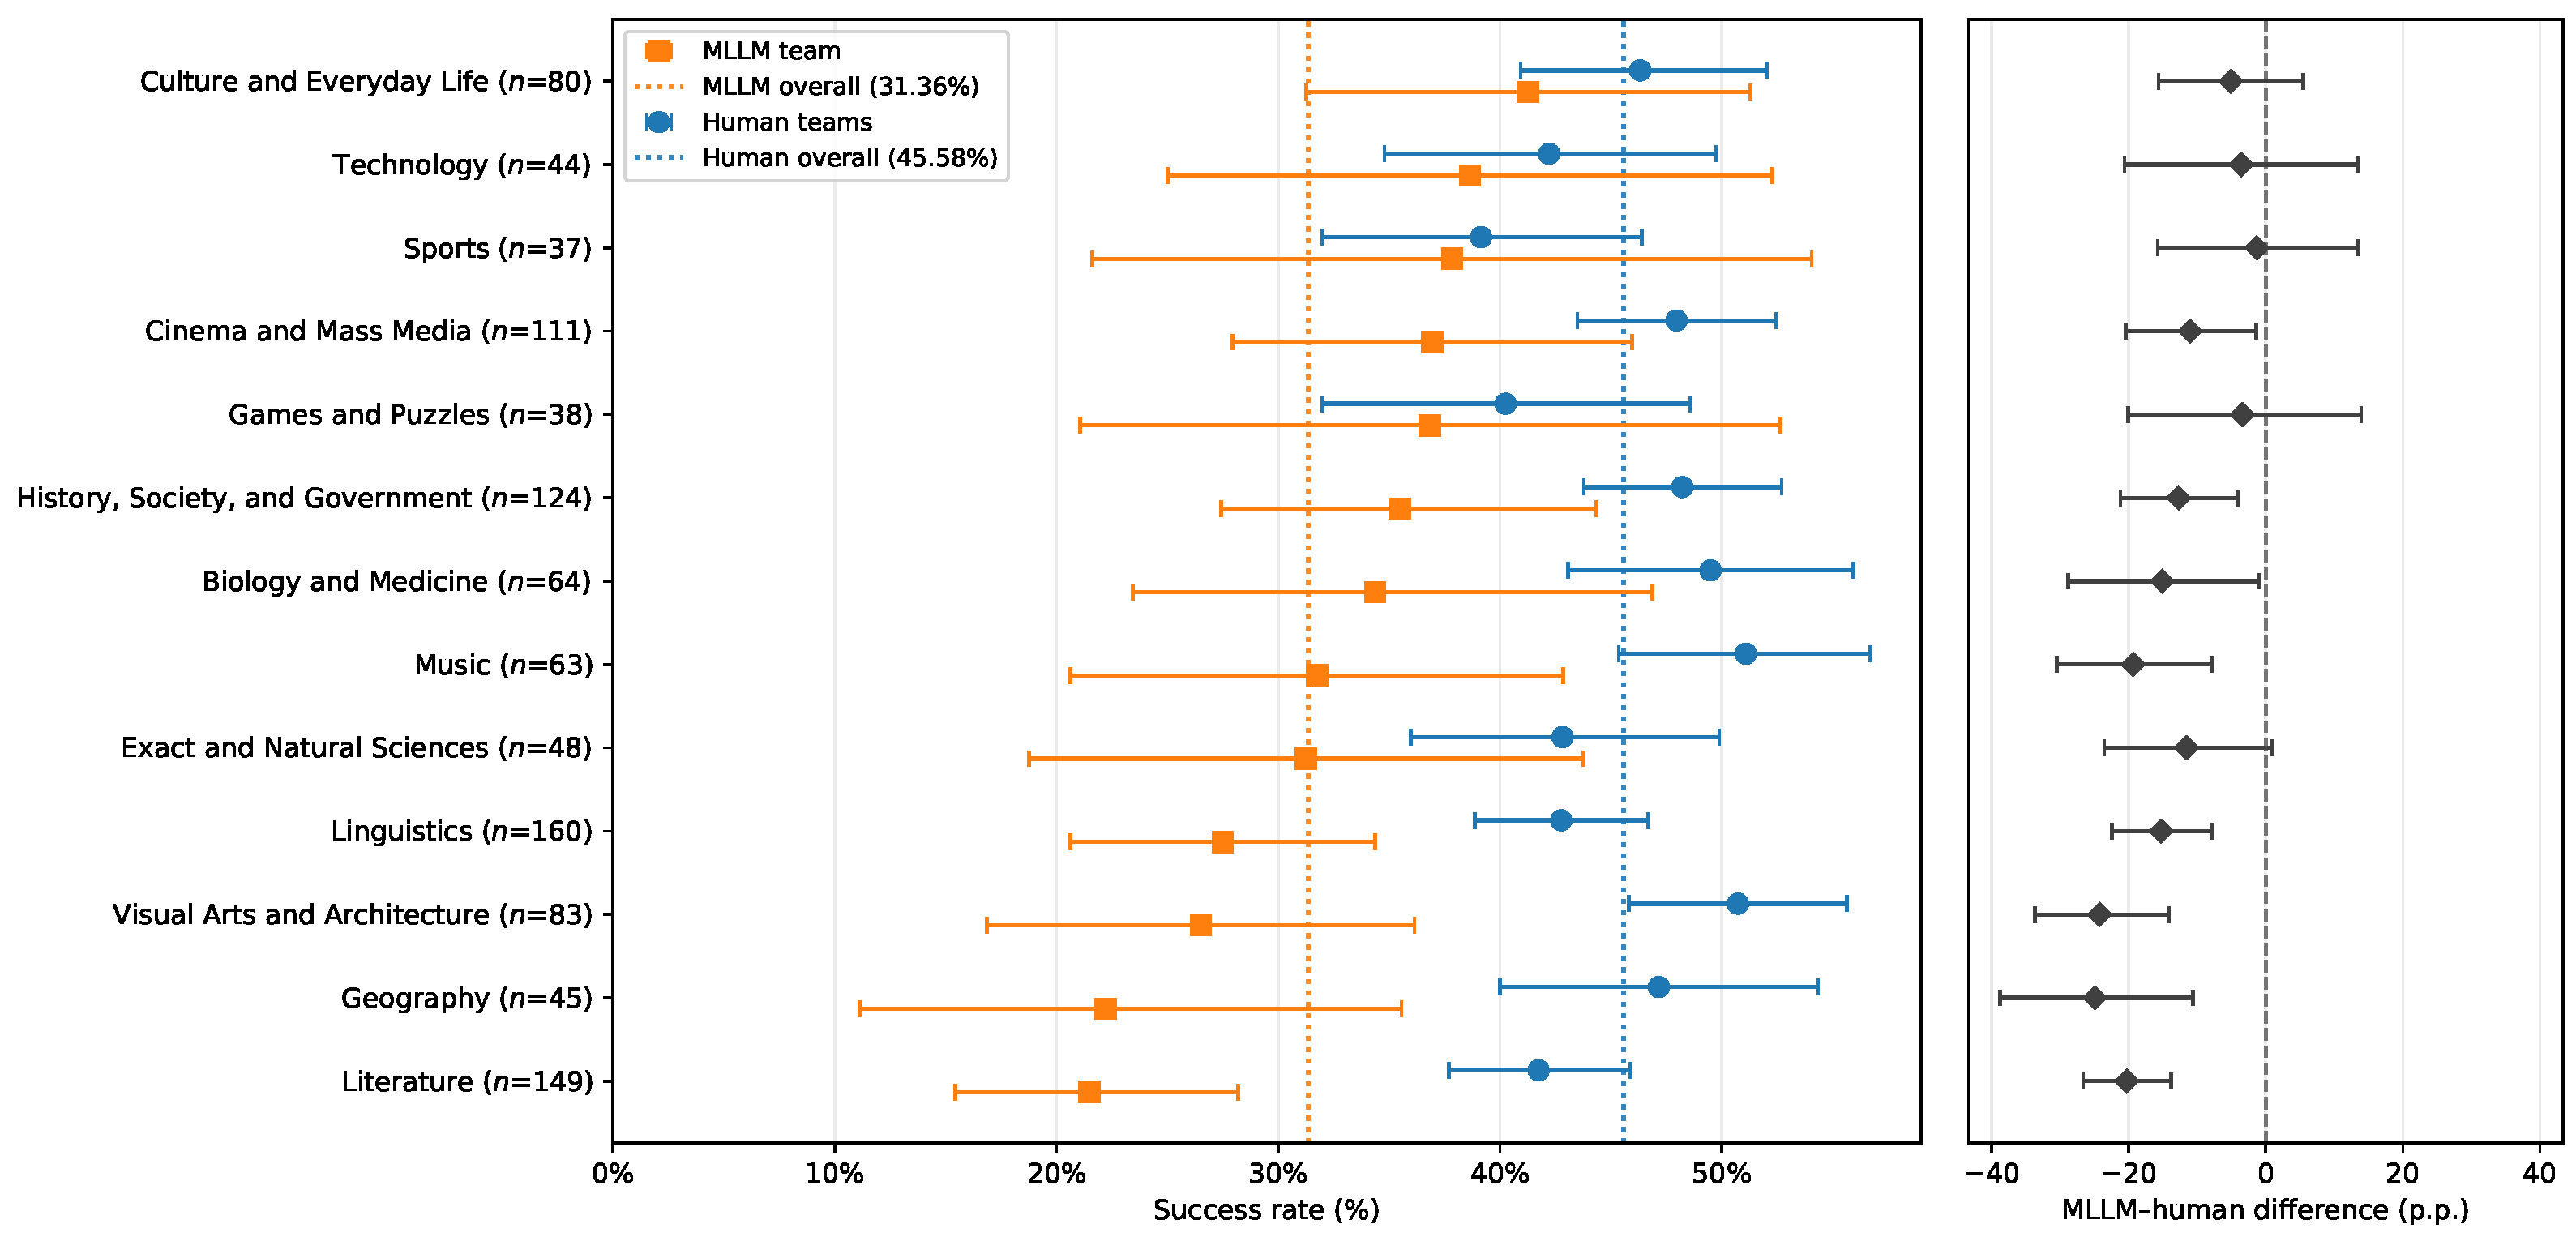
Figure 6 compares the best-performing team configuration, Talkative Debate with Gemma 4 as captain, with human teams across the 13 question topics. Both estimates were calculated on the same 1046 questions for which human success rates were available. This comparison should be interpreted descriptively: the MLLM estimate reflects the performance of a single fixed team configuration, whereas the human estimate averages question-level outcomes across many participating teams and therefore represents an aggregate benchmark rather than the performance of a directly comparable human team. The topic-level results on this matched subset closely reproduced those obtained on the full dataset of 1170 questions: overall MLLM accuracy differed by only 0.16 p.p., the mean absolute difference across topics was approximately 1.22 p.p., and the topic rankings were strongly correlated (
). The left panel presents the topic-level success rates and the overall performance of each group, while the right panel shows the MLLM–human difference in percentage points.
The accuracy of the MLLM team varied substantially across topics, ranging from 21.48% to 41.25%. The strongest results were obtained for Culture and Everyday Life, Technology, and Sports, whereas Literature, Geography, and Visual Arts and Architecture were the most difficult categories. The former group generally exceeded the team’s overall accuracy of 31.36%, while the latter categories fell considerably below it. Confidence intervals were wider for topics represented by fewer questions, making their individual estimates less precise.
Human performance was more uniform across topics and remained between 39.14% and 51.08%, with an overall mean success rate of 45.58%. The topic profiles of the MLLM and human teams did not fully coincide. In particular, Music and Visual Arts and Architecture were among the strongest categories for human teams but among the weaker categories for the MLLM team. Conversely, Sports and Games and Puzzles produced relatively strong MLLM results despite comparatively low human success rates.
The MLLM point estimate was below the corresponding human result in every topic. However, the magnitude and uncertainty of this difference varied considerably. The teams performed most similarly on Sports, Technology, Games and Puzzles, and Culture and Everyday Life; for these topics, as well as Exact and Natural Sciences, the 95% confidence intervals for the MLLM–human difference included zero. For the remaining eight topics, the intervals remained entirely below zero. The largest deficits were observed for Geography, Visual Arts and Architecture, Literature, and Music, where the differences approached or exceeded 20 p.p.
Overall, the aggregate gap between MLLM and human performance was unevenly distributed across topics. The MLLM team approached human performance in several categories, whereas substantial differences remained in a group of humanities- and arts-related topics.
4.2.2. Image Type
We next examined whether performance varied with the type of visual information accompanying the question.
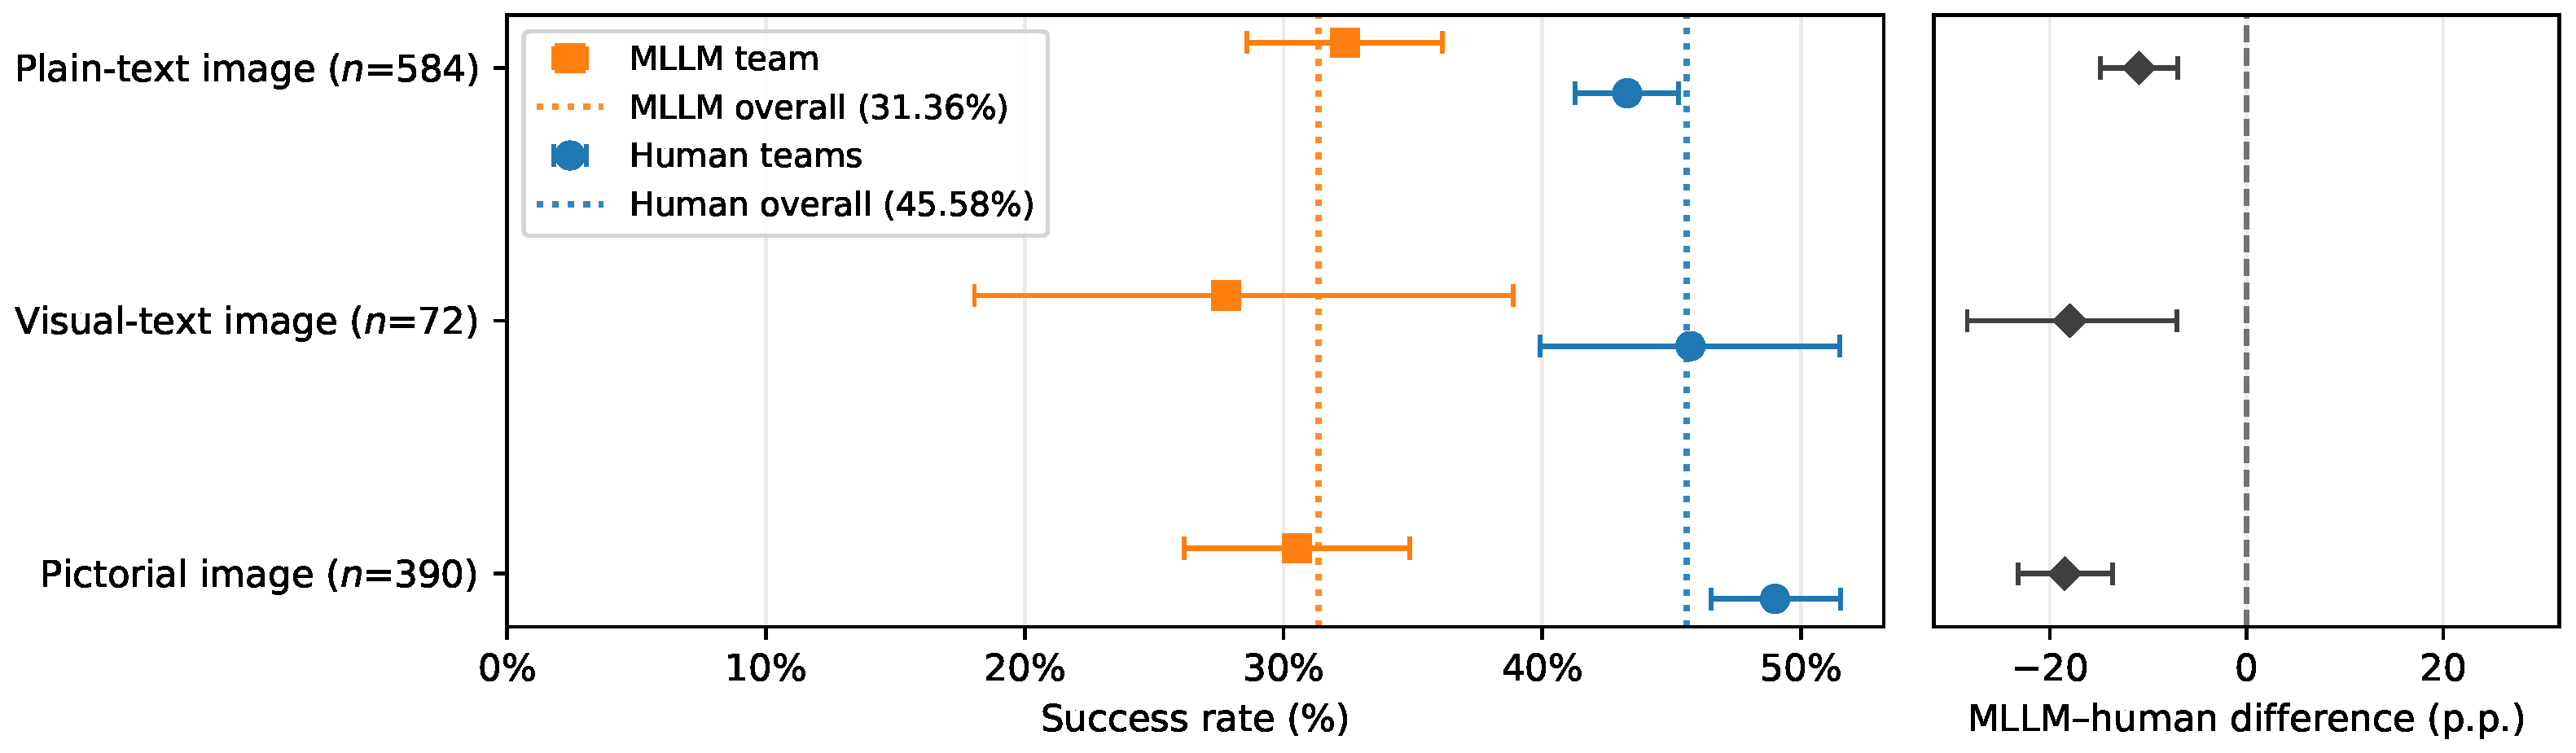
Figure 7 reports the results for plain-text, visual-text, and pictorial images. As in the topic-level comparison, the analysis was restricted to the 1046 questions with available human success rates, allowing MLLM and human performance to be evaluated on the same items. Plain-text images formed the largest category, whereas visual-text images were comparatively rare. The left panel shows the absolute success rates and overall results, and the right panel shows the MLLM–human difference in percentage points.
Questions with visual-text images appeared to be the most challenging for the MLLM team, yielding the lowest accuracy of the three categories (27.78%). Accuracy was higher for pictorial images (30.51%) and highest for plain-text images (32.36%). The estimate for visual-text images was also considerably less precise because this category contained only 72 questions, and its confidence interval overlapped those of the other two categories. Thus, the point estimates suggest particular difficulty with images combining textual and visual information, although the differences in MLLM accuracy across image types should be interpreted cautiously.
Human teams exhibited a different performance profile, achieving their highest success rate on questions with pictorial images and their lowest on those with plain-text images. Consequently, the MLLM team was closest to human performance for plain-text images, with a difference of p.p. The deficits were substantially larger and similar in magnitude for pictorial and visual-text images, at approximately 18 p.p.
The MLLM point estimate was below the corresponding human result for all three image types, and each 95% confidence interval for the MLLM–human difference remained entirely below zero. Overall, the results indicate that the relative disadvantage of the MLLM team was smaller when the image primarily conveyed textual information and more pronounced when solving the question required processing pictorial content or integrating visual and textual elements within the image.
4.2.3. Year
To examine whether performance was associated with question recency, we fitted a logistic regression predicting the correctness of the best-performing team from the year of each question. No statistically significant association was observed (, odds ratio per year , 95% CI: , ). Thus, more recent questions were not systematically easier or harder for the MLLM team. This result provides no evidence of a simple temporal memorization effect, although it cannot rule out the leakage or memorization of individual questions.
5. Discussion
5.1. Inference Resource Usage and Accuracy Trade-Offs
Table 5 compares inference resource usage and accuracy for configurations with Gemma 4 as captain. This model achieved the highest accuracy under five of the six main team strategies, and its strategy ranking matches the ranking of mean accuracies across all six captains. The initial team input counts aggregate the usage of six heterogeneous models, whose tokenization and visual-input processing may differ. These totals therefore need not equal the Gemma 4 single-model input count multiplied by the team size.
Rationale sharing improves accuracy with a comparatively modest increase in resource usage. Relative to Silent Team, Talkative Team requires approximately 10% more input tokens while leaving output usage nearly unchanged, yielding an accuracy gain of 6.15 p.p. with the same number of model calls. The Adaptive Strategy reduces input and output usage by approximately 11% and 2%, respectively, relative to Talkative Team, at the cost of lower accuracy.
Additional debate produces smaller accuracy gains at substantially greater resource requirements. Compared with Talkative Team, Talkative Debate increases input and output usage by approximately 113% and 106%, respectively, for a further accuracy gain of 2.31 p.p. A subsequent discussion round increases input and output usage by another 52% and 49%, respectively, but yields a net gain of only one correct answer across the evaluation dataset, approximately 0.08 p.p. For the evaluated Gemma 4 configurations, these results indicate diminishing returns from additional interaction: Talkative Team provides substantial improvements at a lower resource requirement, while Talkative Debate achieves higher accuracy with considerably more inference workload.
Call and token counts characterize inference workload, while latency and monetary cost also depend on the models and providers used, pricing, and call scheduling, including opportunities for parallel execution. Moreover, token counts across heterogeneous models do not represent equivalent amounts of computation. The reported measurements therefore support a resource-aware comparison of the evaluated strategies, while deployment-specific cost and latency require assessment in the intended execution environment.
5.2. Effect of Increasing the Number of Interaction Rounds
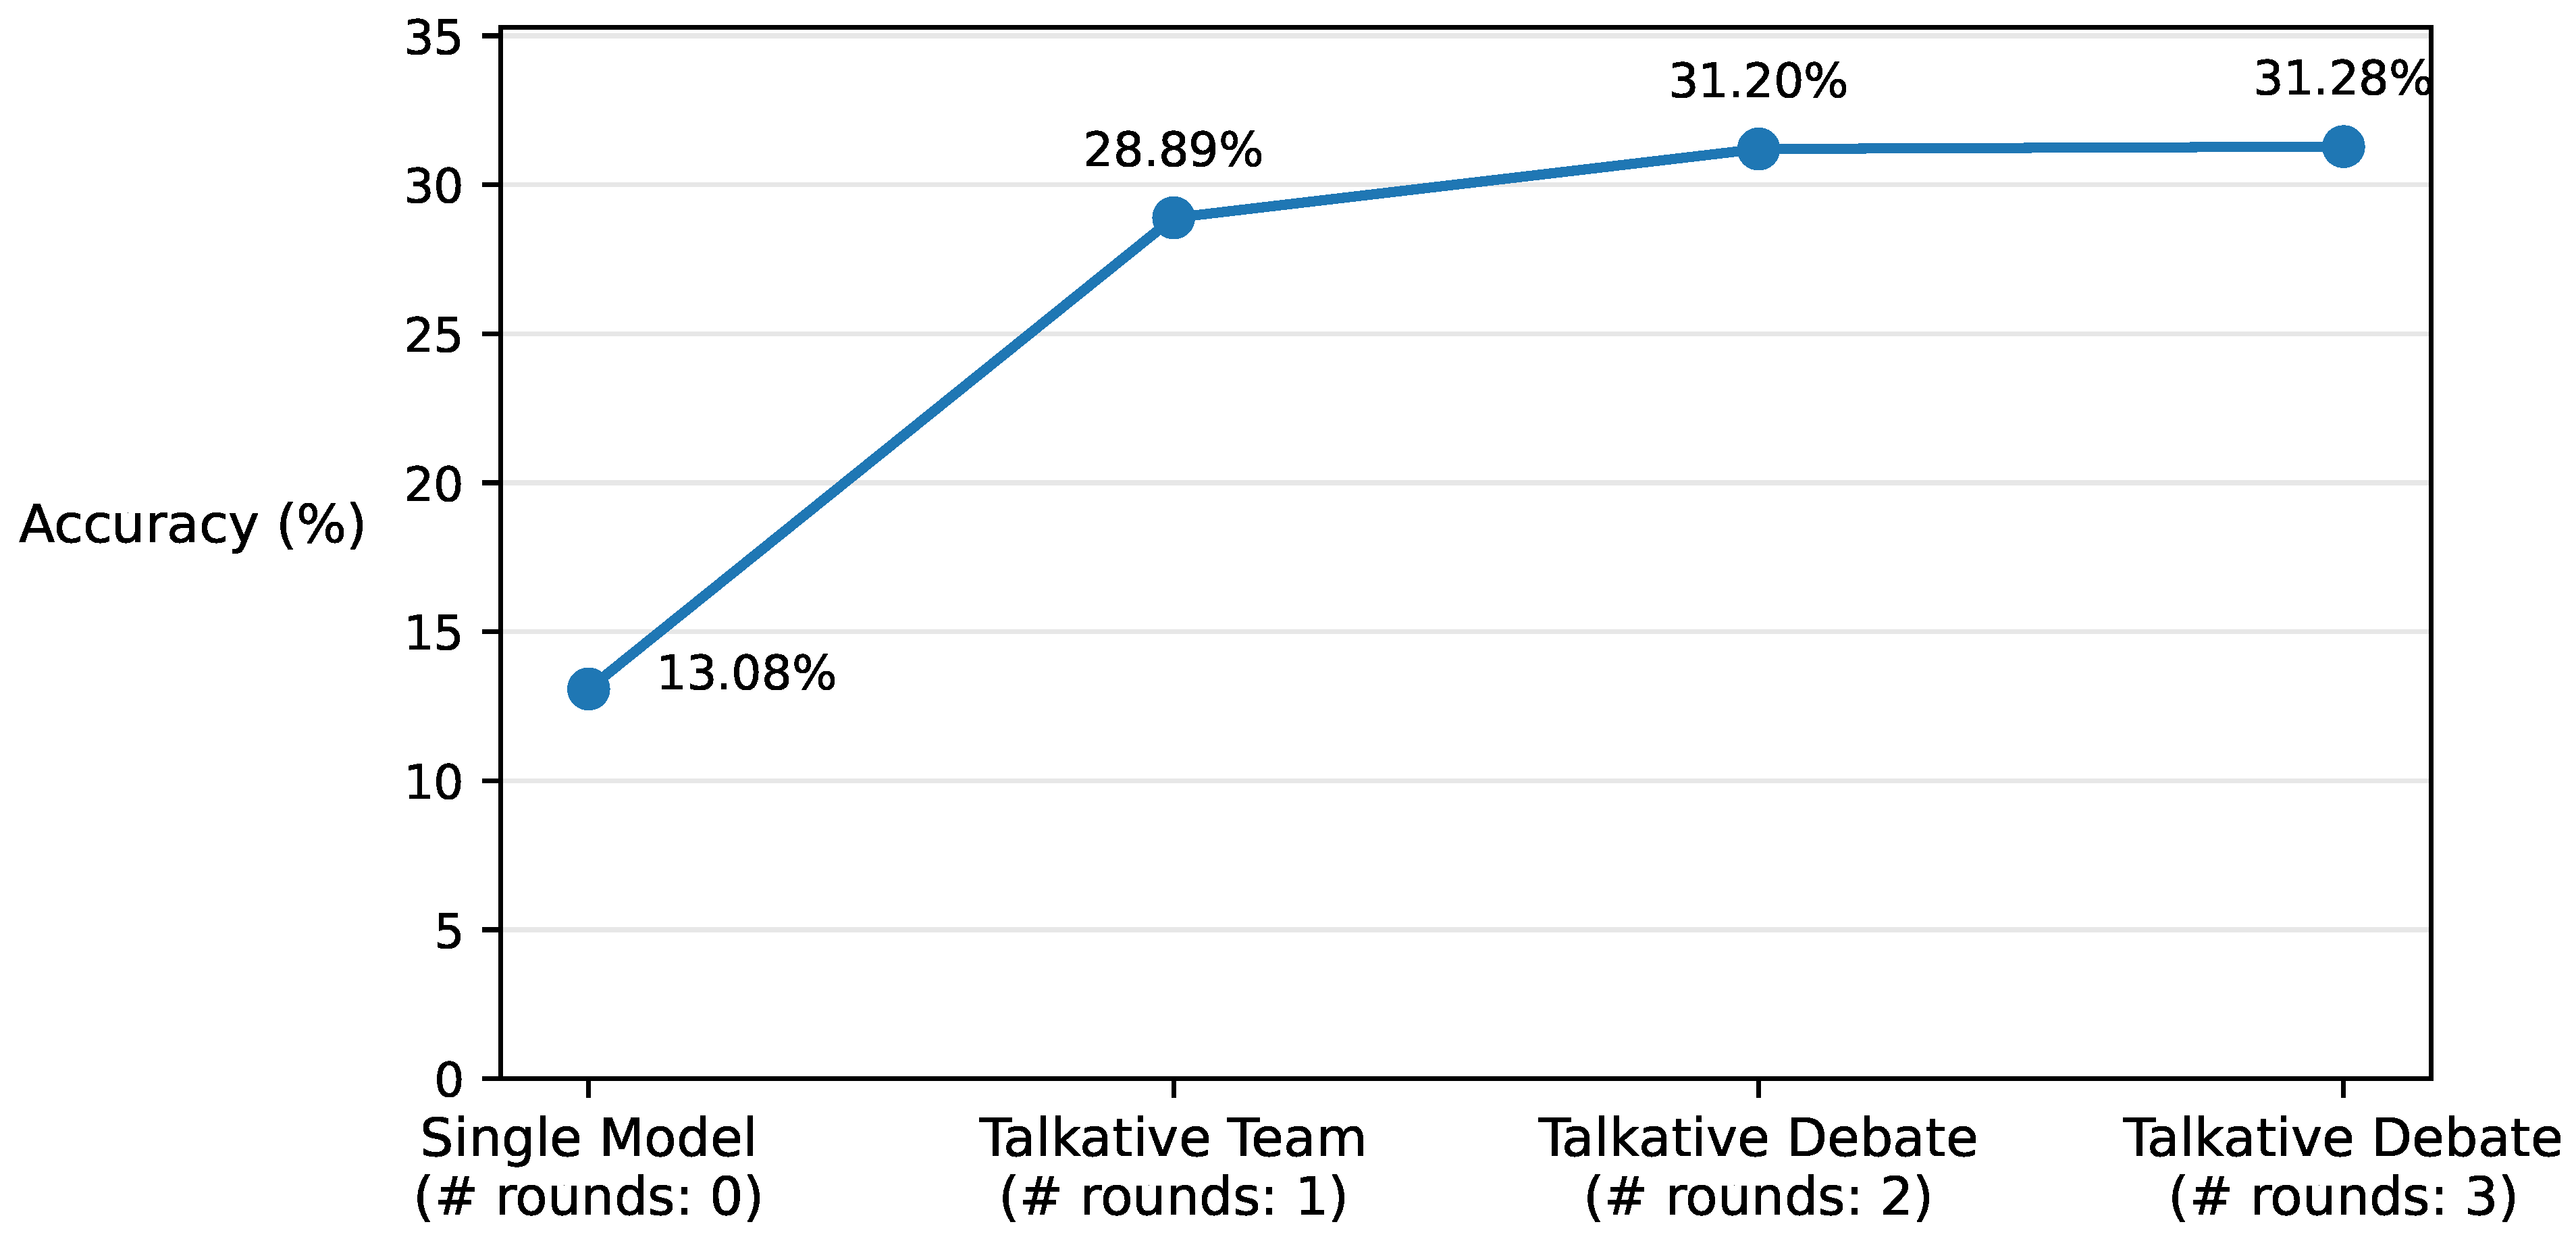
To examine whether additional interaction continues to improve team performance, we evaluated a sequence of progressively more interactive configurations for the best-performing captain, Gemma 4. These configurations corresponded to zero, one, two, and three rounds of discussion: single model, Talkative Team, Talkative Debate, and Talkative Debate with an additional round, respectively.
As shown in
Figure 8, accuracy increased monotonically with the number of rounds, but the marginal gains diminished substantially after the first round. Introducing a single team interaction round increased accuracy by 15.81 p.p. relative to the single-model baseline. Adding a second round yielded a further gain of 2.31 p.p., whereas the third round improved accuracy by only 0.08 p.p. Thus, for the evaluated Gemma 4 configurations, most of the improvement was achieved by the first round, and the benefit of further interaction was minimal beyond two rounds.
5.3. Why Team-Based Inference Improves Performance
To investigate the mechanisms behind the observed gains, we focused on the best-performing team, with Gemma 4 serving as captain. Each final answer was classified relative to the six initial individual responses into one of four mutually exclusive and collectively exhaustive categories: a modal initial answer, defined as an answer variant with the highest frequency among the initial responses; the captain’s non-modal initial answer; a non-modal answer proposed by another team member; or a novel answer absent from the initial response set. In Majority Voting, the final answer coincided with the unique modal answer whenever one existed, while ties were resolved using the captain’s answer. In the remaining strategies, the final answer was produced by the captain after considering the team outputs and, in the talkative strategies, their rationales. The overall accuracy of each strategy is therefore the frequency-weighted average of the conditional accuracies reported for the four categories in
Table 6.
The comparison between Majority Voting and Silent Team demonstrates the value of selective aggregation. Majority Voting always returned a modal answer and achieved 16.75% accuracy. Silent Team retained a modal answer on only 67.69% of the questions, but these selected modal answers were correct in 24.62% of cases. Their frequency-weighted contribution was approximately 16.67 p.p., nearly equal to the complete Majority Voting result. Selections from the other three categories contributed a further 6.07 p.p., raising overall accuracy to 22.74%. Thus, the captain preserved modal answers when they appeared comparatively reliable while replacing them on questions where an alternative answer was more promising.
Sharing rationales further improved the use of alternative hypotheses. From Silent Team to Talkative Team, the share of modal answers decreased from 67.69% to 57.09%, while novel answers increased from 4.27% to 16.41%. Conditional accuracy increased from 23.59% to 31.88% for non-modal teammate answers and from 16.00% to 23.44% for novel answers. Together, these two categories accounted for approximately 4.88 p.p. of the total 6.15 p.p. improvement from Silent Team to Talkative Team. Most of the benefit of rationale sharing therefore came from more effective selection of teammate hypotheses and more successful synthesis of new answers.
The second discussion round produced a smaller but similar effect. Relative to Talkative Team, Talkative Debate increased the share of novel answers from 16.41% to 22.05% and their conditional accuracy from 23.44% to 25.97%. Consequently, the increased use and higher accuracy of novel answers explained approximately 1.88 p.p. of the overall 2.31 p.p. improvement from Talkative Team to Talkative Debate.
We additionally examined whether the answer-source categories were associated with question topics or image types. The topic distributions showed no clear or consistent pattern across the three captain-based strategies. By contrast, novel answers were disproportionately associated with plain-text images in all three strategies. Such images accounted for 55.73% of the dataset but represented 74.00% of novel answers under Silent Team, 59.90% under Talkative Team, and 58.53% under Talkative Debate. The conditional accuracy of these novel answers was 13.51%, 26.96%, and 31.79%, respectively. This pattern is consistent with the team making greater use of textual information embedded in images when formulating new hypotheses, especially when the models’ rationales were available.
Overall, the pattern is consistent with the captain acting as a selective aggregator rather than simply following either the modal response or its own initial hypothesis. Richer interaction allowed it to retain stronger modal answers, recover useful alternatives proposed by teammates, and increasingly come up with correct answers that were absent from the initial response set.
5.4. How Discussion Reshapes the Candidate Set
To examine the internal dynamics of Talkative Debate, we compared the six initial individual responses with the six responses produced in the second post-discussion round, before the Gemma 4 captain selected the final answer. As shown in
Table 7, the second round substantially reduced answer diversity while increasing agreement around correct hypotheses. The mean number of unique variants decreased from 4.04 to 2.36. At the same time, the mean Jaccard similarity between the two response sets was only 0.416, and the second-round set contained 0.66 newly introduced variants on average. Thus, the reduction in diversity did not merely reflect convergence on a subset of the initial answers; discussion also replaced some initial hypotheses with newly formulated alternatives. The availability of at least one correct candidate increased modestly, from 32.05% to 34.53%, whereas the mean support for correct answers more than doubled, from 12.25% to 25.60%. This suggests that the second round primarily strengthened agreement around correct hypotheses, while also introducing correct candidates on some questions.
The transition analysis in
Table 8 further shows that final performance depended strongly on whether a correct hypothesis was available after discussion. A correct candidate remained absent in both rounds for 62.39% of the questions, and the captain answered correctly in only 0.68% of these cases. A correct candidate emerged during the second round on 65 questions (5.56%), of which the captain solved 56 (86.15%), always selecting one of the correct second-round candidates. When a correct candidate was present in both rounds, the captain answered 304 of 339 questions correctly (89.68%). In all but one case, the final answer matched a correct second-round candidate; the remaining answer appears to have been independently reformulated. By contrast, all 36 questions on which a correct initial candidate disappeared during discussion were answered incorrectly. Overall, in the analyzed configuration with Gemma 4 as captain, Talkative Debate improved performance primarily by preserving or introducing correct hypotheses during the second round and increasing their support, after which the captain selected them with high reliability. Direct recovery when the second-round response set contained no correct candidate was possible but rare.
5.5. Error Analysis
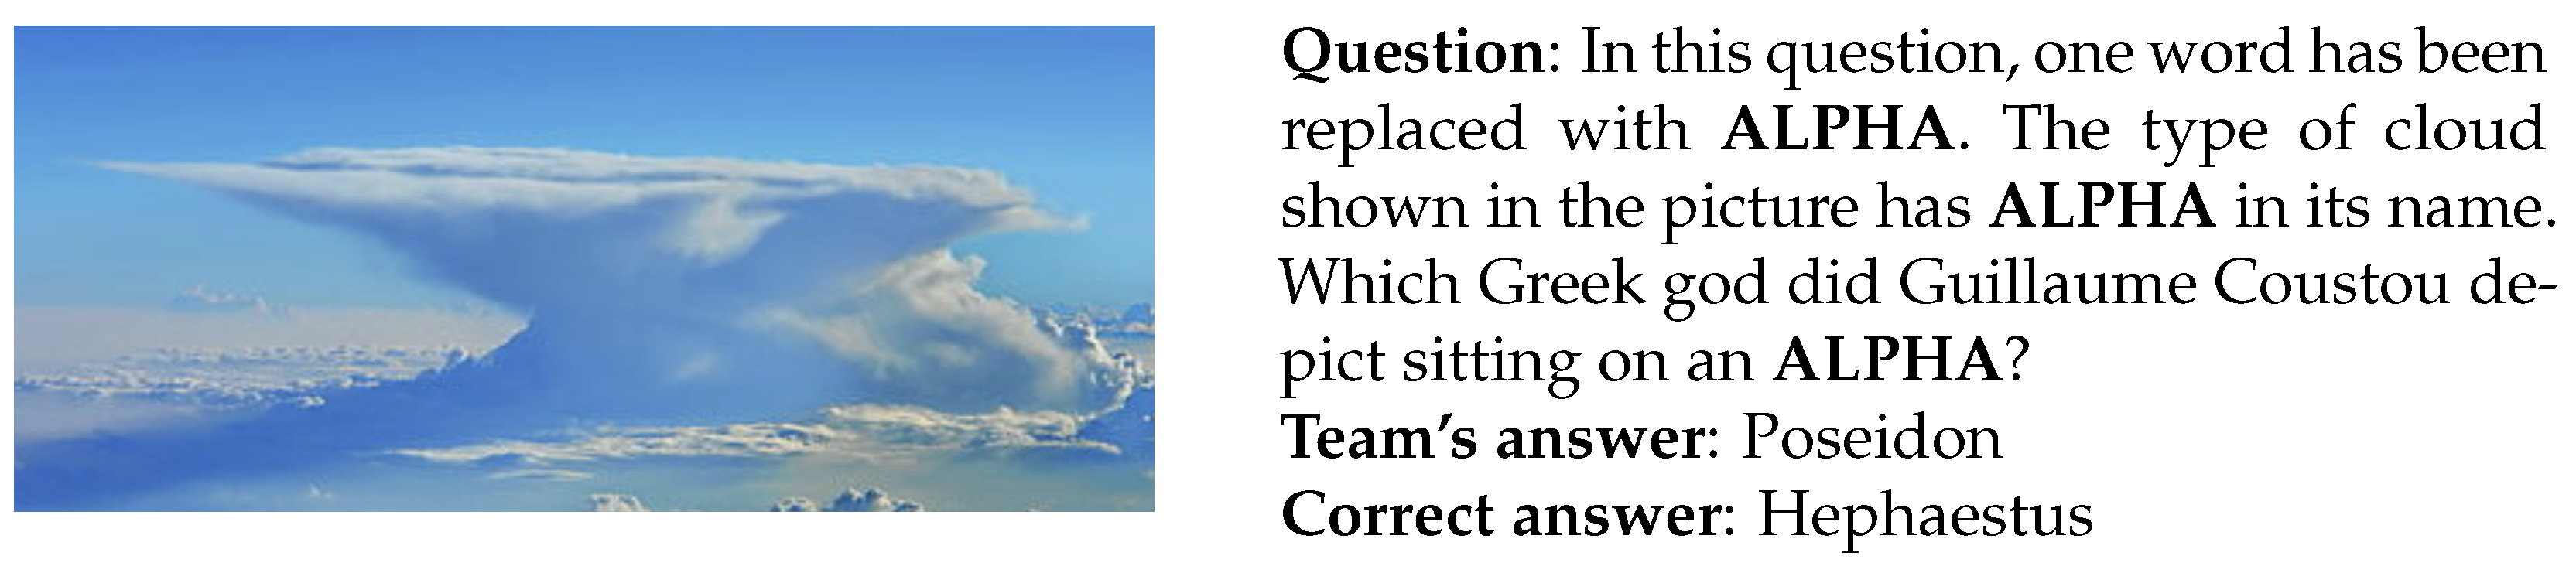
To better understand the limitations of the best-performing team configuration, Talkative Debate with Gemma 4 as captain, we conducted a qualitative analysis of its incorrect answers. The resulting errors were classified along five dimensions.
Image interpretation errors: This category includes cases in which the MLLMs misinterpret information contained in the accompanying visual material. As a result, the team may generate a plausible but incorrect textual description of the image, directing the subsequent discussion toward an erroneous hypothesis from the outset. An example is shown in
Figure 9, where the team failed to recognize the silhouette of an anvil in the photograph.
Figure 9.
Example of a team response exhibiting an image interpretation error.
Figure 9.
Example of a team response exhibiting an image interpretation error.
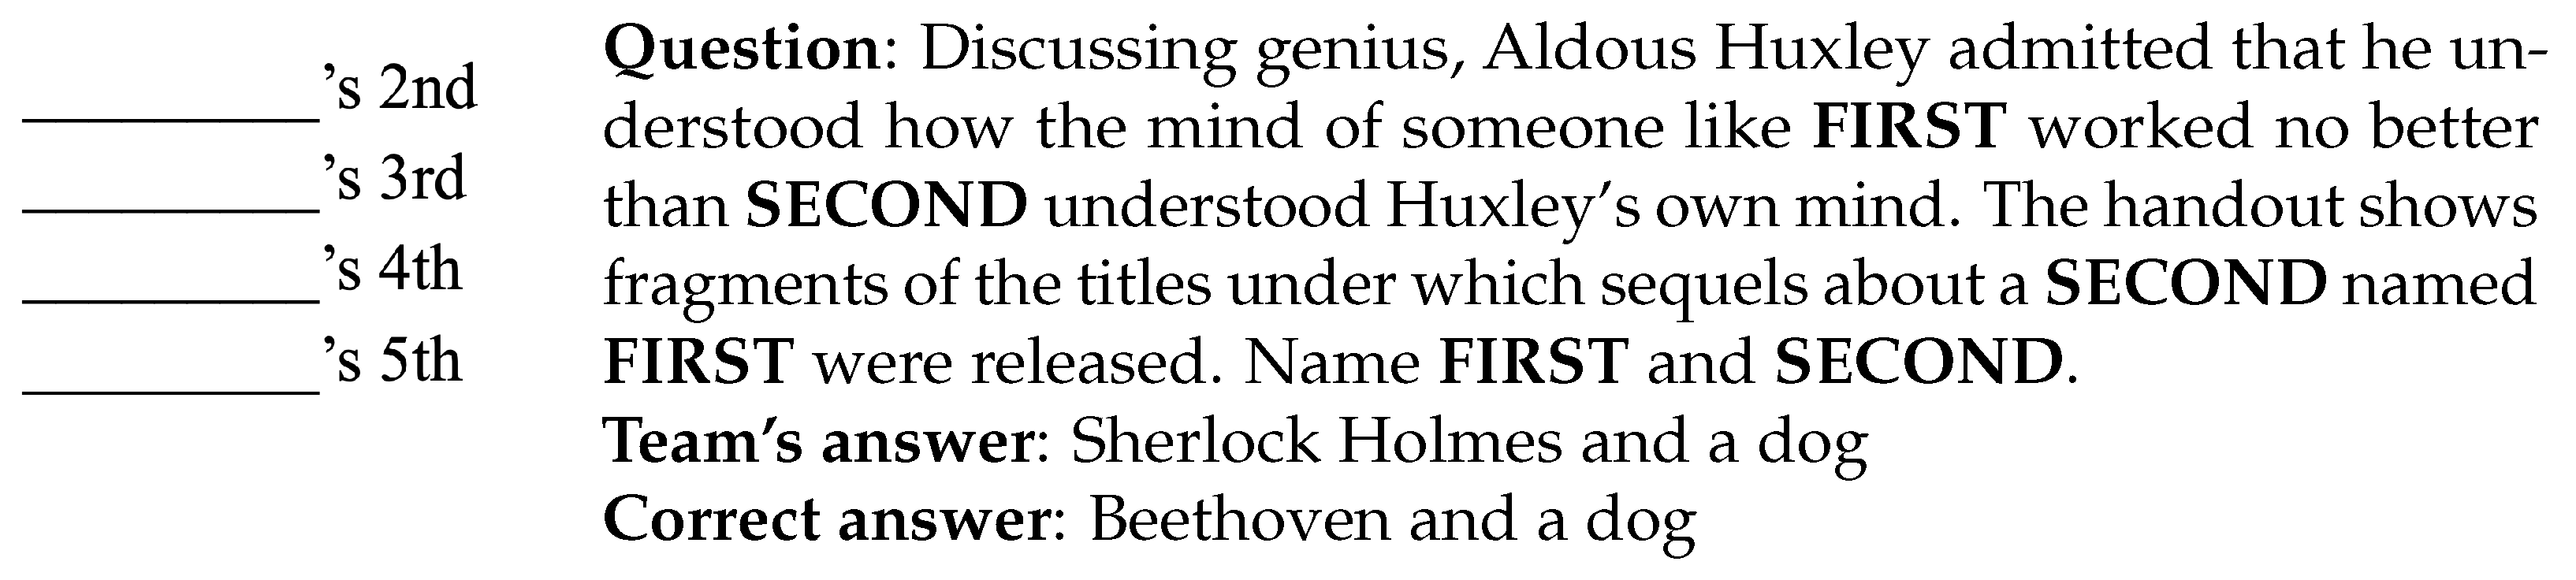
Factual knowledge gaps or distortions: This type of error occurs when the models lack the specific encyclopedic knowledge required to answer the question or when relevant facts are distorted by model hallucinations.
What? Where? When? questions frequently rely on obscure historical, cultural, or scientific facts. When the team does not possess the necessary knowledge, subsequent reasoning may lead to an incorrect answer. An example is shown in
Figure 10: the team was unaware of the film series about a dog named Beethoven.
Figure 10.
Example of a team response exhibiting a factual knowledge gap.
Figure 10.
Example of a team response exhibiting a factual knowledge gap.
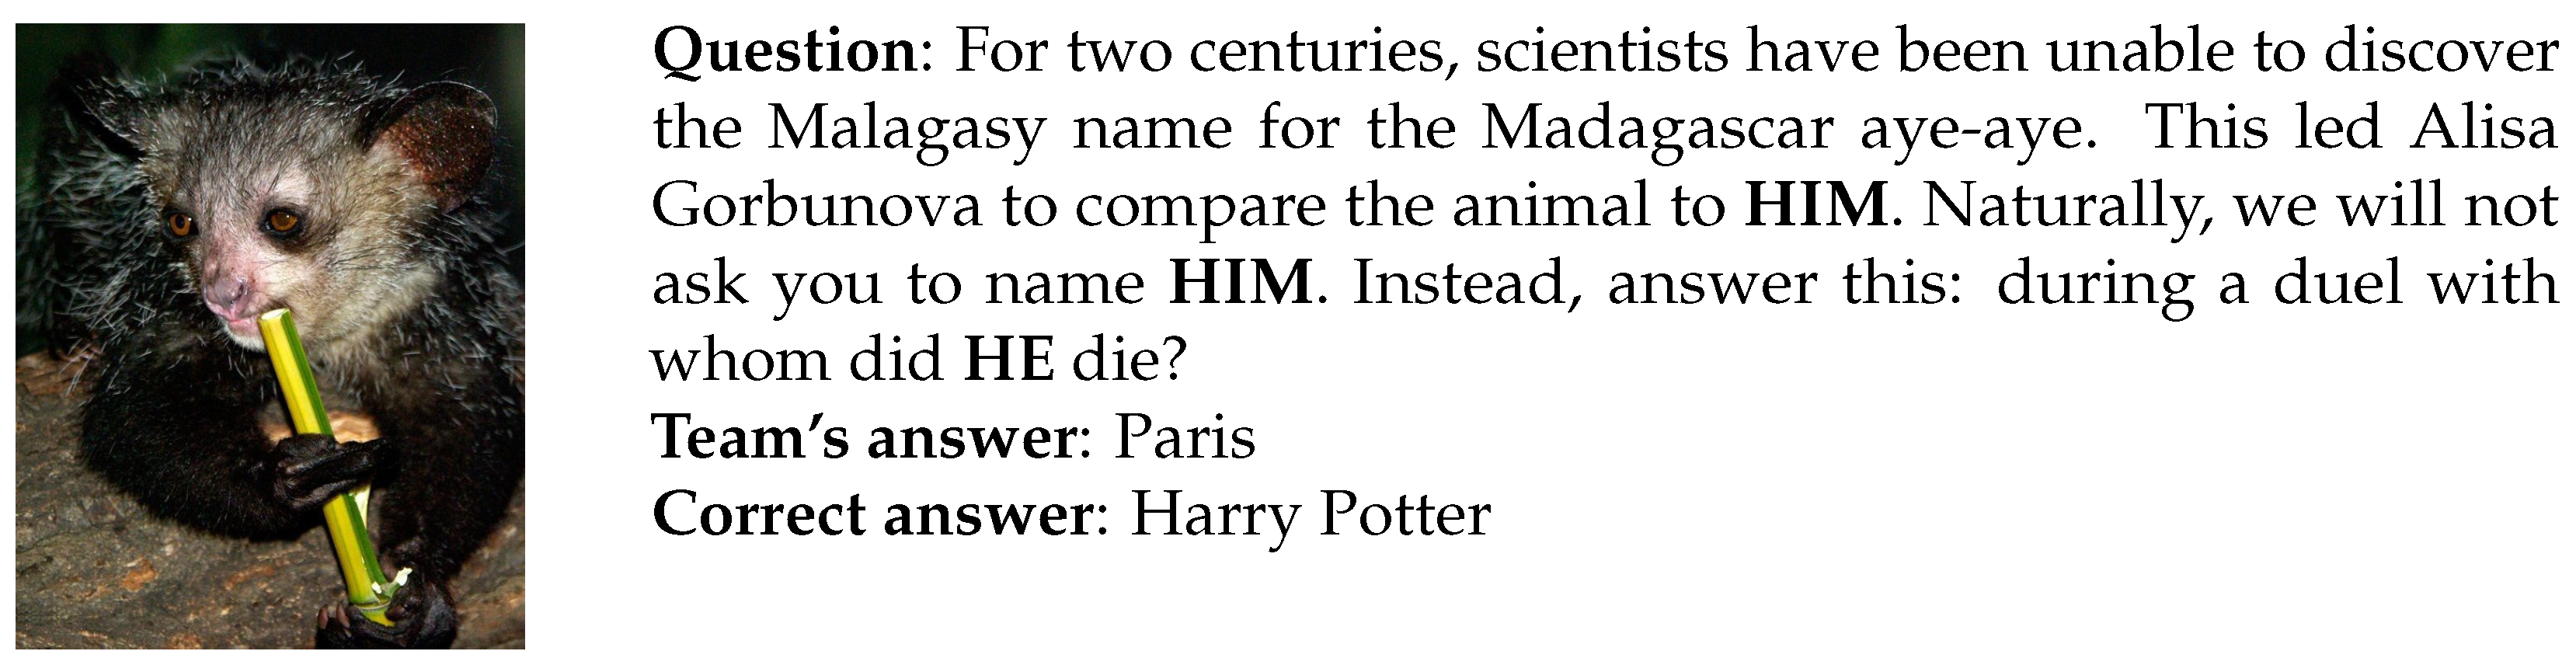
Failure to recognize implicit clues: Some
What? Where? When? questions contain indirect cues, such as wordplay, unusual word order, or seemingly optional remarks addressed to the players. In such cases, the models focus on the literal meaning of the textual and visual information while overlooking these auxiliary constructions, even though they could substantially narrow the search space for the correct answer. An example is shown in
Figure 11: the team failed to recognize the allusion to “He-Who-Must-Not-Be-Named.”
Figure 11.
Example of a team response exhibiting a failure to recognize implicit clues.
Figure 11.
Example of a team response exhibiting a failure to recognize implicit clues.
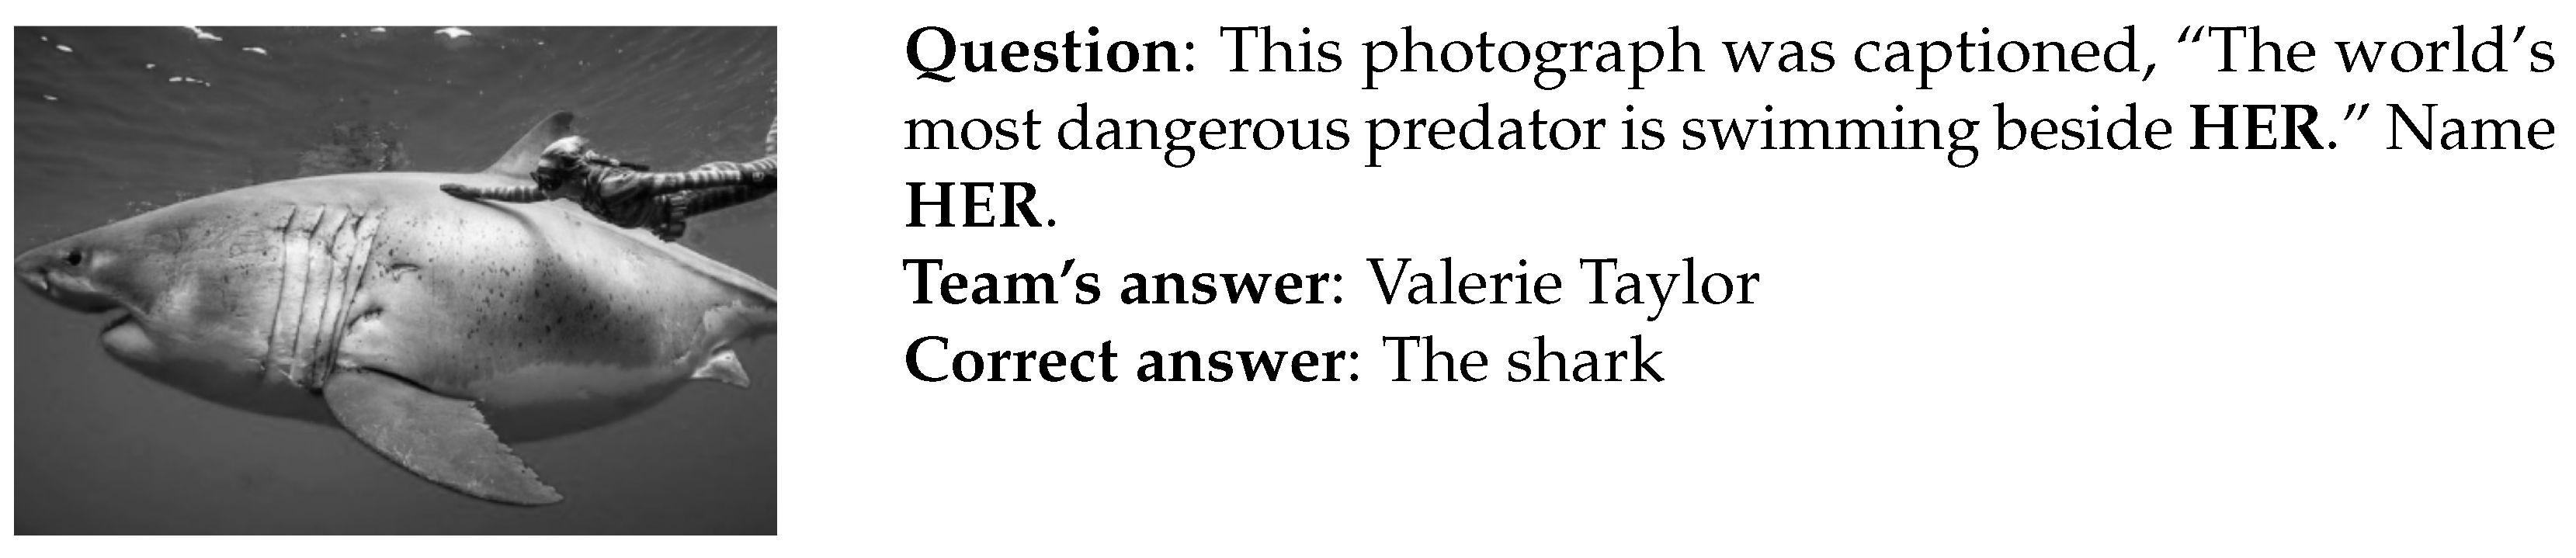
Reasoning-chain errors: Even when the image is interpreted correctly and all the necessary factual knowledge is available, the MLLM team may still fail to resolve the question’s complex logic. The generated rationale chains do not always enable the team to connect disparate pieces of evidence into the unified concept intended by the question author. An example is shown in
Figure 12: the team failed to infer that the word “predator” in the question referred to a human.
Figure 12.
Example of a team response exhibiting a reasoning-chain error.
Figure 12.
Example of a team response exhibiting a reasoning-chain error.
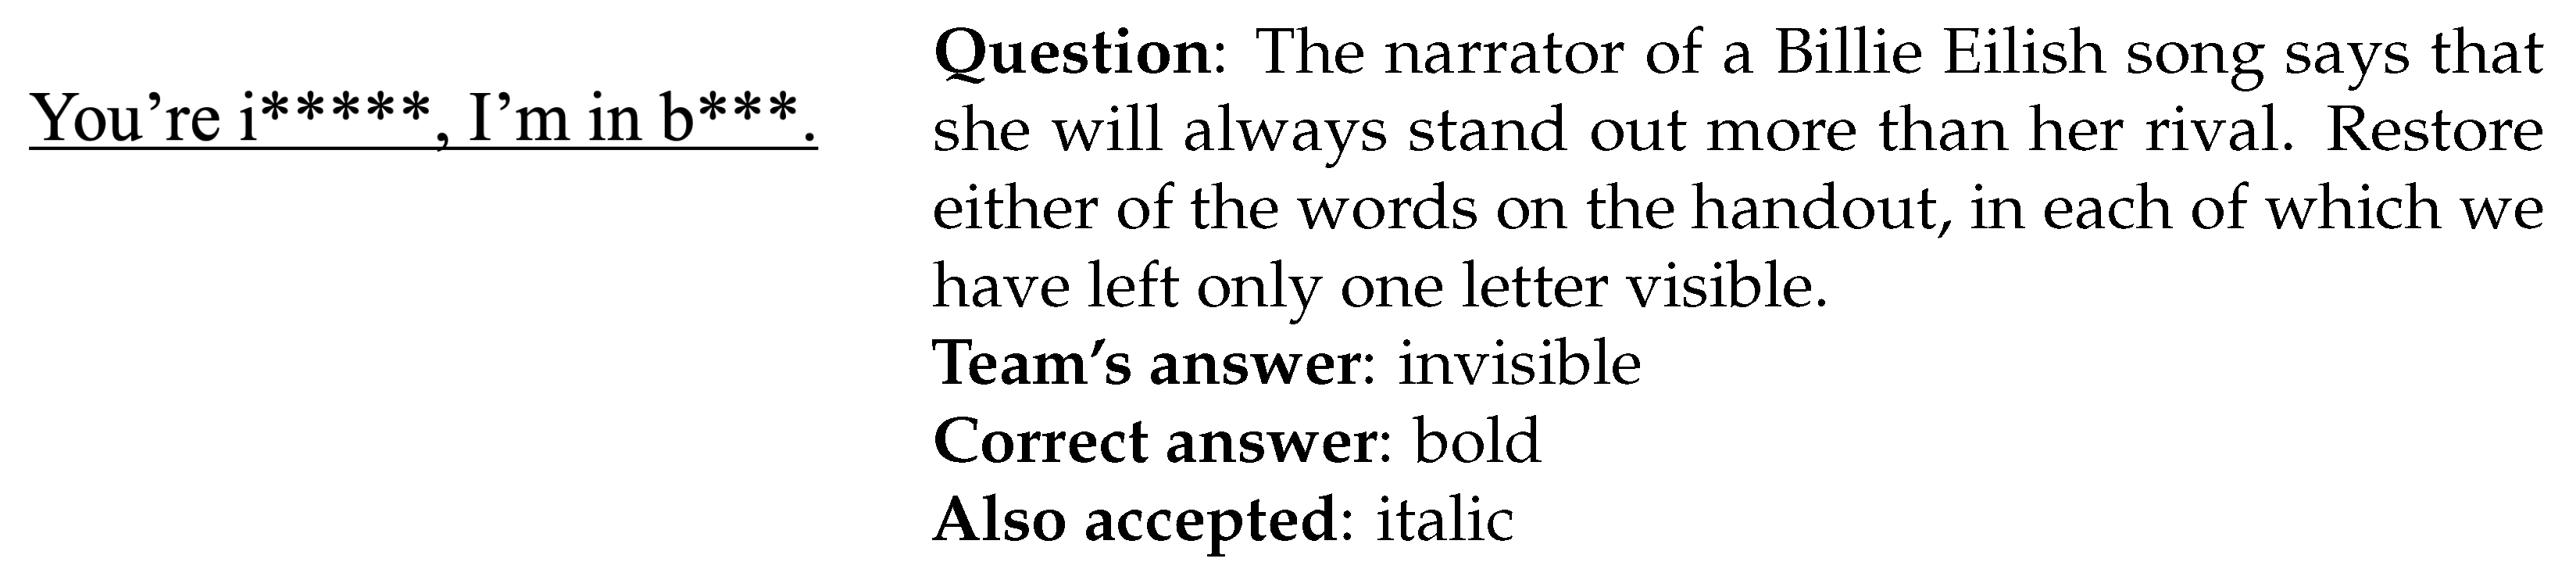
Answer-format violations: This category concerns the MLLM team’s failure to satisfy strict constraints on the required answer form. A question may ask for, for example, two words beginning with the same letter, a compound word containing two roots, or a word of Latin origin. Similar constraints arise in questions with visual materials where a specified number of asterisks must be replaced with letters. In many cases, the team arrives at the correct line of reasoning but produces a final answer that violates the stated format requirement. An example is shown in
Figure 13: the team submitted an answer with an incorrect number of letters.
Figure 13.
Example of a team response exhibiting an answer-format violation. Asterisks represent omitted letters, with each asterisk replacing one letter; one letter in each word remains visible in the original handout.
Figure 13.
Example of a team response exhibiting an answer-format violation. Asterisks represent omitted letters, with each asterisk replacing one letter; one letter in each word remains visible in the original handout.
It should be noted that these error types rarely occur in isolation. Incorrect team responses more often involve a combination of errors. For example, misinterpreting an image may subsequently lead to factual distortions.
5.6. Implications for Theory and Practice
The findings motivate evaluating collaboration through changes in correct-candidate availability and support, alongside final accuracy. From a theoretical perspective, candidate generation, preservation during interaction, and final selection should be treated as distinct components of collaborative performance. Tracking these components can help distinguish a failure to generate a correct hypothesis from its loss during discussion or a failure to select it at aggregation. This distinction also clarifies why agreement should be interpreted together with correctness: convergence may reinforce either correct hypotheses or shared errors.
From a practical perspective, collaboration should be assessed against strong single-model baselines as well as its constituent models. The best team configuration in the main six-strategy comparison achieved 31.20% accuracy, outperforming all six constituent models but remaining 4.27 p.p. below the GPT-5.5 single-model reference (35.47%). This comparison shows that gains over constituent models alone are insufficient to establish a practical advantage over a stronger single model with a simpler inference workflow. Deployment decisions should therefore consider accuracy together with model availability, resource requirements, and operational constraints.
For system design, the observed loss of correct candidates during discussion motivates testing mechanisms that preserve access to earlier candidate sets during final aggregation. The error analysis additionally motivates checking candidate answers against question-relevant visual evidence and explicit answer-format constraints. The effectiveness and resource requirements of these proposed mechanisms remain to be established through controlled evaluation, both on MChGK and in other task settings.
6. Conclusions
This study introduced a unified framework for the systematic design and evaluation of MLLM teams, comprising a nine-dimensional design space and a generic seven-stage reasoning pipeline. Six team strategies derived from this framework were evaluated using matched configurations, enabling systematic comparisons of aggregation, rationale sharing, and additional interaction.
We also constructed, annotated, and publicly released the MChGK dataset, consisting of 1170 Russian-language multimodal What? Where? When? questions. The dataset includes topic and image-type annotations, as well as human success rates for 1046 questions, enabling analyses across question characteristics and comparisons with human teams. The principal empirical findings are summarized below in relation to the research questions.
Regarding RQ1, every evaluated team configuration outperformed the corresponding single-model baseline for all six captains. Talkative Debate was consistently the strongest strategy, improving upon the respective individual models by 9.40–20.00 p.p. Its best configuration, with Gemma 4 as captain, achieved 31.20% accuracy and substantially reduced the gap to the stronger GPT-5.5 single-model reference.
With respect to RQ2, rationale sharing produced the strongest and most consistent gains. Captain-based aggregation was generally more effective than majority voting, although its benefit depended on the captain. An additional interaction round was useful when models exchanged rationales, whereas answer-only discussion had no consistent effect and could reduce accuracy. Further rounds showed sharply diminishing returns.
The comparison with human teams (RQ3) showed that, on the matched subset of 1046 questions, the best MLLM team achieved 31.36% accuracy, compared with a mean human success rate of 45.58%. Its point estimate was lower for every topic and image type, although the gap varied considerably. The team was relatively closer to humans in Sports, Technology, Games and Puzzles, and Culture and Everyday Life, while larger deficits were observed in several humanities- and arts-related categories. It also performed comparatively better on plain-text images than on pictorial and visual-text images, suggesting that complex visual interpretation remains an important weakness.
The analysis of team behavior (RQ4) showed that the captain acted as a selective aggregator rather than simply following the modal answer or retaining its own initial response. Talkative Debate increased agreement around correct hypotheses and could introduce correct answers that were absent from the initial candidate set. When a correct answer was available after discussion, the captain usually identified it; however, when all post-discussion candidates were incorrect, the captain was rarely able to independently construct the correct answer. The gains from debate therefore arose primarily from improving the quality and support of the candidate-answer set before final aggregation.
Several limitations of our study should be considered. First, the evaluation was restricted to a single Russian-language dataset from a specific quiz tradition, whose linguistic, cultural, and answer-format characteristics may limit generalization to other languages and multimodal reasoning tasks. Second, the experiments covered six MLLMs under fixed prompts, deterministic decoding, predefined team compositions, and a limited set of collaboration strategies; different models and protocols may produce different results. Third, the comparison with humans relied on historical aggregate success rates rather than on a controlled experiment in which human and MLLM teams operated under identical conditions.
Overall, within the evaluated configurations on MChGK, the results highlight the importance of enabling models to share, compare, and revise their rationales, beyond simply generating more candidate answers. Rationale-aware captain aggregation and a limited number of discussion rounds provided substantial accuracy improvements, whereas repeated answer-only interaction offered little consistent benefit. Collaboration nevertheless remained vulnerable to shared knowledge gaps, image misinterpretation, overlooked implicit clues, incorrect reasoning, and answer-format violations. Future work can use the proposed design space and reasoning pipeline to develop and systematically compare stronger candidate-generation and verification mechanisms, specialized team roles, and adaptive interaction and stopping policies, as well as to extend evaluation to multilingual datasets and other open-ended multimodal reasoning tasks. More broadly, its combination of multimodal inputs, open-ended answers, indirect clues, broad knowledge requirements, and substantial remaining difficulty for current models makes MChGK a challenging benchmark for evaluating future MLLMs and collaborative inference methods.
Author Contributions
Conceptualization, E.K.; methodology, E.K.; software, A.K.; validation, V.B. and M.D.; investigation, M.D.; resources, A.K.; data curation, A.K.; writing—original draft preparation, A.K. and V.B.; writing—review and editing, M.D. and E.K.; visualization, V.B.; supervision, E.K.; project administration, E.K. All authors have read and agreed to the published version of the manuscript.
Funding
This research received no external funding.
Data Availability Statement
Acknowledgments
During the preparation of this manuscript, the authors used ChatGPT 5.5 for limited assistance with drafting and refining code and for language proofreading. The research questions, methodology, experimental design, data analysis, interpretation of the results, and scientific conclusions were developed independently by the authors. All AI-assisted outputs were reviewed, verified, and edited by the authors, who take full responsibility for the content of this publication.
Conflicts of Interest
The authors declare no conflicts of interest.
Abbreviations
The following abbreviations are used in this manuscript:
| LLM | Large Language Model |
| MLLM | Multimodal Large Language Model |
| MChGK | Multimodal Chto? Gde? Kogda? (English: Multimodal What? Where? When?) |
Appendix A. Prompt Development Set
To develop and refine the prompts used in this study, we constructed a separate development set that was excluded from all subsequent experiments.
Candidate questions were selected from those published in 2025 for which a human success rate was available, yielding 74 eligible questions. The questions were sorted by human success rate and divided into three approximately equal-sized groups representing relatively difficult, medium-difficulty, and easy questions. Within each group, the questions were sorted by length and divided into three approximately equal-sized subsets corresponding to short, medium-length, and long questions. One question was randomly selected from each subset, resulting in nine questions covering all combinations of difficulty and question length.
The selected questions were used exclusively for prompt development and were excluded from the final evaluation dataset. The question identifiers are provided in the repository.
Appendix B. Dataset Year Distribution
Figure A1 presents the distribution of questions in the evaluation dataset by publication year. Most questions originate from the 2020–2023 period, with 2021 contributing the largest number of questions (312). The earliest questions in the dataset date from 2018, while only two questions from 2026 were available at the time of data collection.
Figure A1.
Distribution of evaluation questions by publication year.
Figure A1.
Distribution of evaluation questions by publication year.
Appendix C. Human Success Rate Distribution
A human success rate is available for 1046 questions, corresponding to 89.4% of the evaluation dataset. It records the percentage of participating human teams that answered a question correctly and provides an empirical indicator of its difficulty for human players.
Figure A2 shows the distribution of the available human success rates. The questions cover a broad range of human difficulty, from those solved by only a small proportion of teams to those answered correctly by nearly all participating teams.
Figure A2.
Distribution of human success rates for the 1046 questions with available human performance data. The mean success rate is 45.58%, the median is 43.41%, and the observed range is 1.14–100.00%.
Figure A2.
Distribution of human success rates for the 1046 questions with available human performance data. The mean success rate is 45.58%, the median is 43.41%, and the observed range is 1.14–100.00%.
Appendix D. Topic Annotation Procedure and Distribution
Topic labels were constructed using a multi-stage LLM-assisted clustering procedure. This design follows the broader line of work in which LLMs are used to guide text clustering based on semantic relations and the desired level of cluster granularity [
22]. In contrast to fully unsupervised clustering over fixed vector representations, this approach provides greater control over the grouping criteria and category granularity.
In the first stage, Gemini 2.5 Flash was provided with each question and asked to assign between one and three descriptive topic labels. This produced 872 distinct candidate labels across the dataset. The purpose of this stage was to retain relatively fine-grained semantic information without requiring the model to select from a predefined taxonomy.
In the second stage, the candidate labels were supplied to Gemini 2.5 Flash and grouped into 20 broader categories. The model was instructed to merge labels that referred to closely related subject areas while preserving distinctions that were meaningful for the analysis of question content. The proposed category names and their constituent labels were manually reviewed to identify semantically inconsistent assignments, excessive overlap, and differences in category granularity.
In the third stage, Gemini 2.5 Flash assigned exactly one of the 20 categories to each question. The assignment was based on the complete question text and its reference answer rather than on the initially generated labels alone. Requiring a single label provided a mutually exclusive categorization suitable for category-wise evaluation.
Finally, categories with relatively few examples or substantial semantic overlap were manually merged. This produced the final taxonomy of 13 mutually exclusive topic categories. Human validation was conducted after each stage of the pipeline, including inspection of the generated candidate labels, the proposed clustering, and the final question-level assignments.
Figure A3 presents the resulting topic distribution. The largest categories are Linguistics (175 questions), Literature (167), and History, Society, and Government (141). Nevertheless, no individual category accounts for more than 15% of the evaluation dataset, indicating that the benchmark covers a broad range of subject areas.
Figure A3.
Distribution of the 1170 evaluation questions across the 13 final topic categories. Each question was assigned exactly one topic label.
Figure A3.
Distribution of the 1170 evaluation questions across the 13 final topic categories. Each question was assigned exactly one topic label.
Appendix E. Image-Type Annotation Procedure
Each question image was assigned to one of three categories according to the form in which question-relevant information is presented.
Plain-text image (
Figure 5a): the image contains only text, and all information relevant to answering the question is preserved if the text is transcribed as plain text.
Visual-text image (
Figure 5b): the image is primarily textual, but its visual presentation (e.g., layout, typography, spacing, orientation, highlighting, masking, or arrangement of text) conveys information that is relevant to answering the question.
Pictorial image (
Figure 5c): the image contains non-textual visual content, such as photographs, drawings, maps, diagrams, symbols, or other graphical objects that provide information required to answer the question.
A subset of 278 images (23.8% of the dataset) was manually annotated to establish the annotation scheme and evaluate automatic classification. Gemini 2.5 Flash was then used to classify the remaining 892 images. On the validation subset, the model achieved a precision above 0.99 for both the
Plain-text image and
Pictorial image classes, with classification errors concentrated almost exclusively in the
Visual-text image class. Consequently, all images assigned to the
Visual-text image class were manually reviewed, while the remaining predictions were accepted without further correction. The final distribution of image types is summarized in
Table 2.
Appendix F. Inference Prompts for Individual and Team Strategies
All operational prompts were written in Russian and used without model-specific modifications. English translations are provided below.
The independent-generation prompt was used to obtain the initial answer and rationale from each model. The resulting outputs were used for individual-model evaluation and as the first-round responses in the team strategies. Majority Voting required no additional model call. Silent Team and Talkative Team used the common captain prompt presented below. In the combined template, bold text indicates content included only in the Talkative Team prompt; this emphasis was added for presentation and was not part of the operational prompt.
Appendix F.1. Independent Answer Generation Prompt
Appendix F.2. Captain Aggregation Prompt
The regular text constitutes the Silent Team prompt. The bold text was additionally included for Talkative Team, in which the captain received both candidate answers and the corresponding rationales.
Appendix F.3. Adaptive Strategy and Debate Rounds
In the Adaptive Strategy, the high-diversity branch used the Talkative Team version of the captain prompt, whereas the low-diversity branch applied majority voting without an additional model call.
Silent Debate and Talkative Debate reused the corresponding Silent Team and Talkative Team versions of the captain prompt in an additional round. The answer placeholders were populated with the captain-generated answers obtained in the preceding round. In Talkative Debate, the rationale placeholders were additionally populated with the corresponding captain-generated rationales.
Appendix G. LLM Judge Selection and Evaluation Prompt
The LLM judges were selected using a previously constructed gold-standard set of 260 model answers from our text-only ChGK study [
15]. The set contained 52 answers produced by each of five open models: Gemma-3-27B-it, QwQ-32B, Phi-4, Llama-4-Scout-17B-16E, and Qwen3-32B. Two human annotators evaluated the answers independently and reconciled the small number of disagreements, producing a fully agreed set of binary correctness labels. Because only 10% of the answers were correct, candidate judges were assessed using both raw accuracy and Krippendorff’s
.
Table A1 reports the performance of Gemini-2.5-Flash and DeepSeek-V4-Flash, which were selected for the main evaluation, together with several comparison models. All models were evaluated on the 260-answer gold-standard set. For the two selected judges, the table additionally reports results on an auxiliary validation set constructed from the present multimodal dataset. This set comprised 1170 answers generated by a single MLLM (Gemma 4), one for each evaluation question, and subsequently assigned binary correctness labels through manual review. Because it represents the output of only one model, the auxiliary set was used as a robustness check rather than as the primary basis for judge selection.
Table A1.
Performance of the selected LLM judges and additional comparison models on the gold-standard set. The selected judges are shown in bold. Results on the auxiliary validation set are reported only for the selected judges.
Table A1.
Performance of the selected LLM judges and additional comparison models on the gold-standard set. The selected judges are shown in bold. Results on the auxiliary validation set are reported only for the selected judges.
| Judge Model | Gold-Standard Set () | Auxiliary Set () |
|---|
| | Accuracy | Krippendorff’s | Accuracy |
|---|
| GPT-5.5 | 100.00% | 1.0000 | – |
| Gemini-2.5-Flash | 98.85% | 0.9349 | 95.81% |
| Gemini-3.5-Flash | 98.46% | 0.9201 | – |
| DeepSeek-V4-Flash | 98.46% | 0.9117 | 96.24% |
| Claude-Sonnet-4 | 98.08% | 0.8985 | – |
| Gemini-3.1-Flash-Lite | 97.69% | 0.8720 | – |
| GPT-5.4-Mini | 96.92% | 0.8018 | – |
| Grok-4.1-Fast | 96.92% | 0.8018 | – |
| GPT-5.4-Nano | 94.62% | 0.6033 | – |
| Claude-3.5-Haiku | 85.39% | 0.5359 | – |
The final choice balanced agreement with human annotations, evaluation cost, and reduced reliance on a single developer or model family. GPT-5.5 was evaluated as a candidate judge and served as a high-performance reference, achieving perfect agreement on the gold-standard set. However, its estimated API cost for the full evaluation workload was more than an order of magnitude higher than that of either selected judge. Gemini-2.5-Flash and DeepSeek-V4-Flash provided substantially more economical alternatives while retaining strong agreement with the human labels. Their development by different organizations also reduced dependence on the systematic judgments of a single model family.
During the main evaluation, each unresolved answer was assessed independently by both selected judges. Their label was accepted when they agreed; disagreements were resolved through human adjudication.
The same evaluation prompt was used for both judges. The operational prompt was written in Russian; an English translation is provided below.
References
- Yao, H.; Huang, J.; Qiu, Y.; Chen, M.K.; Liu, W.; Zhang, W.; Zeng, W.; Zhang, X.; Zhang, J.; Song, Y.; et al. MMReason: An Open-Ended Multi-Modal Multi-Step Reasoning Benchmark for MLLMs Toward AGI. In Proceedings of the IEEE/CVF International Conference on Computer Vision; IEEE: New York, NY, USA, 2025; pp. 273–283. [Google Scholar] [CrossRef] [Scilit]
- Foster, E.J.; Friedlander, K.J.; Fine, P.A. Mastermind and Expert Mind: A Qualitative Study of Elite Quizzers. J. Expert. 2025, 8, 38–71. [Google Scholar]
- Ai, R.; Pan, Y.; Simchi-Levi, D.; Tambe, M.; Xu, H. Beyond Majority Voting: LLM Aggregation by Leveraging Higher-Order Information. arXiv 2026, arXiv:2510.01499. [Google Scholar] [CrossRef] [Scilit]
- Kaesberg, L.B.; Becker, J.; Wahle, J.P.; Ruas, T.; Gipp, B. Voting or Consensus? Decision-Making in Multi-Agent Debate. In Proceedings of the Findings of the Association for Computational Linguistics: ACL 2025, Vienna, Austria, 27 July–1 August 2025; Che, W., Nabende, J., Shutova, E., Pilehvar, M.T., Eds.; ACL: Kerrville, TX, USA, 2025; pp. 11640–11671. [Google Scholar] [CrossRef] [Scilit]
- Anvekar, T.; Rajput, K.S.; Baral, C.; Gupta, V. Rethinking Information Synthesis in Multimodal Question Answering A Multi-Agent Perspective. In Proceedings of the 14th International Joint Conference on Natural Language Processing and the 4th Conference of the Asia-Pacific Chapter of the Association for Computational Linguistics, Mumbai, India, 20–24 December 2025; Inui, K., Sakti, S., Wang, H., Wong, D.F., Bhattacharyya, P., Banerjee, B., Ekbal, A., Chakraborty, T., Singh, D.P., Eds.; ACL: Stroudsburg, PA, USA, 2025; pp. 3674–3686. [Google Scholar] [CrossRef] [Scilit]
- Yi, Z.; Liu, J.; Albert, M.V.; Xiao, T. A Multi-Agent System for Complex Reasoning in Radiology Visual Question Answering. In Proceedings of the 2025 ACM/IEEE Joint Conference on Digital Libraries (JCDL); IEEE: New York, NY, USA, 2025; pp. 139–147. [Google Scholar] [CrossRef] [Scilit]
- Cohen, S.; Inger, N.C.; Goldshlager, N.; Shapira, B.; Rokach, L. DFPE: A Diverse Fingerprint Ensemble for Enhancing LLM Performance. In Proceedings of the Findings of the Association for Computational Linguistics: EACL 2026, Rabat, Morocco, 24–29 March 2026; Demberg, V., Inui, K., Marquez, L., Eds.; ACL: Stroudsburg, PA, USA, 2026; pp. 5326–5336. [Google Scholar] [CrossRef] [Scilit]
- Agrawal, A.; Aralikatti, R.; Satheesh, A.; Chakraborty, S.; Bedi, A.S.; Huang, F. Uncertainty-Aware Answer Selection for Improved Reasoning in Multi-LLM Systems. In Proceedings of the Findings of the Association for Computational Linguistics: EMNLP 2025, Suzhou, China, 4–9 November 2025; Christodoulopoulos, C., Chakraborty, T., Rose, C., Peng, V., Eds.; ACL: Stroudsburg, PA, USA, 2025; pp. 25090–25098. [Google Scholar] [CrossRef] [Scilit]
- Chen, J.; Xun, Z.; Zhou, B.; Qi, H.; Zhang, H.; Zhang, Q.; Chen, Y.; Hu, W.; Qu, Y.; Hu, S. Do We Truly Need So Many Samples? Multi-LLM Repeated Sampling Efficiently Scales Test-Time Compute. In Proceedings of the AAAI Conference on Artificial Intelligence; AAAI Press: Washington, DC, USA, 2026; Volume 40, pp. 20083–20091. [Google Scholar] [CrossRef] [Scilit]
- Pitre, P.; Ramakrishnan, N.; Wang, X. CONSENSAGENT: Towards Efficient and Effective Consensus in Multi-Agent LLM Interactions Through Sycophancy Mitigation. In Proceedings of the Findings of the Association for Computational Linguistics: ACL 2025, Vienna, Austria, 27 July–1 August 2025; Che, W., Nabende, J., Shutova, E., Pilehvar, M.T., Eds.; ACL: Kerrville, TX, USA, 2025; pp. 22112–22133. [Google Scholar] [CrossRef] [Scilit]
- Choi, H.K.; Zhu, J.; Li, S. When Identity Skews Debate: Anonymization for Bias-Reduced Multi-Agent Reasoning. In Proceedings of the 64th Annual Meeting of the Association for Computational Linguistics (Volume 1: Long Papers), San Diego, CA,
USA, 2–7 July 2026; Liakata, M., Moreira, V.P., Zhang, J., Jurgens, D., Eds.; ACL: Stroudsburg, PA, USA, 2026; pp. 14284–14311. [Google Scholar] [CrossRef] [Scilit]
- Cui, Y.; Fu, H.; Zhang, H.; Wang, L.; Zuo, C. Free-MAD: Consensus-Free Multi-Agent Debate. In Proceedings of the Findings of the Association for Computational Linguistics: ACL 2026, San Diego, CA, USA, 2–7 July 2026; Liakata, M., Moreira, V.P., Zhang, J., Jurgens, D., Eds.; ACL: Stroudsburg, PA, USA, 2026; pp. 31977–31997. [Google Scholar] [CrossRef] [Scilit]
- Gu, W.; Wang, H.; Han, J.; Li, X.; Wu, Z.; Xiao, H.; Cheng, B. Analyze-compose-execute: A dynamic dialogue framework for multi-agent debate. In Proceedings of the Fortieth AAAI Conference on Artificial Intelligence and Thirty-Eighth Conference on Innovative Applications of Artificial Intelligence and Sixteenth Symposium on Educational Advances in Artificial Intelligence; AAAI’26/IAAI’26/EAAI’26; AAAI Press: Washington, DC, USA, 2026; Volume 40, pp. 30825–30833. [Google Scholar] [CrossRef] [Scilit]
- Zhu, X.; Zhang, C.; Chi, Y.; Stafford, T.; Collier, N.; Vlachos, A. Demystifying Multi-Agent Debate: The Role of Confidence and Diversity. In Proceedings of the Findings of the Association for Computational Linguistics: ACL 2026, San Diego, CA, USA, 2–7 July 2026; Liakata, M., Moreira, V.P., Zhang, J., Jurgens, D., Eds.; ACL: Stroudsburg, PA, USA, 2026; pp. 33909–33930. [Google Scholar] [CrossRef] [Scilit]
- Kuznetsova, A.V.; Byzov, V.A.; Aslanov, I.V.; Kotelnikov, E.V. Do Open Large Language Models Know What, Where, and When? A Case Study with Quiz-Style Questions. Supercomput. Front. Innov. 2025, 12, 90–107. [Google Scholar] [CrossRef] [Scilit]
- Kotelnikova, A.V.; Byzov, V.A.; Dolzhenkova, M.L.; Kotelnikov, E.V. Can LLM Teams Play What? Where? When? In Proceedings of the Computational Linguistics and Intellectual Technologies: Proceedings of the International Conference “Dialogue 2026”, Moscow, Russia, 24–26 June 2026; Max Press: Moscow, Russia, 2026; pp. 282–293. [Google Scholar] [CrossRef] [Scilit]
- Talmor, A.; Yoran, O.; Catav, A.; Lahav, D.; Wang, Y.; Asai, A.; Ilharco, G.; Hajishirzi, H.; Berant, J. MultiModalQA: Complex question answering over text, tables and images. In Proceedings of the International Conference on Learning Representations, Virtual, 3–7 May 2021; OpenReview.net: Newton Highlands, MA, USA, 2021. [Google Scholar]
- Hannan, D.; Jain, A.; Bansal, M. ManyModalQA: Modality Disambiguation and QA over Diverse Inputs. In Proceedings of the AAAI Conference on Artificial Intelligence, New York, NY, USA, 7–12 February 2020; AAAI Press: Washington, DC, USA, 2020; Volume 34, pp. 7879–7886. [Google Scholar] [CrossRef] [Scilit]
- Hu, W.; Gu, J.C.; Dou, Z.Y.; Fayyaz, M.; Lu, P.; Chang, K.W.; Peng, N.V. MRAG-Bench: Vision-Centric Evaluation for Retrieval-Augmented Multimodal Models. In Proceedings of the International Conference on Learning Representations; Yue, Y., Garg, A., Peng, N., Sha, F., Yu, R., Eds.; ICLR (International Conference on Learning Representations): Appleton, WI, USA, 2025; Volume 2025, pp. 95558–95581. [Google Scholar]
- Song, S.; Park, M.; Kim, G. MAVIS: A Benchmark for Multimodal Source Attribution in Long-form Visual Question Answering. In Proceedings of the AAAI Conference on Artificial Intelligence; AAAI Press: Washington, DC, USA, 2026; Volume 40, pp. 33028–33037. [Google Scholar] [CrossRef] [Scilit]
- Chervyakov, A.; Isaeva, U.; Emelyanov, A.; Safin, A.; Tikhonova, M.; Kharitonov, A.; Lyakh, Y.; Surovtsev, P.; Shevelev, D.; Saburov, V.; et al. Multimodal Evaluation of Russian-language Architectures. In Proceedings of the 19th Conference of the European Chapter of the Association for Computational Linguistics (Volume 1: Long Papers), Rabat, Morocco, 24–29 March 2026; Demberg, V., Inui, K., Marquez, L., Eds.; ACL: Kerrville, TX, USA, 2026; pp. 2114–2161. [Google Scholar] [CrossRef] [Scilit]
- Zhang, Y.; Wang, Z.; Shang, J. ClusterLLM: Large Language Models as a Guide for Text Clustering. In Proceedings of the 2023 Conference on Empirical Methods in Natural Language Processing, Singapore, 6–10 December 2023; ACL: Stroudsburg, PA, USA, 2023; pp. 13903–13920. [Google Scholar] [CrossRef] [Scilit]
- Moonshot AI. Kimi K2.5: Open Visual Agentic Intelligence. 2026. Available online: https://github.com/MoonshotAI/Kimi-K2.5 (accessed on 7 August 2026).
- ByteDance Seed. Seed 2.0 Official Launch. 2026. Available online: https://seed.bytedance.com/en/blog/seed-2-0-official-launch (accessed on 7 August 2026).
- Qwen Team. Qwen3.5: Towards Native Multimodal Agents. 2026. Available online: https://qwen.ai/blog?id=qwen3.5 (accessed on 7 August 2026).
- Mistral AI. Ministral 3 14B Instruct 2512. 2025. Available online: https://huggingface.co/mistralai/Ministral-3-14B-Instruct-2512 (accessed on 1 August 2026).
- Xiaomi MiMo Team. Xiaomi MiMo-V2-Omni: Omni-Modal Agentic Foundation Model That Sees, Understands and Acts. 2026. Available online: https://mimo.mi.com/docs/en-US/news/previous-news/v2-omni-release (accessed on 1 August 2026).
- Google DeepMind. Gemma 4 Model Card. 2026. Available online: https://ai.google.dev/gemma/docs/core/model_card_4 (accessed on 1 August 2026).
- Google. Gemma Releases. 2026. Available online: https://ai.google.dev/gemma/docs/releases (accessed on 1 August 2026).
- Google. Gemini 2.5 Flash. 2025. Available online: https://ai.google.dev/gemini-api/docs/models/gemini-2.5-flash (accessed on 1 August 2026).
- DeepSeek. DeepSeek-V4-Flash. 2026. Available online: https://api-docs.deepseek.com/quick_start/pricing/ (accessed on 1 August 2026).
Figure 1.
A motivating example of team-based inference for multimodal question answering. (a) Input: a textual quiz question and its accompanying image. The same question and image are provided to all models in both the individual and collaborative settings. (b) Individual responses: all six MLLMs produce incorrect answers when queried independently. (c) Collaborative response: the MLLM team shares and revises candidate answers and their rationales, enabling Gemma 4 as captain to produce the correct final answer, school bus.
Figure 1.
A motivating example of team-based inference for multimodal question answering. (a) Input: a textual quiz question and its accompanying image. The same question and image are provided to all models in both the individual and collaborative settings. (b) Individual responses: all six MLLMs produce incorrect answers when queried independently. (c) Collaborative response: the MLLM team shares and revises candidate answers and their rationales, enabling Gemma 4 as captain to produce the correct final answer, school bus.
Figure 2.
Proposed design space for LLM team strategies, comprising nine dimensions and their associated design choices.
Figure 2.
Proposed design space for LLM team strategies, comprising nine dimensions and their associated design choices.
Figure 3.
Generic multi-agent reasoning pipeline for LLM teams. Colored badges indicate all design dimensions involved in each stage. The primary dimension is indicated by both the stage background color and a contrasting outline around the corresponding badge (P0–D1, P1–D2, P2–D4, P3–D5, P4–D7, P5–D8, P6–D9). Arrows indicate transitions between stages; backward arrows represent iterative returns for further candidate generation or information exchange.
Figure 3.
Generic multi-agent reasoning pipeline for LLM teams. Colored badges indicate all design dimensions involved in each stage. The primary dimension is indicated by both the stage background color and a contrasting outline around the corresponding badge (P0–D1, P1–D2, P2–D4, P3–D5, P4–D7, P5–D8, P6–D9). Arrows indicate transitions between stages; backward arrows represent iterative returns for further candidate generation or information exchange.
Figure 4.
Instantiation of the generic reasoning pipeline by the six evaluated LLM team strategies. Stages P0 and P1 are identical across all strategies and are therefore omitted. The second P2 column represents an optional additional candidate-generation round; strategies marked as having no second round proceed directly to final aggregation.
Figure 4.
Instantiation of the generic reasoning pipeline by the six evaluated LLM team strategies. Stages P0 and P1 are identical across all strategies and are therefore omitted. The second P2 column represents an optional additional candidate-generation round; strategies marked as having no second round proceed directly to final aggregation.
Figure 5.
Representative examples of the three image types used in the dataset: (a) plain-text image, (b) visual-text image, and (c) pictorial image.
Figure 5.
Representative examples of the three image types used in the dataset: (a) plain-text image, (b) visual-text image, and (c) pictorial image.
Figure 6.
Performance of the best-performing MLLM team and human teams across question topics. Both estimates were calculated on the same 1046 questions for which human success rates were available. The left panel shows the accuracy of Talkative Debate with Gemma 4 as captain and the human success rate; dotted vertical lines indicate the corresponding overall results. The right panel shows the difference between MLLM and human performance in percentage points (p.p.), with negative values indicating lower MLLM performance. Error bars denote 95% confidence intervals obtained using paired bootstrap resampling of questions within each topic with 10,000 resamples.
Figure 6.
Performance of the best-performing MLLM team and human teams across question topics. Both estimates were calculated on the same 1046 questions for which human success rates were available. The left panel shows the accuracy of Talkative Debate with Gemma 4 as captain and the human success rate; dotted vertical lines indicate the corresponding overall results. The right panel shows the difference between MLLM and human performance in percentage points (p.p.), with negative values indicating lower MLLM performance. Error bars denote 95% confidence intervals obtained using paired bootstrap resampling of questions within each topic with 10,000 resamples.
Figure 7.
Performance of the best-performing MLLM team and human teams across image types. Both estimates were calculated on the same 1046 questions for which human success rates were available. The left panel shows the accuracy of Talkative Debate with Gemma 4 as captain and the mean human success rate; dotted vertical lines indicate the corresponding overall results. The right panel shows the difference between MLLM and human performance in percentage points (p.p.), with negative values indicating lower MLLM performance. Error bars denote 95% confidence intervals obtained using paired bootstrap resampling of questions within each image type with 10,000 resamples.
Figure 7.
Performance of the best-performing MLLM team and human teams across image types. Both estimates were calculated on the same 1046 questions for which human success rates were available. The left panel shows the accuracy of Talkative Debate with Gemma 4 as captain and the mean human success rate; dotted vertical lines indicate the corresponding overall results. The right panel shows the difference between MLLM and human performance in percentage points (p.p.), with negative values indicating lower MLLM performance. Error bars denote 95% confidence intervals obtained using paired bootstrap resampling of questions within each image type with 10,000 resamples.
Figure 8.
Accuracy of the Gemma 4-based configuration as a function of the number of discussion rounds. Round 0 corresponds to the single-model baseline, round 1 to Talkative Team, round 2 to Talkative Debate, and round 3 to Talkative Debate with an additional discussion round.
Figure 8.
Accuracy of the Gemma 4-based configuration as a function of the number of discussion rounds. Round 0 corresponds to the single-model baseline, round 1 to Talkative Team, round 2 to Talkative Debate, and round 3 to Talkative Debate with an additional discussion round.
Table 1.
Summary statistics of the evaluation dataset.
Table 1.
Summary statistics of the evaluation dataset.
| Characteristic | Value |
|---|
| Evaluation dataset size | 1170 questions |
| Coverage period | 2018–2026 |
| Questions with human success rates | 1046 (89.4%) |
| Topic annotations | 13 categories |
| Image-type annotations | 3 categories |
| Question length (avg., range) | 29.8 (3–128) words |
| Answer length (avg., range) | 2.4 (1–46) words |
Table 2.
Distribution of image types in the evaluation dataset.
Table 2.
Distribution of image types in the evaluation dataset.
| Image Type | Count | Share |
|---|
| Plain-text image | 652 | 55.7% |
| Visual-text image | 78 | 6.7% |
| Pictorial image | 440 | 37.6% |
Table 3.
Accuracy (%) of the evaluated team strategies across all tested captain models. The single-model configuration provides the corresponding non-team baseline. Boldface indicates the highest score in each column. The bottom row reports the mean accuracy across all evaluated models for each strategy.
Table 3.
Accuracy (%) of the evaluated team strategies across all tested captain models. The single-model configuration provides the corresponding non-team baseline. Boldface indicates the highest score in each column. The bottom row reports the mean accuracy across all evaluated models for each strategy.
| Model | SingleModel | MajorityVoting | SilentTeam | TalkativeTeam | AdaptiveStrategy | SilentDebate | TalkativeDebate |
|---|
| Kimi-K2.5 | 17.61 | 18.03 | 21.11 | 26.24 | 23.93 | 21.11 | 27.01 |
| Seed-2.0 | 12.22 | 16.32 | 21.28 | 28.03 | 25.04 | 21.97 | 29.83 |
| Qwen3.5 | 17.69 | 18.46 | 22.22 | 27.01 | 24.70 | 23.25 | 29.40 |
| Ministral-3 | 4.79 | 15.38 | 12.65 | 19.91 | 19.23 | 10.00 | 24.44 |
| MiMo-V2 | 8.12 | 15.98 | 18.12 | 23.50 | 21.20 | 21.11 | 28.12 |
| Gemma 4 | 13.08 | 16.75 | 22.74 | 28.89 | 25.38 | 24.19 | 31.20 |
| Mean | 12.25 | 16.82 | 19.69 | 25.60 | 23.25 | 20.27 | 28.33 |
Table 4.
Pairwise differences in accuracy between the evaluated configurations, expressed in percentage points and calculated as the first configuration named in each row minus the second. Superscripts indicate significance according to two-sided exact McNemar tests with Holm-adjusted p-values, with the adjustment applied jointly across all 36 prespecified comparisons: * , ** , and *** . Mean differences are descriptive and were not tested separately.
Table 4.
Pairwise differences in accuracy between the evaluated configurations, expressed in percentage points and calculated as the first configuration named in each row minus the second. Superscripts indicate significance according to two-sided exact McNemar tests with Holm-adjusted p-values, with the adjustment applied jointly across all 36 prespecified comparisons: * , ** , and *** . Mean differences are descriptive and were not tested separately.
| Comparison | Kimi | Seed | Qwen | Ministral | MiMo | Gemma | Mean |
|---|
| Maj. Voting−Single Model | 0.43 | 4.10 *** | 0.77 | 10.60 *** | 7.86 *** | 3.68 *** | 4.57 |
| Silent Team−Maj. Voting | 3.08 ** | 4.96 *** | 3.76 *** | −2.74 | 2.14 | 5.98 *** | 2.86 |
| Talk. Team−Silent Team | 5.13 *** | 6.75 *** | 4.79 *** | 7.26 *** | 5.38 *** | 6.15 *** | 5.91 |
| Silent Debate−Silent Team | 0.00 | 0.68 | 1.03 | −2.65 * | 2.99 *** | 1.45 | 0.58 |
| Talk. Debate−Talk. Team | 0.77 | 1.79 | 2.39 ** | 4.53 *** | 4.62 *** | 2.31 ** | 2.74 |
| Talk. Debate−Silent Debate | 5.90 *** | 7.86 *** | 6.15 *** | 14.44 *** | 7.01 *** | 7.01 *** | 8.06 |
Table 5.
Inference resource usage and accuracy of team strategies with Gemma 4 as captain, alongside the single-model baseline. Token counts are mean per-question totals across all calls required to produce the final answer; input counts include image tokens. is the team size, and is the proportion of questions routed to captain aggregation in the Adaptive Strategy. Call counts exclude retries.
Table 5.
Inference resource usage and accuracy of team strategies with Gemma 4 as captain, alongside the single-model baseline. Token counts are mean per-question totals across all calls required to produce the final answer; input counts include image tokens. is the team size, and is the proportion of questions routed to captain aggregation in the Adaptive Strategy. Call counts exclude retries.
| Configuration | Calls Per
Question | Mean Tokens Per Question | Accuracy
(%) |
|---|
| Input | Output |
|---|
| Gemma 4 (single model) | 1 | 433 | 75 | 13.08 |
| Majority Voting | N | 4191 | 614 | 16.75 |
| Silent Team | | 4789 | 706 | 22.74 |
| Talkative Team | | 5281 | 704 | 28.89 |
| Adaptive Strategy | | 4691 | 688 | 25.38 |
| Silent Debate | | 9782 | 1414 | 24.19 |
| Talkative Debate | | 11,263 | 1451 | 31.20 |
Talkative Debate
+ additional round | | 17,068 | 2164 | 31.28 |
Table 6.
Answer-source decomposition for the best-performing team, with Gemma 4 serving as captain in captain-based strategies. Each final answer is assigned to one of four mutually exclusive categories relative to the six initial individual responses. The first subcolumn reports the number and share of questions, and the second reports conditional accuracy. Overall accuracy is the frequency-weighted average of the category-level accuracies.
Table 6.
Answer-source decomposition for the best-performing team, with Gemma 4 serving as captain in captain-based strategies. Each final answer is assigned to one of four mutually exclusive categories relative to the six initial individual responses. The first subcolumn reports the number and share of questions, and the second reports conditional accuracy. Overall accuracy is the frequency-weighted average of the category-level accuracies.
| | Majority Voting | Silent Team | Talkative Team | Talkative Debate |
|---|
| | (%)
| Acc. | (%)
| Acc. | (%)
| Acc. | (%)
| Acc. |
|---|
Modal initial
answer | 1170
(100.00%) | 16.75%
| 792
(67.69%) | 24.62%
| 668
(57.09%) | 31.44%
| 610
(52.14%) | 35.25%
|
Non-modal
captain answer | — | — | 133
(11.37%) | 12.78%
| 103
(8.80%) | 16.50%
| 92
(7.86%) | 19.57%
|
Non-modal
teammate answer | — | — | 195
(16.67%) | 23.59%
| 207
(17.69%) | 31.88%
| 210
(17.95%) | 30.95%
|
| Novel answer | — | — | 50
(4.27%) | 16.00%
| 192
(16.41%) | 23.44%
| 258
(22.05%) | 25.97%
|
| Overall | 1170
(100.00%) | 16.75%
| 1170
(100.00%) | 22.74%
| 1170
(100.00%) | 28.89%
| 1170
(100.00%) | 31.20%
|
Table 7.
Evolution of the candidate-answer set across the two rounds of Talkative Debate. Unique variants are defined using normalized answer clusters. Correct-candidate availability denotes questions for which at least one of the six team members produced a correct answer, while correct-answer support is the mean proportion of team members whose response was correct. Jaccard similarity and newly introduced variants compare the post-discussion responses with the initial response set.
Table 7.
Evolution of the candidate-answer set across the two rounds of Talkative Debate. Unique variants are defined using normalized answer clusters. Correct-candidate availability denotes questions for which at least one of the six team members produced a correct answer, while correct-answer support is the mean proportion of team members whose response was correct. Jaccard similarity and newly introduced variants compare the post-discussion responses with the initial response set.
| Round | Mean
Unique
Variants | Mean
Jaccard
Similarity | Mean Newly
Introduced
Variants | Questions with
a Correct Candidate,
n (%) | Mean Support for
Correct Answers
(%) |
|---|
| Initial responses | 4.04 | — | — | 375 (32.05%) | 12.25% |
| Post-discussion responses | 2.36 | 0.416 | 0.66 | 404 (34.53%) | 25.60% |
Table 8.
Final captain performance by transitions in correct-candidate availability during Talkative Debate. Transition categories indicate whether at least one correct candidate was present among the six initial and post-discussion responses. The last two columns report the number of successful cases, the number of questions in the transition category, and the corresponding percentage.
Table 8.
Final captain performance by transitions in correct-candidate availability during Talkative Debate. Transition categories indicate whether at least one correct candidate was present among the six initial and post-discussion responses. The last two columns report the number of successful cases, the number of questions in the transition category, and the corresponding percentage.
Correct-Candidate
Transition | Questions,
n (%) | Final Captain
Accuracy | Correct Round-2
Candidate Selected |
|---|
| Absent → Absent | 730 (62.39%) | 5 from 730 (0.68%) | — |
| Absent → Present | 65 (5.56%) | 56 from 65 (86.15%) | 56 from 65 (86.15%) |
| Present → Present | 339 (28.97%) | 304 from 339 (89.68%) | 303 from 339 (89.38%) |
| Present → Absent | 36 (3.08%) | 0 from 36 (0.00%) | — |
| Disclaimer/Publisher’s Note: The statements, opinions and data contained in all publications are solely those of the individual author(s) and contributor(s) and not of MDPI and/or the editor(s). MDPI and/or the editor(s) disclaim responsibility for any injury to people or property resulting from any ideas, methods, instructions or products referred to in the content. |