Article

Mosquito Swarm Algorithm-Based Energy Minimization in Wireless Sensor Networks
Intelligence, Data and Computing Team, Faculty of Sciences and Techniques, University Sultan Moulay Slimane, Beni Mellal 23000, Morocco
*
Author to whom correspondence should be addressed.
Computers 2026, 15(8), 521; https://doi.org/10.3390/computers15080521
Submission received: 24 April 2026 / Revised: 4 August 2026 / Accepted: 5 August 2026 / Published: 12 August 2026
(This article belongs to the Special Issue Wireless Sensor Networks in IoT)

Abstract

Wireless sensor networks (WSNs) are sophisticated monitoring systems that gather environmental data via wireless sensors. Numerous wireless sensors that have been placed to monitor and gather data on a particular environment make up these networks. Typically, a base station or central node wirelessly collects the data prior to analysis. As the battery in wireless sensors is both non-replaceable and non-rechargeable, it represents a key element. As a result, optimizing energy consumption in WSN has become a growing concern. One of the key challenges is consequently the creation of effective protocols for communication in WSNs. In this article, we provide a novel MSA (Mosquito Swarm Algorithm) technique for cluster formation and data routing. Simulations indicate that our proposed algorithm conserves the energy of the nodes and keeps them running for a greater number of survival rounds compared to LEACH (Low-Energy Adaptive Clustering Hierarchy) by a difference of 70.14%, PSO-R (Particle Swarm Optimization with routing) by a difference of 4.76%, and BA-R (Bat Algorithm with routing) by a difference of 2.52%. Our algorithm provides the highest throughput, surpassing LEACH by approximately 6.38%, PSO-R by almost 1%, and BA-R by 12.67%. Simulations indicate that our algorithm is highly effective at extending network longevity and increasing throughput, making it the preferred option to lower energy consumption in WSNs.

1. Introduction

Wireless sensor network (WSN) technologies have become crucial in the fields of smart agriculture, environmental monitoring and the Internet of Things. These systems consist of independent nodes that use protocols such as Bluetooth, Wi-Fi, or Zigbee to communicate, enabling the continuous collection of physical data across large areas [1]. The expansion of their use addresses a tangible need for real-time monitoring of natural and industrial events. However, these devices run on batteries with a limited lifespan, and replacing them is often difficult or even impossible. Energy consumption is primarily attributed to radio transmissions, prolonged channel monitoring, potential packet collisions, and control overhead [2]. These factors, combined with channel dynamics and the fluctuating network topology, render static optimization ineffective. To address these challenges, the literature suggests a variety of solution approaches. Traditional methods include optimizing communication procedures (MAC and routing), implementing cyclic monitoring mechanisms, data consolidation, and the integration of adaptive network schemes, such as hierarchical clustering [2]. Furthermore, optimization methods based on artificial intelligence, particularly metaheuristics, have proven effective in addressing complex optimization problems in WSNs. However, these current methods are subject to significant constraints. Traditional protocols struggle to dynamically adapt to changes in channel quality and variations in node density. Furthermore, some research simultaneously considers latency, reliability, and load-balancing constraints when defining the objective function, which limits the practical applicability of the proposed solutions. It is therefore necessary to develop an energy-optimization strategy that incorporates flexibility, adaptability, and robustness in the face of a variety of deployment scenarios. We suggest using problem-independent metaheuristic techniques to find a solution to energy optimization. Among these, bio-inspired algorithms, also known as nature-inspired algorithms, constitute a specific subset [3]. Bio-inspired algorithms can be broadly grouped into three main categories. The initial type is evolutionary, which includes Multi-Objective Evolutionary Algorithms (MOEAs), Distribution Estimation Algorithms (DEAs), Evolutionary Programming (EP), and Evolutionary Strategies (ESs). The second type of algorithm relies on swarms, such as the Artificial Bee Algorithm (ABC), Sparrow Algorithm (SA), Firefly Swarm Algorithm (FA), and Ant Colony Algorithm (ACO). Third-generation methods, such as the Tree Plant Colony Algorithm (PCA), are plant-based. In this article, we propose using the Mosquito Swarm Algorithm (MSA) as a solution to divide the network into clusters and to route data. The following is how this article is structured: In Section 1, WSNs are introduced. Section 2 evaluates literature relevant to bio-inspired algorithms for energy optimization. Section 3 provides a detailed description of the suggested bio-inspired algorithms. Section 4 presents and analyzes the simulation results. The study’s conclusions and recommendations for the future are presented in Section 5.

2. Related Works

The papers listed below concentrate on metaheuristic algorithms intended to address routing difficulties in WSNs:
In [4], faced with the challenges of energy efficiency and minimizing unnecessary transmissions in WSNs, the authors proposed an innovative framework that combines a nature-inspired group leader selection algorithm (APO-CHS, based on the adaptive behavior of the euglena) with a multilevel data aggregation method. They refine node selection using a multi-objective function (distance, energy, density) and minimize repetitions through sophisticated aggregation.
In [5], to improve routing and energy management in WSN, the authors proposed the hybrid MECT-PSO protocol. This strategy combines minimum execution time planning (MECT), which determines the ideal path by considering node load, with PSO to adaptively adjust the position of intermediate nodes. By reducing path lengths and distributing the load evenly, the protocol decreases average energy losses (AELs) and optimizes network self-organization.
The authors of [6] proposed a novel biomimicry-based approach that combines a mixed-integer linear programming model with ant colony optimization to tackle the problem of energy balance within WSNs. This method simultaneously optimizes trajectory management and the waiting time of mobile collection points, taking inspiration from the effective migration strategies of wildebeest (rapid movement/long stay) and the dynamic evaluation of the energy/reward ratio in ants. The mixed-integer linear programming model allows for flexible arrangements between transmission time and energy balance by incorporating pheromone and evaporation mechanisms as constraints. Results from experiments show how well it works to increase network longevity.
Faced with the energy challenges of WSNs in the IoT, the authors in [7] suggest the EE-FGO method, which combines fuzzy logic with gray wolf swarm optimization. This approach simultaneously optimizes the creation of clusters, the selection of multiple agglomeration points, and routing to the base station. Simulations indicate a significant increase in network longevity compared to current protocols.
Finding the mobile node’s shortest route throughout the whole sensor network is the goal. The authors of [8] compare three effective metaheuristic evolutionary algorithms: the firefly algorithm, inspired by swarm intelligence, ABC, and ACO. The most well-known non-deterministic-polynomial combinatorial optimization issue involves an artificial agent that must travel between multiple cities and determine the optimal path by calculating the time or distance required to get between each node or city. An examination of metaheuristic algorithms was performed in this comparison study in order to find the best answer with minimum processing time.
In [9], to increase the energy efficiency of low-power Bluetooth WSNs (M-LPNWSN), the authors suggest combining the artificial bee colony algorithm with the Bluetooth low energy protocol. By leveraging the mesh structure of BLE and the foraging behavior of ABC, this method significantly reduces energy consumption compared to genetic algorithms. Simulations demonstrate its potential for more sustainable and energy-efficient sensor networks.
The writers of [10] draw inspiration from a broad study of mosquito populations and how they naturally seek out hosts. The authors of this paper present the GMHS technique and demonstrate its use. The GMHS approach proved to be accurate, convergent, and efficient.
In [11], the authors propose a HRMS for smart cities, based on a decentralized building-level structure. The ARN is its core component, providing energy independence and self-healing capabilities. The HRMS offers resource allocation that adapts to changing conditions, real-time decision-making and fault tolerance, while streamlined inter-node communication optimizes load distribution and responsiveness. Testing demonstrates significant improvements in energy efficiency and reduced downtime.

3. The Proposed Approach

The longevity of wireless sensor networks is restricted since they rely on limited batteries. The sensor will become useless if the battery runs out or if it is put in an awkward area. This is an important issue, as evidenced by the numerous research studies that have been carried out. Some research uses algorithms inspired by nature, known as bio-inspired algorithms [12]. The subject of WSN energy optimization is addressed by some current studies in the literature employing bio-inspired artificial intelligence techniques like ACO, ABC, GA, and others.
An important aspect of optimizing wireless sensor networks is clustering technology. These networks require interaction between a central base station (BS) and sensors that are spread out over a large area. These sensors are grouped together by clustering, and each group is led by a cluster head (CH) who is in charge of gathering data and coordinating with the BS. By reducing the number of transmissions required and optimizing communication routes, clustering can greatly prolong the network’s lifespan and improve its efficiency. Clustering reduces redundancy and network congestion, increases network efficiency, and prolongs network lifetime by optimizing communication and energy consumption across nodes.
This work presents a new energy optimization algorithm for WSN, using the bio-inspired Mosquito Swarm Algorithm (MSA). Our proposal consists of two phases, the first of which is a setup phase when clusters are built using the MSA. A phase where the MSA directs the gathered data to the base station comes next.

3.1. Mosquito Swarm Algorithm (MSA)

The MSA is considered a bio-inspired metaheuristic; it is based on the analysis of the social behavior of mosquito swarms. Díaz-Parra and Ruiz-Vanoye in 2012 also developed an algorithm inspired by the social behavior of mosquito swarms in a different field. Mosquitoes have sensors that enable them to track their prey: A chemical sensor with a 36-meter detection range for lactic acid and carbon dioxide—gases exhaled by mammals and birds during regular breathing—and a second heat sensor that, when getting close enough, detects heat and makes it simple to locate warm-blooded creatures and birds [13].
The Mosquito Swarm Algorithm is an algorithm inspired by nature based on the host-seeking conduct of mosquito swarms. Mosquitoes feed on nectar, but only females are capable of drinking blood. The following are the phases of a mosquito’s host-seeking behavior:
1.
The mosquito is searching for something smelly or carbon dioxide.
2.
Once it has identified its favorite scent, it moves on to a place of intense concentration.
3.
It descends as soon as it senses the host’s radiated warmth.
The MSA proposed in this article is inspired by the behavior of mosquitoes when attacking humans.
Our contribution is based on a dual inspiration drawn from the behavior of mosquitoes when they attack humans, implemented through two specialized and complementary algorithms: one for cluster creation and cluster leader selections and the other for data routing. In a context where nodes are fixed, the MSA for clustering leverages the exploration phase to ensure rapid convergence toward an optimal and balanced cluster distribution. Similarly, the MSA for routing discovers the best path in terms of energy and distance. This contrasts with single-algorithm approaches (PSO, ACO, GWO, ABC, etc.) that apply the same mechanisms to both tasks and suffer from premature convergence, slow adaptation, or limited handling of multi-objective constraints, respectively.

3.2. Clustering Configuration Phase Using MSA

In this phase, we cluster the WSN to reduce energy usage and increase network lifetime. At the base station, a node with limitless energy is where this algorithm is run. The methodology of clustering wireless sensor networks (WSNs) to minimize energy consumption is based on organizing sensor nodes into groups called clusters. The primary goal is to minimize direct contact between the base station and the sensors. To group a WSN consisting of N fixed sensors and K clusters using the MSA, the network is organized as shown in Algorithm 1.
At the input of the MSA, the network must be divided into a set of clusters with selected cluster leaders. Instead of using random initialization, which can generate empty clusters (a leader with no members) or unbalanced clusters, we use the K-means algorithm. Indeed, K-means minimizes the intra-cluster distance, thus guaranteeing homogeneous groups and relevant cluster leaders from the outset.
Initialize the chemical sensor ( C S ) for each mosquito (which represents WSN’s sensor node) using the following formula [13,14]:
C S i = e i ( t ) j = 1 n e j ( t )
Algorithm 1 Mosquito Swarm Algorithm for cluster construction
1. Enter: Initialize a set of K clusters and N mosquitoes.
2. Initialize the maximum number of iterations t m a x and the iteration t = 1.
3. For each mosquito, calculate the chemical sensor ( C S ) and a heat sensor ( H S ) using Formulas (1) and (2).
4. Find the best solutions using the objective function (Formula (3)). The best solutions are those that yield the maximum values of the objective function.
5. Repeat until t m a x is reached.
6. Start:
7. Make use of the chemical sensor ( C S ) to assess and assign the feasibility of solutions:
8. Calculate the chemical sensor ( C S ) values for the new solutions ( N c h ).
9. Compare the chemical sensor ( C S ) values of the new solutions ( N c h ) with those of the previous solutions and select the best values, which will become the cluster leaders.
10. Assign nodes to the new solutions ( N c h ) found as cluster leaders.
11. Calculate for each mosquito (which represents a WSN sensor) its chemical sensor and its heat sensor using Formulas (1) and (2).
12. Find the best solutions using the objective function (Formula (3)).
13. t = t + 1.
14. Check if t < = t m a x , repeat steps 5 to 13.
15. End of repeat and end of algorithm.
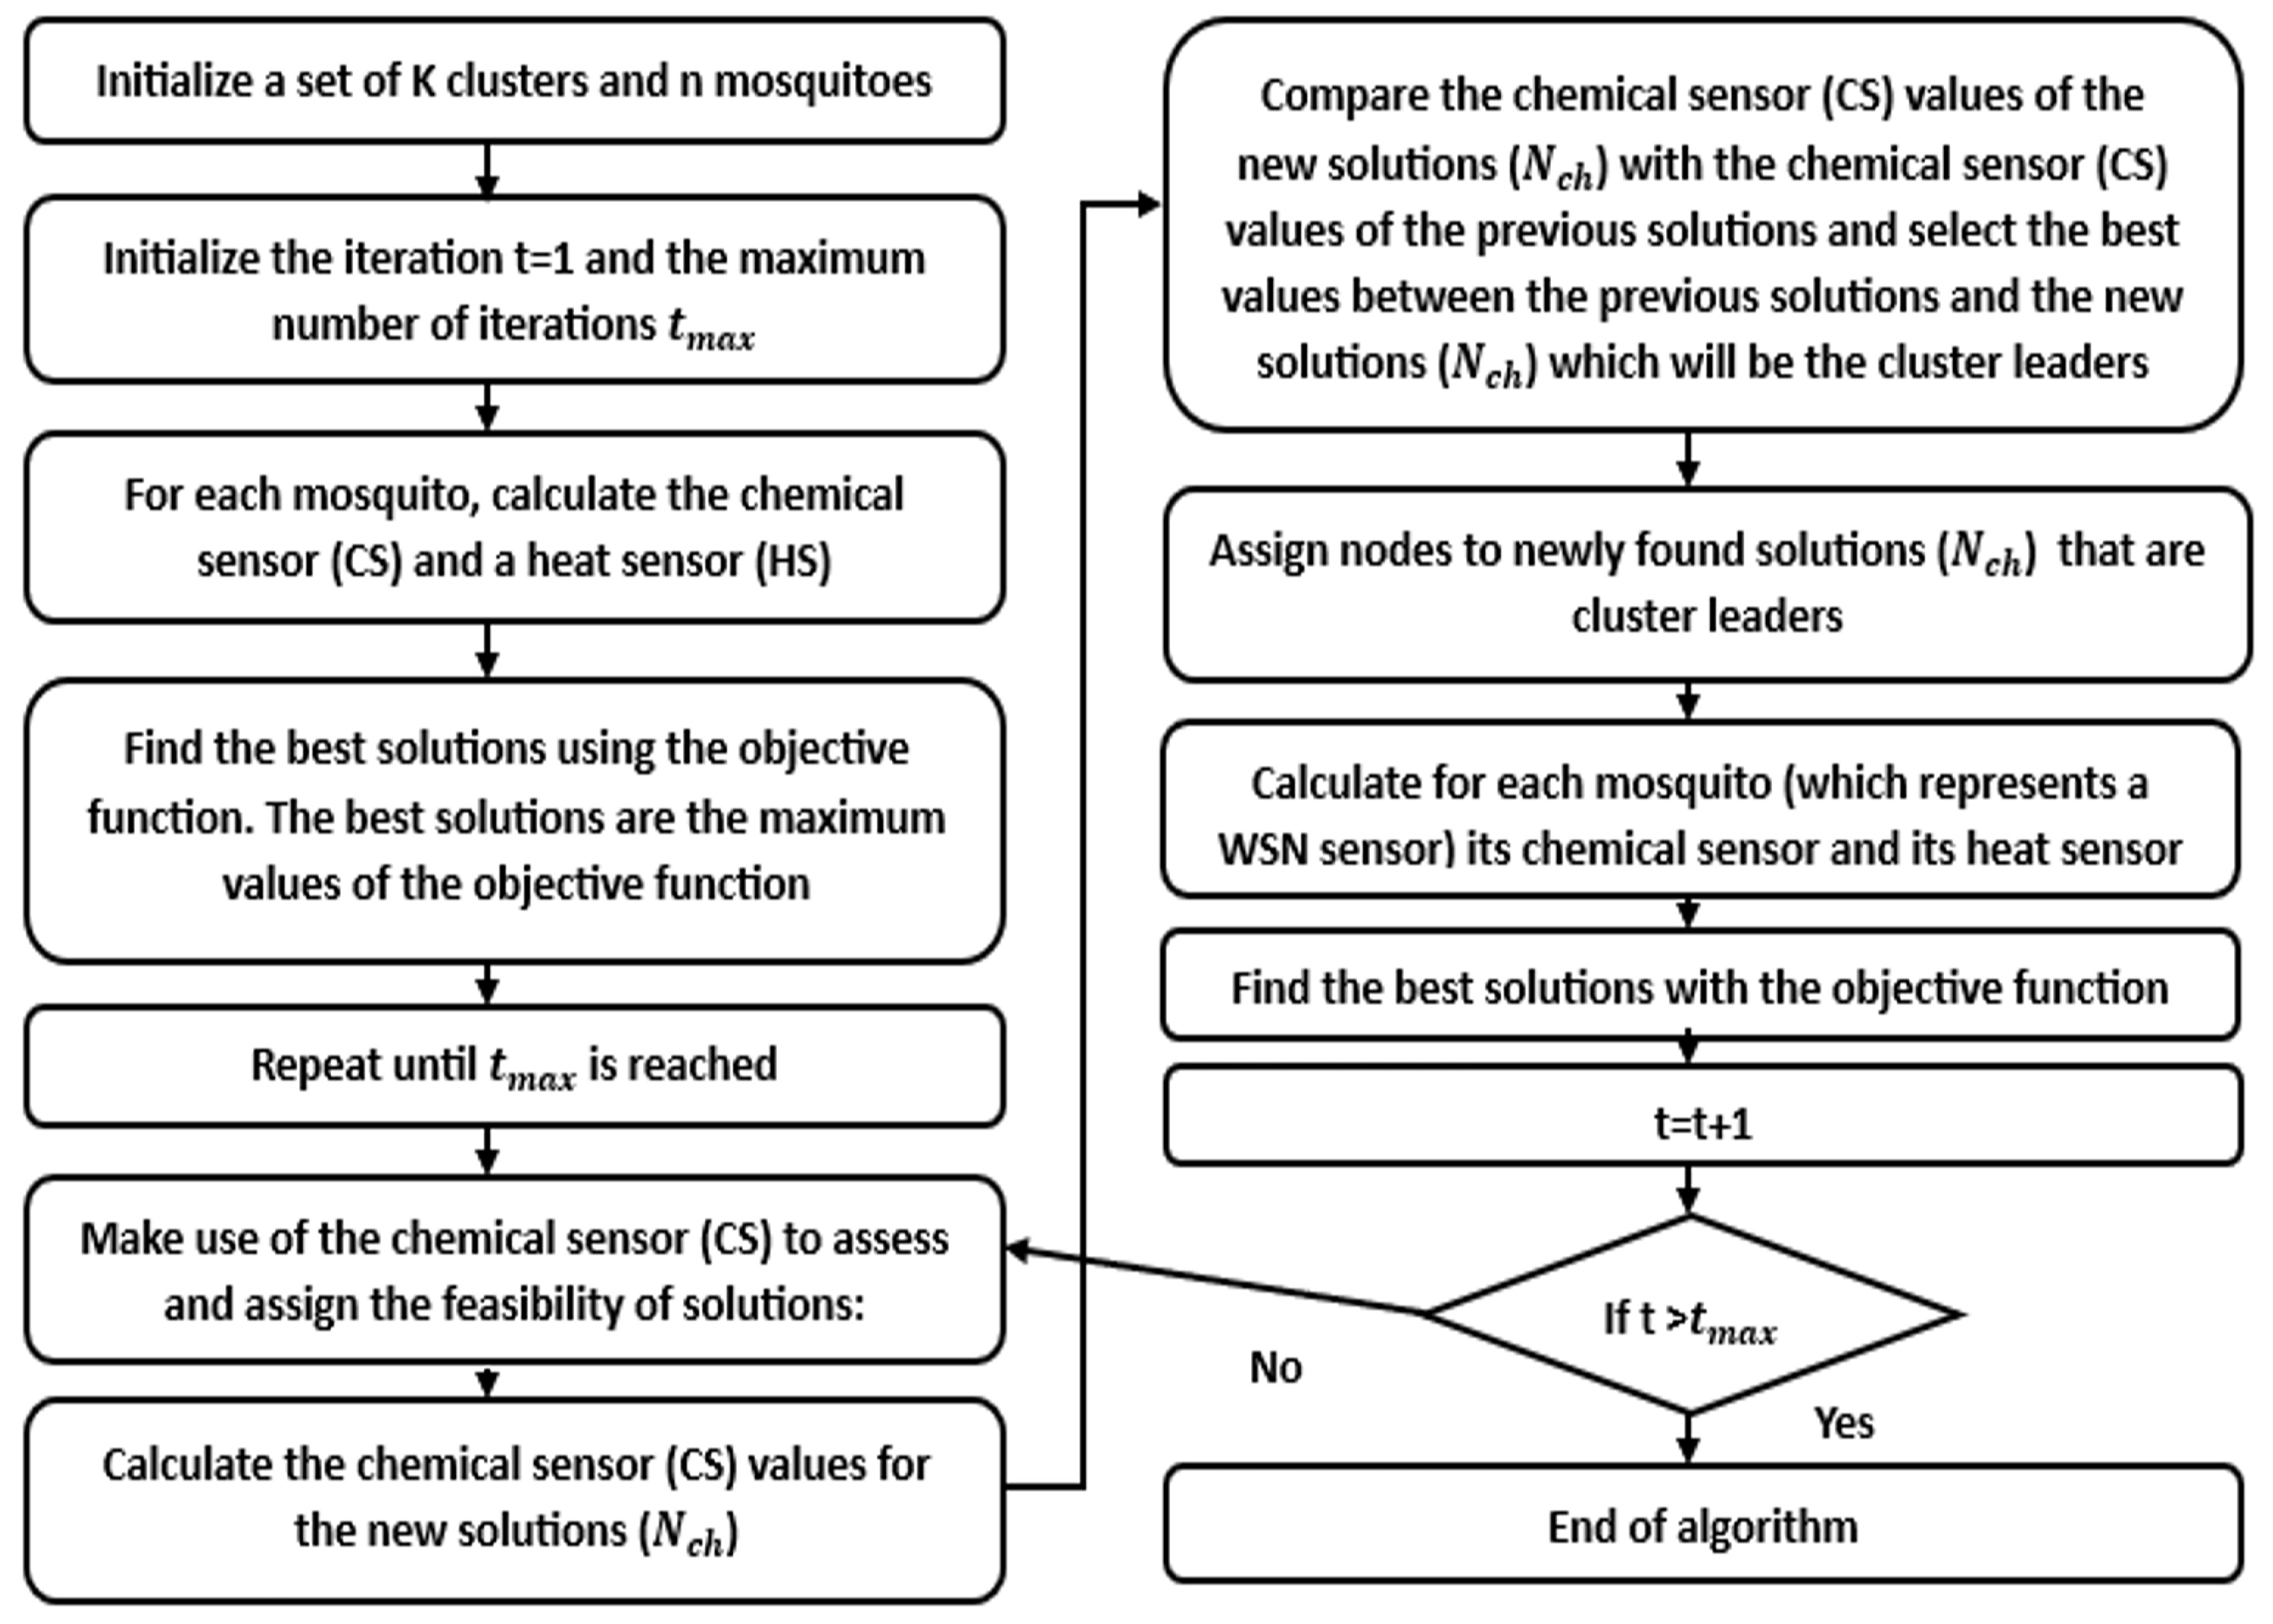
The clustering process based on the MSA is represented in the diagram in Figure 1.
Initialize the heat sensor ( H S ) for each mosquito (which represents WSN’s sensor node) using the following formula [13]:
If C S i = C S i > = E moy therefore H S i = 40 0 < C S i < E moy therefore H S i = 37 C S i = 0 therefore H S i = 0
With e i ( t ) denoting the current energy of node i, E m o y ( t ) the mean energy of all nodes within the WSN, and  N c h the new solutions found in the current iteration using the objective function.
The following is the definition of the objective function:
f i ( t ) = C S i H S i D i
With f i ( t ) denoting the proposed objective function for our MSA, and  D i denoting the fitness function by measuring the total distance separating each sensor node and the base station (BS), each sensor node’s total distance to the cluster leader, and each sensor node’s single distance to the cluster leader, as specified by Formula (4) [15]:
D i = d i c h d T ( s s b ) d T ( s c h )
With d i c h denoting the separation between sensor node i and the CH, d T ( s s b ) the overall separation from all sensor nodes to BS, and  d T ( s c h ) the total separation between all nodes of the cluster and its cluster head [15].
Once the clusters are formed using the MSA at the base station, which has an unlimited power source and high transmission power covering the entire network, the BS manages the entire clustering process. The BS establishes a transmission schedule for each cluster to manage data transmission between each cluster leader and its members, thus preventing message collisions. The BS then communicates this information about the created clusters and transmission schedules via direct unicast to each node in the network.

3.3. The Routing Phase Using MSA

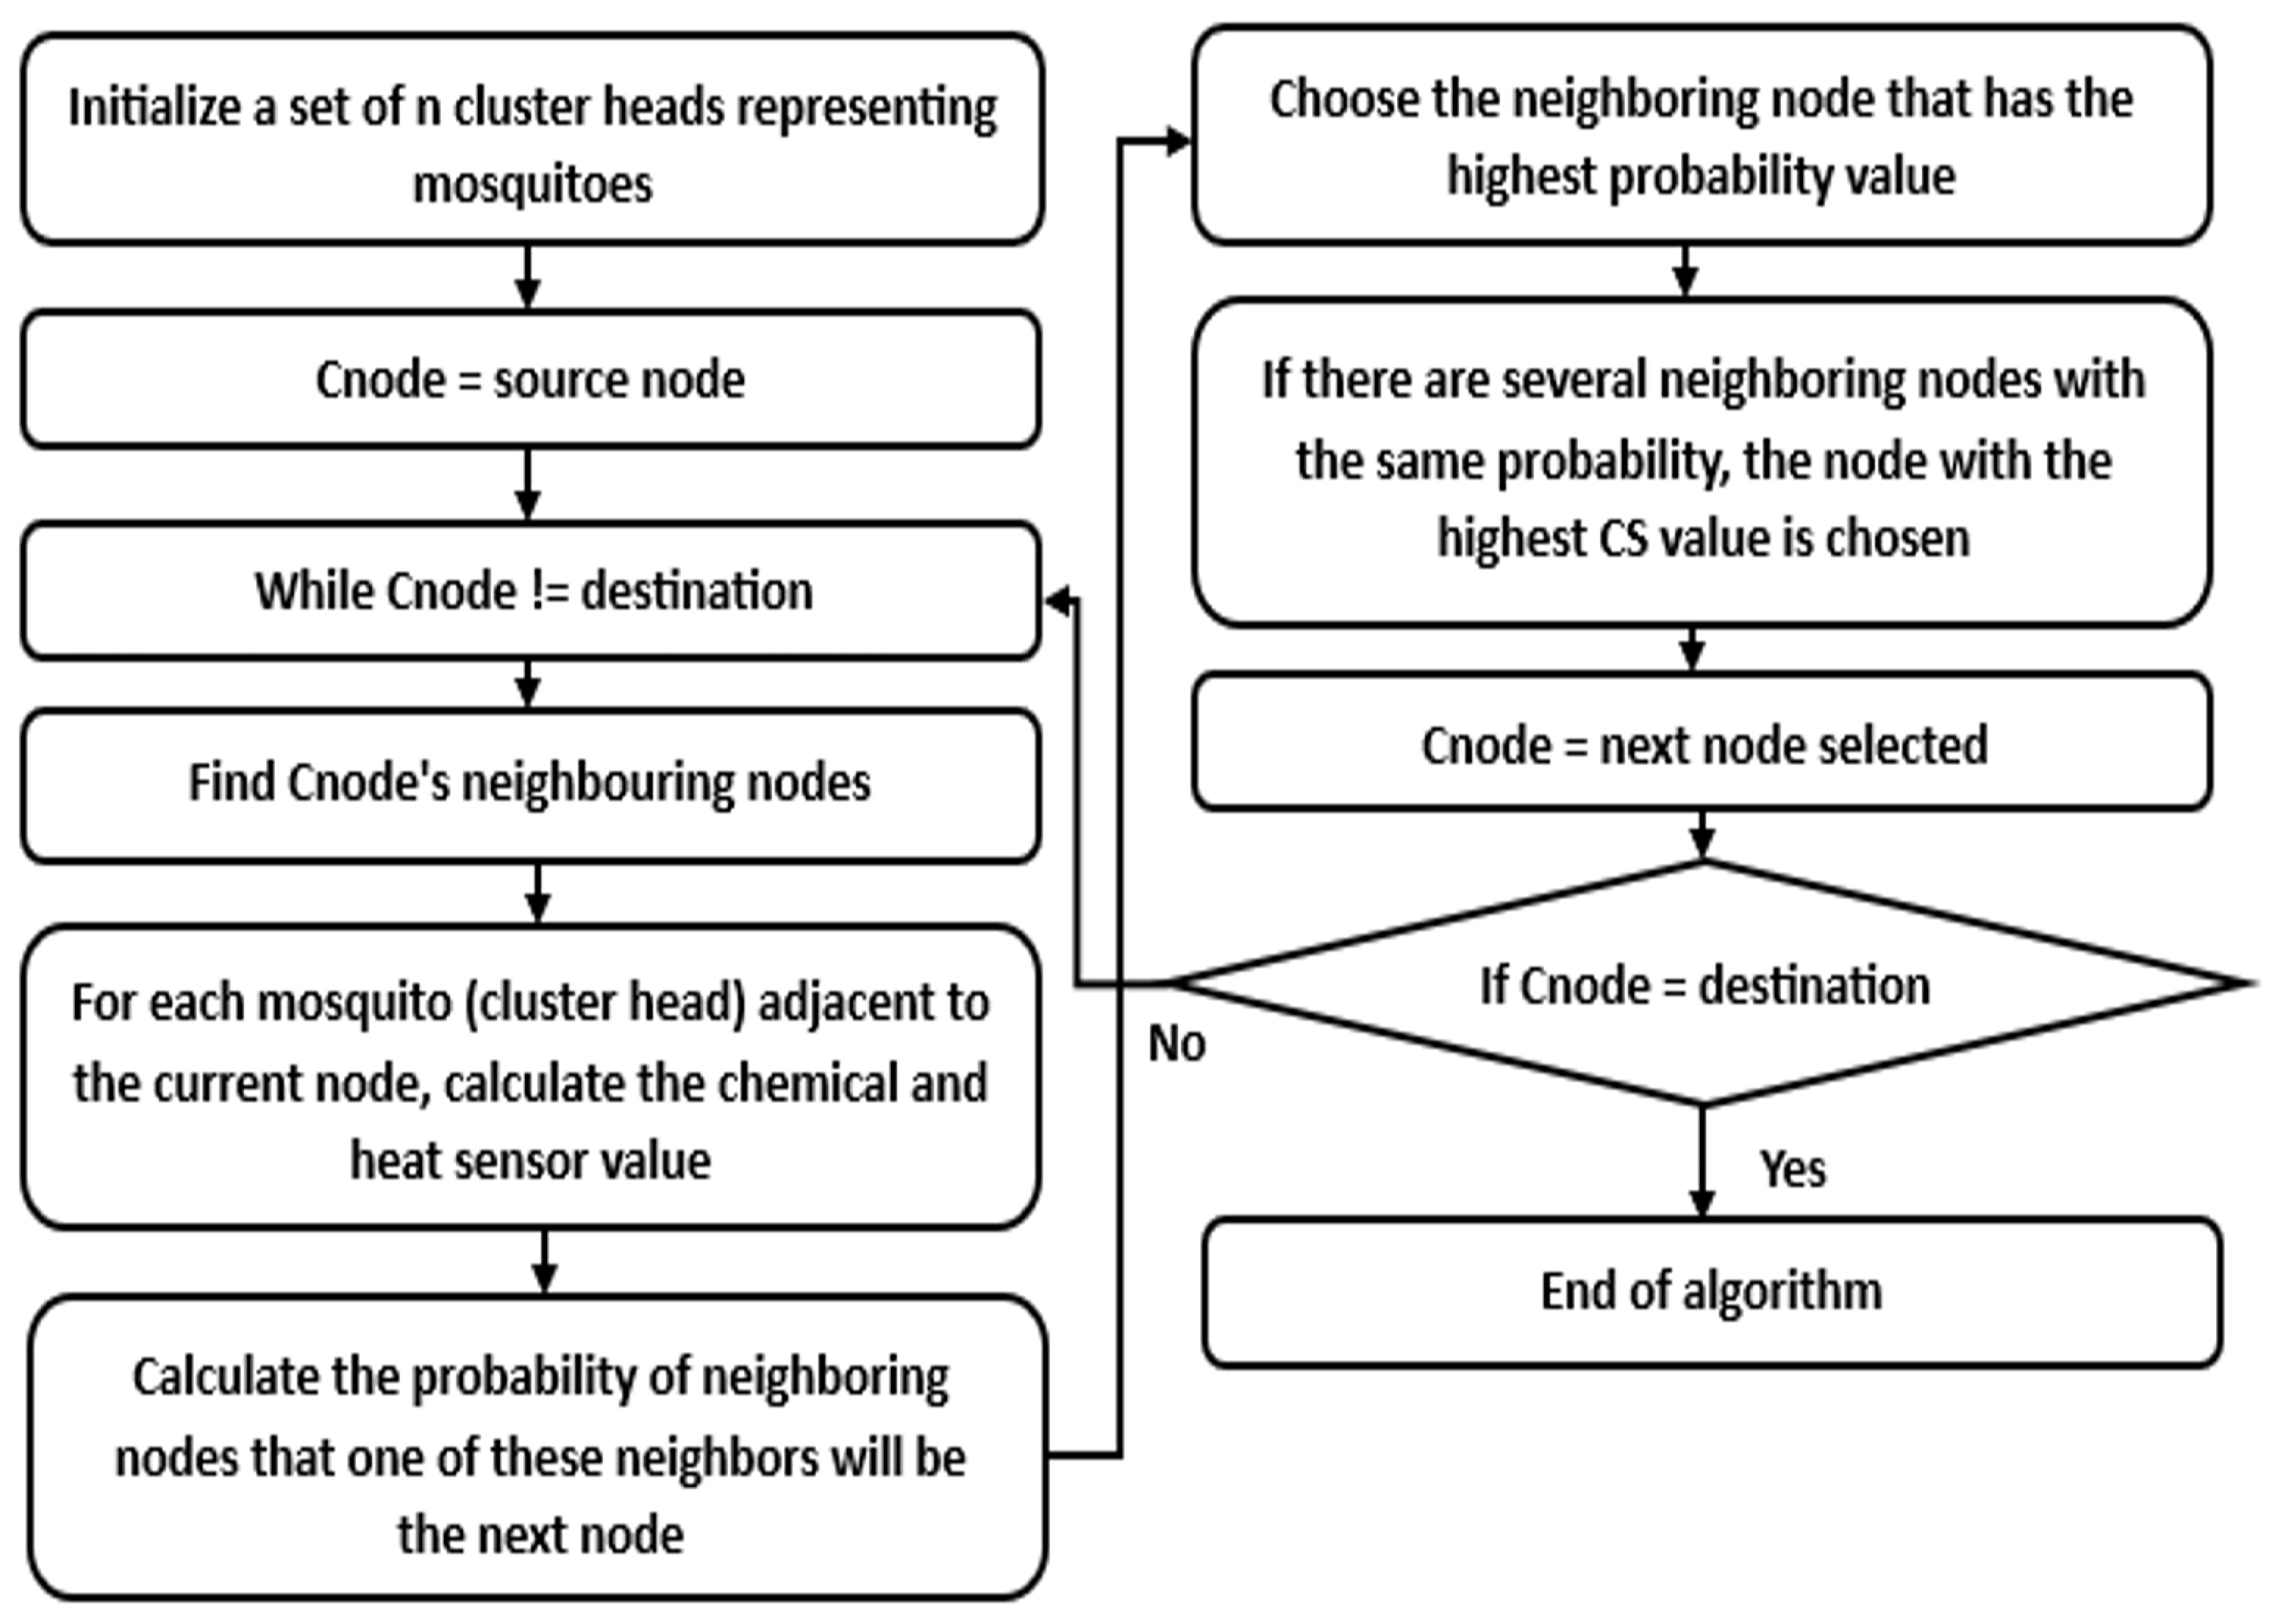
We suggest employing a routing algorithm based on mosquitoes’ host-seeking behavior (MSA) to identify the most efficient path for forwarding the combined data to BS, all the while lowering the energy usage of the network nodes. The complete workflow of the suggested routing protocol is depicted in Figure 2. The nodes active in this stage are the cluster heads, chosen earlier during the setup phase, to forward the consolidated data to BS. The combined data is communicated to the BS through the MSA as shown in Algorithm 2.
Algorithm 2 Mosquito Swarm Algorithm for data routing
1. Initialize a set of n cluster heads representing mosquitoes.
2. Cnode = source node.
3. While Cnode != destination.
4. Start:
5. Find Cnode’s neighboring nodes.
6. For each mosquito (cluster head) adjacent to the current node, calculate the chemical and heat sensor value using Formulas (8) and (2).
7. Calculate the probability of neighboring nodes that one of these neighbors will be the next node, using Formulas (2), (5), (6), (7), (8) and (9).
8. Choose the neighboring node that has the highest probability value.
9. If there are several neighboring nodes with the same probability, the node that has the greatest CS value is selected.
10. Cnode = next node selected.
11. If Cnode != destination, repeat steps 5 to 11.
12. If Cnode = the destination, End of while.
13. End of algorithm.
The following is the definition of the MSA’s probability function [14]:
P i j ( t ) = e x p ( α 1 E n e i j ( t ) + α 2 C S j H S j + α 3 ( 1 D i s i j ) ) k C ( i ) e x p ( α 1 E n e i k ( t ) + α 2 C S k H S k + α 3 ( 1 D i s i k ) )
Where P i j ( t ) denotes the likelihood of packet transfer, and E n e i j ( t ) is the parameter for energy measurement and is defined as follows [14]:
Ene i j ( t ) = E i n i E r e s j ( t ) 1 j C ( i ) E i n i E r e s j ( t ) 1
Where E i n i represents the starting energy assigned to the network nodes, E r e s j ( t ) denotes the energy remaining at node j, the neighbor of the current node i, and D i s i j is the function used for localization, which is defined as follows [14]:
Dis i j = d j d l C ( i ) d l d
Where d j d indicates the distance separating the destination d and node j, which is a neighbor of node i. C S j denotes the chemical sensor of neighboring node j, which is defined as follows for routing:
C S j = e j ( t ) l C ( i ) e l ( t )
H S j denotes the normalized version of the H S j heat sensor of node j, obtained by:
H S j = H S j H S max
Where H S j is the heat sensor of the neighboring node j, H S max is the maximum value that the heat sensor can obtain at node j, and α 1 , α 2 and α 3 are coefficients used to weight the criteria. To model the energy consumption of radio communications, we use the first-order model. The following formula determines the energy required by a node to transmit a packet of k bits over a distance d:
E T x ( k , d ) = k · E elec + k · E f s · d 2 , d < d 0 k · E elec + k · E m p · d 4 , d d 0
Where E T x ( k , d ) denotes the transmission energy, E e l e c denotes the energy consumed by electronic circuits to transmit or receive a bit, and E f s and E m p are the respective attenuation coefficients for the free space and multipath models. The threshold distance d 0 is defined by:
d 0 = E f s / E m p
The energy required to receive a packet of k bits E R x ( k ) is defined as follows:
E R x ( k ) = k · E elec
The energy consumed for data fusion E aggr ( k ) is modeled by:
E aggr ( k ) = k · E d a
Where E d a is the data aggregation energy.
The complexity analysis of our algorithm shows that the main loop is O(n), the nested comparison loops are O ( n 2 ) , the in-house sort is O ( k 2 ) on small subsets ( k < = 100 ) , and the MATLAB functions (exp(), abs(), sqrt()) do not change this complexity. The overall complexity is therefore dominated by the quadratic term O ( n 2 ) .
The entire source code implemented in MATLAB has been deposited in the Zenodo public repository, and the link is as follows: https://doi.org/10.5281/zenodo.21764600 (accessed on 3 August 2026).

4. Results and Discussion

The suggested approach was simulated in MATLAB R2018a, with Table 1 displaying the corresponding simulation settings.
In order to analyze our algorithm’s effectiveness, we performed several comparisons against standard algorithms. Accordingly, we utilized a variety of metrics, including:
Active node: denotes the total number of nodes that continue to function until all nodes in the network have exhausted their energy.
Dead nodes: relates to the total count of inactive nodes at the point when all nodes in the network have exhausted their energy.
Throughput: represents the proportion of packets transmitted compared to the overall count of packets.
Traffic: indicates the overall count of transmitted packets throughout the network.
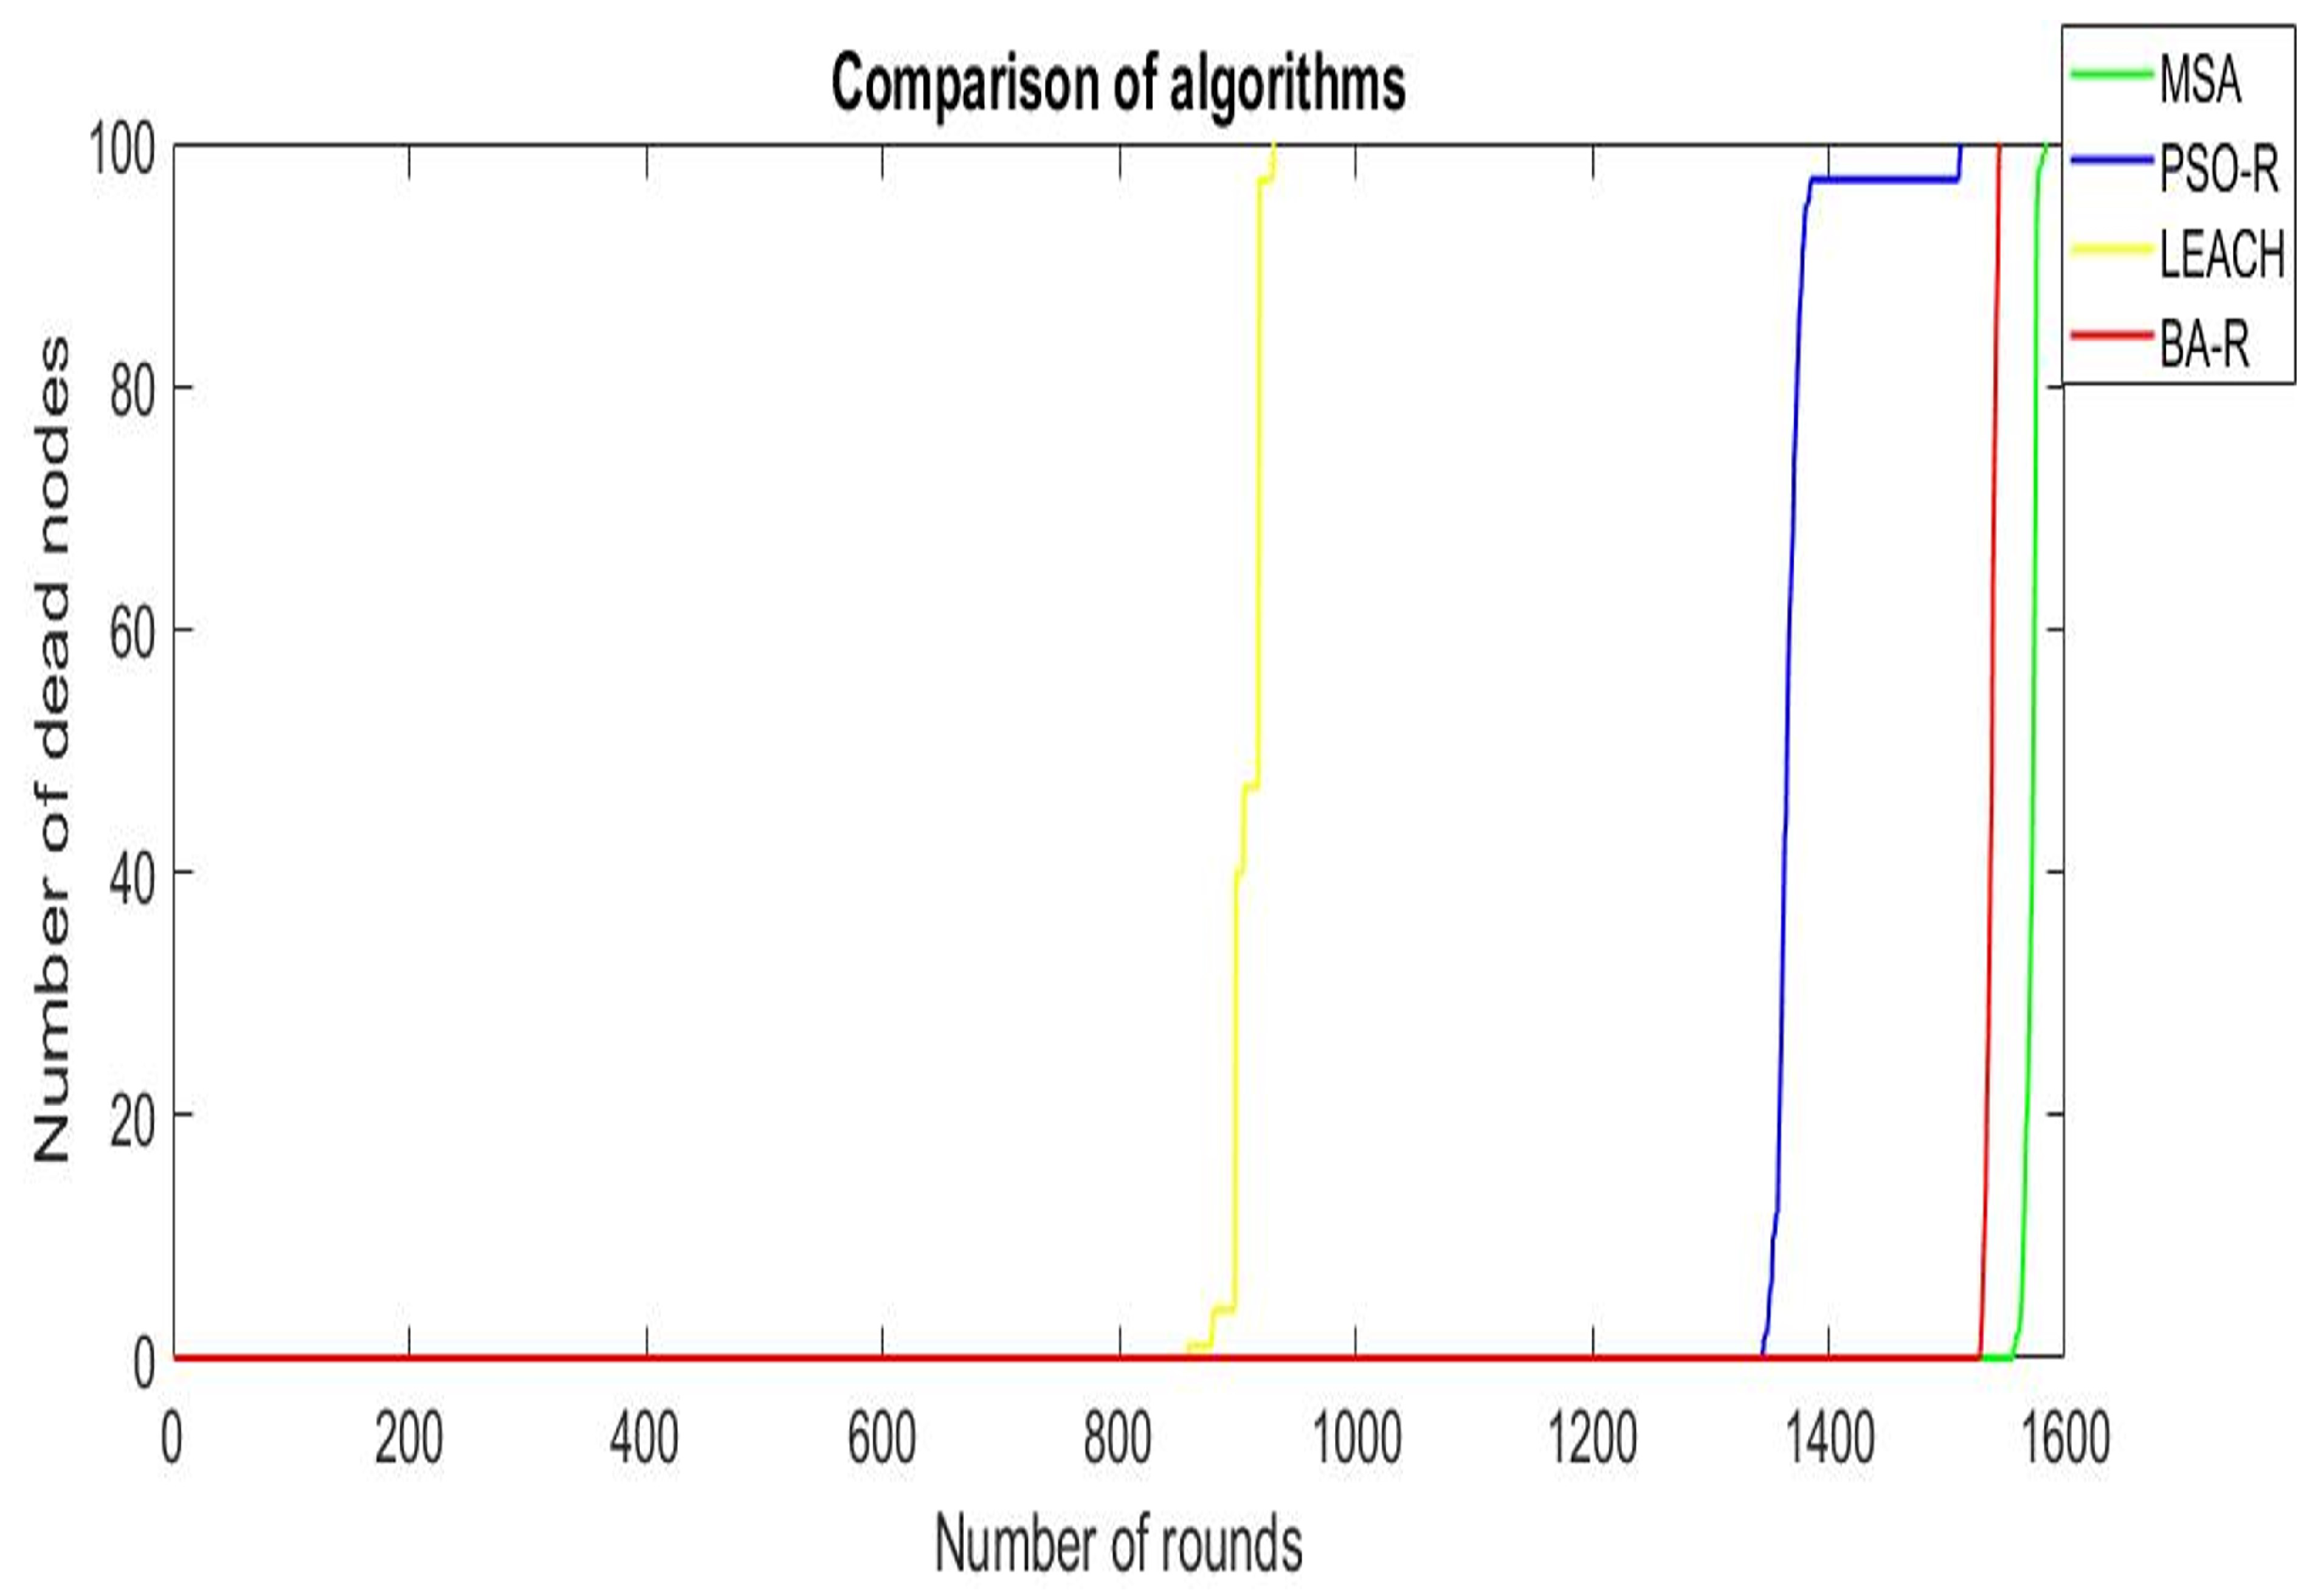
The experiments revealed significant differences between the four algorithms with regard to network lifetime, measured by the appearance of the first dead nodes and the complete death of the network, as shown in Figure 3. For the PSO-R algorithm (PSO clustering combined with routing), the first dead node was detected at iteration 1345, and all nodes were exhausted at iteration 1512 with a mean of 1545 and a standard deviation of 91.6. For the BA-R algorithm (BA clustering combined with routing), the first dead node was detected at iteration 1529, and all nodes were exhausted at iteration 1545 with a mean of 1542 and a standard deviation of 10.5. For the LEACH algorithm (clustering with direct transmission to the base station, without intermediate routing), the first dead node appeared early, at iteration 859, and the network shut down completely at iteration 931 with a mean of 941 and a standard deviation of 12.3. For the MSA (clustering with routing), the first dead node appeared at iteration 1557, and the network remained operational until iteration 1584 with an average of 1576 and a standard deviation of 23.9. This algorithm exhibited a more homogeneous energy distribution among the nodes. With 1584 iterations, the MSA significantly outperformed the other three algorithms, showing a performance improvement of over 4.76% compared to PSO-R, over 2.52% compared to BA-R, and over 70.14% compared to LEACH. This performance suggests effective optimization of overall energy consumption.
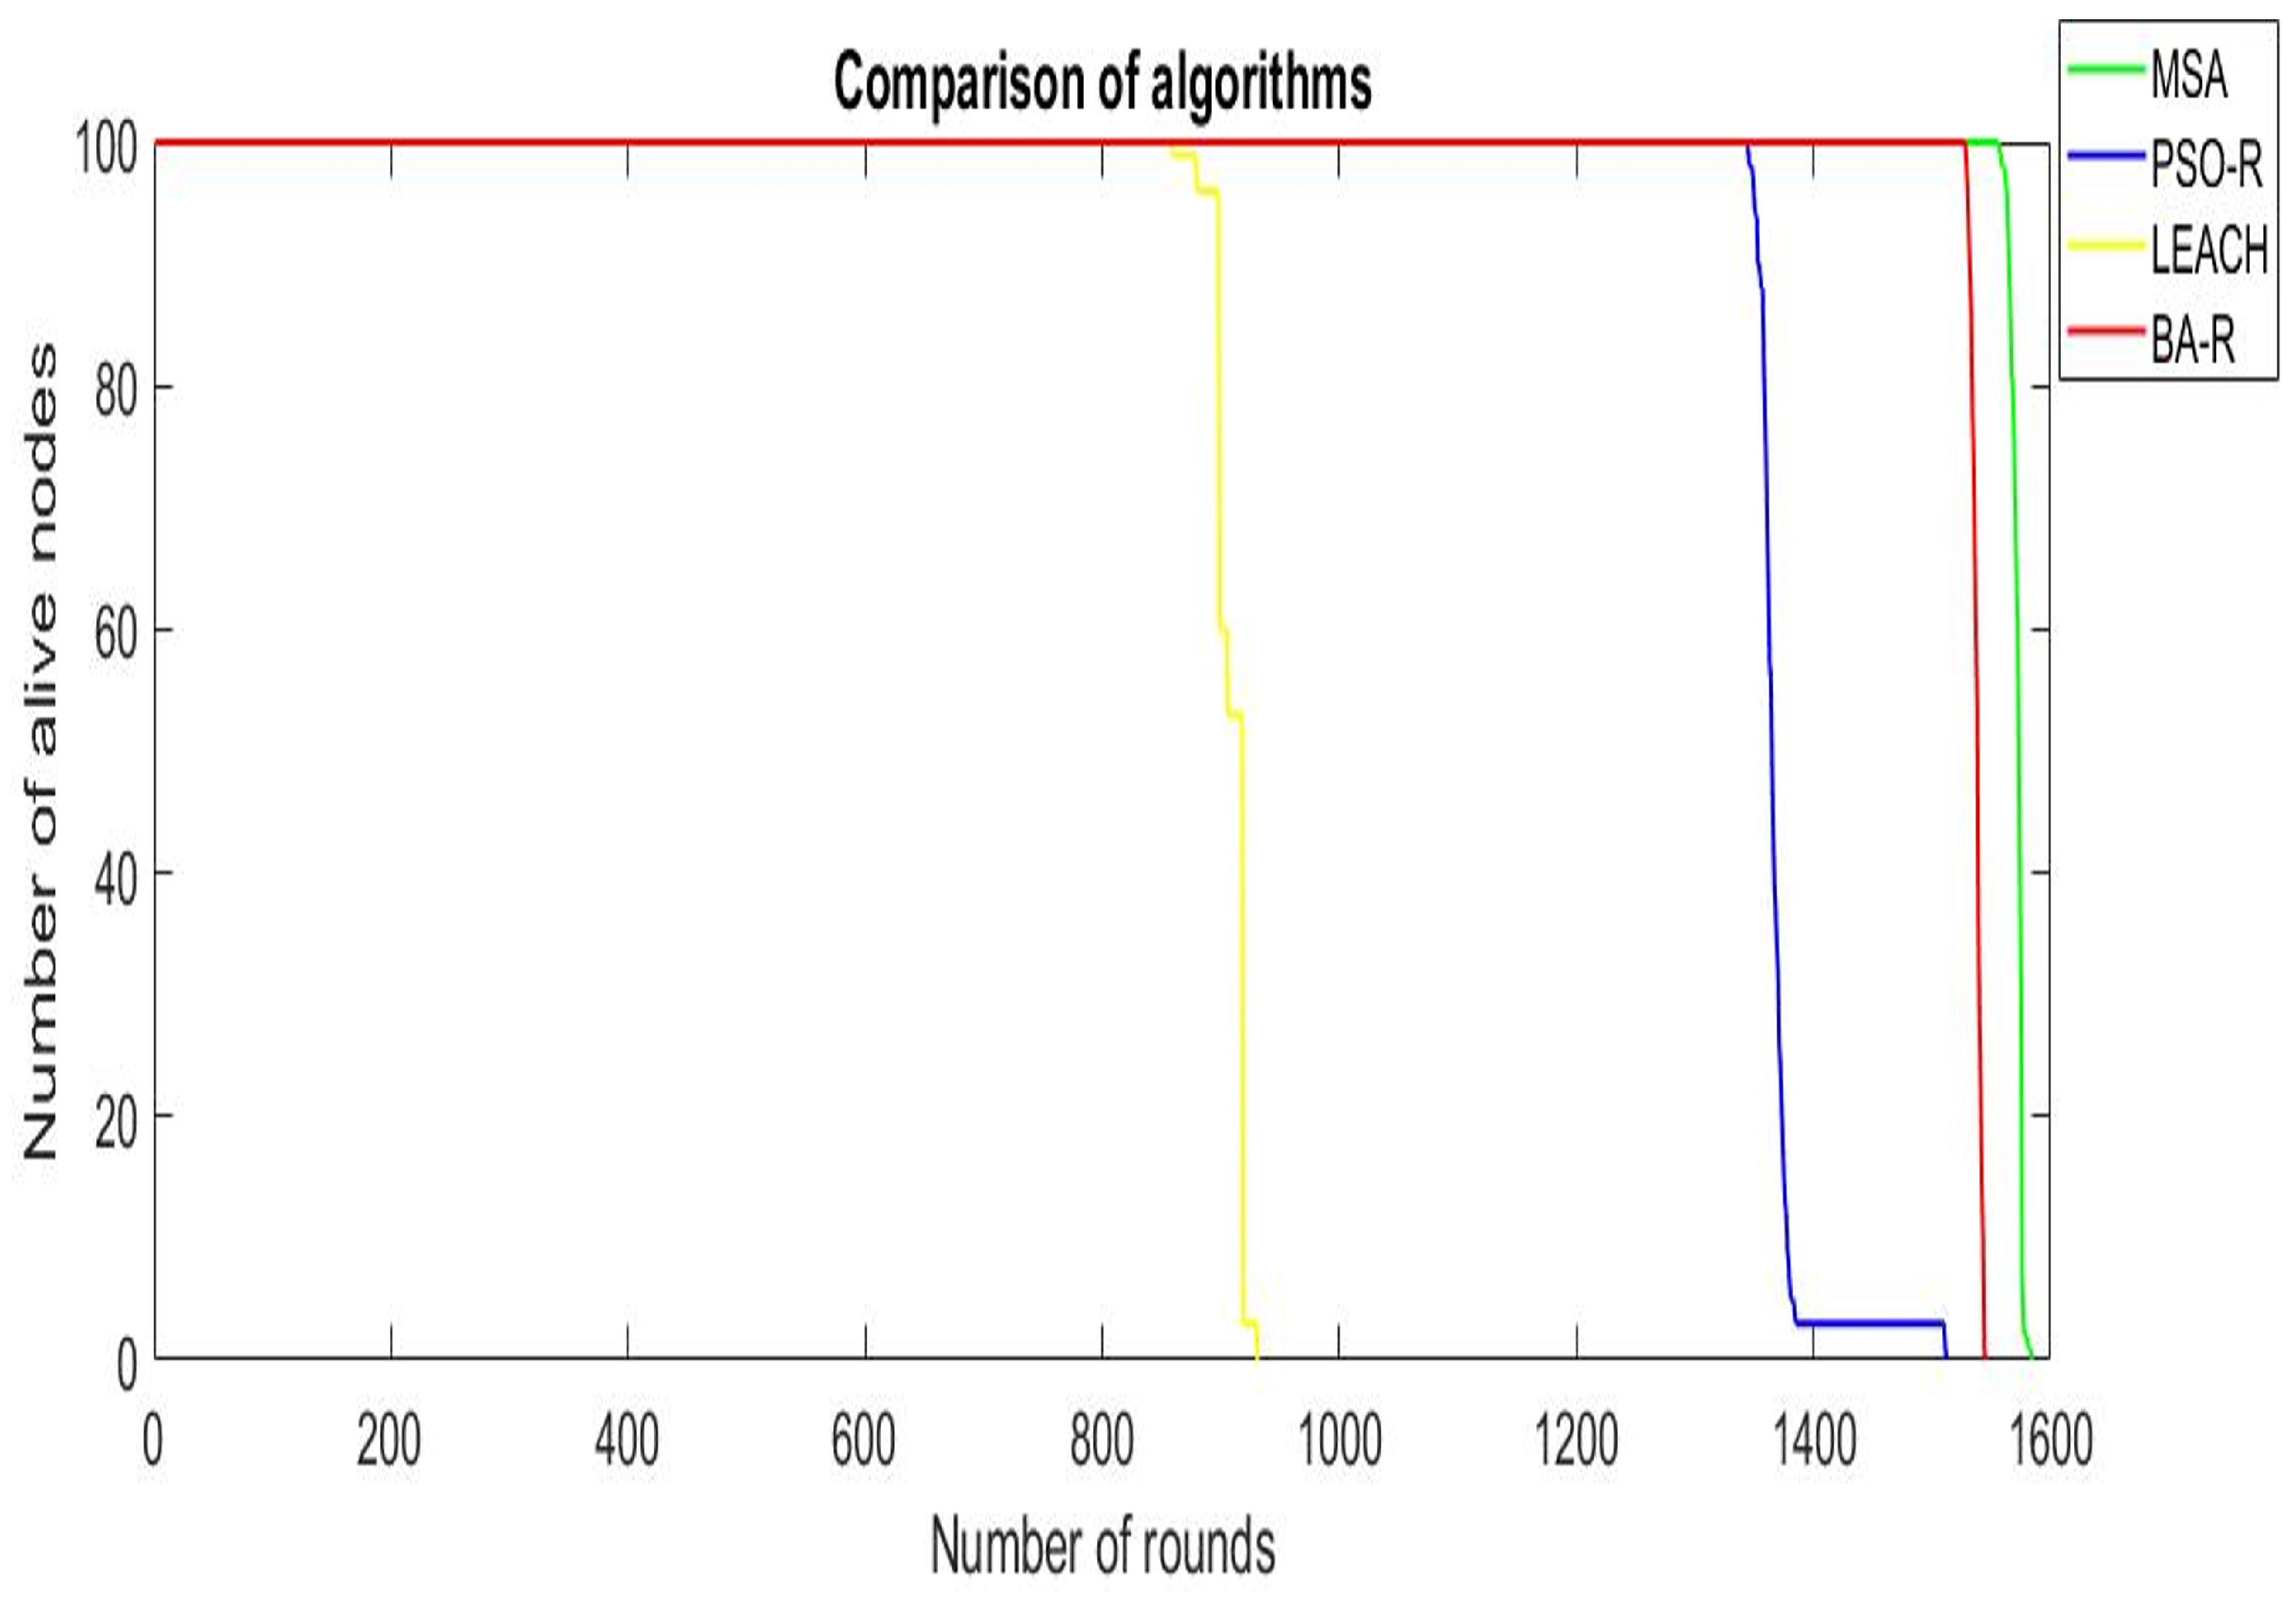
The outcomes of Figure 4 are shown in this part, which compare the stability and longevity of the network as a function of the evolution of active nodes over execution rounds. Regarding the LEACH algorithm, it has the shortest initial stability period at 859 iterations and the shortest total lifetime at 931 iterations. Regarding the PSO-R algorithm: it keeps all its nodes active up to 1345 iterations, then loses all network energy after 1512 iterations. Regarding the BA-R algorithm, it keeps all its nodes active up to 1529 iterations, then loses all network energy after 1545 iterations. Regarding the MSA, it ensures total stability up to 1557 iterations and its overall lifetime reaches 1584 iterations, the longest of the four algorithms. The MSA thus achieved a record of 1584 iterations, surpassing PSO-R by more than 4.76%, BA-R by more than 2.52%, and LEACH by more than 70.14%. This performance testifies to its energy efficiency.
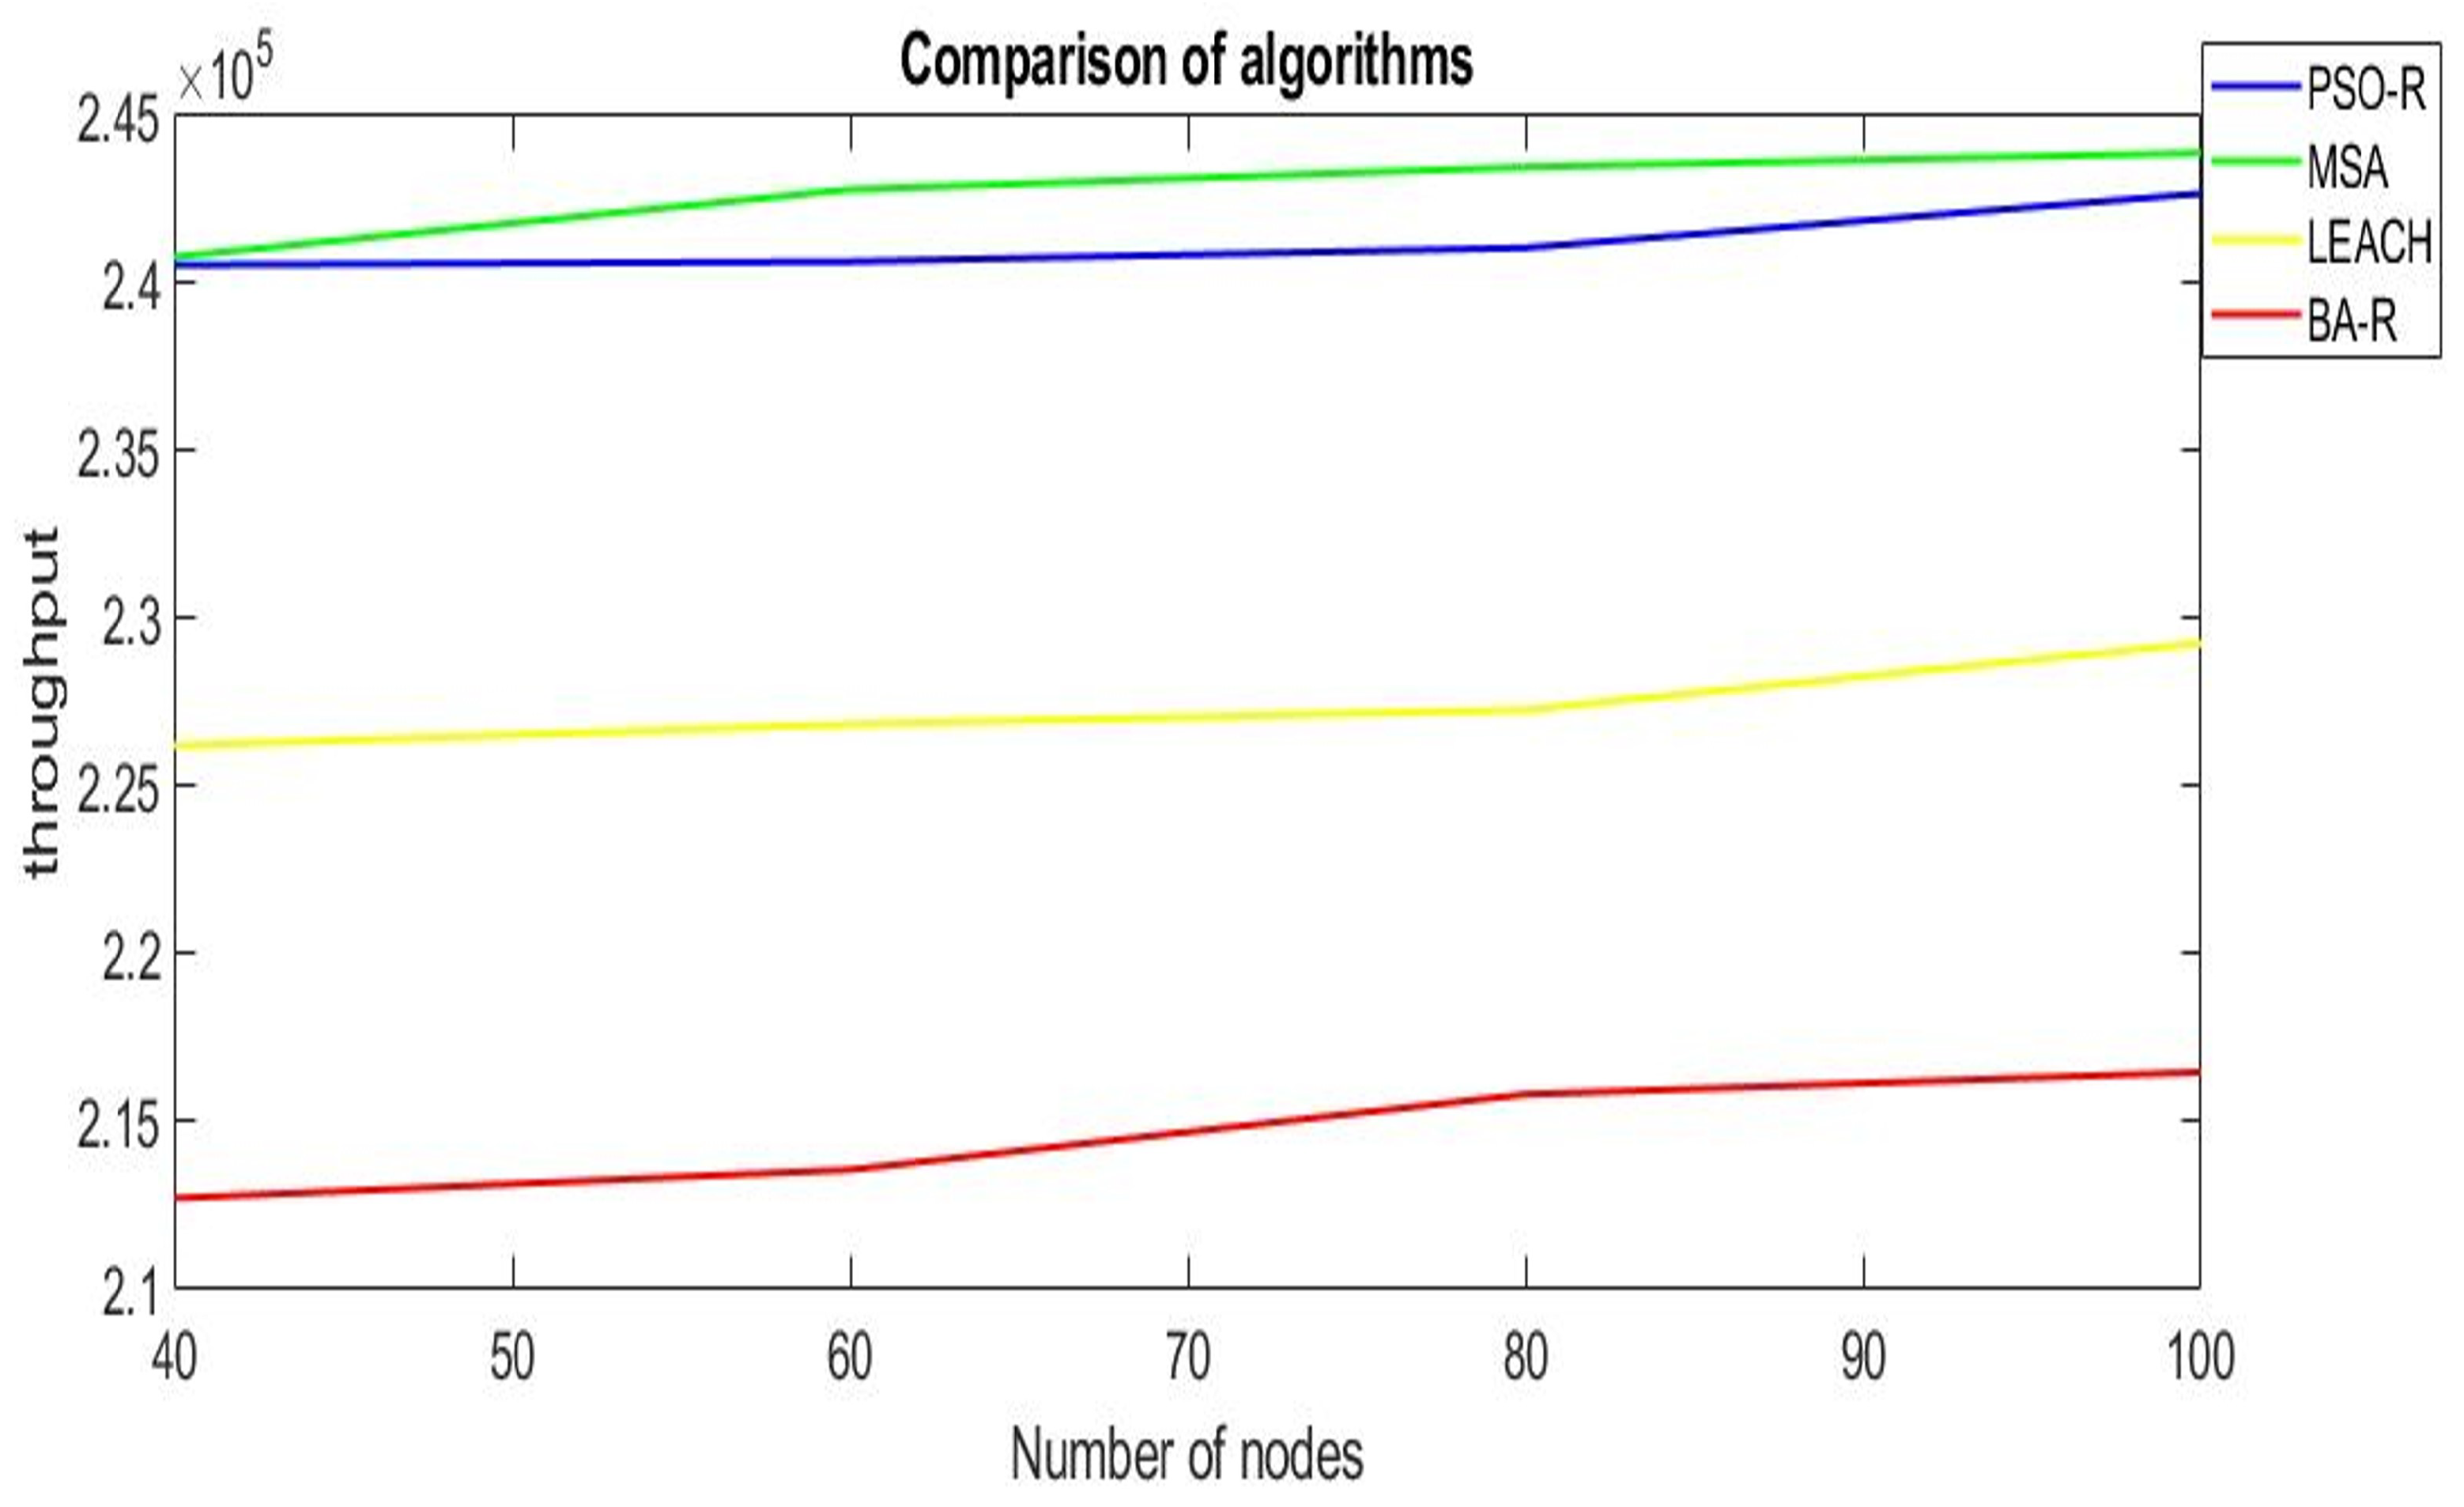
In order to determine which algorithm provides the best performance based on network density, we assess and compare the throughput of the MSA, PSO-R, BA-R, and LEACH algorithms shown in Figure 5. The MSA offers the highest throughput, ranging from 2.4081 × 10 5 bits/s to 2.4391 × 10 5 bits/s, followed by PSO-R from 2.4057 × 10 5 bits/s to 2.427 × 10 5 bits/s, then LEACH from 2.2623 × 10 5 bits/s to 2.2929 × 10 5 bits/s, and finally BA-R from 2.1273 × 10 5 bits/s to 2.1649 × 10 5 bits/s. With a gain of approximately 12.67% compared to BA-R, 6.38% compared to LEACH, and almost 1% compared to PSO-R, the MSA clearly outperforms the others. The outcomes indicate that, regardless of the number of nodes, the recommended MSA consistently achieves the maximum throughput. As a result, in terms of throughput, the MSA performs best.
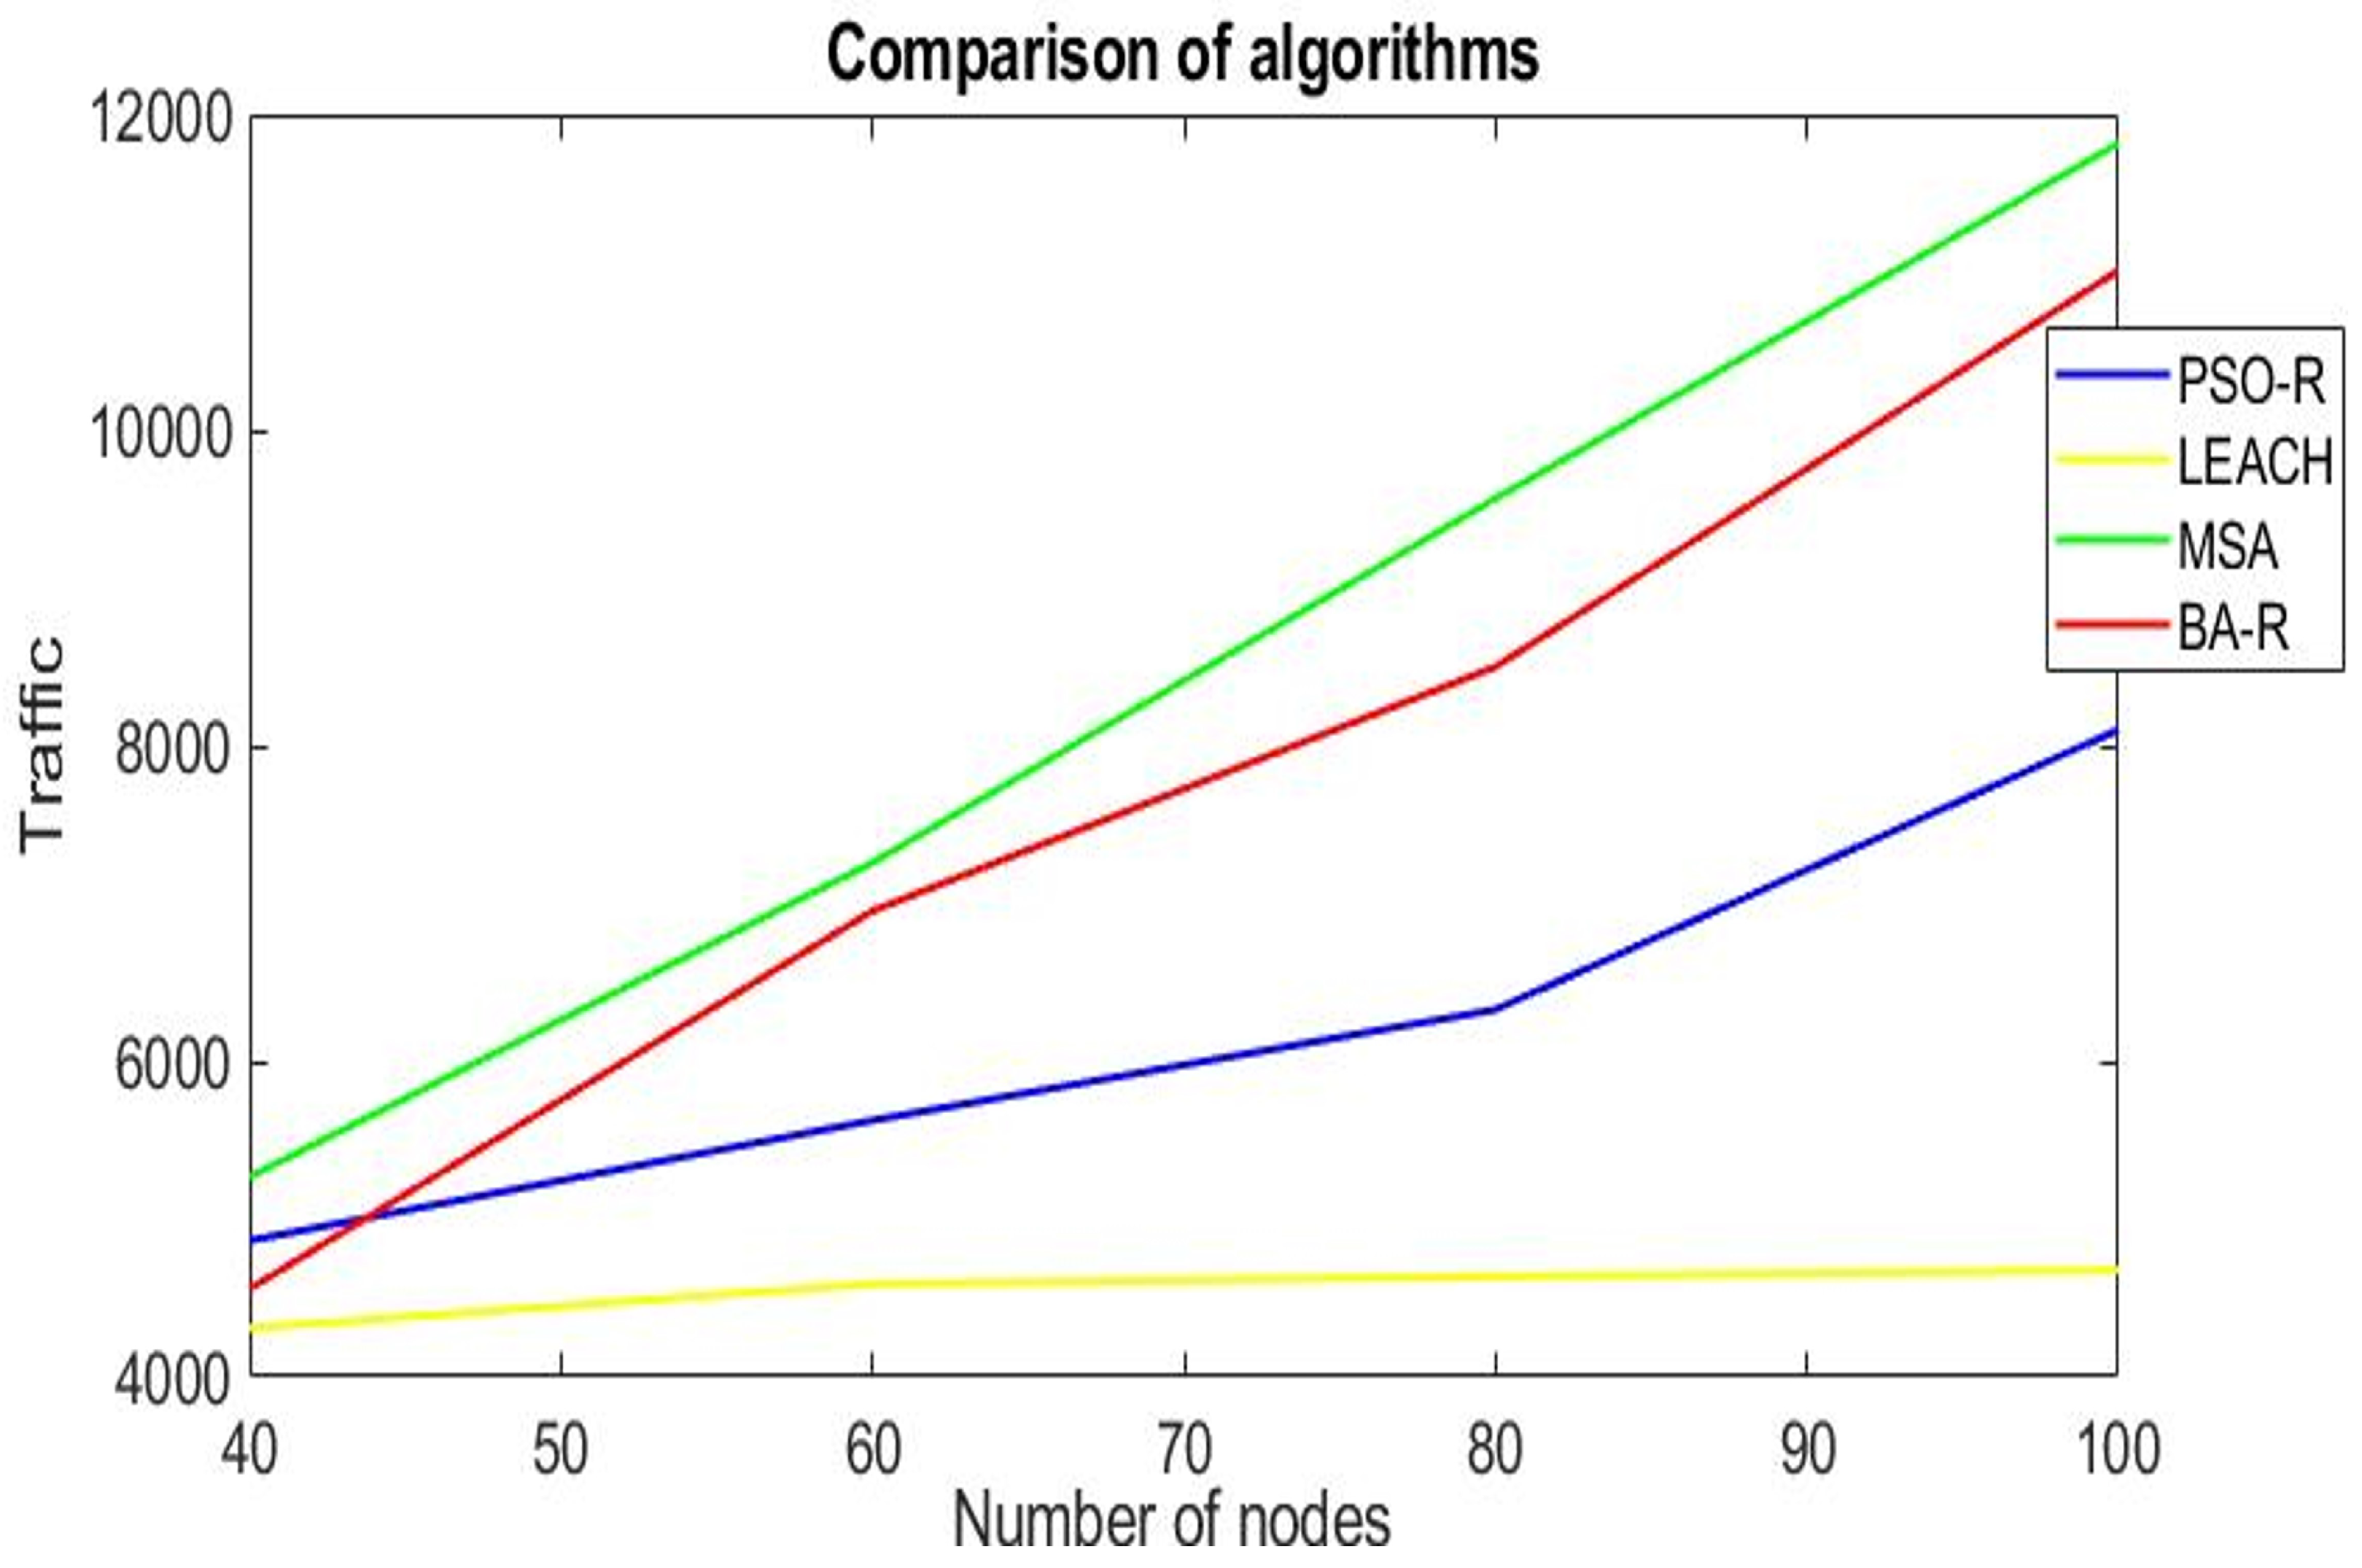
In order to determine which algorithm provides the best performance based on network density, we assess and compare the traffic of the MSA, PSO-R, BA-R, and LEACH algorithms shown in Figure 6. The MSA achieves the highest traffic with 11,817 packets. This means that MSA is the most active algorithm in terms of transmissions. The MSA consistently produces more traffic than the PSO-R, BA-R, and LEACH algorithms, with the gap widening as the number of nodes increases. The BA-R algorithm ranks second with 11,011 packets. The PSO-R algorithm ranks third with 8101 packets. The LEACH algorithm ranks fourth with 4676 packets. Because the MSA keeps its nodes alive longer, the network remains productive for a longer period. With the LEACH algorithm, cluster leaders are randomly selected, which can lead to a greater distance traveled by the nodes and, consequently, a decrease in performance. All three algorithms use clustering, but the MSA appears to better balance the load between cluster heads.
Our algorithm is scalable because it exhibits a stable and predictable execution time, as shown in Table 2. Unlike PSO-R and BA-R, our approach does not suffer from execution-time spikes, ensuring reliable performance even for large sensor networks.

5. Conclusions

In this article, we have put forward a novel algorithm, called the Mosquito Swarm Algorithm (MSA), which has proven to be successful as a routing and optimization tool in wireless sensor networks. Inspired by the host-seeking behavior of mosquito swarms, this algorithm provides a new approach to improve network lifetime. The outcomes of the simulation indicate that the MSA outperforms LEACH, PSO-R (PSO clustering combined with routing) and BA-R (BA clustering combined with routing) algorithms, in terms of performance, energy management, and sensor clustering. Optimizing transmission routes and sensor grouping improves communication efficiency while reducing resource expenditure. In future studies, we will focus on combining other bio-inspired algorithms that are inspired by nature to further increase energy efficiency and improve data routing to cover a wide range of environments. Nevertheless, there is an execution time limitation to our method. In fact, the simulation time grows with the number of nodes, as our scalability research demonstrates. For very large networks, this growth may become a limitation, even though it is still linear and under control. Although this study concentrates on homogeneous dense networks, subsequent research will extend our methodology to more challenging settings, such as sparse deployments with sporadic connectivity and heterogeneous networks with different node capacities.

Author Contributions

Conceptualization, A.A. and N.I.; methodology, A.A. and N.I.; software, A.A.; validation, A.A. and N.I.; writing—original draft preparation, A.A.; writing—review and editing, A.A. and N.I.; supervision, N.I. All authors have read and agreed to the published version of the manuscript.

Funding

This research received no external funding.

Data Availability Statement

The original contributions presented in this study are included in the article.

Conflicts of Interest

The authors declare no conflicts of interest.

References

  1. El Aalaoui, A. Advanced Minimization of Energy Consumption in Wireless Sensor Networks. Ph.D. Thesis, Abdelmalek Essaadi University, Tetouan, Morocco, 2021. [Google Scholar]
  2. Kechar, B. The Problem of Energy Consumption in Wireless Sensor Networks. Ph.D. Thesis, University of Oran, Oran, Algeria, 2010. [Google Scholar]
  3. Singh, A.; Sharma, S.; Singh, J. Nature-Inspired Algorithms for Wireless Sensor Networks: A Comprehensive Survey. Comput. Sci. Rev. 2021, 39, 100342. [Google Scholar] [CrossRef]
  4. Singh, S.; Tyagi, V.; Malik, A.; Kumar, R.; Kumar, N.; Kumar, N. Intelligent Energy-Aware Routing via Protozoa Behavior in IoT-Enabled WSNs. IEEE Trans. Netw. Serv. Manag. 2025, 23, 1960–1969. [Google Scholar]
  5. Agarkar, P.T.; Chawhan, M.D.; Kulat, K.D.; Hajare, P.R. MECT-PSO: A Reliable and Energy Efficient Topology Control Protocol for Wireless Sensor Networks. J. Inf. Sci. Eng. 2023, 39, 885. [Google Scholar]
  6. Chen, F.; Wu, X.; Wang, Z.; Qi, W.; Li, P. A New Ant Colony Optimization-Based Dynamic Path Planning and Energy Optimization Model in Wireless Sensor Networks for Mobile Sink by Using Mixed-Integer Linear Programming. Biomimetics 2026, 11, 44. [Google Scholar] [CrossRef] [PubMed]
  7. Narayan, V.; Faiz, M.; Srivastava, S.; Kumar, V.; Mishra, V.K.; Balyan, V. EE-FGO: Energy-Efficient Fuzzy Grey Wolf Optimization for Cluster Head Selection in WSN. J. Electr. Comput. Eng. 2026, 2026, 1973305. [Google Scholar] [CrossRef]
  8. Zehra, S.S.; Qureshi, R.; Dev, K.; Shahid, S.; Bhatti, N.A. Comparative analysis of bio-inspired algorithms for underwater wireless sensor networks. Wirel. Pers. Commun. 2021, 116, 1311–1323. [Google Scholar]
  9. Mohammed, H.S.; Abdulkareem, O.A.; Ahmad, A.; Dowse, C.S. Optimizing Energy Efficiency in Wireless Sensor Networks: Integrating Bluetooth M-LPN System with ABC Algorithm. Int. J. Eng. Trends Technol. 2024, 72, 85–89. [Google Scholar] [CrossRef]
  10. Feng, X.; Liu, X.; Yu, H. Group mosquito host-seeking algorithm. Appl. Intell. 2016, 44, 665–686. [Google Scholar] [CrossRef]
  11. Papaioannou, C.; Dimara, A.; Papaioannou, A.; Tzitzios, I.; Anagnostopoulos, C.-N.; Krinidis, S. Hierarchical Resources Management System for Internet of Things-Enabled Smart Cities. Sensors 2025, 25, 616. [Google Scholar] [CrossRef] [PubMed]
  12. Sangaiah, A.K.; Sadeghilalimi, M.; Hosseinabadi, A.A.R.; Zhang, W. Energy consumption in point-coverage wireless sensor networks via bat algorithm. IEEE Access 2019, 7, 180258–180269. [Google Scholar] [CrossRef]
  13. Sha’ban, R.; Alkallak, I. Adaptation of a Mosquito Swarm Algorithm to Solve a Binary Knapsack Problem. Al-Rafidain J. Comput. Sci. Math. 2018, 12, 13–24. [Google Scholar] [CrossRef]
  14. Mohajerani, A.; Gharavian, D. An ant colony optimization based routing algorithm for extending network lifetime in wireless sensor networks. Wirel. Netw. 2016, 22, 2637–2647. [Google Scholar] [CrossRef]
  15. Nayak, P.; Kavitha, K.; Khan, N. Cluster head selection in wireless sensor network using bio-inspired algorithm. In Proceedings of the 2019 IEEE Region 10 Conference (TENCON), Kerala, India, 17–20 October 2019; IEEE: Piscataway, NJ, USA, 2019; pp. 1690–1696. [Google Scholar]
Figure 1. Creating clusters using the MSA.
Computers 15 00521 g001
Figure 2. Diagram of the proposed MSA routing algorithm.
Computers 15 00521 g002
Figure 3. Evaluation of the dead nodes produced by the various algorithms.
Computers 15 00521 g003
Figure 4. Analyzing the active nodes generated by the disparate algorithms.
Computers 15 00521 g004
Figure 5. Evaluation of the throughput achieved by the various algorithms.
Computers 15 00521 g005
Figure 6. Evaluation of the traffic achieved by the various algorithms.
Computers 15 00521 g006
Table 1. Settings of the suggested approach.
ParametersValues
Total number of nodes100
Beginning energy1 J
E e l e c 0.05 × ( 10 6 )   J / bit
E f s 1 × ( 10 11 )   J / bit / m 2
E m p 1.3 × ( 10 15 )   J / bit / m 4
E d a 5 × ( 10 9 )   J / bit
Packet size4000 bits
Length of the network100 m
Width of the network100 m
BS location on the X axis50 m
BS location on the Y axis100 m
Table 2. Average execution time (in seconds) for each algorithm.
AlgorithmAverage Time (s)Standard Deviation (±)
MSA2316351
PSO-R432810,234
BA-R619710,339
LEACH14426
Disclaimer/Publisher’s Note: The statements, opinions and data contained in all publications are solely those of the individual author(s) and contributor(s) and not of MDPI and/or the editor(s). MDPI and/or the editor(s) disclaim responsibility for any injury to people or property resulting from any ideas, methods, instructions or products referred to in the content.