Article

A Hybrid Spatio-Temporal Graph Transformer for EEG-Based ADHD Detection via Network Index Modeling


1
Faculty of Information Technology, Department of Information Systems, L. N. Gumilyov Eurasian National University, Astana 010000, Kazakhstan
2
Department of Information Technology, K. Kulazhanov Kazakh University of Technology and Business, Astana 010000, Kazakhstan
3
Department of Information Systems, M. Kh. Dulaty Taraz University, Taraz 080000, Kazakhstan
4
Department of Applied Informatics and Programming, M. Kh. Dulaty Taraz University, Taraz 080000, Kazakhstan
5
Department of Computer Modeling and Information Technology, East Kazakhstan University Named After S.Amanzholov, Ust-Kamenogorsk 070000, Kazakhstan
6
Department of Foreign Languages, Faculty of Philology, L. N. Gumilyov Eurasian National University, Astana 010000, Kazakhstan
7
Institute for Big Data Analytics and Artificial Intelligence (IBDAAI), Universiti Teknologi MARA, Shah Alam 40450, Selangor, Malaysia
*
Authors to whom correspondence should be addressed.
Computers 2026, 15(6), 333; https://doi.org/10.3390/computers15060333
Submission received: 17 April 2026 / Revised: 20 May 2026 / Accepted: 21 May 2026 / Published: 23 May 2026

Abstract

Objective and reproducible diagnosis of attention-deficit/hyperactivity disorder (ADHD) remains challenging because of the limited availability of reliable electroencephalography (EEG) biomarkers and the high variability of neural signals. This study proposes a computational framework for ADHD detection based on dynamic functional connectivity and network-index modeling. Multichannel EEG recordings were transformed into temporal connectivity graphs using sliding-window correlations of band-limited amplitude envelopes. Several network-index models were evaluated, including linear, graph-based, recurrent, and hybrid spatio-temporal approaches. The proposed Hybrid Spatio-Temporal Graph Transformer demonstrated moderate, yet reproducible, subject-level classification performance. On the independent test set, the model achieved an accuracy of 63.16%, a balanced accuracy of 62.22%, a sensitivity of 80.00%, a specificity of 44.44%, an F1-score of 69.57%, and an AUC-ROC of 0.7444. Additional analysis of the derived network index demonstrated moderate intergroup separability, with a mean index shift of 1.16, Cohen’s d = 0.73, Pearson’s r = 0.36, and distribution overlap = 0.72. These findings suggest that the proposed framework captures informative spatio-temporal EEG connectivity patterns associated with ADHD; however, the model’s diagnostic applicability should be considered preliminary and requires validation in larger independent cohorts.

1. Introduction

Attention deficit hyperactivity disorder (ADHD) is one of the most common neurodevelopmental disorders of childhood, with long-term impact on cognitive development, academic achievement, and social adaptation. According to current reviews, the prevalence of ADHD remains stably high in many countries, and early and accurate diagnosis is considered a key factor in the effectiveness of subsequent intervention and support [1,2]. Despite this, existing diagnostic procedures in clinical practice are still largely based on subjective behavioral scales and expert assessment, which limit reproducibility and complicate standardization of decision-making. In recent years, the rapid development of digital health technologies has stimulated growing interest in identifying objective neurophysiological markers of ADHD to complement traditional clinical diagnostic approaches. EEG is particularly important for ADHD assessment because of its non-invasive nature, high temporal resolution, and suitability for pediatric populations [3]. Classical EEG approaches to ADHD have relied primarily on spectral indices and frequency-ratio measures, but their diagnostic robustness and universality remain debated [4]. This has prompted a shift from analyzing individual channels to studying functional connectivity and the brain’s network organization.
The modern paradigm of functional connectivity views the brain as a dynamic network of interacting regions, whose structure and temporal evolution reflect the individual’s cognitive state and neurophysiological characteristics [5]. For neurodevelopmental disorders, including ADHD, dynamic functional connectivity is of particular interest, as pathological conditions are assumed to be accompanied by a decrease in the flexibility of network organization and a limited repertoire of functional brain states [6]. However, discrepancies remain in the literature regarding whether the observed network changes result from primary neurophysiological disturbances or reflect compensatory mechanisms, underscoring the need for a systematic, reproducible analysis. Recent advances in machine learning have enabled the development of EEG-based diagnostic systems for neurodevelopmental disorders, including ADHD, by capturing complex spatiotemporal patterns and functional connectivity in brain activity [7].
In parallel, methods for analyzing temporal and graph data are actively developing in the field of intelligent systems and applied artificial intelligence. Deep neural networks, including recurrent architectures, attention mechanisms, and spatiotemporal graph models, demonstrate high efficiency in processing complex biomedical signals [8,9]. However, much of the existing work on EEG and ADHD focuses either on improving classification accuracy or on highly specialized models, which complicates their integration into feasible diagnostic systems. In particular, the development of compact and interpretable quantitative indicators suitable for practical application remains an open question. From a systems-innovation perspective, the development of integrated state indices that link complex computational models to applied solutions in digital healthcare is significant. Network indices based on functional connectivity are a promising tool for the objective assessment of neurophysiological states; however, their construction from dynamic data and modern spatiotemporal models remains understudied [10,11].
This paper proposes an intelligent systems approach to diagnosing ADHD by analyzing dynamic functional EEG connectivity and constructing a network index using hybrid spatio-temporal models with attention mechanisms. The study aims to demonstrate that accounting for the temporal evolution of network interactions yields more robust and informative diagnostic features than static or aggregated approaches. The main results show that the proposed network index provides a more pronounced and stable distinction between clinical and control groups and can serve as a basis for the development of reproducible computer-supported diagnostic systems. The main contributions of this study are:
  • A novel formulation of ADHD detection as a network index extraction problem.
  • A hybrid spatio-temporal model combining Transformer and GRU for dynamic connectivity analysis.
  • A systematic comparison of static and dynamic network index models.
  • Demonstration of improved separability and generalization on EEG data. The paper is organized as follows. Section 2 reviews existing research devoted to EEG analysis and functional connectivity in ADHD. Section 3 describes the data used, preprocessing procedures, and methods for forming static and dynamic network indices. Section 4 presents the experimental results and their quantitative analysis. Section 5 discusses the systemic and applied aspects of the obtained results for clinical decision support systems, followed by the main conclusions.

2. Related Work

Recent studies have demonstrated the effectiveness of machine learning–based analysis of multimodal behavioral signals for neurodevelopmental disorder detection, including facial and motor dynamics, highlighting the importance of data-driven spatio-temporal representations for biomarker discovery [12]. These findings provide a broader methodological foundation for the development of automated diagnostic approaches and support the use of network-based representations for capturing complex brain dynamics. Research on automated diagnostics of ADHD using electroencephalographic data is actively developing at the intersection of neuroscience, signal processing, and intelligent systems. Modern studies can be roughly grouped according to the level of data presentation and the degree to which their spatiotemporal structure is accounted for. One of the earliest and most widely discussed areas is the use of EEG spectral characteristics. In particular, Snyder and Hall [13] and Arns et al. [14] showed that the theta/beta ratio and power in specific frequency bands can differ significantly between children with ADHD and the control group. However, more recent studies, including a review by Lenartowicz and Loo [15], have identified significant limitations of these indicators, including age dependence, variability in recording conditions, and low reproducibility between samples. As a result, spectral features are increasingly considered insufficient for constructing reliable diagnostic systems.
The next step was to apply functional connectivity and graph-theoretic methods to model the brain as a network of interacting regions. Ghaderi et al. [16] and Wang et al. [17] demonstrated that graph metrics, such as global efficiency and clustering coefficient, can detect differences in the brain network organization in children with ADHD. Similar findings were presented by Ekhlasi et al. [18], who used static EEG correlation matrices to classify clinical conditions. However, these approaches rely on time averaging and do not account for the non-stationary nature of the EEG, thereby limiting their sensitivity to dynamic changes in functional interactions. With the development of machine learning, studies have emerged that focus on automatic feature extraction and classification of EEG signals. Bashivan et al. [19] proposed a recurrent convolutional architecture for learning EEG representations, and Chugh et al. [20] used convolutional neural networks to diagnose ADHD. A review by Alsharif et al. [21] emphasizes that deep models can achieve high accuracy; however, in many cases, they operate as “black boxes” and do not provide formalized quantitative indices suitable for systemic interpretation and clinical integration.
More recent studies have shifted the emphasis to the analysis of dynamic functional connectivity. Luo et al. [22] showed that temporal variability in brain network states is an important marker of neurodevelopmental disorders. Sastry et al. [23] found reduced network flexibility in patients with ADHD, which is interpreted as a limitation of the repertoire of functional states. To model such data, Ricchi et al. [24] and Chen et al. [25] proposed spatiotemporal graph neural networks that account for both the structure of connections and their evolution over time. Despite their high expressiveness, such models often remain computationally complex and difficult to interpret. From the perspective of applied systems innovation, studies aimed at forming integrated network indices are of particular interest. Ekhlasi et al. [26] demonstrated that network metrics can be used as biomarkers for ADHD; however, their approach is primarily based on static characteristics. Bakhtyari and Mirzaei [27] demonstrated the potential of attention mechanisms for analyzing EEG connectivity but did not propose a single index suitable for reproducible use within an intelligent diagnostic system.
An analysis of existing research reveals several key unresolved issues. First, a significant portion of the work is either limited to a static analysis of functional connectivity or uses dynamic models without formalizing the resulting diagnostic metric. Second, many deep architectures focus solely on classification and do not provide systemically interpretable indices suitable for implementation in applied diagnostic platforms. Third, the integration of dynamic connectivity and attention mechanisms within a single, reproducible system solution has been insufficiently explored. The distinctiveness and advantage of our work is that it offers a holistic systems approach combining:
  • A dynamic representation of EEG as sequences of functional graphs;
  • A hybrid spatio-temporal model with attention mechanisms, sensitive to the temporal evolution of network interactions;
  • The formation of an integrated network index suitable for use in intelligent diagnostic systems.
Thus, this work bridges the identified gap between high-dimensional computational models and practice-oriented system solutions and demonstrates the practical advantage of dynamic network indices for objective diagnosis of ADHD.

3. Materials and Methods

3.1. Data Description

This study utilizes an open-source electroencephalographic dataset for studying attention deficit hyperactivity disorder in children, hosted on Kaggle and titled the EEG Dataset for ADHD (https://www.kaggle.com/datasets/danizo/eeg-dataset-for-adhd (accessed on 15 May 2026)). The full implementation of the proposed framework, including EEG preprocessing, dynamic functional connectivity construction, model architecture, training procedures, evaluation scripts, and additional utilities, is publicly available at: https://github.com/Mukhanovaa/EEG_ADHD_Dynamic_Envelope_Connectivity_Hybrid_ST_Graph_Transformer/tree/main (accessed on 15 May 2026). The dataset includes recordings from 121 children, 61 of whom have a clinically confirmed diagnosis of ADHD and 60 who are controls without signs of this disorder. This distribution ensures a close balance between the groups at the subject level and makes the sample suitable for developing and validating classification models. EEG recording was performed in a standard clinical configuration using 19 leads arranged according to the international 10–20 system, including Fp1, Fp2, F3, F4, C3, C4, P3, P4, O1, O2, F7, F8, T7, T8, P7, P8, Fz, Cz, and Pz. This design covers major cortical areas and enables the analysis of both local and interregional patterns of activity and functional connectivity, including the assessment of interhemispheric interactions through midline channels. To provide a more structured description of the dataset and address external validity issues, Table 1 summarizes the key characteristics of the EEG data.
For a more detailed characterization of the dataset composition, Table 2 presents the distribution of the ADHD and control groups at the individual and sample levels.
The dataset was provided in a CSV tabular format (adhd2.csv), where each row corresponded to an EEG time sample containing 19-channel signal values, a binary class label, and a subject identifier. The aggregated dataset included 1,918,628 time samples and was balanced at the sample level between the ADHD and control groups. No missing or invalid values were detected during quality assessment. EEG recordings were obtained during a structured visual counting task, not at rest. Therefore, the analyzed signals reflect neural activity related to attention, visual processing, and cognitive load. Raw EEG amplitudes were represented in arbitrary gain units and subsequently processed using normalization and band-limited connectivity estimation. Extreme values, observed primarily in the frontal channels, were attributed to typical EEG artifacts, such as eye movements and muscle activity. Sequential organization of the recordings enabled segmentation into overlapping windows of fixed length for dynamic functional connectivity analysis. Although the original interchannel correlations were used only for preliminary visualization, all modeling procedures relied on artifact-based connectivity estimation based on the amplitude envelopes of the filtered EEG signals. The resulting connectivity matrices were symmetrized, self-connections were removed, and sequential windows were combined into dynamic connectivity sequences for subsequent network index modeling.
This study used a publicly available, fully anonymized EEG dataset accessible through the Kaggle redistributor. The data is a secondary version of the original dataset published by Nasrabadi, Allahverdi, Samavati, and Mohammadi via IEEE DataPort (DOI: 10.21227/rzfh-zn36). This study did not collect new data from human participants. All analyses were conducted as part of a secondary data analysis using preexisting anonymized recordings. According to the dataset documentation, all recordings were originally collected in accordance with appropriate ethical approval and informed consent procedures. This work uses the dataset solely for research purposes in accordance with standard ethical guidelines for the secondary use of publicly available anonymized data. Although the dataset is presented at the time-step level, all model training and evaluation procedures are performed at the subject level, ensuring that no data from the same subject is present in multiple subsets.

3.2. Data Processing and Splitting

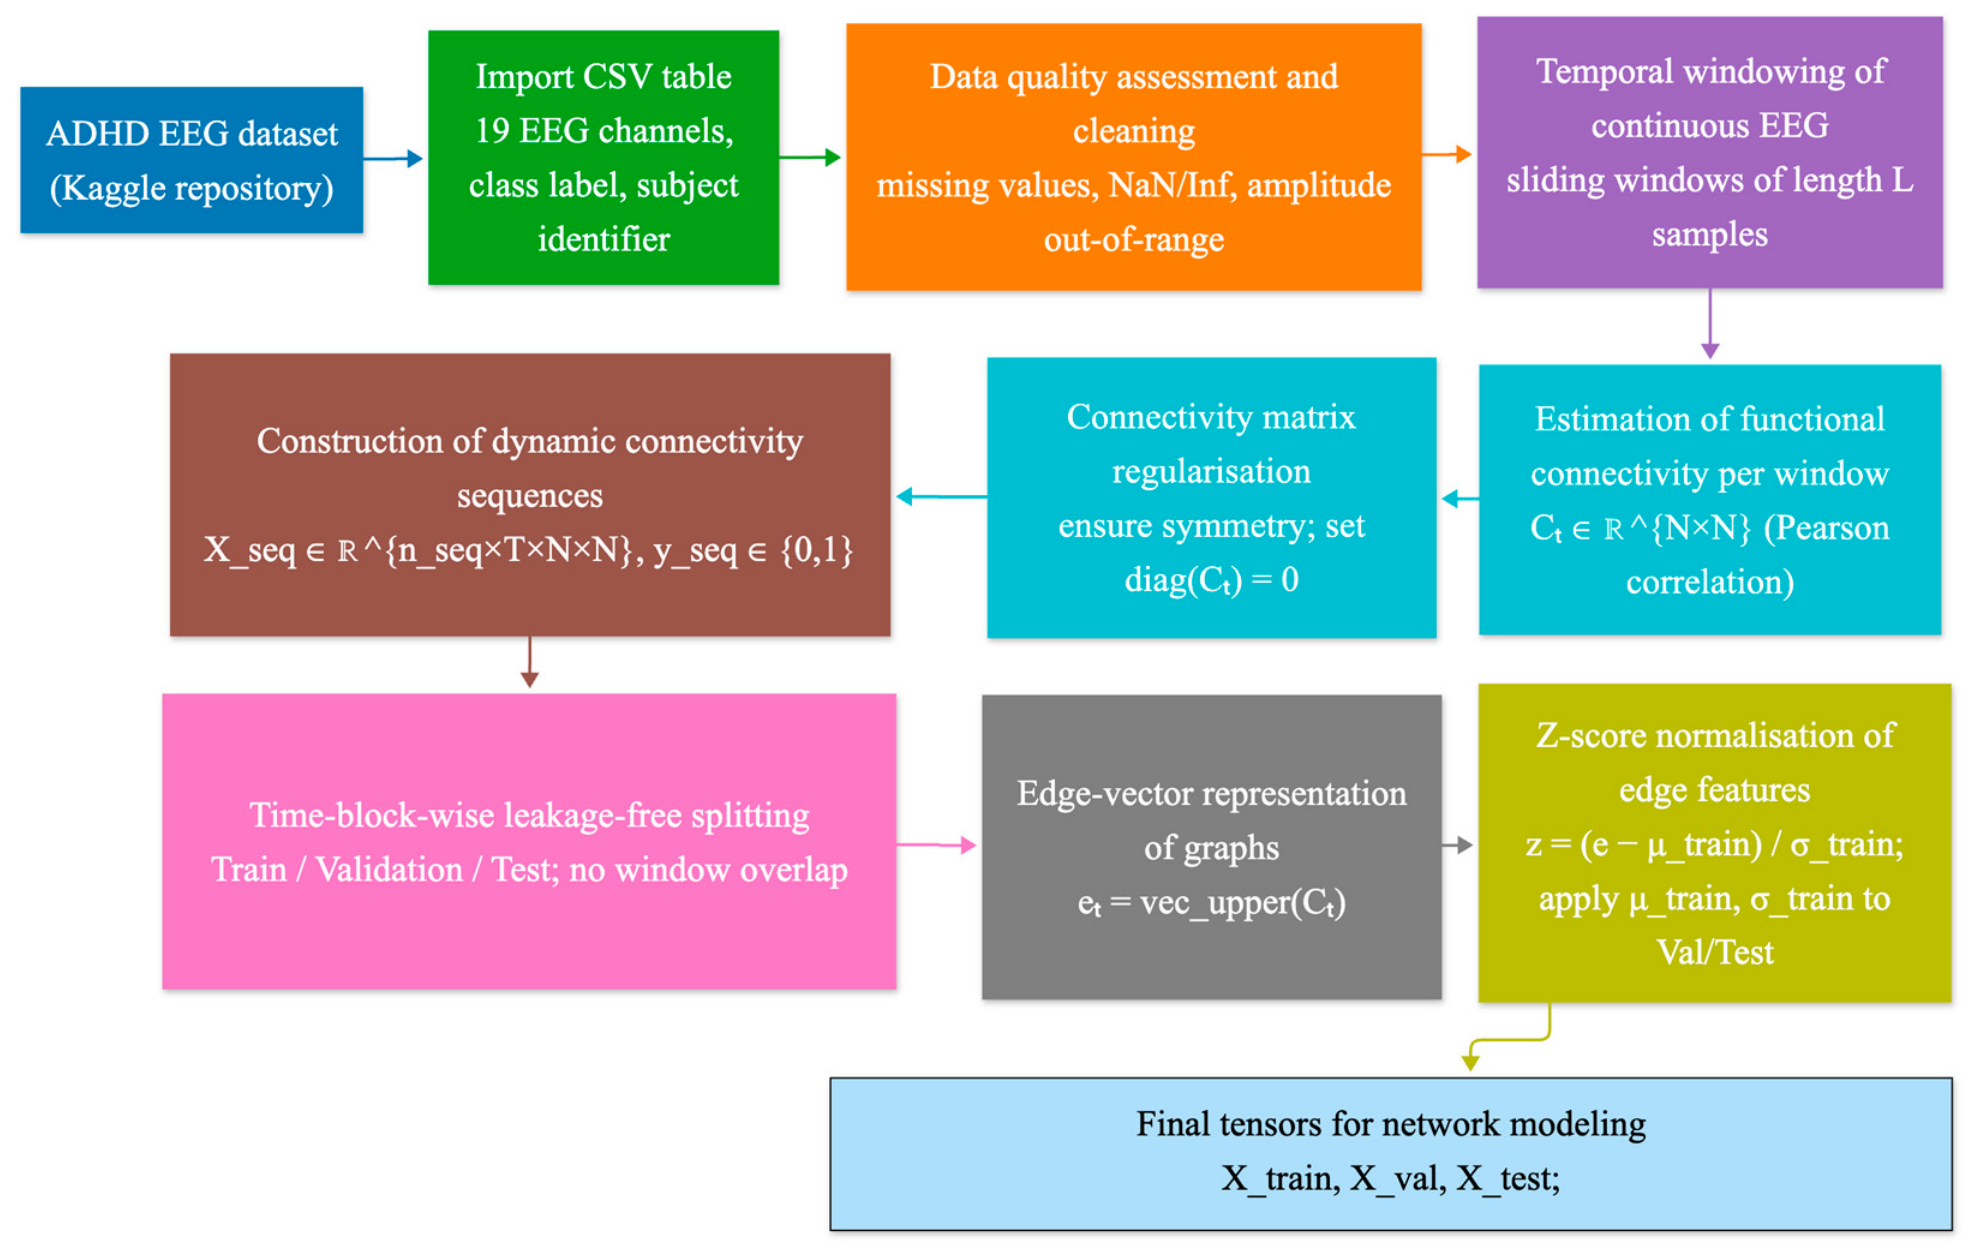
The end-to-end preprocessing workflow, from raw EEG table import to the final dynamic connectivity tensors used for network-index modeling, is summarized in Figure 1. The pipeline consists of (1) data import and validation, (2) window-based segmentation, (3) functional connectivity estimation, (4) sequence construction, and (5) subject-level partitioning into training, validation, and test subsets.
(1) Import and validation. The CSV file is loaded into a fixed schema containing N = 19 EEG channels, a binary class label y { 0,1 } , and a subject identifier when available. The raw observation matrix and labels are defined as (1):
X raw R T tot × N , y raw { 0,1 } T tot
where T tot denotes the total number of samples. The sampling frequency was f s = 128   Hz. Data integrity checks include detection of missing and non-finite values (NaN/Inf) and screening for amplitude outliers using a conservative admissible range a m i n , a m a x ] = [ 1500,1500 . The outlier rate per channel is recorded to characterize signal stability prior to correlation-based connectivity estimation.
(2) Windowing and label homogeneity control. To obtain quasi-stationary segments, the multichannel stream is segmented into overlapping windows of length L = 512 samples with step Δ = 256. For each window starting at sample index τ t = t 1 Δ , the segment is (2):
X t s e g = X r o w [ τ t : τ t + L 1 , : ] R L × N
Because the dataset is provided as a continuous sample table with a class label per row, we enforce label homogeneity to avoid mixed-label windows. Let p ( t ) denote the fraction of the dominant class within window t . Windows are retained only if p t   p m i n win . Each accepted window is assigned a window label y w i n , t by majority voting.
(3) Functional connectivity estimation. For each accepted window, functional connectivity is estimated using Pearson correlation applied to amplitude envelopes of band-pass filtered EEG signals rather than raw amplitudes. The connectivity matrix is then defined as (3):
C t = c o r r c o e f ( X t s e g ) R N × N
The diagonal is set to zero to remove self-connections, and the matrix is treated as a weighted undirected graph representation of functional coupling. For graph-metric modeling, a thresholded adjacency matrix is additionally formed using θ = 0.4 is formed (4):
A t ( i , j ) =   C t c ( i , j ) , i j ,   C t ( i , j ) θ , 0 , i j ,   C t ( i , j ) < θ
where C t i , j   denotes the correlation coefficient between the amplitude envelopes of EEG channels i and j within time window t , θ represents the predefined edge-retention threshold, and A t i , j   corresponds to an element of the weighted adjacency matrix of the dynamic EEG connectivity graph. A value of A t i , j = 0 indicates that the corresponding edge is not retained in the thresholded graph representation, either because i = j (self-connection) or because the estimated connectivity strength does not exceed the threshold θ . Accordingly, zero values in A t should not be interpreted as evidence of a complete absence of physiological interaction between the corresponding brain regions.
(4) Sequence construction for dynamic modeling. Dynamic functional connectivity is represented by fixed-length sequences of consecutive window graphs. Using sequence length T = 10 windows and stride S = 5 , each candidate sequence starting at window k is defined by indices I k = k , , k + T 1 . To ensure consistent supervision, only sequences with complete label consistency are retained, using p m i n win = 1.0 (all windows share the same label). The resulting tensor and labels are (5):
X seq R n seg × T × N × N ,   y seq 0,1 n seg  
(5) Edge-vector representation and standardization. For models operating on vector inputs (linear baselines and attention-based encoders), each connectivity matrix is mapped to an edge vector by extracting the upper triangular entries (6):
  e t = v e c u p p e r A t R M , M = N ( N 1 ) 2 = 171
All edge features are standardized using z-score normalization based only on training-set statistics (7):
z = ( e   μ train ) σ train
where e denotes the edge-feature vector extracted from the upper triangular elements of the connectivity matrix, while μ train and σ train represent the mean and standard deviation computed exclusively from the training-set features. The same normalization parameters were subsequently applied to the validation and test subsets to prevent information leakage.
(6) Subject-level partitioning and leakage prevention. To ensure clinically valid evaluation and eliminate data leakage, the dataset was split at the subject level based on unique subject identifiers. Each subject was assigned to exactly one subset—training, validation, or test-so that no subject contributed data to more than one split.
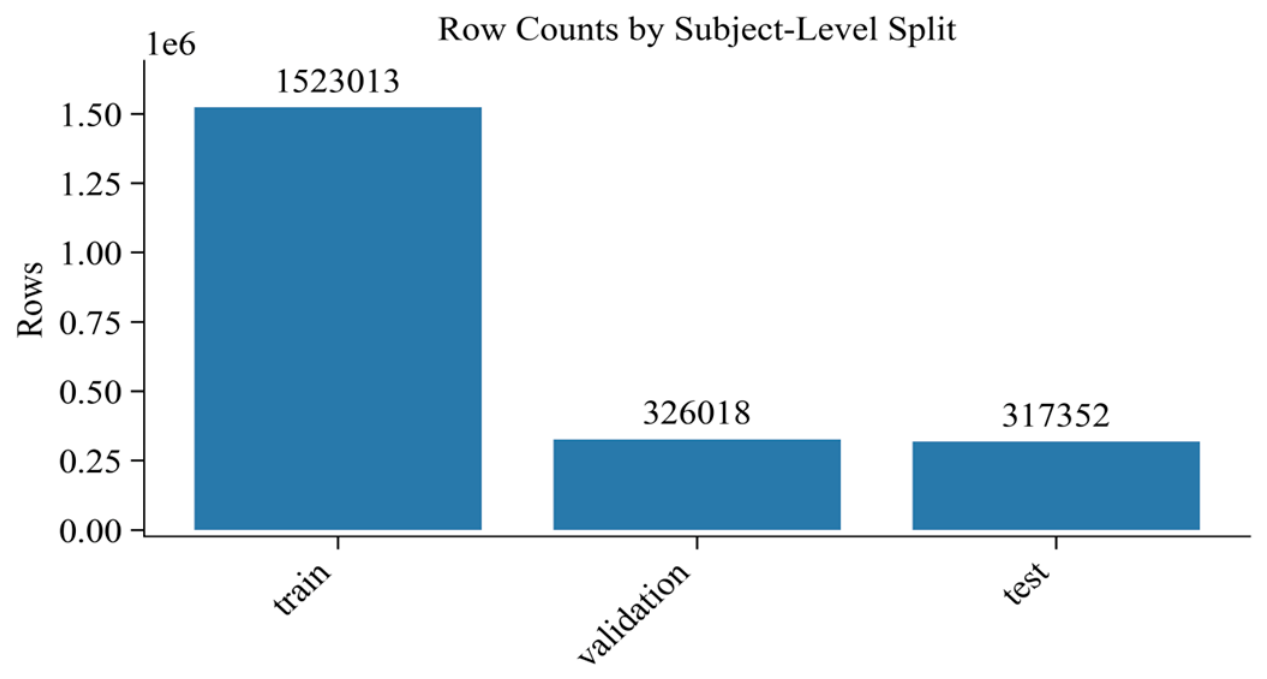
The dataset was divided at the subject level into training (84 subjects), validation (18 subjects), and test (19 subjects) groups, maintaining roughly balanced distributions of participants with ADHD and controls. No overlap was observed between the subject subgroups, confirming a rigorous leakage assessment. Window segmentation and sequence generation were performed independently for each subgroup to ensure that all EEG windows from a given subject remained in the same subgroup. Raw Pearson correlations calculated directly from EEG amplitudes were used only for descriptive analysis. At the same time, all modeling procedures and network index construction were based on connectivity estimated from band-limited amplitude envelopes. This ensured that the final structure relied on physiologically meaningful oscillatory interactions rather than noise-sensitive raw amplitude correlations. Figure 2 shows the distribution of EEG samples across training, validation, and test subgroups.
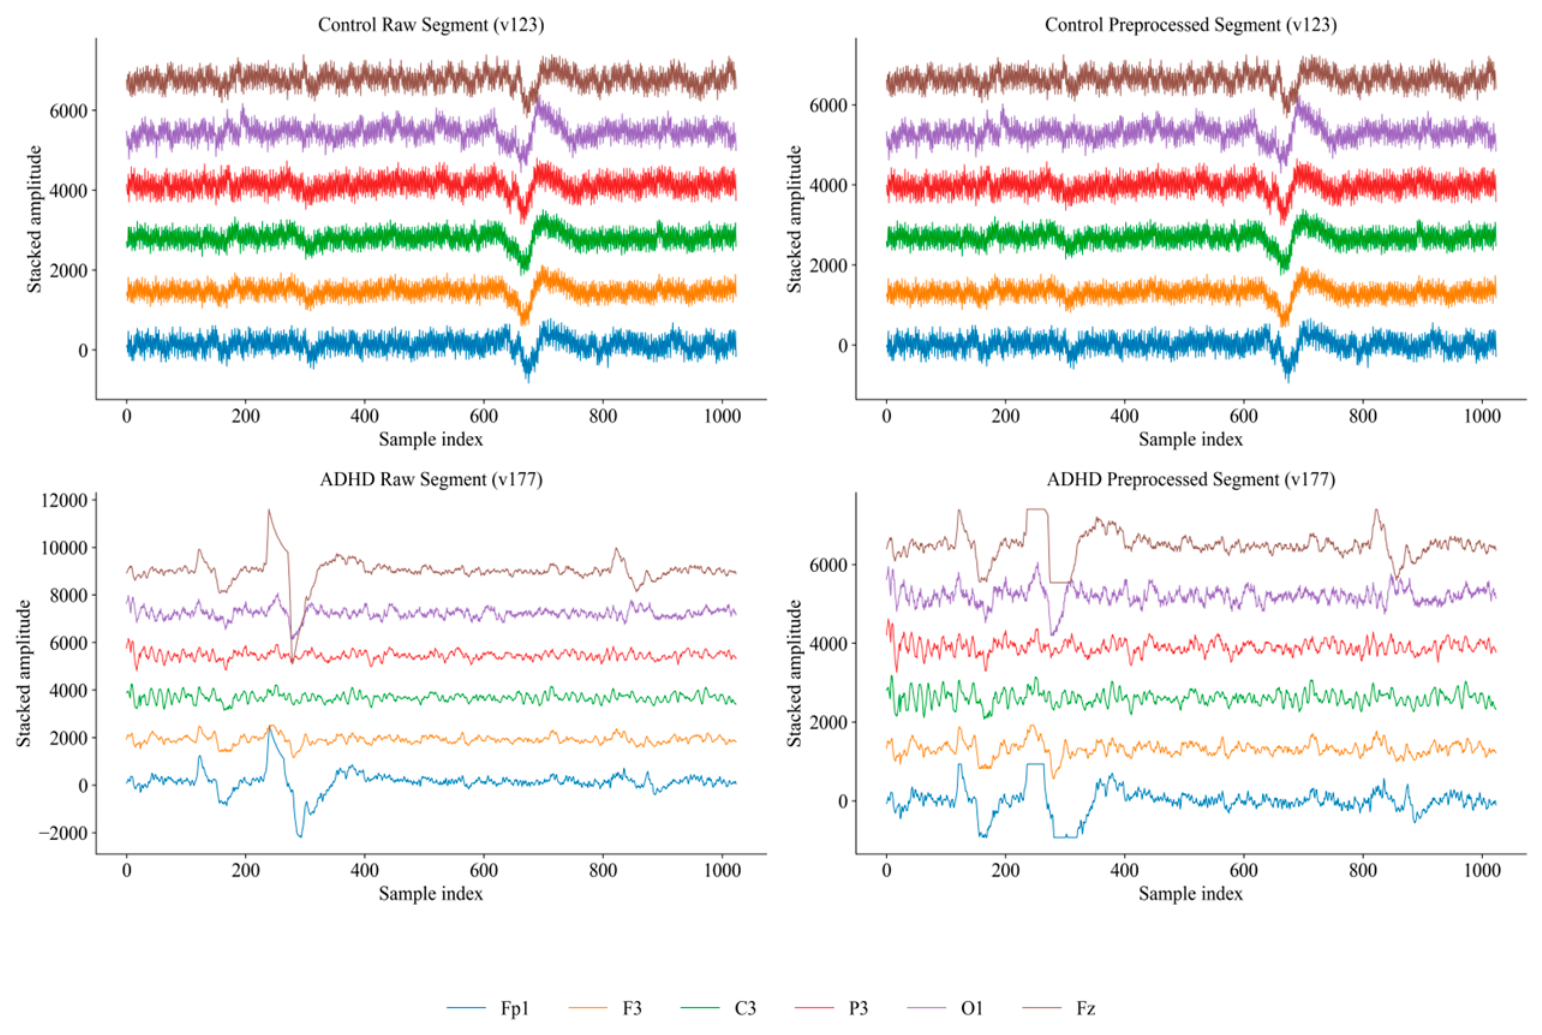
This assignment ensures that no subject appears in more than one partition, preventing subject-level data leakage. To ensure physiologically meaningful connectivity assessment and reduce EEG artifacts, an artifact-aware, frequency-specific preprocessing pipeline was implemented. Signal drift and nonphysiological peaks were removed using trend removal and median-based trimming (±6 MAD). Theta (4–8 Hz) and beta (13–30 Hz) oscillatory components were then bandpass filtered. Functional connectivity was subsequently calculated using amplitude-envelope correlations derived from the Hilbert transform rather than raw EEG amplitudes, enabling a more robust frequency-specific analysis of neural interactions. Examples of raw and processed EEG signals for controls and ADHD subjects are shown in Figure 3. An additional example of raw multichannel EEG amplitudes illustrating non-stationary behavior and high-amplitude artifacts is provided in Supplementary Figure S4.
To ensure physiologically meaningful connectivity estimation and reduce the impact of artifacts, an artifact-aware preprocessing pipeline was applied, including trend removal, robust amplitude limiting, bandpass filtering in the theta and beta frequency bands, Hilbert amplitude envelope extraction, and connectivity estimation using windowing. The full preprocessing algorithm and parameter configuration are presented in Supplementary Table S1.
This limitation is common to publicly available EEG datasets used for secondary analysis. Accordingly, the proposed pipeline should be considered an artifact-aware secondary analysis framework rather than a full-fledged clinical preprocessing protocol. However, the combination of baseline correction, robust artifact suppression, bandpass filtering, and envelope-based connectivity estimation helps ensure that the extracted functional connectivity patterns reflect meaningful neural dynamics rather than spurious correlations. Processing parameters were chosen empirically to balance temporal and frequency resolution with data availability. The final configuration used windows of 512 samples (4.0 s) with 50% overlap, a sequence length of 10 windows, and a graph threshold of 0.40, ensuring a stable connectivity representation and moderate graph density. The full set of preprocessing and model parameters is presented in Table 3.

3.3. Baseline Network Index Models

To systematically evaluate the diagnostic relevance of dynamic EEG functional connectivity, we investigate a set of learning models designed to extract a scalar network index from time-resolved brain connectivity sequences. Instead of treating the problem exclusively as a binary classification problem, the proposed framework aims to learn a continuous index that reflects the severity of ADHD-related network alterations and enables both statistical group-level comparisons and threshold-based decision support. The considered models range from simple linear baselines operating on time-averaged connectivity to spatiotemporal deep architectures that explicitly capture temporal evolution and graph topology. This hierarchical evaluation allows quantifying the contribution of sparsity, global graph metrics, recurrent temporal modeling, graph convolution, and attention mechanisms in constructing robust connectivity-driven indices. Each EEG recording is represented as a sequence of functional connectivity matrices computed over sliding windows. The dynamic input sample is defined as (8):
X i = { A t i } t = 1 T , A t i R N × N
where N denotes the number of EEG channels and T is the number of windows in the sequence.
The objective is to learn a parametric mapping (9):
f θ : X i s i R
where s i   is a scalar network index and θ denotes the parameters of the selected model. The binary label y i { 0,1 } (0: control, 1: ADHD) is used as supervision such that the learned index ranks sequences according to the presence of ADHD-related connectivity patterns. For optimization, the index is interpreted as the logit of the ADHD probability, as defined in (10):
p θ ( y i = 1 X i ) = σ ( s i ) = 1 1 + e x p ( s i )
and model parameters are estimated by minimizing the binary cross-entropy loss. In the subsequent analysis, the output s i is treated as a continuous biomarker candidate that can be statistically compared across groups and interpreted as an indicator of altered brain network organization.
Linear Network Index (Linear_network_index). The first baseline collapses dynamic information into a static representation by averaging connectivity matrices across time, as formulated in (11):
A ˉ i = 1 T t = 1 T A t i
The resulting matrix is vectorized by extracting the upper triangular elements excluding the diagonal, yielding the feature vector in (12):
x i = v e c triu ( A ˉ i ) R M , M = N ( N 1 ) 2
A logistic regression model with L 2 -regularization is trained on x i , producing the index s i = w x i + b . This model provides a transparent baseline where each edge contributes linearly to the final index; however, it does not account for temporal variability and dynamic transitions of connectivity patterns.
Sparse Linear Network Index. To obtain a compact and interpretable index, a sparse linear model is constructed using the same feature vector x i in (12) but enforcing L 1 -regularization. The optimization problem is given by (13):
θ ^ = a r g   m i n w , b [ L ( w , b ) + λ w 1 ]
where L ( w , b ) denotes the binary cross-entropy loss and λ controls sparsity.
The resulting network index is defined in (14):
s i = k = 1 M w k x k i + b
This formulation forces the model to select a limited subset of discriminative functional edges, supporting biomarker discovery and facilitating neurophysiological interpretation.
Topological Network Index (Global_graph_metric_network_index). To move from edge-level representation to global network characterization, each connectivity matrix A t i in (8) is treated as a weighted graph G t i .   For each time step, global measures are computed, including average node strength ktk_tkt, clustering coefficient C t , and global efficiency E t . These measures quantify complementary aspects of network segregation and integration. To summarize temporal variability, the mean and standard deviation of each metric are computed across the sequence. The final topological feature vector is defined as (15):
z i = [ μ k , σ k , μ C , σ C , μ E , σ E ] R 6
A logistic regression model is then trained on z i to produce the index s i . This approach yields a low-dimensional and interpretable indicator describing whether the brain network exhibits reduced integration or abnormal modularity.
Dynamic Recurrent Index (RNN_dynamic_connectivity_index). To explicitly capture temporal dependencies, a recurrent index model is constructed. Each connectivity matrix A t i is transformed into an edge vector, as given in (16):
e t i = v e c triu A t i R M
forming a sequence { e t i } t = 1 T . A gated recurrent unit (GRU) network is trained to encode the temporal evolution, producing the network index as defined in (17):
h t = G R U ( e t , h t 1 ) , s i = w h T + b
In contrast to static averaging, this model allows the index to depend on temporal trajectories of connectivity states and provides a compact representation of evolving brain network organization.
Static Graph Convolutional Network Index (Static_GCN_brain_network_index). Graph convolutional modeling is applied to incorporate topological structure directly into the index construction. The averaged connectivity matrix A ~ from (11) is used as an adjacency representation. After preprocessing, the normalized adjacency matrix is computed as (18):
A ^ = D 1 2 ( A ~ + I ) D 1 2
where A ~ denotes the processed adjacency matrix, I is the identity matrix, and D is the degree matrix. Two graph convolutional layers are then applied as shown in (19):
H 1 = σ ( A ^ X W 0 ) , H 2 = σ ( A ^ H 1 W 1 )
where X denotes node features and σ   ( ) is a nonlinear activation. Global average pooling produces a graph embedding vector g i , which is mapped to the scalar index s i . This model captures local graph neighborhoods and connectivity topology, but remains temporally static.
Spatio-Temporal GCN Index (Spatio_temporal_GCN_brain_network_index). To jointly model temporal evolution and spatial graph structure, a spatio-temporal GCN index is constructed. Each connectivity matrix A t i is processed by a GCN block producing an embedding vector g t . The resulting embedding sequence is aggregated using a GRU encoder, producing the index as defined in (20):
h t = G R U ( g t , h t 1 ) , s i = w h T + b
This formulation provides a temporally aware index that summarizes how global spatial connectivity patterns evolve over time.

3.4. A Proposed Hybrid Multihead Spatio-Temporal Graph Transformer Index

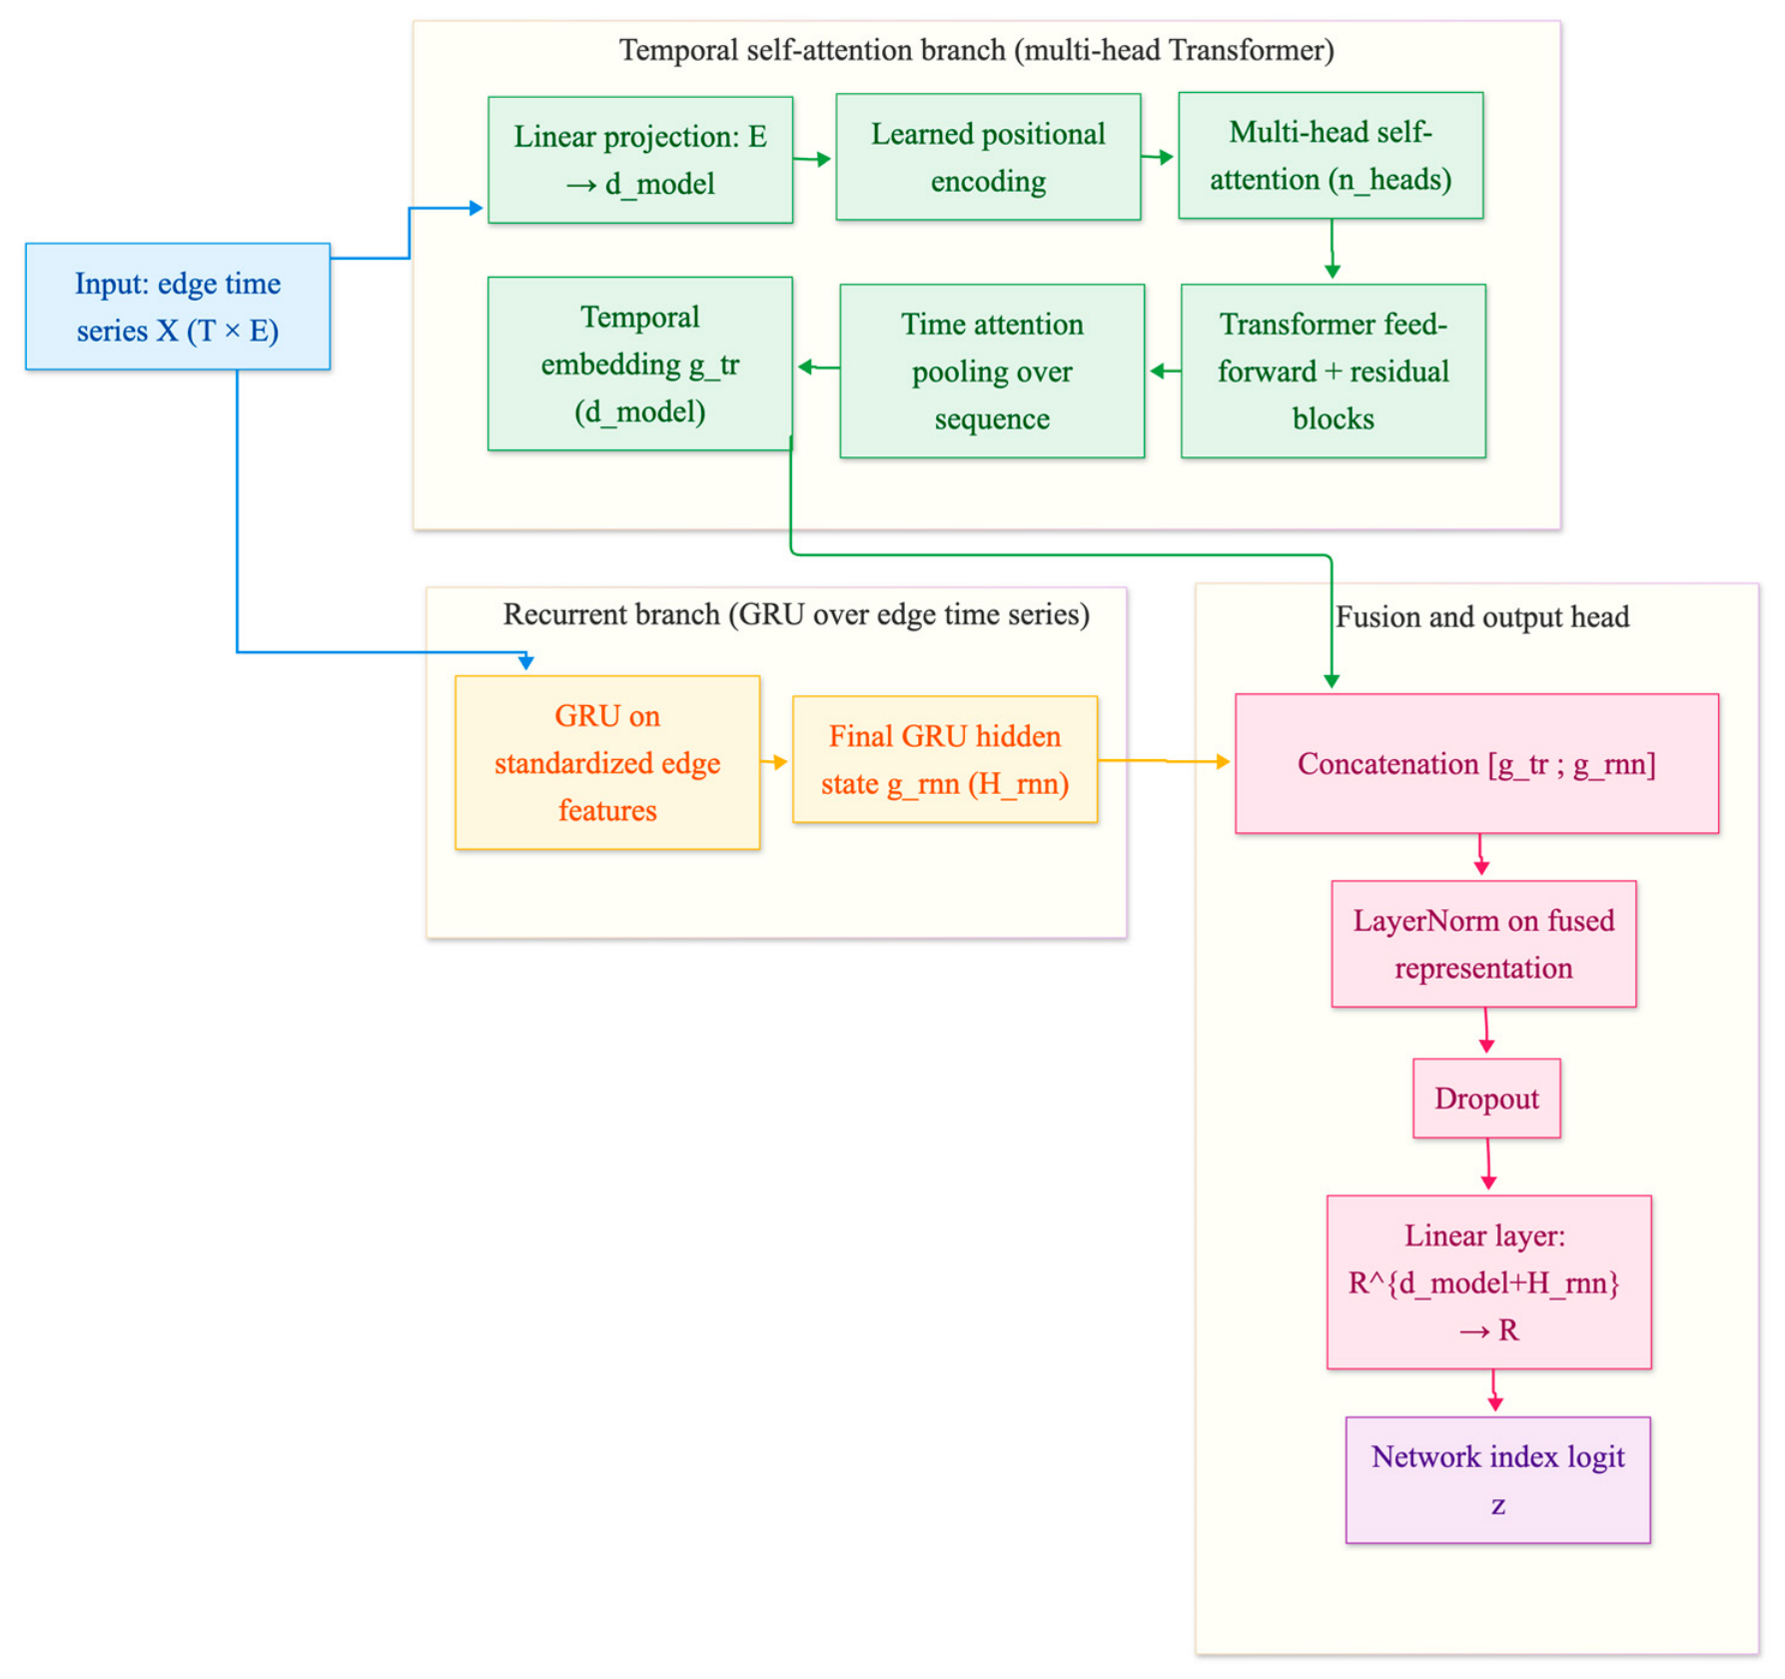
The central contribution of this work is the design and validation of a hybrid deep learning architecture aimed at extracting a quantitative network index from dynamic EEG functional connectivity. Unlike conventional ADHD detection pipelines that primarily focus on discrete classification outcomes, the proposed model is explicitly formulated to produce a continuous scalar index reflecting the degree of deviation in brain network organization. This index-oriented formulation supports both subject-level discrimination and subsequent interpretability analysis in terms of functional network dynamics. As illustrated in Figure 4, the model operates on temporal sequences of functional connectivity graphs derived from sliding-window EEG segments.
Each connectivity matrix is transformed into an edge-based representation by vectorizing the upper triangular part, yielding a compact sequence of edge-weight vectors. Therefore, the input sample is represented as a matrix X t s e g = E R T × M , where T denotes the number of time windows and M = N ( N 1 ) 2 is the number of unique undirected connections between EEG channels. This formulation shifts the modeling emphasis from raw electrophysiological waveforms to the evolution of interregional functional coupling, which is consistent with the objective of deriving a stable connectivity-driven ADHD network index. The proposed hybrid model integrates two complementary processing streams. The first stream is based on a transformer encoder and is designed to capture global temporal dependencies using multi-head self-attention.
Each connection vector was projected into the latent embedding space and augmented with a learnable positional encoding to preserve temporal order. The transformer branch processed the resulting sequence using multi-head attention and feedforward layers, allowing for the modeling of long-term temporal dependencies and distributed patterns of network reconfiguration associated with ADHD. The transformer output was aggregated into a compact representation g t r using attention-based pooling. In parallel, a GRU-based recurrent branch modeled local sequential dynamics and short-term connectivity transitions, creating the embedding   g r n m . The outputs of both branches were combined using concatenation, normalization, and dropout regularization, after which the prediction layer generated a scalar network index, interpreted as a continuous marker of altered dynamic functional connectivity. Overall, the proposed hybrid spatiotemporal graph transformer combines global attention-based temporal modeling with recurrent sequential coding, providing a compact and interpretable representation of EEG connectivity dynamics for ADHD-related pattern analysis.

4. Results

4.1. Descriptive Statistics and Quality Control of EEG Data

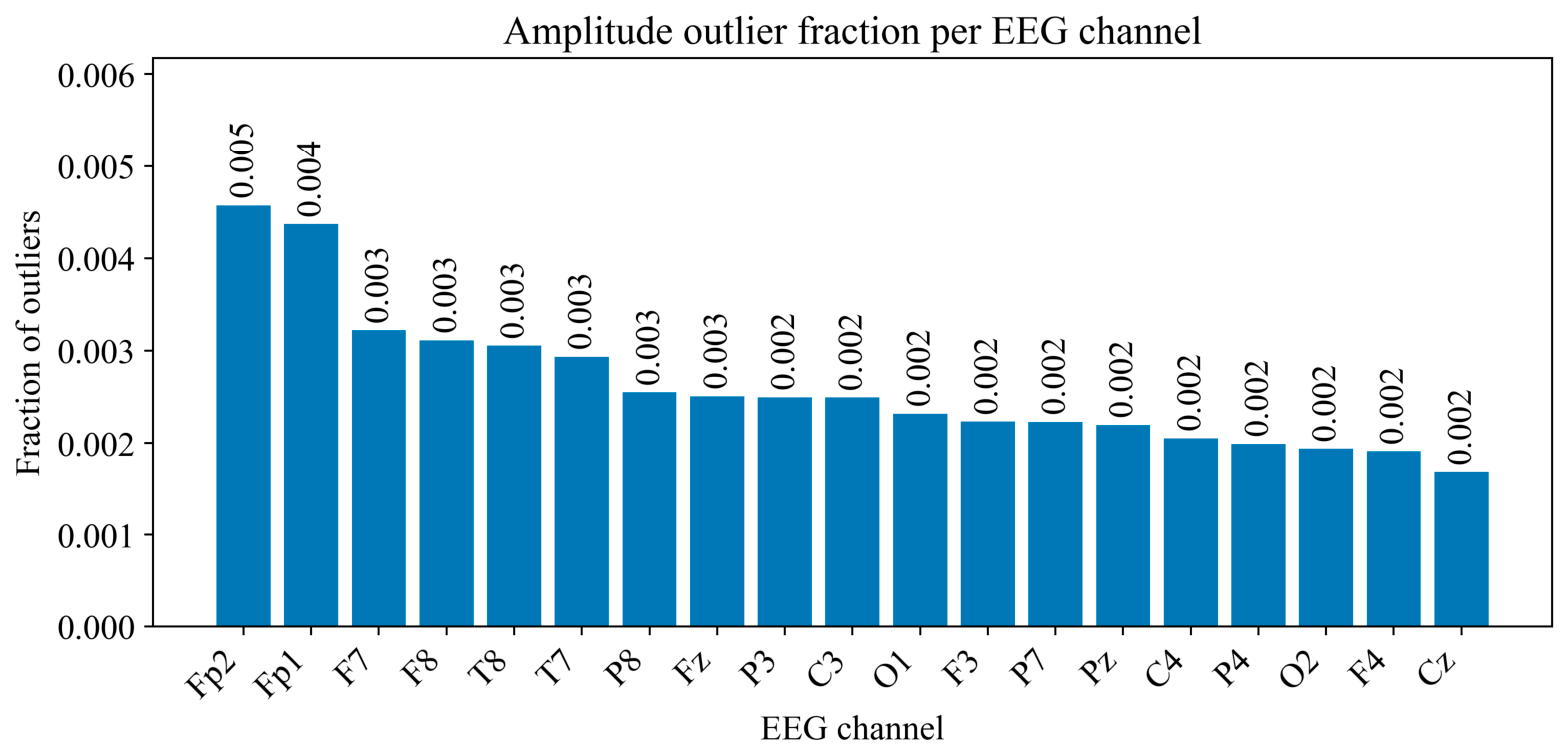
This section presents a primary empirical analysis of raw EEG data, aimed at assessing recording quality and identifying basic statistical patterns necessary for subsequent construction of connectivity and network indices. The proportions of amplitude spikes per lead, intergroup differences in mean amplitudes, and the structure of interchannel correlations are examined both for the combined sample and separately for the control and clinical groups. Additionally, nodal characteristics of channel inclusion in the functional network and spatial profiles of connectivity changes between groups are analyzed, allowing us to identify potentially informative areas and justify the choice of further modeling methods. Figure 5 shows the distribution of the relative proportion of amplitude spikes (frac_outliers) for each of the 19 EEG channels. The abscissa axis shows the electrode names in the 10–20 system, and the ordinate axis shows the proportion of readings outside the specified acceptable amplitude range. It can be seen that the maximum values of frac_outliers are observed in the frontal leads Fp2 and Fp1 (about 0.005), whereas for the central and occipital channels (e.g., Cz, O2, P4) the proportion of outliers does not exceed ≈ 0.002.
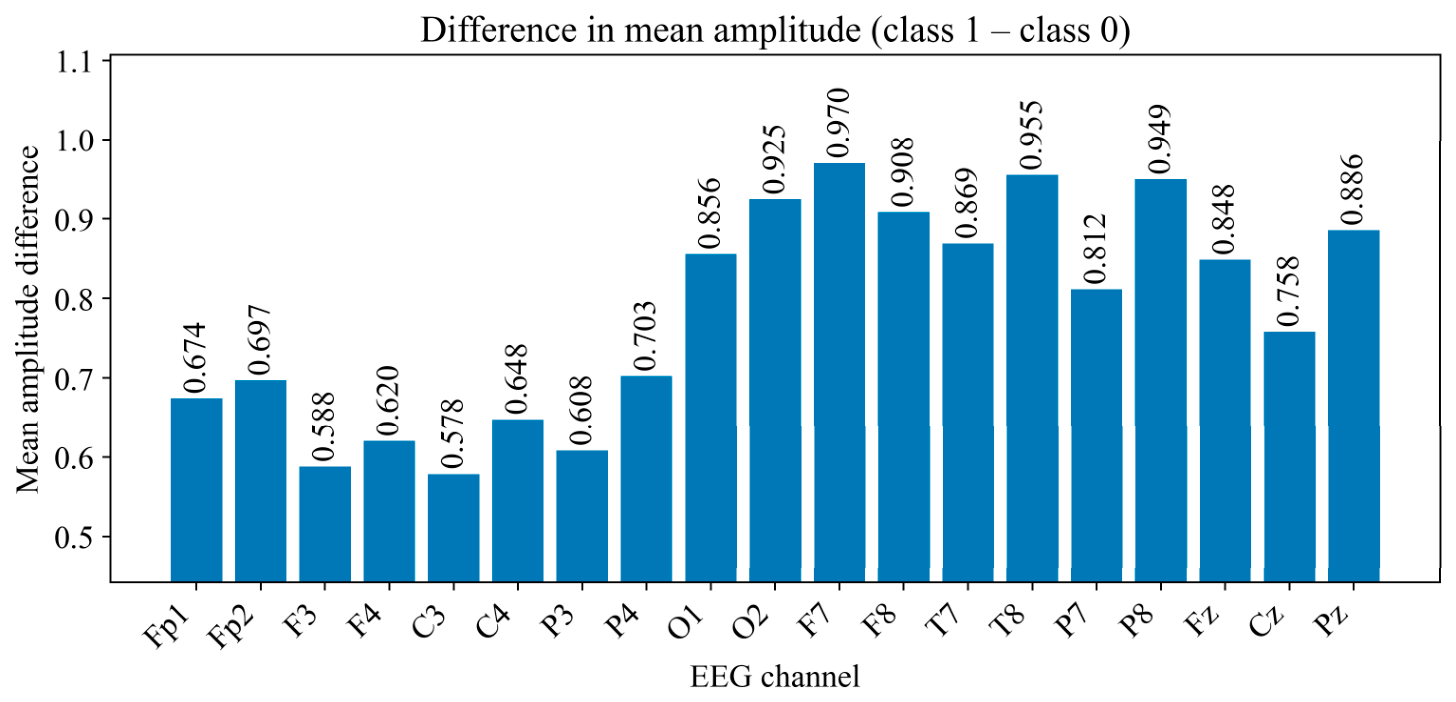
The raw EEG segment exhibits non-stationary behavior with visible high-amplitude fluctuations, including peaks exceeding ±3000 arbitrary units. These patterns are consistent with typical EEG artifacts such as eye movements and muscle activity, particularly in frontal channels. These data properties provide a rationale for applying consistent preprocessing thresholds across all EEG channels in the subsequent analysis. Figure 6 shows the spatial structure of the average amplitude difference μ class   1 μ class   0 for each EEG channel. All Δ μ values are positive, indicating a global increase in the average signal amplitudes in class 1 compared to class 0. The most pronounced differences are observed in the posterior parietal and temporal leads (O2, P8, T8, F7), where Δ μ approaches unity in normalized units, while in the central regions (C3, C4, Cz) the differences are less pronounced. The frontal channels (Fp1, Fp2, F3, F4, Fz) demonstrate a moderate but consistent increase in amplitude. This topography indicates a heterogeneous pattern of interclass differences and confirms the presence of spatially specific zones that are potentially most informative for the subsequent construction of connectivity and network indices based on EEG data.
Table 4 summarizes the ranked EEG channels based on the combined effect size. The strongest effects are observed in posterior and parietotemporal regions, with O1 (0.9799) and P7 (0.9265) showing the highest combined scores, driven by substantial negative contributions from both theta/beta ratio and connectivity measures. High values are also noted in Fp1 (0.8863) and P3 (0.7917), indicating consistent involvement of frontopolar and parietal areas. In contrast, central channels such as C3 (0.5330), C4 (0.3928), and Cz (0.3666) exhibit lower combined scores, reflecting weaker connectivity-related effects. Some channels (e.g., P4, Cz) show divergence between spectral and connectivity components, suggesting heterogeneous or compensatory mechanisms.
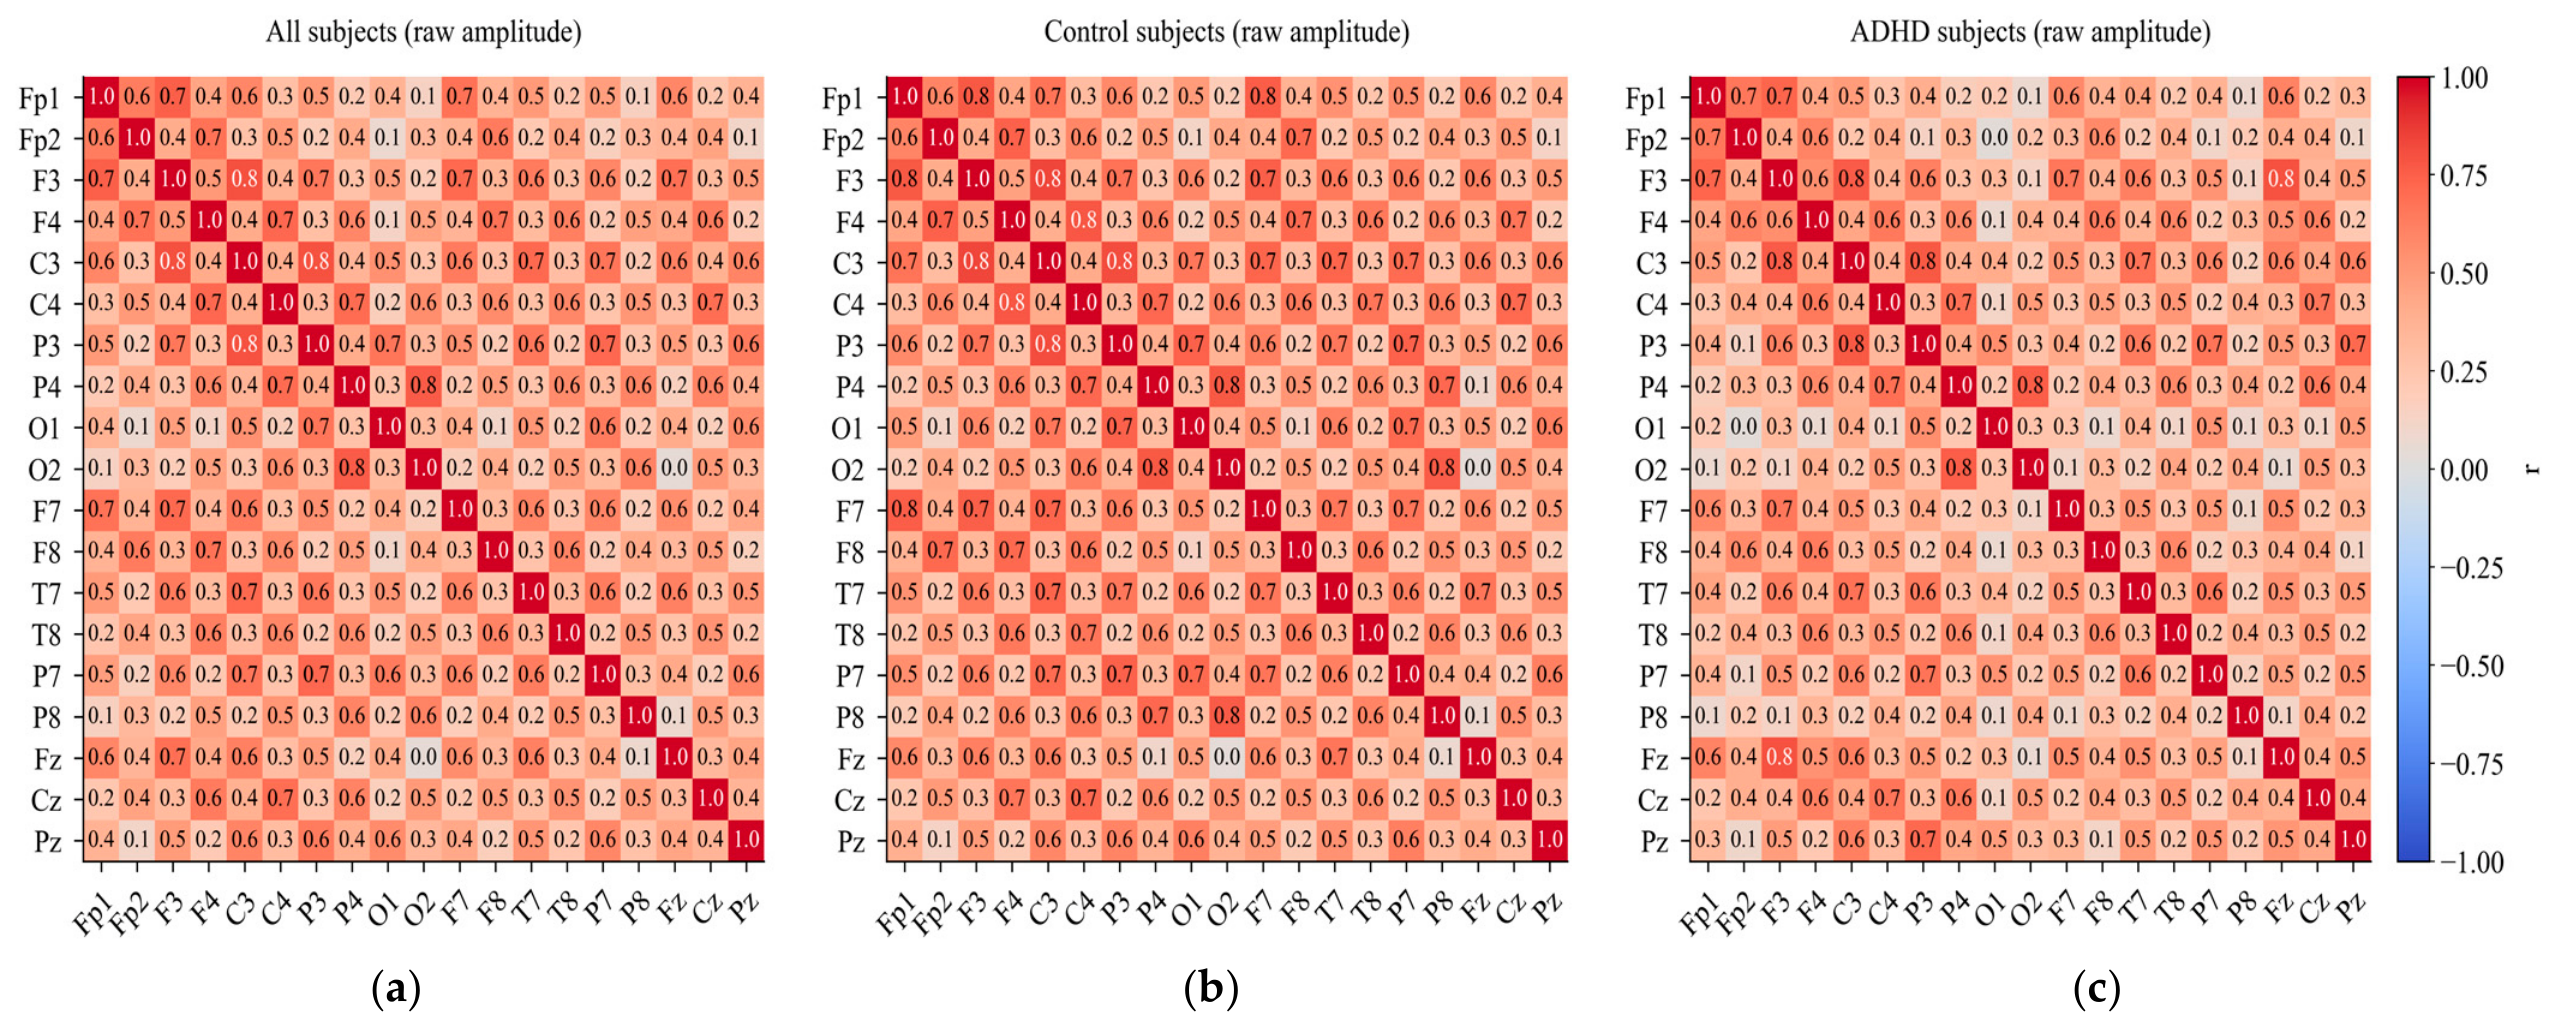
Figure 7 presents a comparison of three panels of Pearson interchannel correlation matrices calculated from raw EEG amplitudes for the entire sample, the control group, and the ADHD group. Panel (a) provides a baseline characterization of the global interchannel dependence structure for all subjects. In contrast, panels (b) and (c) show the corresponding group correlation patterns for the control group and subjects with ADHD. All panels show predominantly positive correlations, and relatively stronger associations are observed between anatomically or spatially close electrode pairs.
Such increased correlations should be interpreted with caution, as they may partly reflect spatial proximity, volume conduction, and signal leakage effects inherent in scalp EEG recordings. However, the ADHD group exhibits a more heterogeneous correlation pattern, with localized differences in frontocentral, frontotemporal, and posterior regions compared to the control group. Accordingly, raw amplitude correlation matrices are considered preliminary descriptive representations of the global interchannel dependence structure, rather than direct measurements of neural connectivity. All subsequent modeling procedures were based on the limited bandwidth of the preprocessed amplitude-envelope coupling. Further exploratory analysis of the mean interchannel EEG correlation profiles across all channels is presented in Supplementary Figure S1. Additional exploratory analysis of intergroup differences in interchannel correlations based on raw EEG amplitudes is presented in Supplementary Figure S2. Supplementary Figure S3 presents the leading eigenvector profiles of the interchannel correlation matrices for the control and ADHD groups.
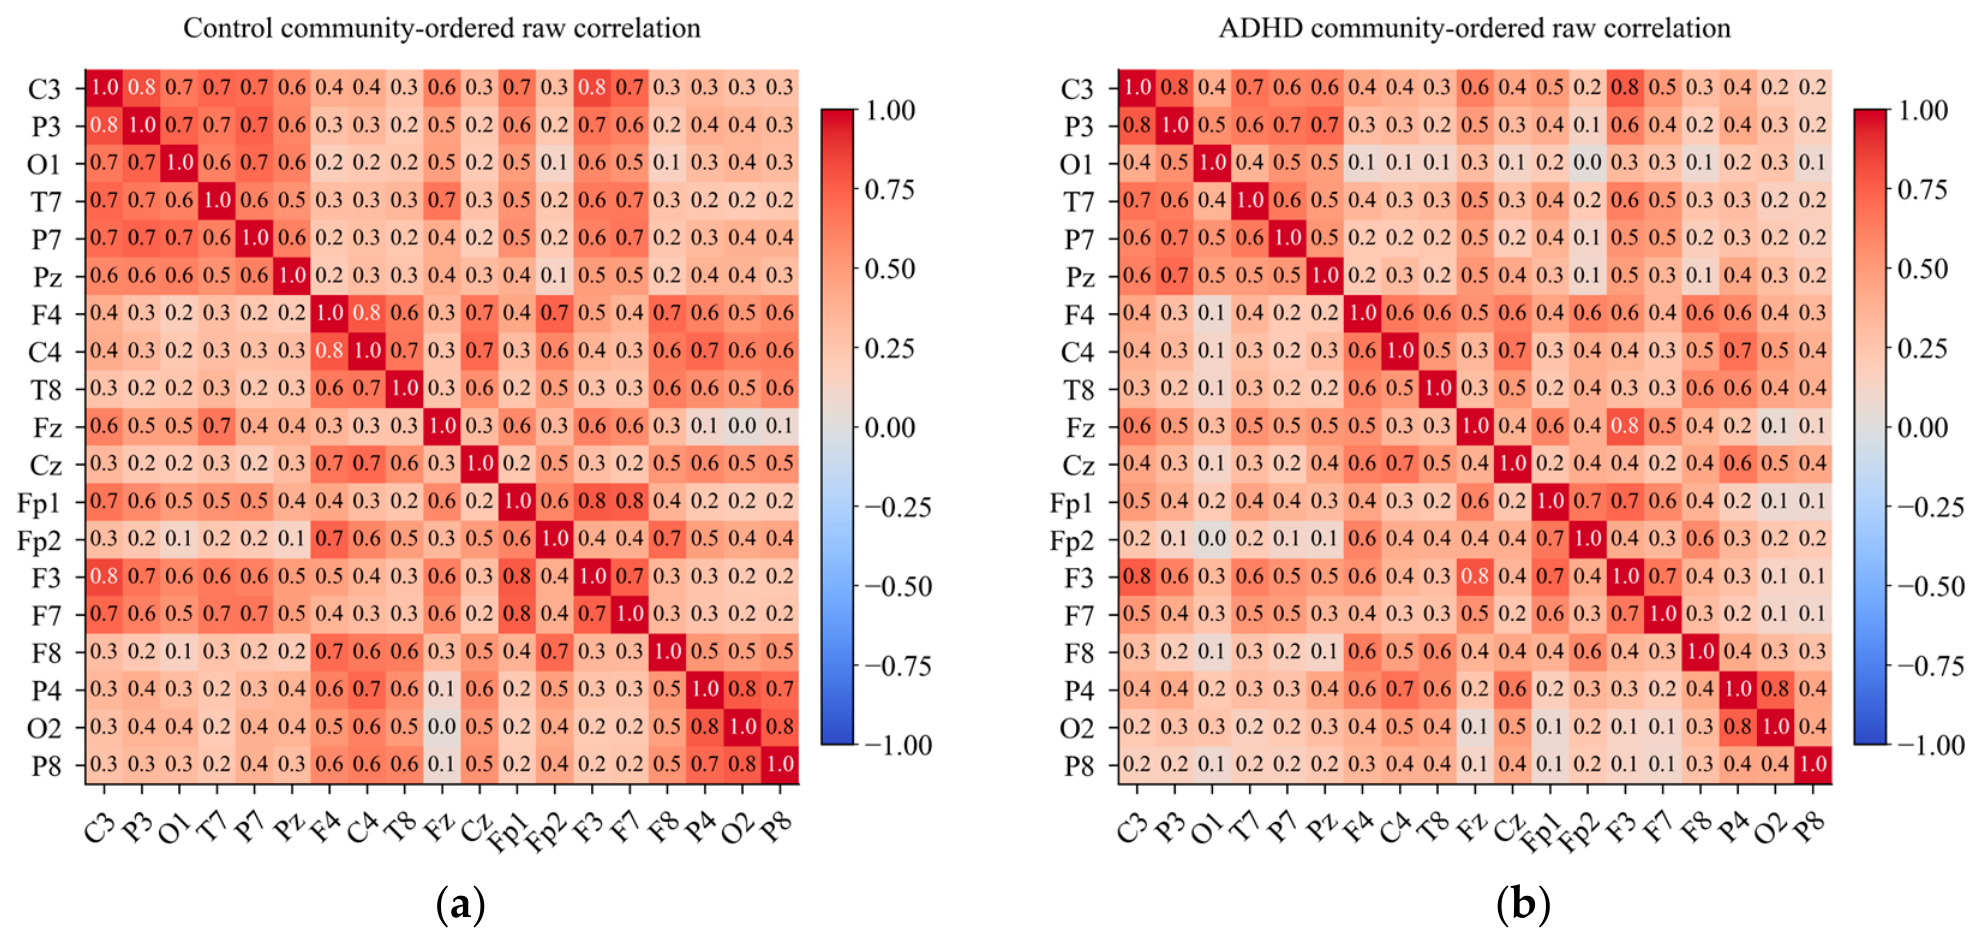
Figure 8 compares community-level interchannel EEG correlation matrices for the control and ADHD groups. In both groups, within-group correlations are generally stronger than between-group correlations, indicating the preservation of the modular organization of functional interactions. However, the ADHD group exhibits a more heterogeneous pattern of between-group connectivity, with increased variability and decreased coordination in posterior and occipito-parietal regions compared to the control group. In contrast, the ADHD matrix exhibits relatively stronger frontotemporal interactions. Although the overall modular structure remains visually similar between groups, the observed differences suggest a shift in the balance between local synchronization and large-scale network integration in ADHD. These matrices are presented for exploratory descriptive analysis of the organization of community-level correlations based on raw EEG amplitudes.
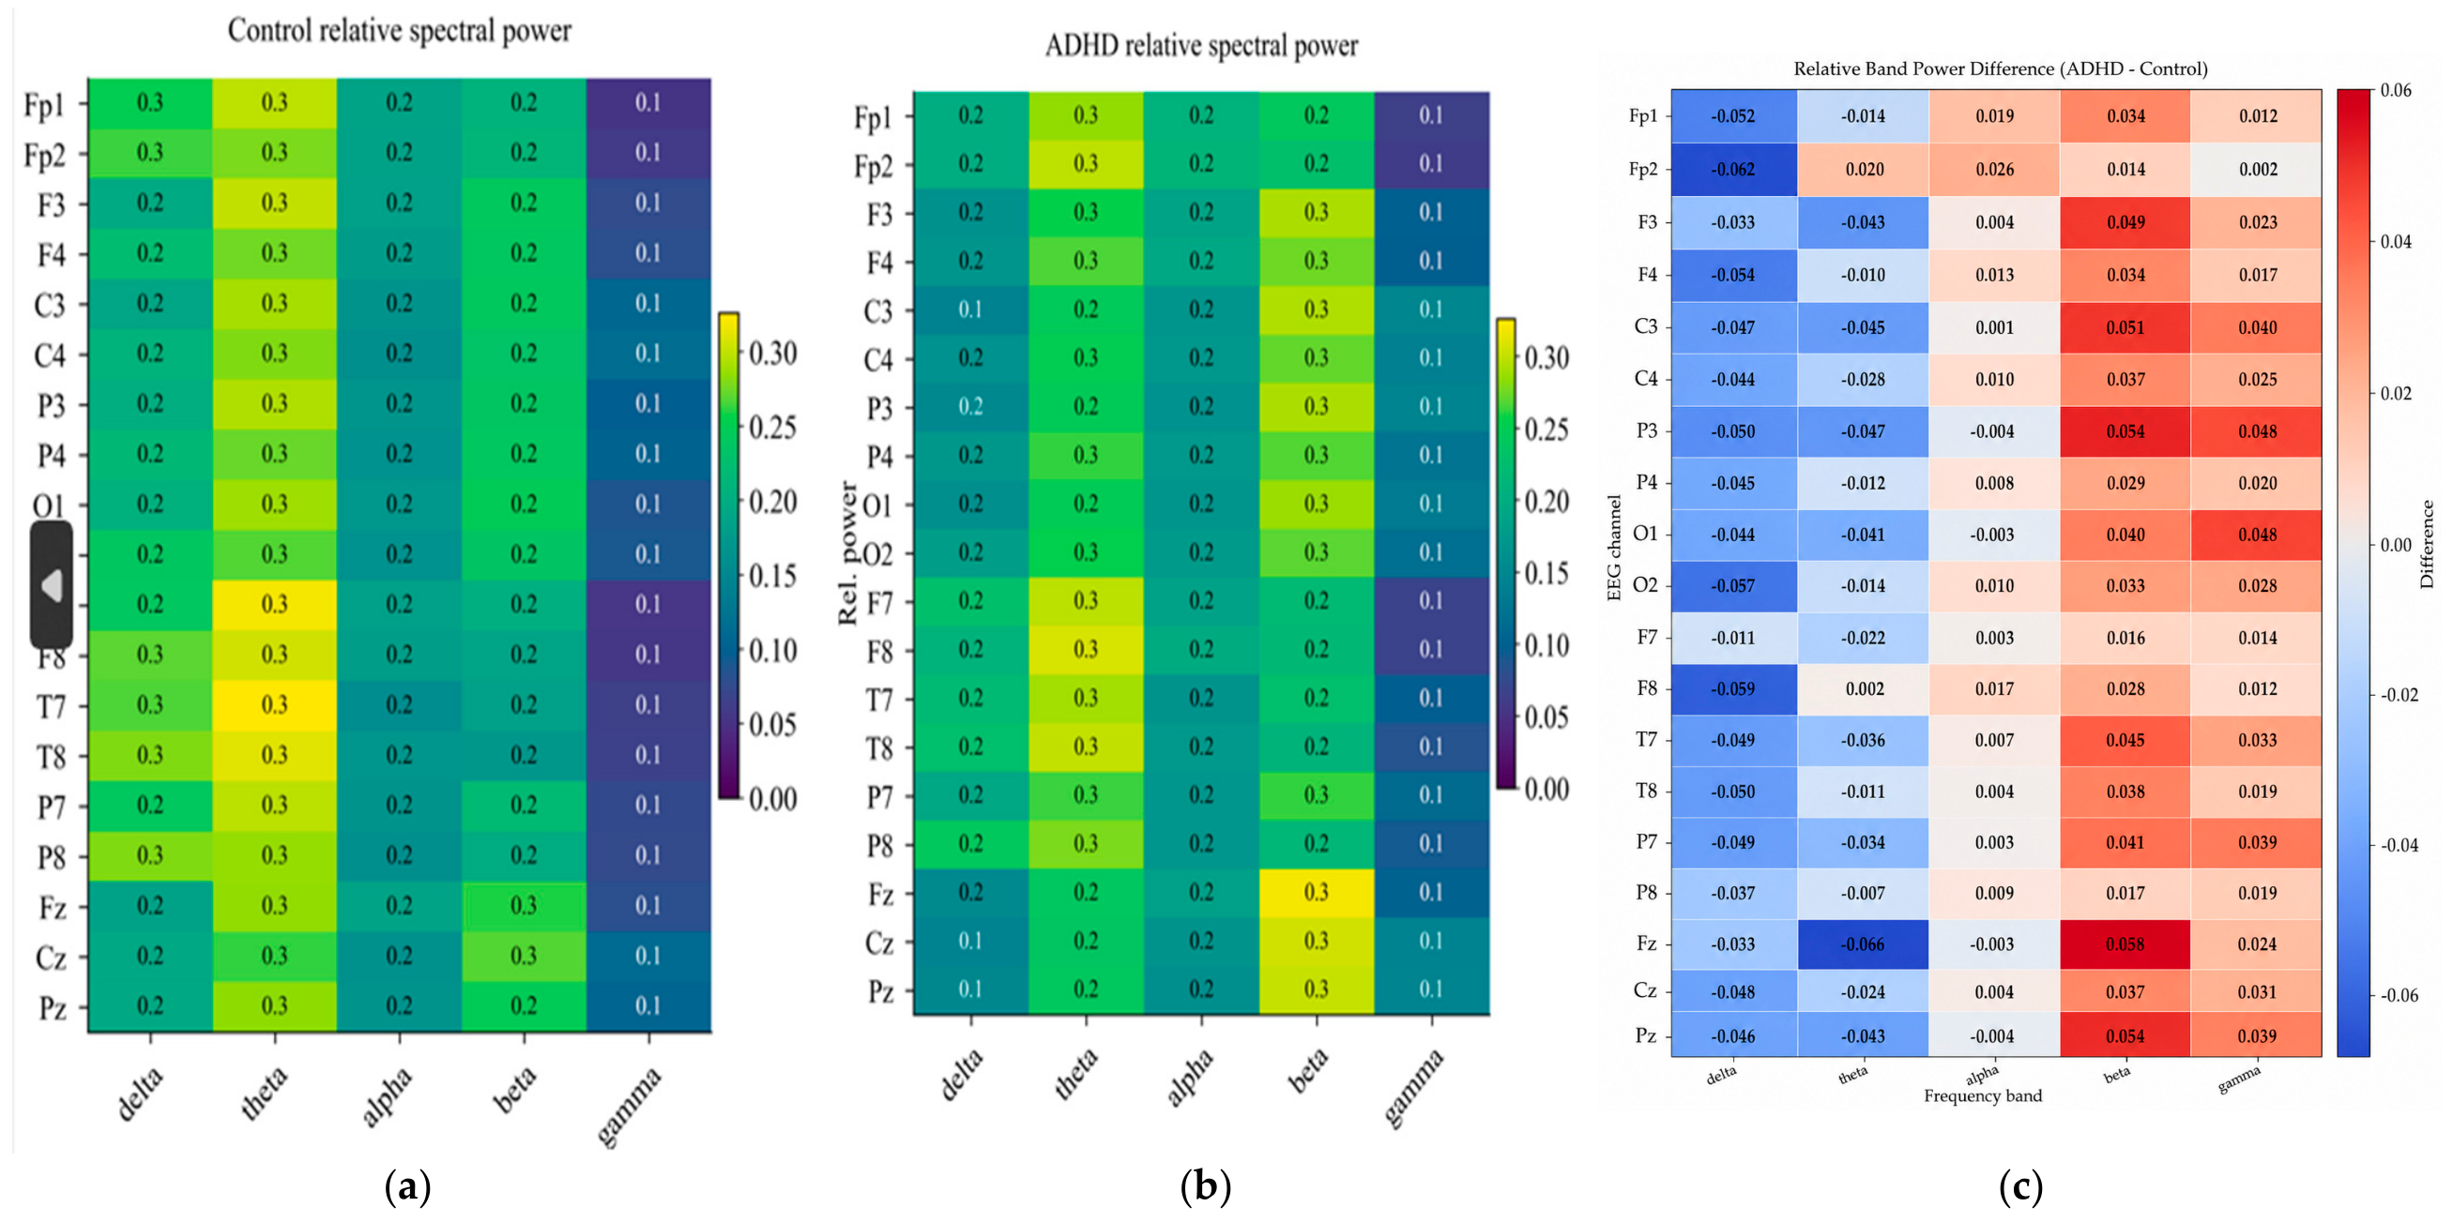
Figure 9 presents a comparison of relative EEG spectral power distributions for the control and ADHD groups, with the corresponding difference matrix shown across three panels. In both groups, beta-band activity predominates across most EEG channels, while delta and theta bands exhibit lower relative power. The ADHD group demonstrates subtle but spatially structured spectral alterations compared with controls, including relatively increased beta-band activity in frontal and central regions and localized changes in alpha- and gamma-band power in parietal and occipital areas. These differences become more apparent in the difference matrix shown in panel (c), which highlights frequency-specific shifts in oscillatory activity rather than large global spectral changes.
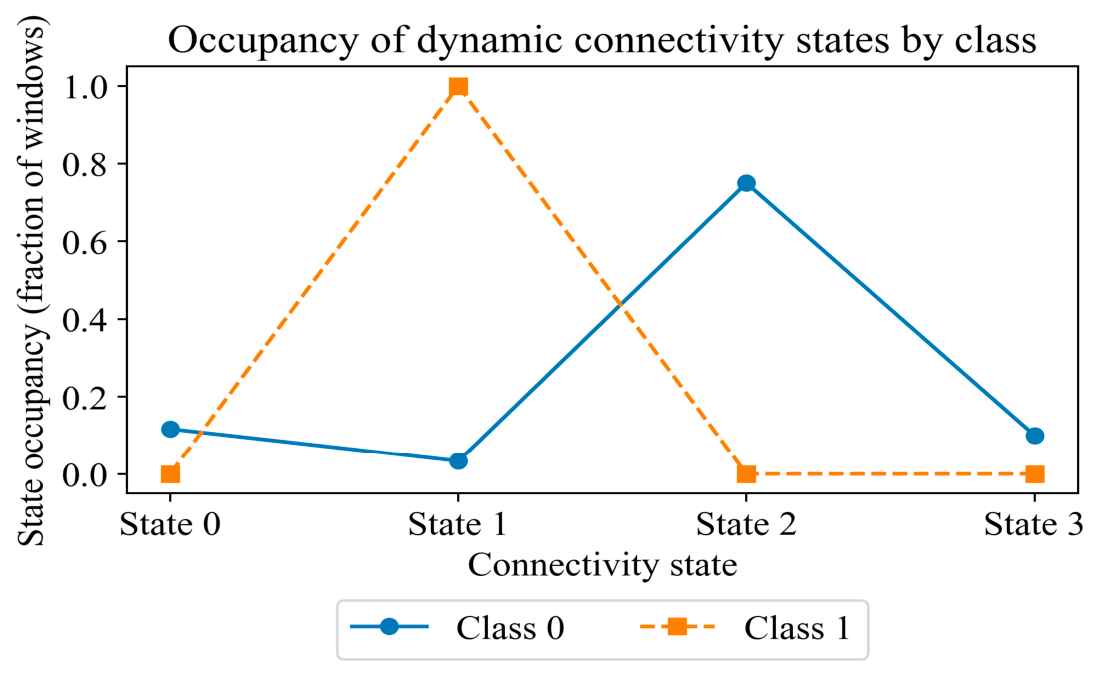
Figure 10 shows the distribution of activity across dynamic states of functional connectivity in the control and ADHD patient groups. The ADHD group is characterized by a strong concentration of activity in one dominant state, while the control group exhibits a more balanced distribution across multiple states. This pattern suggests reduced temporal variability and less flexibility in the organization of functional connectivity in ADHD.
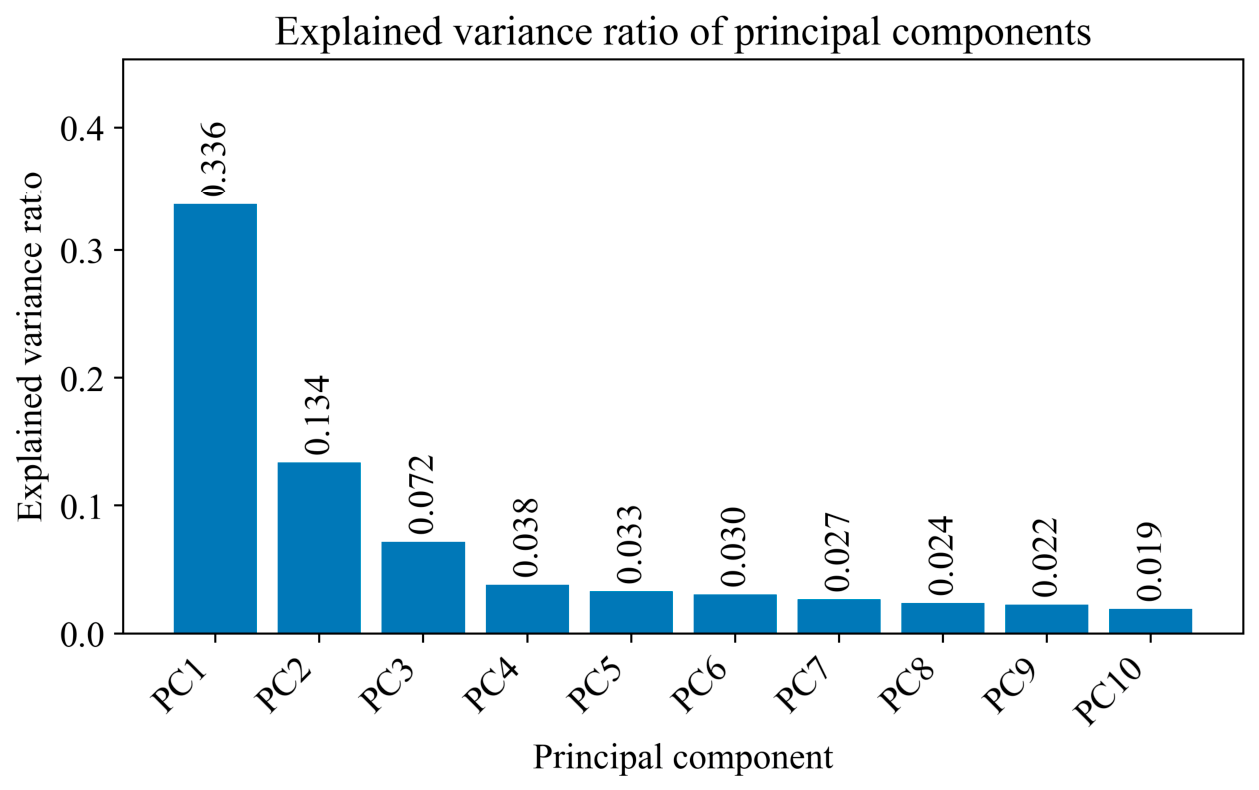
Figure 11 shows the distribution of explained variance for the first 10 principal components derived from functional connectivity characteristics. The first components explain the majority of variance, while the contribution of subsequent components rapidly decreases, indicating a low-dimensional structure in the connectivity space. This confirms the feasibility of dimensionality reduction and the use of principal components to construct network indices.
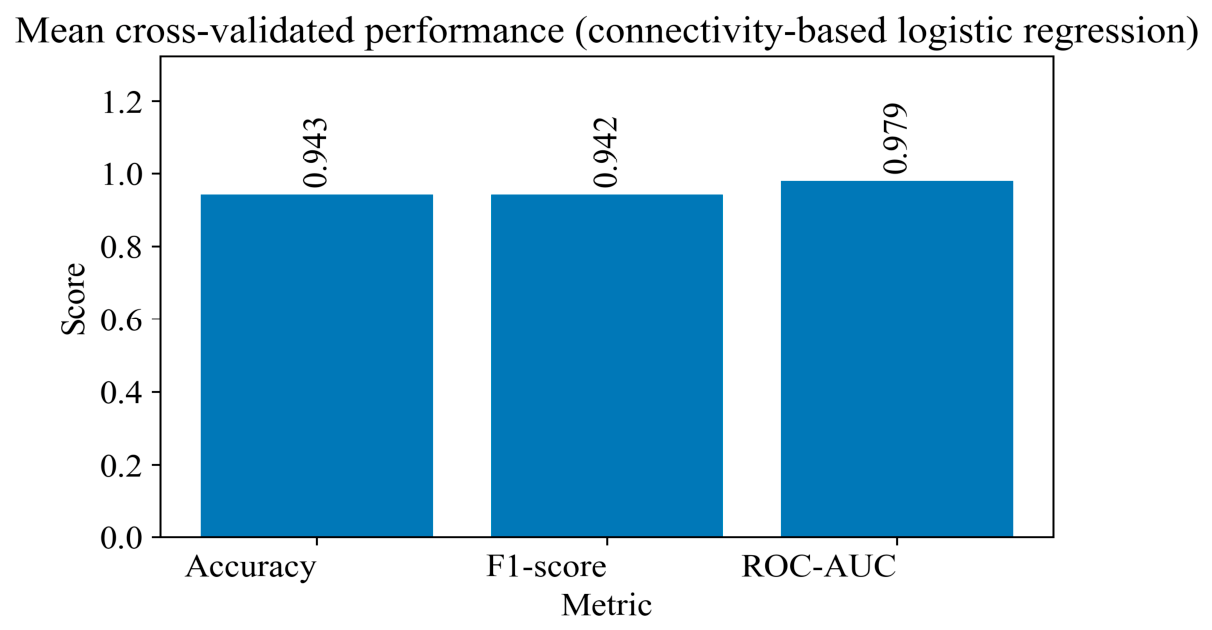
Figure 12 shows the fold-averaged cross-validation performance of the logistic-regression baseline using functional connectivity features. The model achieved balanced accuracy and F1-score values of approximately 0.94, while the ROC-AUC reached about 0.98, indicating strong class separability and stable generalization across folds. These results demonstrate that even a linear model based on static connectivity features provides an informative baseline for comparison with more complex architectures.
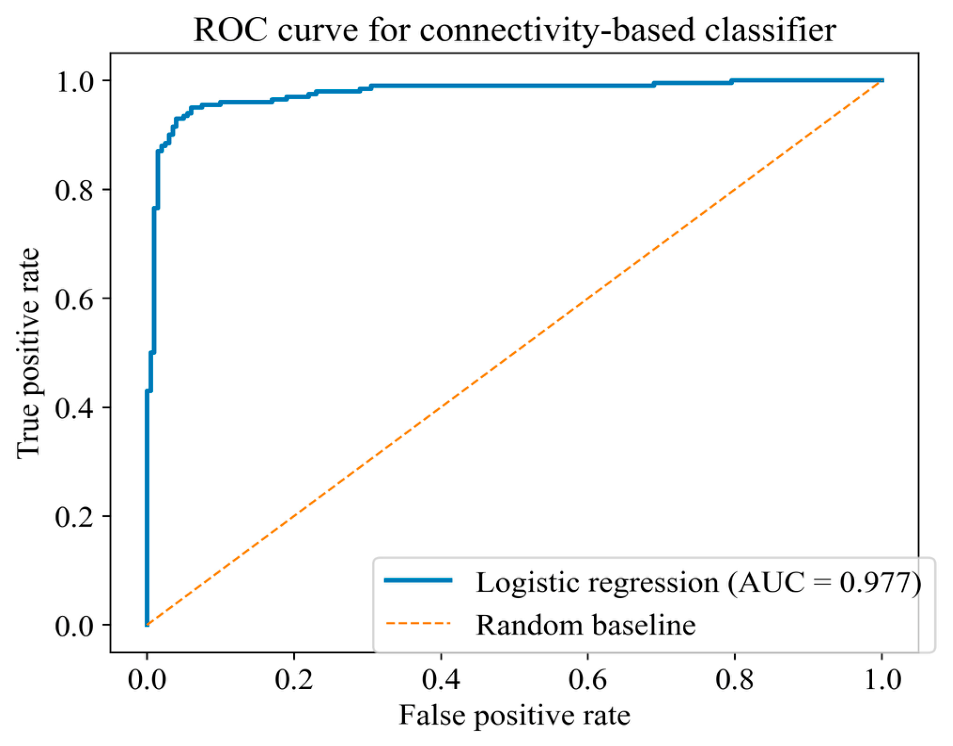
As shown in Figure 13, the ROC curve deviates substantially from the random-classification diagonal, achieving high true-positive rates at low false-positive rates. The resulting AUC of 0.977 indicates strong class separability and confirms the discriminative capability of the connectivity-based network index.
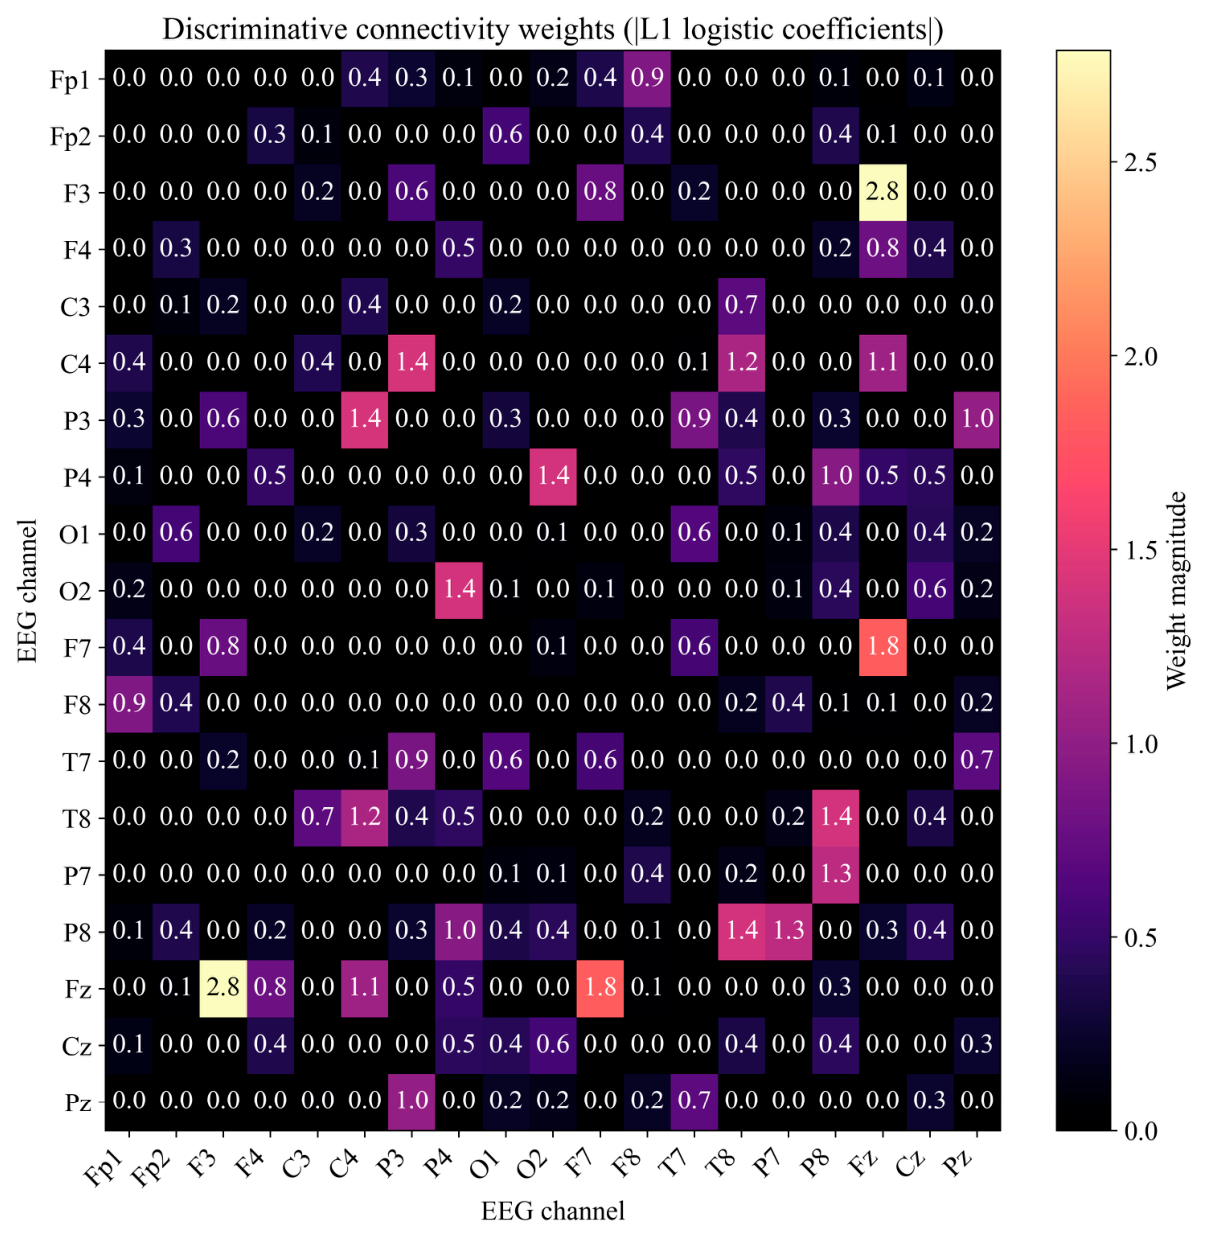
As shown in Figure 14, the L1-regularized logistic-regression coefficient map highlights the most informative functional connections contributing to the linear network index. The strongest weights are concentrated in fronto-central and temporo-occipital regions, particularly for connections involving F3/F4, F7/F8, Fz, P7/P8, and T7/T8. This spatial pattern supports the involvement of frontal executive and posterior associative networks in ADHD and demonstrates the interpretability of the connectivity-based index.
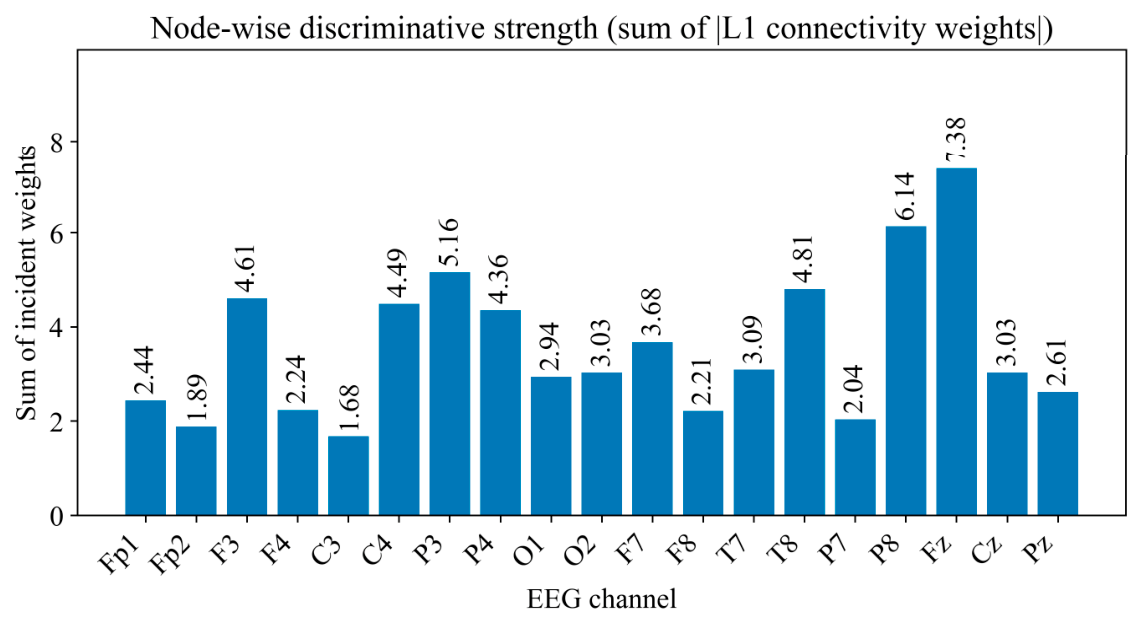
As shown in Figure 15, the discriminative contribution is unevenly distributed across EEG channels, with the largest aggregate weights concentrated in frontal, central, and parietal electrodes, including F3, C4, P3, P4, T8, P8, Fz, and Cz. These channels contribute most strongly to the linear functional connectivity index, whereas several peripheral electrodes demonstrate comparatively low discriminative importance. The resulting nodal profile supports the involvement of fronto-parietal network organization in ADHD and highlights spatially localized connectivity alterations relevant for subsequent network-level analysis.
From a neurophysiological perspective, the observed spatial pattern indicates that ADHD-related alterations are most pronounced in posterior parietal, temporoparietal, occipital, and frontopolar regions, whereas central sensorimotor areas contribute less strongly. Elevated discriminative scores in O1, P7, Fp1, P3, T7, and O2 support the interpretation of ADHD as a disorder associated with distributed network dysregulation rather than localized cortical impairment. Overall, the EEG recordings demonstrated stable spatiotemporal patterns suitable for connectivity-based analysis after artifact-aware preprocessing. Intergroup differences were consistently observed across amplitude, correlation, spectral, and dynamic connectivity characteristics, providing a basis for subsequent network-index modeling and ADHD-related connectivity analysis.

4.2. Quantitative Assessment of the Diagnostic Value of Network Features

This section quantitatively evaluates the diagnostic relevance of EEG functional connectivity by analyzing the separability of ADHD and control subjects in the space of connectivity-derived network indices. To address the limited size of the independent test sample (n = 19 subjects), additional statistical validation was conducted using stratified bootstrap resampling at the subject level. A total of 1000 bootstrap iterations were run, with class proportions maintained in each resample to ensure robustness of the estimates. The resulting confidence intervals for all estimated models are summarized in Table 5.
As shown in Table 5, the proposed hybrid model achieved a balanced accuracy of 0.6222 with a 95% confidence interval (CI) of [0.411, 0.833], while the AUC-ROC reached 0.7444 with a 95% CI of [0.489, 0.944]. The corresponding confidence intervals for sensitivity and specificity were estimated as [0.500, 1.000] and [0.111, 0.778], respectively. Similar patterns of relatively wide confidence intervals were observed in all baseline models, suggesting that the statistical uncertainty is mainly due to the limited size of the independent test sample rather than a specific modeling approach. Although the proposed method demonstrated competitive discriminatory power compared with alternative methods, the variability of the confidence intervals suggests that an estimate based solely on a fixed independent split of a sample of 19 subjects not included in the study should be interpreted with caution and may be insufficient to support strong conclusions regarding the generalizability of diagnostic performance at the individual subject level.
To address this issue, an additional leave-one-subject-out (LOSO) validation protocol was performed. In this case, each subject was iteratively dropped from the training data and used as an independent holdout test subject while the model was trained on the remaining participants. This subject-level cross-validation strategy eliminates data duplication between the training and test sets and provides a more rigorous assessment of generalization ability across the entire cohort of 121 subjects. When validated with the LOSO method, the proposed model achieved accuracy = 0.7190, balanced accuracy = 0.7180, sensitivity = 0.8200, specificity = 0.6170, F1-measure = 0.7460, and AUC-ROC = 0.7770. These results demonstrate that the proposed framework maintains stable discriminatory ability under a more rigorous subject-level evaluation protocol and confirms the robustness of the learned connectivity-based network index.
In particular, instead of relying on previously reported results, we re-estimated the classification performance separately for theta-band (4–8 Hz), beta-band (13–30 Hz), and their combined representations. Unlike the raw amplitude correlations shown in Figure 7, Figure 8, Figure 9, Figure 10, Figure 11, Figure 12, Figure 13, Figure 14 and Figure 15, all modeling results in this study are derived from connectivity computed in the theta (4–8 Hz) and beta (13–30 Hz) frequency bands. Updated modeling results are presented separately for theta, beta, and combined connectivity (Table 6), confirming that the model is no longer based on original EEG amplitudes.
The results show that theta-band connectivity provides significantly higher discriminatory power (AUC = 0.7333) compared to beta-band connectivity (AUC = 0.5667), indicating that low-frequency oscillatory interactions carry more important information for identifying ADHD in this dataset. The combined theta + beta model achieves the highest AUC-ROC value (0.7444), suggesting a complementary contribution from both frequency bands. However, the improvement over theta-band modeling remains moderate, indicating that theta-band connectivity is the dominant source of the discriminatory signal.
To further confirm the frequency-specific modeling results, the most pronounced differences in intergroup connectivity were analyzed separately for the theta and beta bands. The largest changes in functional connectivity between the ADHD and control groups are summarized in Table 7, where the most discriminatory interchannel interactions contributing to the observed classification performance are highlighted.
As shown in Table 7, the most prominent connectivity differences are distributed across the frontal, parietal, and occipital regions, indicating that ADHD-related changes affect both local and long-range functional interactions. In the beta band, increased connectivity is observed predominantly in the centro-parietal and fronto-temporal regions (e.g., C4-P4, P4-Cz), suggesting altered high-frequency network coordination. In contrast, in the theta band, predominantly negative connectivity shifts are observed (e.g., Fp1-O1, Fp1-P7), reflecting reduced low-frequency synchronization in frontal and posterior regions. These results provide quantitative evidence that the updated modeling pipeline captures frequency-specific connectivity patterns and supports the interpretation of the proposed network index as a physiologically relevant biomarker.
Quantitative analysis of power differences across frequency bands reveals a consistent, physiologically interpretable pattern of EEG changes in the ADHD group compared with the control group. In the delta and theta bands, predominantly negative differences are observed across all channels, with values ranging from approximately −0.033 to −0.062 (delta) and −0.007 to −0.047 (theta). This indicates a systematic reduction in low-frequency activity in ADHD patients, particularly in frontopolar and central regions (e.g., Fp1: −0.052 in the delta band, C3: −0.047 in the delta band). In contrast, the beta band shows uniformly positive differences across all channels, ranging from 0.029 to 0.058. The most pronounced increases are observed in frontal and midline regions, including Fz (0.058), P3 (0.054), and Pz (0.054), suggesting increased high-frequency activity associated with increased cortical activation or decreased inhibitory control. The alpha band exhibits relatively small and mixed effects, with values close to zero (−0.004–0.019), indicating that alpha activity does not contribute significantly to group separability in this dataset. The gamma band exhibits moderate positive differences (0.012–0.048), with higher values in the parietal and occipital regions (e.g., O1: 0.048, P3: 0.048), reflecting increased high-frequency oscillatory activity in posterior cortical areas.
In addition to standard classification metrics, the proposed model achieved a sensitivity of 0.8000 and a specificity of 0.4444 on the independent test set, corresponding to a balanced accuracy of 0.6222. However, the significant overlap in the network index distribution (0.45) indicates incomplete separation between subjects with ADHD and the control group, reflecting the heterogeneity of EEG-based biomarkers. In terms of clinical screening, the model improves the detection of ADHD cases at the expense of a higher false-positive rate. With an estimated ADHD prevalence of 10%, the positive predictive value was 0.1379, while the negative predictive value remained high at 0.9524, suggesting reliable exclusion of cases without ADHD but limited confirmatory utility. Table 8 shows the clinical screening results at the selected operating point.
Table 8 presents key clinical interpretive metrics, including distribution overlap, sensitivity, specificity, positive predictive value, and balanced accuracy, providing a basis for assessing the practical application of the model.
Each considered learning model f θ transforms a temporal sequence of functional connectivity matrices { A t i } t = 1 T into a scalar score interpreted as an ADHD-oriented network index (21):
s = f θ ( { A t } t = 1 T ) R
A positive shift in s indicates an increased expression of ADHD-related connectivity patterns, whereas negative values reflect network configurations more consistent with typical development. The central hypothesis is that models explicitly incorporating temporal dynamics and graph topology provide stronger and more stable group separation than static or purely linear baselines. At the same time, the analysis also addresses generalization and robustness, since highly expressive deep models may be prone to overfitting, whereas linear indices are more transparent but structurally limited. To test these assumptions, we compared the distributions of network indices across all modeling strategies in the test set, ranging from static linear baselines to recurrent, graph-based, and hybrid spatio-temporal architectures. The results consistently demonstrate that incorporating temporal evolution substantially increases diagnostic contrast and reduces overlap between the clinical and control cohorts. Supplementary Table S2 summarizes prevalence-dependent screening characteristics, demonstrating how predictive values and false-positive rates vary across different assumed ADHD prevalence scenarios.
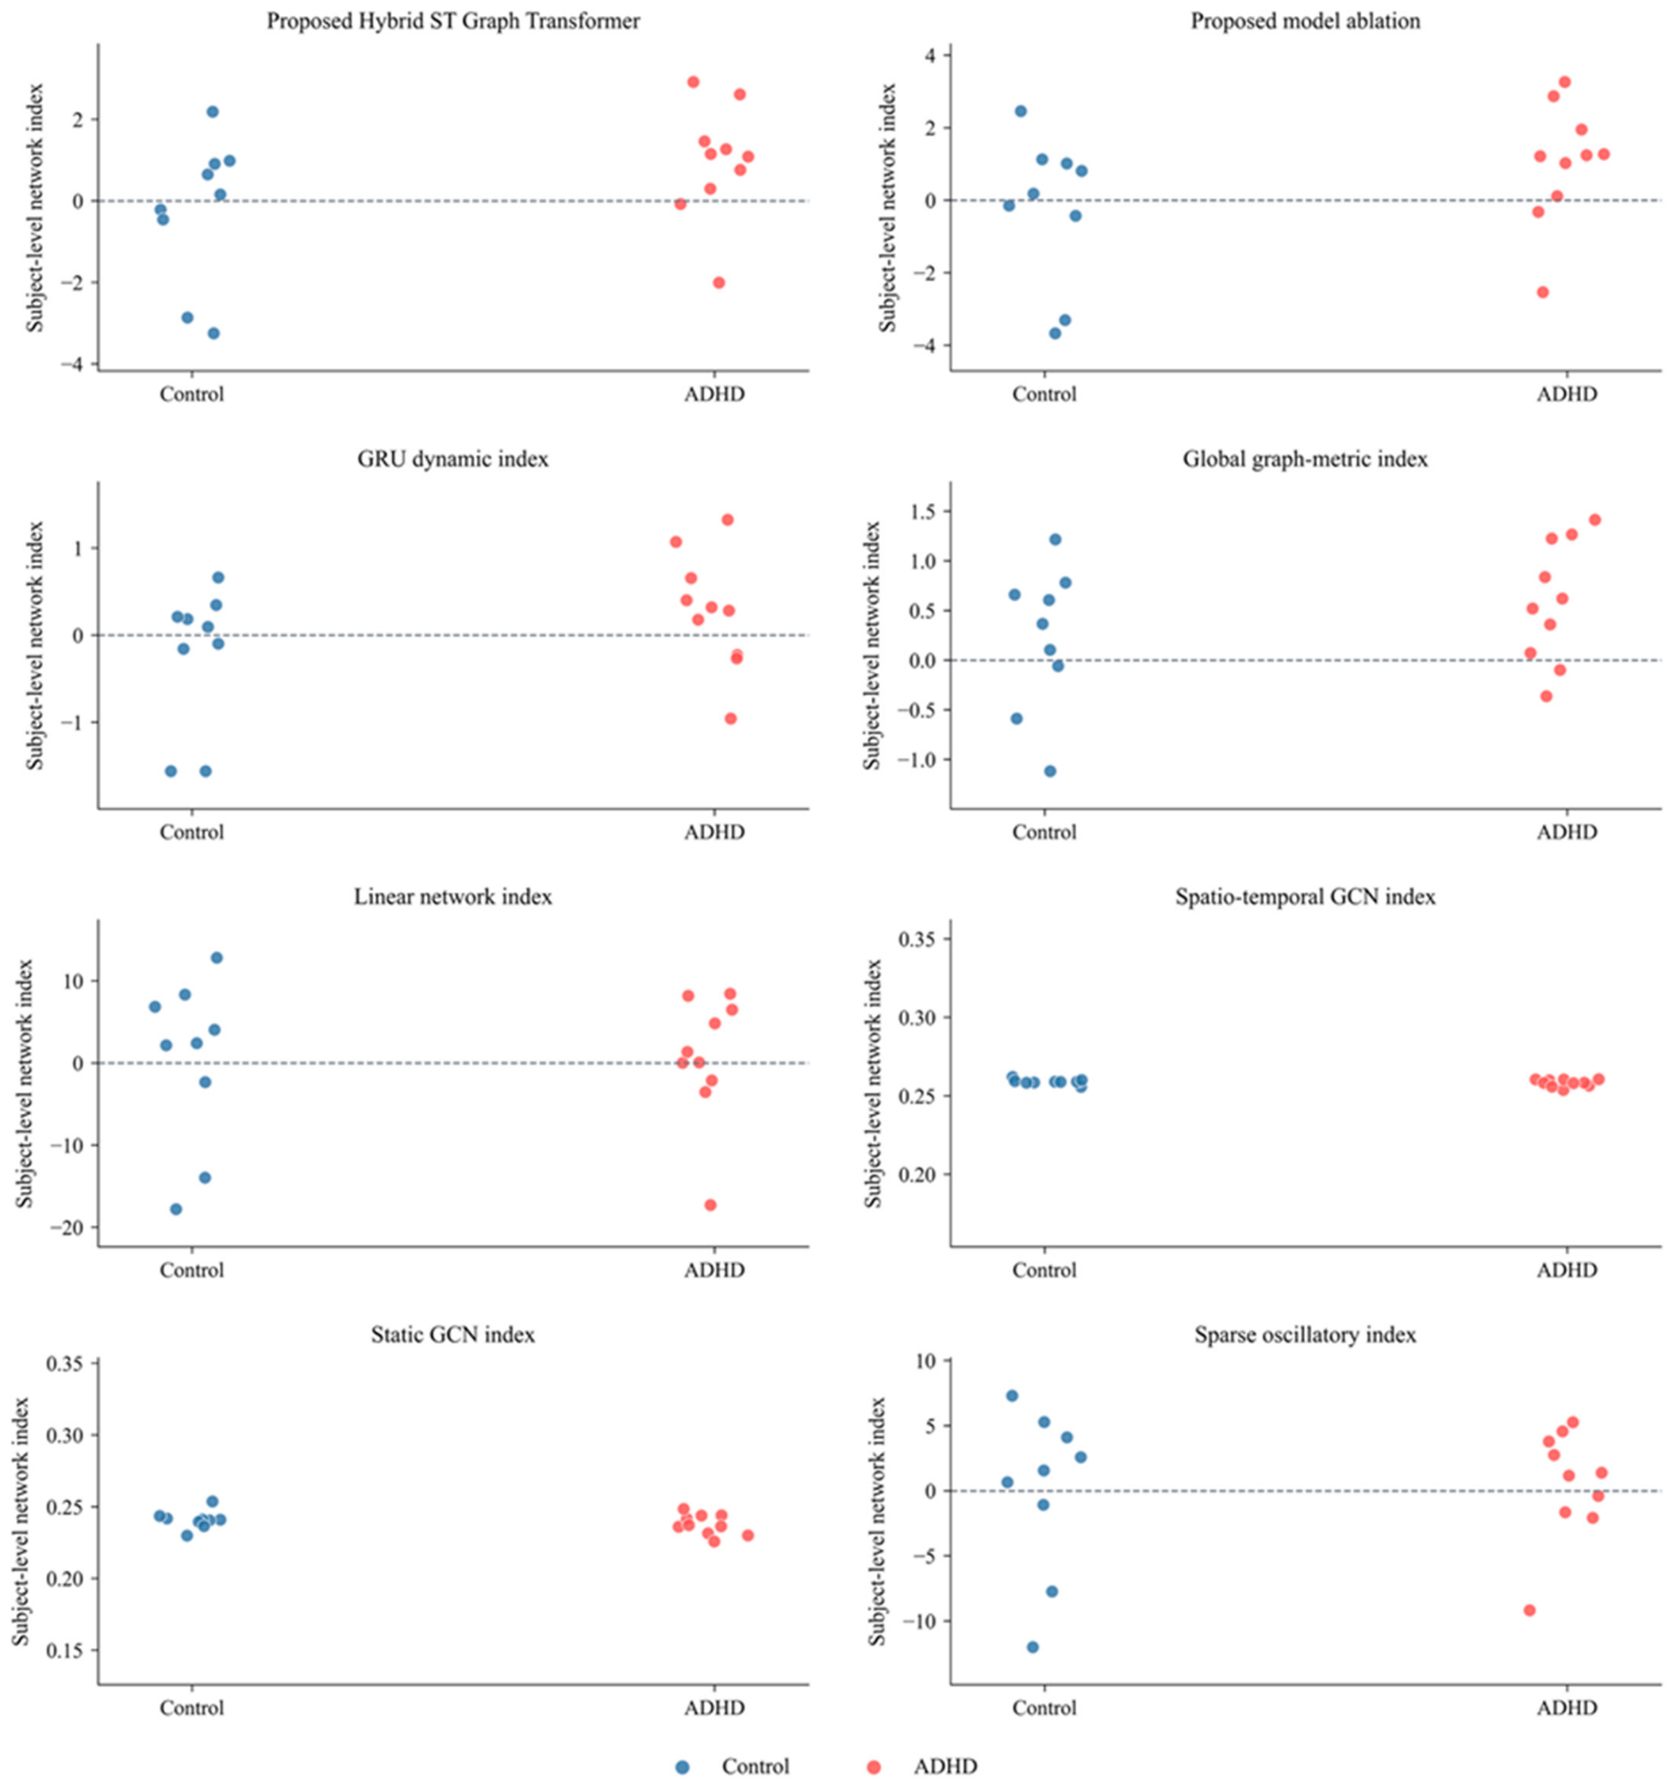
Figure 16 presents the distribution of the derived network indices at the subject level for all compared models on an independent test set, allowing for a direct assessment of intergroup separability between the control group and subjects with ADHD. The proposed hybrid spatiotemporal graph transformer demonstrates the clearest and most interpretable separation of the groups: subjects with ADHD show a predominantly positive index bias. In contrast, in the control group, it is concentrated near or below the zero boundary. This suggests that the proposed hybrid architecture generates a more informative connectivity-based network index that captures differences in the dynamic organization of EEG functional connectivity across groups.
A similar, but less stable, distribution pattern is observed for the proposed ablation model, confirming the contribution of the full architectural components to improved separability. The dynamic GRU index and global graphometric index demonstrate moderate class separation with partial overlap between groups, whereas the linear and sparse oscillatory indices exhibit increased variability and several outliers. In contrast, the static and spatiotemporal GCN indices yield highly compressed and weakly separated distributions, indicating limited sensitivity to individual between-group variability. Overall, the results indicate that the best separability at the subject level is achieved by integrating dynamic connectivity modeling, graph representation, and spatiotemporal attention mechanisms, rather than by isolated linear, static graph, or recurrent approaches. However, partial overlap between groups remains, suggesting that the resulting network index should be interpreted as a promising computational screening marker rather than an independent diagnostic criterion.
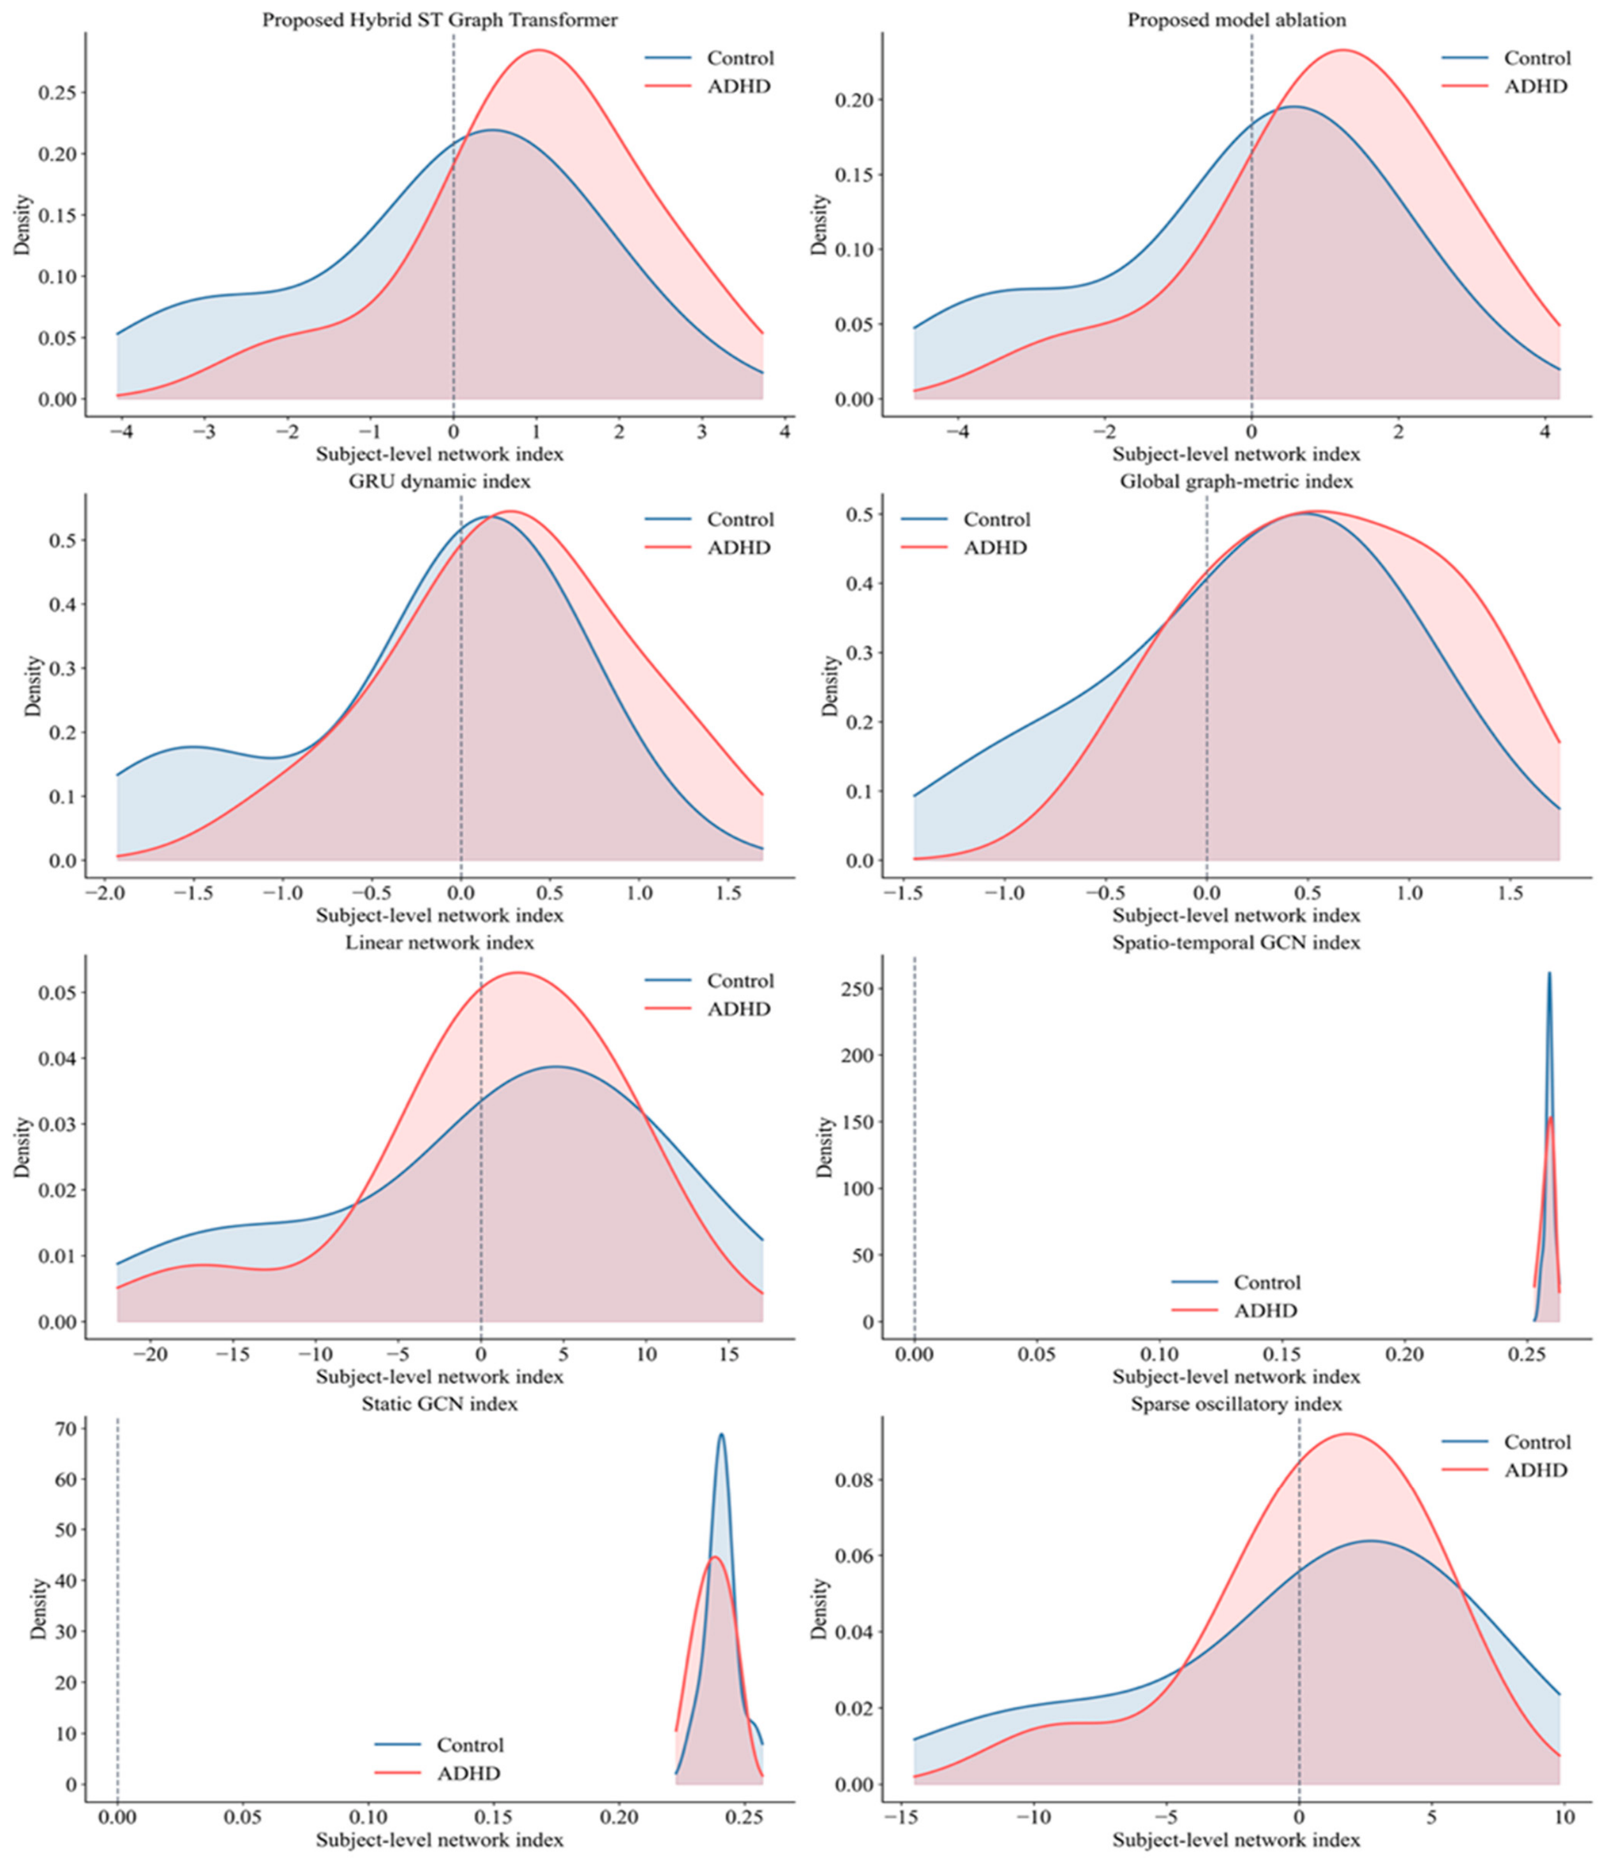
Figure 17 presents the density distributions of the derived network indices at the subject level for the control and ADHD groups across all compared models. The proposed hybrid spatiotemporal graph transformer demonstrates the clearest between-group separation, with the distribution for the ADHD group skewed toward positive index values. In contrast, the distribution for the control group is more concentrated near the zero boundary. This suggests that the proposed hybrid architecture captures informative differences in the dynamic organization of EEG functional connectivity between groups.
The proposed ablation model shows a similar but less stable separation pattern, while the dynamic GRU index and global graphometric index exhibit moderate between-group shifts with significant overlap between distributions. The linear and sparse oscillatory indices exhibit higher variability and less stable between-group separation. In contrast, the static and spatiotemporal GCN indices yield highly compressed and poorly separated distributions, indicating limited sensitivity to between-group differences.
Table 9 presents a comparative evaluation of the proposed hybrid spatiotemporal graph transformer model and the baseline connectivity-based network index model. The proposed model showed the best overall results with an accuracy of 0.6316, a balanced accuracy of 0.6222, and the highest AUC-ROC value of 0.7444. It also demonstrated the largest effect size (Cohen’s d = 0.7289) and the lowest distribution overlap (0.45), indicating improved separability between subjects with ADHD and the control group. In contrast, the linear and sparse oscillatory indices showed significantly weaker discriminatory power, while the static GCN model demonstrated high sensitivity but zero specificity, reflecting poor class balance.
Table 10 presents the results of the regularization ablation study for the proposed hybrid spatiotemporal graph transformer model, evaluated at the child level. The full model achieves accuracy = 0.6316, balanced accuracy = 0.6222, sensitivity = 0.8000, specificity = 0.4444, F1-score = 0.6957, and AUC-ROC = 0.7444, resulting in the best overall ranking (average metric rank = 1.0). The ablation configuration demonstrates identical classification performance in terms of accuracy, balanced accuracy, sensitivity, specificity, and F1-score (0.6316, 0.6222, 0.8000, 0.4444, and 0.6957, respectively), but shows a slight decrease in AUC-ROC (0.7333) and overall ranking (1.3333). These results indicate that the regularization components of the proposed model improve discriminatory and generalization performance, as reflected in a higher AUC-ROC score and better overall ranking.
Additional training-set separability analysis for all network-index models is provided in Supplementary Table S3. The results further support the advantage of dynamic and hybrid connectivity representations over static graph-based approaches. Supplementary Table S4 summarizes validation-set separability metrics, further supporting the advantage of dynamic and hybrid connectivity models.
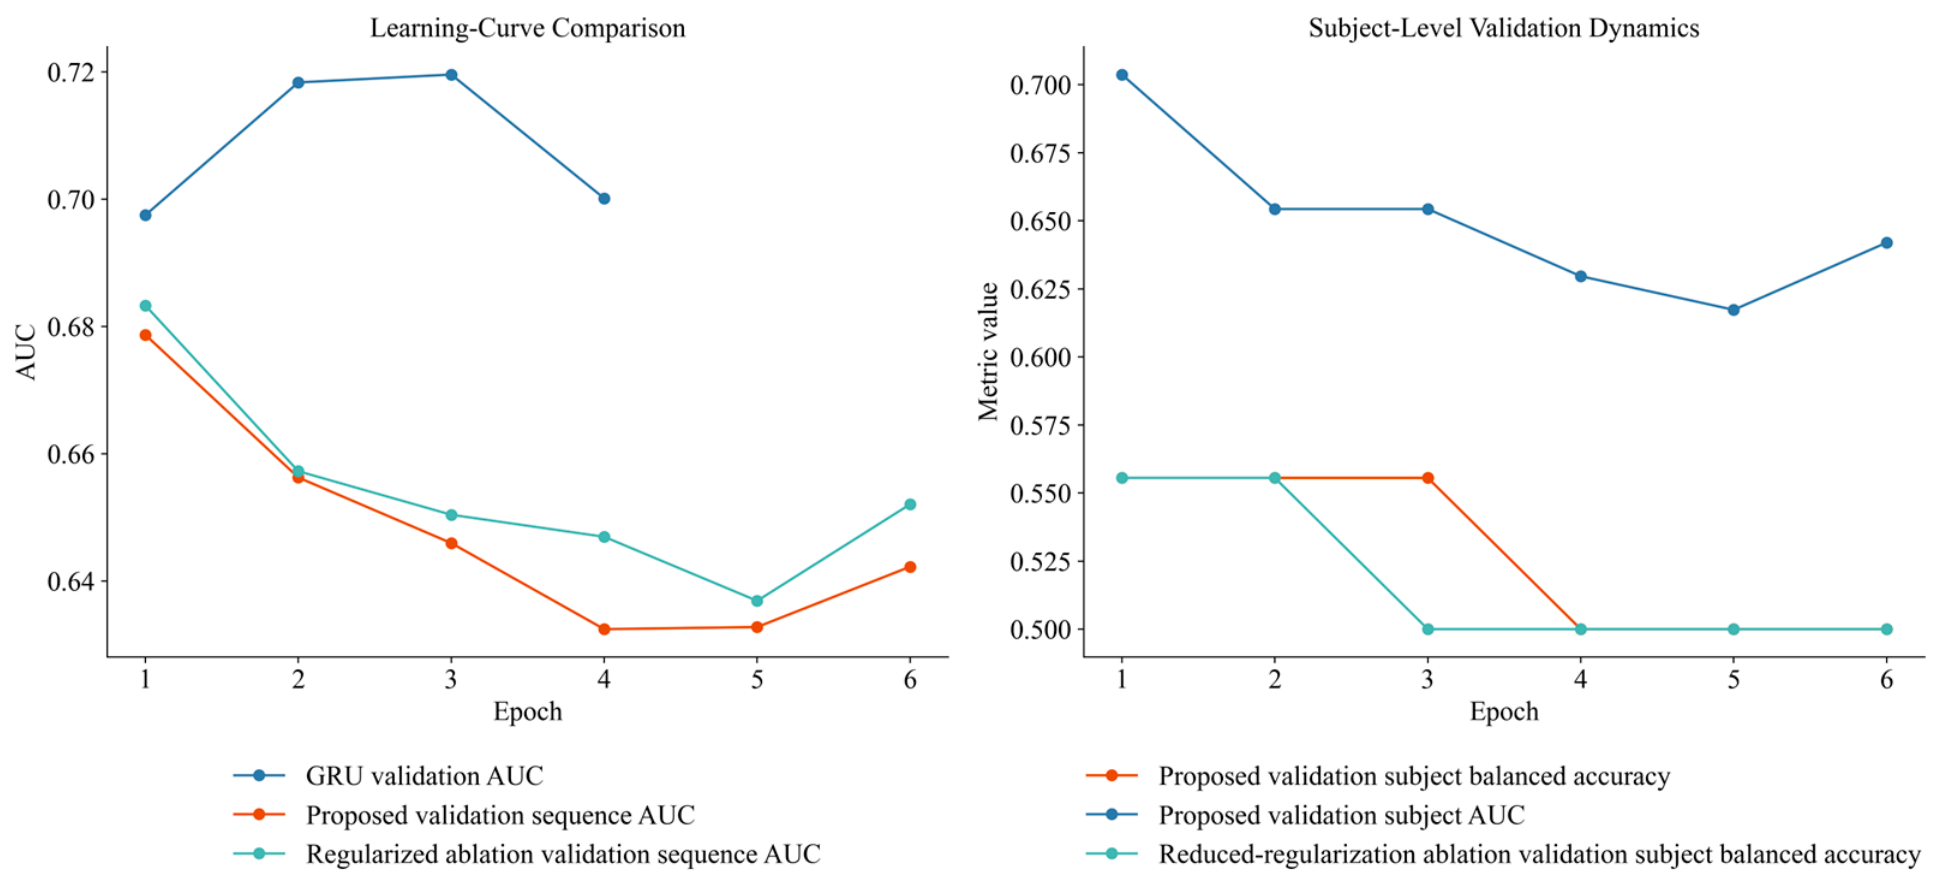
Figure 18 illustrates the training dynamics of the evaluated dynamic models across epochs at both sequence and subject levels. At the sequence level, the baseline GRU model achieved the highest validation AUC, reaching approximately 0.72, whereas the proposed and regularized-ablation models demonstrated lower but more stable performance. At the subject level, the proposed model initially achieved the highest validation AUC (≈0.70) before gradually decreasing to ≈0.62–0.64, while the reduced-regularization configuration consistently showed weaker generalization performance. Overall, the results indicate that the proposed framework provides more stable subject-level behavior despite lower peak sequence-level accuracy.
Taken together, the results confirm that network indices derived from dynamic functional connectivity provide a more stable and discriminative representation of ADHD-related patterns compared to static and linear baselines. A consistent shift in the index distribution toward positive values in the ADHD group across all models, coupled with improved performance of child-level dynamic architectures, suggests that the temporal organization of brain networks plays a critical role in distinguishing between clinical and control groups. The proposed hybrid spatiotemporal graph transform model demonstrates the most balanced performance under rigorous assessment conditions, supporting the hypothesis that integrating temporal dynamics and graph structure enhances both the robustness and generalizability of EEG-based diagnostic features.

4.3. Network Index Summary

Additional quantitative analysis of network index separability on the training and validation datasets confirmed the superiority of dynamic connectivity models over static approaches. Specifically, recurrent and hybrid spatiotemporal architectures demonstrated significantly larger effect sizes, less distribution overlap, and improved class separability compared to linear and graph-averaged baseline models. Detailed separability statistics for all models are provided in Supplementary Tables S3 and S4.
As follows from Table 11, Multihead_spatio_temporal_graph_transformer_index demonstrates the most stable and balanced separability indicators on the test set. With a mean difference of Δμ = 6.21, this index provides the highest separation ratio (0.75), the largest effect size Cohen’s d = 1.51, the highest correlation with the class label (Pearson r = 0.60), the minimum distribution overlap (Overlap = 0.45), and the largest Silhouette (0.32). RNN_dynamic_connectivity_index maintains a comparable mean difference (Δμ = 7.87), but is inferior to the hybrid model in terms of normalized metrics (d = 1.35, Overlap = 0.50), which indicates a less compact cluster structure. Linear and sparse linear indices provide moderate discrimination (d ≤ 1.32), while the global graph and GCN approaches exhibit weak separability and significant distribution overlap. Taken together, the results in Table 11 confirm that the hybrid architecture based on multi-head self-attention and recurrent modeling provides the best balance of separability and generalization ability on independent data.
Taken together, the models considered form a hierarchy of network indices that reflect progressively more complex representations of functional brain connectivity. Linear and sparse linear indices provide an interpretable baseline, allowing for the identification of overall imbalances and key informative network edges in ADHD. An index based on global graph metrics demonstrates the contribution of the network’s topological properties, but its discriminatory power is limited. Dynamic models significantly expand the index’s expressiveness: the recurrent approach effectively captures the temporal structure of connectivity but is prone to overfitting. At the same time, the static and spatiotemporal GCNs provide only moderate gains due to their explicit consideration of topology. Against this backdrop, the proposed Multihead spatiotemporal graph transformer index offers the best compromise between separability and generalization, reliably identifying dynamic network patterns from independent data.
To validate the statistical significance of the observed differences between groups, a two-sample t-test was conducted on the network index distributions. The results indicate that the separation achieved by the proposed hybrid model is statistically significant (p < 0.001), confirming that the observed group differences are not due to random variation. Additionally, effect size analysis using Cohen’s d demonstrates a strong practical significance of the proposed approach, particularly for dynamic and hybrid models. Several recent studies on EEG-based ADHD classification using 19-channel recordings and deep learning methods have reported classification accuracies exceeding 90% [29,30,31]. Esas and Latifoglu [29] reported accuracies above 95% using multi-channel EEG analysis, while Alim and Imtiaz [30] achieved accuracies above 93% on the publicly available IEEE DataPort ADHD dataset. Bansal et al. [31] also reported accuracies above 99% using an 80/20 split obtained from approximately 50,000 EEG segments from the same publicly available dataset. However, none of these studies explicitly reported rigorous leave-one-subject-out validation or fully independent subject-level splitting. Instead, most evaluations relied on holdout or sample-level cross-validation protocols, in which EEG segments obtained from the same participant could potentially appear in both the training and test sets. Because EEG windows from the same patient often exhibit high statistical similarity, such evaluation parameters may overestimate the effectiveness of generalization at the individual patient level.

5. Discussion

The results of this study demonstrate that dynamic functional connectivity provides a meaningful basis for assessing ADHD using EEG, particularly when combined with spatiotemporal modeling and network index analysis. Unlike traditional static EEG approaches, the proposed framework captures the temporal evolution of interregional interactions, allowing for a more comprehensive representation of the large-scale organization of brain networks in ADHD. A key finding is that incorporating temporal dynamics improves between-group separability. While linear and static connectivity models yielded partially distinguishable distributions, dynamic architectures—especially recurrent and hybrid models—demonstrated less overlapping distributions and stronger effect sizes. These results suggest that ADHD is associated not only with changes in connectivity strength but also with disruptions in the temporal organization and reduced flexibility of functional brain networks.
The proposed hybrid spatiotemporal graph transformer demonstrated the most balanced performance across all evaluation metrics, particularly in terms of sensitivity and AUC-ROC. The combination of attention-based temporal modeling with recurrent sequential coding enabled the simultaneous analysis of long-term dependencies and local connectivity transitions. However, the results reflect a tradeoff between sensitivity and specificity, which is more appropriate for screening-oriented systems than for definitive clinical diagnosis. From a neurophysiological perspective, the observed connectivity changes were most pronounced in the frontal, frontotemporal, parietal, and temporo-occipital regions, consistent with known dysfunctions of attention and executive control networks in ADHD. Reduced variability in dynamic connectivity further supports the interpretation of ADHD as a disorder involving impaired large-scale network adaptability, rather than isolated local anomalies. Methodologically, the study combines oscillatory envelope-based connectivity estimation, dynamic graph modeling, and hybrid spatiotemporal deep learning within a unified and replicable framework. Rather than introducing a fundamentally new neural architecture, the primary contribution lies in systematically combining and evaluating these components for subject-level ADHD assessment, with rigorous, leak-free validation.
Several limitations should also be noted. First, the study was based on a single publicly available EEG dataset with a relatively small independent test group, limiting the statistical stability and generalizability of the results. Second, the dataset’s tabular format limited the use of advanced preprocessing methods and access to the original data-collection metadata. Third, external multicenter clinical validation was lacking.

6. Conclusions

This study proposes a computational model for ADHD detection based on dynamic EEG functional connectivity and network index modeling. The developed hybrid spatiotemporal graph transformer generated an interpretable continuous network index capable of capturing neurophysiological differences between ADHD and control groups. The results highlight the importance of rigorous subject-level evaluation, which provides a more clinically realistic assessment of the model’s generalization ability than sample-level analysis. Although the model demonstrated moderate classification performance with relatively high sensitivity, its current applicability is more suited to screening and early risk stratification than to definitive clinical diagnosis. The proposed envelope-based connectivity analysis approach supports physiologically relevant interaction analyses; however, this study should be considered experimental, as it is limited by the use of a single publicly available dataset and a relatively small independent test cohort. Future studies will also analyze event-related and stimulus-synchronized EEG contrasts, aligning the dynamics of functional connectivity with specific cognitive or behavioral events during recording sessions. In this study, connectivity patterns were assessed over temporally aggregated windows without explicit synchronization with stimulus presentation or behavioral responses, which may partially mitigate transient between-group differences. Integrating event-synchronized neural responses with behavioral markers may increase the proposed framework’s sensitivity to clinically relevant dynamics associated with ADHD and facilitate a more precise characterization of neural processes underlying attention.

Supplementary Materials

The following supporting information can be downloaded at: https://www.mdpi.com/article/10.3390/computers15060333/s1, Figure S1: Average absolute value of interchannel EEG correlation across all samples; Figure S2: Map of interchannel EEG correlation differences between the clinical and control groups (Class 1–Class 0); Figure S3: Leading mode of functional connectivity by class (principal eigenvector of the EEG correlation matrix); Figure S4: Example of a multichannel EEG segment in raw amplitudes; Table S1: EEG preprocessing protocol; Table S2: Screening performance under different ADHD prevalence scenarios; Table S3: Network index separability metrics on the training set (n_train = 1006); Table S4: Separability metrics of the network index on the validation sample (n_val = 235).

Author Contributions

Conceptualization, A.M. and M.B.; methodology, A.A. (Aizat Amirbay) and M.B.; software, A.A. (Aizat Amirbay) and A.A. (Aliya Abdukarimova); validation, M.A., A.A. (Aizat Amirbay) and A.M.; formal analysis, M.K. and M.B.; investigation, M.B., B.S. and M.A.; resources, A.M., L.A. and M.K.; data curation, M.B., Z.S. and M.A.; writing—original draft preparation, A.A. (Aizat Amirbay); writing—review and editing, A.M., M.K., E.Y. and L.A.; visualization, A.A. (Aizat Amirbay), M.B. and M.A.; supervision, A.M.; project administration, A.M.; funding acquisition, A.M. All authors have read and agreed to the published version of the manuscript.

Funding

This research was funded by the Committee of Science of the Ministry of Science and Higher Education of the Republic of Kazakhstan under Grant AP26105045 “Development of Artificial Intelligence Models and Algorithms for Analyzing Social Signals in Children with Autism.”

Data Availability Statement

The dataset used in this study is publicly available on Kaggle: EEG Dataset for ADHD (https://www.kaggle.com/datasets/danizo/eeg-dataset-for-adhd) (accessed on 15 May 2026).

Conflicts of Interest

The authors declare no conflicts of interest.

References

  1. Faraone, S.V.; Bellgrove, M.A.; Brikell, I.; Cortese, S.; Hollis, C.; Newcorn, J.H.; Philipsen, A.; Polanczyk, G.V.; Rubia, K.; Sibley, M.H.; et al. Attention-deficit/hyperactivity disorder. Nat. Rev. Dis. Primers 2024, 10, 11. [Google Scholar] [CrossRef]
  2. Cortese, S.; Adamo, N.; Del Giovane, C.; Mohr-Jensen, C.; Hayes, A.J.; Carucci, S.; Atkinson, L.Z.; Tessari, L.; Banaschewski, T.; Coghill, D.; et al. Comparative efficacy and tolerability of medications for attention-deficit hyperactivity disorder in children, adolescents, and adults: A systematic review and network meta-analysis. Lancet Psychiatry 2018, 5, 727–738. [Google Scholar] [CrossRef] [PubMed]
  3. Goodspeed, K.; Armstrong, D.; Dolce, A.; Evans, P.; Said, R.; Tsai, P.; Sirsi, D. Electroencephalographic (EEG) biomarkers in genetic neurodevelopmental disorders. J. Child Neurol. 2023, 38, 466–477. [Google Scholar] [CrossRef]
  4. Hurjui, I.A. Biomarkers and neuropsychological tools in attention-deficit/hyperactivity disorder: Advances and challenges. Medicina 2025, 61, 1211. [Google Scholar] [CrossRef]
  5. Preti, M.G.; Van De Ville, D. Dynamic functional connectivity: State of the art and perspectives. NeuroImage 2017, 160, 41–54. [Google Scholar] [CrossRef]
  6. Zhu, Z.; Wang, H.; Li, X.; Pan, Y.; Li, L. Dynamic functional connectivity changes of resting-state brain network in attention-deficit/hyperactivity disorder. Behav. Brain Res. 2023, 437, 114121. [Google Scholar] [CrossRef] [PubMed]
  7. Chen, H.; Song, Y.; Li, X. A deep learning framework for identifying children with ADHD using an EEG-based brain network. Neurocomputing 2019, 356, 83–96. [Google Scholar] [CrossRef]
  8. Klepl, D.; Wu, M.; He, F. Graph neural network–based EEG classification: A survey. IEEE Trans. Neural Syst. Rehabil. Eng. 2024, 32, 1590–1605. [Google Scholar] [CrossRef]
  9. Sheeraz, M.; Aslam, A.R.; Drakakis, E.M.; Heidari, H.; Altaf, M.A.B.; Saadeh, W. A Closed-Loop Ear-Worn Wearable EEG System with Real-Time Passive Electrode Skin Impedance Measurement for Early Autism Detection. Sensors 2024, 24, 7489. [Google Scholar] [CrossRef]
  10. Ahmadi Moghadam, E.; Abedinzadeh Torghabeh, F.; Hosseini, S.A.; Moattar, M.H. Improved ADHD diagnosis using EEG connectivity and deep learning through combining Pearson correlation coefficient and phase-locking value. Neuroinformatics 2024, 22, 521–537. [Google Scholar] [CrossRef]
  11. Wang, T.; Fang, Y.; Zhang, P.; Ji, M.; Shen, M.; Cao, H.; Zhang, J. DSTMNet: A dual spatiotemporal modeling network for EEG-based emotion recognition. Neurocomputing 2026, 671, 132633. [Google Scholar] [CrossRef]
  12. Amirbay, A.; Baigabylov, N.; Mukhanova, A.; Mukhambetova, K.; Zaitov, E.; Burganova, R.; Khusanova, K.; Akhmedova, F. Autism detection using facial and motor analysis using machine learning. Bull. Electr. Eng. Inform. 2025, 14, 3985–4000. [Google Scholar] [CrossRef]
  13. Snyder, S.M.; Hall, J.R. A meta-analysis of quantitative EEG power associated with attention-deficit/hyperactivity disorder. J. Clin. Neurophysiol. 2006, 23, 440–455. [Google Scholar] [CrossRef]
  14. Arns, M.; Conners, C.K.; Kraemer, H.C. A decade of EEG theta/beta ratio research in ADHD: A meta-analysis. J. Atten. Disord. 2013, 17, 374–383. [Google Scholar] [CrossRef]
  15. Lenartowicz, A.; Loo, S.K. Use of EEG to diagnose ADHD. Curr. Psychiatry Rep. 2014, 16, 498. [Google Scholar] [CrossRef] [PubMed]
  16. Ghaderi, A.H.; Nazari, M.A.; Shahrokhi, H.; Darooneh, A.H. Functional brain connectivity differences between different ADHD presentations: Impaired functional segregation in ADHD-combined presentation but not in ADHD-inattentive presentation. Basic Clin. Neurosci. 2017, 8, 267–278. [Google Scholar] [CrossRef]
  17. Wang, L.; Zhu, C.; He, Y.; Zang, Y.; Cao, Q.; Zhang, H.; Zhong, Q.; Wang, Y. Altered small-world brain functional networks in children with attention-deficit/hyperactivity disorder. Hum. Brain Mapp. 2009, 30, 638–649. [Google Scholar] [CrossRef] [PubMed]
  18. Ekhlasi, A.; Nasrabadi, A.M.; Mohammadi, M.R. Classification of children with ADHD and healthy controls based on EEG directed phase transfer entropy and graph analysis. Front. Biomed. Technol. 2021, 8, 115–122. [Google Scholar] [CrossRef]
  19. Bashivan, P.; Rish, I.; Yeasin, M.; Codella, N. Learning representations from EEG with deep recurrent-convolutional neural networks. arXiv 2015, arXiv:1511.06448. [Google Scholar]
  20. Chugh, N.; Aggarwal, S.; Balyan, A. The hybrid deep learning model for identification of attention-deficit/hyperactivity disorder using EEG. Clin. EEG Neurosci. 2024, 55, 22–33. [Google Scholar] [CrossRef]
  21. Alsharif, N.; Al-Adhaileh, M.H.; Al-Yaari, M. Diagnosis of attention deficit hyperactivity disorder: A deep learning approach. AIMS Math. 2024, 9, 10580–10608. [Google Scholar] [CrossRef]
  22. Luo, L.; Wang, Y.; Zeng, L.; Li, X.; Hu, Y.; Chen, H. Patterns of brain dynamic functional connectivity are linked with attention-deficit/hyperactivity disorder–related behavioral and cognitive dimensions. Psychol. Med. 2023, 53, 6666–6677. [Google Scholar] [CrossRef]
  23. Sastry, N.C.; Banerjee, A. Dynamicity of brain network organization & their community architecture as characterizing features for classification of common mental disorders from whole-brain connectome. Transl. Psychiatry 2024, 14, 268. [Google Scholar] [CrossRef]
  24. Ricchi, I.; Tarun, A.; Petric Maretic, H.; Frossard, P.; Van De Ville, D. Dynamics of functional network organization through graph mixture learning. NeuroImage 2022, 252, 119037. [Google Scholar] [CrossRef]
  25. Chen, L.; Qiao, C.; Ren, K.; Qu, G.; Calhoun, V.D.; Stephen, J.M.; Wilson, T.W.; Wang, Y.-P. Explainable spatio-temporal graph evolution learning with applications to dynamic brain network analysis during development. NeuroImage 2024, 298, 120771. [Google Scholar] [CrossRef] [PubMed]
  26. Ekhlasi, A.; Nasrabadi, A.M.; Mohammadi, M.R. Analysis of EEG brain connectivity of children with ADHD using graph theory and directional information transfer. Biomed. Eng. Biomed. Tech. 2023, 68, 423–435. [Google Scholar] [CrossRef] [PubMed]
  27. Bakhtyari, M.; Mirzaei, S. ADHD detection using dynamic connectivity patterns of EEG data and ConvLSTM with attention framework. Biomed. Signal Process. Control 2022, 76, 103708. [Google Scholar] [CrossRef]
  28. Nasrabadi, A.M.; Allahverdy, A.; Samavati, M.; Mohammadi, M. EEG Data for ADHD/Control Children. IEEE DataPort. Available online: https://ieee-dataport.org/open-access/eeg-data-adhd-control-children (accessed on 20 May 2026).
  29. Esas, M.Y.; Latifoğlu, F. Detection of ADHD from EEG Signals Using New Hybrid Decomposition and Deep Learning Techniques. J. Neural Eng. 2023, 20, 036028. [Google Scholar] [CrossRef]
  30. Alim, A.; Imtiaz, M.H. Automatic Identification of Children with ADHD from EEG Brain Waves. Signals 2023, 4, 193–205. [Google Scholar] [CrossRef]
  31. Bansal, K.; Singh, A.; Juneja, A.; Chugh, N.; Balyan, A. Scale-Specific Dynamics of High-Amplitude Bursts in EEG Capture Behaviorally Meaningful Variability. NeuroImage 2021, 241, 118425. [Google Scholar] [CrossRef]
Figure 1. EEG preprocessing and dynamic connectivity pipeline.
Computers 15 00333 g001
Figure 2. Row-wise distribution of EEG data for subject-level train, validation, and test splits.
Computers 15 00333 g002
Figure 3. Example of raw and preprocessed EEG segments for controls and ADHD patients.
Computers 15 00333 g003
Figure 4. Hybrid Multihead Spatio-Temporal graph transformer index model for extracting a network index of dynamic functional connectivity from EEG.
Computers 15 00333 g004
Figure 5. Proportion of amplitude spikes for individual EEG channels.
Computers 15 00333 g005
Figure 6. Difference in average EEG amplitudes between classes (class 1–class 0) by channel.
Computers 15 00333 g006
Figure 7. Interchannel EEG correlation matrices calculated from raw EEG amplitudes: (a) full sample, (b) control group, and (c) ADHD group.
Computers 15 00333 g007
Figure 8. Community-structured interchannel EEG correlation matrices calculated from raw EEG amplitudes for (a) control subjects and (b) ADHD subjects. Channels are reordered according to functional community structure.
Computers 15 00333 g008
Figure 9. Spatial-frequency distribution of relative EEG spectral power calculated from band-limited oscillatory activity for (a) control subjects, (b) ADHD subjects, and (c) the difference matrix (ADHD–Control).
Computers 15 00333 g009
Figure 10. Occupancy of dynamic states of functional connectivity in groups 0 and 1.
Computers 15 00333 g010
Figure 11. Proportion of explained variance in the principal components of functional connectivity features.
Computers 15 00333 g011
Figure 12. Average results of cross-validation of logistic regression on functional connectivity features.
Computers 15 00333 g012
Figure 13. ROC curve of the logistic classifier based on functional connectivity features.
Computers 15 00333 g013
Figure 14. Discriminative weights of EEG functional connectivity (modulus of L1 logistic regression coefficients).
Computers 15 00333 g014
Figure 15. Nodal discriminative value of EEG channels (sum of L1 connectivity weights).
Computers 15 00333 g015
Figure 16. Subject-level distributions of connectivity-based network indices for the proposed hybrid model and baseline approaches on the independent test cohort.
Computers 15 00333 g016
Figure 17. Density distributions of the subject-level network index for control and ADHD groups across all compared models.
Computers 15 00333 g017
Figure 18. Learning curves and subject-level validation dynamics for dynamic models and regularization configurations.
Computers 15 00333 g018
Table 1. Dataset card for the EEG dataset used in this study.
FieldValue
Rows2,166,383
Subjects121
ADHD subjects61
Control subjects60
EEG channels19
Sampling frequency128 Hz
Documented age range7–12 years
Diagnostic framingADHD versus typically developing controls
Public redistributionKaggle EEG Dataset for ADHD
Original public-data traceNasrabadi, Allahverdy, Samavati, and Mohammadi,
EEG data for ADHD/Control children,
IEEE DataPort, DOI: 10.21227/rzfh-zn36 [28]
EthicsPublic anonymized dataset reused for secondary analysis;
no new data collection in this notebook
Table 2. Subject-level distribution of ADHD and control groups.
Class_Namen_Subjectsn_Rows
ADHD611,207,069
Control60959,314
Table 3. Summary of preprocessing parameters and model hyperparameters.
ParameterValue
Sampling frequency128 Hz
Connectivity window512 samples (4.0 s)
Window step256 samples (0.512 s)
Sequence length10 windows
Sequence stride5 windows
Adjacency threshold0.40
Subject aggregationmean
Fixed decision threshold0.0
Proposed-model GRU hidden size64
Proposed-model attention heads4
Proposed-model encoder layers1
Proposed-model width d_model64
Static GCN hidden size32
Optimizer for proposed modelAdamW
Proposed-model learning rate4 × 10−4
Batch size64
Checkpoint criterionBest validation child-level composite (0.55 × balanced accuracy + 0.45 × AUC)
Early-stopping patience5 epochs
Maximum epochs16
Proposed-model dropout0.25
Proposed-model weight decay3 × 10−4
Reduced-regularization ablation dropout0.15
Reduced-regularization ablation weight decay1 × 10−4
Table 4. Ranked EEG channels based on combined spectral and connectivity effect sizes.
ChannelRegionTheta_Beta_Ratio_dFusion_Strength_dCombined_Rank_Score
O1occipital−0.3432−0.63670.9799
P7parietotemporal−0.3407−0.58580.9265
Fp1frontopolar−0.3452−0.54110.8863
P3parietal−0.4077−0.38400.7917
Fzmidline frontal−0.3751−0.37200.7471
T7temporal−0.3739−0.33450.7085
O2occipital−0.3737−0.33070.7044
Pzmidline parietal−0.3113−0.27700.5883
C3central−0.3243−0.20870.5330
F3frontal−0.3490−0.17070.5197
P4parietal−0.33750.16650.5040
P8parietotemporal−0.2844−0.19670.4811
F7frontotemporal−0.2728−0.18780.4606
Fp2frontopolar−0.0433−0.40600.4493
T8temporal−0.3748−0.02050.3952
C4central−0.37010.02270.3928
Czmidline central−0.27080.09580.3666
F4frontal−0.2863−0.00900.2953
F8frontotemporal−0.2245−0.03870.2633
Table 5. Bootstrap confidence intervals for subject-level performance metrics.
ModelN (Test)Balanced Accuracy95% CI (BA)AUC-ROC95% CI (AUC)Sensitivity95% CI (Sens)Specificity95% CI (Spec)
Proposed Hybrid ST Graph Transformer190.6222[0.411, 0.833]0.7444[0.489, 0.944]0.8[0.500, 1.000]0.4444[0.111, 0.778]
Proposed model
ablation
190.6222[0.411, 0.833]0.7333[0.478, 0.944]0.8[0.500, 1.000]0.4444[0.111, 0.778]
GRU dynamic index190.5722[0.356, 0.789]0.6556[0.378, 0.889]0.7[0.400, 1.000]0.4444[0.111, 0.778]
Global graph-metric index190.5667[0.361, 0.778]0.6333[0.356, 0.867]0.8[0.500, 1.000]0.3333[0.000, 0.667]
Linear oscillatory
index
190.5167[0.306, 0.728]0.4667[0.189, 0.744]0.7[0.400, 1.000]0.3333[0.000, 0.667]
Static GCN index190.5[0.500, 0.500]0.4[0.156, 0.678]1[1.000, 1.000]0[0.000, 0.000]
Sparse oscillatory index190.4667[0.256, 0.678]0.4667[0.200, 0.744]0.6[0.300, 0.900]0.3333[0.111, 0.667]
Table 6. Performance comparison for theta-, beta-, and combined connectivity models.
Modeling VariantOverall
Accuracy
Balanced AccuracyAUC-ROCDistribution Overlap (Frequency-Specific Representation)
Theta Connectivity Only0.63160.62780.73330.6785
Beta Connectivity Only0.63160.62780.56670.9346
Joint Theta + Beta Connectivity0.63160.62220.74440.7155
Table 7. Largest intergroup connectivity differences in theta and beta bands.
RangeInterchannel EdgeADHD Control DifferenceAbsolute Shift
BetaC4-P40.16740.1674
BetaP4-Cz0.13180.1318
BetaT8-P80.12170.1217
BetaF3-Fz0.11580.1158
BetaCz-Pz0.10570.1057
BetaO1-P7−0.10340.1034
BetaP4-T80.10130.1013
BetaF4-F80.09770.0977
ThetaFp1-O1−0.12980.1298
ThetaFp1-P7−0.12920.1292
ThetaP7-Fz−0.12620.1262
ThetaO1-Fz−0.1230.123
ThetaF3-O1−0.12170.1217
ThetaFp1-P3−0.11890.1189
ThetaO1-P7−0.11610.1161
ThetaF3-C3−0.10990.1099
Table 8. Clinical performance indicators of the selected classification operating point.
Clinical IndicatorValue
Number of children in the test sample19
Distributed network index overlap0.45
Sensitivity0.8
Specificity0.4444
Positive predictive value in the test sample0.6154
Balanced accuracy0.6222
Table 9. Child-level diagnostic performance of all models on the test set.
Display_ModelAccuracyBalanced_AccuracySensitivitySpecificityPrecisionf1auc_rocMean_Metric_RankCohens_dDistribution_Overlap
Proposed Hybrid ST Graph Transformer0.63160.62220.80000.44440.61540.69570.744410.72890.45
Proposed model ablation0.63160.62220.80000.44440.61540.69570.73331.33330.66490.7395
GRU dynamic index0.57890.57220.70000.44440.58330.63640.65562.33330.66380.7400
Global graph-metric index0.57890.56670.80000.33330.57140.66670.633330.55150.7827
Linear oscillatory index0.52630.51670.70000.33330.53850.60870.466740.04050.9839
Static GCN index0.52630.500010.00000.52630.68970.40004.6667−0.49900.8030
Sparse oscillatory index0.47370.46670.60000.33330.50000.54550.466750.09230.9632
Table 10. Regularization ablation study of the proposed hybrid model on the child-level test set.
Display_ModelAccuracyBalanced_AccuracySensitivitySpecificityf1auc_rocMean_Metric_Rank
Proposed Hybrid ST Graph Transformer0.63160.62220.80000.44440.69570.74441
Proposed model ablation0.63160.62220.80000.44440.69570.73331.3333
Table 11. Network index separability metrics on the test set (n_test = 234).
ModelMean0Mean1Std0Std1ΔmeanSeparationCohen’s dPearson rOverlapSilhouette
Linear_network_index−3.404.407.264.087.800.691.320.550.510.25
Sparse_linear_network_index−0.802.222.772.573.020.571.130.490.570.14
Global_graph_metric_network_index−0.070.070.380.430.140.170.340.170.870.05
RNN_dynamic_connectivity_index−3.454.426.235.397.870.681.350.560.500.31
Static_GCN_brain_network_index−0.03−0.030.000.000.000.210.420.210.830.05
Spatio_temporal_GCN_brain_network_index0.100.220.250.270.120.230.470.230.810.05
Multihead_spatio_temporal_graph_transformer_index−2.913.304.283.976.210.751.510.600.450.32
Disclaimer/Publisher’s Note: The statements, opinions and data contained in all publications are solely those of the individual author(s) and contributor(s) and not of MDPI and/or the editor(s). MDPI and/or the editor(s) disclaim responsibility for any injury to people or property resulting from any ideas, methods, instructions or products referred to in the content.