Author Contributions
Conceptualization, Y.Y., Y.Z. and G.C.; methodology, Y.Y., Y.Z. and G.C.; software, Y.Y. and B.H.; validation, Y.Y., Y.Z. and G.C.; formal analysis, Y.Y. and B.H.; investigation, Y.Y., Y.Z. and G.C.; resources, Y.Y., Y.Z. and G.C.; data curation, Y.Y.; writing—original draft preparation, Y.Y. and B.H.; writing—review and editing, G.C. and Y.Z.; visualization, Y.Y. and B.H.; supervision, G.C. and Y.Z.; project administration, G.C.; funding acquisition, Y.Z. All authors have read and agreed to the published version of the manuscript.
Figure 1.
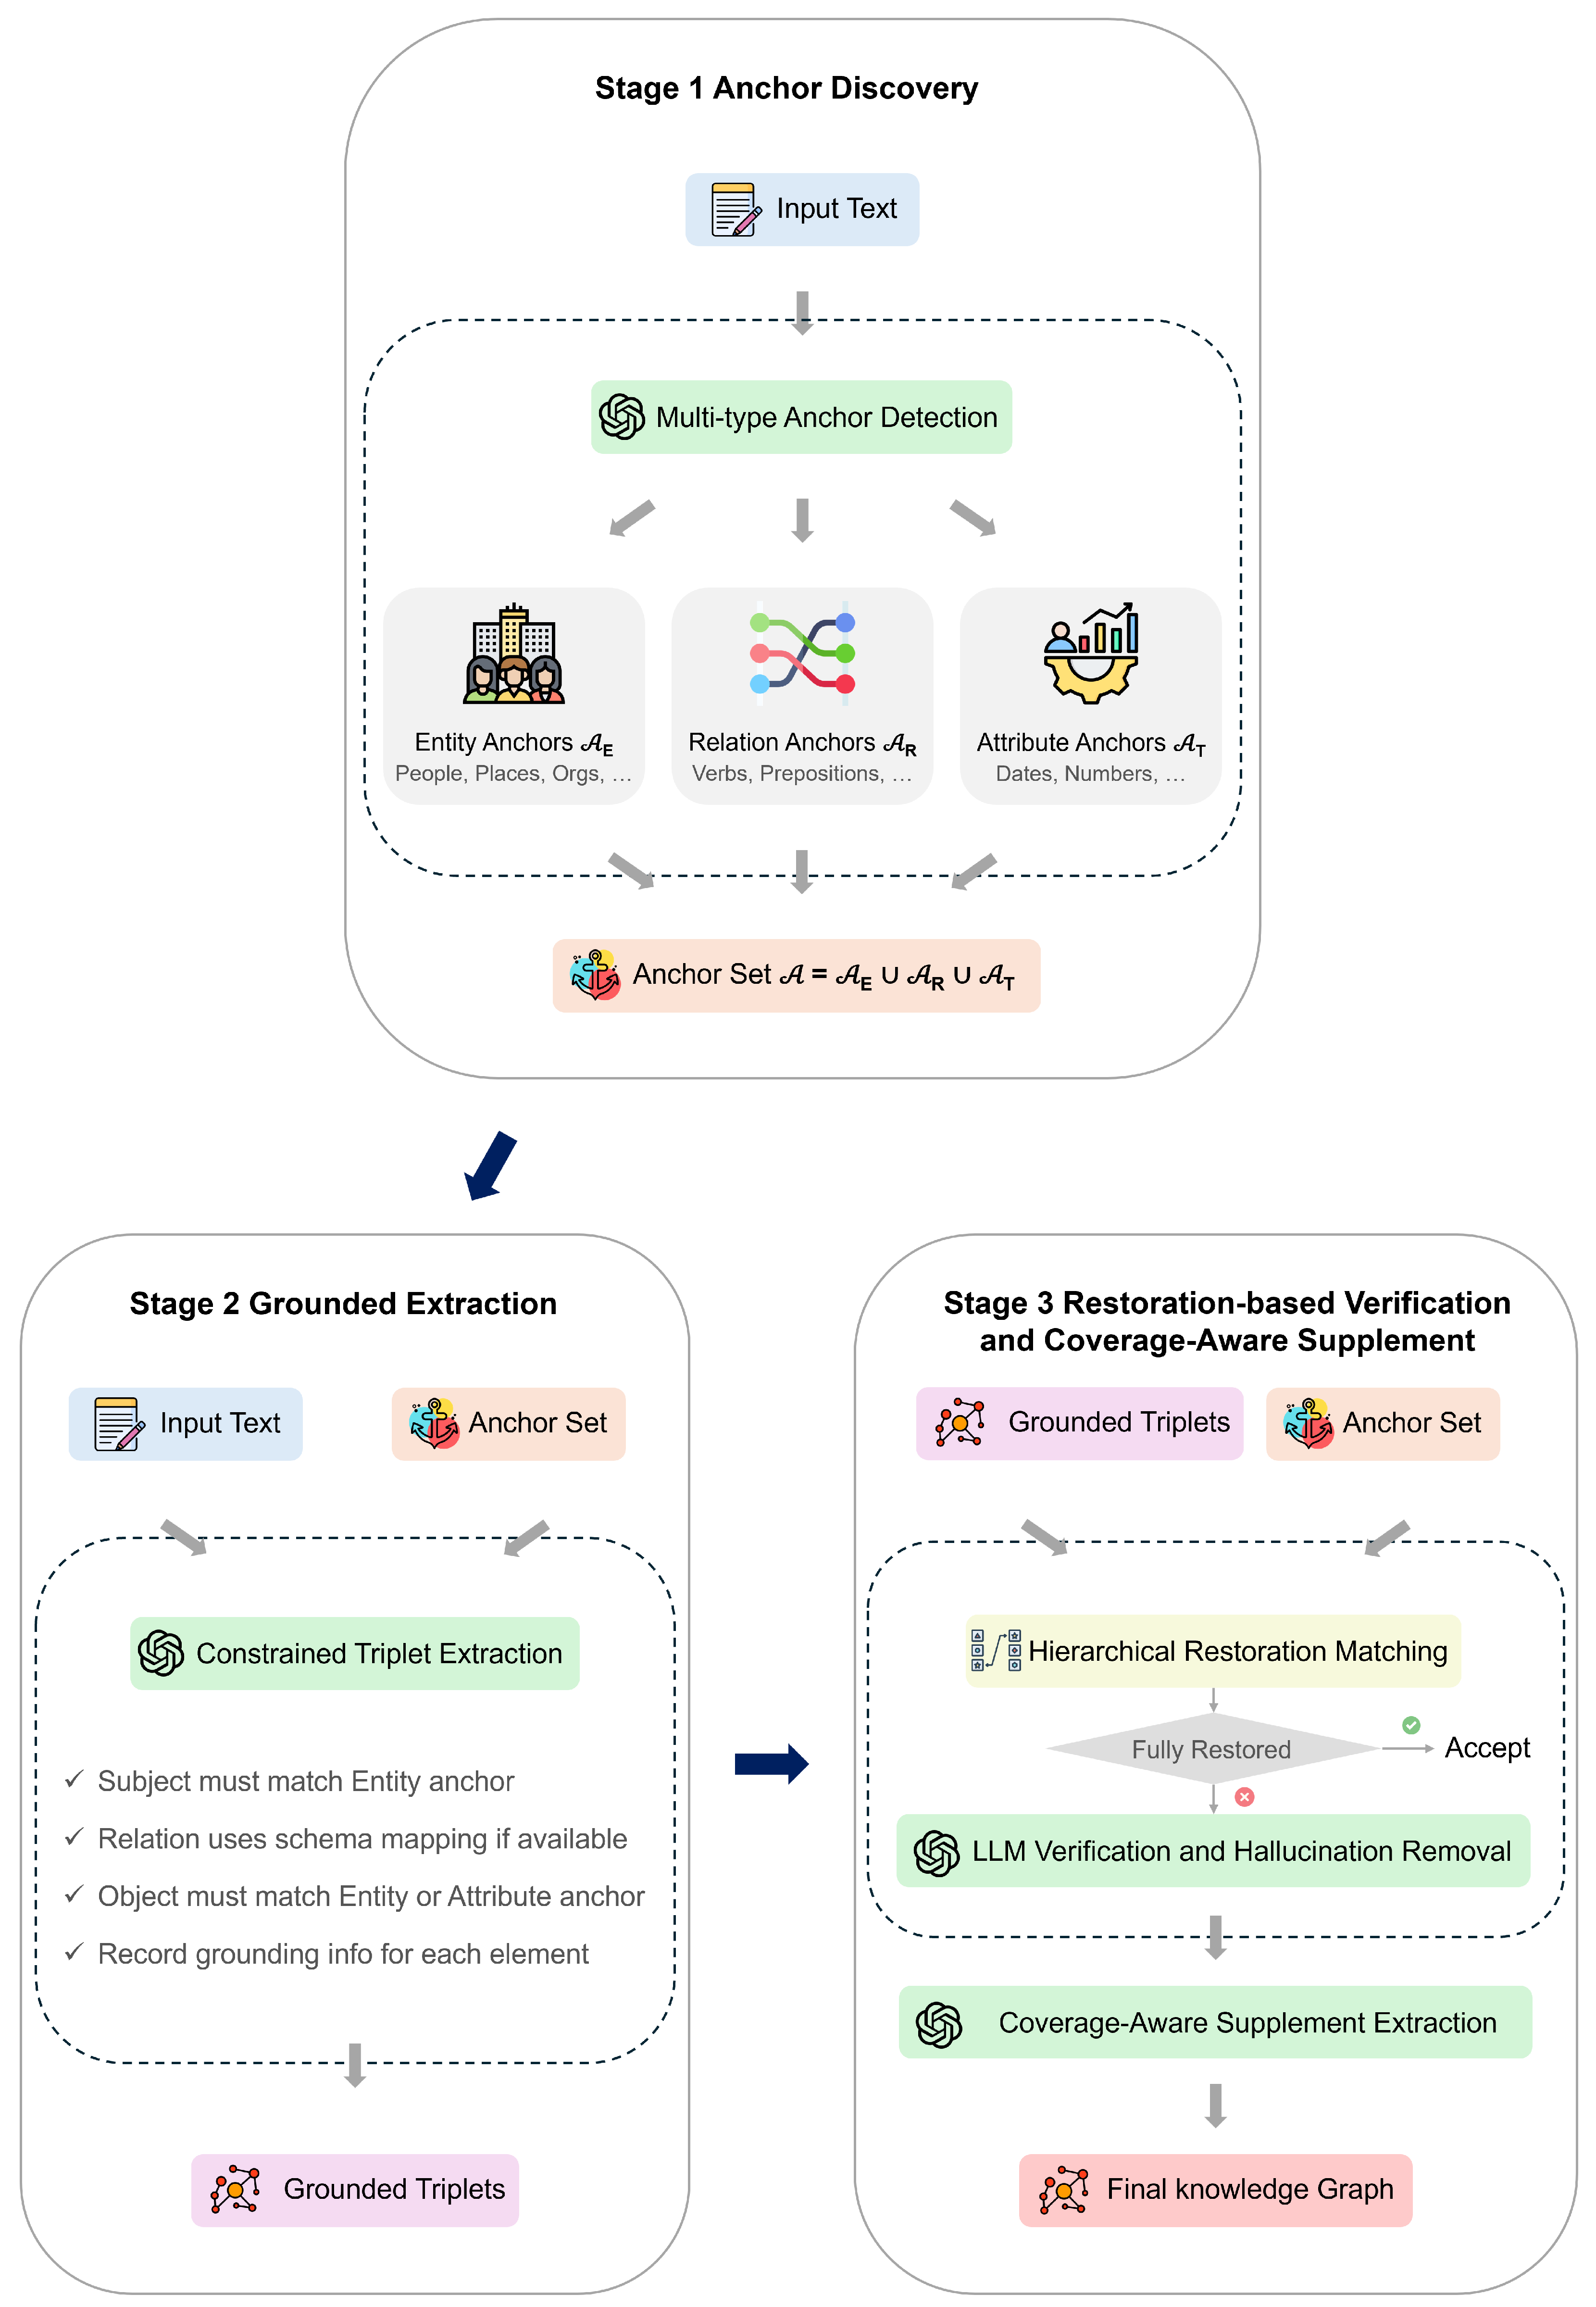
The AEVS framework architecture. Blue labels denote inputs, green labels denote LLM processing steps. Arrows indicate data flow between stages. Stage 1 (anchor discovery) identifies entity, relation, and attribute anchors with character-level positions, forming a closed vocabulary . Stage 2 (grounded extraction) extracts triplets constrained by , producing grounded triplets with provenance annotations. Stage 3 (restoration-based verification and coverage-aware supplement) verifies each triplet through independent restoration matching; fully restored triplets are accepted directly, while partially restored ones undergo LLM verification. A coverage-aware supplement mechanism ensures comprehensive extraction by targeting unused anchors.
Figure 1.
The AEVS framework architecture. Blue labels denote inputs, green labels denote LLM processing steps. Arrows indicate data flow between stages. Stage 1 (anchor discovery) identifies entity, relation, and attribute anchors with character-level positions, forming a closed vocabulary . Stage 2 (grounded extraction) extracts triplets constrained by , producing grounded triplets with provenance annotations. Stage 3 (restoration-based verification and coverage-aware supplement) verifies each triplet through independent restoration matching; fully restored triplets are accepted directly, while partially restored ones undergo LLM verification. A coverage-aware supplement mechanism ensures comprehensive extraction by targeting unused anchors.
Figure 2.
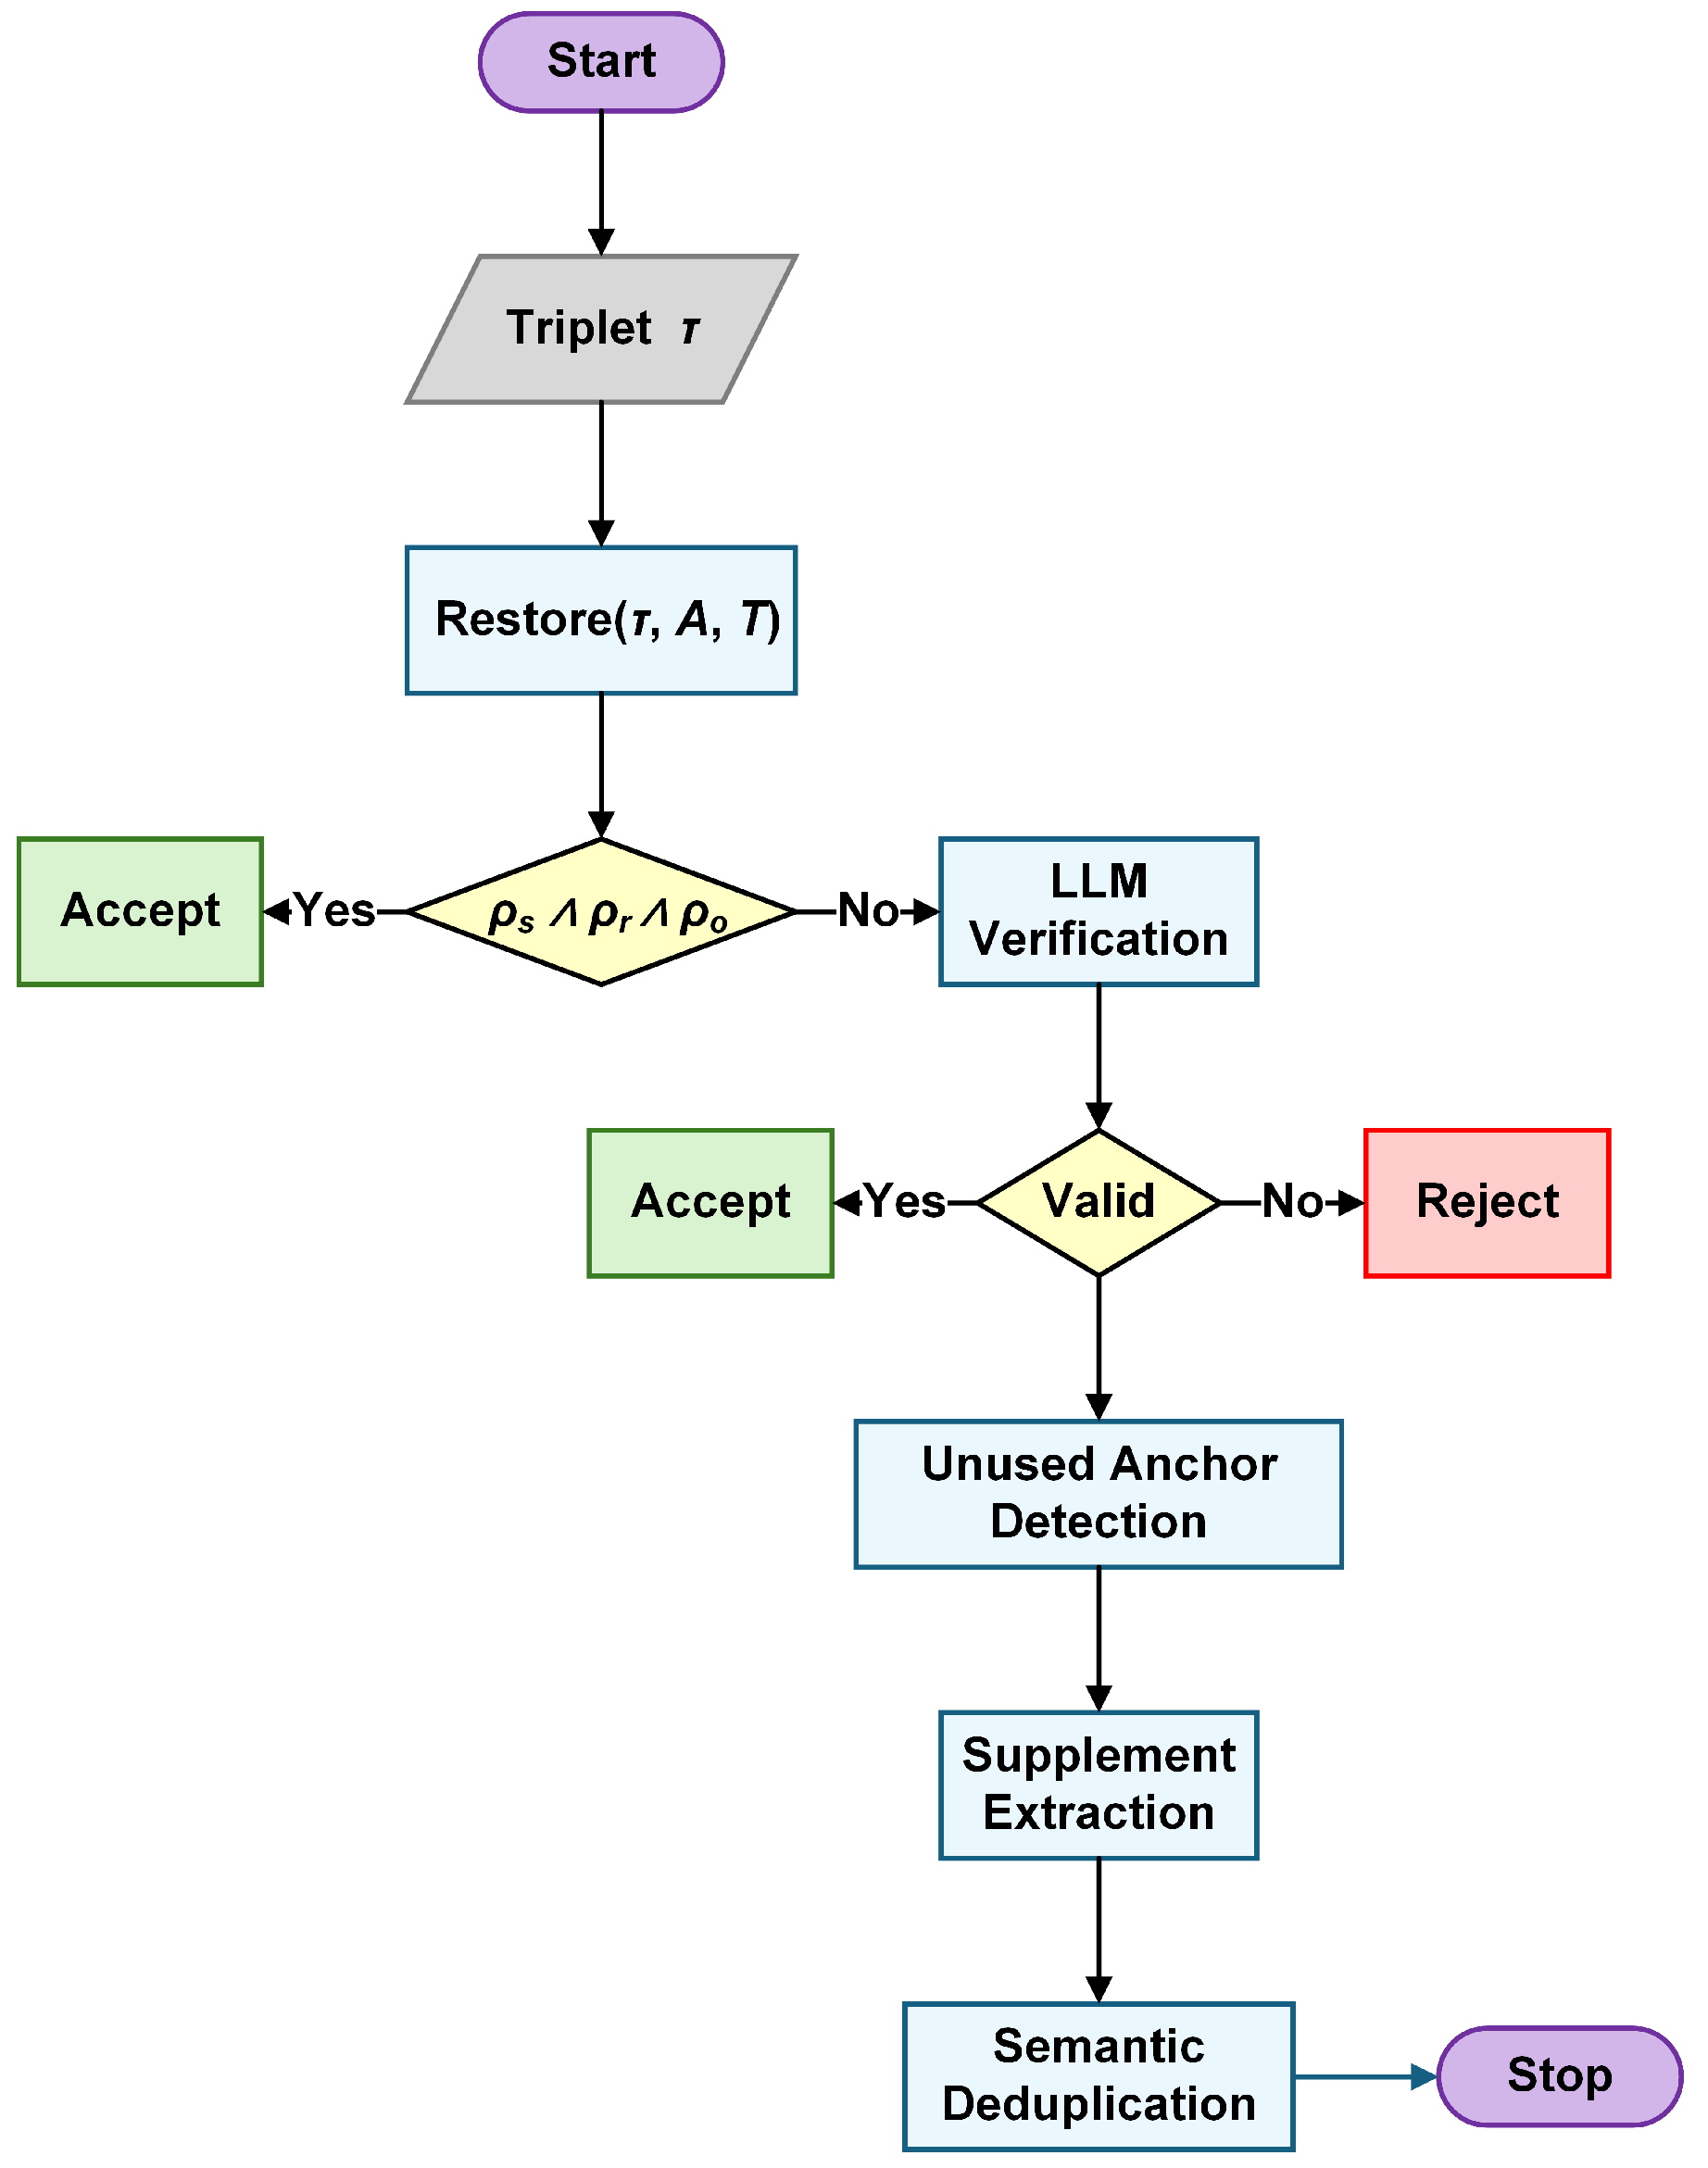
Verification workflow in Stage 3. Each triplet undergoes restoration matching, where fully restored triplets are accepted directly, while partially restored ones are sent to LLM verification. After verification, unused anchors trigger supplement extraction with semantic deduplication.
Figure 2.
Verification workflow in Stage 3. Each triplet undergoes restoration matching, where fully restored triplets are accepted directly, while partially restored ones are sent to LLM verification. After verification, unused anchors trigger supplement extraction with semantic deduplication.
Figure 3.
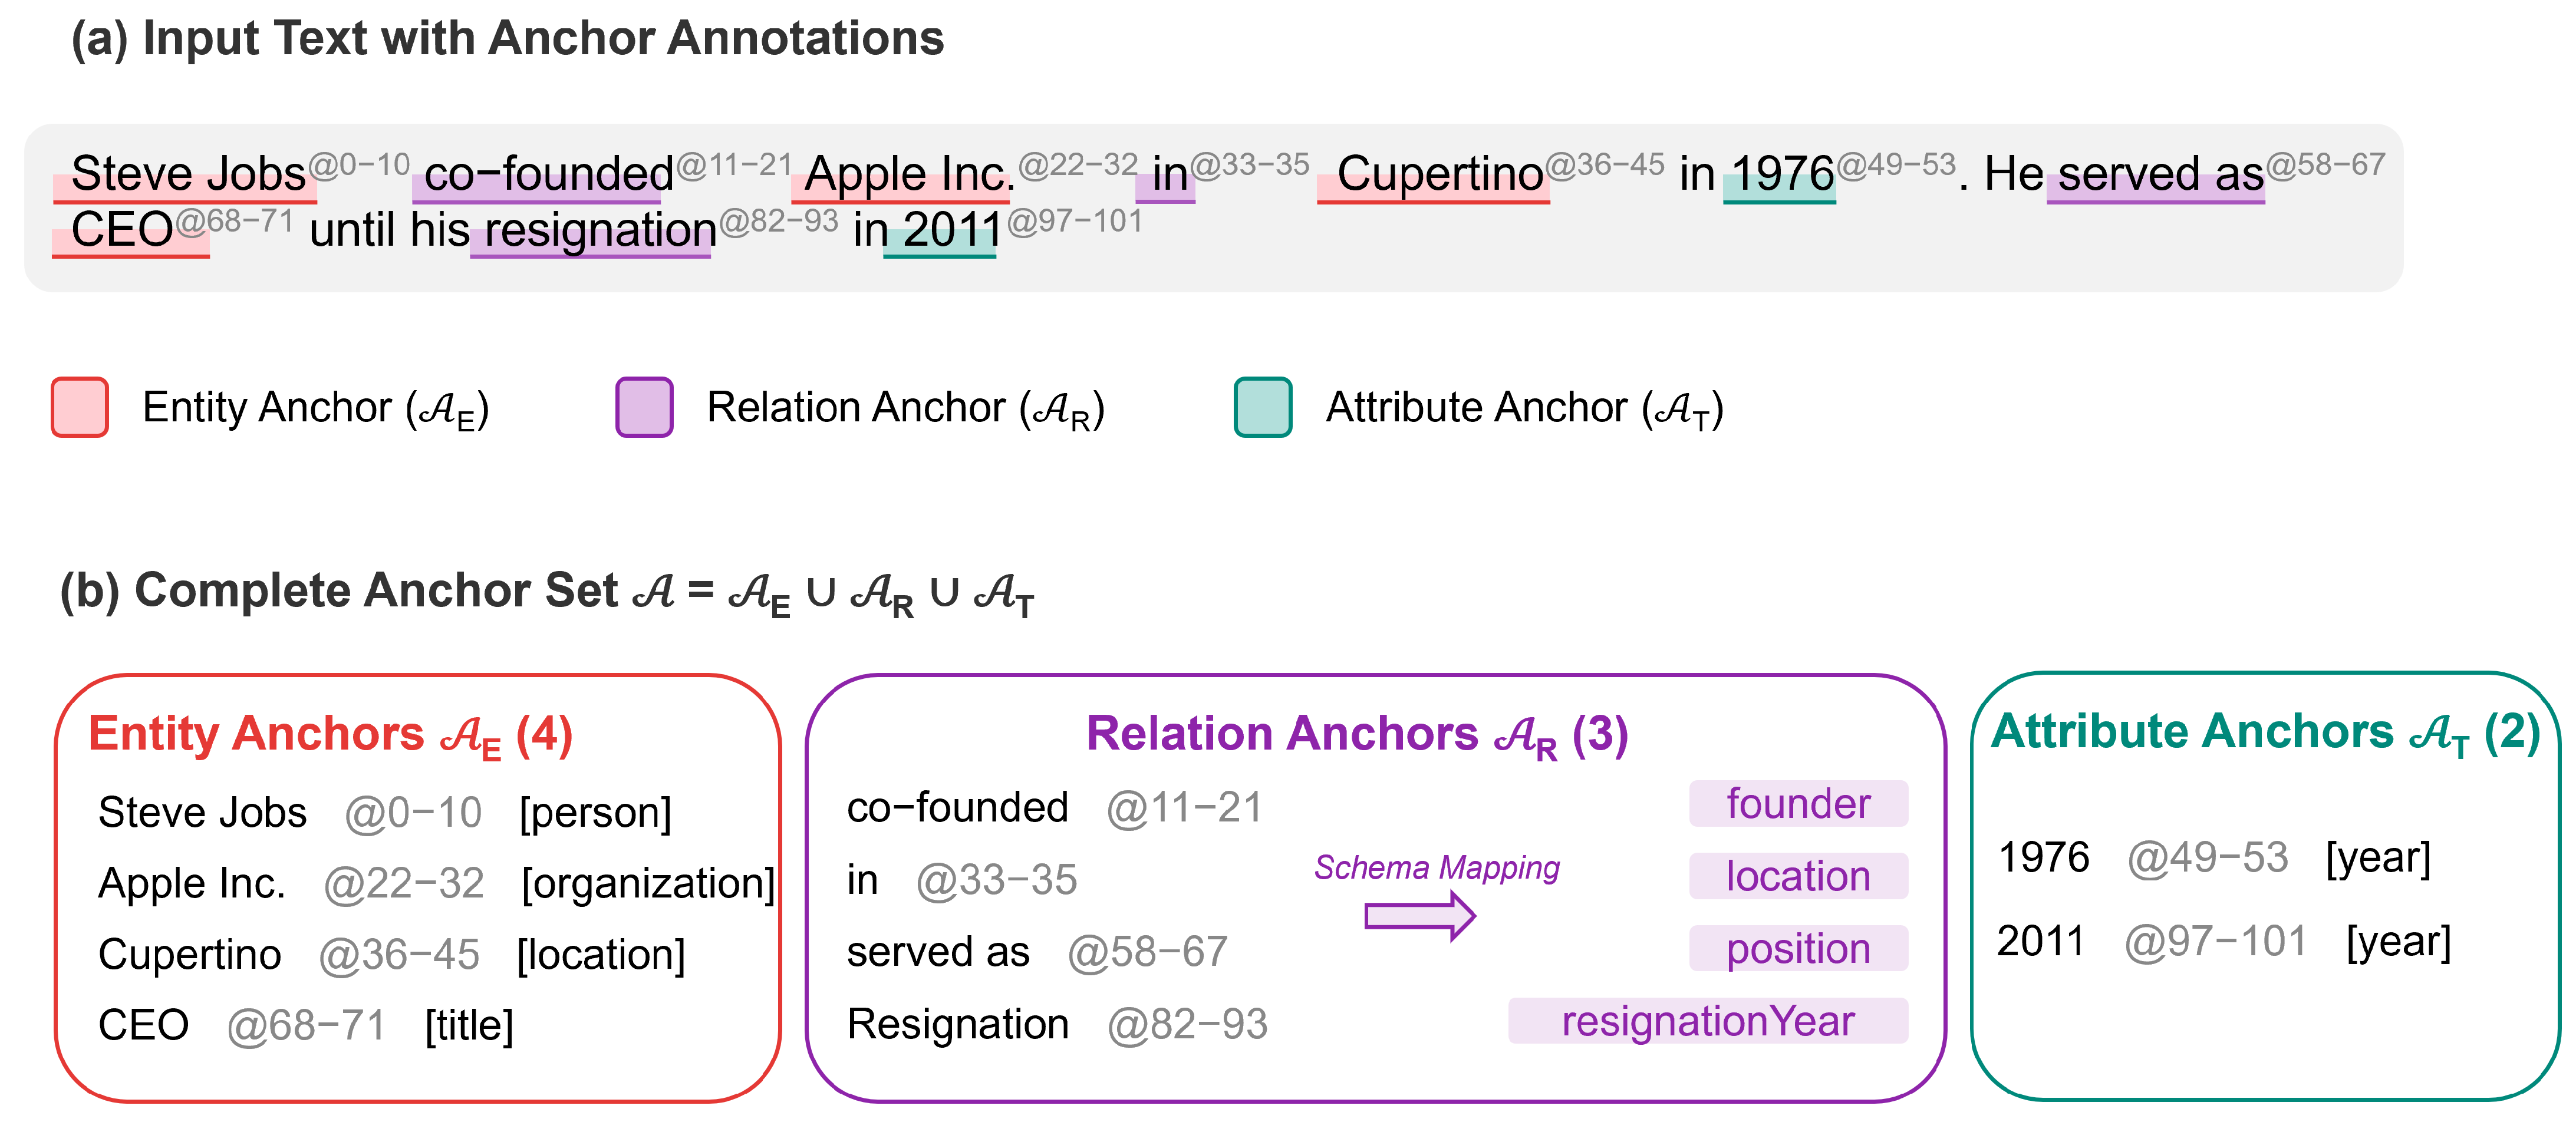
Stage 1 example: anchor discovery. (a) Input text with color-coded anchor annotations—entity (red), relation (purple), and attribute (teal)—each with character positions. (b) Complete anchor set , with relation anchors showing schema mappings .
Figure 3.
Stage 1 example: anchor discovery. (a) Input text with color-coded anchor annotations—entity (red), relation (purple), and attribute (teal)—each with character positions. (b) Complete anchor set , with relation anchors showing schema mappings .
Figure 4.
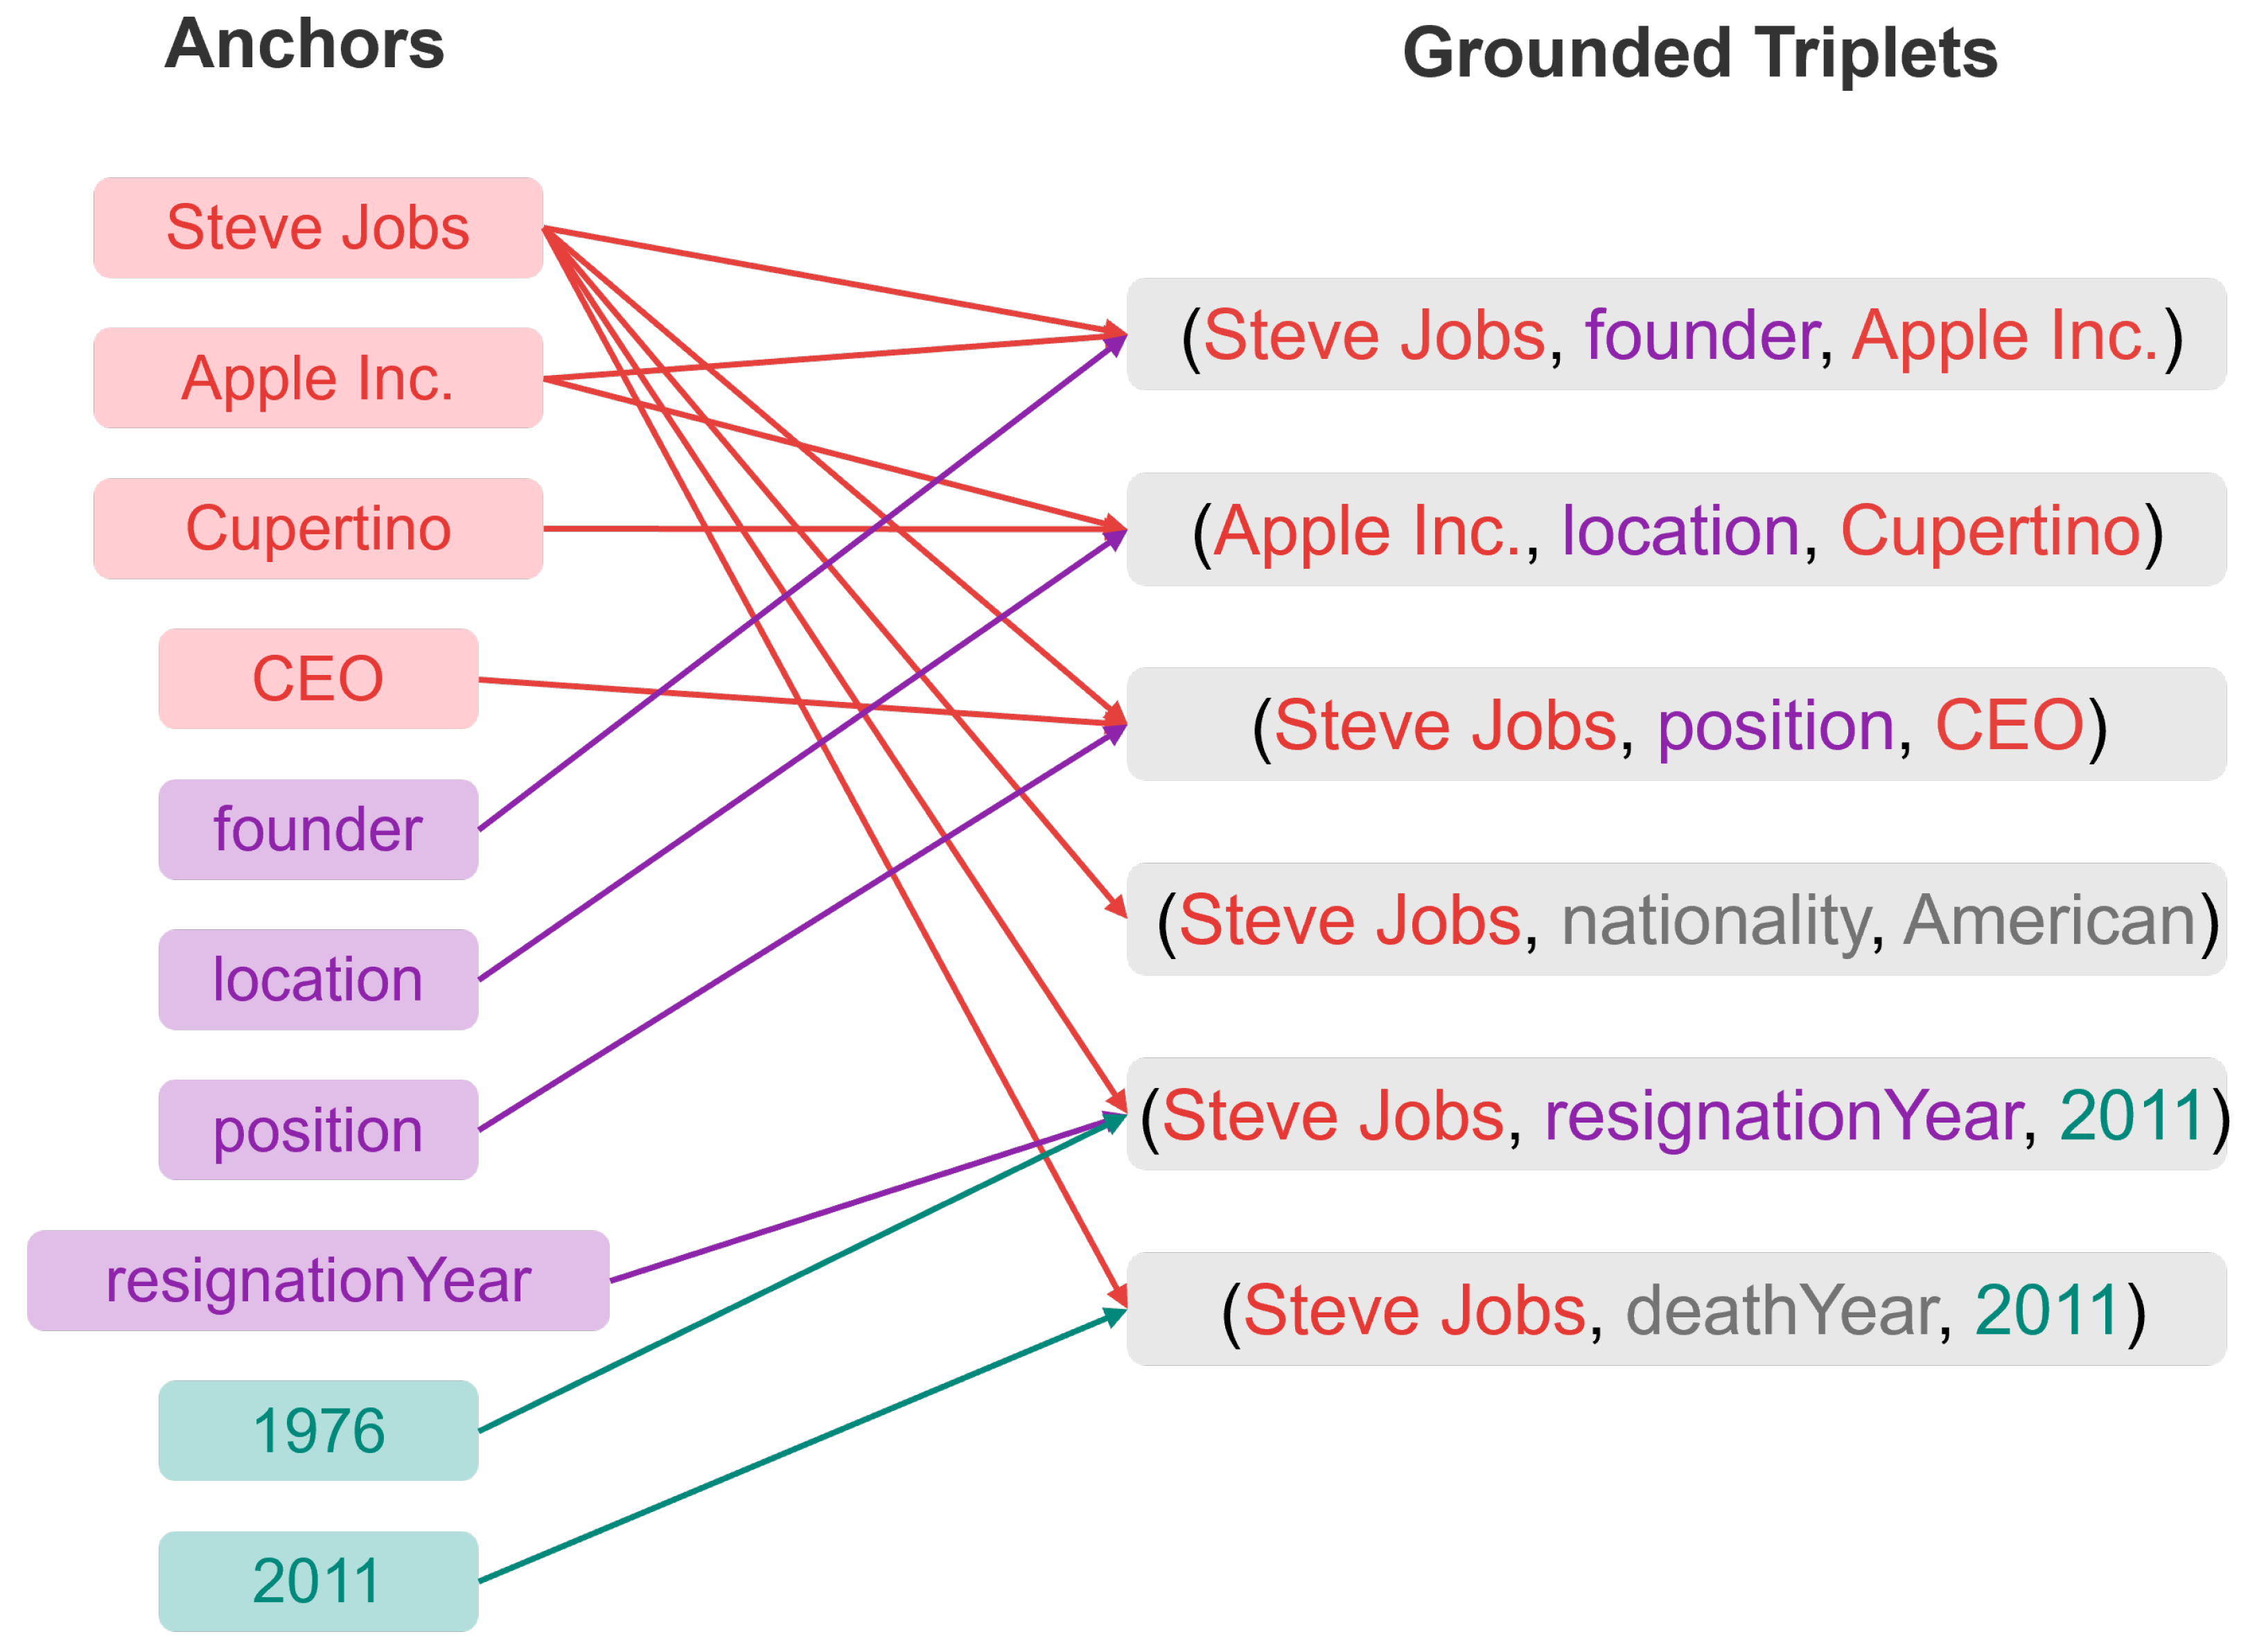
Stage 2 example: grounded extraction. Pink, purple, and teal boxes represent entity, relation, and attribute anchors, respectively. Matching colored arrows and text indicate grounding links; gray text marks ungrounded elements. Arrows show grounding links from anchors to triplet elements. Triplets – are fully grounded; – contain ungrounded elements (highlighted) that will require verification.
Figure 4.
Stage 2 example: grounded extraction. Pink, purple, and teal boxes represent entity, relation, and attribute anchors, respectively. Matching colored arrows and text indicate grounding links; gray text marks ungrounded elements. Arrows show grounding links from anchors to triplet elements. Triplets – are fully grounded; – contain ungrounded elements (highlighted) that will require verification.
Figure 5.
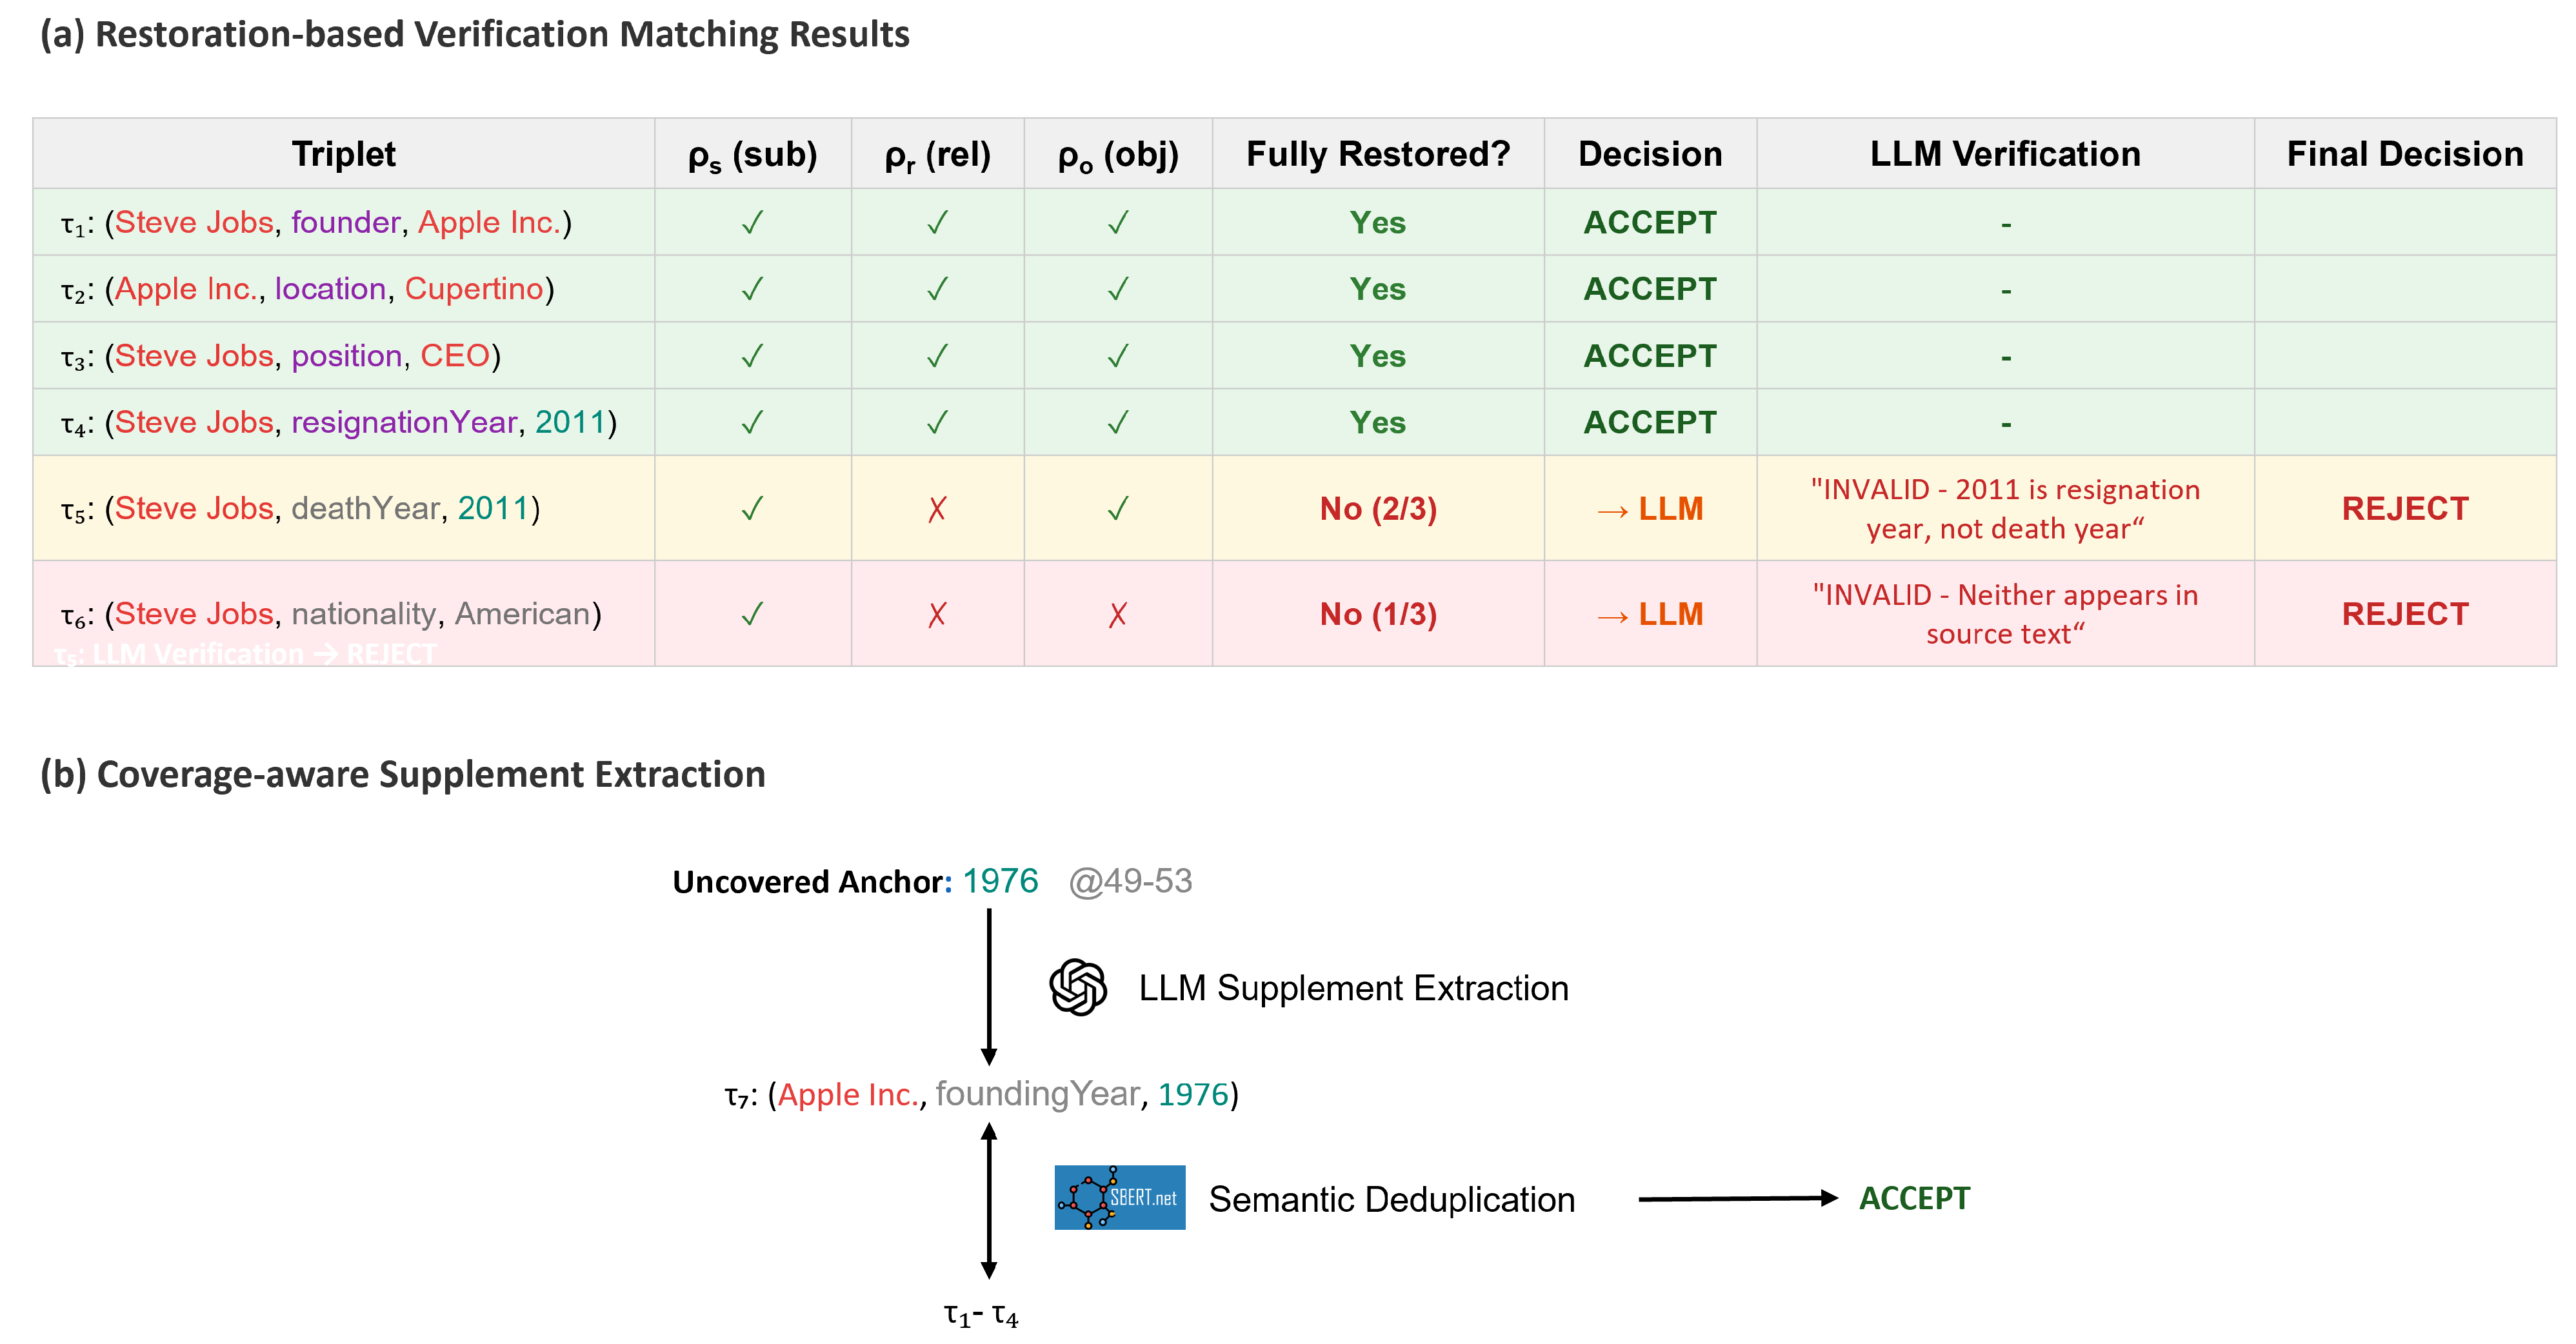
Stage 3 example: restoration-based verification and coverage-aware supplement. (a) Restoration matching results with element-level status . Green checkmarks and red crosses indicate successful and failed element restoration, respectively; green “ACCEPT” and red “REJECT” denote final decisions. Triplets – were fully restored and directly accepted. (b) LLM verification rejected (deathYear unsupported) and (hallucinated nationality). Coverage-aware supplement extracted for unused anchor “1976”. Final result: 5 verified triplets.
Figure 5.
Stage 3 example: restoration-based verification and coverage-aware supplement. (a) Restoration matching results with element-level status . Green checkmarks and red crosses indicate successful and failed element restoration, respectively; green “ACCEPT” and red “REJECT” denote final decisions. Triplets – were fully restored and directly accepted. (b) LLM verification rejected (deathYear unsupported) and (hallucinated nationality). Coverage-aware supplement extracted for unused anchor “1976”. Final result: 5 verified triplets.
Figure 6.
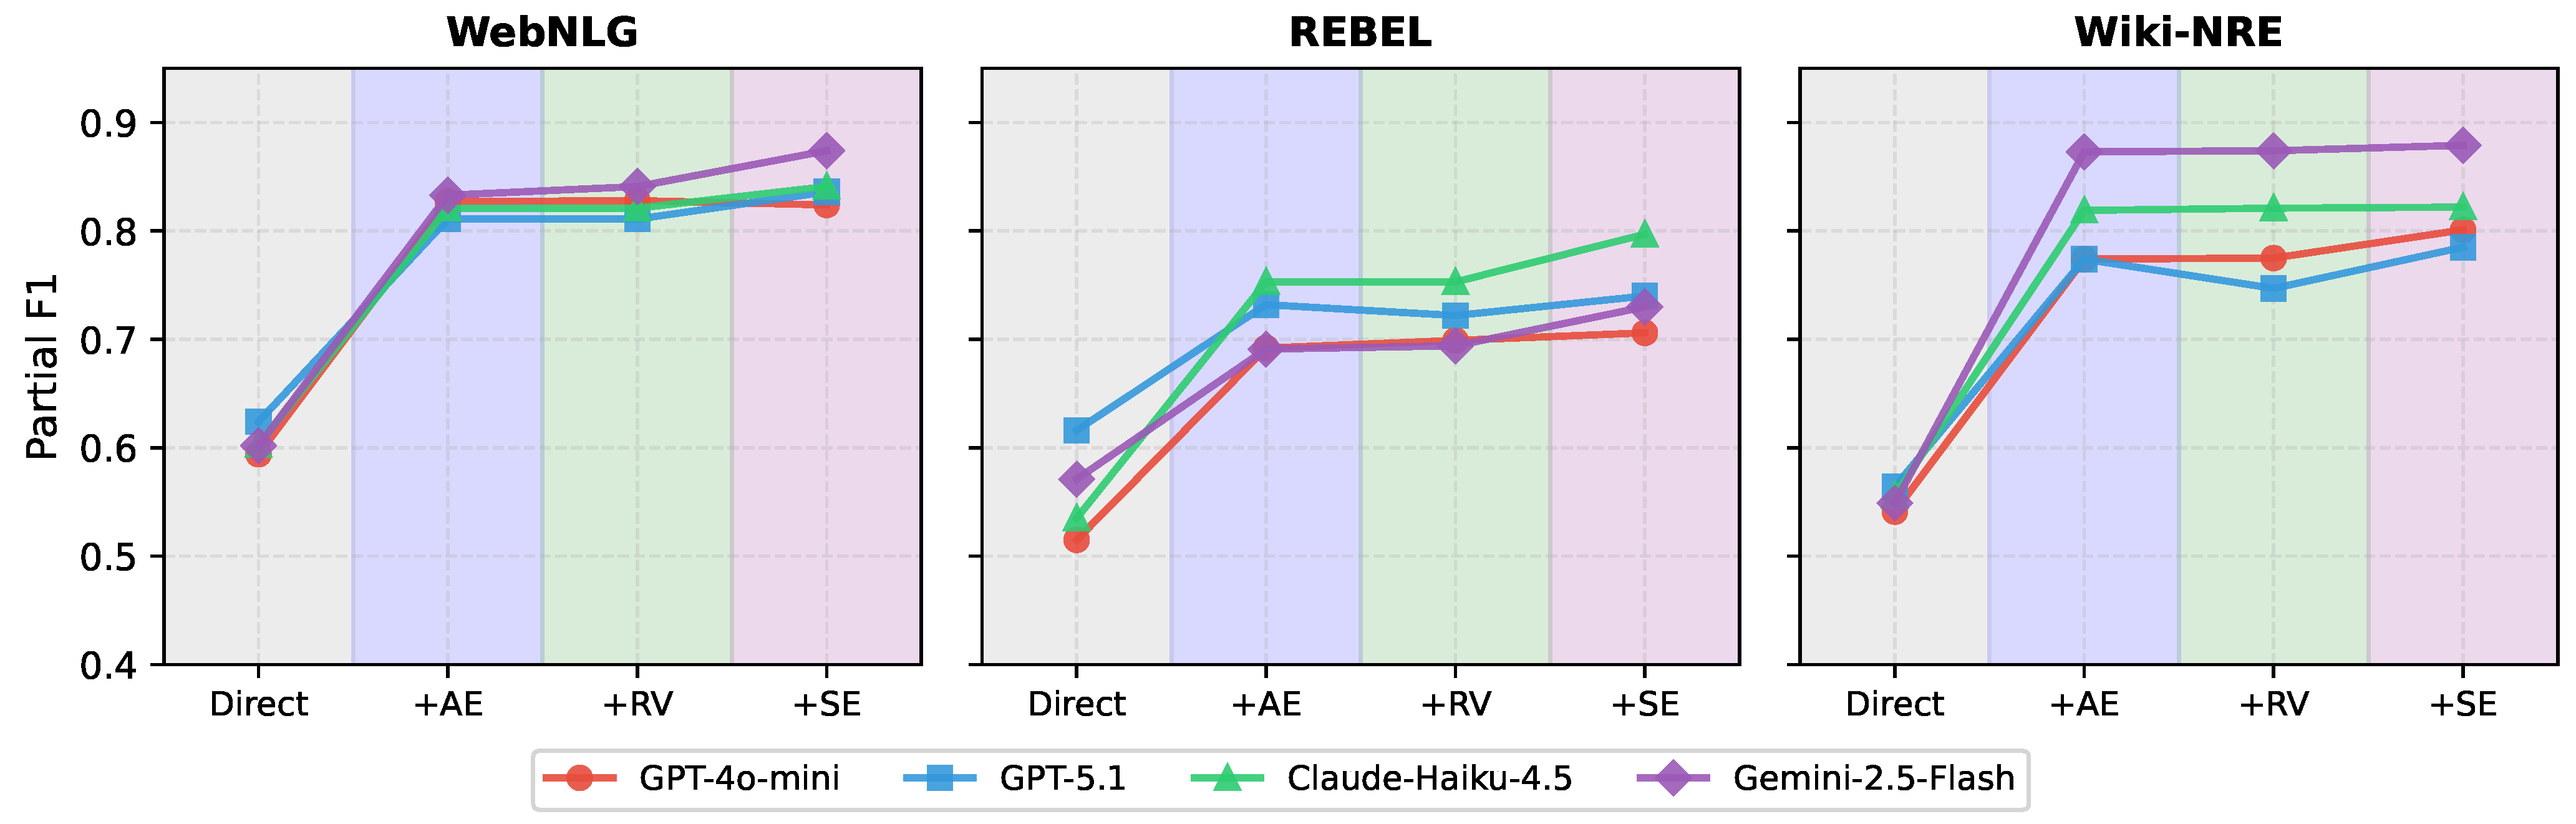
Ablation study results under partial matching. Background colors indicate progressive component additions: gray (direct baseline), purple (+AE), green (+RV), and pink (+SE). The most substantial improvement occurred upon adding anchor-based extraction, validating the effectiveness of text-grounded constraint in reducing hallucinated outputs.
Figure 6.
Ablation study results under partial matching. Background colors indicate progressive component additions: gray (direct baseline), purple (+AE), green (+RV), and pink (+SE). The most substantial improvement occurred upon adding anchor-based extraction, validating the effectiveness of text-grounded constraint in reducing hallucinated outputs.
Figure 7.
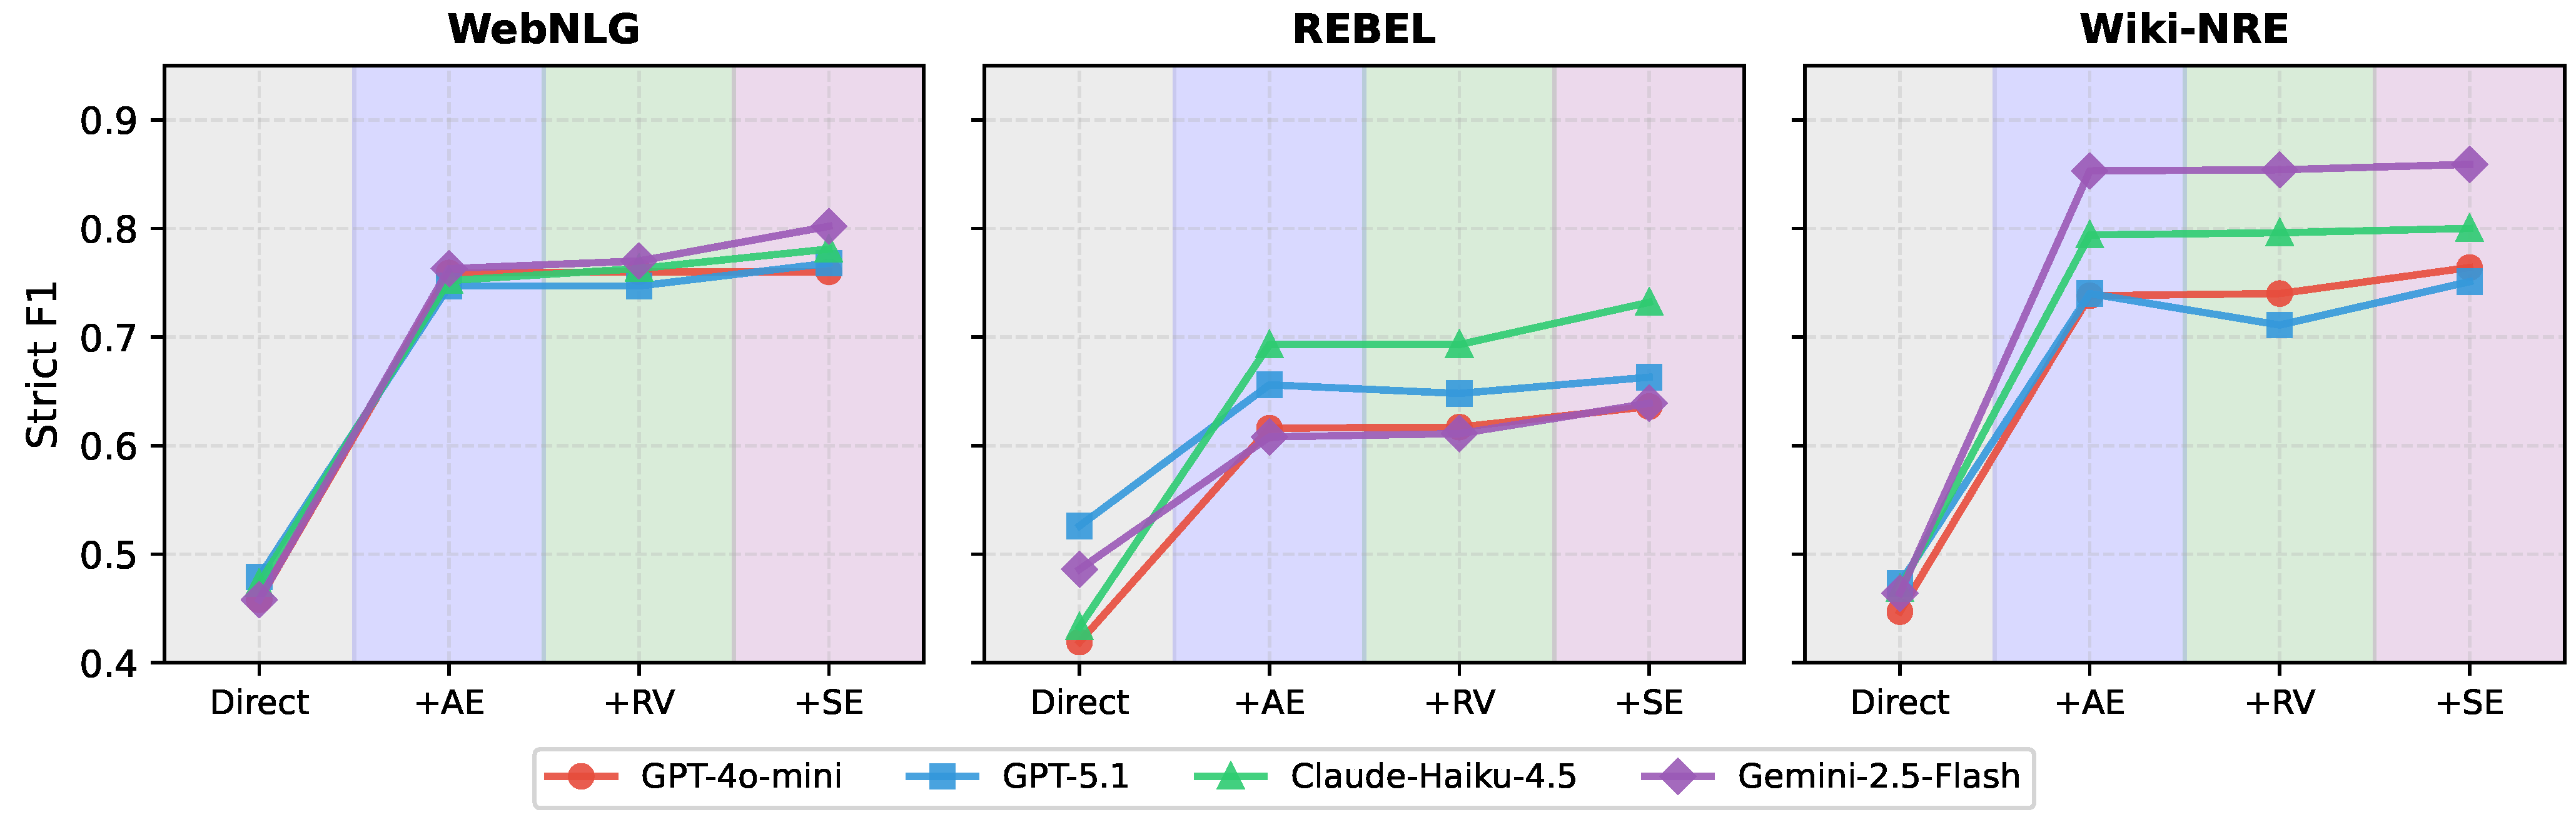
Ablation study results under strict matching.
Figure 7.
Ablation study results under strict matching.
Figure 8.
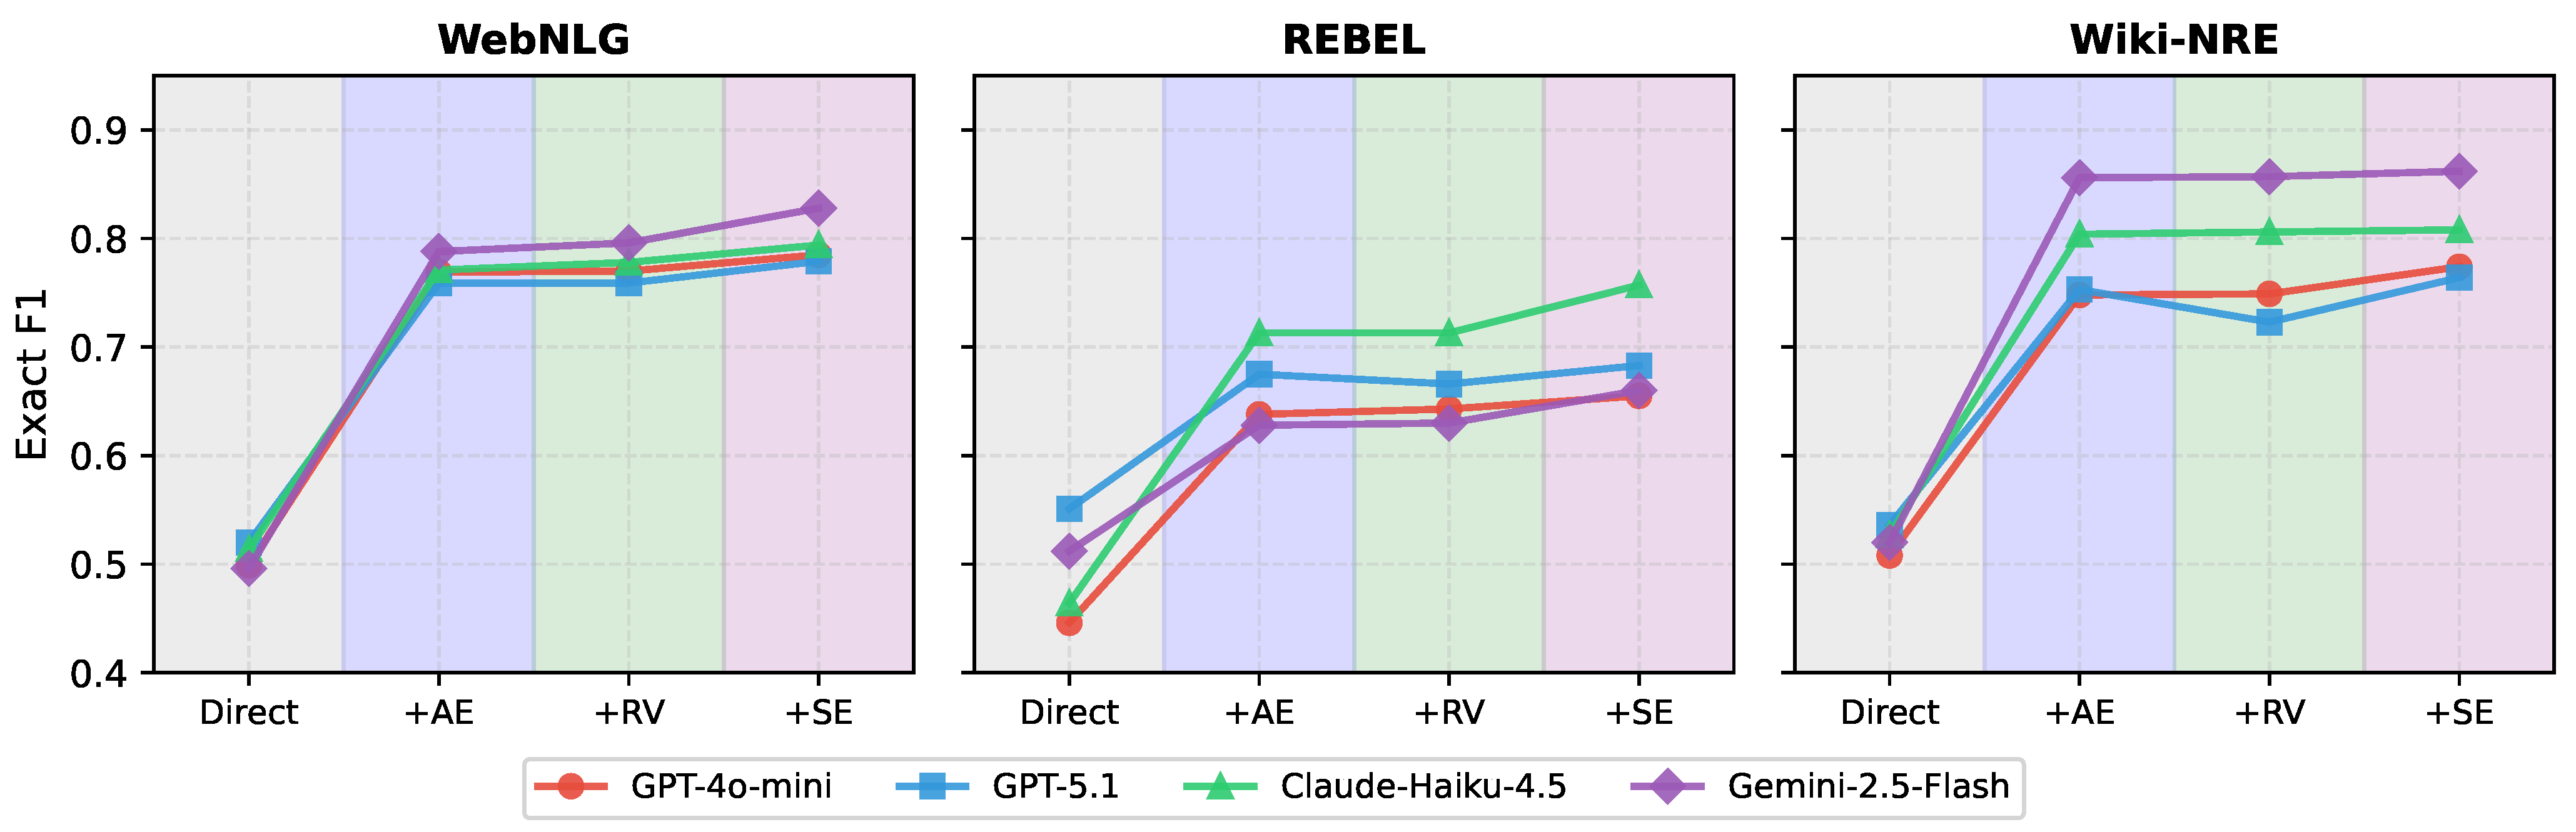
Ablation study results under exact matching.
Figure 8.
Ablation study results under exact matching.
Figure 9.
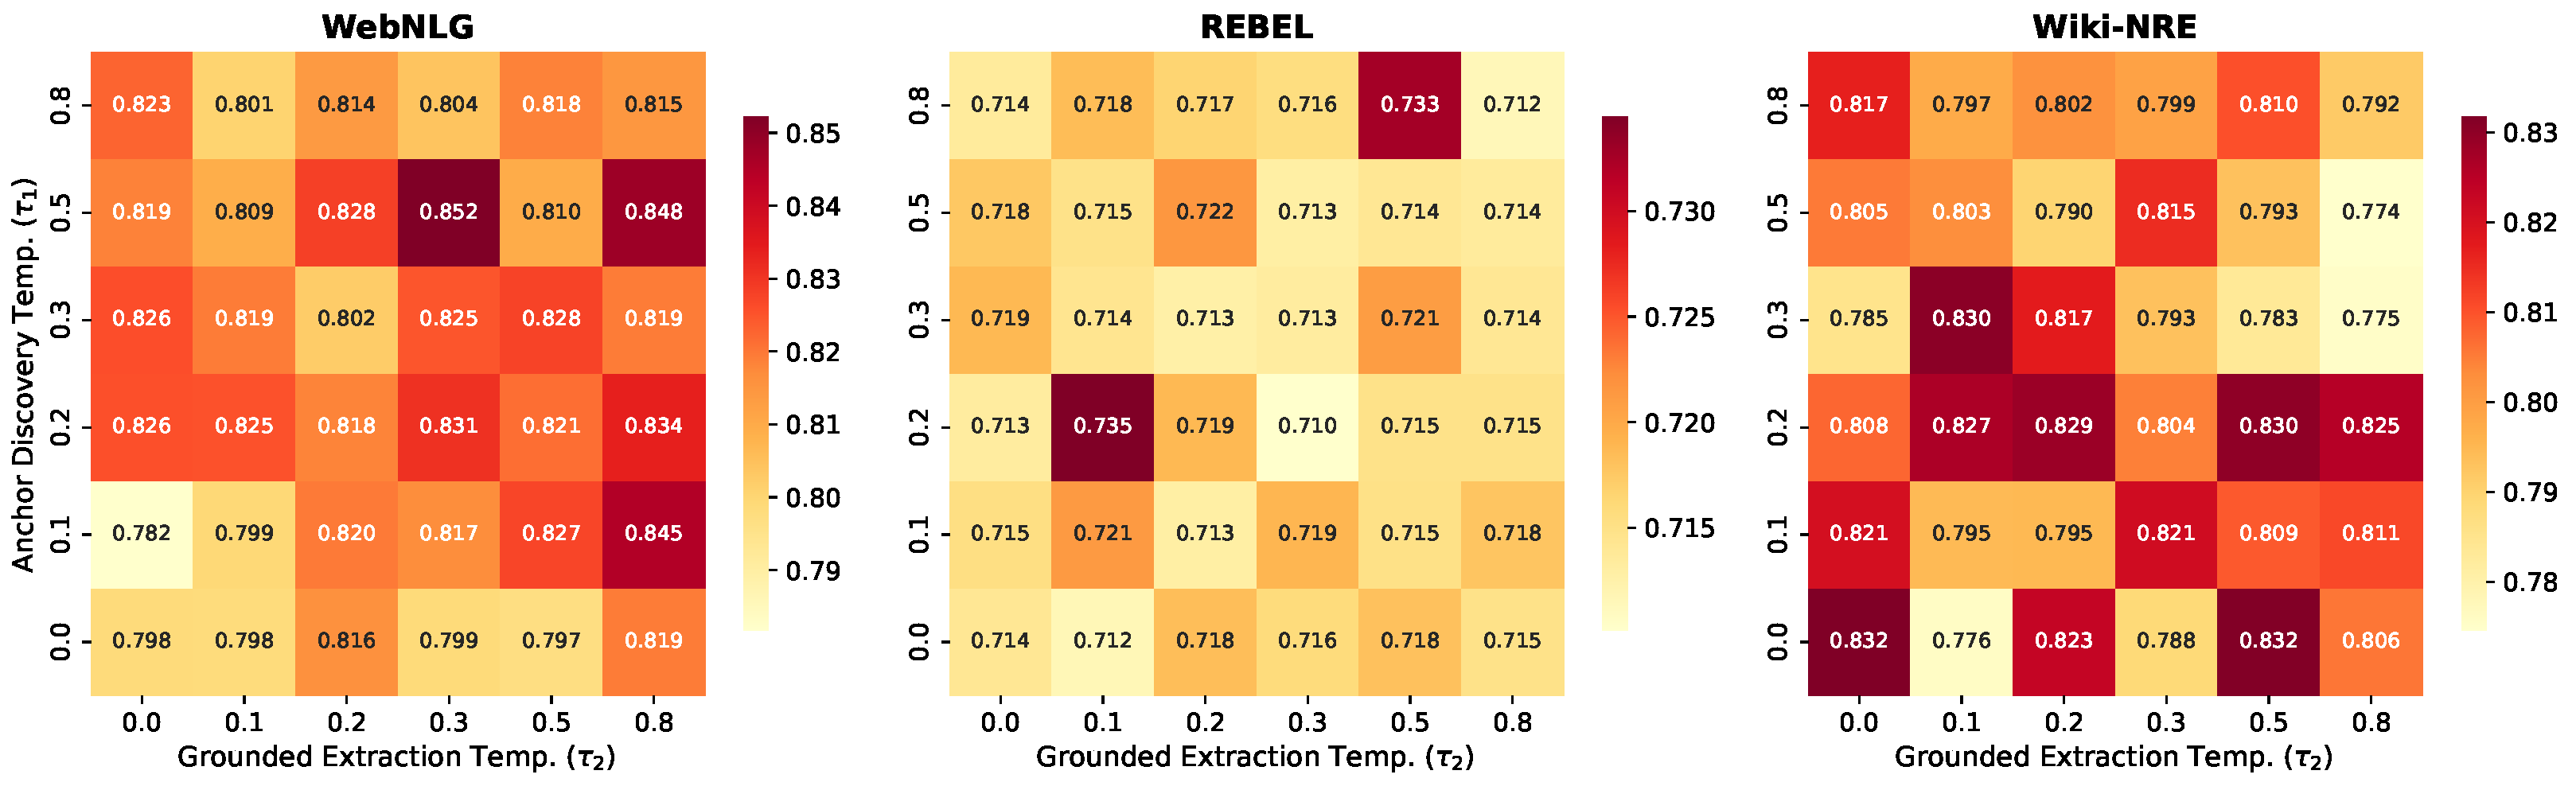
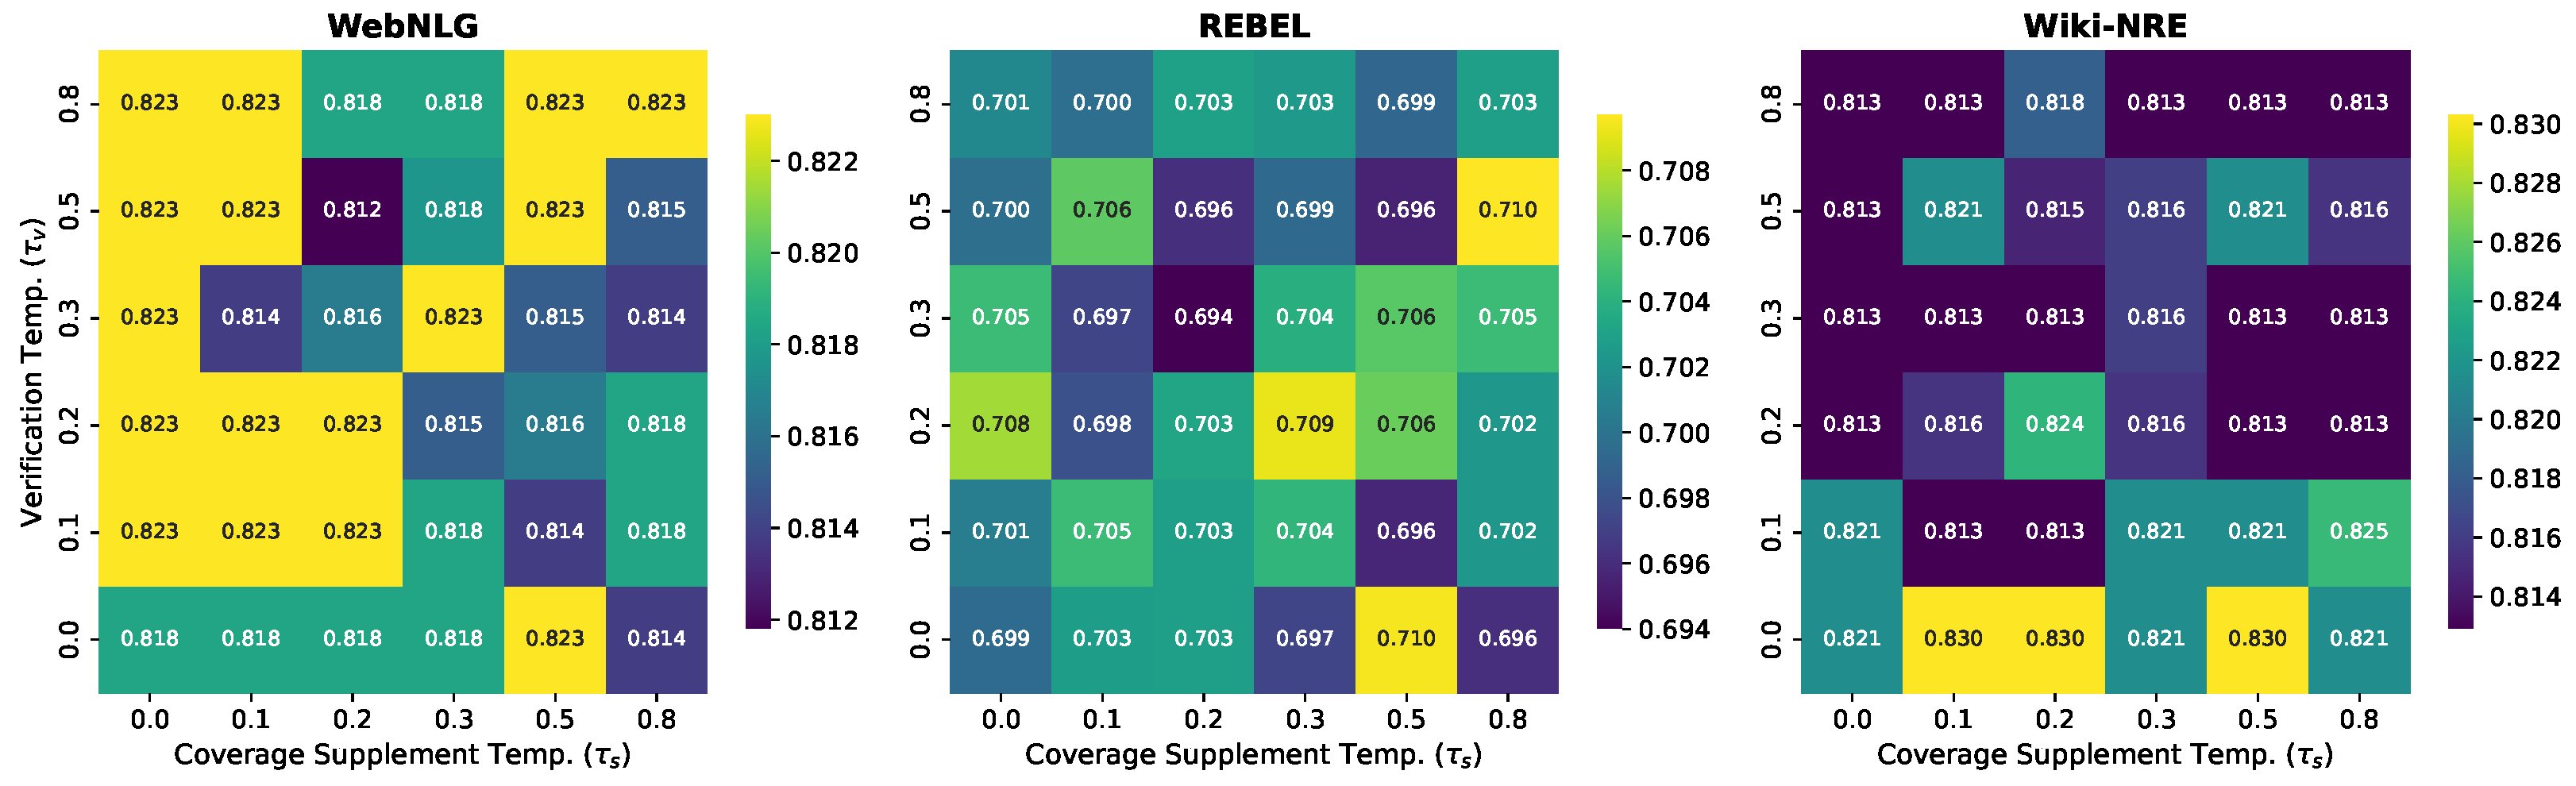
Temperature sensitivity analysis for Stages 1 and 2 under partial matching. Heat maps show F1 scores across temperature combinations for each dataset. Results based on 10% data samples using the best-performing model for each dataset.
Figure 9.
Temperature sensitivity analysis for Stages 1 and 2 under partial matching. Heat maps show F1 scores across temperature combinations for each dataset. Results based on 10% data samples using the best-performing model for each dataset.
Figure 10.
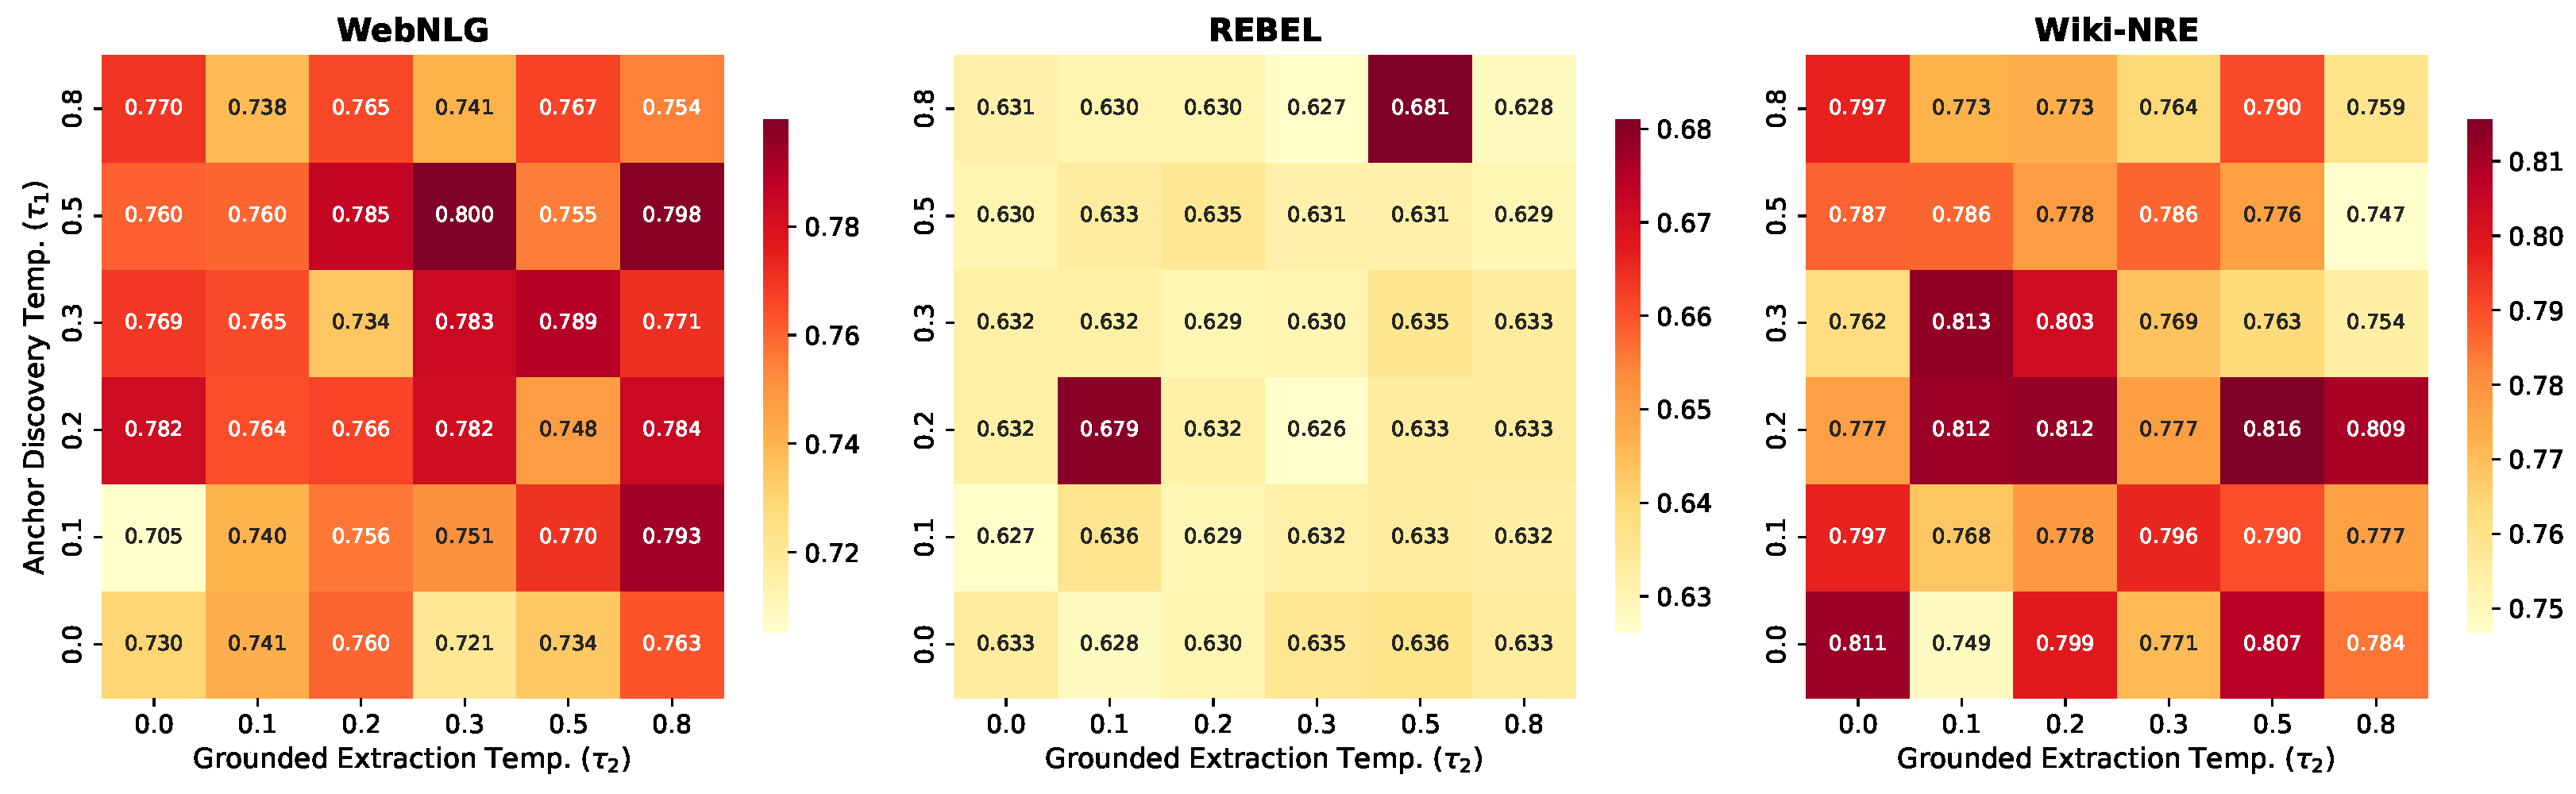
Temperature sensitivity analysis for Stages 1 and 2 under strict matching.
Figure 10.
Temperature sensitivity analysis for Stages 1 and 2 under strict matching.
Figure 11.
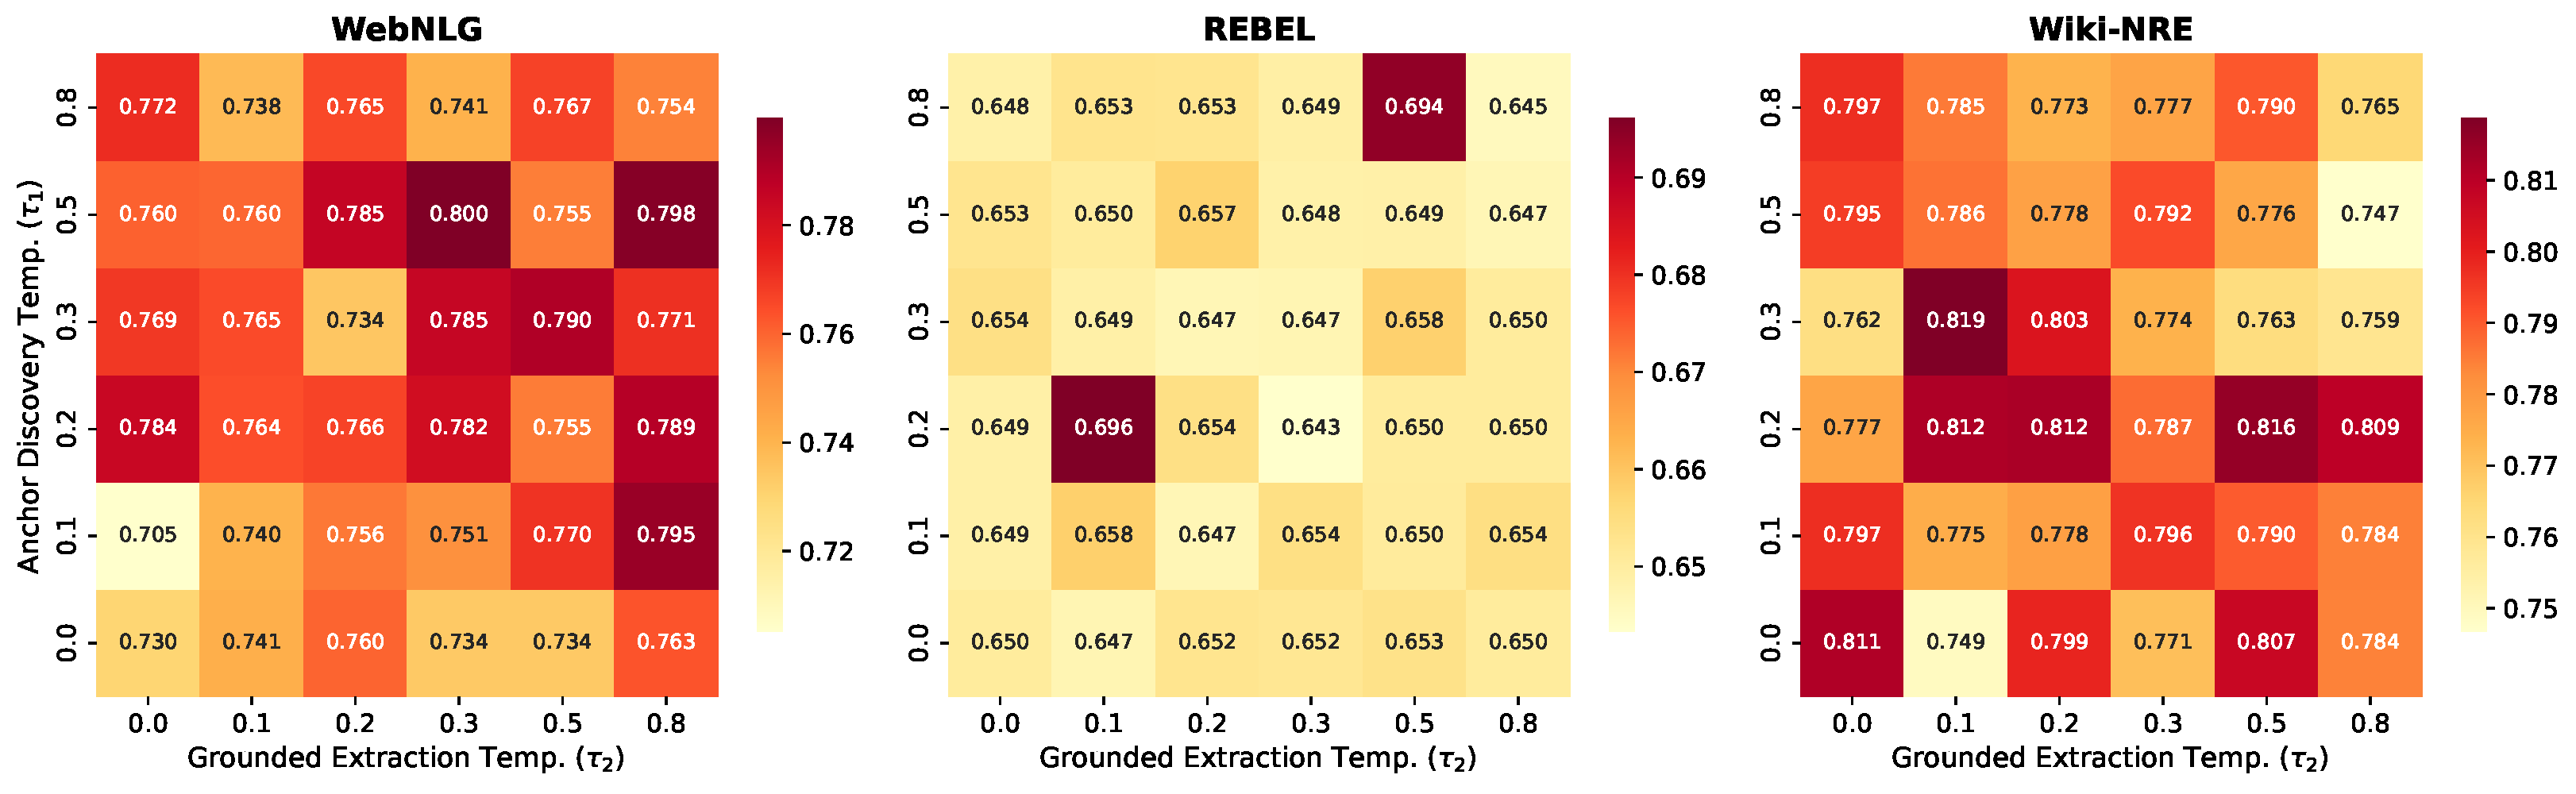
Temperature sensitivity analysis for Stages 1 and 2 under exact matching.
Figure 11.
Temperature sensitivity analysis for Stages 1 and 2 under exact matching.
Figure 12.
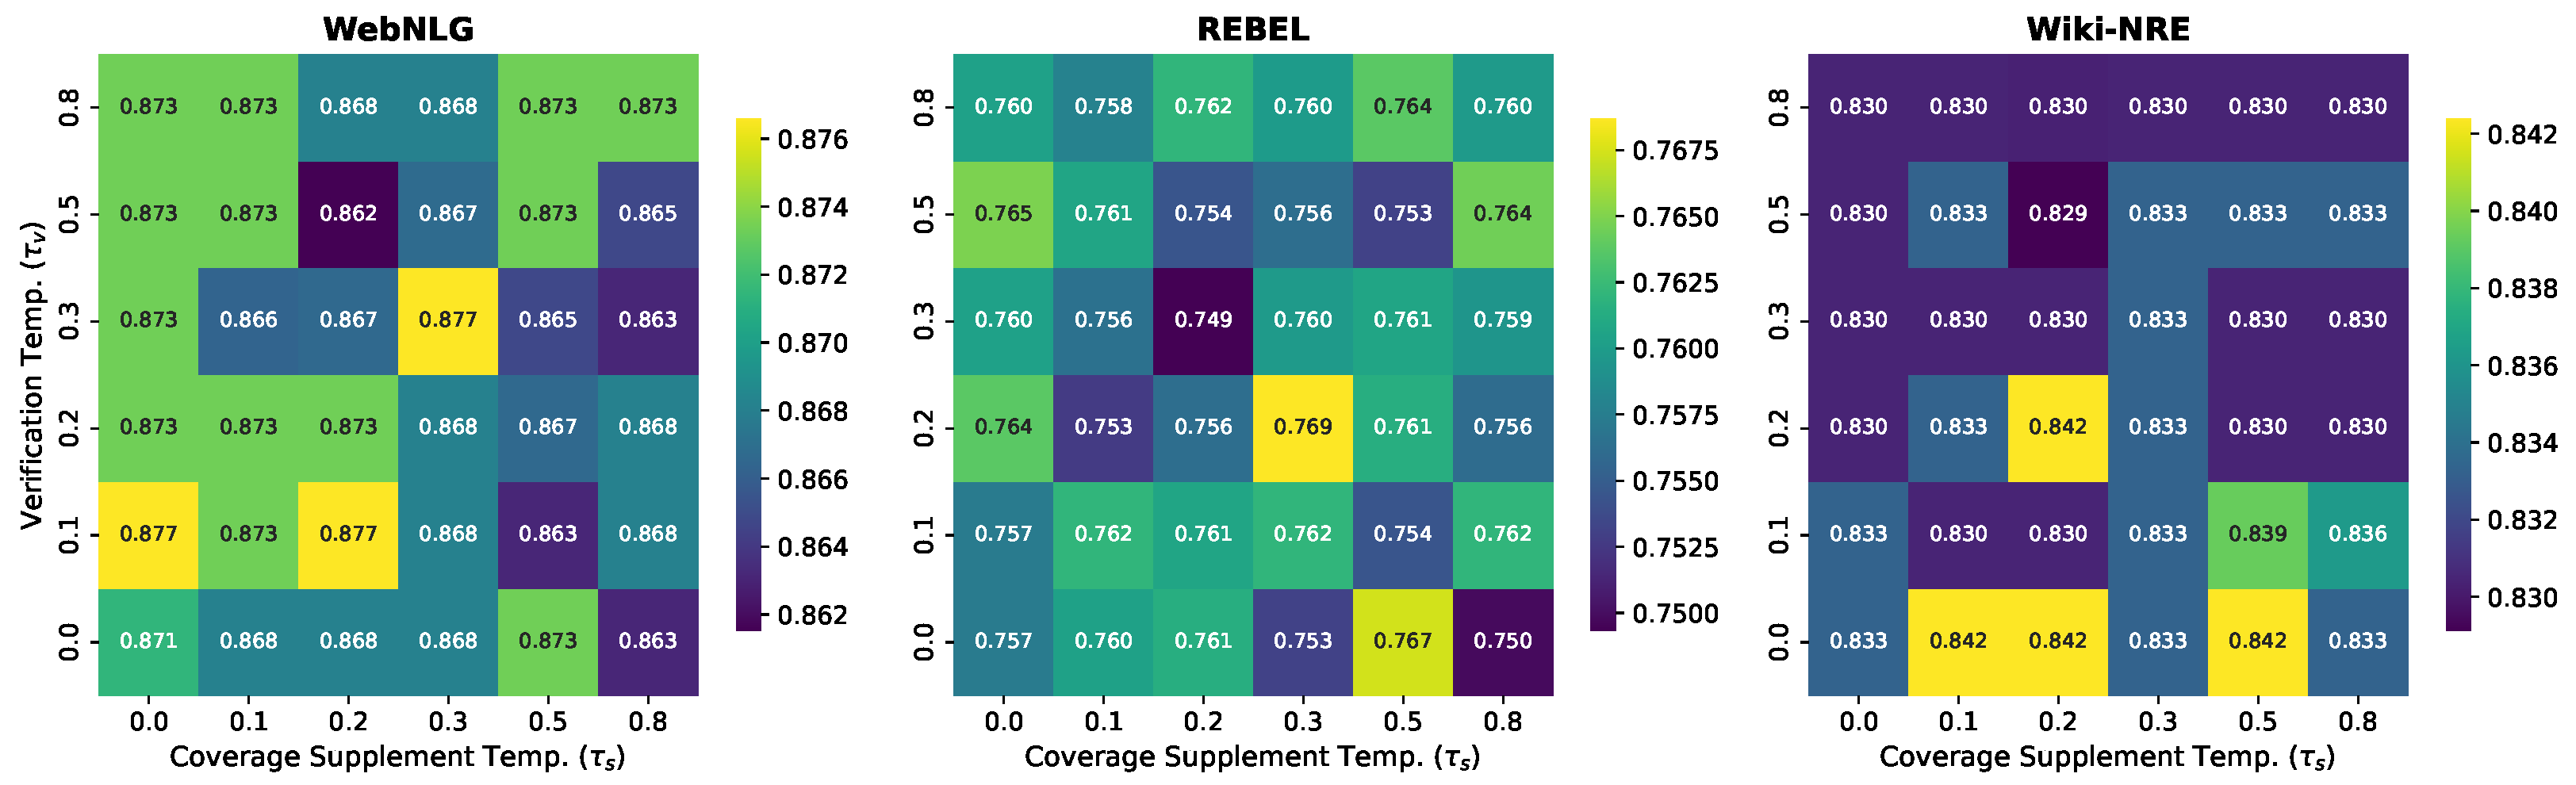
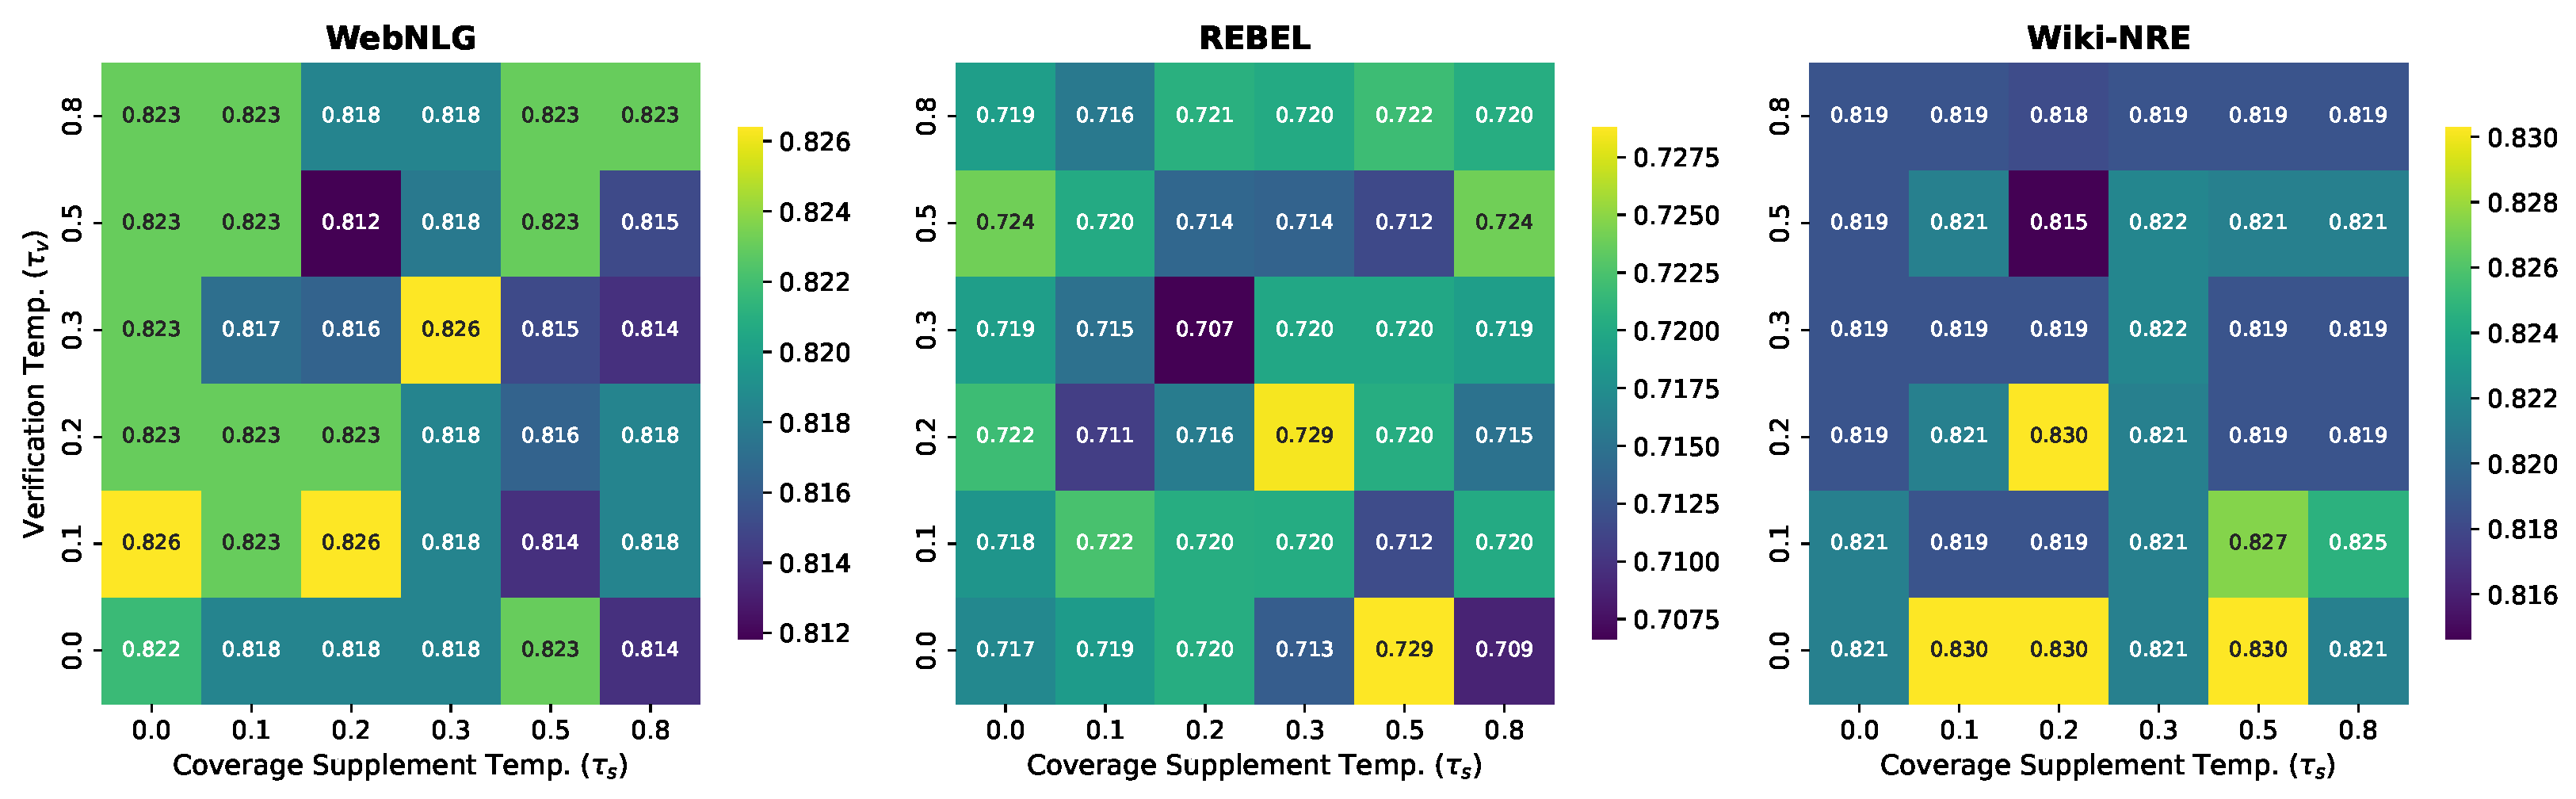
Temperature sensitivity analysis for Stage 3 under partial matching. The relatively uniform color distribution indicates that the verification and supplement stages are less sensitive to temperature settings compared with the extraction stages.
Figure 12.
Temperature sensitivity analysis for Stage 3 under partial matching. The relatively uniform color distribution indicates that the verification and supplement stages are less sensitive to temperature settings compared with the extraction stages.
Figure 13.
Temperature sensitivity analysis for Stage 3 under strict matching.
Figure 13.
Temperature sensitivity analysis for Stage 3 under strict matching.
Figure 14.
Temperature sensitivity analysis for Stage 3 under exact matching.
Figure 14.
Temperature sensitivity analysis for Stage 3 under exact matching.
Figure 15.
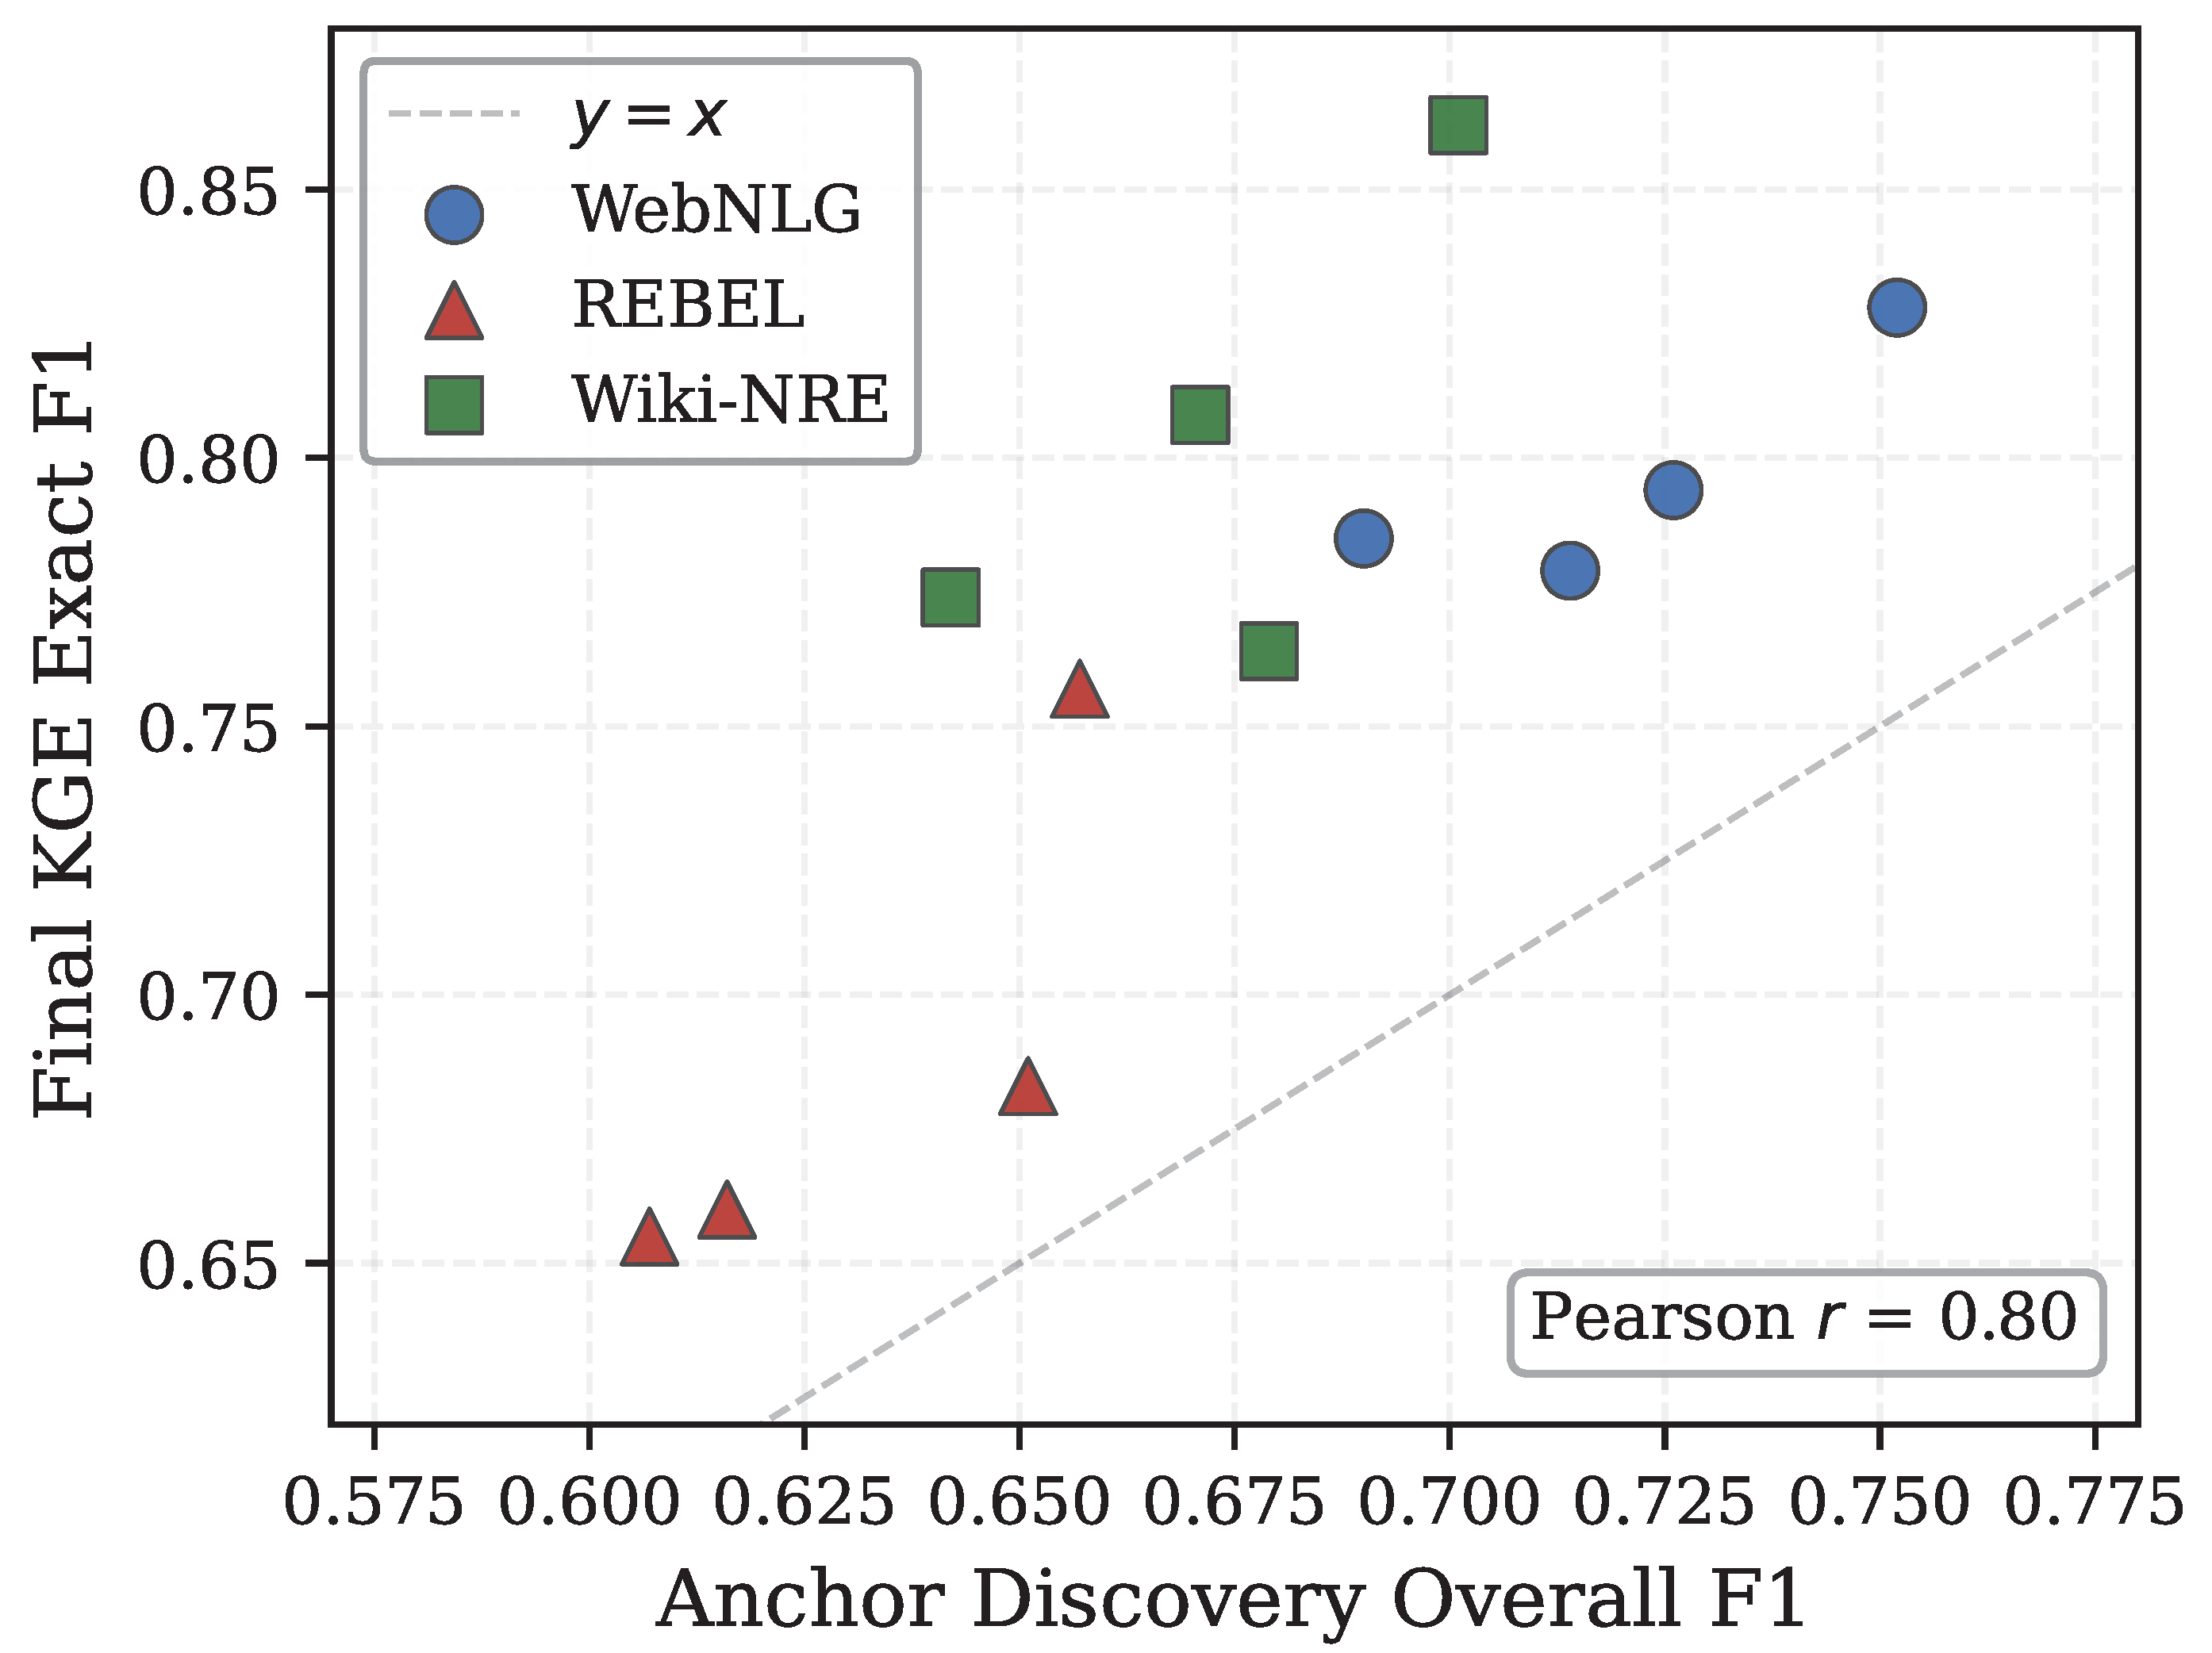
Anchor discovery’s Overall F1 vs. final KGE Exact F1 across all 12 model-dataset configurations. The dashed line represents . All points lie above this line, indicating that the AEVS pipeline consistently compensated for imperfect anchor discovery through its multi-stage design. Pearson .
Figure 15.
Anchor discovery’s Overall F1 vs. final KGE Exact F1 across all 12 model-dataset configurations. The dashed line represents . All points lie above this line, indicating that the AEVS pipeline consistently compensated for imperfect anchor discovery through its multi-stage design. Pearson .
Figure 16.
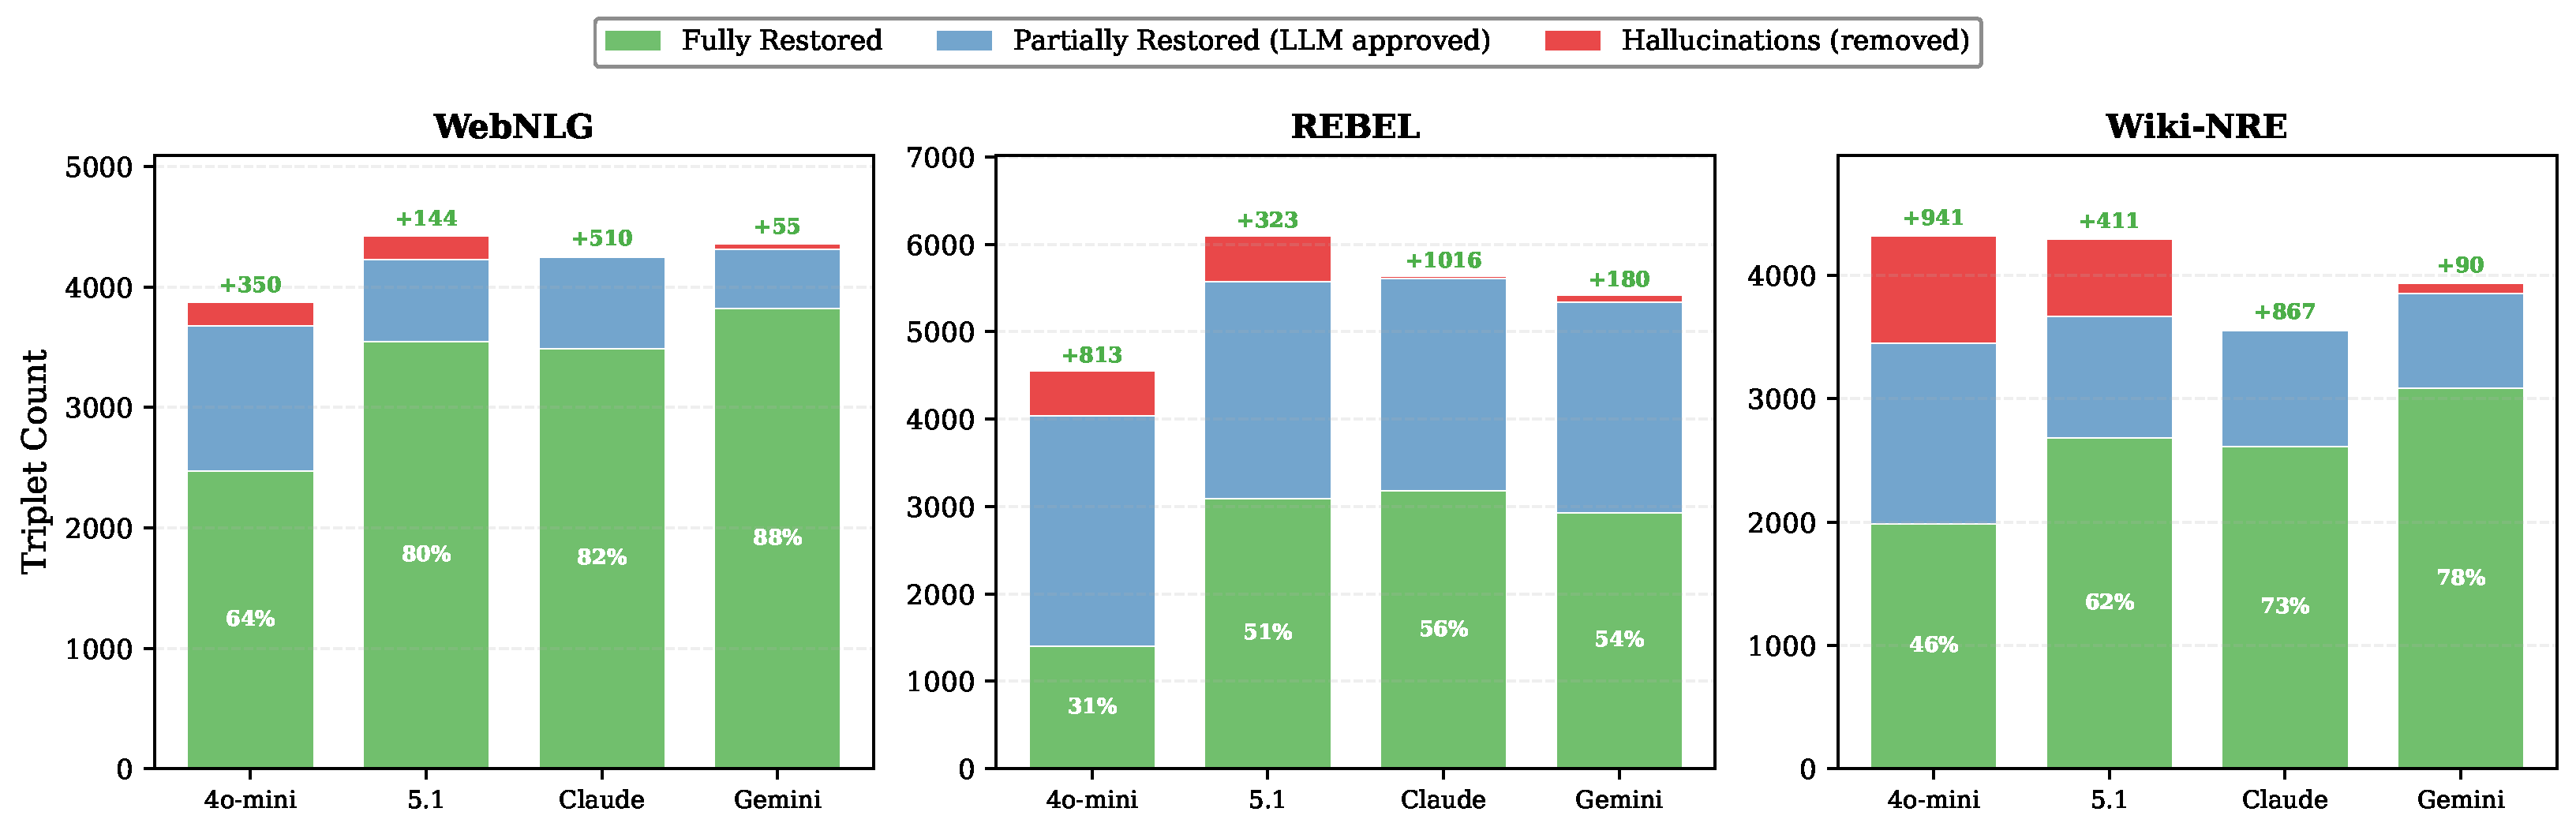
Verification stage pipeline flow across all model-dataset configurations. Each stacked bar decomposed initial triplets into fully restored (green, all three elements grounded), partially restored and LLM-approved (blue), and hallucinations removed (red). Percentages indicate the fully restored rate. Numbers above bars show triplets added by coverage-aware supplement.
Figure 16.
Verification stage pipeline flow across all model-dataset configurations. Each stacked bar decomposed initial triplets into fully restored (green, all three elements grounded), partially restored and LLM-approved (blue), and hallucinations removed (red). Percentages indicate the fully restored rate. Numbers above bars show triplets added by coverage-aware supplement.
Figure 17.
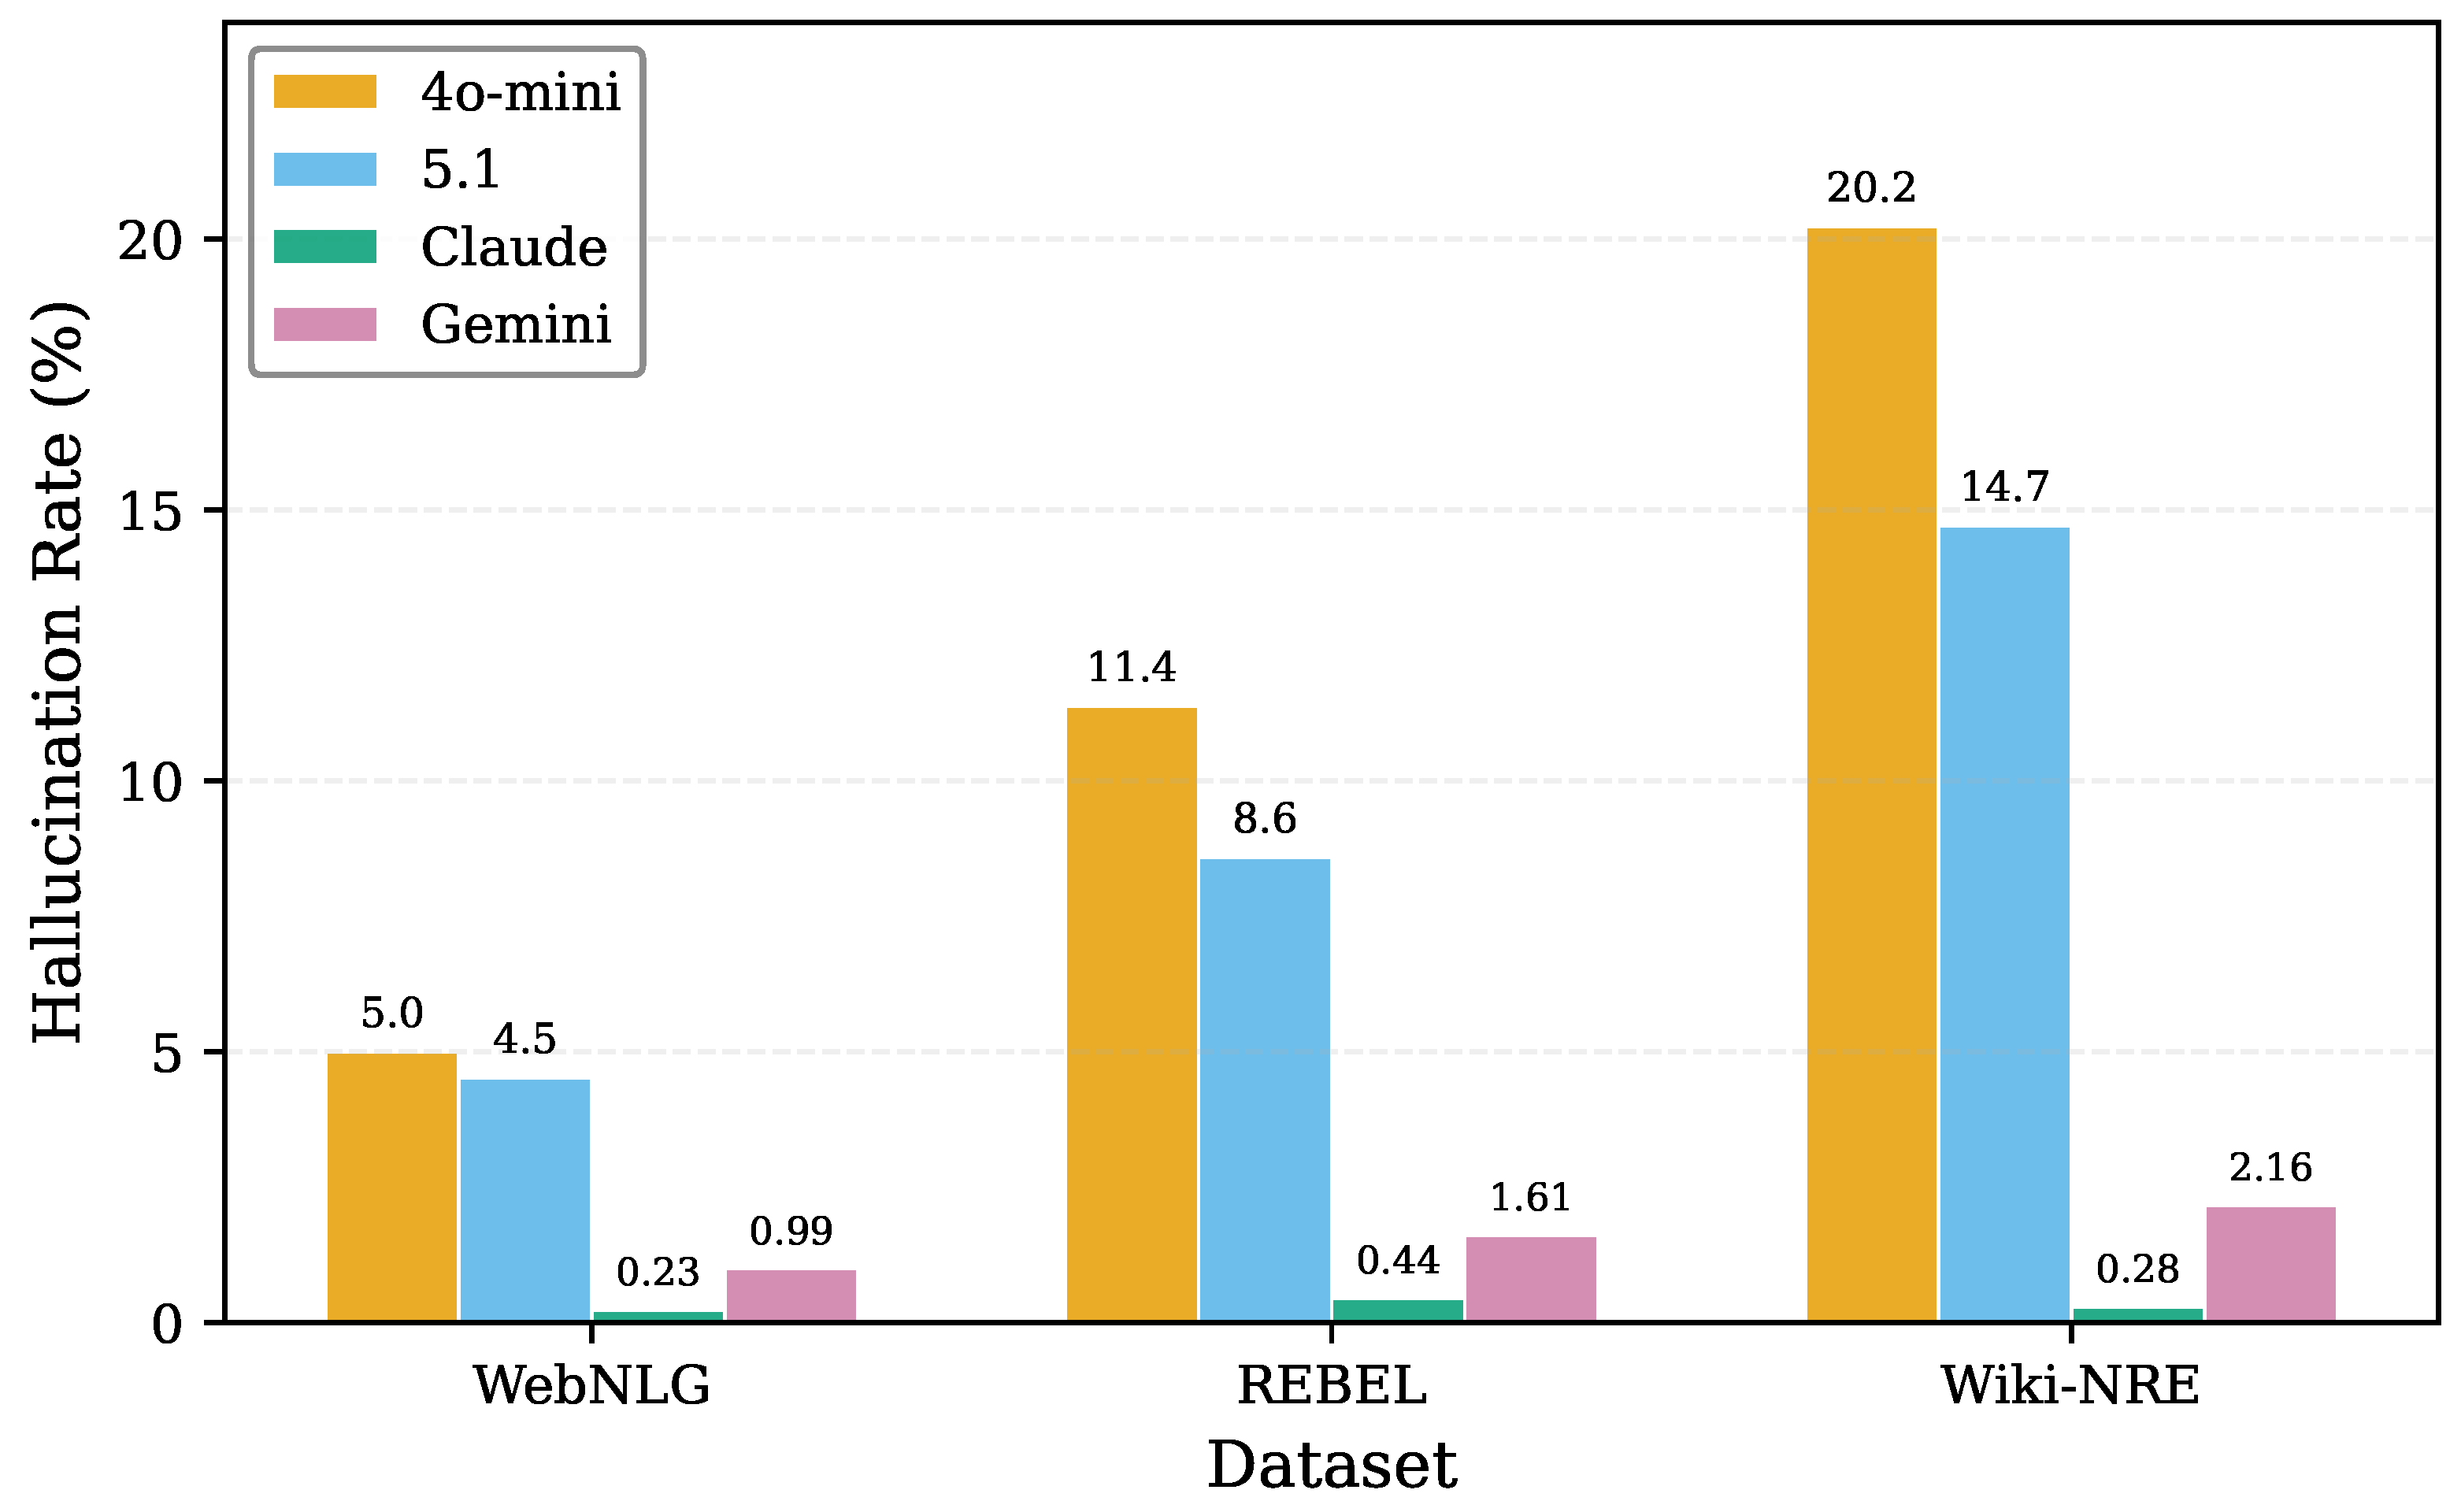
Hallucination rates across models and datasets. Rates span two orders of magnitude from 0.23% (Claude on WebNLG) to 20.23% (GPT-4o-mini on Wiki-NRE). Both model capability and dataset difficulty independently influence hallucination prevalence.
Figure 17.
Hallucination rates across models and datasets. Rates span two orders of magnitude from 0.23% (Claude on WebNLG) to 20.23% (GPT-4o-mini on Wiki-NRE). Both model capability and dataset difficulty independently influence hallucination prevalence.
Table 1.
Hierarchical matching strategies for restoration. Higher-priority methods provide stronger evidence of faithfulness.
Table 1.
Hierarchical matching strategies for restoration. Higher-priority methods provide stronger evidence of faithfulness.
| Priority | Method | Description | Scope |
|---|
| 1 | | Match via schema mapping | Relations only |
| 2 | | Exact normalized match with anchor | All elements |
| 3 | | Substring containment match | All elements |
| 4 | | Direct match in source text | All elements |
Table 2.
Results on WebNLG (159 relation types). Best results are bolded, and second-best results are underlined. †: specialized trained model; ‡: LLM-based framework.
Table 2.
Results on WebNLG (159 relation types). Best results are bolded, and second-best results are underlined. †: specialized trained model; ‡: LLM-based framework.
| Method | Partial | Strict | Exact |
|---|
|
P
|
R
|
F1
|
P
|
R
|
F1
|
P
|
R
|
F1
|
|---|
| REGEN † | 0.755 | 0.788 | 0.767 | 0.713 | 0.735 | 0.720 | 0.714 | 0.738 | 0.723 |
| Direct (GPT-4o-mini) | 0.580 | 0.620 | 0.594 | 0.450 | 0.473 | 0.458 | 0.491 | 0.515 | 0.499 |
| Direct (GPT-5.1) | 0.607 | 0.654 | 0.624 | 0.468 | 0.496 | 0.479 | 0.509 | 0.538 | 0.520 |
| Direct (Claude 4.5 Haiku) | 0.590 | 0.628 | 0.603 | 0.465 | 0.486 | 0.473 | 0.506 | 0.528 | 0.514 |
| Direct (Gemini 2.5 Flash) | 0.586 | 0.629 | 0.602 | 0.448 | 0.474 | 0.458 | 0.487 | 0.513 | 0.496 |
| EDC ‡ (GPT-4o-mini) | 0.808 | 0.832 | 0.817 | 0.748 | 0.764 | 0.753 | 0.759 | 0.775 | 0.765 |
| AEVS (GPT-4o-mini) | 0.817 | 0.838 | 0.824 | 0.756 | 0.770 | 0.760 | 0.780 | 0.794 | 0.785 |
| AEVS (GPT-5.1) | 0.827 | 0.853 | 0.836 | 0.762 | 0.779 | 0.768 | 0.773 | 0.790 | 0.779 |
| AEVS (Claude 4.5 Haiku) | 0.830 | 0.852 | 0.841 | 0.774 | 0.788 | 0.781 | 0.787 | 0.802 | 0.794 |
| AEVS (Gemini 2.5 Flash) | 0.863 | 0.886 | 0.874 | 0.795 | 0.810 | 0.802 | 0.821 | 0.836 | 0.828 |
Table 3.
Results on REBEL (200 relation types). Best results are bolded, and second-best are underlined. †: specialized trained model; ‡: LLM-based framework.
Table 3.
Results on REBEL (200 relation types). Best results are bolded, and second-best are underlined. †: specialized trained model; ‡: LLM-based framework.
| Method | Partial | Strict | Exact |
|---|
|
P
|
R
|
F1
|
P
|
R
|
F1
|
P
|
R
|
F1
|
|---|
| GenIE † | 0.381 | 0.391 | 0.385 | 0.353 | 0.356 | 0.362 | 0.362 | 0.369 | 0.364 |
| Direct (GPT-4o-mini) | 0.503 | 0.535 | 0.515 | 0.412 | 0.431 | 0.419 | 0.439 | 0.460 | 0.446 |
| Direct (GPT-5.1) | 0.606 | 0.632 | 0.616 | 0.520 | 0.537 | 0.526 | 0.544 | 0.562 | 0.551 |
| Direct (Claude 4.5 Haiku) | 0.513 | 0.573 | 0.535 | 0.417 | 0.460 | 0.433 | 0.448 | 0.492 | 0.464 |
| Direct (Gemini 2.5 Flash) | 0.559 | 0.594 | 0.571 | 0.477 | 0.500 | 0.486 | 0.503 | 0.521 | 0.512 |
| EDC ‡ (GPT-4o-mini) | 0.687 | 0.705 | 0.694 | 0.619 | 0.630 | 0.623 | 0.638 | 0.650 | 0.643 |
| AEVS (GPT-4o-mini) | 0.699 | 0.719 | 0.706 | 0.632 | 0.643 | 0.636 | 0.651 | 0.663 | 0.655 |
| AEVS (GPT-5.1) | 0.736 | 0.747 | 0.740 | 0.661 | 0.667 | 0.663 | 0.680 | 0.687 | 0.683 |
| AEVS (Claude 4.5 Haiku) | 0.793 | 0.803 | 0.797 | 0.730 | 0.736 | 0.732 | 0.755 | 0.762 | 0.757 |
| AEVS (Gemini 2.5 Flash) | 0.721 | 0.746 | 0.730 | 0.634 | 0.646 | 0.639 | 0.655 | 0.670 | 0.660 |
Table 4.
Results on Wiki-NRE (45 relation types). Best results are bolded, and second-best are underlined. †: specialized trained model; ‡: LLM-based framework.
Table 4.
Results on Wiki-NRE (45 relation types). Best results are bolded, and second-best are underlined. †: specialized trained model; ‡: LLM-based framework.
| Method | Partial | Strict | Exact |
|---|
|
P
|
R
|
F1
|
P
|
R
|
F1
|
P
|
R
|
F1
|
|---|
| GenIE † | 0.482 | 0.486 | 0.484 | 0.462 | 0.464 | 0.463 | 0.477 | 0.479 | 0.478 |
| Direct (GPT-4o-mini) | 0.524 | 0.579 | 0.541 | 0.435 | 0.474 | 0.447 | 0.496 | 0.536 | 0.508 |
| Direct (GPT-5.1) | 0.546 | 0.606 | 0.564 | 0.458 | 0.506 | 0.473 | 0.521 | 0.569 | 0.536 |
| Direct (Claude 4.5 Haiku) | 0.534 | 0.600 | 0.556 | 0.451 | 0.502 | 0.468 | 0.509 | 0.561 | 0.527 |
| Direct (Gemini 2.5 Flash) | 0.528 | 0.590 | 0.549 | 0.448 | 0.496 | 0.464 | 0.504 | 0.552 | 0.520 |
| EDC ‡ (GPT-4o-mini) | 0.722 | 0.734 | 0.727 | 0.688 | 0.697 | 0.692 | 0.699 | 0.708 | 0.702 |
| AEVS (GPT-4o-mini) | 0.794 | 0.813 | 0.801 | 0.759 | 0.772 | 0.764 | 0.769 | 0.783 | 0.774 |
| AEVS (GPT-5.1) | 0.782 | 0.791 | 0.785 | 0.748 | 0.755 | 0.751 | 0.761 | 0.768 | 0.764 |
| AEVS (Claude 4.5 Haiku) | 0.820 | 0.825 | 0.822 | 0.799 | 0.803 | 0.800 | 0.807 | 0.810 | 0.808 |
| AEVS (Gemini 2.5 Flash) | 0.877 | 0.882 | 0.879 | 0.858 | 0.861 | 0.859 | 0.861 | 0.864 | 0.862 |
Table 5.
Anchor discovery quality evaluation. Pseudo-gold anchors were derived from gold triplet annotations. Metrics are micro-averaged precision (P), recall (R), and F1 score for entity and relation anchors separately and overall.
Table 5.
Anchor discovery quality evaluation. Pseudo-gold anchors were derived from gold triplet annotations. Metrics are micro-averaged precision (P), recall (R), and F1 score for entity and relation anchors separately and overall.
| Dataset | Model | Entity | Relation | Overall |
|---|
|
P
|
R
|
F1
|
P
|
R
|
F1
|
P
|
R
|
F1
|
|---|
| WebNLG | GPT-4o-mini | 0.592 | 0.783 | 0.674 | 0.781 | 0.618 | 0.690 | 0.658 | 0.725 | 0.690 |
| GPT-5.1 | 0.578 | 0.821 | 0.678 | 0.752 | 0.783 | 0.767 | 0.639 | 0.808 | 0.714 |
| Claude-4.5-Haiku | 0.586 | 0.843 | 0.691 | 0.779 | 0.762 | 0.770 | 0.654 | 0.815 | 0.726 |
| Gemini-2.5-Flash | 0.612 | 0.867 | 0.718 | 0.803 | 0.794 | 0.798 | 0.679 | 0.842 | 0.752 |
| REBEL | GPT-4o-mini | 0.721 | 0.862 | 0.785 | 0.453 | 0.341 | 0.389 | 0.612 | 0.602 | 0.607 |
| GPT-5.1 | 0.618 | 0.937 | 0.745 | 0.581 | 0.468 | 0.518 | 0.604 | 0.706 | 0.651 |
| Claude-4.5-Haiku | 0.611 | 0.943 | 0.742 | 0.572 | 0.503 | 0.535 | 0.598 | 0.728 | 0.657 |
| Gemini-2.5-Flash | 0.714 | 0.871 | 0.785 | 0.468 | 0.353 | 0.402 | 0.618 | 0.613 | 0.616 |
| Wiki-NRE | GPT-4o-mini | 0.631 | 0.963 | 0.762 | 0.428 | 0.417 | 0.422 | 0.560 | 0.752 | 0.642 |
| GPT-5.1 | 0.604 | 0.991 | 0.751 | 0.561 | 0.513 | 0.536 | 0.587 | 0.806 | 0.679 |
| Claude-4.5-Haiku | 0.578 | 0.997 | 0.732 | 0.536 | 0.572 | 0.553 | 0.562 | 0.833 | 0.671 |
| Gemini-2.5-Flash | 0.612 | 0.978 | 0.753 | 0.583 | 0.621 | 0.601 | 0.601 | 0.840 | 0.701 |
Table 6.
Anchor discovery statistics and error analysis. and denote the average number of discovered and pseudo-gold anchors per sample, respectively. and are the mean and standard deviation of the per-sample Overall F1, respectively. Entity and relation miss rates indicate the fraction of gold anchors of that type not matched by any discovered anchor.
Table 6.
Anchor discovery statistics and error analysis. and denote the average number of discovered and pseudo-gold anchors per sample, respectively. and are the mean and standard deviation of the per-sample Overall F1, respectively. Entity and relation miss rates indicate the fraction of gold anchors of that type not matched by any discovered anchor.
| Dataset | Model | | | | | Ent. Miss | Rel. Miss |
|---|
| WebNLG | GPT-4o-mini | 7.1 | 7.7 | 0.698 | 0.158 | 17.3% | 38.2% |
| GPT-5.1 | 8.5 | 7.7 | 0.712 | 0.149 | 14.8% | 21.7% |
| Claude-4.5-Haiku | 8.6 | 7.7 | 0.727 | 0.143 | 13.2% | 23.8% |
| Gemini-2.5-Flash | 8.9 | 7.7 | 0.752 | 0.134 | 10.8% | 20.6% |
| REBEL | GPT-4o-mini | 7.6 | 8.6 | 0.618 | 0.151 | 10.3% | 65.9% |
| GPT-5.1 | 9.8 | 8.6 | 0.651 | 0.141 | 4.8% | 53.2% |
| Claude-4.5-Haiku | 10.1 | 8.6 | 0.668 | 0.135 | 4.2% | 49.7% |
| Gemini-2.5-Flash | 7.8 | 8.6 | 0.622 | 0.148 | 9.8% | 64.7% |
| Wiki-NRE | GPT-4o-mini | 7.3 | 5.8 | 0.686 | 0.136 | 3.7% | 58.3% |
| GPT-5.1 | 7.6 | 5.8 | 0.700 | 0.131 | 0.9% | 48.7% |
| Claude-4.5-Haiku | 8.2 | 5.8 | 0.726 | 0.123 | 0.3% | 42.8% |
| Gemini-2.5-Flash | 8.0 | 5.8 | 0.753 | 0.115 | 2.2% | 37.9% |
Table 7.
Computational cost analysis of AEVS. Avg Calls denotes the mean number of LLM calls per sample. Token counts are per-sample averages (estimated). The theoretical range of LLM calls per sample is from 2 (Stage 1 + Stage 2 only) to 5 (all stages including supplement verification). For comparison, direct prompting requires 1 call/sample, and EDC requires ≈3 calls/sample.
Table 7.
Computational cost analysis of AEVS. Avg Calls denotes the mean number of LLM calls per sample. Token counts are per-sample averages (estimated). The theoretical range of LLM calls per sample is from 2 (Stage 1 + Stage 2 only) to 5 (all stages including supplement verification). For comparison, direct prompting requires 1 call/sample, and EDC requires ≈3 calls/sample.
| Dataset | Model | Avg Calls | Avg Input Tok | Avg Output Tok | Avg Total Tok |
|---|
| | GPT-4o-mini | 3.60 | 12,014 | 889 | 12,903 |
| WebNLG | GPT-5.1 | 2.83 | 9694 | 1002 | 10,696 |
| (1165 samples) | Claude-4.5-Haiku | 3.02 | 10,880 | 972 | 11,852 |
| | Gemini-2.5-Flash | 3.24 | 11,347 | 1718 | 13,065 |
| | GPT-4o-mini | 4.28 | 16,867 | 1198 | 18,065 |
| REBEL | GPT-5.1 | 3.58 | 14,037 | 1503 | 15,540 |
| (1000 samples) | Claude-4.5-Haiku | 4.03 | 16,592 | 1439 | 18,031 |
| | Gemini-2.5-Flash | 3.81 | 15,238 | 2136 | 17,374 |
| | GPT-4o-mini | 4.14 | 4618 | 1166 | 5784 |
| Wiki-NRE | GPT-5.1 | 3.46 | 3754 | 1055 | 4809 |
| (1000 samples) | Claude-4.5-Haiku | 3.71 | 4467 | 994 | 5461 |
| | Gemini-2.5-Flash | 3.36 | 3856 | 1648 | 5504 |
Table 8.
Verification stage pipeline statistics. Initial = triplets from Stage 2; FR = fully restored (all three elements grounded); Hallu. = hallucinations detected and removed; Supp. = triplets added by coverage-aware supplement; Final = output triplet count. denotes the net change from Initial to Final.
Table 8.
Verification stage pipeline statistics. Initial = triplets from Stage 2; FR = fully restored (all three elements grounded); Hallu. = hallucinations detected and removed; Supp. = triplets added by coverage-aware supplement; Final = output triplet count. denotes the net change from Initial to Final.
| Dataset | Model | Initial | Restoration | Hallucinations | Supp. | Final | % |
|---|
|
FR
|
FR%
|
Detected
|
Rate%
|
|---|
| WebNLG | GPT-4o-mini | 3870 | 2470 | 63.8 | 193 | 4.99 | 350 | 4022 | +3.9 |
| GPT-5.1 | 4425 | 3547 | 80.2 | 200 | 4.52 | 144 | 4327 | −2.2 |
| Claude-4.5-Haiku | 4257 | 3487 | 81.9 | 10 | 0.23 | 510 | 4741 | +11.4 |
| Gemini-2.5-Flash | 4356 | 3820 | 87.7 | 43 | 0.99 | 55 | 4368 | +0.3 |
| REBEL | GPT-4o-mini | 4552 | 1404 | 30.8 | 518 | 11.38 | 813 | 4828 | +6.1 |
| GPT-5.1 | 6098 | 3089 | 50.7 | 523 | 8.58 | 323 | 5857 | −4.0 |
| Claude-4.5-Haiku | 5632 | 3176 | 56.4 | 25 | 0.44 | 1016 | 6616 | +17.5 |
| Gemini-2.5-Flash | 5420 | 2927 | 54.0 | 87 | 1.61 | 180 | 5513 | +1.7 |
| Wiki-NRE | GPT-4o-mini | 4321 | 1984 | 45.9 | 874 | 20.23 | 941 | 4373 | +1.2 |
| GPT-5.1 | 4296 | 2682 | 62.4 | 632 | 14.71 | 411 | 4032 | −6.1 |
| Claude-4.5-Haiku | 3564 | 2613 | 73.3 | 10 | 0.28 | 867 | 4413 | +23.8 |
| Gemini-2.5-Flash | 3938 | 3083 | 78.3 | 85 | 2.16 | 90 | 3943 | +0.1 |
Table 9.
Error type distribution across datasets and models. Unsup. Rel. = unsupported relation; Ext. Know. = external knowledge injection; Other = remaining types combined.
Table 9.
Error type distribution across datasets and models. Unsup. Rel. = unsupported relation; Ext. Know. = external knowledge injection; Other = remaining types combined.
| Dataset | Model | Unsup. Rel. | Ext. Know. | Other | Total |
|---|
| WebNLG | GPT-4o-mini | 192 | 1 | 0 | 193 |
| GPT-5.1 | 200 | 0 | 0 | 200 |
| Claude-4.5-Haiku | 10 | 0 | 0 | 10 |
| Gemini-2.5-Flash | 41 | 2 | 0 | 43 |
| REBEL | GPT-4o-mini | 508 | 10 | 0 | 518 |
| GPT-5.1 | 520 | 2 | 1 | 523 |
| Claude-4.5-Haiku | 25 | 0 | 0 | 25 |
| Gemini-2.5-Flash | 84 | 3 | 0 | 87 |
| Wiki-NRE | GPT-4o-mini | 869 | 5 | 0 | 874 |
| GPT-5.1 | 631 | 1 | 0 | 632 |
| Claude-4.5-Haiku | 10 | 0 | 0 | 10 |
| Gemini-2.5-Flash | 82 | 3 | 0 | 85 |