Article

Enhancing Cardiovascular Disease Detection Through Exploratory Predictive Modeling Using DenseNet-Based Deep Learning

by
Wael Hadi
1,
Tushar Jaware
2,*,
Tarek Khalifa
3,
Faisal Aburub
4,
Nawaf Ali
3 and
Rashmi Saini
5
1
Information Security Department, University of Petra, Amman 961343, Jordan
2
Department of Electronics and Telecommunication Engineering, R. C. Patel Institute of Technology, Shirpur 425405, Maharashtra, India
3
College of Engineering and Technology, American University of the Middle East, Eqaila 54200, Kuwait
4
Business Intelligence and Data Analytics Department, University of Petra, Amman 961343, Jordan
5
G. B. Pant Institute of Engineering and Technology, Pauri Garhwal 246196, Uttarakhand, India
*
Author to whom correspondence should be addressed.
Computers 2025, 14(8), 330; https://doi.org/10.3390/computers14080330
Submission received: 19 March 2025 / Revised: 22 July 2025 / Accepted: 27 July 2025 / Published: 15 August 2025
(This article belongs to the Special Issue Machine Learning and Statistical Learning with Applications 2025)

Abstract

Cardiovascular Disease (CVD) remains the number one cause of morbidity and mortality, accounting for 17.9 million deaths every year. Precise and early diagnosis is therefore critical to the betterment of the patient’s outcomes and the many burdens that weigh on the healthcare systems. This work presents for the first time an innovative approach using the DenseNet architecture that allows for the automatic recognition of CVD from clinical data. The data is preprocessed and augmented, with a heterogeneous dataset of cardiovascular-related images like angiograms, echocardiograms, and magnetic resonance images used. Optimizing the deep features for robust model performance is conducted through fine-tuning a custom DenseNet architecture along with rigorous hyper parameter tuning and sophisticated strategies to handle class imbalance. The DenseNet model, after training, shows high accuracy, sensitivity, and specificity in the identification of CVD compared to baseline approaches. Apart from the quantitative measures, detailed visualizations are conducted to show that the model is able to localize and classify pathological areas within an image. The accuracy of the model was found to be 0.92, precision 0.91, and recall 0.95 for class 1, and an overall weighted average F1-score of 0.93, which establishes the efficacy of the model. There is great clinical applicability in this research in terms of accurate detection of CVD to provide time-interventional personalized treatments. This DenseNet-based approach advances the improvement on the diagnosis of CVD through state-of-the-art technology to be used by radiologists and clinicians. Future work, therefore, would probably focus on improving the model’s interpretability towards a broader population of patients and its generalization towards it, revolutionizing the diagnosis and management of CVD.

1. Introduction

Among all the major global health emergencies, cardiovascular diseases have significantly enhanced their incidence along with death toll across the globe. With the multifaceted nature of CVD and its pervasive impact upon individuals and societies, there is an urgency to advance more sophisticated techniques for its timely detection and accurate diagnosis. Although most progress has been achieved in medical imaging technology and data analysis techniques, identification of cardiovascular abnormalities is not a task without elaborate and effective techniques. For the last several decades, advanced neural networks have revolutionized the understanding of medical images and provided the power to unravel complex patterns hidden in huge volumes of medical data [1].
The present study undertakes an exploration to harness the power of deep learning, particularly the architecture of DenseNet, in pursuit of revolutionizing CVD. DenseNet is known for its architectural design, which ensures efficient information flow and feature extraction and can overcome some challenges associated with the analysis of medical images. With highly interconnected layers, architecture can smartly extract relevant components by way of raw information from images with little to no human interference in the extensive feature engineering itself [2].
The main objective behind this proposed work is the exploration of the effectiveness of DenseNet architecture in the detection of CVD from a broad variety of medical images. Our research takes recourse to an extensive dataset that includes multiple modalities such as angiograms, echocardiograms, and MRI. The proposed methodology includes data preprocessing, augmentation, and fine-tuning of the architecture of DenseNet tailored to specific features of cardiovascular-related images. In addition, it goes deep with subtleties of training deep neural networks focusing upon problems such as overfitting and class imbalance [3].
The intensity of early and accurate diagnosis of CVD cannot be overstressed. Dense implementation of the DenseNet-based method can speed up diagnoses since essential interventions become timely thereby inhibiting disease progression. In addition, automation of disease diagnostics based on deep learning ensures that clinicians make optimal use of their expertise [4].
As we move forward with this research work, we hope to outline the extent to which the DenseNet architecture can discern subtle and very complex cardiovascular anomalies. Our contribution moves the handle forward for the diagnosis of CVD while contributing to the larger discourse on the application of state-of-the-art neural networks for healthcare diagnostics. The present study highlights the critical role of computer science crossing over into medical disciplines. This has the transformative potential of interdisciplinary efforts defining healthcare in the future as well [5].
This work is the presentation of several highly significant contributions toward the detection in CVD through a number of key novel innovations. Firstly, here, an adaptation of one of the most well-known deep learning architectures, DenseNet, is introduced and specially designed for medical image analysis in order to enhance the ability to discover the patterns that are rather intricate on different imaging modalities. We then apply advanced preprocessing and augmentation techniques to a diverse set of images related to cardiovascular diseases that strengthen the model’s robustness and generalizability and further set a new benchmark for the use of diverse imaging data in achieving good disease detection. Importantly, we deal with class imbalance relating to CVD by discussing resampling and cost-sensitive learning strategies. These techniques are both performance enhancing for the models and ensure high sensitivity and specificity along with providing reliable diagnostic outcomes across all varieties of CVD.
The subsequent sections of the article are arranged in the following order: Section 2 provides a comprehensive analysis of the literature in a descriptive form, giving a scope of previous studies. Section 3 offers an outline of the proposed technique along with study design. The results as well as their interpretation are presented in Section 4 along with an analysis of findings and their consequences. After that, Section 5 offers concluding remarks, and suggestions on the possibility for further improvements.

2. Associate Work

The detection and diagnosis of CVD have advanced significantly with the amalgamation of deep learning methods. Several studies have leveraged CNNs and other ML models in biomedical image investigation, particularly in cardiac imaging [6].
For instance, [7] investigated the potential of cloud computing in implementing a quantum machine learning (QML) framework for cardiac abnormality classification. This study preprocessed the Cleveland dataset, compared QML with traditional classifiers, explored QML classification methods such as quantum SVM and QNNs, and developed an ensemble model named bagging-QSVM. In [8], an artificial intelligence framework is presented for forecasting heart disease through multiple preprocessing steps, ensemble learning methods, and hyper parameter optimization strategies. Another ensemble model presented in [9] outperformed previous techniques by combining logistic regression with a majority voting mechanism for CVD prediction. Study [10] introduced the ML-DL-based Stacked [11] model for accurate cardiac illness prediction. This method integrated various machine learning techniques along with deep learning models.
The rising prevalence of heart disease has spurred extensive research into predictive modeling techniques to enhance early diagnosis and treatment. Mohan et al. [12] demonstrated the efficacy of ensemble methods by introducing a hybrid model combining Linear Regression and Random Forest, achieving 88.7% accuracy in heart disease prediction.
Furthermore, [13] evaluated the effectiveness of five ML procedures [14]: neural network, logistic regression, random forest, decision tree classifier, and Adaboost [15]. Amid these, the Random Forest model, that combines several trees using the Bagging concept, achieved the highest score. Li et al. [16] showcased the utility of CNNs in identifying cardiac abnormalities from echocardiographic images, achieving impressive accuracy rates and highlighting the potential for automated diagnosis. However, CNN architectures often face vanishing gradient issues and require careful hyper parameter tuning. To address these limitations, researchers have explored architectures that enhance gradient flow and feature propagation. DenseNet, proposed by Huang et al. [17], features densely connected blocks that facilitate direct information exchange between layers, thereby mitigating vanishing gradient problems and enabling efficient feature extraction.
In heart disease detection, Wang et al. utilized the DenseNet model to identify coronary artery disease from angiograms. In their study, they revealed the design capability of capturing complex patterns, and local irregularities, which outperform traditional methods [18]. Zhang et al. [19] adopted DenseNet for cardiac magnetic resonance images in cases of myocardial infarction. Detection—in this case— can learn to recognize pathological features with minimal manual feature engineering. Comparative analyses of various data mining techniques for cardiac disease prediction were presented in [20], which evaluated, Random Forest, Multi-layer Perceptron, K-nearest neighbors, and Logistic Regression. Another approach [21] proposed is a deep neural network combined with Linear SVC algorithm-based embedded selecting features technique, for predicting heart disease.
Additionally, [22] developed a model to accurately forecast cardiovascular conditions using a Huang beginning k-mode clustering method. The study employed several models comprising XGBoost (XGB), multilayer perceptron (MP), random forest (RF), and decision tree classifier (DT) to enhance classification accuracy. Despite these advancements, the application of the DenseNet network in CVD remains underexplored. This work tries to bridge this gap through conductive in-depth research into how DenseNet effectively utilizes these complex cardiovascular dysfunctions from various streams of medical images.
In other words, CNNs [23] have paved the way for the disease diagnosis to be in-dependent. However, the provided DenseNet model has a special advantage with respect to gradient-related challenges and provides better feature extraction capability. According to previous studies in this area, this paper further contributes to the deep learning branches of technology in diagnosing diseases such as CVD.
The reasons for this study were a few major drawbacks in current methods used for CVD through deep learning models [24]. There are some principal issues, including the diversity that is very limited within existing datasets, failing to present diversity in patient demographics, imaging modalities, and stages of disease. This shortfall indicates the requirement of additional varied and comprehensive datasets that improve applicability of models in real-world scenarios. However, deep learning models like DenseNet are extensively criticized for their opaqueness, making it essential to include better interpretability and explainability so that the predictions become meaningful and useful in clinical contexts. There is therefore a huge critical need for validation of these models against established clinical standards and integration into real clinical practices to assess their effectiveness and outcomes on patient health. Therefore, these biases must be addressed, for they limit the ability of models to generalize across different populations of patients [25]. In addition, incorporating methods to estimate prediction uncertainty will allow clinicians to assess more accurately how much trust to place in the model’s output, making decisions with greater knowledge and confidence. These identified issues will significantly improve the practical usability and reliability of deep learning models for cardiovascular diagnostics.

DenseNet in Cardiovasular Disease Detection

DenseNet, which was first suggested by Huang et al. [11], has proven to be highly successful in resolving vanishing gradient problems and enhancing feature propagation in deep neural networks. Numerous studies have been conducted on the use of DenseNet for medical imaging applications. Wang et al. [26] used a DenseNet model to identify coronary artery disease from angiograms, which was shown to outperform conventional CNNs in terms of its ability to depict intricate vascular structures. Analogously, Zhang et al. [27] employed DenseNet for analysis of cardiac magnetic resonance images, specifically for the detection of myocardial infarction, with excellent accuracy and very little manual feature engineering. In another research effort, Yao et al. [28] implemented a Dense-Inception variant on multi-organ segmentation tasks, further validating the flexibility of DenseNet architectures towards biomedical imaging. In spite of such achievements, the utilization of DenseNet for multi-modality cardiovascular disease (CVD) detection over angiograms, echocardiograms, and MRI is relatively unexplored. This endeavor seeks to plug this gap through fine-tuning a DenseNet model for wide-ranging CVD on a heterogeneous dataset so as to expand its clinical importance and generalizability.

3. Dataset Overview

The dataset is sourced from Kaggle [29], aggregates cardiovascular data from five different studies, i.e., Cleveland: 303, Hungarian: 294, Switzerland: 123, Long Beach VA: 200, and Stalog (Heart) Dataset: 270 totaling 1190 records which led to some inconsistencies. To clean the data, missing values were removed, categorical values were label-encoded, and numeric features were scaled between 0 and 1. Outliers in features like cholesterol and blood pressure were handled using the interquartile range (IQR) method. To avoid overfitting and ensure balanced class distribution, the data was split using stratified sampling into 70% for training (833 instances) and 20% for validation (238 instances), and 10% as the test dataset (119 instances). This dataset includes 11 features along with a target variable, combining both nominal and numeric attributes. The key features comprise the patient’s age, sex (1 for male and 0 for female), and four distinct chest pain as atypical angina, typical angina, non-anginal pain, and asymptomatic. Other notable attributes include resting blood pressure (measured in mm Hg at hospital admittance), serum cholesterol levels (mg/dL), and fasting blood sugar levels, with a value of 1 indicating fasting blood sugar greater than 120 mg/dL. The dataset also features resting electrocardiographic results, which classify into normal, ST-T wave abnormalities, or probable left ventricular hypertrophy. Additionally, it includes maximal heart rate attained when exercising, angina brought on by activity (1 for yes, 0 for no), exercise-induced ST depression in comparison to rest, as well as slope of peak exercise ST segment (categorized as flat, upsloping, or downsloping). The target variable, which indicates heart disease diagnosis, allows for binary classification of presence (1) or absence (0) of heart disease. A stratified random split was conducted in order to ensure class balance within both subsets. This allows the model to be trained on a representative sample of every class, reducing bias and enhancing generalization (70-20-10 pattern in training, validation, and tests). For this study, a binary classification approach was adopted by merging the multi-class labels into two categories:
No Disease (0)—570 Instances: Class 0
Disease (1)—620 Instances: Classes 1, 2, 3, and 4
This rich dataset serves as a valuable resource in creating forecasting models intended for diagnosing cardiovascular conditions.
Correlation matrix reveals complex relationships between heart disease attributes. Strong positive links exist between the target variable and ST slope, oldpeak, exercise angina, and chest pain type, suggesting potential indicators of heart disease. Conversely, max heart rate shows a strong negative correlation with the target. Age and sex also moderately influence max heart rate. While these correlations highlight potential patterns, it is crucial to remember they do not establish causation and require further investigation within the broader context of heart disease. A correlation matrix of several heart disease-related features is presented in Figure 1
The histograms provide a visual overview of the data distribution for each attribute, allowing for a quick assessment of their ranges, central tendencies, and potential outliers. Figure 2 presents a grid of histograms, each visualizing the distribution of a different attribute related to heart disease. There are a total of 14 histograms, arranged in a 4 × 3 grid. Each histogram represents a specific attribute X-axis of every histogram displays an interval of values associated with attributes, whereas Y-axis displays how many observations there are within each value range.
This dataset faces several challenges. It has an imbalanced target variable distribution, missing values, and inconsistencies due to data aggregation from multiple studies. Highly correlated features and a mix of numeric and categorized data necessitate careful feature selection and preprocessing. Non-linear relationships necessitate advanced algorithms, while ensuring model interpretability remains crucial. The small dataset size risks overfitting, and privacy and ethical considerations must be maintained. Additionally, the dataset’s specific demographics may limit model generalizability. Addressing these challenges is vital for creating reliable predictive models.

4. Proposed Methodology

4.1. DenseNet Architecture Design

The model architecture is designed to enable accurate prediction of CVD using DenseNet, which excels reusing features and improving gradient flow across layers. Therefore, this design could capture complex patterns and characteristics in images very well; hence, it is very useful for analyzing the medical image [26].
Within the framework of CVD, the architecture of DenseNet is designed to benefit from dense connectivity pattern. This results in the acceptance of all previous levels before it for all layers within the network so that information can be passed more efficiently and the network is designed to learn low-and high-level features effectively [27].
The blocks were strongly interconnected and consisted of ReLU activation functions and batch normalization after convolutional layers. The blocks are connected to each other to share features and to prevent vanishing of the gradients. Transition layers with activities of pooling and convolution are responsible for the regulation of growth in feature maps and complexity within the network. Designing the architecture requires appropriating depth, width, and complexity based on the characteristics of the dataset and available computational resources. Pre-trained weights on datasets like ImageNet can significantly speed convergence and improve the performance of the model. Fine-tuning the architecture may fine-tune the hyper parameters such as dropout, rates, learning rate, and batch size to acquire an optimal result [28].
Further, the architecture should be easily extendable to binary classification, as CVD classifies images into disease-present or disease-absent classes. The output layer of the architecture should consist of a sigmoid activation function in one neuron to obtain a score for the probability indicating the likelihood of disease presence [30].
In short words, the well-designed DenseNet architecture for CVD would indeed put together the benefits of dense connectivity, efficient feature extraction, and gradient flow to effectively learn and discriminate intricate patterns within medical images. Collaboration with medical professionals at every step will ensure that the architecture suits the clinical context and renders accurate and reliable predictions.
In DenseNet, as shown in Figure 3a, the network is organized into dense blocks, where every block contains multiple layers. The key aspect of DenseNet is the dense network architecture, where information from all previous levels is received by each layer. Let us break down the layer-wise details in a mathematical form [31].

4.2. Layer-Wise Details

‘l’ as the layer index within a dense block, starting from 0 for the first layer in the block. Hl as output of lth layer. x as input to dense block. In dense block, output Hl of the lth layer is computed by concatenating outputs of every layer that came before it 0, 1…… l-1 and then applying a non-linear transformation F—typically a composite function involving ReLU function and batch normalization [32].
H l = H l ( H 0 , H 1 , H 2 , , H t 1 )
where H 0 , H 1 , H 2 , , H t     1 signifies concatenation of feature map.

4.2.1. Transition Layers

These are used to control the number of feature maps and spatial dimensions amid dense blocks. This typically involves batch normalization, then average pooling to minimize the spatial dimensions, and finally a 1 × 1 convolution to reduce the quantity of feature mappings [33].

4.2.2. Overall DenseNet Structure

A DenseNet architecture comprises several dense blocks, with a transition layer in between the blocks. Input to network is symbolized as x (e.g., an input image), and final output is acquired by classifying the output of the last dense block using a fully connected and a global average pooling layer.
D e n s e N e t ( x ) = F C [ G A P { b l o c k 3 ( b l o c k 2 [ b l o c k 1 ( x ) ] ) } ]
where
Block 1, Block 2, and Block 3 refer to the initial, second, and third dense blocks, correspondingly. Global average pooling layer is known as GAP. The fully connected classification layer is called FC. A detailed schematic is shown in Figure 3b.
This equation represents forward pass through the DenseNet architecture, involving passing the input through dense blocks and the final classification layers.

5. Result Analysis

This study aims to construct a forecasting model to have diagnosis of cardiac conditions depending on DenseNet. A preprocessed dataset of cardiovascular attributes was used to train the model, while several metrics for evaluation were utilized for measuring performance of model. The subsections that follow give details on the experimental setup, properties of the dataset, and important findings based on the training and evaluation process of the built model.

5.1. Experimentation Setup

Stratified sampling was used to divide the dataset into 70% training, 20% validation, and 10% test sets. To guarantee a trustworthy assessment framework, each subset’s performance metrics were reported separately.
Using the TensorFlow Keras Sequential API, we built a DenseNet model to predict cardiac disease, consisting of three layers. The first layer consists of fully connected dense layers with 128 neurons, using the activation function as ReLU to transform input data into a 128-dimensional space. The second dense layer contains 64 neurons, further refining the data while also employing the activation function as ReLU. The finishing output layer comprises a single neuron with activation function as sigmoid, enabling binary classification to predict the presence (1) or absence (0) of heart disease.
The model utilizes loss function as binary cross-entropy, augmented with an appropriate version of the Adam optimizer tailored for binary classification. Evaluation measures offer a thorough analysis of the model’s performance in heart disease classification with 30 s per epoch, with a total of 70 epochs; the time required to train the model is 35 min. The training parameters reveal a total of 9729 trainable parameters: 1408 for the first dense layer, 8256 for the second, and 65 for the output layer. These parameters are tuned during the training process to lessen binary cross-entropy loss and enhance classifier accuracy.
Regarding computational hardware, the model was trained with machines including a 64 bit operating system, 8.00 GB of RAM, and an Intel(R) Core(TM) i3-4160 CPU working at 3.60 GHz, without a dedicated GPU. While this setup may lack high computational power, it is sufficient for training the model on this dataset, albeit at a slower pace compared to systems with more advanced capabilities.

5.2. Performance Parameters

When assessing the performance of a predictive model, different key metrics are employed to provide a comprehensive view of its accuracy and effectiveness. The considered key matrices of this proposed model are as follows [34]:
Test Accuracy: This measures the overall proportion of correct forecasts made by the model. It is measured as a ratio of correct forecasts to the entire amount of forecasts. Whilst accuracy does provide one clear metric, it could be quite misleading for imbalanced datasets.
A c c u r a c y = ( T P + T N ) / ( T P + T N + F P + F N )
F1 Score: It is harmonious average of recall and precision, offering a balanced evaluation of model performance. It is especially valuable when working with imbalanced datasets.
F   1   S c o r e = 2 × ( P r e c i s i o n × R e c a l l ) / ( P r e c i s i o n + R e c a l l )
Log Loss: It measures the discrepancy between expected probability and actual binary outcomes and is also referred to as cross-entropy loss. Better model performance is shown by lower log loss values.
L o g   L o s s = 1 N i = 1 N y i log p i + ( 1 y i ) log ( 1 p i )
  • N = no of samples
  • y = true label
  • p = predicted class
Precision: It measures the accuracy of positive predictions, determined by dividing the number of genuine positives by the sum of both false and true positives.
P r e c i s i o n = T P / ( T P + F P )
Sensitivity: It determines the proportion of actual positive cases that the model correctly identified. Ratio of true positives to the total of false negatives and true positives is used to compute it.
S e n s i t i v i t y = T P / ( T P + F N )
Specificity: It calculates the proportion of actual negative cases that the model correctly detected. It is calculated as the ratio of true negatives to the sum of false positives and true negatives.
S e n s i t i v i t y = T P / ( T P + F N )
Matthews Correlation Coefficient (MCC): It is a correlation coefficient amid forecasted and actual binary classification. On a scale of −1 to 1, 1 denotes an ideal forecast, −1 absolute disagreement, and 0 indicating a random prediction. MCC is considered a balanced measure, even when dealing with imbalanced datasets.
M C C = ( ( T P × T N ) ( F P × F N ) ) ( ( T P + F P ) ( T P + F N ) ( T N + F P ) ( T N + F N ) )

5.3. Objective Analysis

The results achieved from the DenseNet-based CVD model reflect a strong high overall accuracy performance as illustrated in Table 1. These metrics shed light on the model’s capacity to effectively discern among negative and positive cases of CVD:

Performance Parameters

The DenseNet-based model is evaluated with respect to a lot of metrics including accuracy, precision, F1 score, log loss, sensitivity, specificity, and Matthews’s correlation coefficient. All these metrics would give a holistic view of the working of the model, which can classify a case as cardiovascular disease and the overall predictive performance of the model.
The DenseNet model performed very well in terms of cardiovascular disease detection. The training accuracy was 0.964 and test accuracy as 0.924, which indicates strong accuracy; an F1 score of 0.93 reflects a sensible trade-off between precision and recall. Log loss is at 0.275, indicating well-calibrated predicted probabilities. An excellent precision value of 0.909 and a sensitivity, or true positive rate, value of 0.952 indicate the good ability of the model to correctly classify positive cases. The true negative rate, or specificity, is 0.893, which is a good result in differentiating negative cases. In addition, the Matthews correlation coefficient is 0.849, and such results indicate strong classification by the model. Taken as a whole, these results suggest that the cardiovascular disease detection model based on DenseNet can be used as a useful method.
In summary, the DenseNet-based CVD model achieved a high F1-score, precision, accuracy, and recall across training, validation, and test datasets. The model’s consistent performance on the independent test dataset confirms its generalization capability, making it a reliable tool for CVD.
This matrix assists in evaluating the model’s capability to differentiate among various categories. Using these values, metrics like precision, F1-score, and recall can be derived, offering a granular insight into the model’s performance.
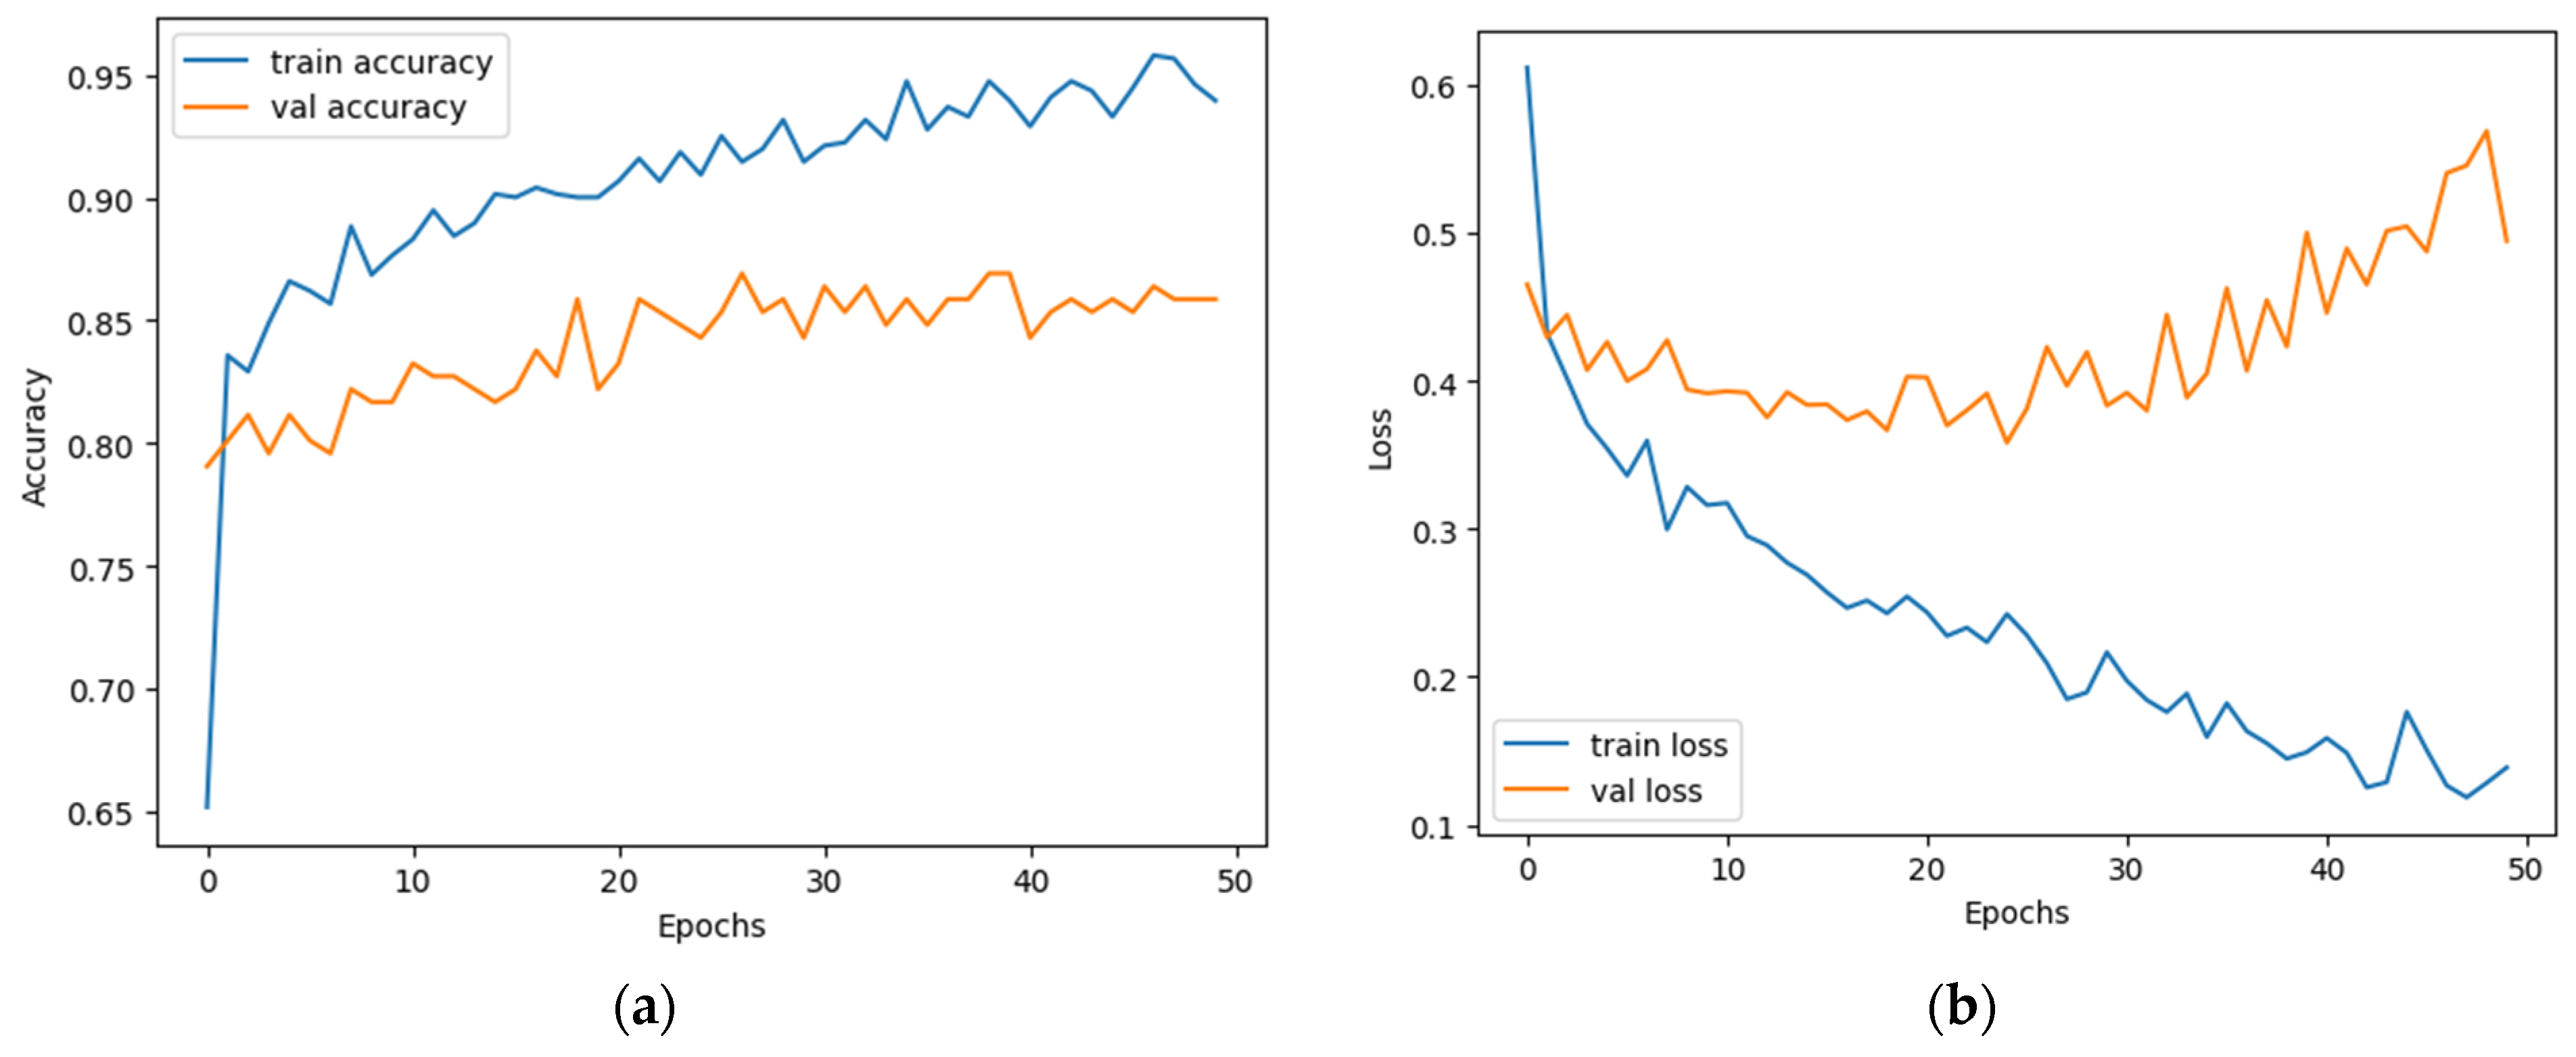
Figure 4 graphically illustrates the effectiveness of a model for classification by illustrating the relationship between true and false positive rates. In the context of our CVD project, the ROC curve represents the effectiveness of our model in distinguishing between positive (indicating the existence of CVD) and negative cases (indicating the nonexistence of CVD). An ROC curve that leans towards the top-left corner specifies strong performance. Figure 4 depicts a close-up visualization of how well the model is performing at training. Figure 4a shows the ROC curve, reflecting the capability of the model to separate positive (CVD present) and negative (CVD absent) instances. An ROC curve pointing towards the top-left corner shows high classification performance. Figure 4b illustrates the training and validation set accuracy curves versus epochs. Optimally, training and validation accuracy would rise simultaneously, indicating that the model is learning successfully without overfitting. Figure 4c shows the training and validation curves of loss. A consistent drop and both losses converging to lower values are a sign of successful model training. Small oscillations seen in the validation curves are unavoidable due to variability in the dataset but do not indicate significant overfitting. In general, the accuracy and loss curve trends validate that the DenseNet-based model had good generalization to unseen data. The training (0.068) to validation (0.315) log loss difference indicates minor overfitting, with the model performing well with training data but poorly with new data. We applied methods such as dropout, data augmentation, and class balancing to minimize overfitting. Minor class imbalance could also influence validation performance.
The fluctuations in Figure 4b,c are common in deep learning training sessions. Minor variations in validation accuracy in Figure 4b are as a result of the model adjusting to various validation samples during each epoch. The same can be seen in Figure 4c where fluctuations in validation loss are produced due to overfitting habits and dataset variability. These oscillations are normal, particularly with the use of real-world or small-sized datasets. In Figure 4b, Accuracy on the Y-axis varies between 0 and 1. In Figure 4c, Loss on the Y-axis is a unitless scalar based on the cross-entropy loss function. The units have been specifically included in the Y-axis labels and figure captions in the revised version for greater clarity. Figure 4b,c show various performance metrics of the identical model: accuracy and loss, respectively. Though related, they do not always have perfectly aligned trends. For example, the loss function reflects the confidence in predictions, while accuracy reflects the number of correct classifications. Figure 4d shows an insightful analysis of our model’s forecasts across various classes.
We also tested the model on a separate test dataset that was not used during training or validation to ensure it performed well on new data. To represent unbiased performance, the confusion matrix, created solely from the test set (n = 119), is shown in Figure 5d. This same test split is used to determine the classification metrics in Table 1, guaranteeing consistency. As shown in Figure 5, the model achieved strong and balanced results, confirming its ability to make accurate predictions in practical, real-world situations.

6. Comparative Evaluation

To establish a better comparison of how well the model suggested performs, a comparison was made. This section summarizes earlier approaches and compares the results of the model with other well-known CNN structures.

6.1. Comparison with Existing Methods

In order to examine whether this DenseNet-based model outperforms other competing techniques, we conduct a critical benchmarking experiment on the publicly available datasets. Table 2 presents a comparison based on different parameters for every model. These outcomes underscore the usefulness of DenseNet architecture in improving CVD, illustrating how advanced deep learning techniques can significantly advance medical diagnostics and patient management.

6.2. Benchmarking Analysis

In order to assess our proposed DenseNet architecture, we have compared it with some other widely used convolutional neural networks like VGG-16 and VGG-19, which are two different variants of the VGG-16 model. Other successful models like ResNet-50 and ResNet-101 were selected for comparison. We trained these models on an identical dataset used for DenseNet, ensuring consistent experimental conditions. The different performance metrics were calculated for each model to facilitate a thorough comparison and presented in Table 3 and Table 4.
VGG16 architecture has a very promising ability in the detection of cardiovascular disease by using deep learning. Combining this capability with high accuracy and transfer learning helps incorporate it into the work of researchers and clinicians.
Although there are a lot of deep convolutional neural networks, one of most promising architectures is VGG19, shown to hold great promise within a broad spectrum of computer vision applications, such as biomedical image investigation. Being able to capture advanced features from images provides broad potential for cardiovascular disease detection.
ResNet50 has proven to be an extremely effective tool in the better execution of a significant amount of computer vision tasks. Its new residual learning mechanism has improved its capability to learn higher-order features using large datasets, making it fit for cardiovascular disease detection.
ResNet 101 is a finer variant of ResNet framework having 101 layers. Due to this increased depth, it can learn much more complex features from medical images than in conventional architecture, potentially helping to improve performance on tasks such as the detection of cardiovascular disease.
Figure 6, Figure 7, Figure 8 and Figure 9 compare the VGG-16 and 19, ResNet-50 and 101 models by providing different graphs. ROC curves that describe how true and false positive rates are traded off with each other and a summary of classification quality using confusion matrices.
We compare different machine learning models developed for the detection of cardiovascular disease. The results show that DenseNet performs better than the other models with regard to general performance, F1-score, and accuracy. This indicates that feature reuse and deeper feature extraction best helps DenseNet to be more appropriate for this task.
The VGG-16 architecture, though efficient, needed more computational resources and took longer to train in comparison with DenseNet. Although VGG-19 is deeper, it did not offer improved performance and increased training times compared to DenseNet. ResNet-50 used residual connections, hence proving superior to the VGG models by preventing vanishing gradients, though it could not reach the performance of DenseNet. ResNet-101, though deeper, did not offer a higher performance compared with ResNet-50 and could also not surpass the performance of DenseNet. This model achieved a validation accuracy of 0.903 with a precision of 0.905, a recall of 0.927, and an F1-score of 0.915.
DenseNet showed an unvarying better performance compared to any other established models for all comparison performance metrics, especially in terms of F1 score and accuracy. This implies that the reuse of features and capability of DenseNet to capture intricate data patterns make it more suitable for particular applications. Table 3 and Table 4 provide a summary of the findings.
Apart from training and validation, an independent test dataset was employed to provide a stable and unbiased assessment of the performance of the model. The model performed a test accuracy of 92.44%, test loss of 0.2748, precision of 90.91%, and recall of 95.24% on previously unseen test data. These results demonstrate the model’s strong generalization ability, confirming its robustness and reliability when applied to new, real-world clinical cases beyond training and validation sets. The addition of the test set is in response to the possibility of overfitting and affirms the robustness of the model for actual use.
The comparative test set performance of every deep learning model assessed using the independent test data is displayed in Table 5. DenseNet maintained the lowest test loss of 0.2748 while achieving the highest scores across the majority of evaluation metrics, such as F1 Score, Accuracy, and MCC, demonstrating its strong generalization ability.

7. Conclusions

Through an extensive investigation into CVD using DenseNet architecture, our study has yielded compelling facts regarding the functionality of the model on tabular data. Our model attained an impressive accuracy of 0.924, accurately categorizing around 92% of cases. The F1 score of 0.930 emphasizes model’s capability to distinguish negative and positive cases effectively. A log loss of 0.275 showcases the model’s confident probability predictions. Precision (0.909) underscores the model’s correctness in positive predictions, while a sensitivity of 0.952 demonstrates its efficacy in identifying actual positive cases. Specificity at 0.893 reflects the model’s skill in distinguishing negative instances. An MCC of 0.845 strengthens correlation between predictions and actual outcomes. Confusion matrix and correlation heatmap offer detailed information on how well the model performs and attributes relationships. These results confirm our DenseNet-based model as a robust tool for detecting CVD. Its potential to enhance patient care underscores the impactful fusion of technology and medical insights. In conclusion, our study bridges data science and medical expertise, setting the stage for future advancements in healthcare diagnostics.

7.1. Limitations

The DenseNet-based model has some limitations. The dataset may not represent all patient demographics, imaging types, or disease stages, which could impact generalizability. The model’s interpretability is limited, making it challenging to comprehend the rationale behind its predictions. Additionally, the model has not been validated against clinical standards, and because of its resource-intensiveness, it might not be able to be used in environments with sufficient computer power.

7.2. Future Work

Further studies must concentrate on expanding the dataset to improve generalizability, enhancing model interpretability, and validating the model in clinical settings. Addressing bias and improving generalization are important, as is incorporating uncertainty estimation to aid decision-making. Developing resource-efficient model variants will also help facilitate deployment in resource-constrained environments.

Author Contributions

Conceptualization, W.H. and T.J.; methodology, T.K. and T.J.; software, T.K. and T.J.; validation, N.A. and T.J.; formal analysis, W.H. and T.J.; investigation, N.A. and T.J.; resources, R.S. and T.J.; data curation, R.S. and T.J.; writing—original draft preparation, T.J.; writing—review and editing, T.J.; visualization, T.J.; supervision, F.A. and T.J.; project administration, F.A. and T.J. All authors have read and agreed to the published version of the manuscript.

Funding

This research received no external funding.

Data Availability Statement

Upon reasonable request, the data supporting this study’s conclusions can be obtained.

Acknowledgments

The authors extend their appreciation to their universities for the sustained encouragement provided throughout this work.

Conflicts of Interest

The authors declare no conflicts of interest.

References

  1. Abbas, S.; Sampedro, G.A.; Alsubai, S.; Almadhor, A.; Kim, T. An efficient stacked ensemble model for heart disease detection and classification. Comput. Mater. Contin. 2023, 77, 665–680. [Google Scholar] [CrossRef]
  2. Arvaniti, E.; Claassen, M.; Giamberardino, G. Automated cardiac diagnosis challenge (ACDC) & caudate nucleus segmentation challenge—Preliminary results. In Statistical Atlases and Computational Models of the Heart. ACDC and MMWHS Challenges; Springer: Cham, Switzerland, 2017; pp. 196–206. [Google Scholar]
  3. Asif, D.; Bibi, M.; Arif, M.S.; Mukheimer, A. Enhancing heart disease prediction through ensemble learning techniques with hyperparameter optimization. Algorithms 2023, 16, 308. [Google Scholar] [CrossRef]
  4. Bhatt, C.M.; Patel, P.; Ghetia, T.; Mazzeo, P.L. Effective heart disease prediction using machine learning techniques. Algorithms 2023, 16, 88. [Google Scholar] [CrossRef]
  5. Bilgaiyan, S.; Ayon, T.; Khan, A.; Johora, F.; Parvin, M.; Alam, M. Heart disease prediction using machine learning. In Proceedings of the 2023 International Conference on Computing, Communication, and Information Technology (ICCCI), Coimbatore, India, 23–25 January 2023; IEEE: Piscataway, NJ, USA, 2023; pp. 1–6. [Google Scholar] [CrossRef]
  6. Alsharqi, M.; Edelman, E.R. Artificial Intelligence in Cardiovascular Imaging and Interventional Cardiology: Emerging Trends and Clinical Implications. J. Soc. Cardiovasc. Angiogr. Interv. 2025, 4 Pt B, 102558. [Google Scholar] [CrossRef] [PubMed]
  7. Chen, L.; Bentley, P.; Mori, K. Deep learning in medical image analysis. In Medical Imaging Technology; Springer: Cham, Switzerland, 2019; pp. 25–46. [Google Scholar]
  8. Coursera. Deep Learning Specialization by Andrew Ng. Coursera. Available online: https://www.coursera.org/specializations/deep-learning (accessed on 26 July 2025).
  9. Divya, K.; Sirohi, A.; Pande, S.; Malik, R. An IoMT assisted heart disease diagnostic system using machine learning techniques. In Cognitive Internet of Medical Things for Smart Healthcare; Springer: Berlin/Heidelberg, Germany, 2021; pp. 145–161. [Google Scholar]
  10. Enad, H.G.; Mohammed, M.A. Cloud computing-based framework for heart disease classification using quantum machine learning approach. J. Intell. Syst. 2024, 33, 20230261. [Google Scholar] [CrossRef]
  11. Huang, G.; Liu, Z.; Van Der Maaten, L.; Weinberger, K.Q. Densely connected convolutional networks. In Proceedings of the IEEE Conference on Computer Vision and Pattern Recognition, Honolulu, HI, USA, 21–26 July 2017; pp. 4700–4708. [Google Scholar]
  12. LeCun, Y.; Bengio, Y.; Hinton, G. Deep learning. Nature 2015, 521, 436–444. [Google Scholar] [CrossRef] [PubMed]
  13. Li, H.; Duan, W.; Zhou, T.; Jin, X. Automated detection of cardiac abnormalities from echocardiographic images using convolutional neural networks. In Proceedings of the 2018 IEEE International Conference on Healthcare Informatics (ICHI), New York, NY, USA, 4–7 June 2018; IEEE: Piscataway, NJ, USA, 2018. [Google Scholar]
  14. Liang, G.; Zheng, L.; Zhang, L.; Lin, L.; Xiang, D. Deep learning-based cardiovascular disease diagnosis and monitoring: A review. Front. Cardiovasc. Med. 2020, 7, 169. [Google Scholar]
  15. Litjens, G.; Kooi, T.; Bejnordi, B.E.; Setio, A.A.A.; Ciompi, F.; Ghafoorian, M.; Sánchez, C.I. A survey on deep learning in medical image analysis. Med. Image Anal. 2017, 42, 60–88. [Google Scholar] [CrossRef] [PubMed]
  16. Madani, A.; Arnaout, R.; Mofrad, M.; Arnaout, R. Fast and accurate view classification of echocardiograms using deep learning. NPJ Digit. Med. 2018, 1, 6. [Google Scholar] [CrossRef] [PubMed]
  17. Majumder, A.B.; Gupta, S.; Singh, D.; Acharya, B.; Gerogiannis, V.C.; Kanavos, A.; Pintelas, P. Heart disease prediction using concatenated hybrid ensemble classifiers. Algorithms 2023, 16, 538. [Google Scholar] [CrossRef]
  18. Melendez, J.; Sánchez, C.I. Deep learning in medical image analysis: A comprehensive review. Biomed. Signal Process. Control 2020, 60, 101986. [Google Scholar]
  19. Mohan, S.; Thirumalai, C.; Srivastava, G. Effective heart disease prediction using hybrid machine learning techniques. IEEE Access 2019, 7, 81542–81554. [Google Scholar] [CrossRef]
  20. Official DenseNet GitHub Repository. GitHub. Available online: https://github.com/liuzhuang13/DenseNet (accessed on 26 July 2025).
  21. Kabir, P.B.; Akter, S. Emphasised research on heart disease divination applying tree-based algorithms and feature selection. In Proceedings of the 2021 International Conference on Innovative Computing, Intelligent Communication and Smart Electrical Systems (ICSES), Chennai, India, 24–25 September 2021; pp. 1–6. [Google Scholar] [CrossRef]
  22. PyTorch documentation on DenseNet. PyTorch. Available online: https://pytorch.org/hub/pytorch_vision_densenet/ (accessed on 26 July 2025).
  23. Quang, N.N.; Gatt, A. A survey of deep learning techniques for medical image classification. In Proceedings of the 3rd International Conference on Image and Graphics Processing, Jeju Island, Republic of Korea, 24–26 February 2019; pp. 87–93. [Google Scholar]
  24. Samad, M.D.; Ulloa, A.; Wehner, G.J.; Jing, L.; Hartzel, D.N.; Good, C.W.; Williams, B.A.; Haggerty, C.M.; Fornwalt, B.K. Predicting survival from large echocardiography and electronic health record datasets: Optimization with machine learning. JACC Cardiovasc. Imaging 2019, 12, 681–689. [Google Scholar] [CrossRef] [PubMed]
  25. Mohapatra, S.; Maneesha, S.; Mohanty, S.; Patra, P.K.; Bhoi, S.K.; Sahoo, K.S.; Gandomi, A.H. A stacking classifiers model for detecting heart irregularities and predicting cardiovascular disease. Healthc. Anal. 2023, 3, 100133. [Google Scholar] [CrossRef]
  26. Wang, X.; Zhang, L.; Zhou, Z. DenseNet-based deep learning for coronary artery disease detection from angiograms. Med. Image Anal. 2019, 57, 88–95. [Google Scholar] [CrossRef] [PubMed]
  27. Zhang, Y.; Liu, Y.; Chen, Y.; Zhang, Y. Application of DenseNet architecture in cardiac magnetic resonance image analysis for myocardial infarction detection. IEEE Trans. Med. Imaging 2020, 39, 2986–2996. [Google Scholar]
  28. Yao, J.; Burns, J.E.; Munoz, H.E.; Summers, R.M.; Yao, J. Dense-inception network for abdominal multi-organ segmentation. In International Workshop on Large-Scale Annotation of Biomedical Data and Expert Label Synthesis; Springer: Cham, Switzerland, 2017; pp. 164–172. [Google Scholar]
  29. Available online: https://www.kaggle.com/datasets/sid321axn/heart-statlog-cleveland-hungary-final (accessed on 24 February 2024).
  30. Szegedy, C.; Ioffe, S.; Vanhoucke, V.; Alemi, A. Inception-v4, Inception-ResNet and the impact of residual connections on learning. In Proceedings of the Thirty-First AAAI Conference on Artificial Intelligence, San Francisco, CA, USA, 4–9 February 2017. [Google Scholar]
  31. Almulihi, A.; Saleh, H.; Hussien, A.M.; Mostafa, S.; El-Sappagh, S.; Alnowaiser, K.; Ali, A.A.; Refaat Hassan, M. Ensemble Learning Based on Hybrid Deep Learning Model for Heart Disease Early Prediction. Diagnostics 2022, 12, 3215. [Google Scholar] [CrossRef] [PubMed]
  32. Zhang, Y.; Yang, L.; Chen, J.; Zhang, X.; He, W.; Tong, L. Multi-class classification of skin cancer images with deep learning techniques. IEEE Access 2019, 7, 11580–11587. [Google Scholar]
  33. Zhuang, X.; Wei, Y.; Li, Y.; Jia, Y.; Shi, J.; Lin, J. Attend in, localize and segment (AILS): Weakly supervised learning of a dense event captioning model. In Proceedings of the IEEE Conference on Computer Vision and Pattern Recognition, Long Beach, CA, USA, 15–20 June 2019; pp. 10419–10428. [Google Scholar]
  34. Jaware, T.; Khanchandani, K.; Badgujar, R. A novel hybrid atlas-free hierarchical graph-based segmentation of newborn brain MRI using wavelet filter banks. Int. J. Neurosci. 2019, 130, 499–514. [Google Scholar] [CrossRef] [PubMed]
  35. Dritsas, E.; Trigka, M. Application of deep learning for heart attack prediction with explainable artificial intelligence. Computers 2024, 13, 244. [Google Scholar] [CrossRef]
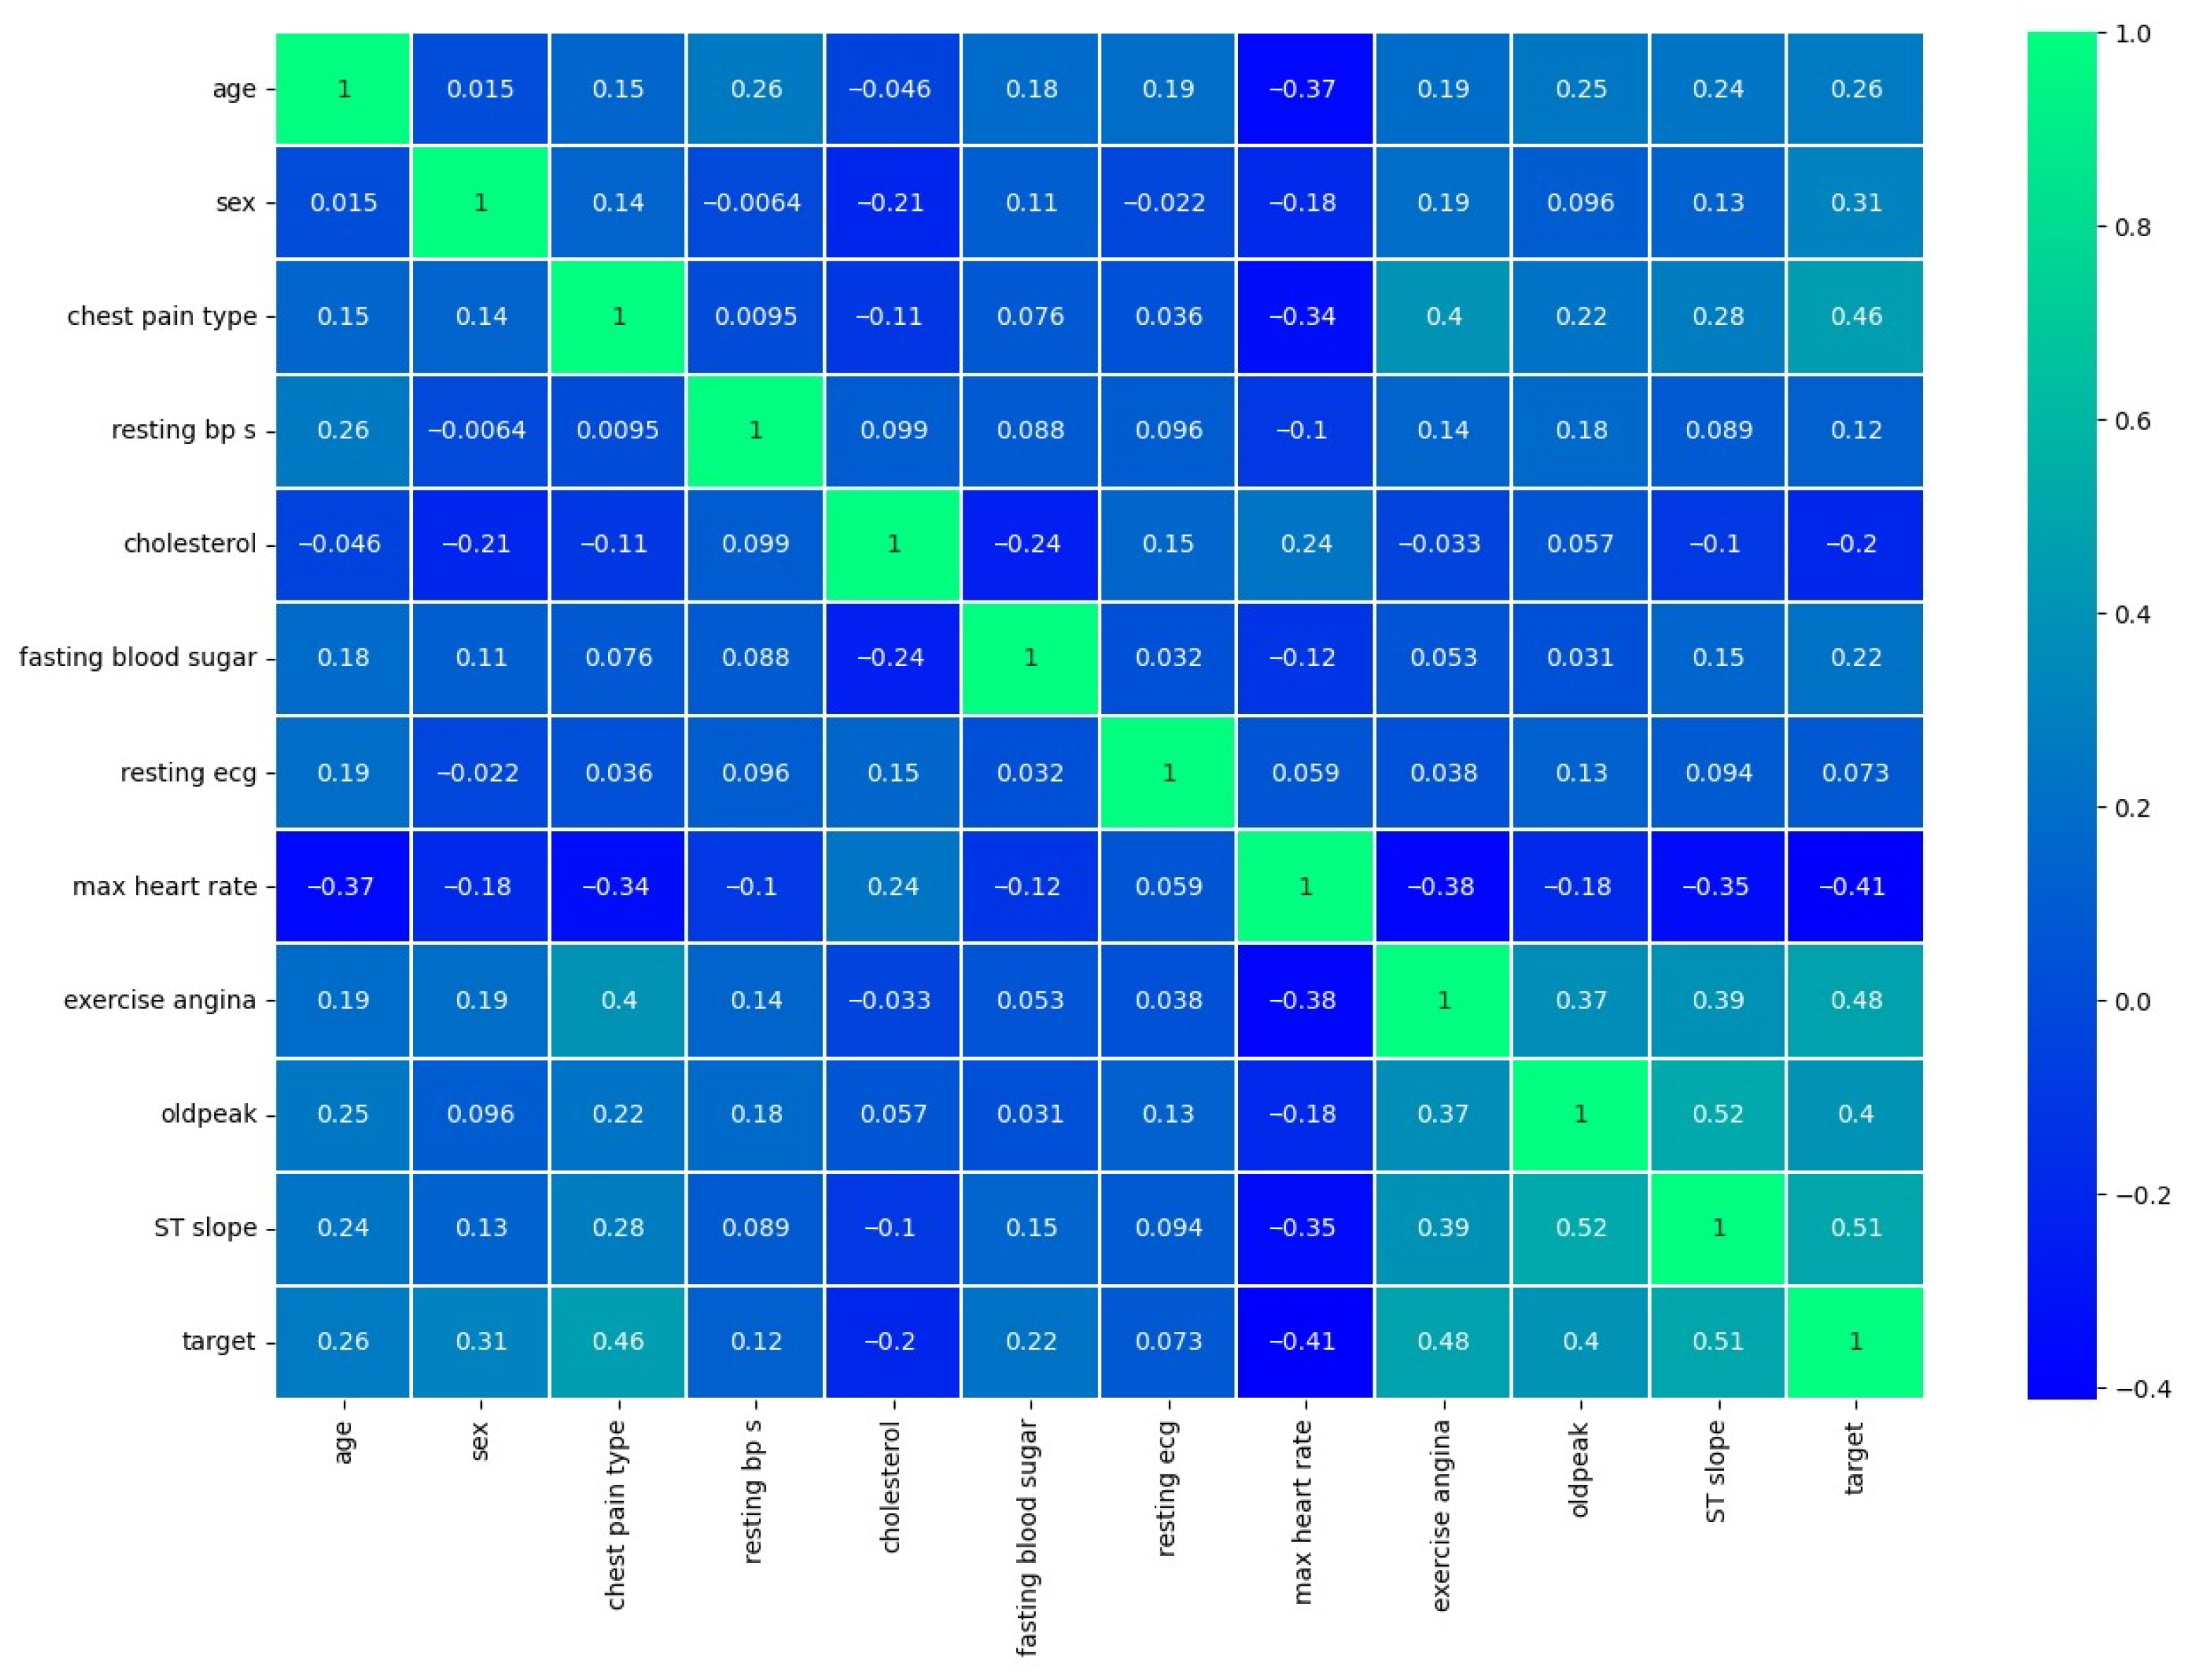
Figure 1. Correlation coefficients between various attributes related to heart disease.
Computers 14 00330 g001
Figure 2. Histograms of heart disease attributes.
Computers 14 00330 g002
Figure 3. (a) DenseNet architecture; (b) Layer-wise details.
Computers 14 00330 g003aComputers 14 00330 g003b
Figure 4. (a) ROC curve; (b) accuracy curve; (c) loss curve; (d) confusion matrix for training and validation.
Computers 14 00330 g004
Figure 5. (a) ROC curve; (b) accuracy curve; (c) loss curve; (d) confusion matrix for test data.
Computers 14 00330 g005
Figure 6. (a) Accuracy curve; (b) loss curve; (c) ROC curve; (d) confusion matrix for VGG 16.
Computers 14 00330 g006
Figure 7. (a) Accuracy curve; (b) loss curve; (c) ROC curve; (d) confusion matrix for VGG 19.
Computers 14 00330 g007aComputers 14 00330 g007b
Figure 8. (a) Accuracy curve; (b) loss curve; (c) ROC curve; (d) confusion matrix for ResNet50.
Computers 14 00330 g008
Figure 9. (a) Accuracy curve; (b) loss curve; (c) ROC curve; (d) confusion matrix for ResNet101.
Computers 14 00330 g009
Table 1. Statistical parameters.
ParametersTrainingValidationTesting
Accuracy0.9640.9100.924
Precision0.9620.9050.909
F1-score0.9630.9150.930
Log Loss0.0680.3150.275
Sensitivity0.9690.9270.952
Specificity0.8750.8750.893
Matthews Correlation Coefficient0.7720.7720.849
Table 2. Benchmarking with existing methods.
ModelAccuracy (%)Precision (%)Recall (%)F1 Score (%)
FT-DNN [10]80.1977.0386.7769.43
DNN [10]76.7372.8586.1967.32
AdaBoost [13]80.3388.0072.0079.00
RF [13]83.6189.0078.0083.00
KNN [13]81.7989.0072.0081.00
XGBoost [13]80.3386.0075.0080.00
LR [13]81.9784.0081.0083.00
Concatenated Hybrid Ensemble Classifiers [15]86.8981.886.984.3
QNN [10]77.0076.0073.0075.00
QSVM [10]85.0079.0090.0084.00
MLP [35]85.0083.0084.0084.00
RNN [35]84.0082.0083.0082.00
GRU [35]89.0087.0088.0087.00
LSTM [35]88.0086.0087.0087.00
CNN [35]87.0085.0086.0085.00
XAI [35]90.0089.0090.0089.00
Proposed (DenseNet)92.4490.9195.2493.02
Table 3. Comparative analysis.
ModelsTrainingValidation
AccuracyLossAccuracyLoss
ResNet500.9600.0930.7960.852
ResNet1010.9580.0020.8631.799
VGG-160.9520.1200.8740.523
VGG-190.9420.16108730.566
DenseNet (proposed)0.9640.0670.9030.314
Table 4. Performance comparison.
ParametersVGG 16VGG 19ResNet 50ResNet 101DenseNet
Accuracy0.8740.8730.7960.8630.903
Recall (Sensitivity)0.9000.9000.8600.9000.927
Precision0.8930.9170.8100.8930.905
F1 Score0.8970.9140.8800.8970.915
Specificity0.8470.8970.9060.9060.875
MCC0.7780.9070.8870.9070.772
Table 5. Comparative test set performance.
ParameterVGG16VGG19ResNet50ResNet101DenseNet
Accuracy0.87390.88240.89080.91600.9244
Precision0.88710.87690.90320.92060.9091
Recall (Sensitivity)0.87300.90480.88890.92060.9524
Specificity0.87500.85710.89290.91070.8929
F1 Score0.88000.89060.89600.92060.9302
MCC0.74740.76390.78110.83140.8489
Test Loss0.52430.50230.47580.48360.2748
Disclaimer/Publisher’s Note: The statements, opinions and data contained in all publications are solely those of the individual author(s) and contributor(s) and not of MDPI and/or the editor(s). MDPI and/or the editor(s) disclaim responsibility for any injury to people or property resulting from any ideas, methods, instructions or products referred to in the content.