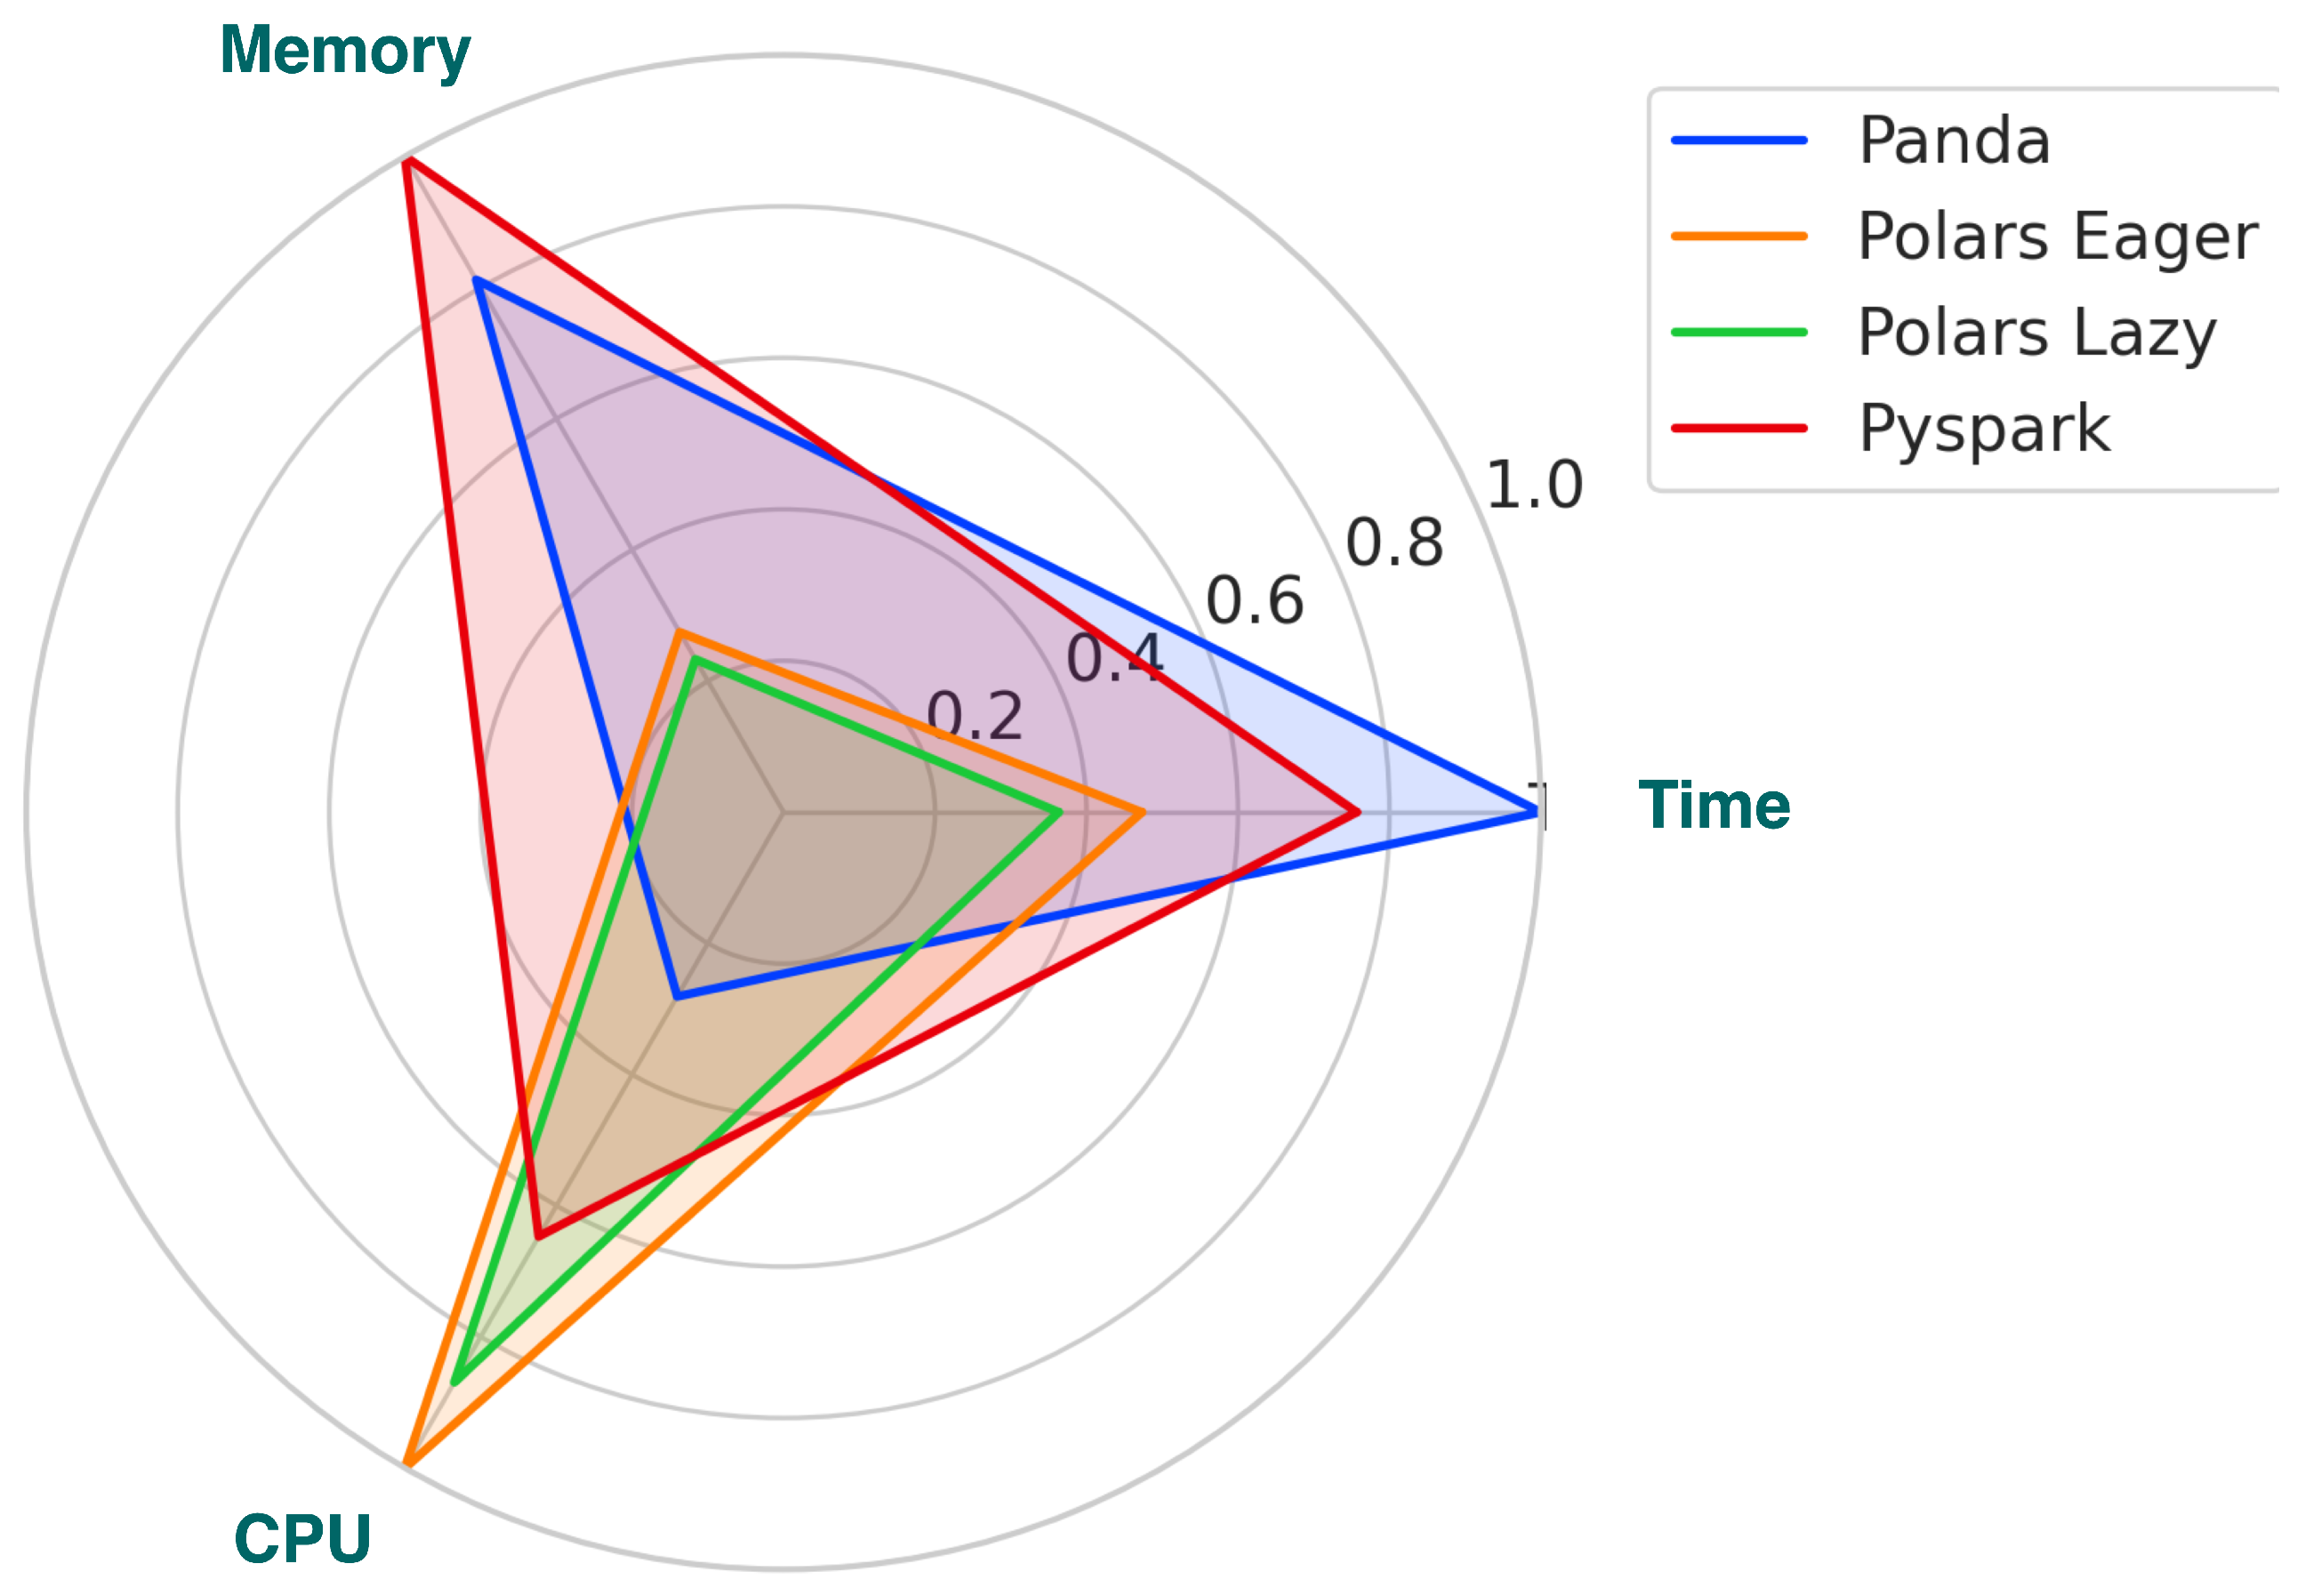
Abstract
This study evaluates the performance and energy trade-offs of three popular data processing libraries—Pandas, PySpark, and Polars—applied to GreenNav, a CO2 emission prediction pipeline for urban traffic. GreenNav is an eco-friendly navigation app designed to predict CO2 emissions and determine low-carbon routes using a hybrid CNN-LSTM model integrated into a complete pipeline for the ingestion and processing of large, heterogeneous geospatial and road data. Our study quantifies the end-to-end execution time, cumulative CPU load, and maximum RAM consumption for each library when applied to the GreenNav pipeline; it then converts these metrics into energy consumption and CO2 equivalents. Experiments conducted on datasets ranging from 100 MB to 8 GB demonstrate that Polars in lazy mode offers substantial gains, reducing the processing time by a factor of more than twenty, memory consumption by about two-thirds, and energy consumption by about 60%, while maintaining the predictive accuracy of the model (R2 ≈ 0.91). These results clearly show that the careful selection of data processing libraries can reconcile high computing performance and environmental sustainability in large-scale machine learning applications.
1. Introduction
The escalating growth of urban areas, coupled with increasing road traffic, directly contributes to significant rises in CO2 emissions and notable deterioration in air quality [1]. This challenge is particularly acute in major cities such as Paris, where effective traffic management poses a crucial issue for local decision makers and residents [2,3]. In response, artificial intelligence (AI)-based predictive systems have emerged as essential tools that provide accurate forecasts, optimizing traffic flows and prioritizing eco-friendly routes [4].
However, these technological advancements come with a substantial environmental cost, primarily due to their intensive consumption of computing resources. Numerous studies highlight the growing energy footprints associated with large-scale AI models [5,6]. For instance, training GPT-3 is estimated to have generated approximately 552,000 kg of CO2 [7], equivalent to the carbon footprint produced when manufacturing around 147 gasoline-powered vehicles [8]. More broadly, research conducted by the University of Massachusetts Amherst indicates that training large natural language processing (NLP) models generates significant CO2 emissions. Specifically, training a large transformer model with a neural architecture search can produce about 284 tons of CO2, equivalent to the lifetime emissions of five average cars or roughly 315 round-trip flights between New York and San Francisco for one passenger [9].
Therefore, the widespread deployment of these technologies, although beneficial for industrial, logistical, and decision-making processes, raises critical questions regarding environmental sustainability. This paradox—the considerable potential benefits of AI versus its substantial energy requirements—underscores the urgent need to design energy-efficient AI models capable of delivering comparable performance while significantly reducing energy consumption [10].
From this perspective, our study adopts a responsible scientific approach, aiming to demonstrate the feasibility of combining high predictive accuracy and energy efficiency through a structured and optimized data processing pipeline [11]. Specifically, we evaluate the energy efficiency of different software configurations across three critical stages of our production pipeline applied to GreenNav, an eco-friendly navigation application:
- The ingestion of diverse data from multiple sources and APIs;
- Rigorous pre-processing, including the cleaning, imputation, and normalization of data;
- The probabilistic modeling of CO2 emissions for each road segment.
To achieve this objective, we conduct a detailed comparative analysis of three widely recognized big data processing libraries: Pandas [12], PySpark [13], and Polars [14]. The purpose of this comparison is to identify the most suitable software library capable of maintaining high predictive accuracy while minimizing the computational resources necessary for implementation.
The remainder of the article is structured as follows: after presenting each component of our production pipeline in detail, we outline our comparative methodology and the experimental results obtained. Finally, we discuss the implications of our findings, emphasizing the importance of adopting a reasoned and responsible approach when designing predictive solutions with significant environmental impacts.
2. Related Works
Green computing has become a major area of interest over the last two decades, aiming to reduce the environmental footprints of IT systems across hardware, software, and usage practices. Early frameworks, such as Murugesan’s four pillars (green use, disposal, design, and manufacturing), provided high-level guidelines for sustainable computing [15]. Later, Saha [15,16] and Paul et al. [17] expanded the scope through systematic reviews covering energy consumption, virtualization, data center optimization, and eco-certification schemes. Zhou et al. [18] also proposed a focused taxonomy for green AI, highlighting four key dimensions: energy measurement, model efficiency, system-level optimization, and AI for sustainability.
While significant efforts have targeted data center energy management, including virtualization, workload consolidation, and advanced cooling techniques, the literature remains largely focused on infrastructure-level solutions. Lin et al. [19] introduced a reinforcement learning-based framework for server consolidation. However, such dynamic approaches are still rare and primarily confined to hardware-level control.
Other research has addressed software-level optimizations, such as DVFS-based OS schedulers and power-aware application design. End-user strategies, including thin clients, aggressive sleep policies, and equipment recycling, have also been explored, alongside procurement policies guided by eco-labels like ENERGY STAR and EPEAT [20].
Despite this body of work, energy and resource optimization within data science pipelines, particularly during data preparation, model training, and evaluation, remains underexplored. Most green computing approaches do not address the specificities of high-volume data workflows or the trade-offs involved in selecting preprocessing tools. This gap is acknowledged in recent surveys by Paul et al. [17] and Zhou et al. [18], who emphasize the need for fine-grained, adaptive techniques integrated directly into the AI development process.
Our study sheds new light on the detailed resource consumption and energy efficiency during the data preprocessing phase for CNN-LSTM models, widely used in road traffic prediction. While CNN-LSTM models have been extensively studied [21], the precise step-by-step resource usage and computational efficiency of data preprocessing remain largely unexplored. This work explicitly addresses this gap by providing a fine-grained comparative analysis of the Pandas, Polars, and PySpark libraries in terms of computational and energy performance.
Concomitantly, the industrialization of MLOps workflows has significantly increased the energy footprints of data preprocessing stages. In real-world production scenarios, large-scale feature engineering pipelines often run repeatedly on generic CPU infrastructures, such as CI/CD pipelines and Kubernetes pods, which typically lack GPU acceleration capabilities. Consequently, the choice of dataframe library (e.g., Pandas for Eager execution, Polars for Lazy execution, or PySpark for distributed processing) critically influences both the execution time and the overall energy consumption. Given the growing importance of these operational realities, a detailed examination of CPU and GPU considerations in preprocessing pipelines is essential. This critical issue will be explored thoroughly in the following section.
3. Context of Our Work
3.1. The General Process in Data Science: Architectures and Tools
The data science workflow comprises several key stages: data collection, data preparation (cleaning, integration, imputation, and normalization), exploratory visualization, model training, and evaluation [22]. Each of these stages requires specific tools, and choosing the right ones is crucial for the performance and quality of the results obtained [23].
Among the fundamental libraries, NumPy [24] and SciPy [25] are highly regarded for their ability to perform fast numerical calculations on multidimensional arrays, as well as for their wealth of scientific features (statistics, optimizations, numerical integrations) [23,24,25]. For advanced data preparation, Pandas is a benchmark due to its efficiency in manipulating tabular data, despite high memory consumption and low parallelization [26]. PySpark [27] and Polars [28] stand out for their increased performance and optimized management of large volumes of data.
For exploratory visualization, Matplotlib [23,29] remains the benchmark library thanks to its great graphical flexibility. Seaborn [23,30] simplifies this approach with a more intuitive interface, while Plotly [23,31] is preferred for its interactive graphs that allow the in-depth dynamic exploration of data.
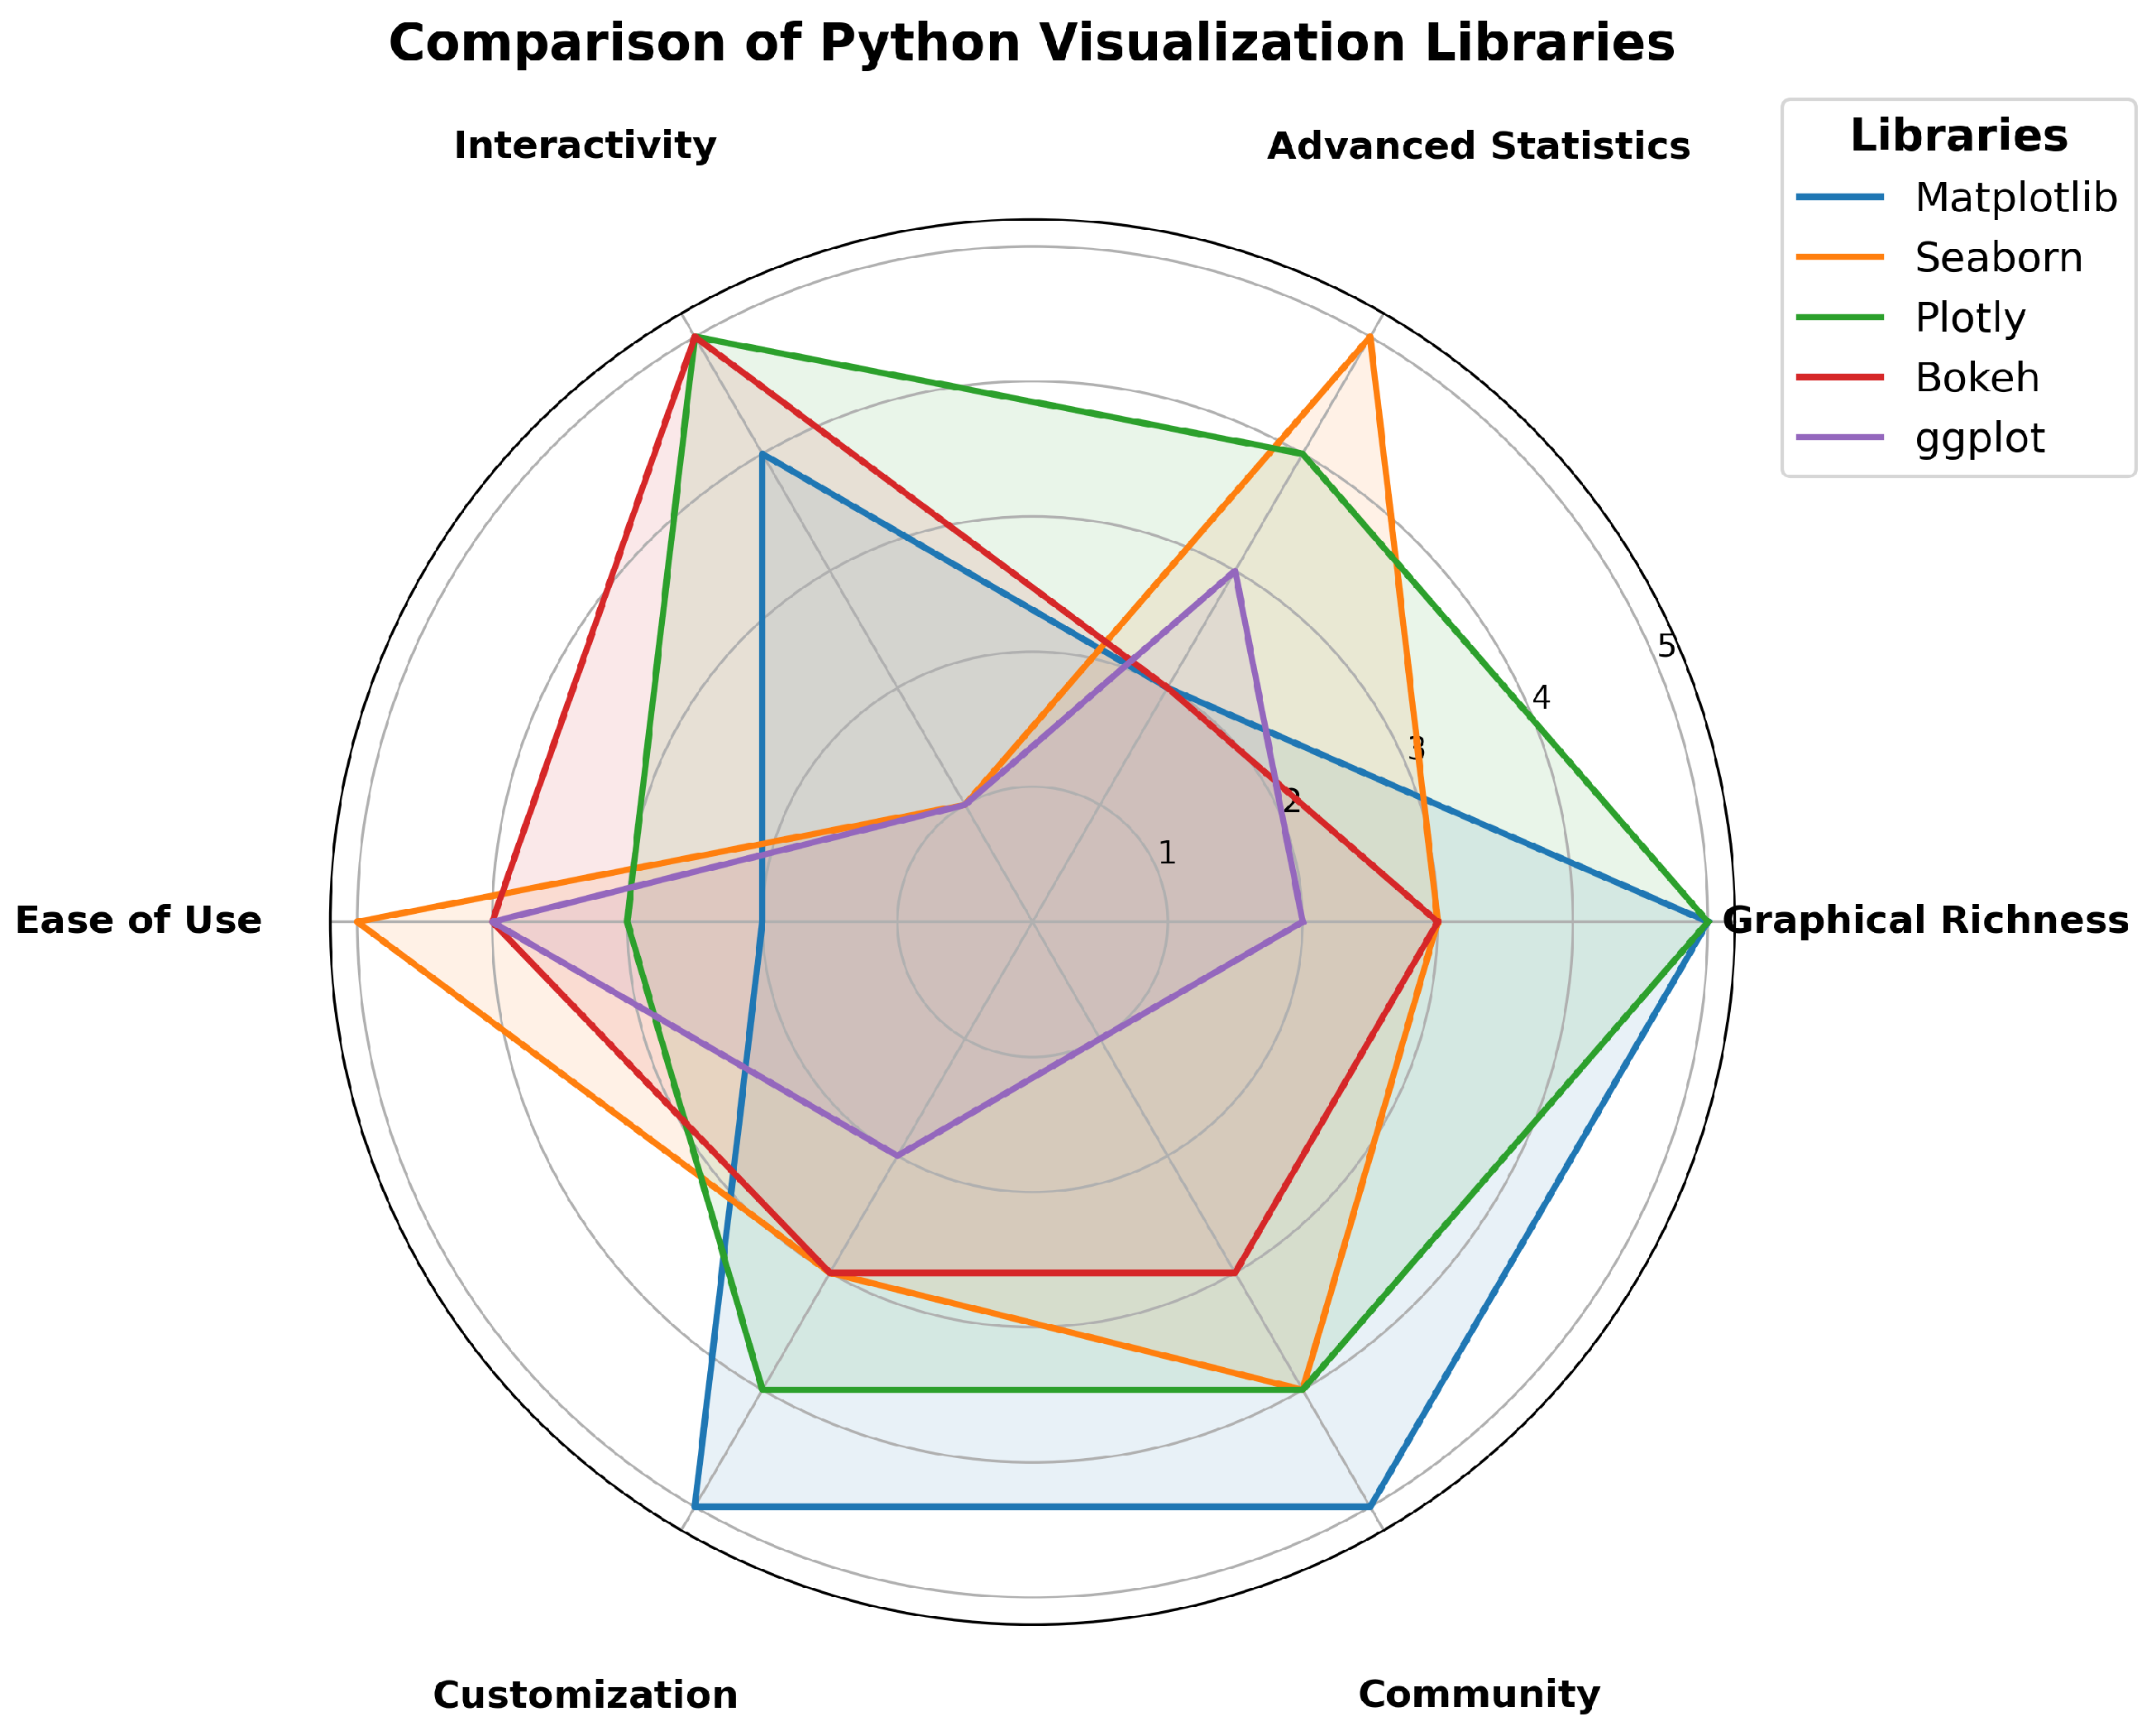
Figure 1 below visually summarizes the main features and graphical capabilities of these libraries in a radar chart to effectively guide their selection according to the specific needs of a data analysis project.
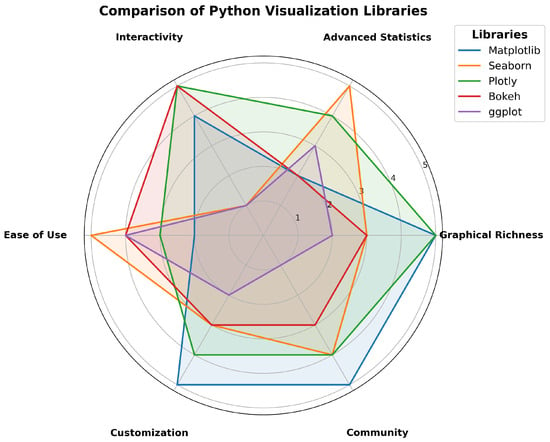
Figure 1.
Radar chart comparing key features of Python 3.11.10 visualization libraries: Matplotlib 3.10.5, Seaborn v0.13.2, and Plotly v3.0.3.
3.2. Comparative Overview of Pandas, Polars, and PySpark
This section briefly presents three libraries frequently used in the preprocessing and analysis of big data: Pandas [12], Polars [13], and PySpark [14]. Each of these libraries adopts a specific approach, with significant implications for performance and computing resource consumption.
Pandas is a versatile Python library that is widely used but suffers from poor scalability for large datasets due to its inefficient memory management and limited parallelization [12].
Polars, developed in Rust, offers a recent and high-performance alternative thanks to lazy evaluation and native parallelization optimized for modern multicore architectures. These features significantly reduce computation times and resource consumption [13].
PySpark, based on Apache Spark 4.0.0, is specifically designed for distributed environments and large volumes of data, but its operational complexity and network infrastructure requirements increase its overall energy consumption [14].
A recent benchmark [32] (Table 1) was obtained on a macOS Sonoma with an Apple M1 Pro chip (32 GB RAM), using financial data from Kaggle [33]; it highlights the performance of the three libraries, with Polars evaluated in both its Eager and Lazy execution modes.

Table 1.
Detailed benchmark of execution time (seconds) on a macOS Sonoma (Apple M1 Pro, 32 GB RAM) using a Kaggle financial dataset.
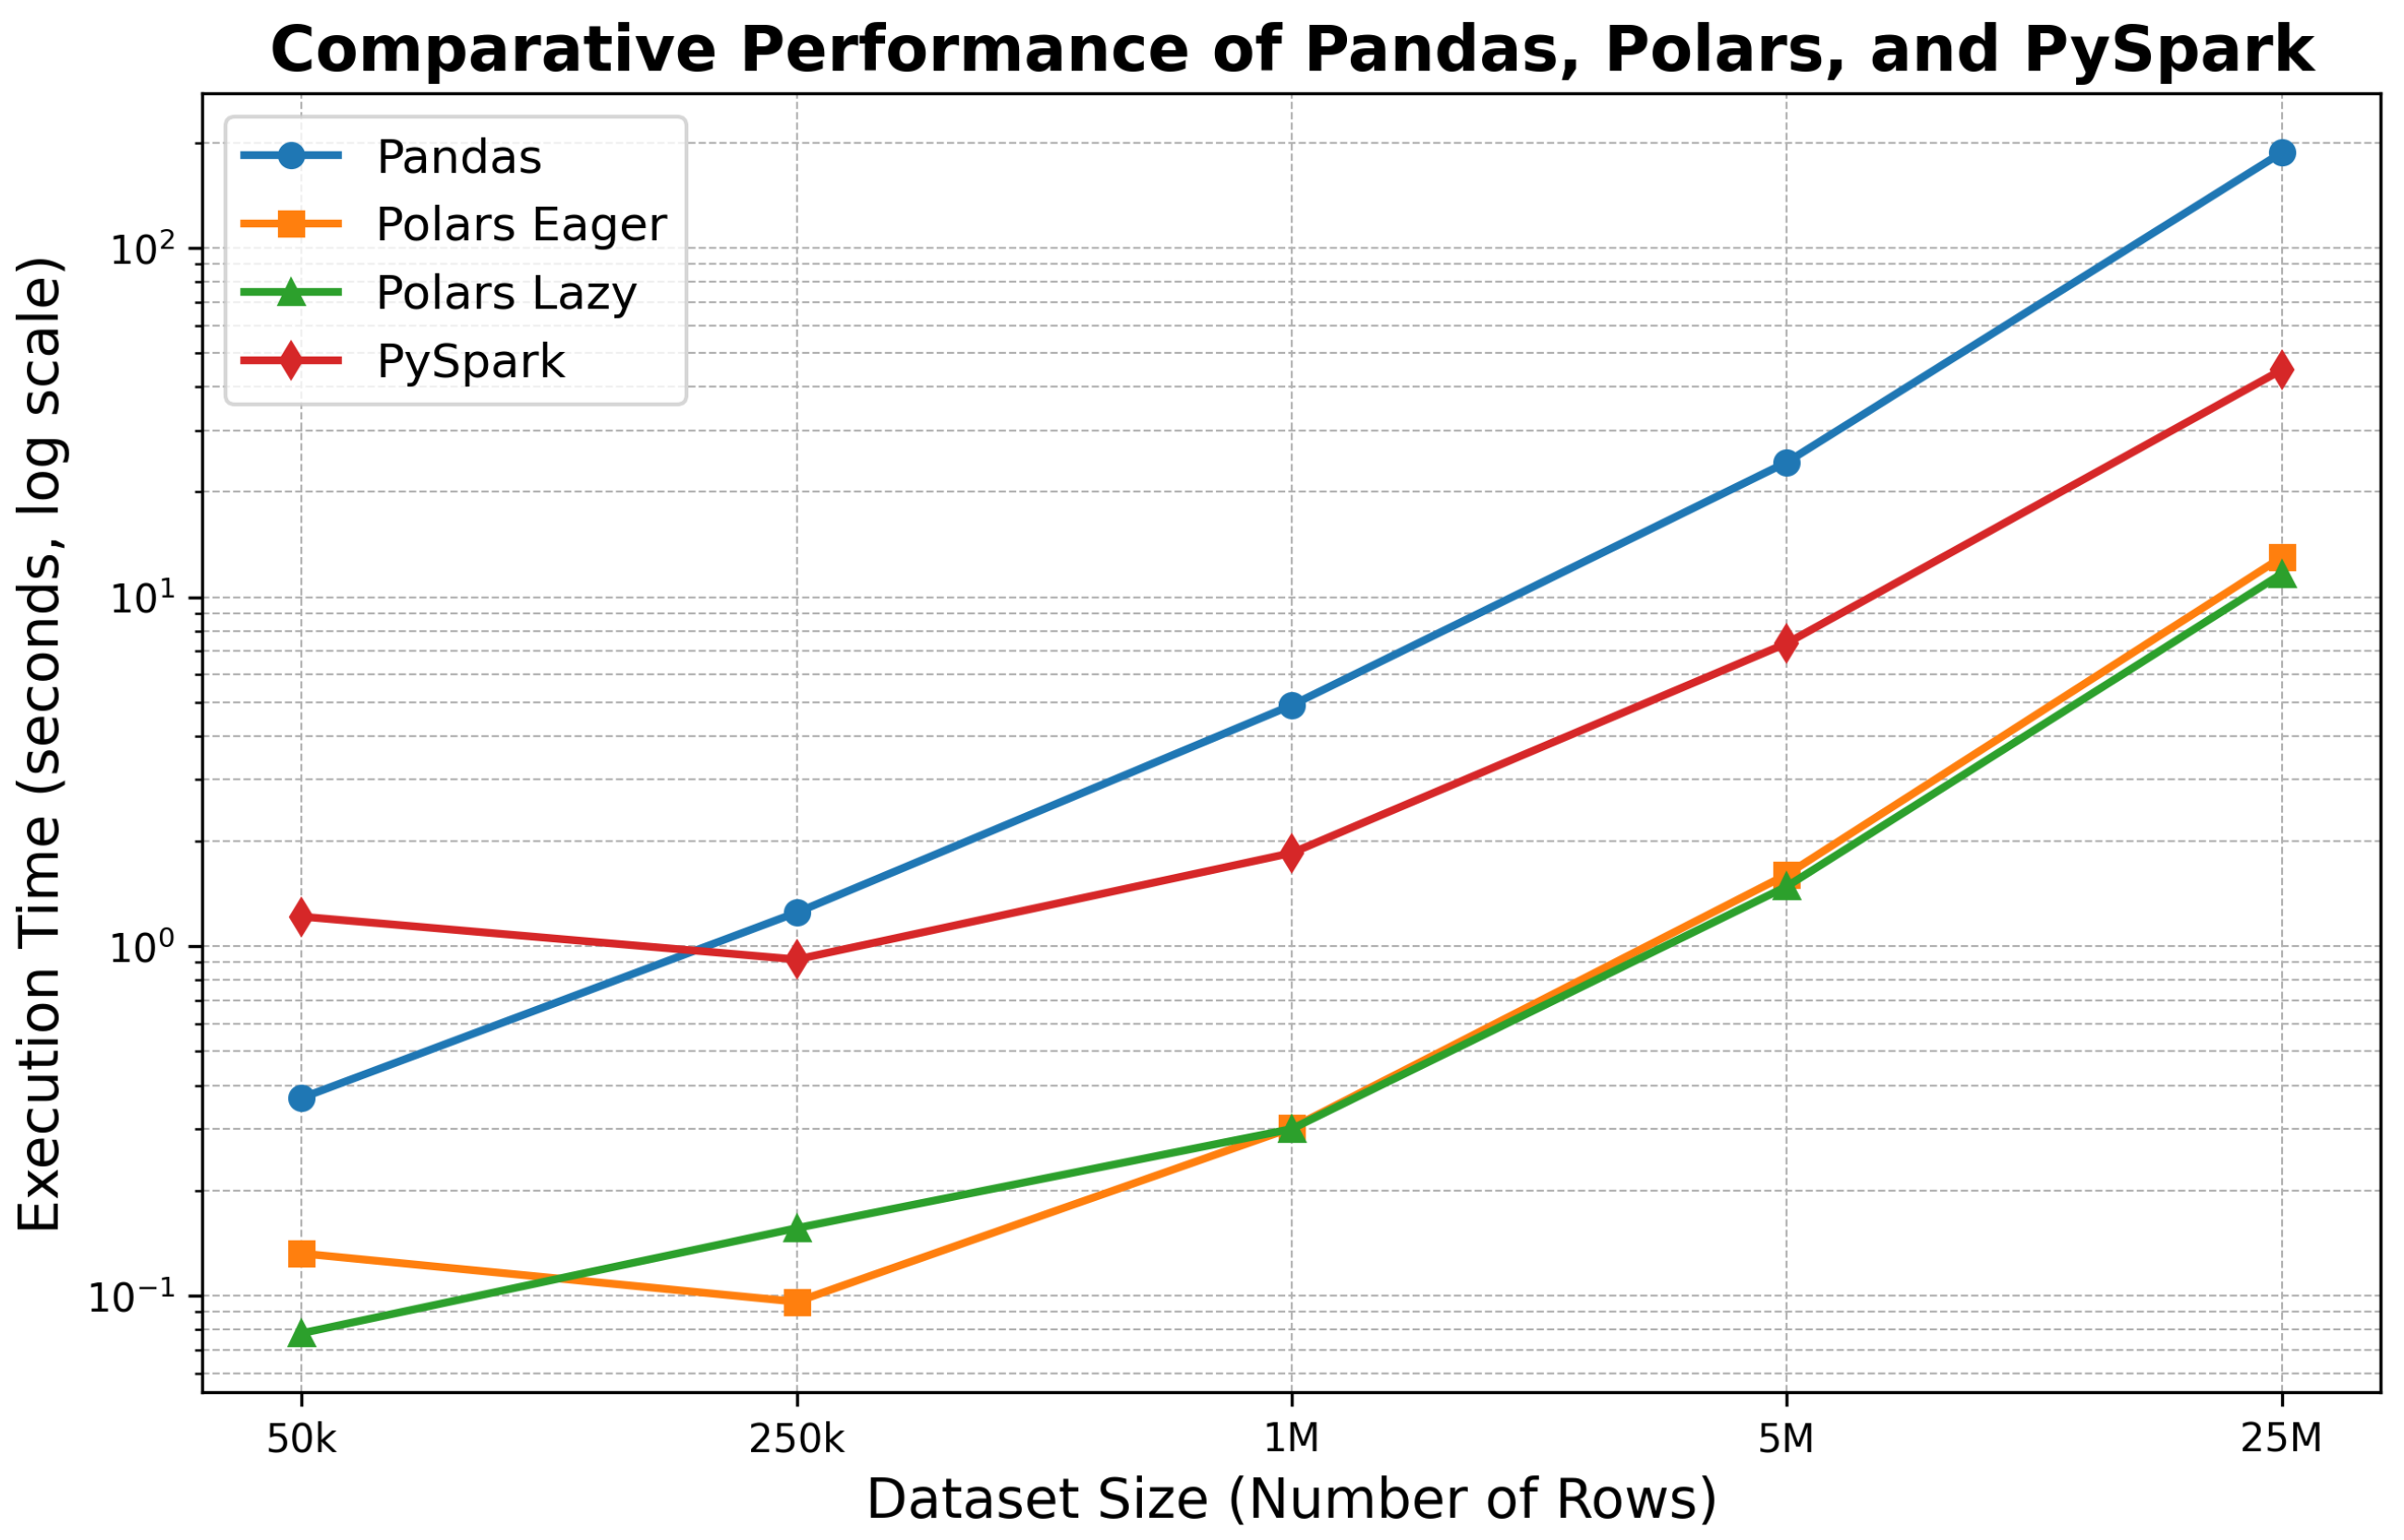
The results clearly show the superior performance of Polars, which shows an improvement of up to 97% compared to Pandas and 75% compared to PySpark (Figure 2). This efficiency is mainly attributed to its deferred execution and advanced parallelization capabilities.
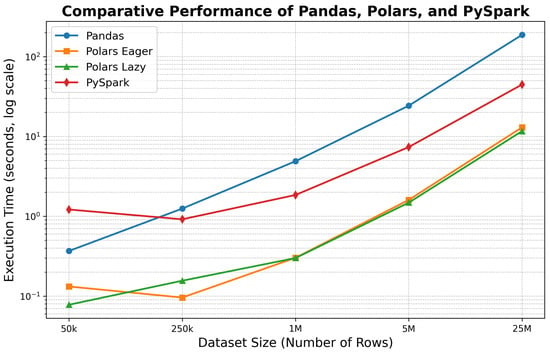
Figure 2.
Execution time comparison for Pandas, Polars, and PySpark by dataset size.
A simplified summary of the main technical characteristics of the three libraries is presented in Table 2 below.

Table 2.
Qualitative comparison of the three libraries.
This summary allows us to make an informed choice based on the specific context of the project, taking into account volume constraints, computational performance, and environmental requirements. To further explore these theoretical conclusions, we will use our study of the GreenNav [11,34,35] application to examine how these libraries perform in practice during the various stages of the data science process (preprocessing, cleaning, imputation, normalization, visualization, model training, and testing). In particular, we will examine the actual consumption of hardware and energy resources during each stage by using a hybrid CNN-LSTM architecture [11,21]. GreenNav [11,34,35] aims to predict CO2 emissions for each road segment in the city of Paris and optimize routes to minimize their carbon impacts in a particularly complex and data-dense urban context.
3.3. Positioning the Study: CPU vs. GPU in Data Preprocessing Pipelines
Hardware acceleration, particularly through graphics processing units (GPUs), has redefined performance benchmarks in computationally intensive workloads. Thanks to their massively parallel architectures, modern GPUs (for example, NVIDIA RTX or Tesla) can process thousands of threads simultaneously, making them well suited to the vectorizable operations that dominate neural network training and large-scale data preprocessing tasks [36,37].
This advantage has been popularized by libraries such as cuDF and the broader RAPIDS ecosystem, which report substantial speed-ups compared with traditional CPU-centric solutions for tabular data processing [37,38].
However, recent studies show that adopting GPUs for data preprocessing does not automatically guarantee better end-to-end performance or energy efficiency [39,40]. In practice, GPUs are generally reserved for compute-intensive phases like deep learning training or real-time inference, whereas routine preprocessing tasks such as data cleaning, imputation, feature engineering, and API enrichment are executed on cost-effective, readily available CPU resources [38,39]. This gap between theoretical acceleration and operational reality motivates a closer look at CPU-based solutions.
In many production settings, especially within small and medium enterprises and public institutions, GPU infrastructure is still uncommon. Preprocessing pipelines therefore run almost exclusively on CPU-only servers, reflecting pragmatic constraints such as limited hardware budgets, ease of deployment, and the need for compatibility with widely adopted libraries that lack native GPU support (for example, Pandas or Dask). Our benchmark intentionally targets datasets up to 8 GB, a size that remains challenging for single-threaded CPU workflows yet representative of daily analytical workloads in these environments. By focusing on CPUs, we mirror real-world conditions and expose meaningful differences in efficiency, scalability, and memory handling between frameworks.
Energy efficiency is an additional consideration. GPUs draw considerably more idle power than CPUs; when pipeline stages are sequential or I/O-bound, the device may remain underutilized while still consuming significant energy. Aligning with green AI principles that seek to minimize the environmental footprint of data science, a thorough evaluation of CPU-optimized pipelines remains highly relevant [39,40].
Against this backdrop, we benchmark three mainstream CPU libraries, Pandas, Polars and PySpark, in terms of execution time, resource usage, and energy footprint. The resulting reference framework will guide practitioners who operate in CPU-only environments and sets a baseline for future extensions that will compare these optimized CPU pipelines with GPU-accelerated alternatives in the GreenNav project.
The next section introduces the GreenNav production pipeline, followed by the detailed presentation of our experimental results.
3.4. Description of Our GreenNav Production Pipeline
In the current context of digital transformation and the necessary ecological transition, optimizing the IT resources used by artificial intelligence systems is an essential aspect of green computing [41]. The main objective of this research is to identify the most effective methodological approaches and libraries, enabling GreenNav [11] to accurately predict CO2 emissions from Parisian road traffic while minimizing the IT resources consumed. Our methodology is based on a comprehensive pipeline, organized into five key stages:
- Data acquisition [34];
- Data preprocessing [11];
- CO2 emissions modeling [34];
- Training, validation, and deployment of the predictive model [34];
- Interactive visualization application [11,34,35].
Before proceeding with the comparative performance evaluation of the different processing libraries used in this process, it is important to understand the specificities of each step in the proposed pipeline. We therefore begin by presenting the different key phases of our production chain, detailing the processes and treatments involved. This will provide a comprehensive and accurate overview of the operations carried out, enabling a better understanding of the results of the comparisons made.
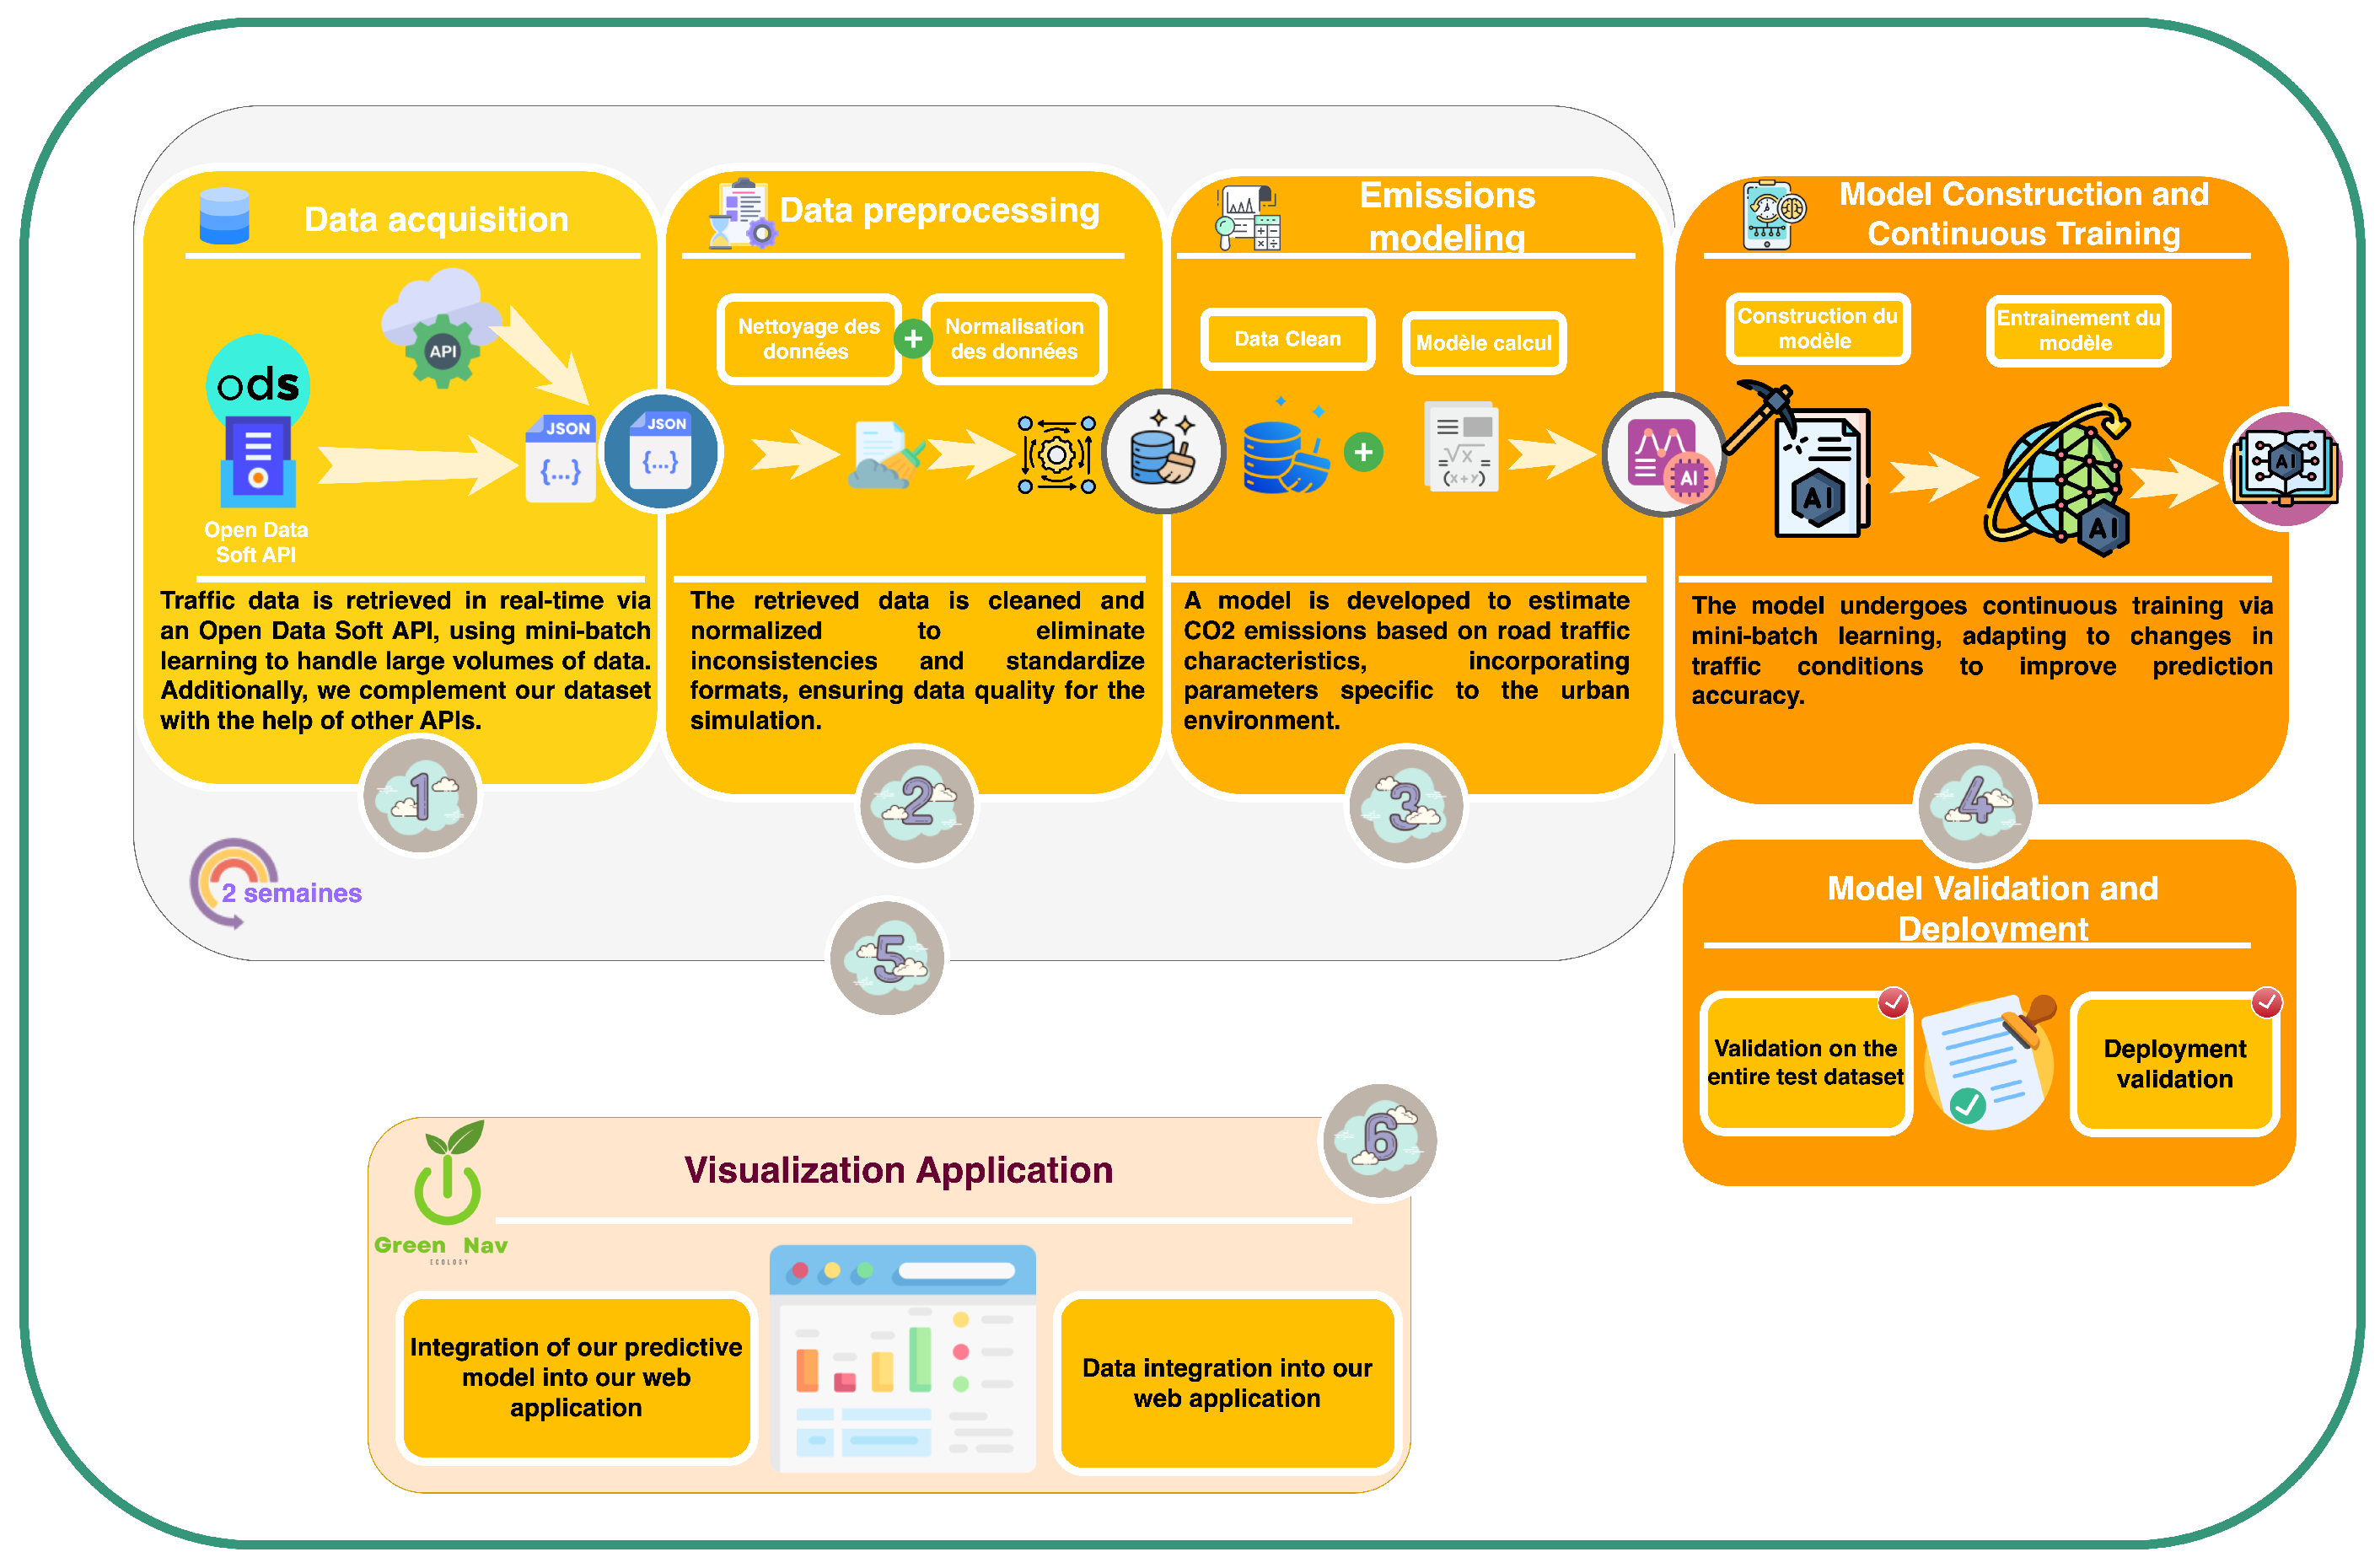
To this end, Figure 3 above summarizes the various stages of our methodological pipeline used to predict CO2 emissions on each road segment in the city of Paris.
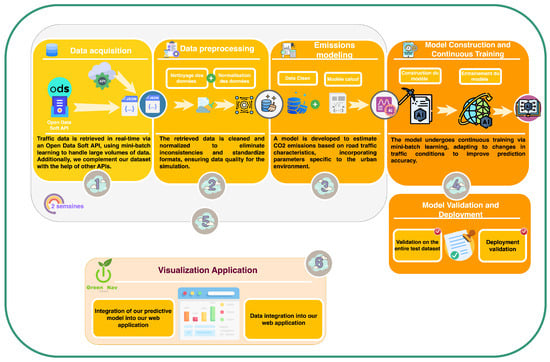
Figure 3.
Pipeline illustrating the five-step research methodology for the prediction of CO2 emissions on individual road segments in Paris.
3.4.1. Data Acquisition
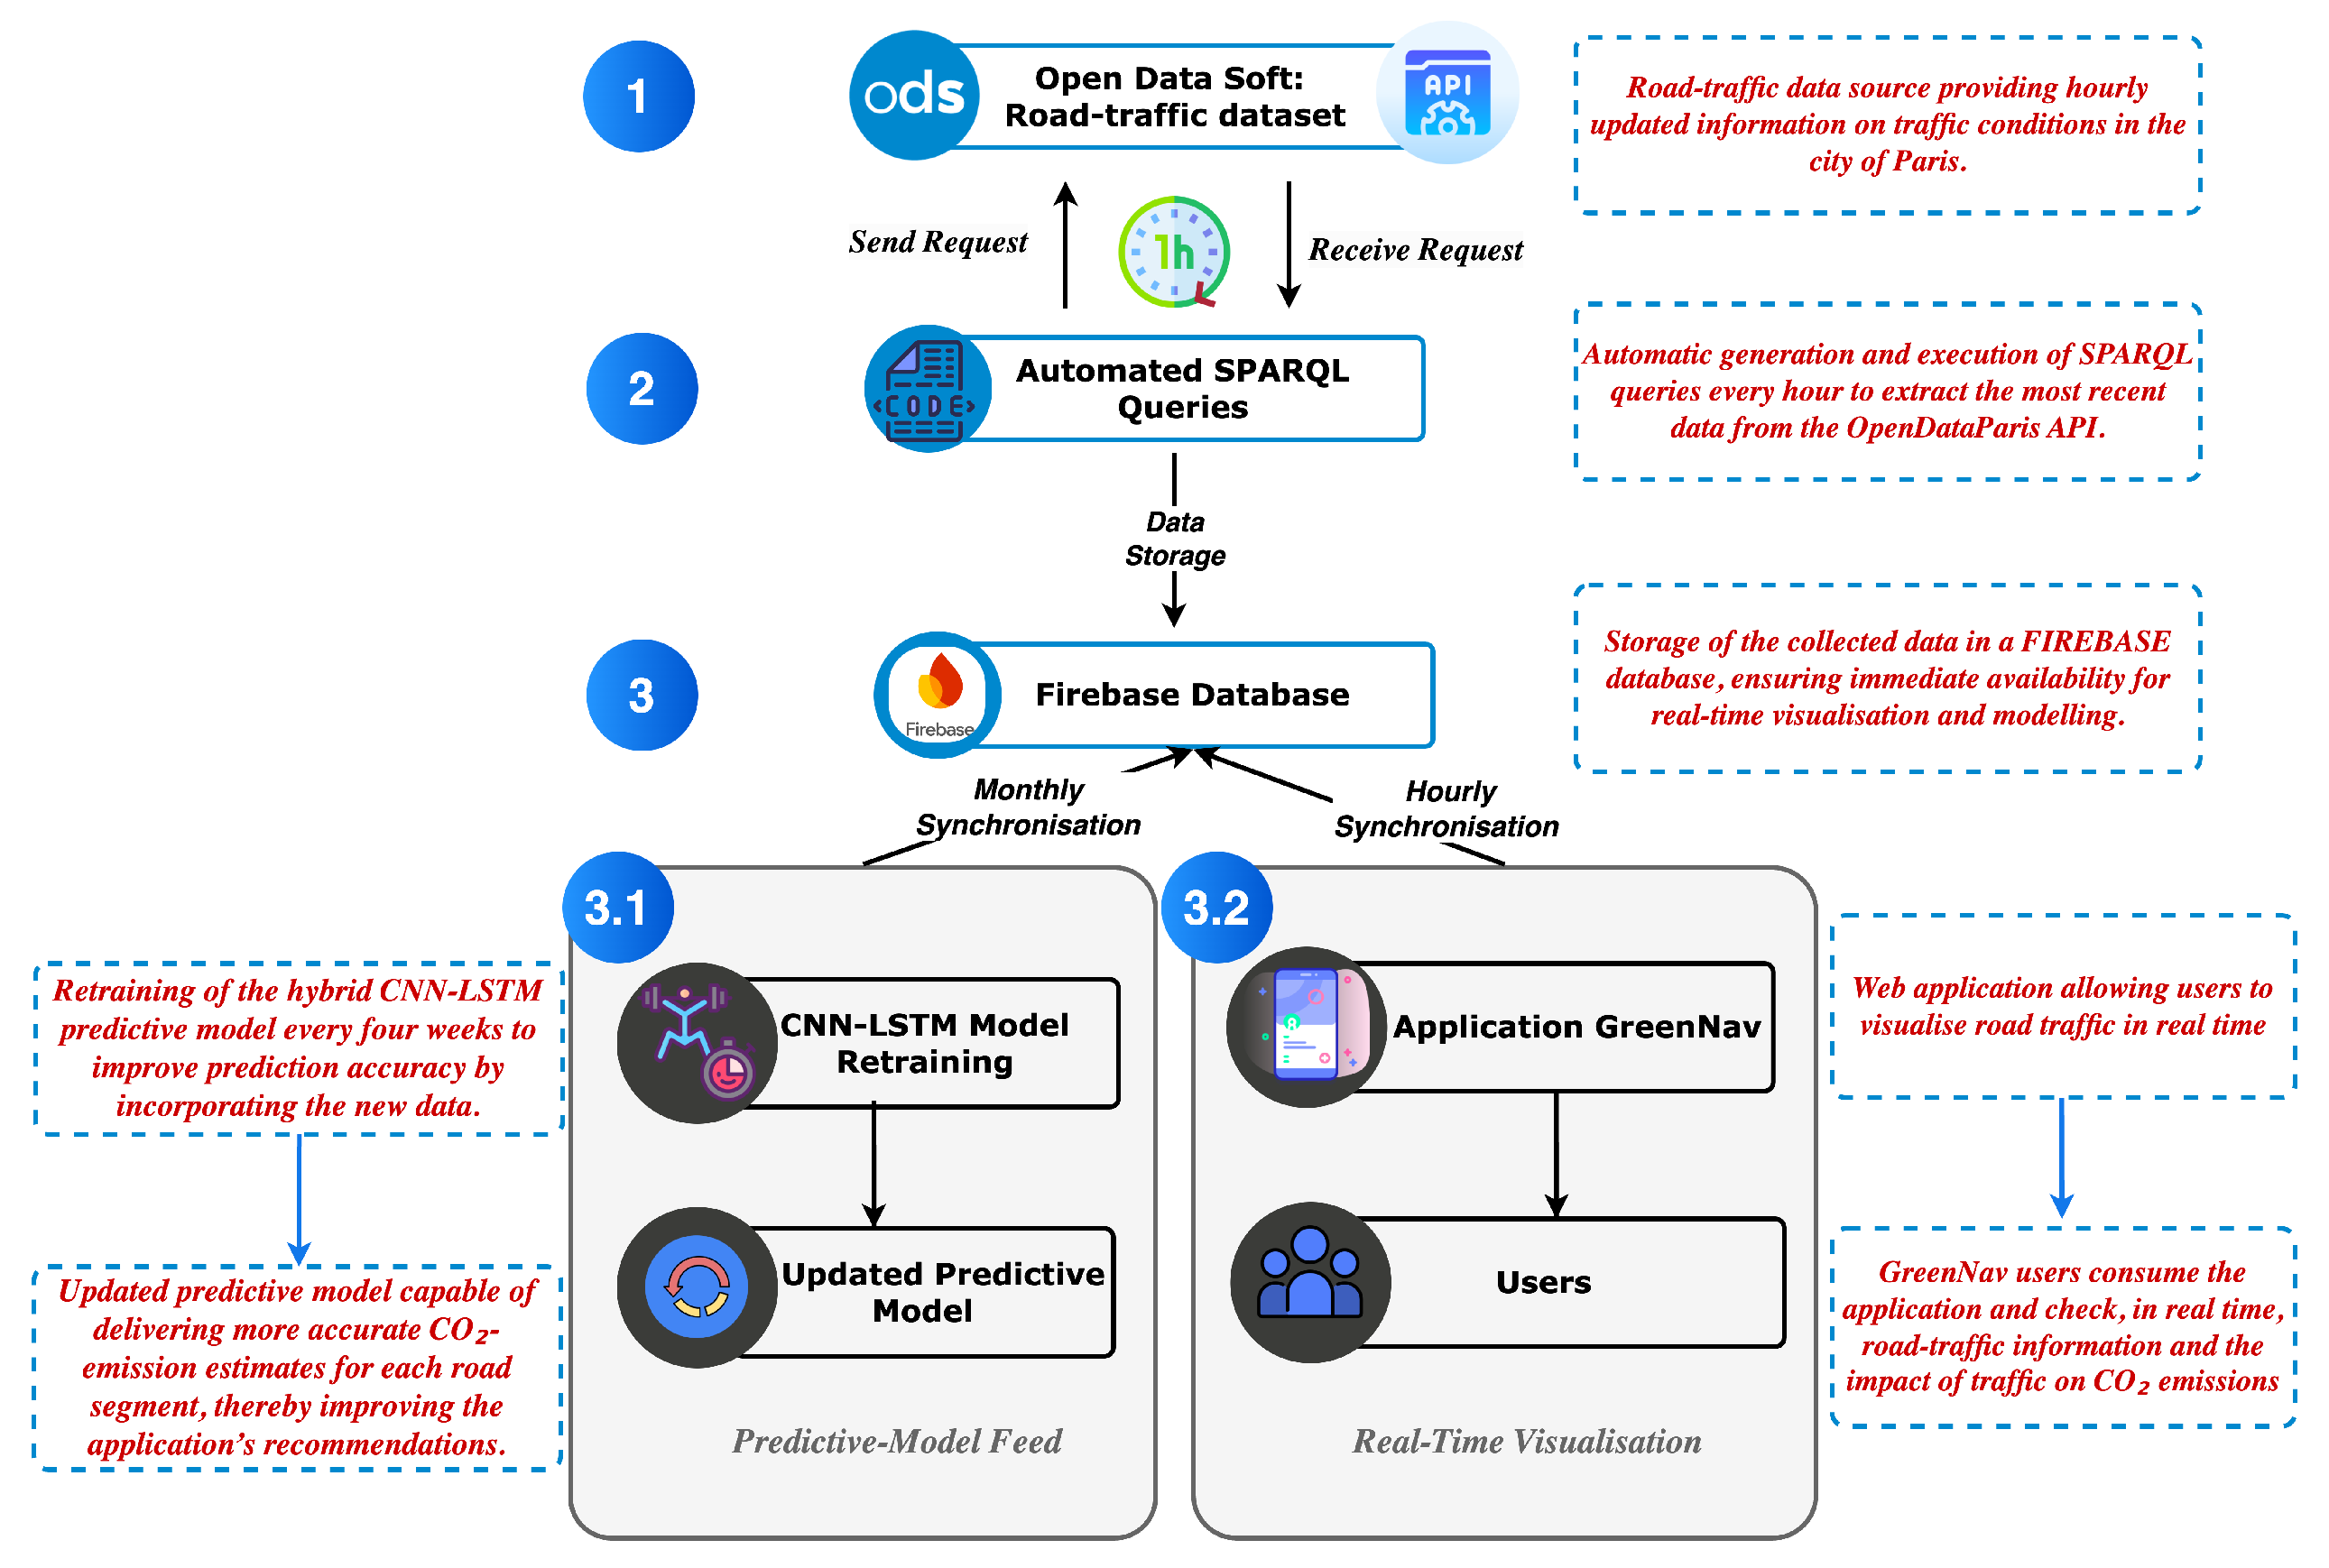
The first essential step in our methodology consists of acquiring and dynamically integrating data from multiple sources in order to build a representative and comprehensive dataset for our study. The main source used is the Open Data Paris platform [42], which offers detailed information about road traffic, including hourly traffic flows, lane occupancy rates, and general traffic conditions. To automate the retrieval of these data, we have set up a system using SPARQL queries [43]. These queries are executed periodically and dynamically to query the Open Data Paris knowledge base in real time [42]. As shown in Figure 4 below, this automated system not only enables the efficient and continuous integration of the initial data but also ensures that they are regularly updated, thus guaranteeing their relevance for our predictive analysis.
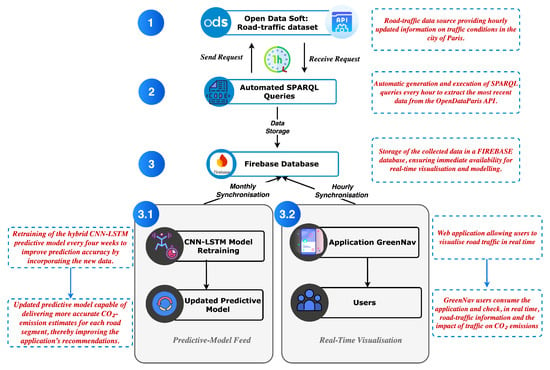
Figure 4.
Architecture of the automated data retrieval system for GreenNav.
Each time the initial dataset is refreshed, asynchronous calls are triggered to three external APIs to enrich the information:
- Google Maps [44], providing data on average vehicle speeds and distances traveled on each road segment;
- AirParif [45], providing real-time air quality information;
- Getambee [46], providing detailed weather data such as temperature, rainfall, and wind speed.
3.4.2. CO2 Emissions Modeling
This phase aims to build a robust model that can accurately estimate CO2 emissions by integrating several determining factors, including spatiotemporal variables, specific vehicle and engine characteristics, one-off events (e.g., accidents, roadworks), and driving behavior (e.g., aggressive driving, use of air conditioning) [34]. To reflect the complexity and real variability in emissions on each road segment, we have developed a probabilistic simulation algorithm based on the Monte Carlo method [34]. In concrete terms, this algorithm performs random draws weighted by probabilities defined by real-time factors such as the weather, time of day, and day of the week, as well as by global statistical data (such as the distribution of vehicle classes in Paris).
For example, on 25 September 2024, at 23:00, more than 100 vehicles were recorded on Rue de Réaumur in Paris [42]. To estimate the CO2 emissions for this scenario, we first draw random samples weighted by the probabilities of the vehicle classes. We then randomly select 100 vehicles from these samples, assigning each a specific emission factor according to its environmental class (e.g., Class C vehicles have emission factors in the range 121–140 g/km [47]), thereby incorporating realistic variability.
In general, the total emissions on a road segment at a given time are calculated as
where
- D is the distance of the segment (km);
- is the emission factor (g/km) of vehicle i;
- N is the number of vehicles on the segment at a given time.
Each individual emission factor is defined as
where
- : basic emission factor of vehicle i by environmental class;
- : emission increase due to vehicle maintenance;
- : emission increase due to aggressive driving;
- : emission increase due to air conditioning/heating use;
- : emission increase due to cold starts.
This process enables the accurate and dynamic estimation of the CO2 emissions on each road segment, accounting for real traffic fluctuations and behavioral variations. It is crucial to clearly understand this modeling step, as it constitutes the most computationally intensive part of our pipeline. Consequently, thoroughly analyzing and comprehending the details of this process is essential to accurately interpret the resource and energy consumption measurements during the comparative evaluation of Pandas, PySpark, and Polars in the subsequent sections.
3.4.3. Data Preprocessing
Data quality is essential to ensure the accuracy of the predictive model. Therefore, we placed a particular emphasis on the data preprocessing stage, involving thorough cleaning and rigorous standardization to ensure data integrity for subsequent analysis. A preliminary statistical and visual exploration was carried out to quickly identify the main trends, anomalies, and inconsistencies in the data [11,34,35]. This exploration directly guides an automated preprocessing workflow structured around the following key functions:
- CorrigeFormat(): Automatically checks and corrects data formats (dates, numbers, etc.).
- CorrigeData(): Harmonizes spatial data (latitude, longitude, street names) using road segment identifiers to correct non-sensitive inconsistencies.
- CorrigeSensibleData(): Processes sensitive variables such as hourly flows and occupancy rates, which are particularly affected by missing values, using advanced methods:
- Linear temporal interpolation for sparse time series data;
- Multivariate imputation via the MICE algorithm to exploit complex variable correlations;
- Imputation based on data from neighboring road segments.
Although crucial, these automated functions and algorithms consume significant computing and energy resources. Hence, a central objective of our study is to comparatively evaluate different computational architectures and libraries to identify those that enable optimal data processing with minimal energy and computational costs, in line with a green computing approach.
3.4.4. Training, Validation, and Deployment of the Hybrid CNN-LSTM Model
The core of our methodology is based on a hybrid model combining convolutional neural networks (CNNs) [48,49] to capture the spatial characteristics of the data and LSTM networks [50,51] to capture complex temporal dynamics. Before the training phase, the data undergo an extensive preprocessing phase, including rigorous cleaning, advanced imputation, and normalization techniques [11]. These preliminary operations, although critical to ensuring the predictive performance of the model, require significant computing resources in terms of execution time, memory consumption (RAM), and CPU usage. Optimizing this step is therefore a key objective in order to balance high predictive accuracy with computational efficiency.
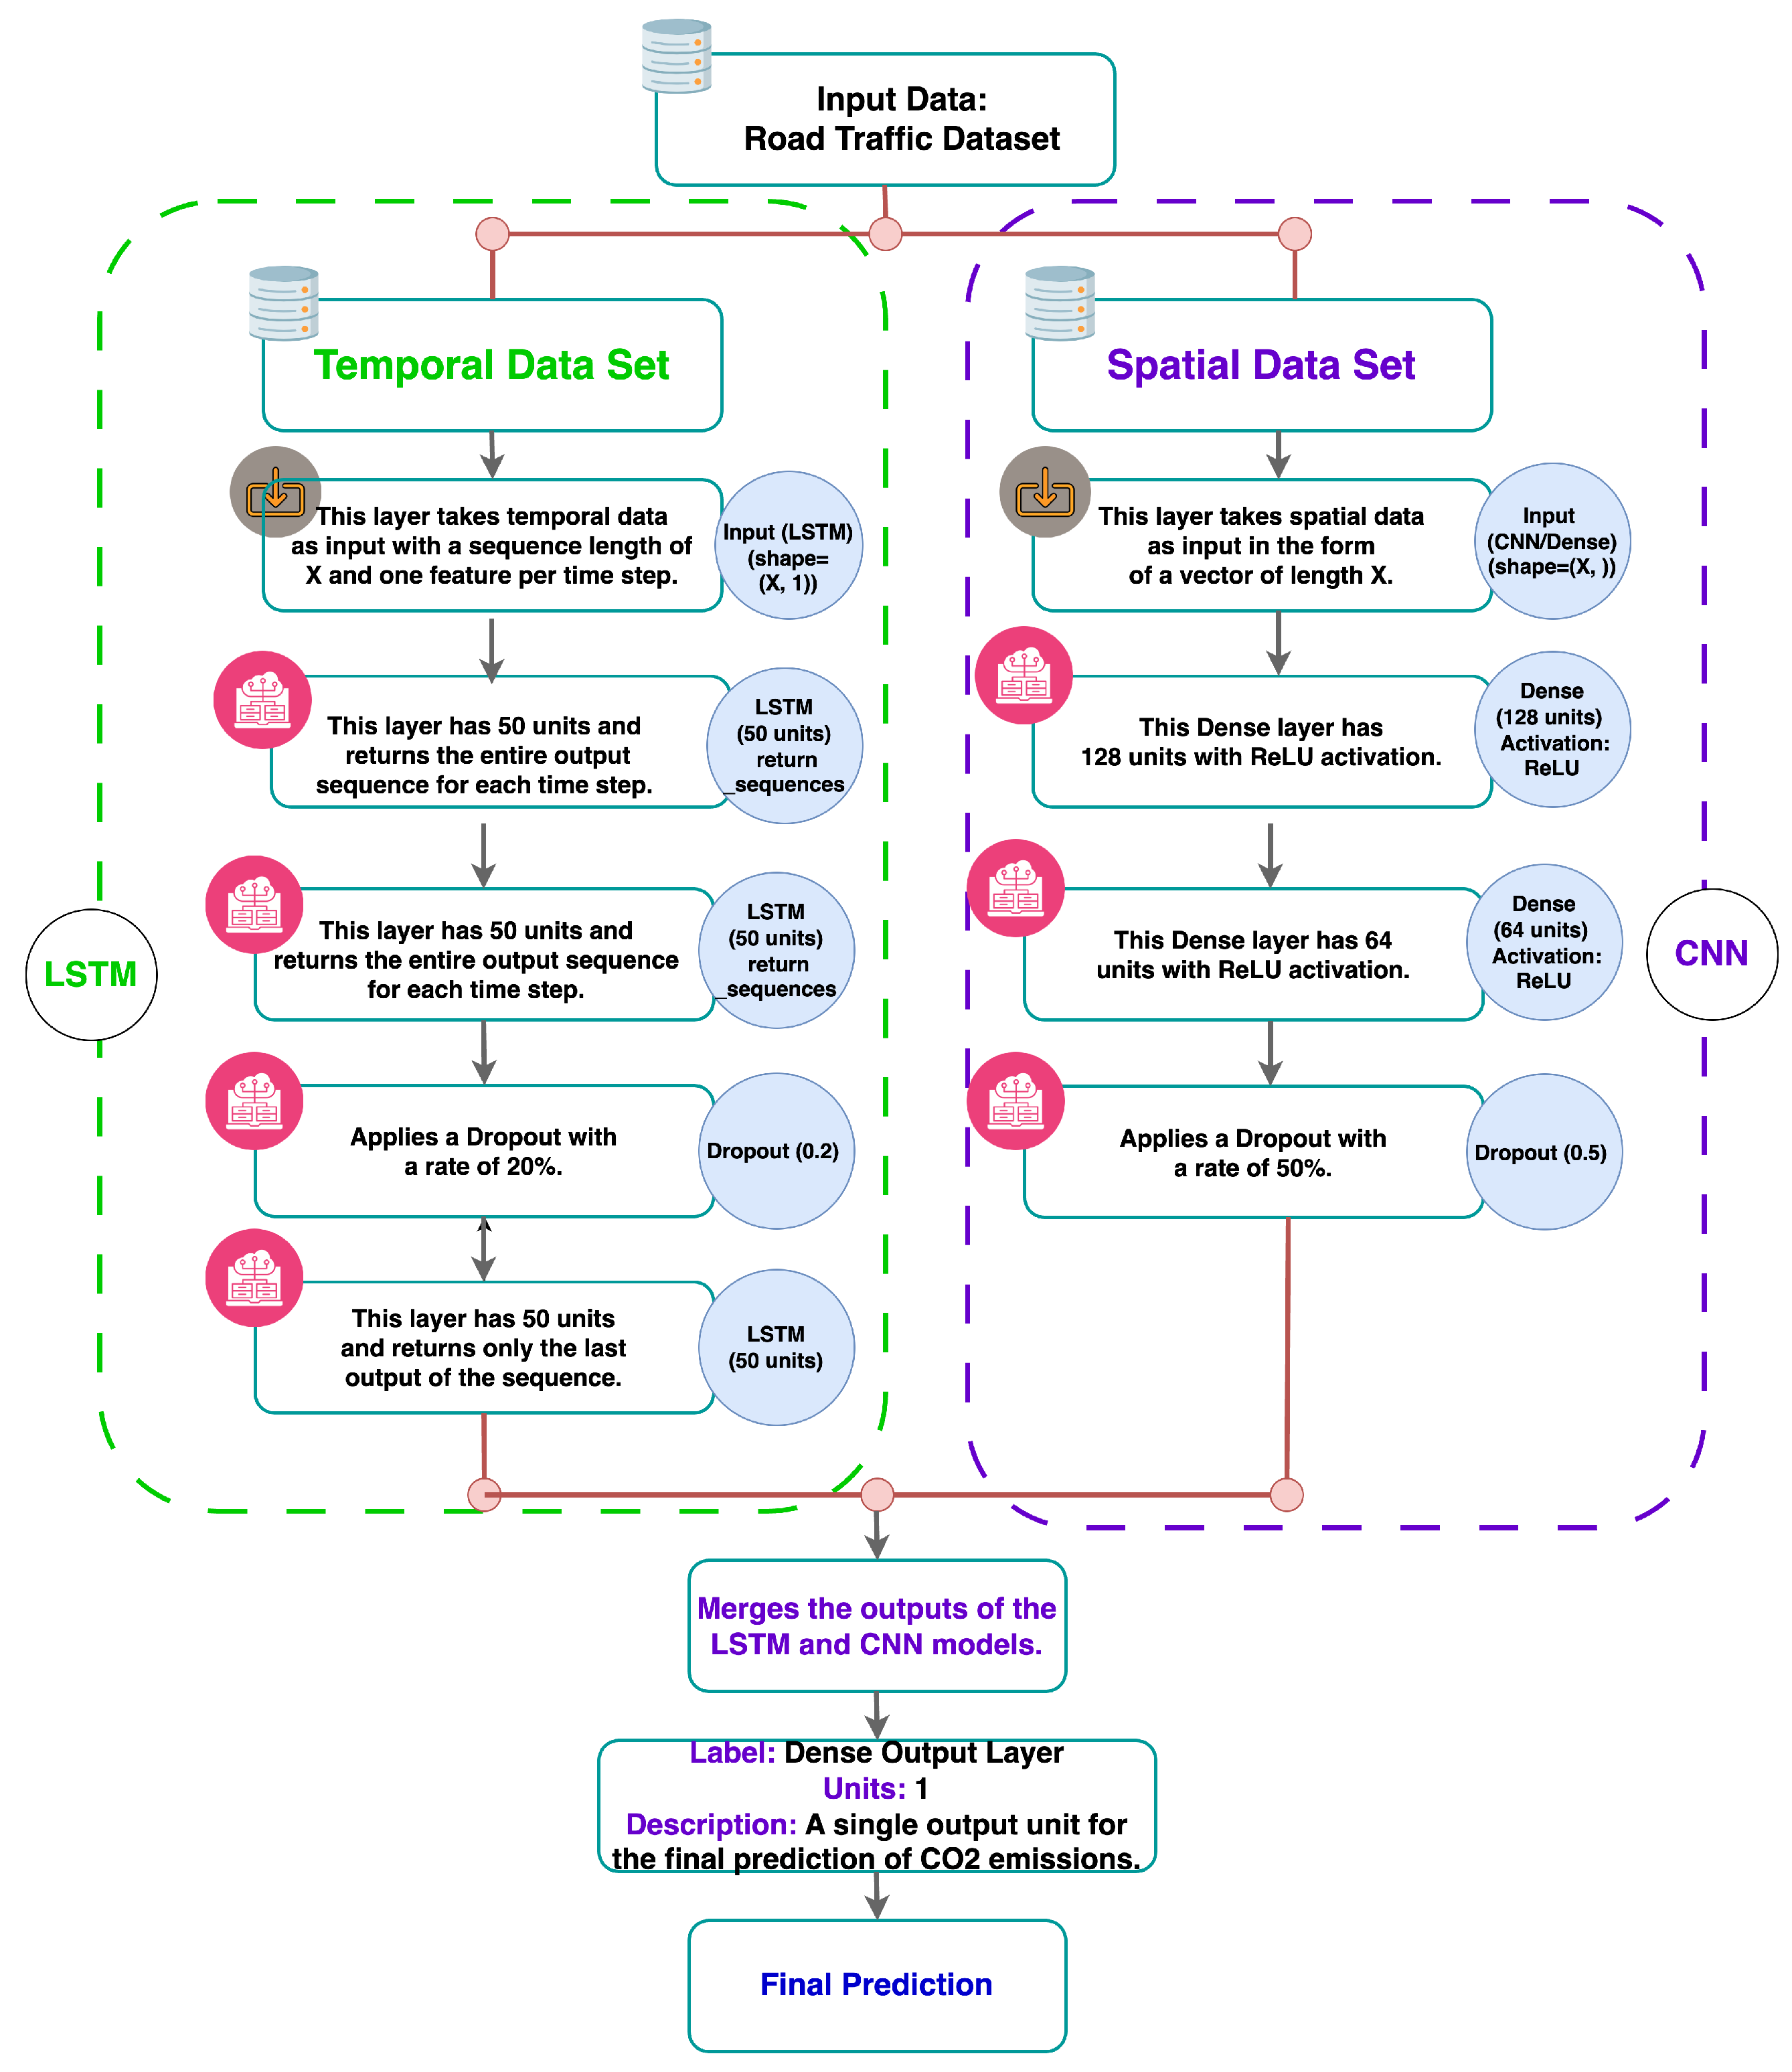
To ensure the best predictive performance and robustness, we carried out the careful optimization of the hyperparameters (number of layers, units per layer, dropout rate, optimal number of epochs), as shown in Figure 5. This optimization, performed through several experiments, placed a significant additional load on the computing resources. However, the results justify these methodological choices: the hybrid CNN-LSTM model achieved a coefficient of determination (R2) of 0.91 and a root mean square error (RMSE) of 0.086 on an independent test set [11].
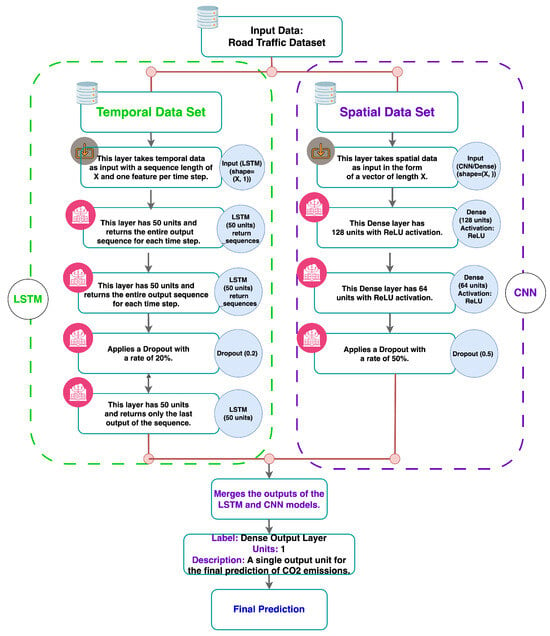
Figure 5.
Architecture of the CNN-LSTM hybrid prediction model.
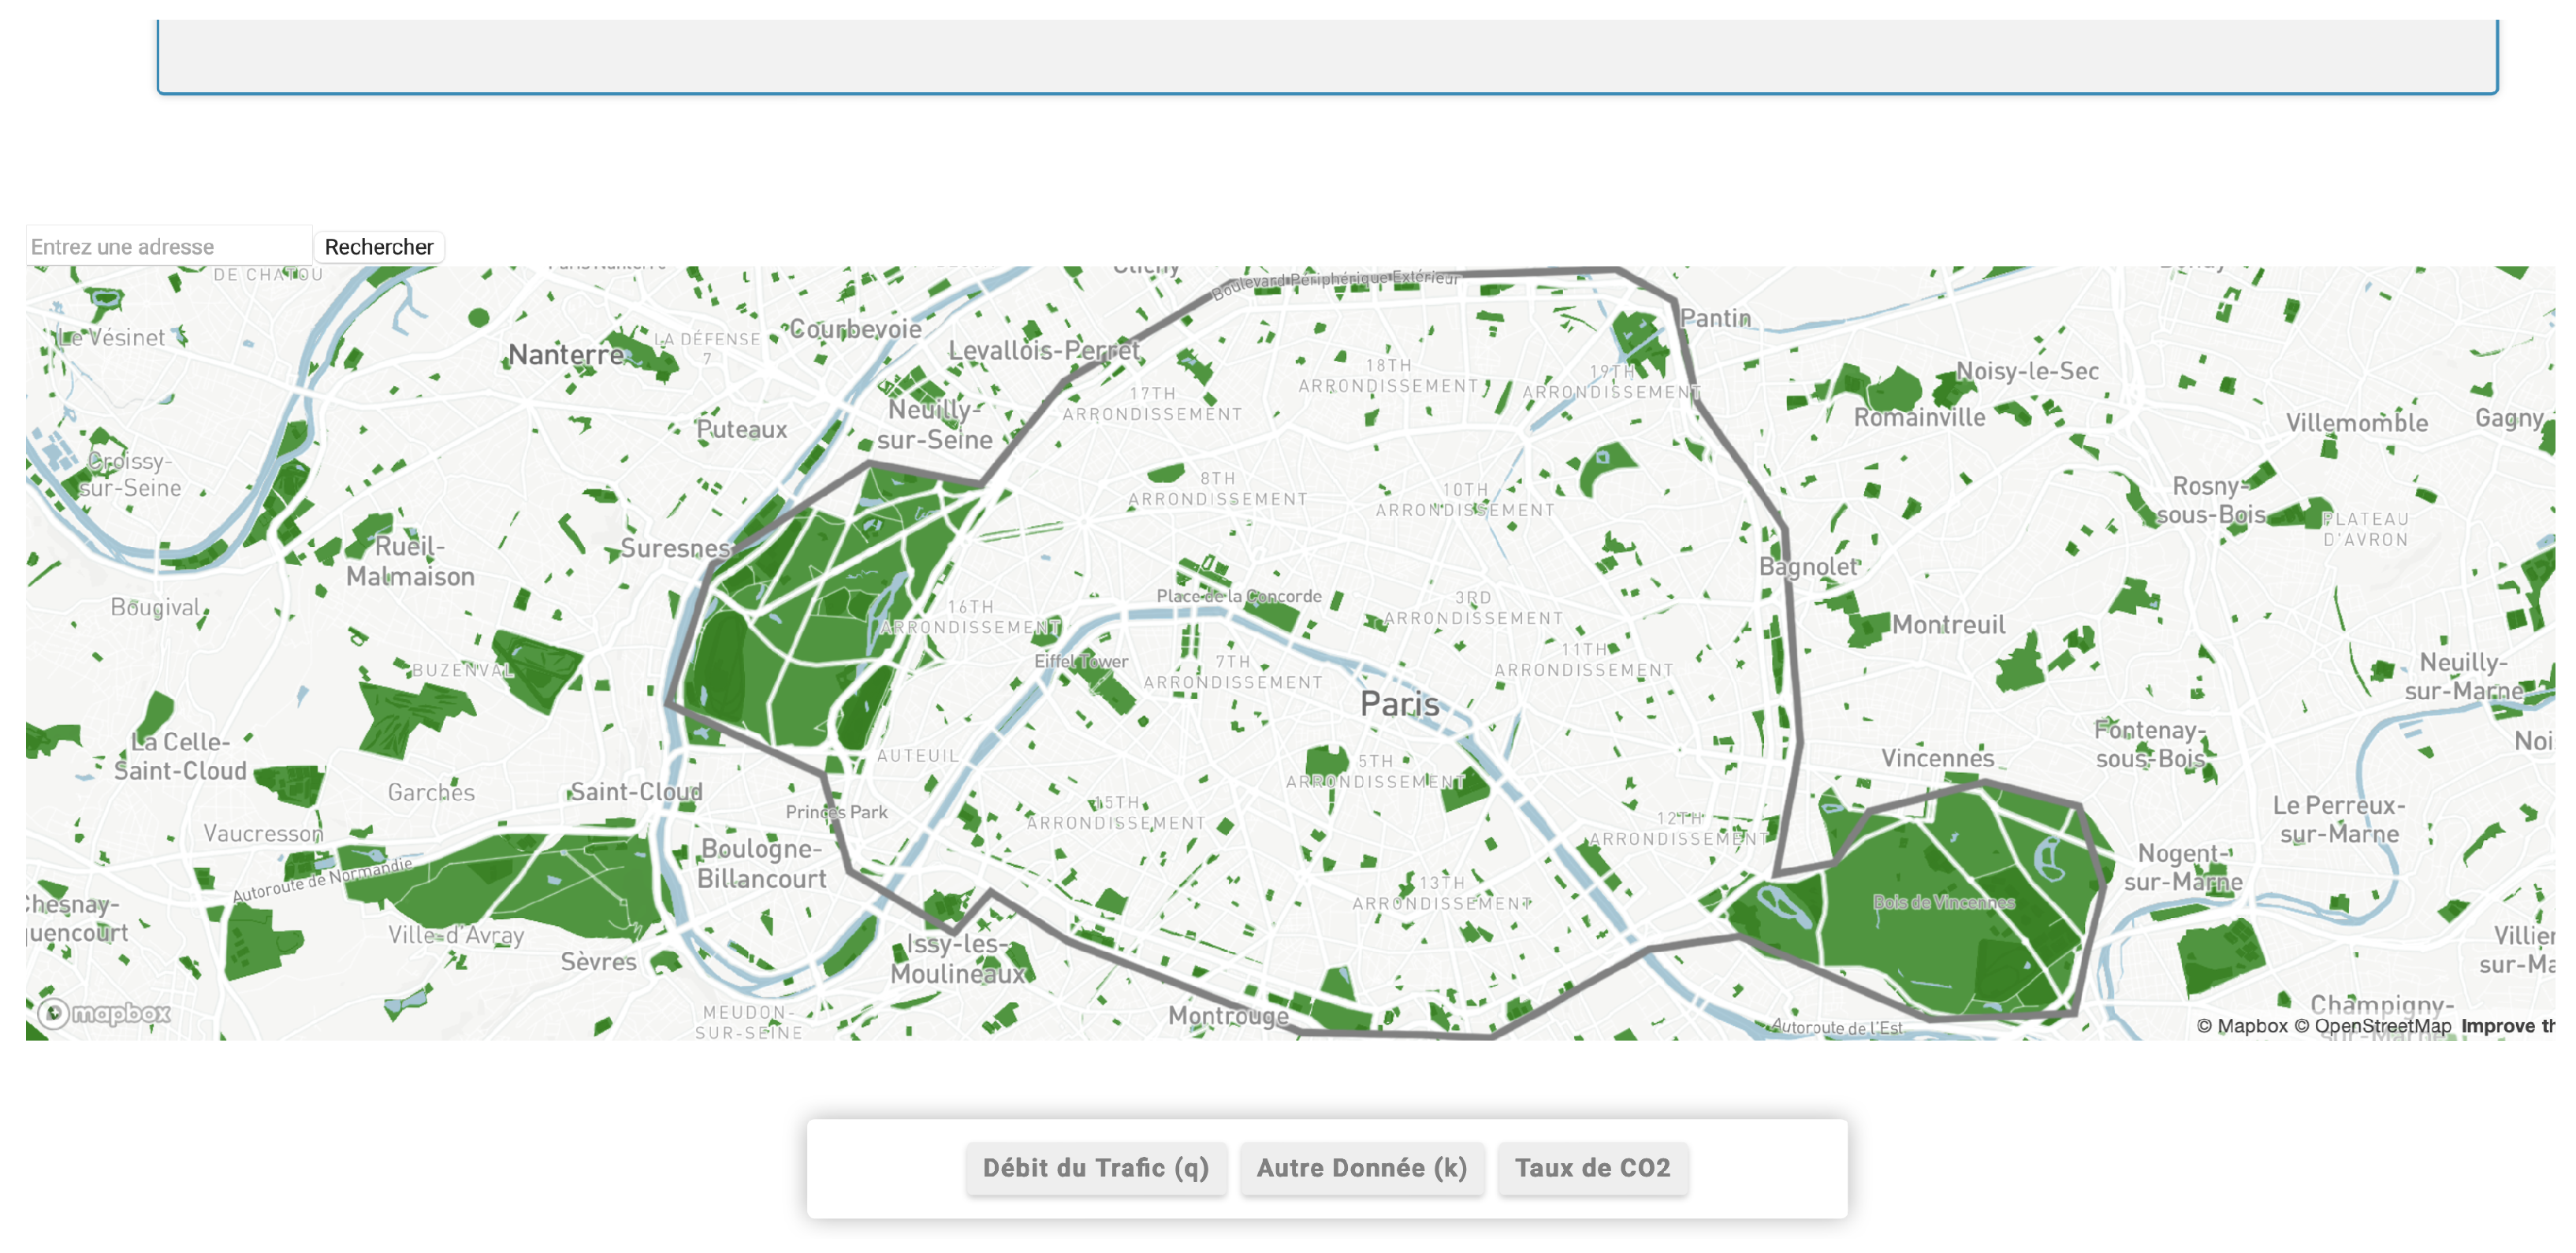
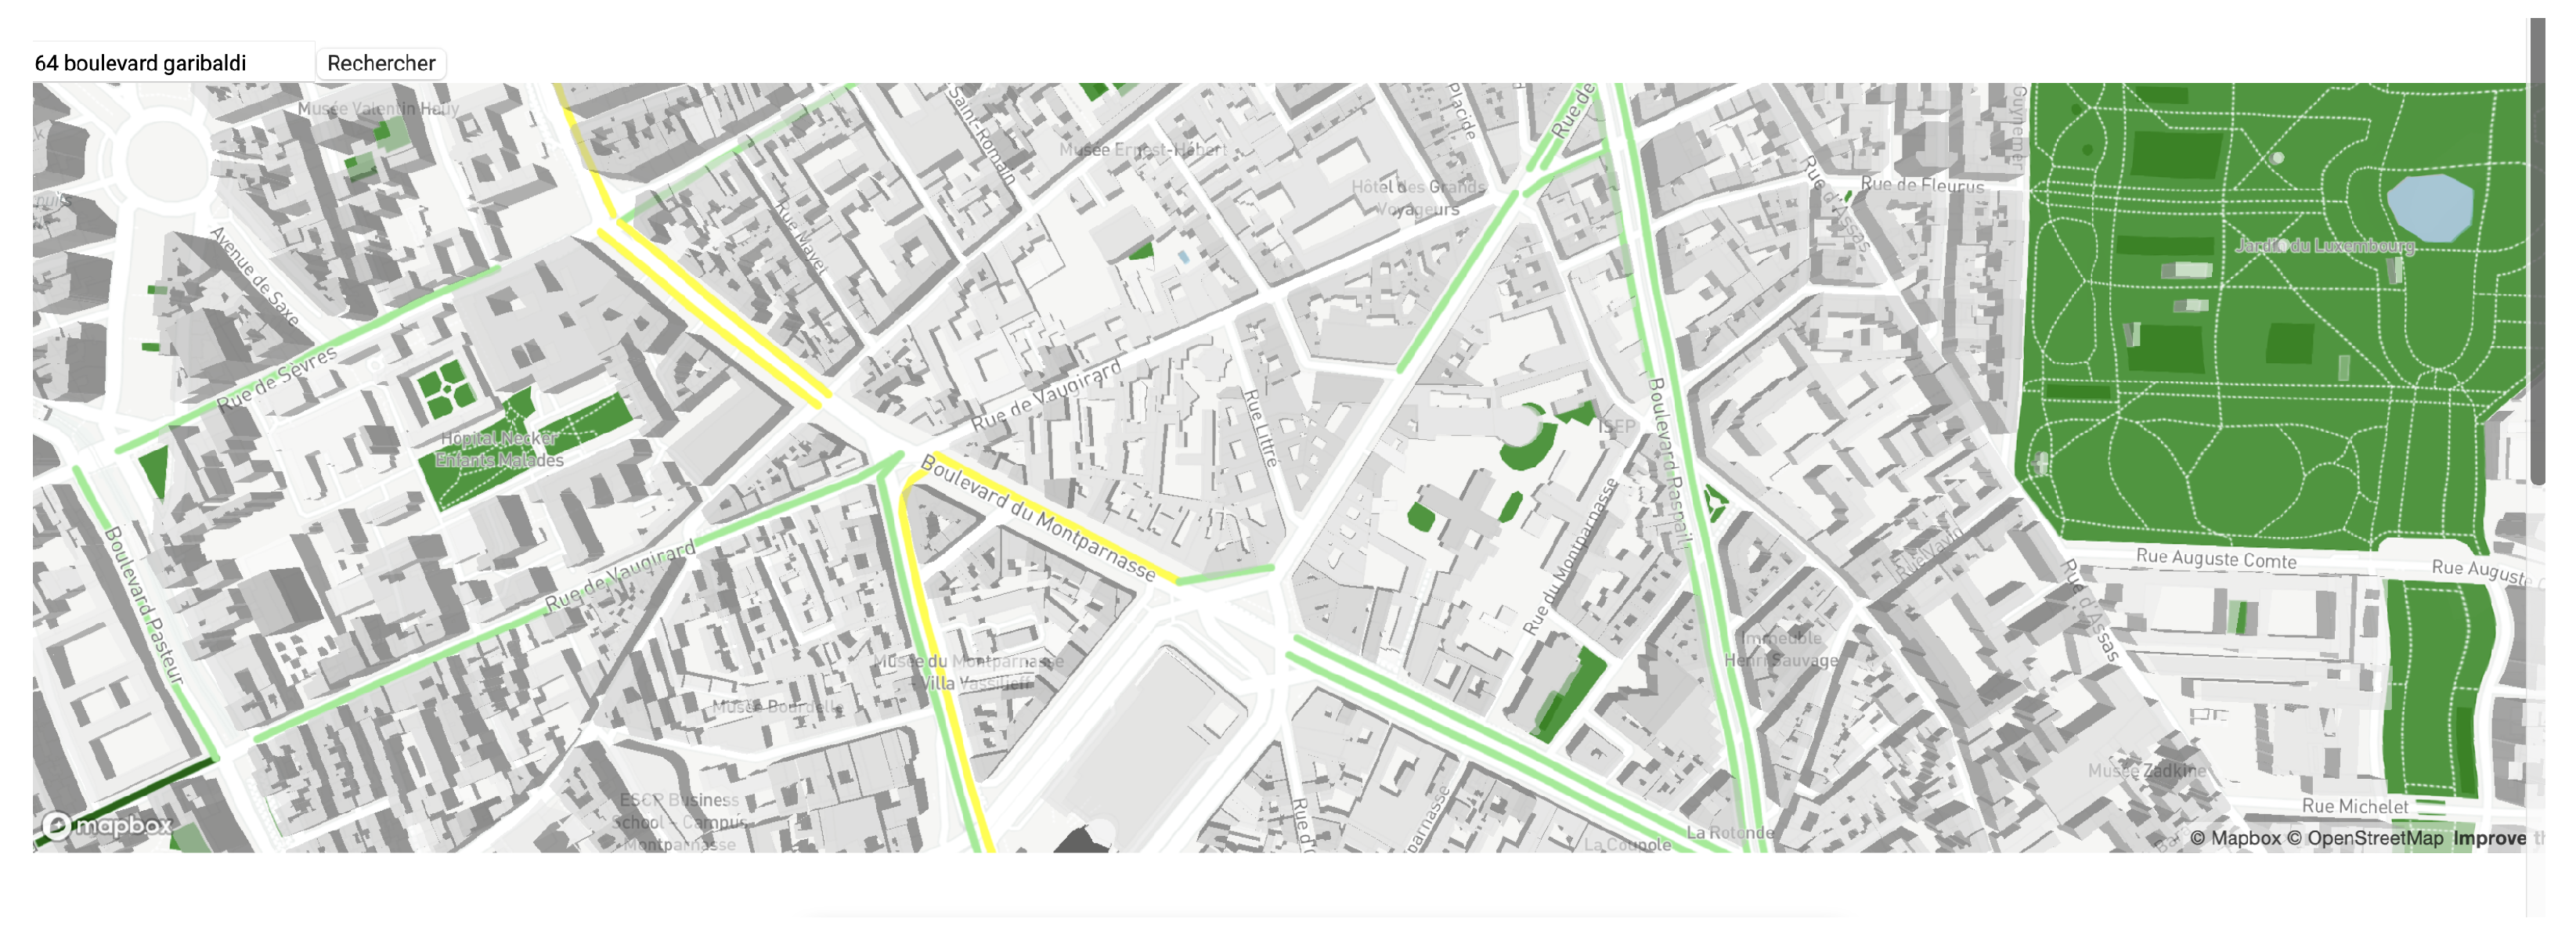
After this validation stage, the model was deployed and its predictions integrated into an interactive 2D/3D visualization interface, as shown in Figure 6 and Figure 7 below. Although this final deployment also involved additional IT resource consumption, it was crucial for the qualitative validation and operational use of the predictive model.
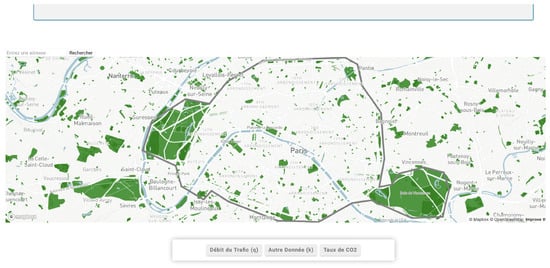
Figure 6.
A 3D map of CO2 emissions on the Paris road network.

Figure 7.
Detailed view of a specific road segment (Boulevard Garibaldi).
All methodological details concerning the precise architecture of the hybrid model, the hyperparameter configurations evaluated, and the full validation and performance results are available in our previous publication devoted exclusively to this model [11].
The next section will focus on evaluating the performance (CPU time and RAM consumption) of the different libraries—Pandas [12], PySpark [14], and Polars [13]—in the context of large data volumes, which are common in data science and deep learning. The central challenge is to identify the software stack that maintains the predictive performance while minimizing the computational load to meet the energy efficiency requirements of AI projects.
4. Simulation Methodology and Results
4.1. Experimental Environment
In a context where reducing the environmental impact of information technology has become a crucial concern, this study offers a comparative analysis of three widely used data processing libraries, Pandas, Polars, and PySpark. The objective is to evaluate their efficiency in terms of CPU time and RAM usage across multiple dataset sizes, thereby identifying the most suitable tools for high-performance processing that adheres to green computing principles [41]. After detailing our production pipeline based on a hybrid CNN-LSTM model dedicated to CO2 emission prediction [11], we now focus on the performance of five critical preprocessing steps: data reading, feature extraction, imputation, normalization, and emission calculation.
Our experimental approach is based on the use of the same dataset, broken down into several sizes to accurately assess the impact of this variation on the processing performance.
To ensure the reproducibility and fairness of the results, our experiments were conducted on a unified infrastructure hosted by the Google Cloud Platform (GCP) [37]. This infrastructure, equipped with an n2-standard-8 virtual machine (8 Intel Xeon Skylake vCPUs, 52 GiB RAM), enabled us to perform all processing operations with the libraries studied. The data used were sourced from the Open Data Paris—Traffic platform [42] and had various controlled sizes: 100 MB, 500 MB, 1 GB, 2 GB, 4 GB, and 8 GB.
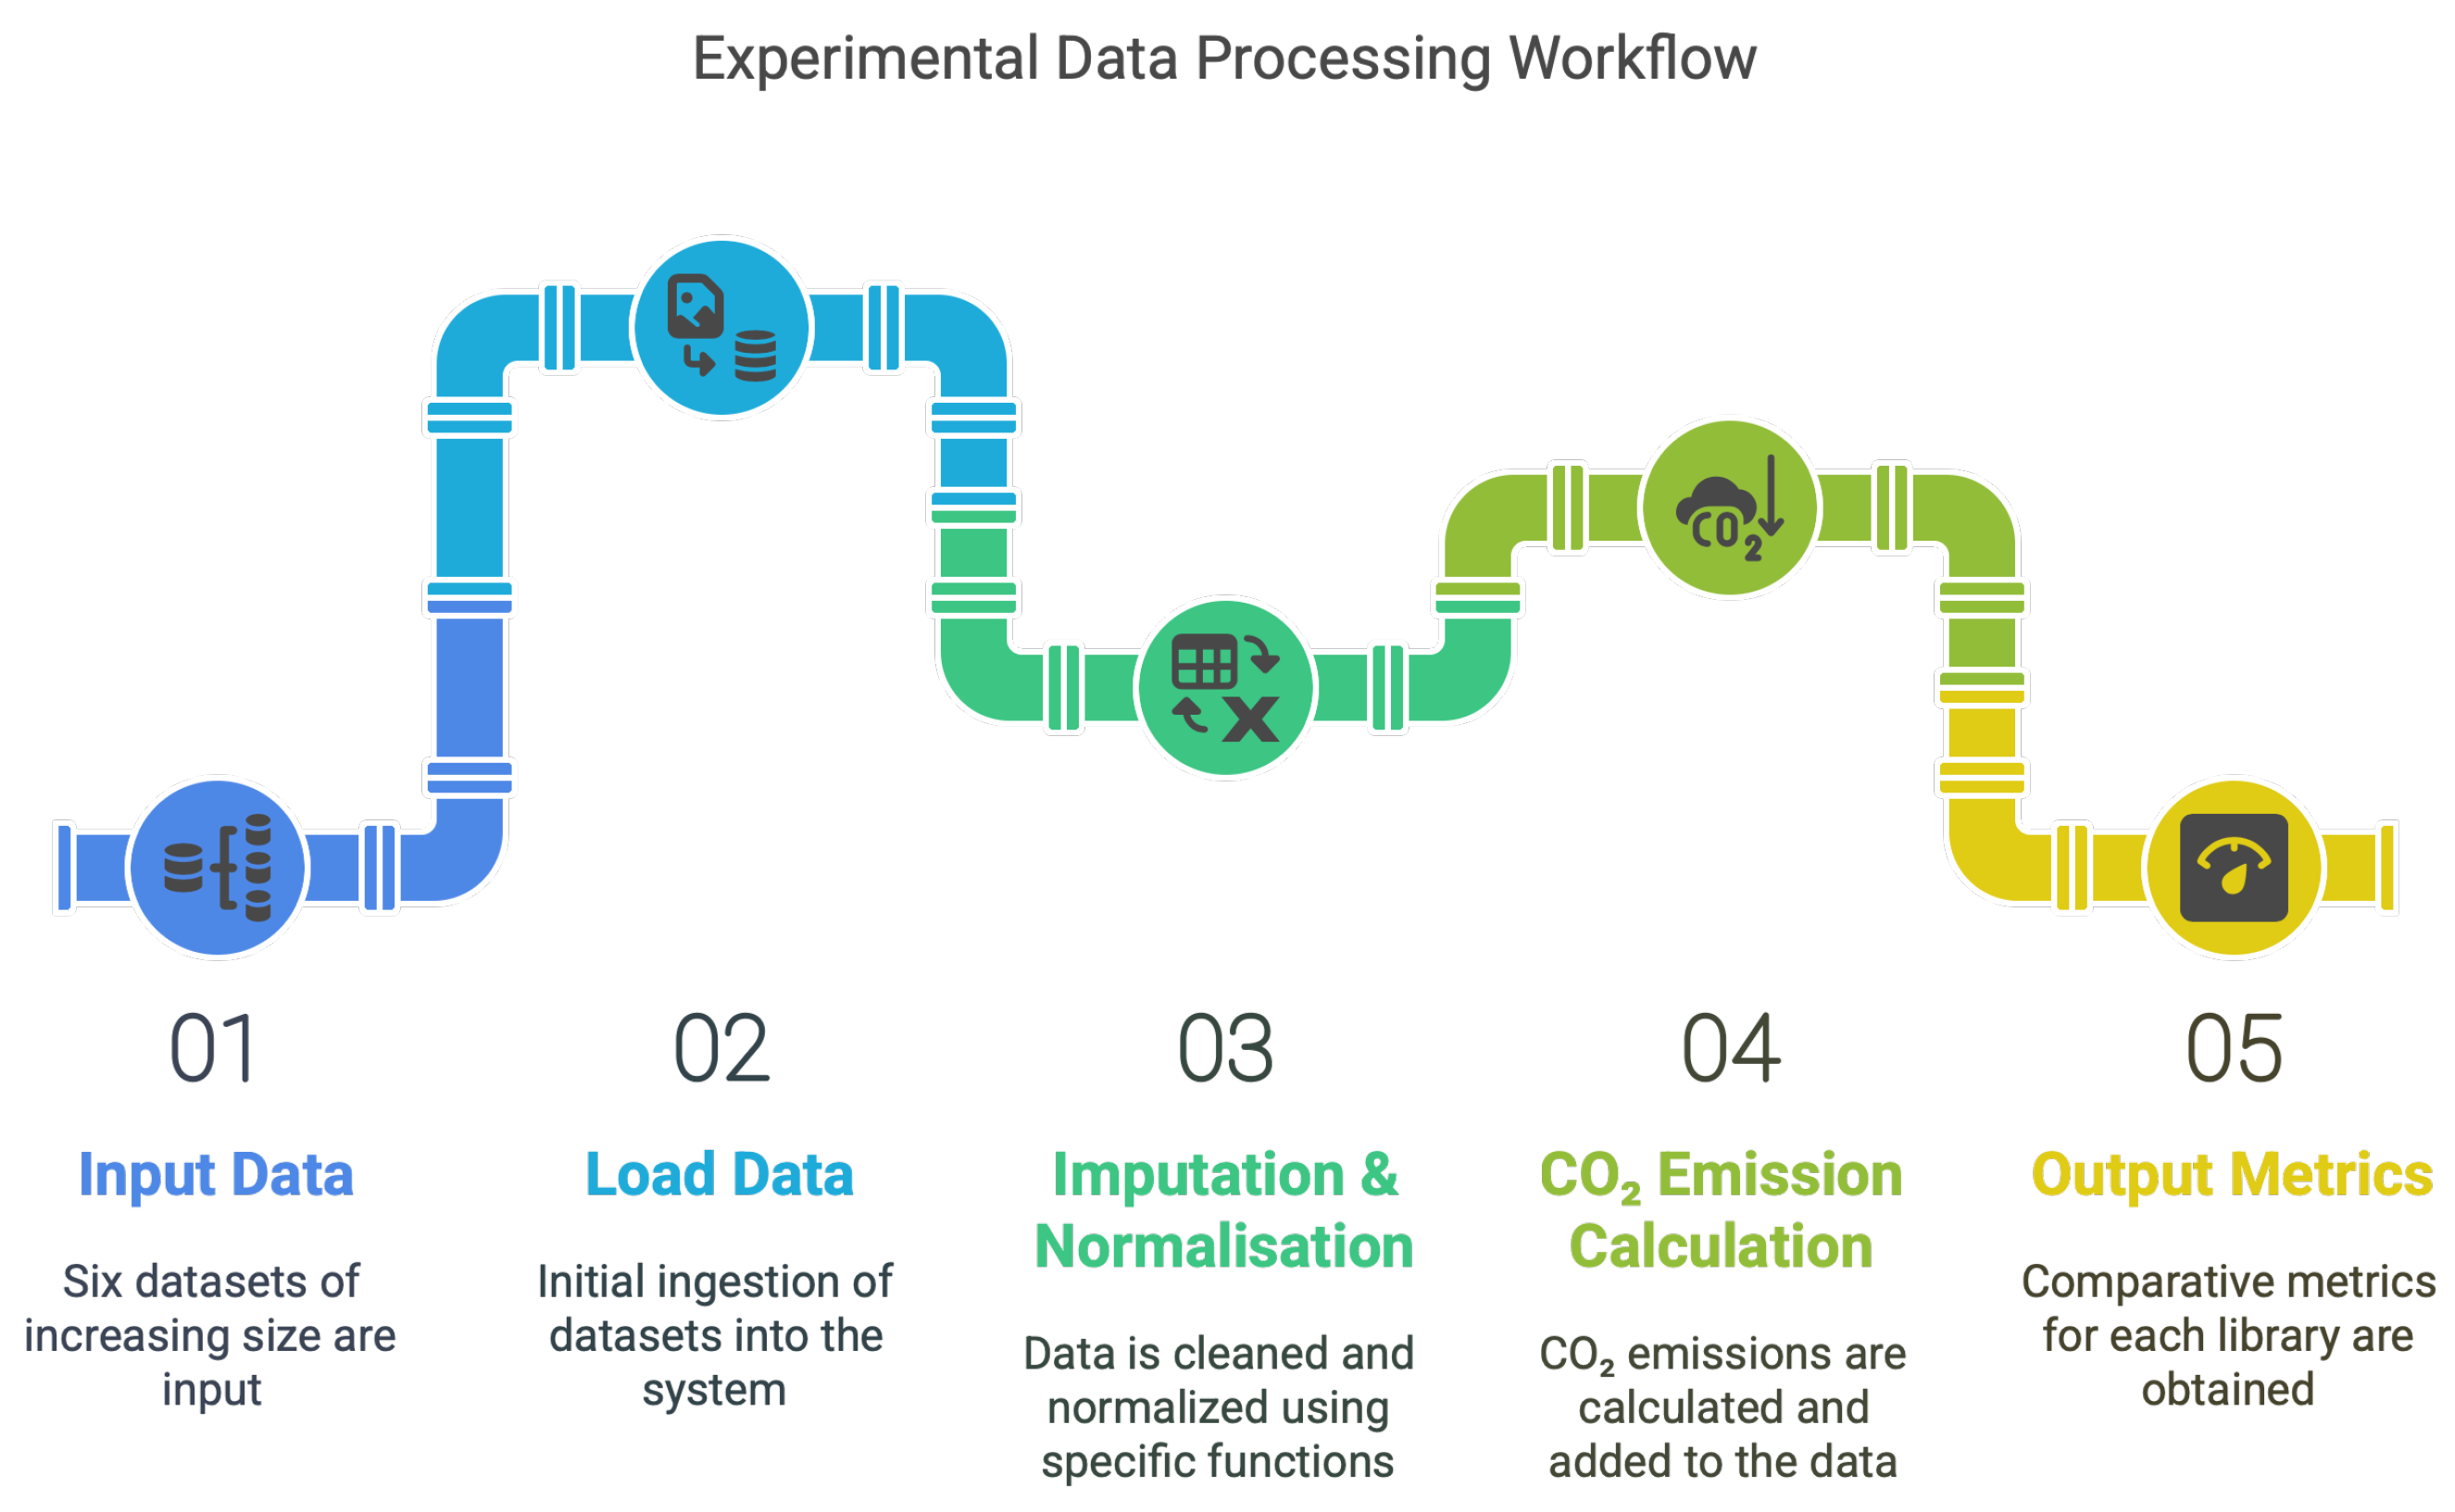
As illustrated in Figure 8, the experimental process consists of four essential steps:
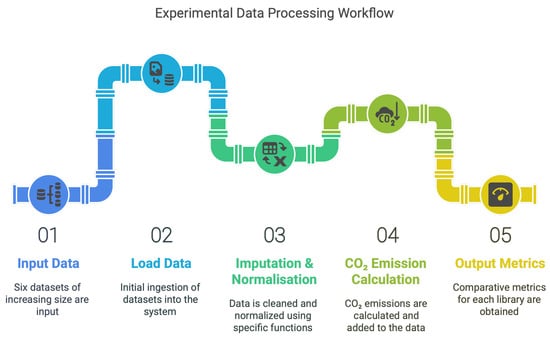
Figure 8.
Experimentaldata processing workflow.
- (1)
- Data loading: Initial reading of data from Parquet files, supplemented by the integration of external data from APIs (Google Maps for distances and speeds [44], AirParif for air quality [45], and Getambee for meteorological data [46]).
- (2)
- Imputation and normalization: Management of missing values via imputation based on similarities in temporal and spatial conditions (time, day, road segment). Quantitative, temporal, and spatial data are then normalized.
- (3)
- Calculation of CO2 emissions [11]: Use of a probabilistic model based on the Monte Carlo method to determine emissions, taking into account the environmental, behavioral, and technical factors of the vehicles.
- (4)
- Systematic collection of results: Detailed recording of performance in terms of execution time, maximum memory consumption (RAM), and average CPU usage in a dedicated CSV file.
4.2. Performance Results and Key Observations
In order to facilitate an overall understanding of the results obtained through our comparative experiment, we first group all the quantitative data collected in a table, showing the total execution time (in seconds), average CPU consumption (in %), and average RAM usage (in MB or GB) for each library and each dataset size. To ensure reproducibility and reliability, each experiment was executed 16 times, and the variability between runs was measured, confirming that the standard deviations remained consistently below 5%. Table 3 below summarizes the experimental results obtained with Pandas.

Table 3.
Experimental results with Pandas.
The observation of Table 3 above reveals that Pandas exhibits stable CPU usage, capped below 102 %, indicating an inherent limitation in the efficient use of multicore resources, likely due to Python’s Global Interpreter Lock (GIL). Table 4 below presents the experimental results with Polars Eager.

Table 4.
Experimental results with Polars Eager.
For Polars Eager, as we can see in Table 4 above, the CPU usage is significantly higher than with Pandas, reaching up to 657%, demonstrating an increased ability to leverage available multithreaded resources. Memory consumption remains moderate compared to Pandas, highlighting the efficiency of the Arrow data format used by Polars. Table 5 below details the experimental results obtained with Polars Lazy.

Table 5.
Experimental results with Polars Lazy.
Polars Lazy delivers even more impressive performance in terms of execution time, particularly on large datasets (over 1 GB). CPU utilization reaches up to 57 %, confirming increased optimization due to lazy evaluation and significantly reducing the overall execution times. Finally, Table 6 below summarizes the experimental results obtained with PySpark. PySpark displays intermediate CPU consumption and relatively high memory usage, particularly on large datasets. This can be explained by the additional costs associated with the JVM and the serialization/deserialization processes between Python and Java.

Table 6.
Experimental results with PySpark.
5. Comparison and Analysis
5.1. Quantitative Performance Metrics
5.1.1. Total Execution Time
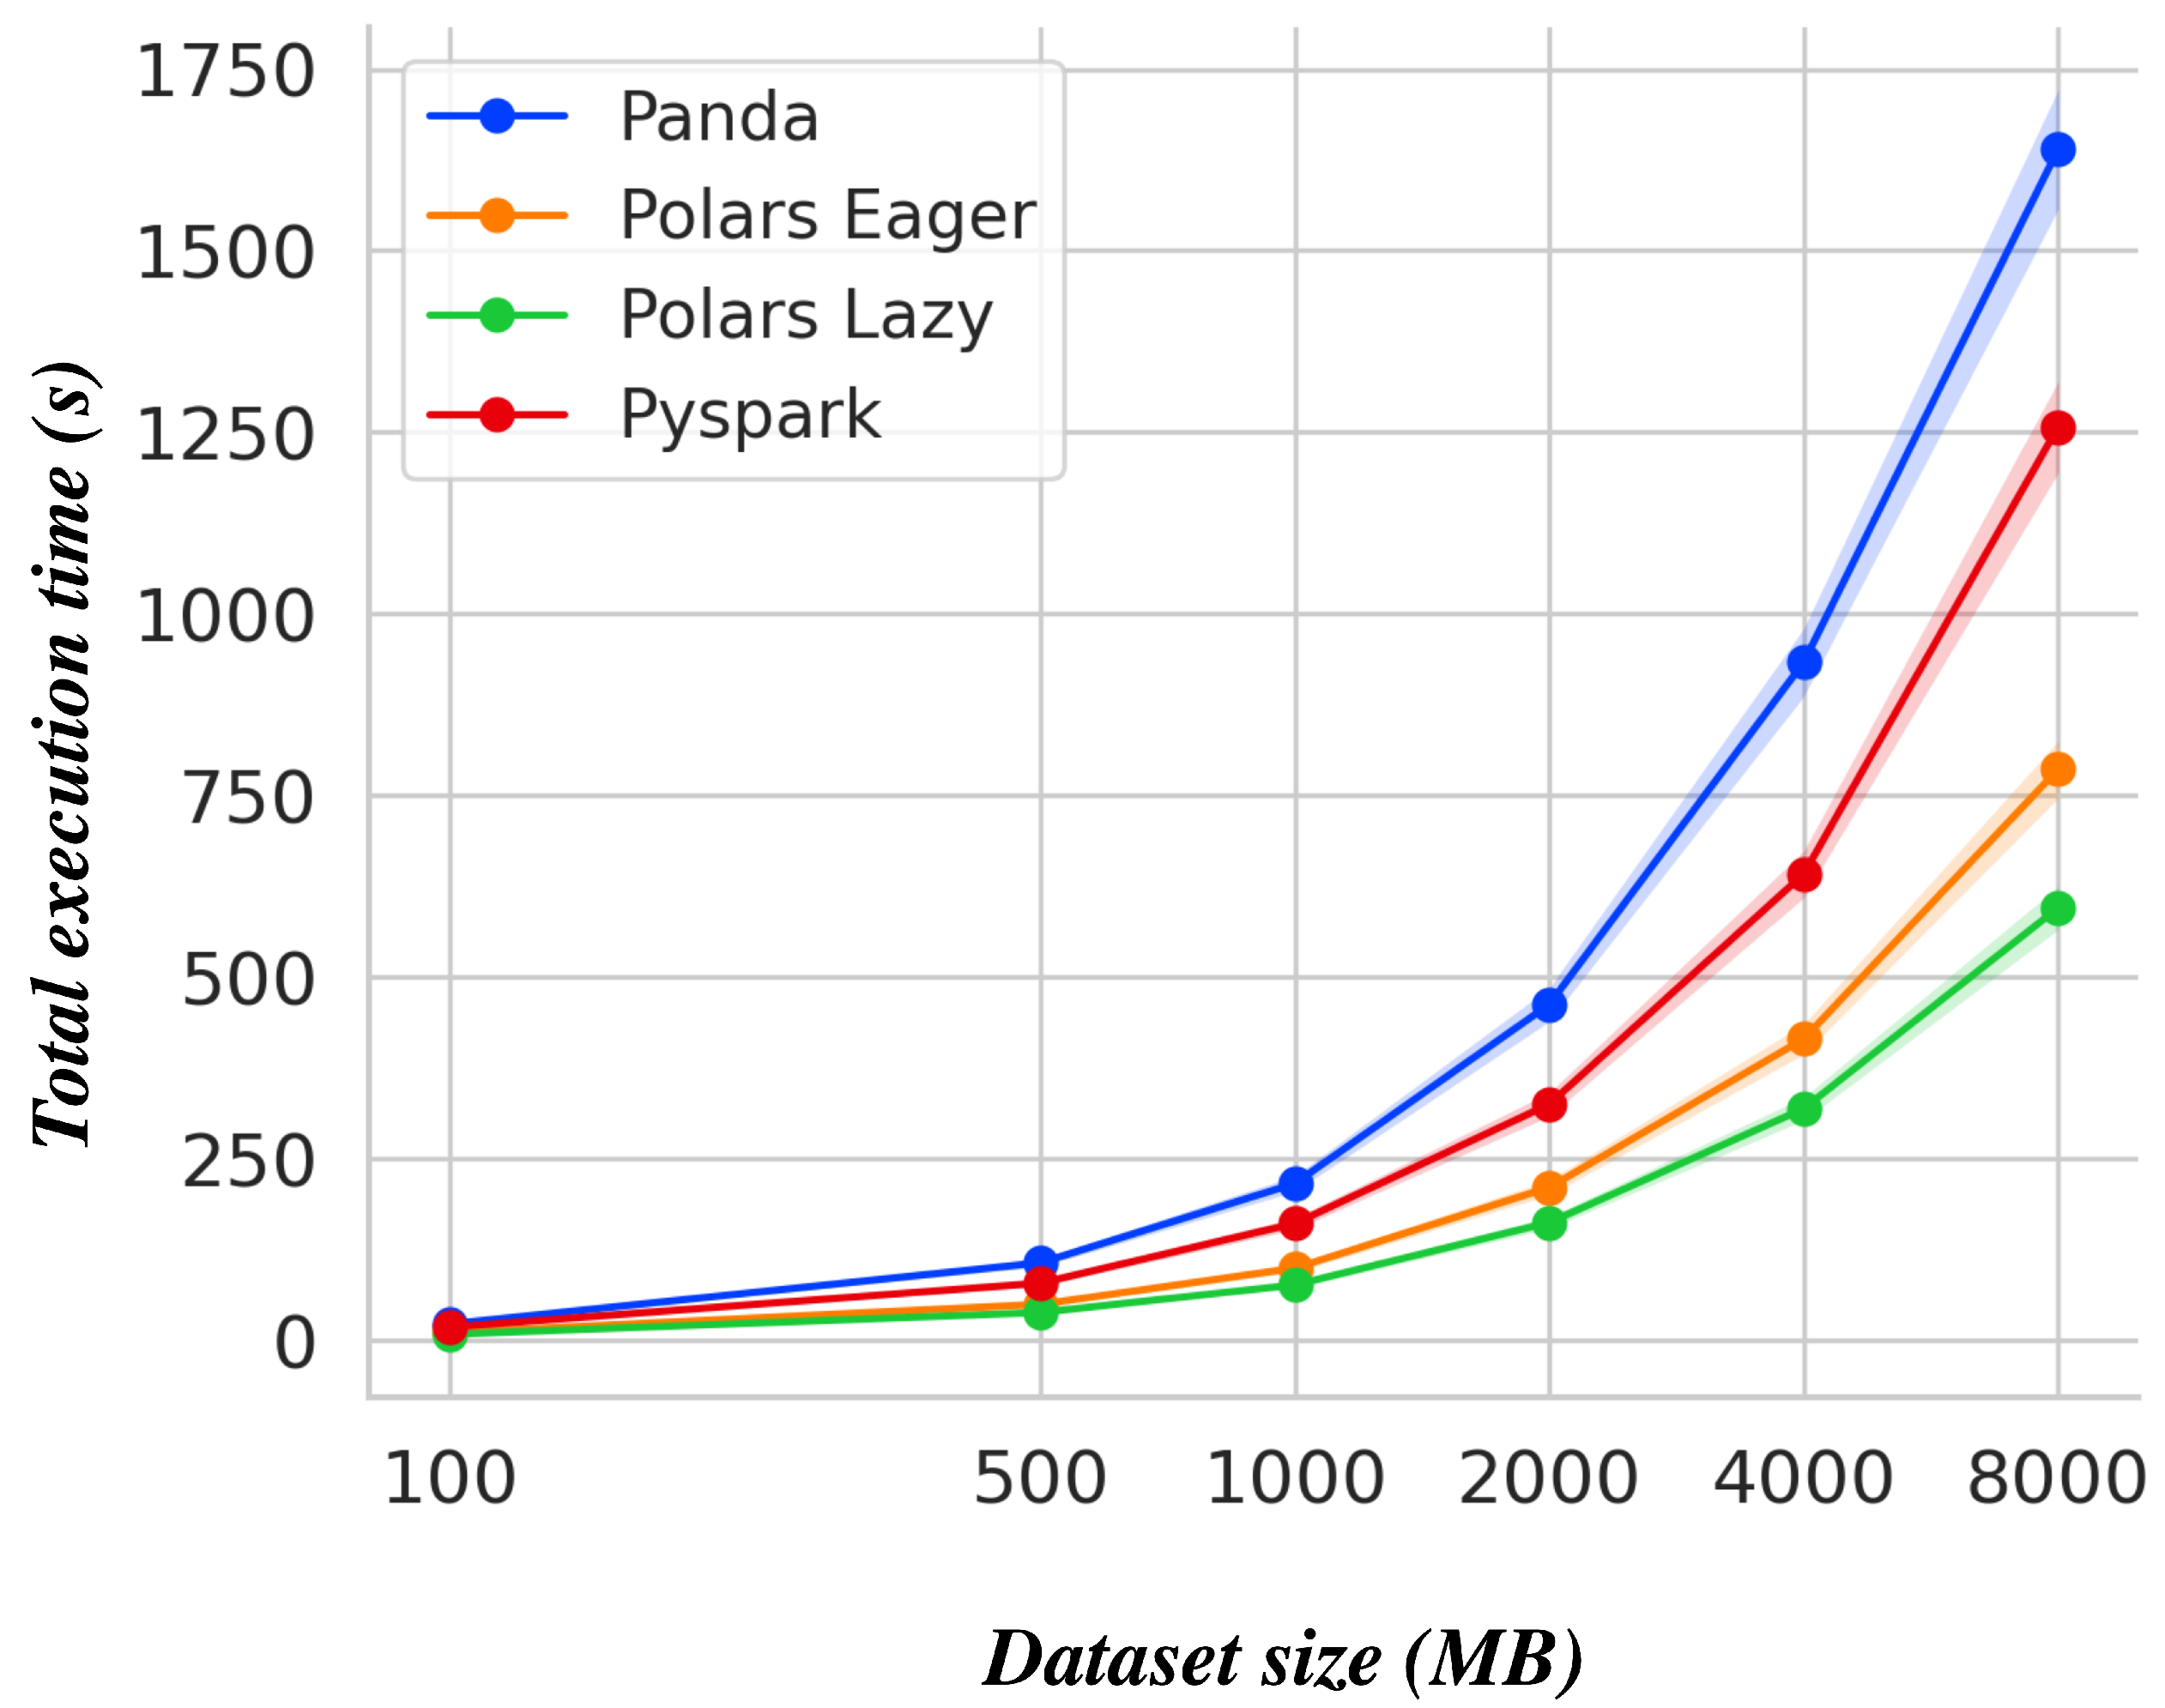
Figure 9 below shows the evolution of the total execution time as a function of the dataset size for each library.
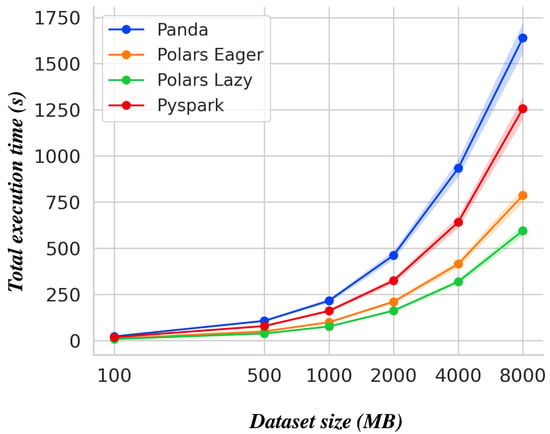
Figure 9.
Total execution time vs. dataset size for Pandas, Polars (Eager and Lazy), and PySpark.
It is clear that Pandas exhibits an exponentially increasing execution time beyond approximately 500 MB, reaching 1.5 to 2 times those required by Polars (Lazy and Eager) and PySpark for datasets larger than 2000 MB. This exponential growth in Pandas is directly attributable to its single-threaded nature and lack of parallel execution optimization. Conversely, Polars Lazy demonstrates the best overall performance, particularly noticeable for the 1000 MB dataset, with significant time savings due to its deferred execution approach and its ability to automatically optimize operations into a single compact query. PySpark shows intermediate execution times between Pandas and Polars Lazy but remains less efficient at equal volumes due to its overhead related to the JVM and Python–JVM serialization/deserialization operations.
5.1.2. Peak Memory Consumption
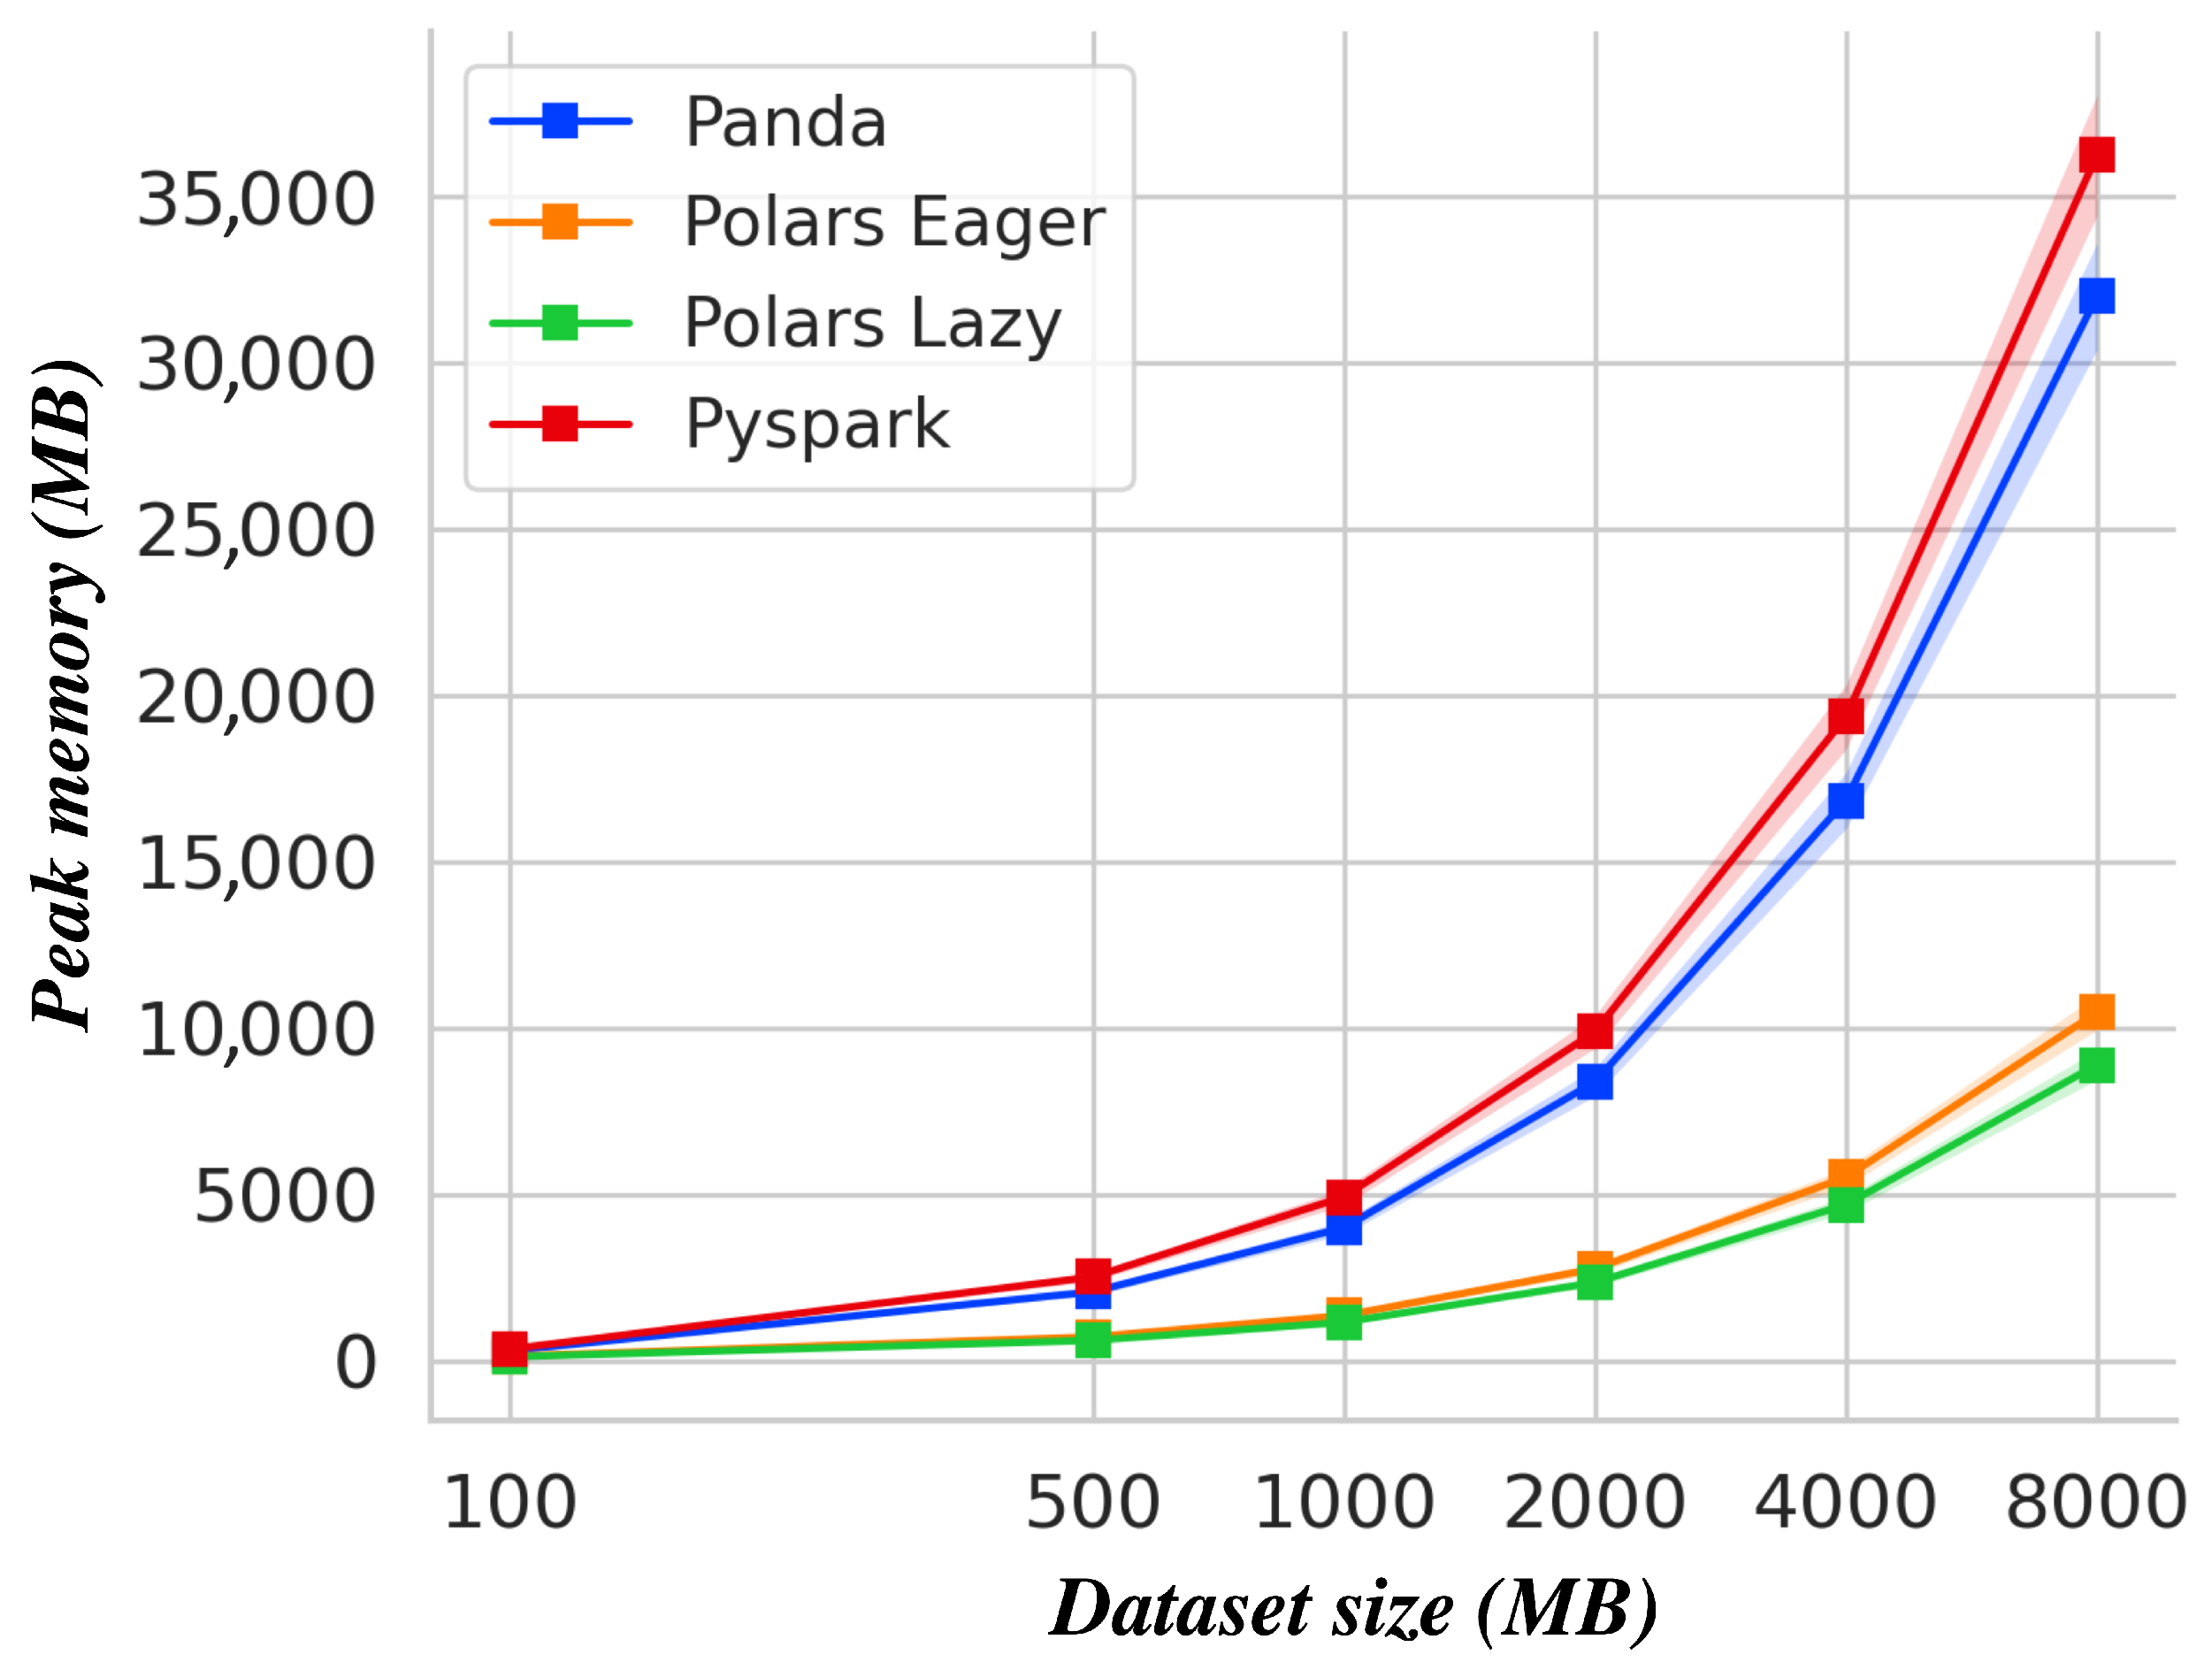
The maximum memory consumption observed is shown in Figure 10 below. The results clearly indicate that PySpark and Pandas have significantly higher memory peaks than Polars, particularly for datasets larger than 1000 MB. Pandas’ memory consumption increases dramatically as the dataset grows, revealing inefficient memory management in large-volume scenarios. PySpark, although designed for distributed processing, also exhibits high memory spikes due to the necessary serialization between Python and the JVM, as well as the internal partition and shuffle buffer management process. In contrast, Polars, thanks to its Apache Arrow-based columnar data format, has a significantly smaller memory footprint, confirming its advantage for large-scale processing applications while minimizing its environmental footprint.
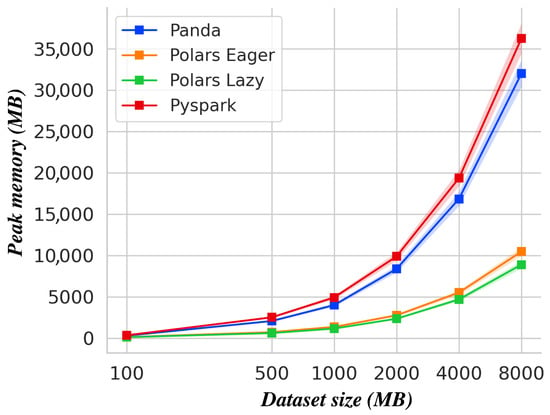
Figure 10.
Peak RAM usage vs. dataset size for Pandas, Polars (Eager and Lazy), and PySpark.
5.1.3. Average CPU Load
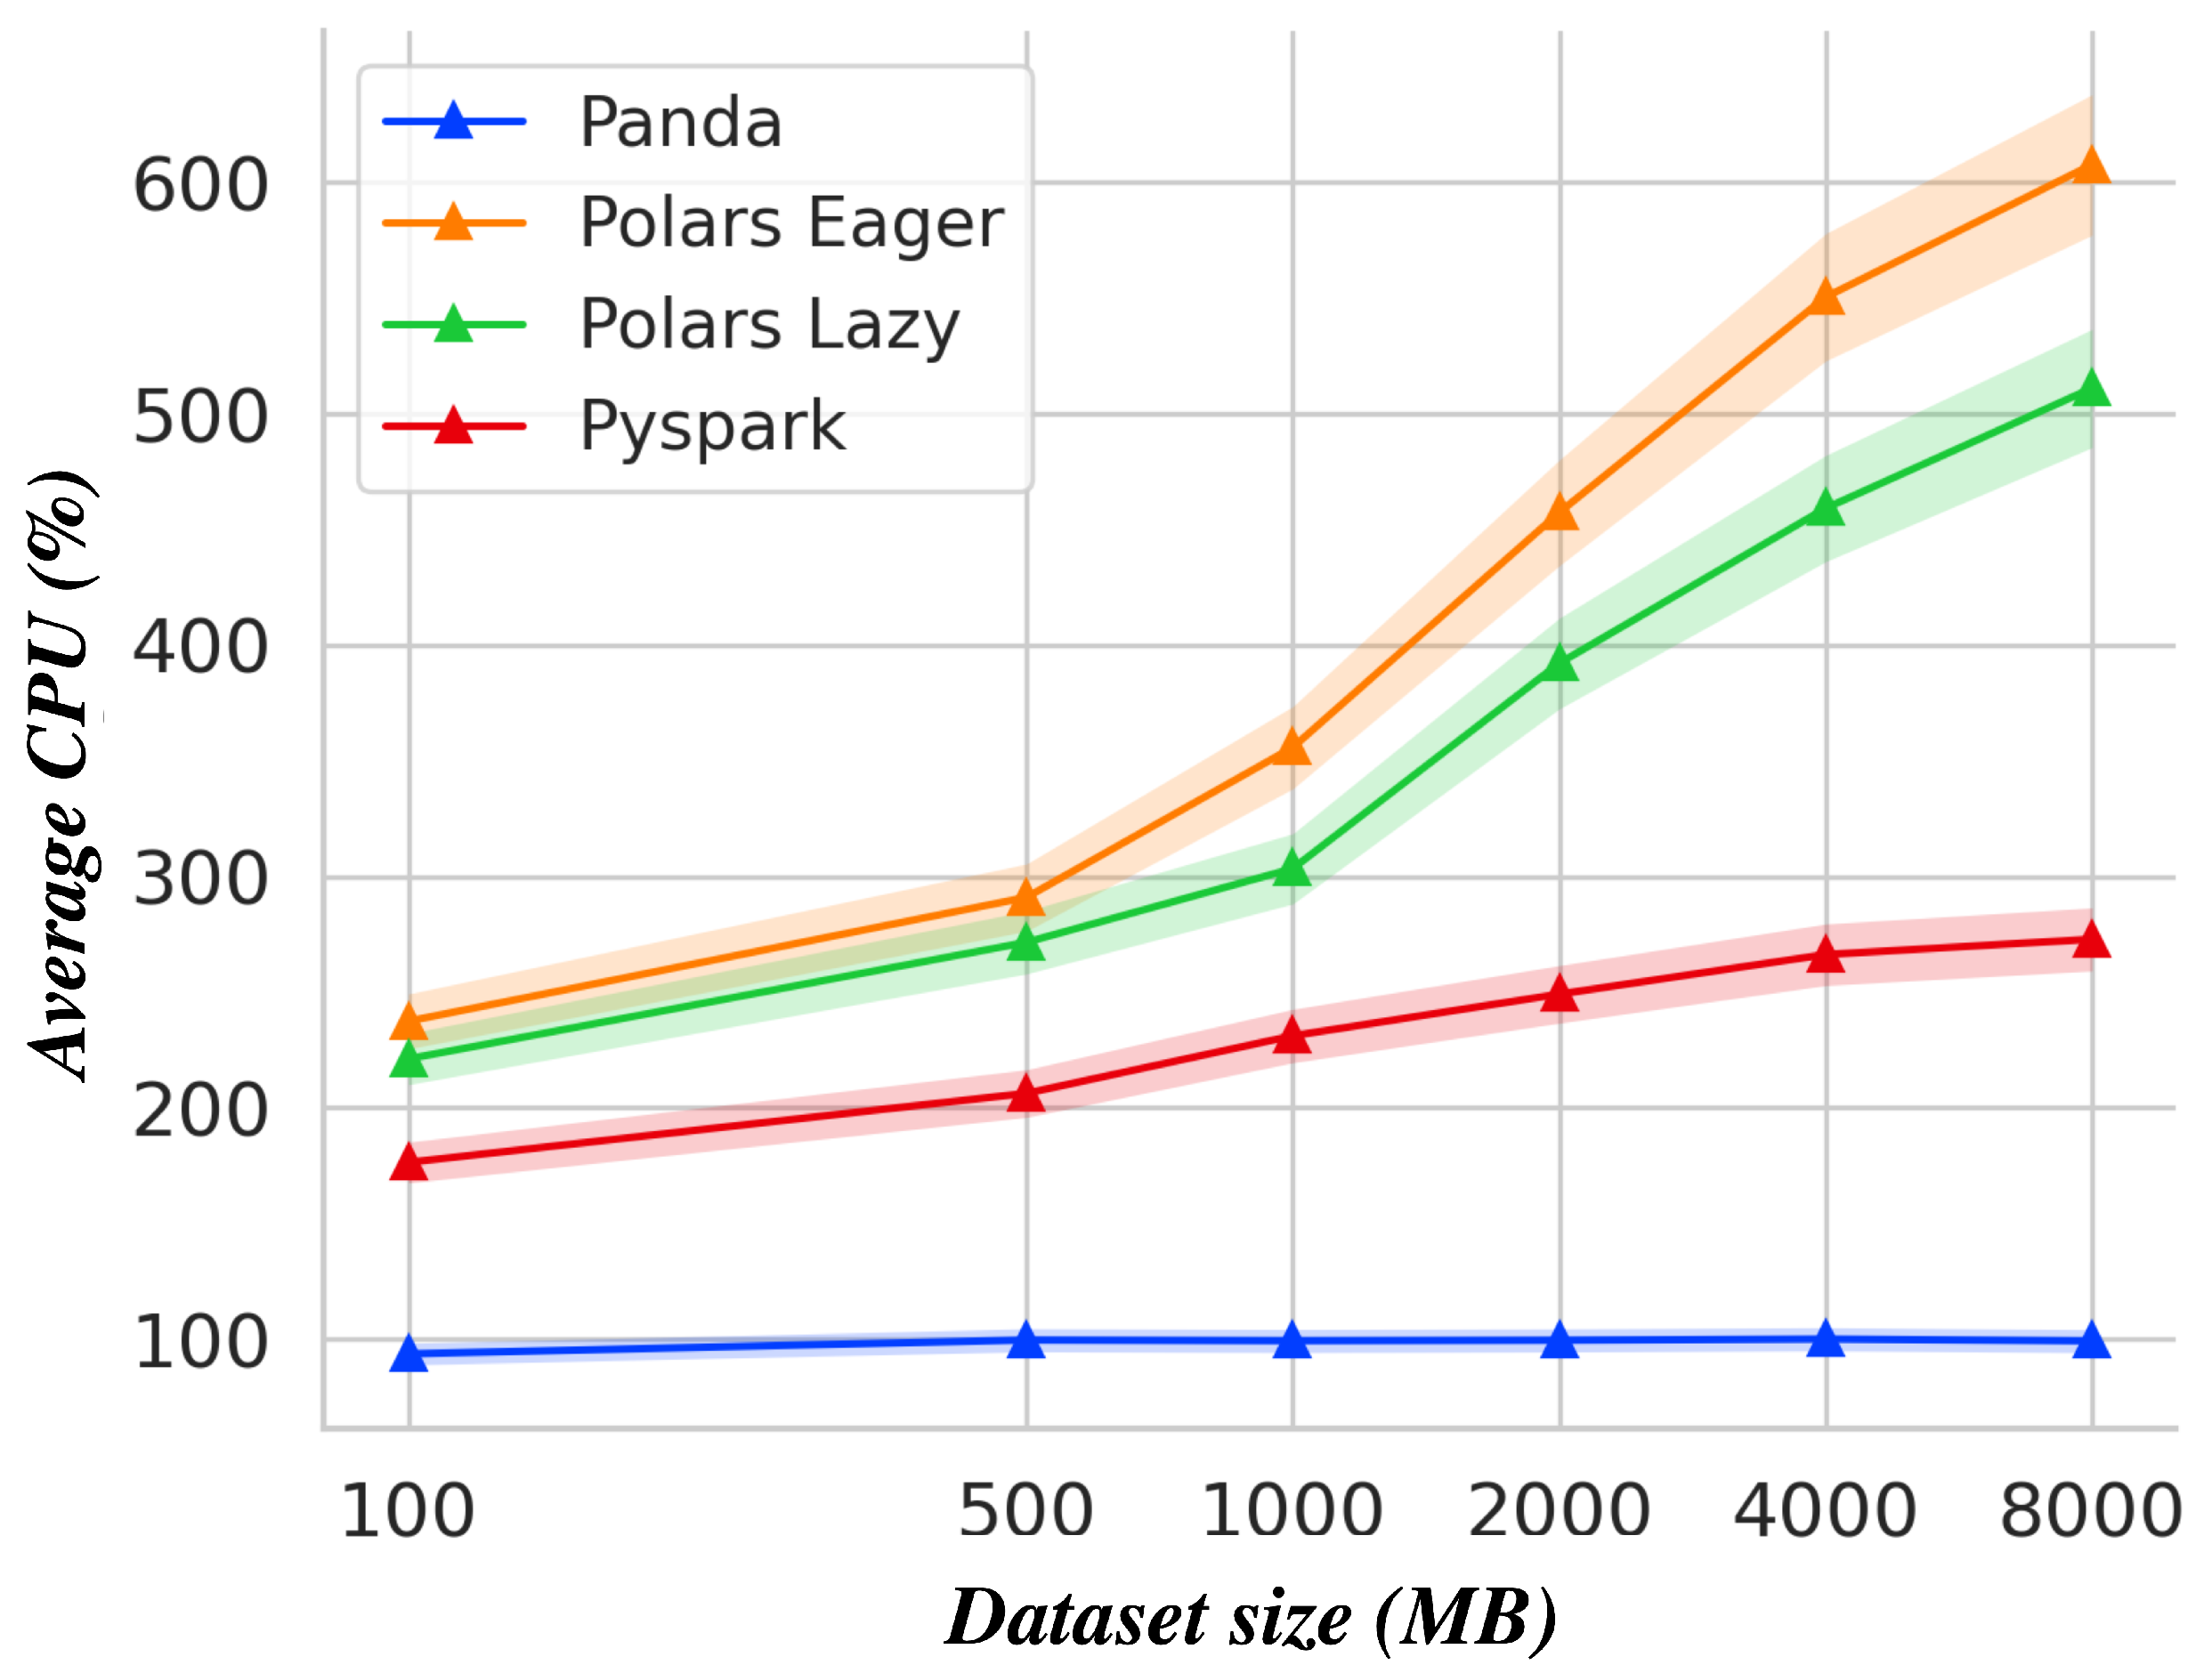
Figure 11 below illustrates the average CPU load observed for each library according to the size of the dataset processed. The results show that Pandas has stable and relatively low CPU usage, below 120%, highlighting its inability to fully utilize the available multicore resources. PySpark shows moderate usage, varying around 250%, due to internal JVM management and garbage collector interruptions. Polars (Eager and Lazy) fully exploits the available parallel resources, frequently reaching values above 500%. This result partly explains the excellent temporal performance of this library on large datasets.
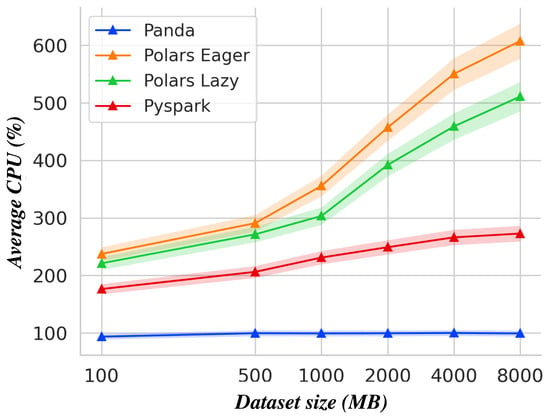
Figure 11.
Average CPU load (%) vs. dataset size for Pandas, Polars (Eager and Lazy), and PySpark.
5.1.4. Step-by-Step Runtime Analysis
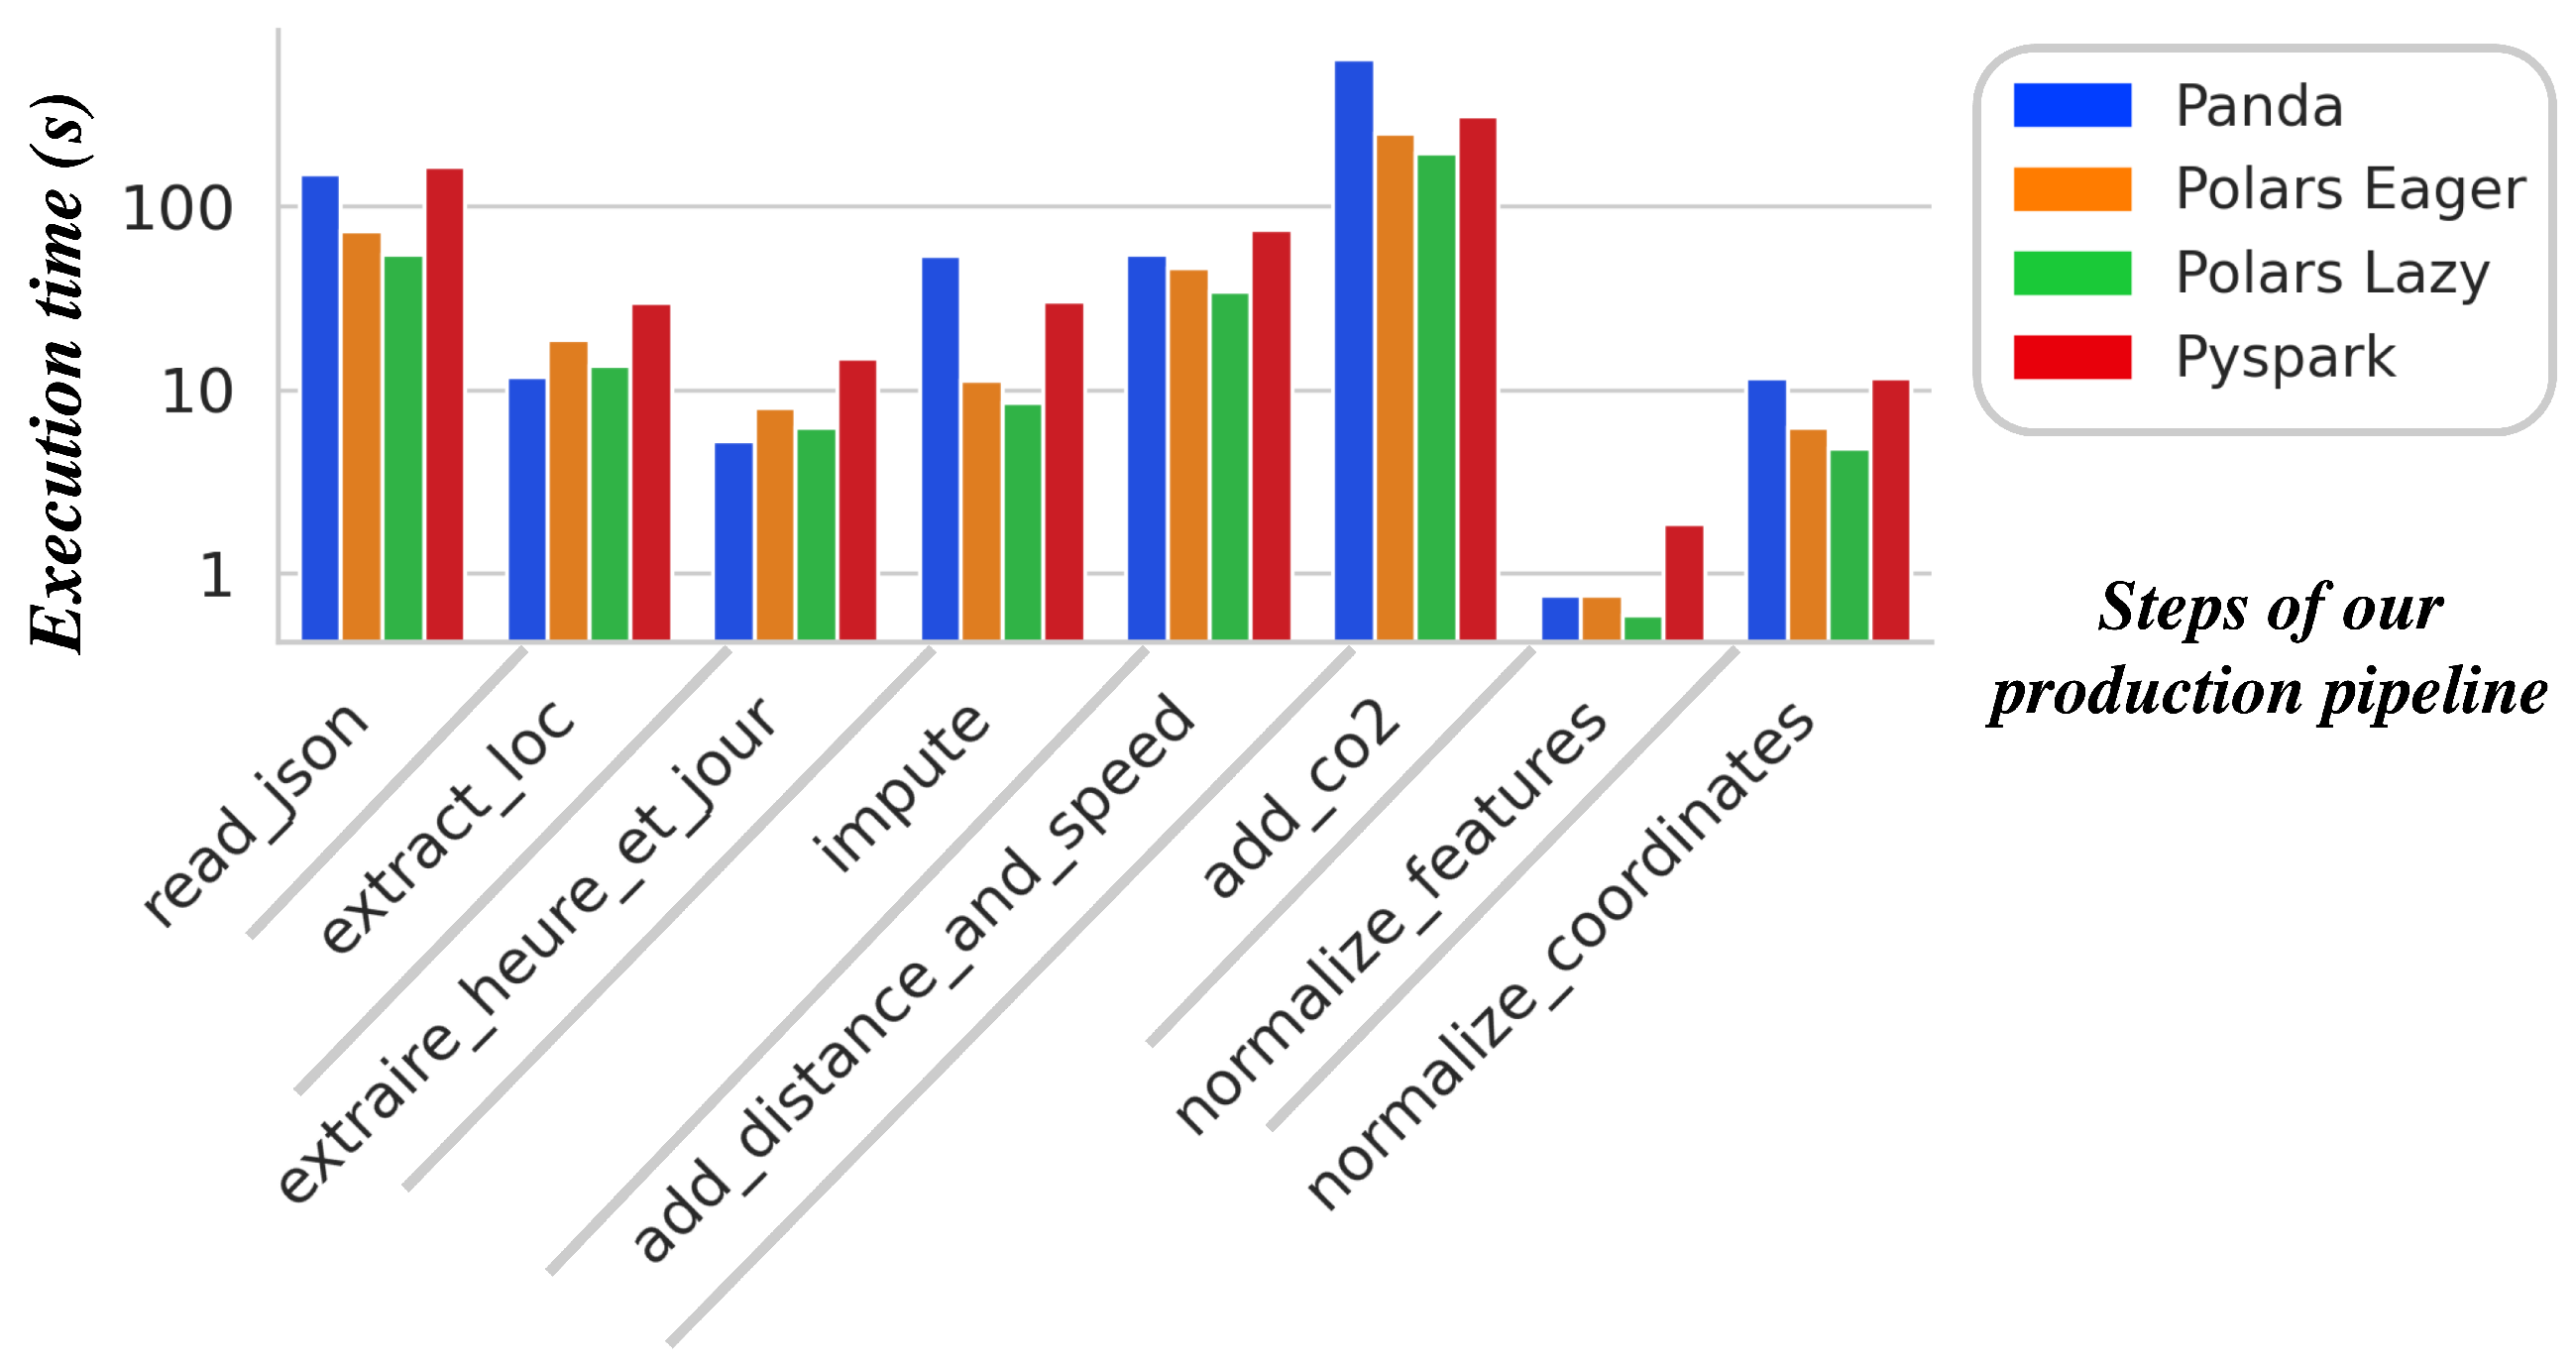
Figure 12 below provides a step-by-step runtime breakdown for a medium-sized dataset (4000 MB). This detailed analysis highlights two particularly costly steps for all libraries: data reading (read_json) and CO2 emissions calculation (add_co2). Pandas and PySpark show significantly longer times during these steps. In the case of Pandas, inefficient and sequential data reading is responsible for the observed slowdown. For PySpark, the additional cost is mainly due to the initialization of distributed objects (RDD/DataFrame) and frequent transfer operations between Python and the JVM. Polars, thanks to its vectorized read optimization and native parallel processing, effectively minimizes these bottlenecks. Lightweight operations (normalization of coordinates and features) exhibit minimal execution times with Polars, demonstrating its optimized internal resource management.
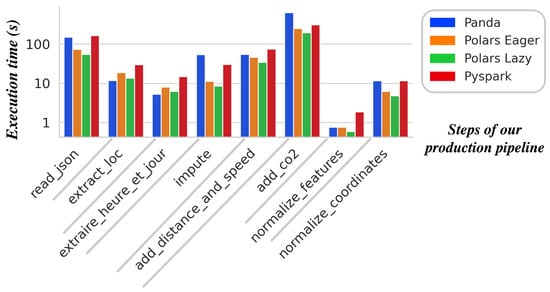
Figure 12.
Runtime breakdown for critical processing steps on a 4000 MB dataset for Pandas, Polars (Eager and Lazy), and PySpark.
5.2. Quantitative Summary of Average Performance
The following Table 7 summarizes the average performance metrics obtained across six dataset sizes (ranging from 100 MB to 8 GB) for the four evaluated libraries: Pandas, Polars (Eager and Lazy), and PySpark.

Table 7.
Summary of average performance metrics for the four evaluated libraries.
Polars Lazy clearly stands out thanks to its reductions in processing time (up to 76%) and memory consumption (82%) compared to Pandas, while taking full advantage of CPU resources through efficient parallelism. Polars Lazy’s superiority stems from three major technical advantages:
- Lazy evaluation: Successive operations are merged into an optimized execution plan, limiting intermediate reads/writes.
- Native vectorization with Apache Arrow: Optimal memory access and CPU cache utilization accelerate bulk processing.
- Multithreaded Rust scheduler: Full utilization of all available cores (8 vCPUs) for maximal throughput.
In concrete terms, this yields an average reduction in total time of 76% and a maximum memory footprint of 82% compared to Pandas, accompanied by higher CPU utilization (421% on average) but a net energy saving. However, despite its intuitive API and tight Python integration, Pandas suffers from the GIL—leading to rapid memory saturation (up to 32 GB) and long runtimes beyond 500 MB, making it best suited for rapid prototyping on small datasets.
Polars Eager offers a high-performance compromise, leveraging Polars’ optimized engine without deferred execution, still achieving a 61% time reduction and nearly four times lower memory usage relative to Pandas.
PySpark, by contrast, excels in distributed multinode setups but incurs JVM and Python–JVM serialization overheads on a single machine, limiting its performance advantage in this context.
Finally, Figure 13 below visualizes these comparative results across the execution time, CPU load, and memory usage.
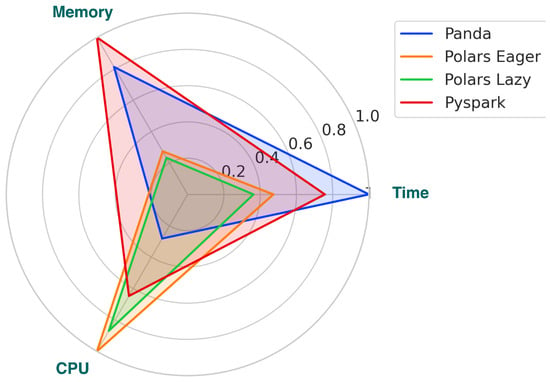
Figure 13.
Performance evaluation of Pandas, Polars (Eager and Lazy), and PySpark based on execution time, CPU utilization, and memory footprint.
5.3. Environmental Assessment: Energy Cost Modeling
The performance of a data processing library cannot be evaluated solely on the basis of the execution speed or memory consumption; it must also take into account environmental factors, particularly the energy consumption and the associated carbon footprint. Several recent studies highlight the importance of accurately measuring the energy consumption of data science and artificial intelligence tasks in order to promote a green computing approach [9,52].
In this study, the total energy consumed by each process was modeled based on three experimentally measured parameters: the execution time T, average CPU load , and maximum RAM used m. We applied a simplified equation, inspired by the approaches proposed by Strubell et al. [1] and Schwartz et al. [2], which expresses energy consumption E (in Wh) as follows:
where is the base power of a machine (approximately 45 W), is the power consumed by the processor as a function of the load (0.02 W/%CPU), and is the power associated with RAM usage (0.372 W/GB) [53].
The results obtained are summarized in Table 8, which shows, for each library, the average energy consumption per process and the equivalent CO2 emissions (using a conversion factor of 0.4 kg CO2/kWh, as recommended by ADEME [54]).

Table 8.
Estimated energy consumption and equivalent annual CO2 emissions by library.
Applying this model highlights some notable differences: Polars Lazy, thanks to its optimized architecture and deferred execution, reduces the energy consumption by nearly 80% compared to Pandas when processing large datasets. In a realistic scenario (daily processing of an 8 GB file), this represents an annual saving of around 8 to 12 kg CO2 per computing station, a gain that becomes significant at a data center scale. To evaluate the robustness of these findings, it is essential to analyze their sensitivity to the model’s parameters. The most influential parameter is the base power, , as its contribution to the total energy is directly proportional to the execution time T. Consequently, any variation in more significantly affects slower libraries like Pandas. An increase in this constant would therefore amplify the observed performance gap, reinforcing our conclusions. The influence of the dynamic coefficients, and , is more constrained. The least performant libraries in our tests exhibit a combination of longer execution times and higher resource consumption (CPU and RAM). Thus, even a substantial change in these weights would be highly unlikely to offset the fundamental performance deficit and alter the final ranking. In summary, while the absolute CO2 values are dependent on the chosen hardware constants, the relative ranking of the libraries, and the conclusion that Polars Lazy offers the highest energy savings, is robust to reasonable changes in the power model parameters.
Beyond the purely technological aspect, these results confirm that the choice of data processing library has a direct and measurable impact on the environmental footprint of a data science pipeline. Pooling such gains on a large scale, in the cloud or in industry, contributes to the overall reduction of emissions and is fully in line with the green AI dynamic [52].
5.4. Summary of Findings and Practical Usage Guidelines
At the end of this comparative analysis, several key conclusions can be drawn about the performance of the libraries studied in terms of large-scale data processing.
- Polars Lazy stands out as the best-performing library for large datasets (≥1000 MB). Its architecture is based on lazy evaluation, native vectorization with Apache Arrow, and a Rust-based multithread scheduler that yields an average reduction in execution time of 76% and a memory footprint of 82% compared to Pandas, while efficiently utilizing all eight vCPUs (up to 421% CPU load).
- Polars Eager is a relevant intermediate alternative, retaining vectorization benefits without deferred execution. It achieves a 61 % time saving and a nearly 75 % memory reduction versus Pandas, with a minimal impact on code readability.
- Pandas remains suitable for exploration or prototyping on small volumes (≤500 MB), thanks to its ease of use and ubiquity. However, its single-threaded GIL-bound execution and unoptimized memory management lead to resource saturation (over 6.8 GB) and long runtimes (>90 s) on larger datasets.
- PySpark, designed for distributed processing, shows average performance on a single node due to the JVM and Python–JVM serialization overheads. Its true advantage appears in multinode cluster environments.
It is worth contextualizing these findings within other published benchmarks. Our results diverge from some studies, like the one referenced in our work [32], which concludes that PySpark is the “clear winner” on a single multicore machine. In contrast, our study unambiguously identifies Polars Lazy as the most efficient solution in our specific context. This difference stems primarily from the workload type. Unlike benchmarks that often test isolated and generic operations, our study evaluates the performance on an end-to-end, multistep pipeline with complex, custom functions (e.g., add_co2_MC). In such a scenario, the holistic query optimization of Polars Lazy, which analyzes and fuses the entire chain of commands, proves decisive. In contrast, the architectural overhead of PySpark, which was discussed previously, becomes a cumulative bottleneck when chaining multiple distinct operations on a single node. It is also possible that our specific single-node configuration for PySpark was not optimally tuned to mitigate these effects. This highlights a crucial point: while general benchmarks provide a baseline, evaluating libraries within a specific, application-driven context is essential in making informed architectural choices.
This study demonstrates that the choice of library must align not only with the data volume but also with the available hardware. A well-chosen library can significantly optimize performance and reduce environmental impacts. Table 9 below summarizes the usage recommendations according to the project context.

Table 9.
Usage recommendations according to project context.
6. Conclusions and Perspectives
This work aligns with the principles of responsible data science, where reducing the carbon footprints of digital technologies is regarded as a goal that is as critical as algorithmic performance optimization. Through the development of GreenNav, we demonstrate that it is possible to design a system for the prediction and optimization of CO2 emissions that balances model accuracy with the need to limit computing resource consumption.
Our experimental findings underscore the importance of tool selection in large-scale data processing pipelines. The comparative evaluation of Pandas, Polars (Eager and Lazy modes), and PySpark showed that, in a single-node environment representative of a standard cloud infrastructure deployment, Polars Lazy delivers the best trade-off: it significantly reduced the processing time, with minimal memory usage and strong energy efficiency, while optimally leveraging hardware-level parallelism. In contrast, Pandas remains suitable for small-scale datasets or rapid prototyping phases, and PySpark, despite its intrinsic scalability, only reaches full efficiency in distributed multinode environments.
From an application standpoint, GreenNav successfully validated the integration of a complete pipeline, from multisource data acquisition to predictive inference across each road segment of the Parisian network. The combination of a hybrid CNN-LSTM model with optimized preprocessing techniques enables the fine-grained estimation of emissions while controlling the environmental impact of the entire workflow.
This work also opens up several avenues for future research: integrating Polars Streaming for real-time processing; adapting the pipeline to multinode architectures using recent versions of PySpark; and assessing the impact of upcoming changes in the Python ecosystem (e.g., GIL removal, new parallelization interfaces) on overall pipeline performance.
Finally, while our study intentionally focused on CPU-oriented libraries in a single-node computing environment, extending our analysis to other execution contexts would be highly relevant. Therefore, future work will replicate our experimental protocol with GPU-based libraries (e.g., RAPIDS/cuDF), as well as distributed or memory-mapped frameworks (e.g., Dask and Vaex), to provide a more comprehensive understanding of the trade-offs between computational performance and energy consumption across diverse hardware settings.
In conclusion, this study illustrates how artificial intelligence, environmental performance, and sustainable urban planning can be meaningfully combined. The proposed approach may be adapted to other cities and challenges, contributing to the emergence of ecological and responsible digital solutions for the urban mobility systems of tomorrow.
Author Contributions
Conceptualization, Y.M.; methodology, Y.M.; software, Y.M.; validation, Y.M. and M.L.; formal analysis, Y.M.; investigation, Y.M.; resources, Y.M.; data curation, Y.M.; writing—original draft preparation, Y.M.; writing—review and editing, M.L. and M.K.; visualization, Y.M.; supervision, M.L. and M.K.; project administration, Y.M.; funding acquisition, Y.M. All authors have read and agreed to the published version of the manuscript.
Funding
This research received no external funding.
Data Availability Statement
The traffic count data used in this study are openly available from the Paris Open Data portal at https://opendata.paris.fr/explore/dataset/comptages-routiers-permanents/information/?disjunctive.libelle&disjunctive.libelle_nd_amont&disjunctive.libelle_nd_aval&disjunctive.etat_trafic (accessed on 1 July 2025).
Conflicts of Interest
The authors declare no conflicts of interest.
References
- IEA (International Energy Agency). Data and Statistics: “CO2 Emissions by Sector, World 1990–2019”. Available online: https://www.iea.org/data-and-statistics/databrowser?country=WORLD&fuel=CO2%20emissions&indicator=CO2BySector (accessed on 10 February 2023).
- Musa, A.A.; Malami, S.I.; Alanazi, F.; Ounaies, W.; Alshammari, M.; Haruna, S.I. Sustainable Traffic Management for Smart Cities Using Internet-of-Things-Oriented Intelligent Transportation Systems (ITS): Challenges and Recommendations. Sustainability 2023, 15, 9859. [Google Scholar] [CrossRef]
- Kim, M.; Schrader, M.; Yoon, H.-S.; Bittle, J.A. Optimal Traffic Signal Control Using Priority Metric Based on Real-Time Measured Traffic Information. Sustainability 2023, 15, 7637. [Google Scholar] [CrossRef]
- Shaygan, M.; Meese, C.; Li, W.; Zhao, X. Traffic prediction using artificial intelligence: Review of recent advances and emerging opportunities. Transp. Res. Part C Emerg. Technol. 2022, 145, 103921. [Google Scholar] [CrossRef]
- Różycki, R.; Solarska, D.A.; Waligóra, G. Energy-Aware Machine Learning Models—A Review of Recent Techniques and Perspectives. Energies 2025, 18, 2810. [Google Scholar] [CrossRef]
- Sánchez-Mompó, A.; Mavromatis, I.; Li, P.; Katsaros, K.; Khan, A. Green MLOps to Green GenOps: An Empirical Study of Energy Consumption in Discriminative and Generative AI Operations. Information 2025, 16, 281. [Google Scholar] [CrossRef]
- Patterson, D.; Black, J.; Grover, A.; Leahy, K.; Liang, P.; Liu, B.; Pistilli, M.; Tissier, N. Carbon Emissions and Large Neural Network Training. arXiv 2021. [Google Scholar] [CrossRef]
- Greenly. Empreinte Carbone D’une Voiture Thermique: Fabrication, Usage et Fin de Vie. 2023. Available online: https://greenly.earth/blog/secteurs/empreinte-carbone-voiture-thermique (accessed on 1 July 2025).
- Strubell, E.; Ganesh, A.; McCallum, A. Energy and Policy Considerations for Deep Learning in NLP. In Proceedings of the 57th Annual Meeting of the Association for Computational Linguistics, Florence, Italy, 28 July–2 August 2019; pp. 3645–3650. [Google Scholar] [CrossRef]
- Yarally, T.; Cruz, L.; Feitosa, D.; Sallou, J.; van Deursen, A. Uncovering Energy-Efficient Practices in Deep Learning Training: Preliminary Steps Towards Green AI. In Proceedings of the 2023 IEEE/ACM 2nd International Conference on AI Engineering–Software Engineering for AI (CAIN), Melbourne, Australia, 15–16 May 2023; pp. 25–36. Available online: https://www.computer.org/csdl/proceedings-article/cain/2023/011300a025/1OvtrisvBDO (accessed on 31 July 2025).
- Mekouar, Y.; Saleh, I.; Karim, M. GreenNav: Spatiotemporal Prediction of CO2 Emissions in Paris Road Traffic Using a Hybrid CNN-LSTM Model. Network 2025, 5, 2. [Google Scholar] [CrossRef]
- McKinney, W. pandas: A Foundational Python Library for Data Analysis and Statistics. Python High Perform. Sci. Comput. 2011, 14, 1–9. [Google Scholar]
- Bandi, R.; Amudhavel, J.; Karthik, R. Machine Learning with PySpark—Review. Indones. J. Electr. Eng. Comput. Sci. 2018, 12, 102–106. [Google Scholar] [CrossRef]
- Foxcroft, J.; Antonie, L. Using Polars to Improve String Similarity Performance in Python. Int. J. Popul. Data Sci. 2024, 9. [Google Scholar] [CrossRef]
- Saha, B. Green Computing. Int. J. Comput. Trends Technol. (IJCTT) 2014, 14, 46–51. [Google Scholar] [CrossRef]
- Saha, B. Green Computing: Current Research Trends. Int. J. Comput. Sci. Eng. (IJCSE) 2018, 6, 467–473. Available online: http://www.ijcseonline.org (accessed on 1 July 2025). [CrossRef]
- Paul, S.G.; Mishra, D.; Pal, S. A Comprehensive Review of Green Computing: Past, Present, and Future Research. IEEE Access 2023, 11, 87445–87494. [Google Scholar] [CrossRef]
- Zhou, Y.; Lin, X.; Zhang, X.; Wang, M.; Jiang, G.; Lu, H.; Wu, Y.; Zhang, K.; Yang, Z.; Wang, K.; et al. On the Opportunities of Green Computing: A Survey. arXiv 2023. arXiv:2311.00447. [Google Scholar] [CrossRef]
- Lin, X.; Wang, Y.; Pedram, M. A Reinforcement Learning-Based Power Management Framework for Green Computing Data Centers. In Proceedings of the 2016 IEEE International Conference on Cloud Engineering (IC2E), Berlin, Germany, 4–8 April 2016; pp. 135–138. [Google Scholar] [CrossRef]
- Vanthana, N. Green Computing. Int. J. Eng. Res. Technol. (IJERT) 2018, 6. ISSN 2278-0181. Available online: https://www.ijert.org/green-computing-4 (accessed on 1 July 2025).
- Zhou, S.; Wei, C.; Song, C.; Fu, Y.; Luo, R.; Chang, W.; Yang, L. A Hybrid Deep Learning Model for Short-Term Traffic Flow Prediction Considering Spatiotemporal Features. Sustainability 2022, 14, 10039. [Google Scholar] [CrossRef]
- Biswas, S.; Wardat, M.; Rajan, H. The Art and Practice of Data Science Pipelines: A Comprehensive Study of Data Science Pipelines in Theory, in-the-Small, and in-the-Large. In Proceedings of the 44th International Conference on Software Engineering, Pittsburgh, PA, USA, 21–29 May 2022; pp. 2091–2103. [Google Scholar] [CrossRef]
- Stančin, I.; Jović, A. An Overview and Comparison of Free Python Libraries for Data Mining and Big Data Analysis. In Proceedings of the 2019 42nd International Convention on Information and Communication Technology, Electronics and Microelectronics (MIPRO), Opatija, Croatia, 20–24 May 2019; pp. 977–982. [Google Scholar] [CrossRef]
- Harris, C.R.; Millman, K.J.; Van Der Walt, S.J.; Gommers, R.; Virtanen, P.; Cournapeau, D.; Wieser, E.; Taylor, J.; Berg, S.; Smith, N.J.; et al. Array Programming with NumPy. Nature 2020, 585, 357–362. [Google Scholar] [CrossRef]
- Virtanen, P.; Gommers, R.; Oliphant, T.E.; Haberl, M.; Reddy, T.; Cournapeau, D.; Burovski, E.; Peterson, P.; Weckesser, W.; Bright, J.; et al. SciPy 1.0: Fundamental Algorithms for Scientific Computing in Python. Nat. Methods 2020, 17, 261–272. [Google Scholar] [CrossRef]
- Devin, G.D.L. Several Methods for Efficiently Handling Large Datasets in Pandas. Medium, 21 June 2024. Available online: https://medium.com/@tubelwj/several-methods-for-efficiently-handling-large-datasets-in-pandas-b37e4db8256a (accessed on 1 July 2025).
- Databricks. What Is PySpark? Available online: https://www.databricks.com/glossary/pyspark (accessed on 1 July 2025).
- Polars Developers. Polars: DataFrames for the New Era. Available online: https://pola.rs/ (accessed on 1 July 2025).
- Hunter, J.D. Matplotlib: A 2D Graphics Environment. Comput. Sci. Eng. 2007, 9, 90–95. [Google Scholar] [CrossRef]
- Waskom, M.L. Seaborn: Statistical Data Visualization. J. Open Source Softw. 2021, 6, 3021. [Google Scholar] [CrossRef]
- Van Der Donckt, J.; Van der Donckt, J.; Deprost, E.; Van Hoecke, S. Plotly-Resampler: Effective Visual Analytics for Large Time Series. In Proceedings of the 2022 IEEE Visualization and Visual Analytics (VIS), Oklahoma City, OK, USA, 16–21 October 2022; pp. 21–25. [Google Scholar] [CrossRef]
- Corcuera Platas, N. Pandas-Polars-PySpark-BenchMark [GitHub Repository]. 2024. Available online: https://github.com/NachoCP/Pandas-Polars-PySpark-BenchMark (accessed on 1 July 2025).
- Chua, C. Sample Sales Data (5 Million Transactions) [Data Set]. Kaggle. Available online: https://www.kaggle.com/datasets/weitat/sample-sales (accessed on 11 June 2025).
- Mekouar, Y.; Saleh, I.; Karim, M. Integration of Data Acquisition and Modeling for Ecological Simulation of CO2 Emissions in Urban Traffic: The Case of the City of Paris. In Proceedings of the 2024 International Conference on Computer and Applications (ICCA), Cairo, Egypt, 17–19 December 2024; pp. 1–7. [Google Scholar] [CrossRef]
- Mekouar, Y.; Karim, M. Analyse et visualisation des données du trafic routier—Une carte interactive pour comprendre l’évolution et la répartition du taux d’émission de CO2 dans la ville de Paris. In La Fabrique du Sens à L’ère de L’information Numérique: Enjeux et Défis; ISTE Editions: London, UK, 2023; p. 99. ISBN 9781784059835/9781784069834. [Google Scholar]
- Kim, T.; Jeong, Y.; Jang, M.; Lee, J.-G. FusionFlow: Accelerating Data Preprocessing for Machine Learning with CPU-GPU Cooperation. Proc. VLDB Endow. 2024, 17, 863–876. [Google Scholar] [CrossRef]
- Mozzillo, A.; Zecchini, L.; Gagliardelli, L.; Aslam, A.; Bergamaschi, S.; Simonini, G. Evaluation of Dataframe Libraries for Data Preparation on a Single Machine. In Proceedings of the 28th International Conference on Extending Database Technology (EDBT 2025), Barcelona, Spain, 25–28 March 2025; pp. 337–348. [Google Scholar] [CrossRef]
- Raschka, S.; Patterson, J.; Nolet, C. Machine Learning in Python: Main Developments and Technology Trends in Data Science, Machine Learning, and Artificial Intelligence. Information 2020, 11, 193. [Google Scholar] [CrossRef]
- Lee, S.; Park, S. Performance Analysis of Big Data ETL Process over CPU-GPU Heterogeneous Architectures. In Proceedings of the 2021 IEEE 37th International Conference on Data Engineering Workshops (ICDEW), Chania, Greece, 19–22 April 2021; pp. 42–47. [Google Scholar] [CrossRef]
- Zhu, Y.; Jiang, W.; Alonso, G. Efficient Tabular Data Preprocessing of ML Pipelines (Piper). arXiv 2024, arXiv:2409.14912. [Google Scholar] [CrossRef]
- Bolón-Canedo, V.; Morán-Fernández, L.; Cancela, B.; Alonso-Betanzos, A. A Review of Green Artificial Intelligence: Towards a More Sustainable Future. Neurocomputing 2024, 599, 128096. [Google Scholar] [CrossRef]
- Ville de Paris-Direction de la Transition Écologique et du Climat. Inventaire des Émissions de Gaz à Effet de Serre (GES) du Territoire Parisien [Dataset]. Paris Open Data, 2023. Available online: https://opendata.paris.fr/explore/dataset/inventaire-des-emissions-de-gaz-a-effet-de-serre-du-territoire/information/ (accessed on 1 July 2025).
- Qi, J.; Su, C.; Guo, Z.; Wu, L.; Shen, Z.; Fu, L.; Wang, X.; Zhou, C. Enhancing SPARQL Query Generation for Knowledge Base Question Answering Systems by Learning to Correct Triplets. Appl. Sci. 2024, 14, 1521. [Google Scholar] [CrossRef]
- Maguire, Y. Google Maps Platform: 3 New APIs to Monitor Environmental Conditions. Google Blog, 2023. Available online: https://blog.google/products/maps/google-maps-apis-environment-sustainability/ (accessed on 1 October 2024).
- Airparif. Baromètre Airparif (Indicateur ATMO). Paris Data, 2023. Available online: https://opendata.paris.fr/explore/dataset/barometre_aiparif_2021v2/ (accessed on 1 October 2024).
- Ambee Data API. Ambee: Real-Time Environmental Data API Documentation. Available online: https://docs.ambeedata.com (accessed on 13 December 2024).
- Impact CO2. Outils de Calcul des Émissions de CO2 pour le Transport. Available online: https://impactco2.fr/outils/transport (accessed on 13 December 2024).
- He, K.; Zhang, X.; Ren, S.; Sun, J. Deep Residual Learning for Image Recognition. In Proceedings of the IEEE Conference on Computer Vision and Pattern Recognition (CVPR), Las Vegas, NV, USA, 27–30 June 2016; pp. 770–778. [Google Scholar]
- Madziel, M.; Jaworski, A.; Kuszewski, H.; Woś, P.; Campisi, T.; Lew, K. The Development of CO2 Instantaneous Emission Model of Full Hybrid Vehicle with the Use of Machine Learning Techniques. Energies 2021, 15, 142. [Google Scholar] [CrossRef]
- Greff, K.; Srivastava, R.K.; Koutník, J.; Steunebrink, B.R.; Schmidhuber, J. LSTM: A Search Space Odyssey. IEEE Trans. Neural Netw. Learn. Syst. 2017, 28, 2222–2232. [Google Scholar] [CrossRef] [PubMed]
- Xayasouk, T.; Lee, H.; Lee, G. Air Pollution Prediction Using Long Short-Term Memory (LSTM) and Deep Autoencoder (DAE) Models. Sustainability 2020, 12, 2570. [Google Scholar] [CrossRef]
- Schwartz, R.; Dodge, J.; Smith, N.A.; Etzioni, O. Green AI. Commun. ACM 2020, 63, 54–63. [Google Scholar] [CrossRef]
- van de Voort, T.; Zavrel, V.; Torrens Galdiz, J.I.; Hensen, J.L.M. Analysis of Performance Metrics for Data Center Efficiency—Should the Power Utilization Effectiveness (PUE) Still Be Used as the Main Indicator? Part 1. REHVA J. 2017, 54. Available online: https://www.rehva.eu/rehva-journal/chapter/analysis-of-performance-metrics-for-data-center-efficiency-should-the-power-utilization-effectiveness-pue-still-be-used-as-the-main-indicator-part-1 (accessed on 1 July 2025).
- Aiouch, Y.; Chanoine, A.; Corbet, L.; Drapeau, P.; Ollion, L.; Vigneron, V.; Vateau, C.; Lees Perasso, E.; Orgelet, J.; Bordage, F.; et al. Évaluation de L’impact Environnemental du Numérique en France et Analyse Prospective, État des Lieux et Pistes D’actions; ADEME et ARCEP: Paris, France, 2022; 179p, Available online: https://www.arcep.fr/actualites/les-publications (accessed on 10 June 2025).
Disclaimer/Publisher’s Note: The statements, opinions and data contained in all publications are solely those of the individual author(s) and contributor(s) and not of MDPI and/or the editor(s). MDPI and/or the editor(s) disclaim responsibility for any injury to people or property resulting from any ideas, methods, instructions or products referred to in the content. |
© 2025 by the authors. Licensee MDPI, Basel, Switzerland. This article is an open access article distributed under the terms and conditions of the Creative Commons Attribution (CC BY) license (https://creativecommons.org/licenses/by/4.0/).

