
User-Centered Design of a Computer Vision System for Monitoring PPE Compliance in Manufacturing


Abstract
1. Introduction
2. Related Work
2.1. Technologies Used with YOLO
2.2. Lean UX in Industrial Applications
2.3. Computer Vision in Industries
3. Methodology
3.1. Think
3.2. Make
3.3. Check
4. Results
4.1. Think
4.2. Make
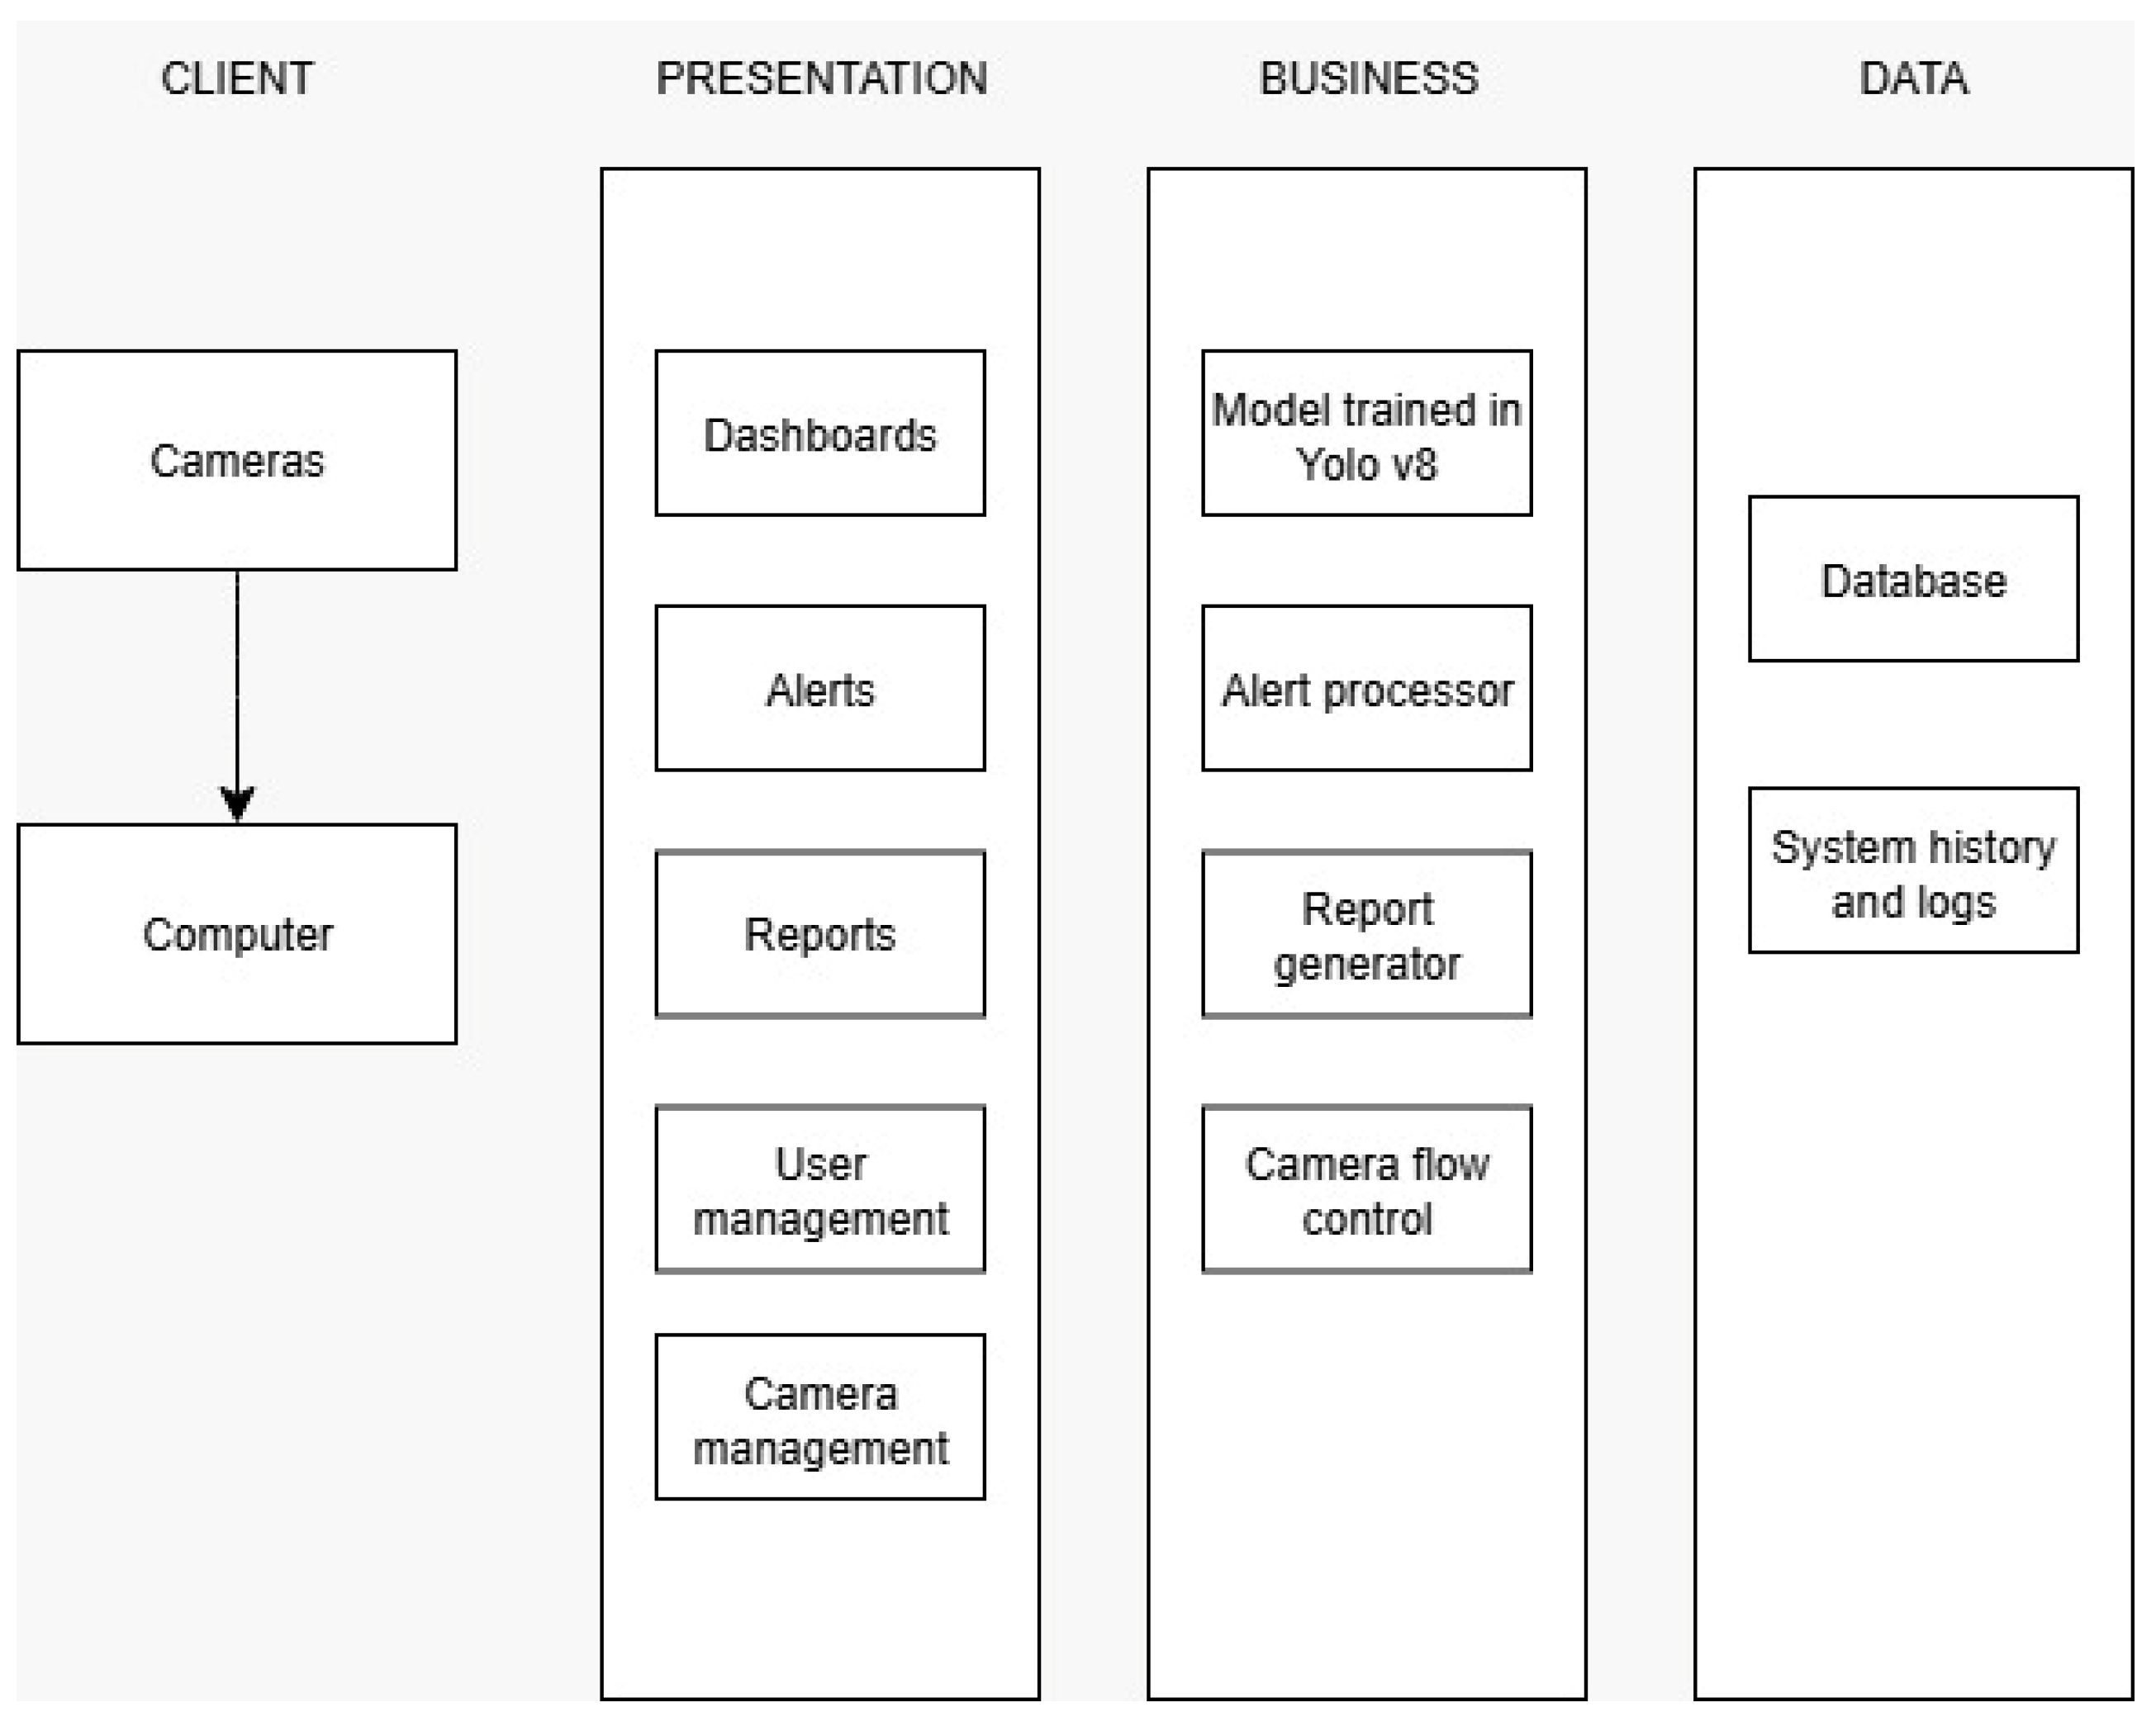
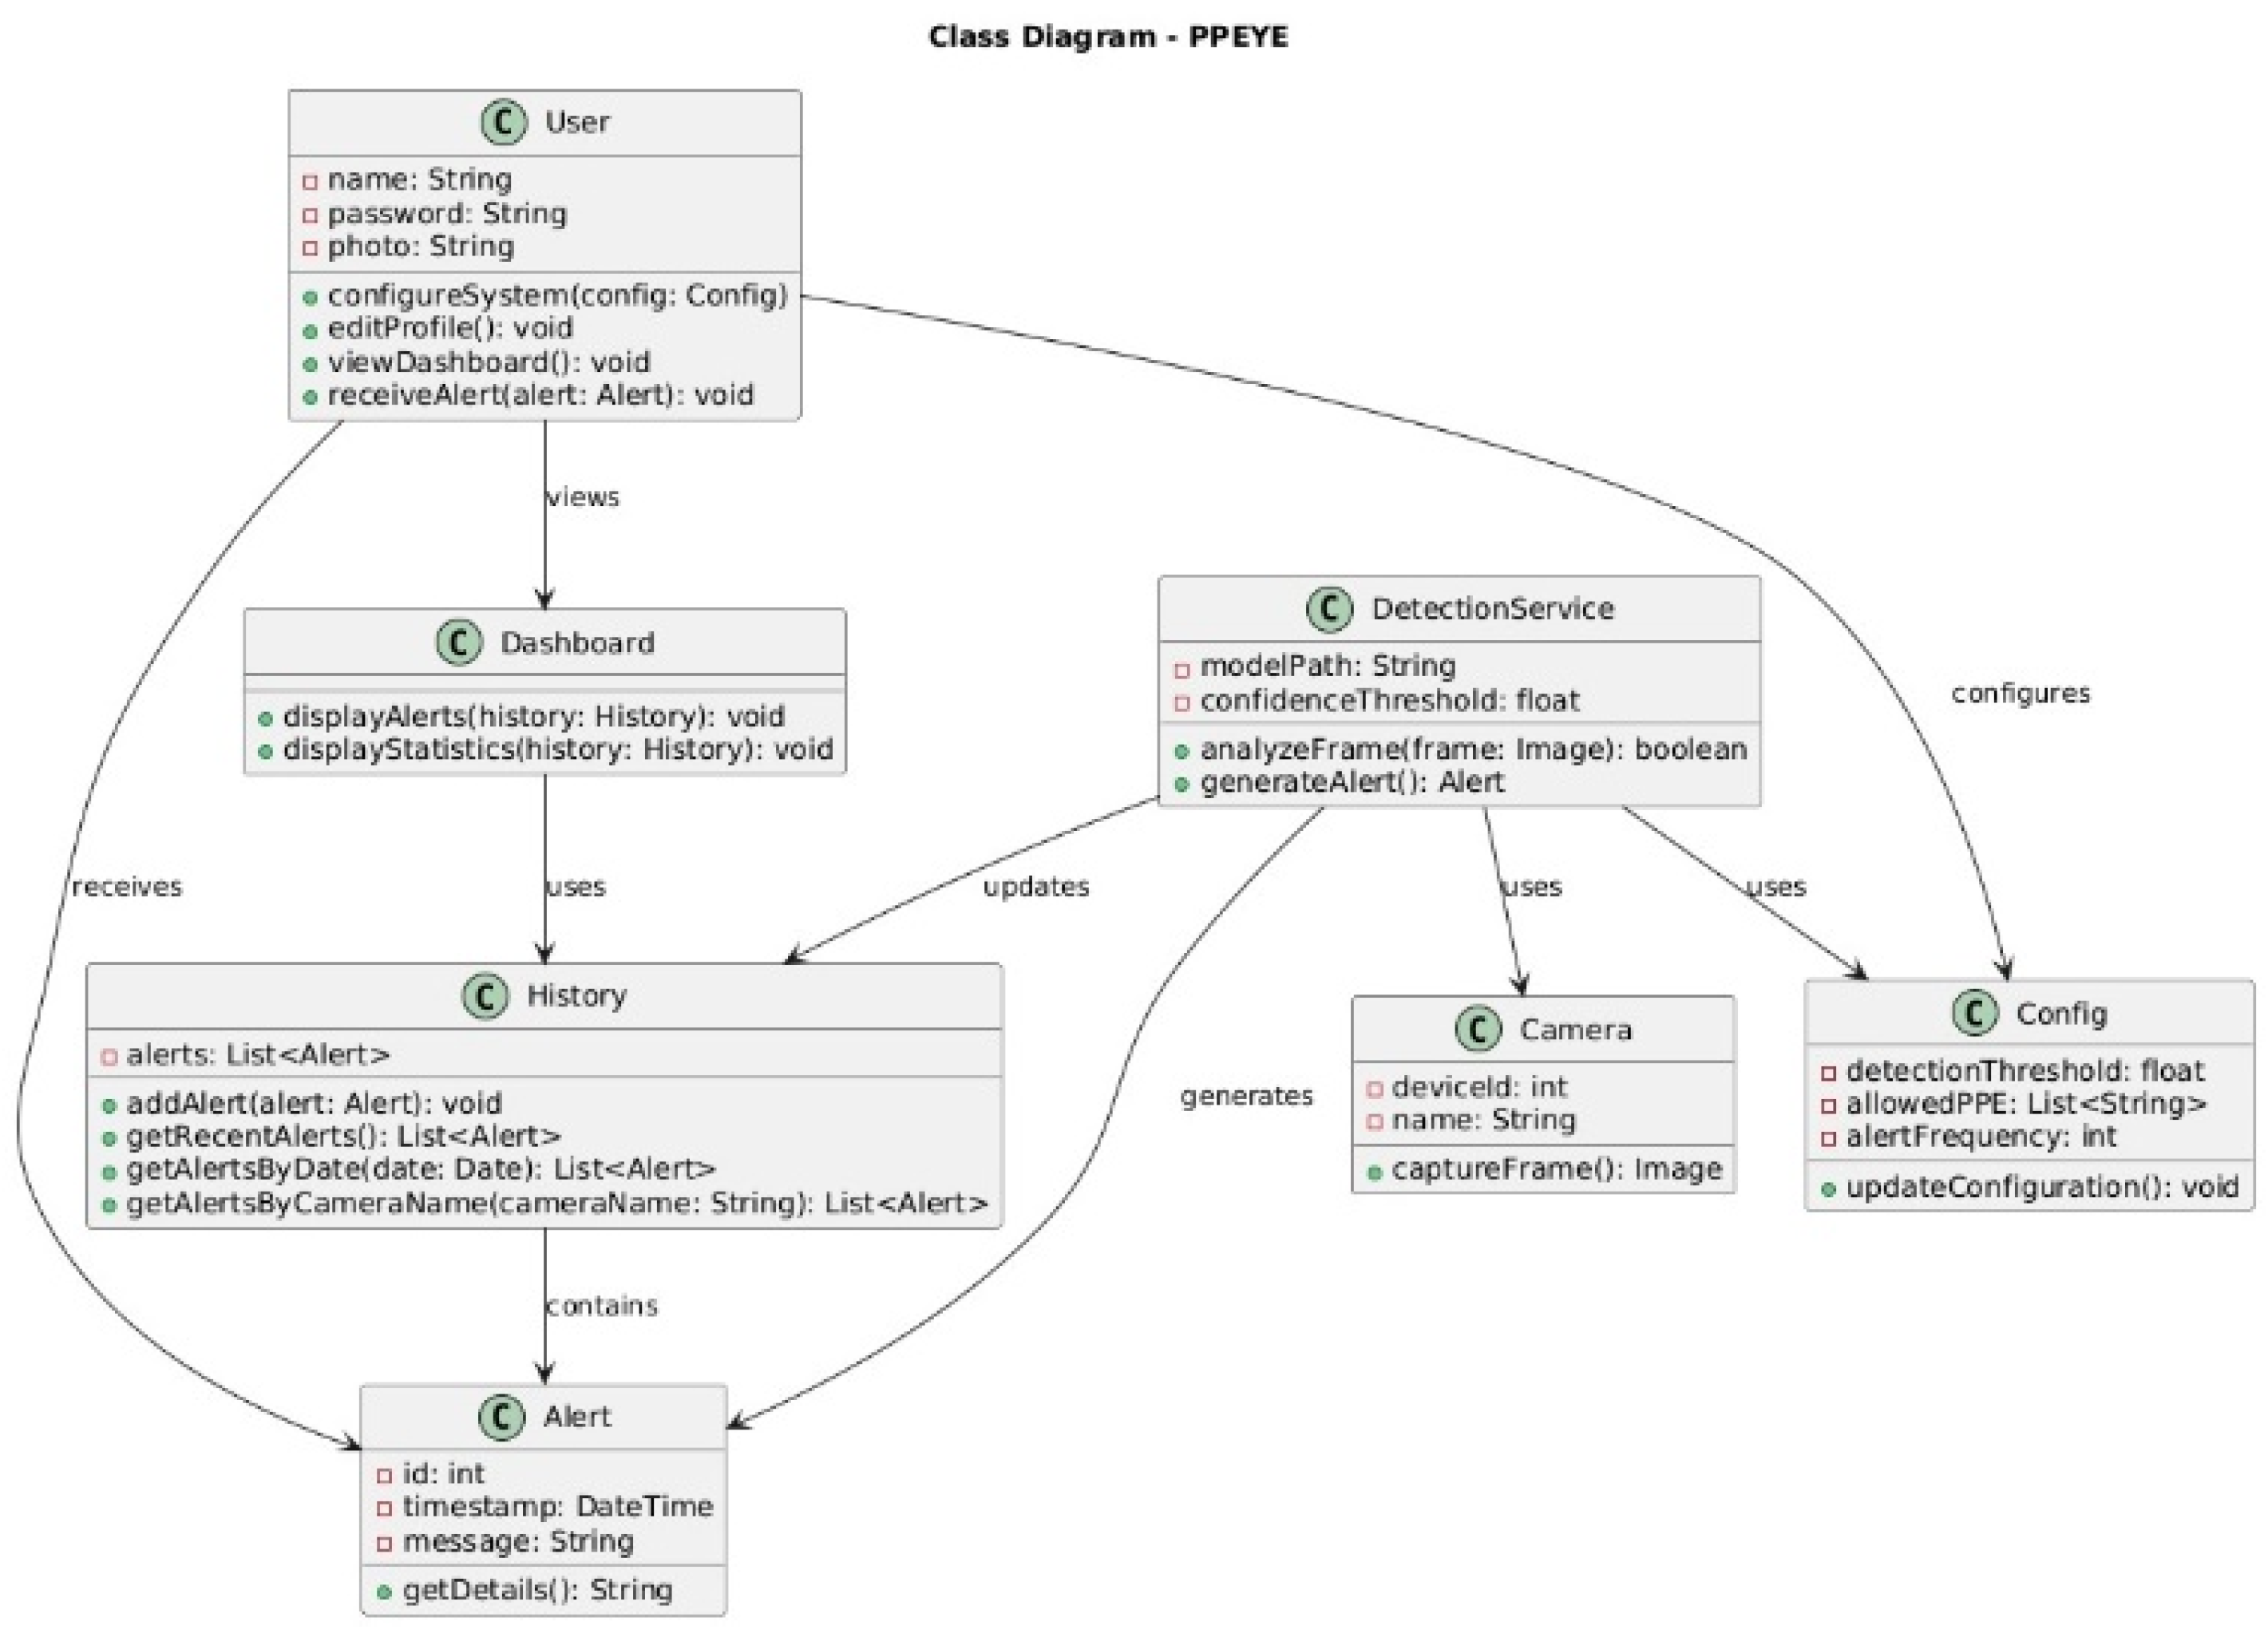
4.2.1. Architecture
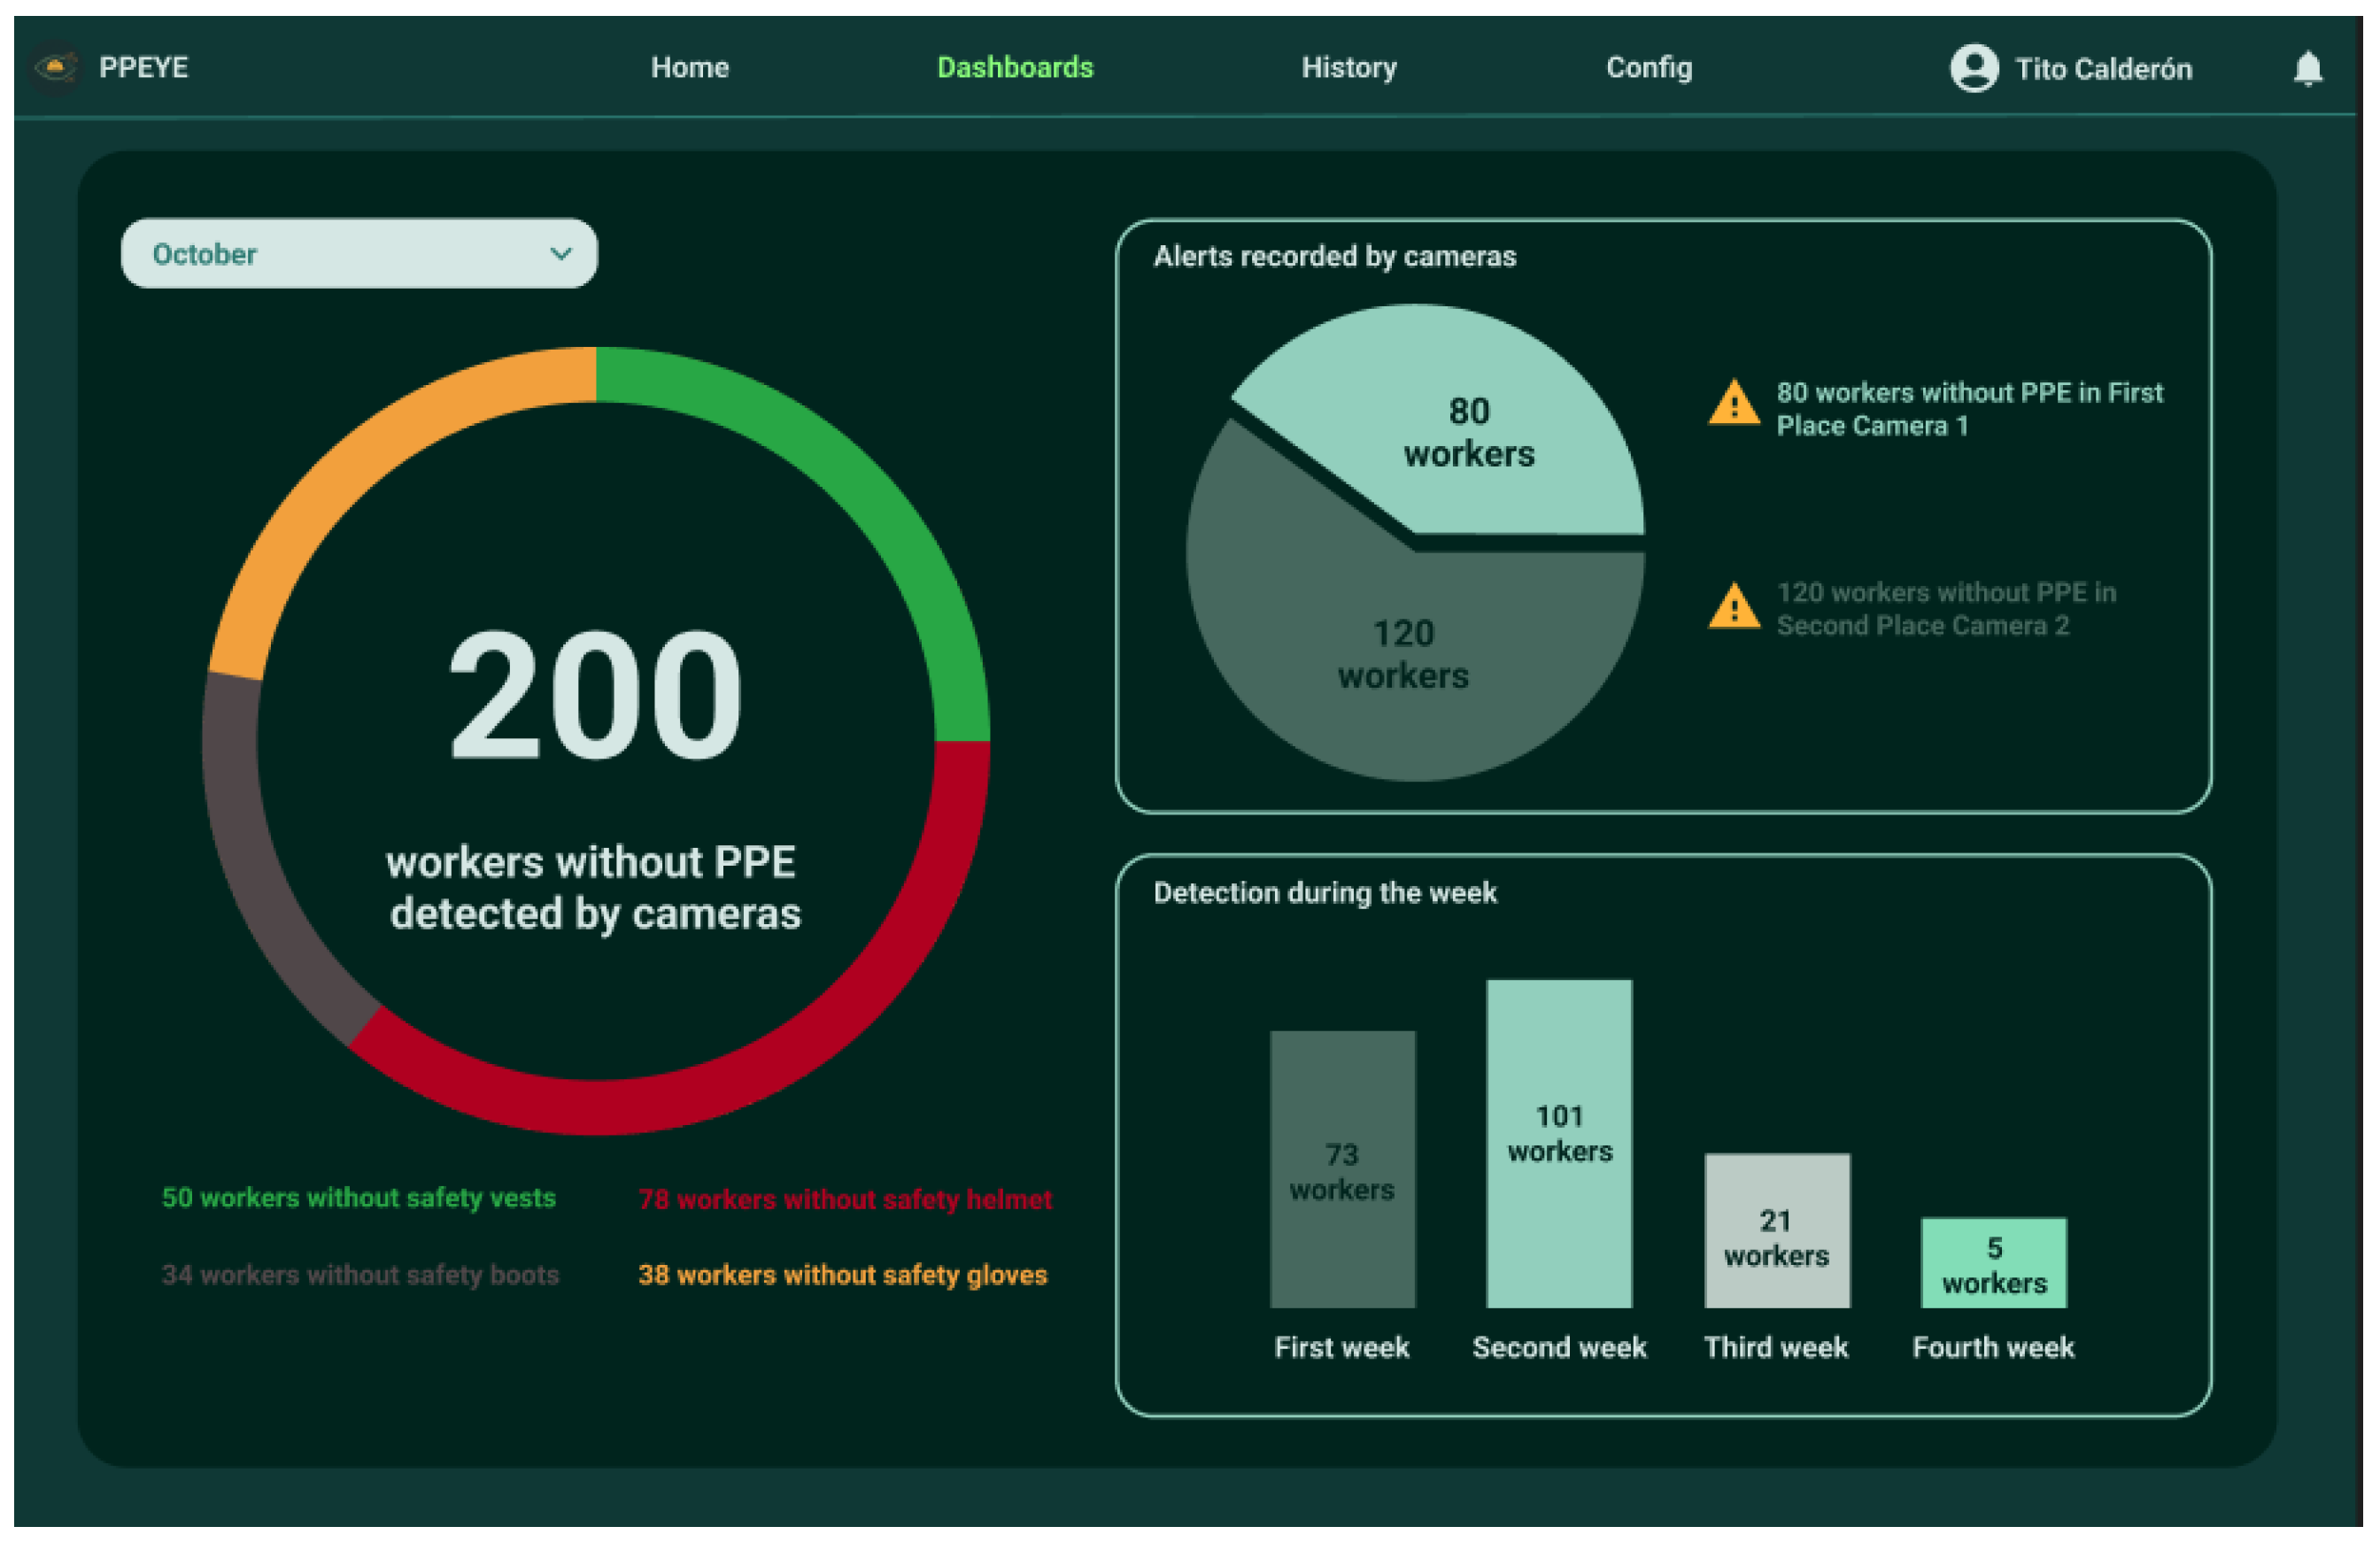
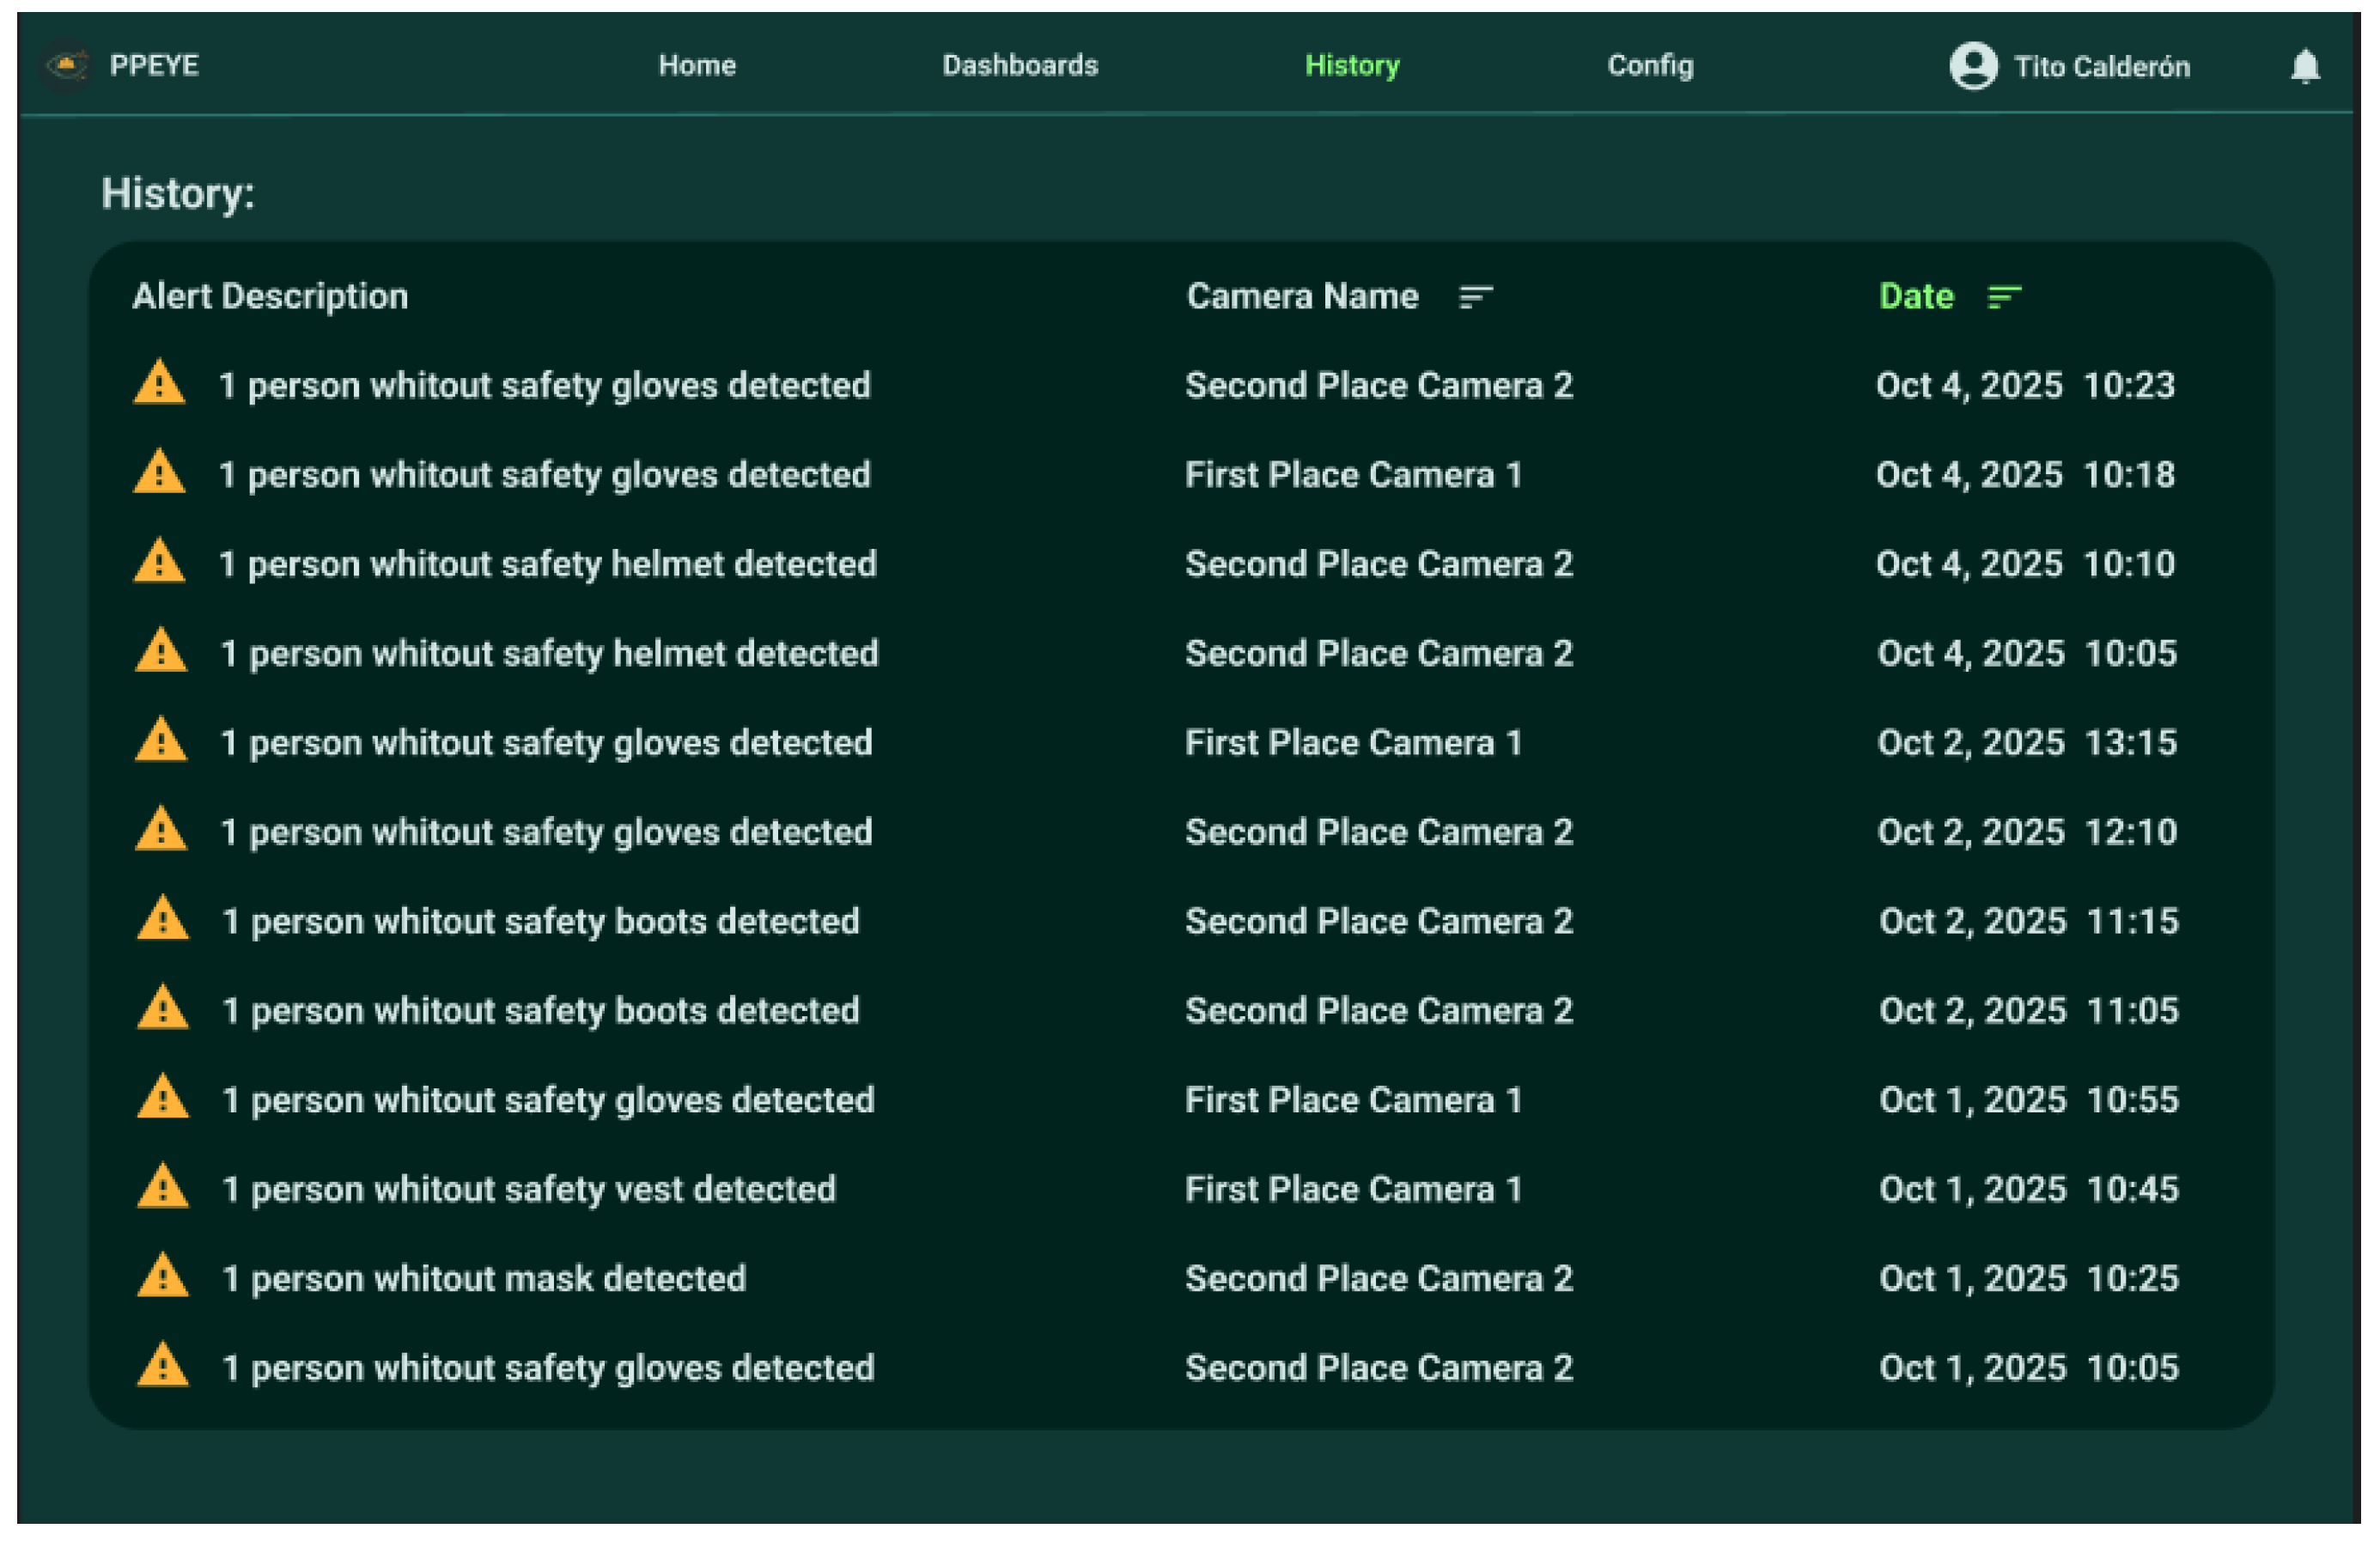
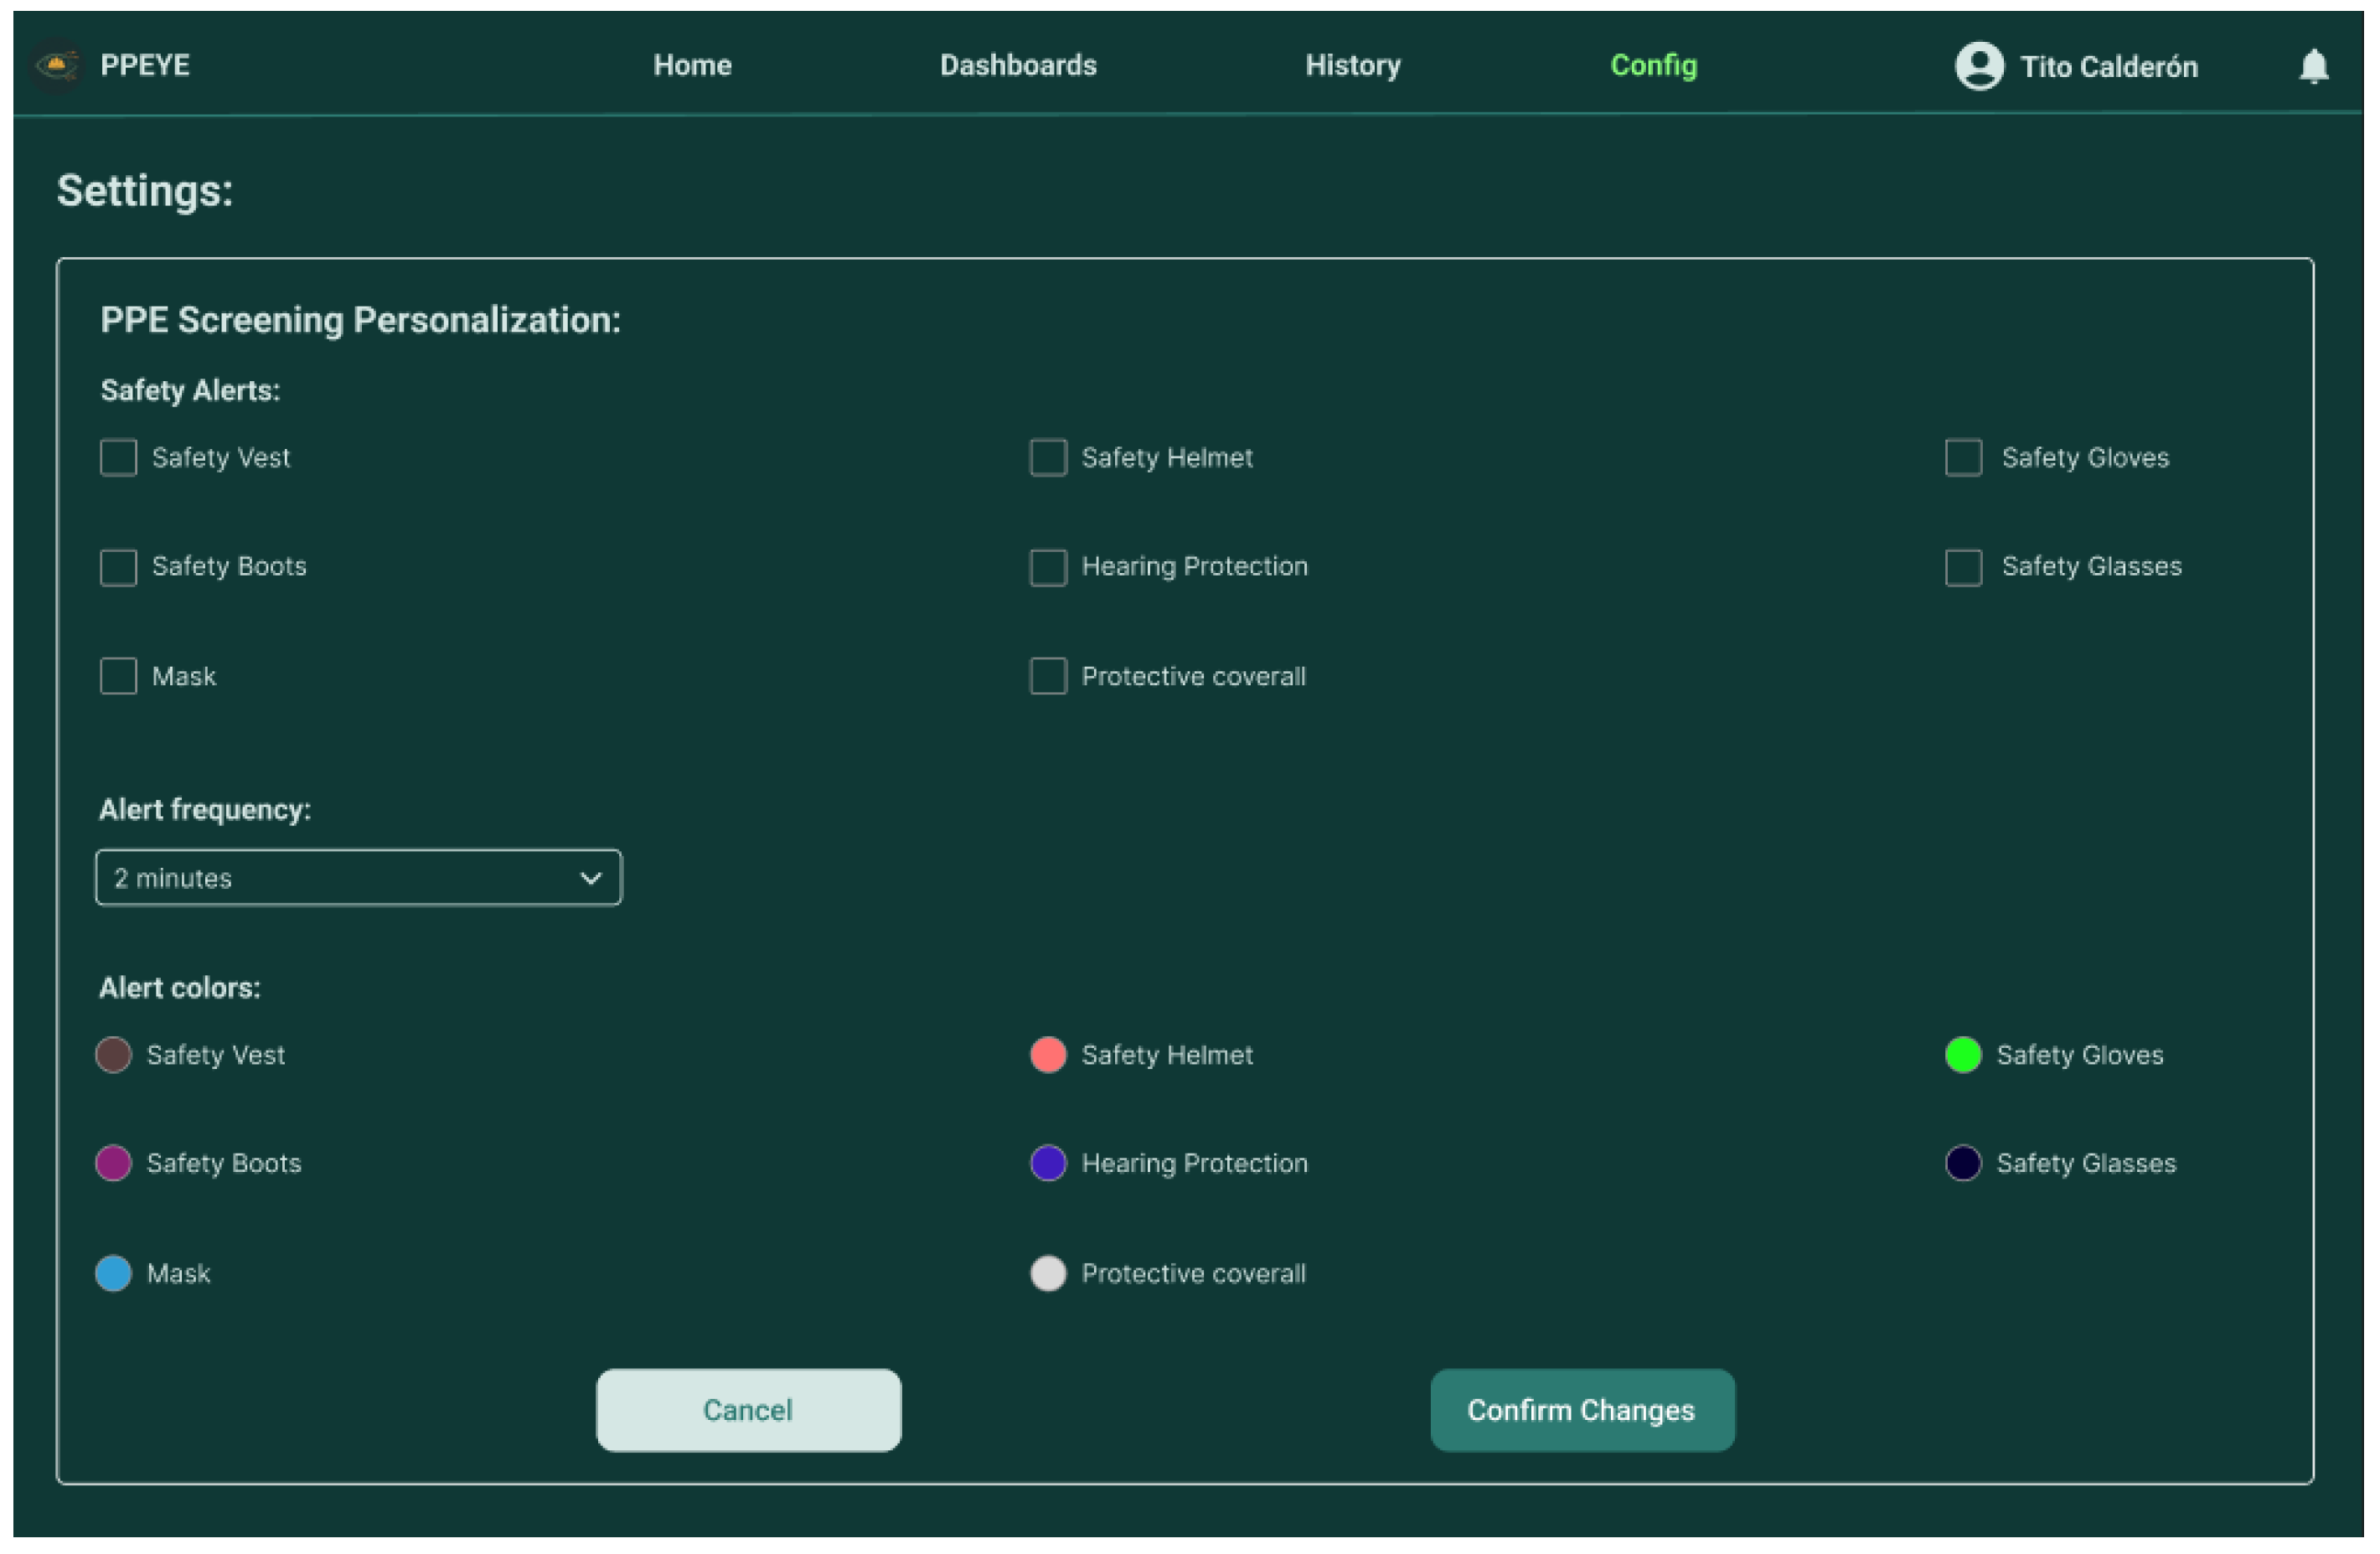
4.2.2. Prototypes
4.3. Check
5. Discussion
6. Conclusions
Author Contributions
Funding
Data Availability Statement
Acknowledgments
Conflicts of Interest
References
- Ahmed, M.I.B.; Saraireh, L.; Rahman, A.; Al-Qarawi, S.; Mhran, A.; Al-Jalaoud, J.; Al-Mudaifer, D.; Al-Haidar, F.; AlKhulaifi, D.; Youldash, M.; et al. Personal Protective Equipment Detection: A Deep-Learning-Based Sustainable Approach. Sustainability 2023, 15, 13990. [Google Scholar] [CrossRef]
- Lo, J.-H.; Lin, L.-K.; Hung, C.-C. Real-Time Personal Protective Equipment Compliance Detection Based on Deep Learning Algorithm. Sustainability 2022, 15, 391. [Google Scholar] [CrossRef]
- Pisu, A.; Elia, N.; Pompianu, L.; Barchi, F.; Acquaviva, A.; Carta, S. Enhancing Workplace Safety: A Flexible Approach for Personal Protective Equipment Monitoring. Expert Syst. Appl. 2024, 238, 122285. [Google Scholar] [CrossRef]
- Jin, Z.; Gambatese, J.; Karakhan, A.; Nnaji, C. Analysis of Prevention through Design Studies in Construction: A Subject Review. J. Safety Res. 2023, 84, 138–154. [Google Scholar] [CrossRef] [PubMed]
- Vukicevic, A.M.; Petrovic, M.; Milosevic, P.; Peulic, A.; Jovanovic, K.; Novakovic, A. A Systematic Review of Computer Vision-Based Personal Protective Equipment Compliance in Industry Practice: Advancements, Challenges and Future Directions. Artif. Intell. Rev. 2024, 57, 319. [Google Scholar] [CrossRef]
- Zhang, H.; Mu, C.; Ma, X.; Guo, X.; Hu, C. MEAG-YOLO: A Novel Approach for the Accurate Detection of Personal Protective Equipment in Substations. Appl. Sci. 2024, 14, 4766. [Google Scholar] [CrossRef]
- Rahmawati, S.D.; Prasetiyo, B. Application of Lean UX and System Usability Scale (SUS) Methods in Redesigning User Interface and User Experience on Adella Hospital Online Registration Website. J. Adv. Inf. Syst. Tech. 2025, 6, 200–218. [Google Scholar] [CrossRef]
- Yipeng, L.; Junwu, W. Personal Protective Equipment Detection for Construction Workers: A novel dataset and enhanced YOLOV5 approach. IEEE Access 2024, 12, 47338–47358. [Google Scholar] [CrossRef]
- Ahmad, H.M.; Rahimi, A. SH17: A Dataset for Human Safety and Personal Protective Equipment Detection in Manufacturing Industry. J. Saf. Sci. Resil. 2025, 6, 175–185. [Google Scholar] [CrossRef]
- Wang, J.; Qi, Z.; Wang, Y.; Liu, Y. A Lightweight Weed Detection Model for Cotton Fields Based on an Improved YOLOv8n. Sci. Rep. 2025, 15, 457. [Google Scholar] [CrossRef] [PubMed]
- Gupta, R.; Jansen, N.; Regnat, N.; Rumpe, B. Design Guidelines for Improving User Experience in Industrial Domain-Specific Modelling Languages. In Proceedings of the 25th International Conference on Model Driven Engineering Languages and Systems: Companion Proceedings, Montreal, QC, Canada, 23–28 October 2022; ACM: New York, NY, USA, 2022. [Google Scholar]
- Alhammad, M.M.; Moreno, A.M. Integrating User Experience into Agile: An Experience Report on Lean UX and Scrum. In Proceedings of the ACM/IEEE 44th International Conference on Software Engineering: Software Engineering Education and Training, Pittsburgh, PA, USA, 21–29 May 2022; ACM: New York, NY, USA, 2022. [Google Scholar]
- Islam, M.R.; Zamil, M.Z.H.; Rayed, M.E.; Kabir, M.M.; Mridha, M.F.; Nishimura, S.; Shin, J. Deep learning and computer vision techniques for enhanced quality control in manufacturing processes. IEEE Access 2024, 12, 121449–121479. [Google Scholar] [CrossRef]
- Cardona-Reyes, H.; Muñoz-Arteaga, J.; Villalba-Condori, K.; Barba-González, M.L. A Lean UX Process Model for Virtual Reality Environments Considering ADHD in Pupils at Elementary School in COVID-19 Contingency. Sensors 2021, 21, 3787. [Google Scholar] [CrossRef] [PubMed]
- Cornide-Reyes, H.; Duran, C.; Baltierra, S.; Silva-Aravena, F.; Morales, J. Improving UX in Digital Transformation Projects through Lean Principles. In Social Computing and Social Media; Springer Nature Switzerland: Cham, Switzerland, 2024; pp. 161–178. ISBN 9783031612800. [Google Scholar]
- Sam, J.; Richardson, C.G.; Currie, L.M. Application of Two-Eyed Seeing in Adolescent Mental Health to Bridge Design Thinking and Indigenous Collective Storytelling. Int. J. Environ. Res. Public Health 2022, 19, 14972. [Google Scholar] [CrossRef] [PubMed]
- Krog, J.; Akbas, C.; Nolte, B.; Vietor, T. Development of a Functional and Logical Reference System Architecture in Automotive Engineering. Systems 2025, 13, 141. [Google Scholar] [CrossRef]
- Brown, S. Software Architecture for Developers, 2nd ed.; Leanpub: Birmingham, UK, 2014. [Google Scholar]
- Bjarnason, E.; Lang, F.; Mjöberg, A. An Empirically Based Model of Software Prototyping: A Mapping Study and a Multi-Case Study. Empir. Softw. Eng. 2023, 28, 115. [Google Scholar] [CrossRef]
- Merritt, K.; Zhao, S. An Innovative Reflection Based on Critically Applying UX Design Principles. J. Open Innov. 2021, 7, 129. [Google Scholar] [CrossRef]
- Weichbroth, P. Usability Testing of Mobile Applications: A Methodological Framework. Appl. Sci. 2024, 14, 1792. [Google Scholar] [CrossRef]
- Nielsen, J. Usability Engineering; Academic Press: San Diego, CA, USA, 1993; pp. 71–114. [Google Scholar]
- Brooke, J. SUS: A ‘quick and dirty’ usability scale. In Usability Evaluation in Industry; Jordan, P.W., Thomas, B., Weerdmeester, B.A., McClelland, I.L., Eds.; Taylor & Francis: London, UK, 1996; pp. 189–194. [Google Scholar]
- Mondragón Bernal, I.F.; Lozano-Ramírez, N.E.; Puerto Cortés, J.M.; Valdivia, S.; Muñoz, R.; Aragón, J.; García, R.; Hernández, G. An Immersive Virtual Reality Training Game for Power Substations Evaluated in Terms of Usability and Engagement. Appl. Sci. 2022, 12, 711. [Google Scholar] [CrossRef]
- Tan, J.J.Y.; Ismail, M.N.; Md Fudzee, M.F.; Jofri, M.H.; Nordin, M.A.H. Development of Mobile Application for Enhancing Emotion Management for UTHM Students Using DASS-21. J. Adv. Res. Des. 2025, 129, 1–19. [Google Scholar] [CrossRef]


| Application | Method | Results | Lessons for Your Project |
|---|---|---|---|
| PPE detection | Clip2Safety (YOLO-World + GPT-4o) | 79.7% accuracy in attributes | Avoid cloud dependency |
| Follow-up | YOLOv8 + SAM | 95.61% MOTA in multi-chambers | Pre-processing techniques (e.g., histogram equalization) applicable to your system |
| Optimization | MEAG-YOLO (YOLOv8n) | 98.4% mAP in substations | Using lightweight modules (GhostConv) for CPUs |
| Criteria | Traditional Design | Lean UX + SUS |
|---|---|---|
| Iteration time | Slow | Fast |
| Design approach | Requirements based | User centered |
| Usability evaluation | Informal | SUS Scale |
| Adaptability to change | Low | High |
| Industrial Challenge | Traditional Solution | Limitations | Benefit |
|---|---|---|---|
| Real-time monitoring | Cameras + human supervisors | Costly, error prone | Cost reduction and increased reliability |
| Variable conditions | Random inspection | Limited coverage | Continuous detection without gaps |
| Regulatory compliance | Manual records | Risk of counterfeiting | Transparent audits |
| N° | Questions |
|---|---|
| 1 | I would like to use this system frequently. |
| 2 | The system is unnecessarily complex. |
| 3 | I found the system easy to use. |
| 4 | I think I would need the support of a technician to be able to use this system. |
| 5 | The various functions of the system are well integrated. |
| 6 | There is too much inconsistency in this system. |
| 7 | I think most people would learn to use this system very quickly. |
| 8 | I find the system very cumbersome to use. |
| 9 | I felt safe using the system. |
| 10 | I needed to learn a lot of things before I could use the system. |
| Assumptions | Hypotheses |
|---|---|
| The user needs to act quickly in critical situations. | If we design direct action flows with quick access and clear visual hierarchy, the user will be able to register events in an agile and efficient way. |
| The user works in multiple windows or tabs simultaneously. | If we offer a modular interface, we facilitate the simultaneous handling of tasks and the comparison of information in real time. |
| Technical information can be dense and complex. | If we structure the information with hierarchical design, intelligent filters, and clear visualization, we will reduce the user’s cognitive load. |
| The user expects to see evidence of recorded work quickly. | If we enable immediate uploading of images, files or logs from the browser, we will increase confidence in the system and reduce management times. |
| The user needs reports ready to communicate results. | If we implement automated exports and customizable dashboards, we will improve productivity and reporting capabilities. |
| Code | Title | Value (1/2/3/5/8) |
|---|---|---|
| US001 | Integrate Yolov8 for PPE detection | 8 |
| US002 | Integrate OpenCV for real-time capture | 5 |
| US003 | Train a model for PPE detection | 8 |
| US004 | Visual interface to see when a worker is not wearing PPE | 5 |
| US005 | Quick identification of missing PPE detected on screen | 5 |
| US006 | Receive alerts when a worker is without PPE | 5 |
| US007 | Keep a history of alerts | 3 |
| US008 | Organize alerts | 3 |
| US009 | Display detection graphs for the month | 5 |
| US010 | Configure alert colors | 2 |
| US011 | Review detection statistics | 3 |
| US012 | Configure profile and frequency | 1 |
Disclaimer/Publisher’s Note: The statements, opinions and data contained in all publications are solely those of the individual author(s) and contributor(s) and not of MDPI and/or the editor(s). MDPI and/or the editor(s) disclaim responsibility for any injury to people or property resulting from any ideas, methods, instructions or products referred to in the content. |
© 2025 by the authors. Licensee MDPI, Basel, Switzerland. This article is an open access article distributed under the terms and conditions of the Creative Commons Attribution (CC BY) license (https://creativecommons.org/licenses/by/4.0/).
Share and Cite
Trujillo-Lopez, L.A.; Raymundo-Guevara, R.A.; Morales-Arevalo, J.C. User-Centered Design of a Computer Vision System for Monitoring PPE Compliance in Manufacturing. Computers 2025, 14, 312. https://doi.org/10.3390/computers14080312
Trujillo-Lopez LA, Raymundo-Guevara RA, Morales-Arevalo JC. User-Centered Design of a Computer Vision System for Monitoring PPE Compliance in Manufacturing. Computers. 2025; 14(8):312. https://doi.org/10.3390/computers14080312
Chicago/Turabian StyleTrujillo-Lopez, Luis Alberto, Rodrigo Alejandro Raymundo-Guevara, and Juan Carlos Morales-Arevalo. 2025. "User-Centered Design of a Computer Vision System for Monitoring PPE Compliance in Manufacturing" Computers 14, no. 8: 312. https://doi.org/10.3390/computers14080312
APA StyleTrujillo-Lopez, L. A., Raymundo-Guevara, R. A., & Morales-Arevalo, J. C. (2025). User-Centered Design of a Computer Vision System for Monitoring PPE Compliance in Manufacturing. Computers, 14(8), 312. https://doi.org/10.3390/computers14080312