Article

Informing Disaster Recovery Through Predictive Relocation Modeling

Department of Civil and Environmental Engineering, Kennesaw State University, Marietta, GA 30060, USA
*
Author to whom correspondence should be addressed.
Computers 2025, 14(6), 240; https://doi.org/10.3390/computers14060240
Submission received: 1 May 2025 / Revised: 10 June 2025 / Accepted: 13 June 2025 / Published: 19 June 2025
(This article belongs to the Special Issue Machine Learning and Statistical Learning with Applications 2025)

Abstract

Housing recovery represents a critical component of disaster recovery, and accurately forecasting household relocation decisions is essential for guiding effective post-disaster reconstruction policies. This study explores the use of machine learning algorithms to improve the prediction of household relocation in the aftermath of disasters. Leveraging data from 1304 completed interviews conducted as part of the Displaced New Orleans Residents Survey (DNORS) following Hurricane Katrina, we evaluate the performance of Logistic Regression (LR), Random Forest (RF), and Weighted Support Vector Machine (WSVM) models. Results indicate that WSVM significantly outperforms LR and RF, particularly in identifying the minority class of relocated households, achieving the highest F1 score. Key predictors of relocation include homeownership, extent of housing damage, and race. By integrating variable importance rankings and partial dependence plots, the study also enhances interpretability of machine learning outputs. These findings underscore the value of advanced predictive models in disaster recovery planning, particularly in geographically vulnerable regions like New Orleans where accurate relocation forecasting can guide more effective policy interventions.

1. Introduction

The frequency of natural hazards has increased fourfold since the 1970s, now averaging over 400 events per year [1]. In 2017 alone, the United States experienced USD 306 billion in disaster-related damage. Notably, 43% of housing units in the U.S. are situated in areas with a high risk of natural hazards such as hurricanes, tornadoes, and floods [2]. Housing plays a central role in community infrastructure, accounting for approximately 70% of total building assets [3]. Household decisions to rebuild or relocate significantly influence community recovery, as housing affects multiple interdependent aspects of community resilience. Understanding the housing recovery process is therefore crucial for predicting and improving overall disaster recovery timelines. To this end, a range of models have been developed to examine household recovery decisions, including spatial regression models [4], conditional inference trees [5], and mixed logit models [6]. Researchers have identified various factors that influence relocation decisions, such as psychological stress [7], sense of loss [8], extent of property damage [9], local community [10], and demographic characteristics [11]. Moreover, relocation is increasingly viewed as a collective household-level action, rather than solely an individual decision [12].
Logistic regression has long served as the “standard method” for examining post-disaster household relocation decisions [11,13,14,15]. This preference stems from a traditional emphasis on identifying statistically significant predictors rather than optimizing the predictive accuracy of the models. As a result, for the past two decades, practitioners have largely adhered to this approach, often producing models with limited effectiveness in accurately predicting which households will relocate following a disaster. This raises two critical concerns [14]. First, household relocation is intrinsically linked to the broader community recovery process. Accurate prediction of relocation decisions is essential for policymakers to design and implement effective recovery strategies. Integrating household recovery behavior into disaster policy frameworks can significantly accelerate community-level recovery. Second, the low predictive power of traditional statistical models suggests that their estimated parameters may not be robust or generalizable, thereby limiting their practical utility. In contrast, machine learning algorithms such as Support Vector Machines (SVMs) and random forests have shown considerable promise in enhancing predictive performance and addressing these limitations [16,17].
Although machine learning algorithms have been widely applied across various disciplines, their use in modeling post-disaster household relocation remains limited. Relocation is not solely a geographic process, it is deeply shaped by human behavior, social norms, and individual household needs. To account for these dimensions, this study incorporates a wide range of demographic and socioeconomic variables, such as homeownership, housing damage, income, religious affiliation, and education, into predictive models. By doing so, it aims to capture the complex decision-making processes that underlie relocation. The analysis compares the predictive performance of random forest and weighted support vector machine against the traditionally used logistic regression. The following sections review relevant literature, highlight current knowledge gaps, and present the methodology used to integrate behavioral and contextual factors into the modeling framework. The study concludes with findings, contributions, and future directions for improving model relevance and interpretability in real-world recovery planning.

2. Literature Review

The literature demonstrates that relocation decisions are not merely the result of economic rationality or hazard exposure but are embedded in a complex landscape of emotional, cultural, geographic, and systemic factors. A predictive model that seeks to anticipate household relocation behavior must therefore incorporate these diverse drivers to provide accurate and actionable insights.

2.1. Related Studies on Relocation Factors

Post-disaster relocation is a multidimensional process shaped by a confluence of geographic, economic, psychological, and social factors. Geographically, hazard exposure, proximity to critical infrastructure, and spatial disparities in government recovery investment significantly affect relocation outcomes. Areas with prolonged flooding, uninhabitable structures, or delayed utility restoration are associated with lower return rates, as seen in case studies of Hurricane Katrina and Superstorm Sandy [5,11,18]. Spatial accessibility of employment centers, schools, healthcare, and transportation systems also plays a vital role in shaping post-disaster residential decision making.
Behavioral and psychosocial variables further complicate these decisions. Place attachment, a person’s emotional and symbolic connection to their home and community, has been consistently identified as a deterrent to permanent relocation, even when physical conditions are unfavorable [19]. This attachment is especially strong in historically marginalized communities, where identity and cultural continuity are deeply tied to geographic space [7,20]. Research by Morrice [7] and Najarian et al. [21] showed that post-disaster trauma and emotional loss significantly influence an individual’s capacity and willingness to make rational housing decisions, particularly among vulnerable populations such as the elderly or low-income families.
Social networks also act as both anchors and motivators in relocation decisions. Tight-knit communities, such as those observed in Vietnamese and African-American neighborhoods in post-Katrina New Orleans, often exhibited collective return behaviors, even in the absence of adequate infrastructure, due to shared values, mutual support systems, and informal communication networks [8,22]. Conversely, the disruption of social ties caused by displacement can reduce the likelihood of return, especially when relocation leads to geographic and emotional fragmentation of extended families or support groups. Economic and demographic factors remain critical. Households with lower income levels, renters, and those lacking insurance coverage are less likely to rebuild or return, often due to limited access to financial recovery tools such as FEMA grants, SBA loans, or private insurance payouts [13,14,23]. In contrast, homeowners with greater financial resilience tend to have more options for repair or relocation. Comerio [3] underscores this point, arguing that post-disaster housing markets often exacerbate pre-existing inequalities, with the most socioeconomically disadvantaged populations suffering the longest periods of displacement.
Objective indicators, such as race, employment status, gender, and household structure, have been widely used in predictive models and have proven to be reliable proxies for structural vulnerabilities [24]. Black and Latino households, in particular, have historically faced slower and more incomplete recovery outcomes, not only because of resource disparities but also due to discriminatory lending, zoning, and recovery prioritization processes [14,25]. Furthermore, the interplay between public policy and relocation decisions is increasingly recognized. The design of buyout programs, rebuilding incentives, and temporary housing assistance often implicitly shapes household decisions about whether to return, rebuild, or resettle. For example, studies on the New York buyout program post-Hurricane Sandy indicate that bureaucratic complexity, lack of transparency, and inconsistencies in compensation directly influenced the decision to relocate for many homeowners [13].

2.2. Related Studies on Machine Learning Algorithm

Machine Learning (ML) has emerged as a transformative tool in domains that require the analysis of high-dimensional, non-linear, and imbalanced data, including finance, health, political science, and, increasingly, disaster research. In contrast to traditional parametric models such as logistic regression, ML algorithms make fewer assumptions about the underlying data distribution and are better suited to capturing complex interactions between variables.
In the context of disaster-related prediction tasks, ML models such as Random Forest (RF), Gradient Boosting Machines (GBM), and Support Vector Machines (SVM) have been used to predict flood risk, infrastructure failure, and evacuation behavior with high accuracy [26,27,28,29]. For example, random forest has proven effective in modeling civil war onset using imbalanced political datasets, outperforming logistic regression in both precision and recall [30]. Zhao et al. [28] applied RF to model pre-evacuation behavior and found that it captured latent interaction effects between psychological, spatial, and demographic variables better than traditional methods. Similarly, Ganguly et al. [29] demonstrated that RF provided more accurate household-level flood damage predictions than generalized linear models.
Despite these successes, the application of ML to post-disaster household relocation prediction remains underdeveloped. The few existing studies in this area have tended to rely on regression models that emphasize coefficient significance rather than predictive accuracy, thereby limiting their utility for policy applications that require reliable forecasts [23]. Yet, relocation modeling is well-suited to ML approaches: it involves binary classification, suffers from class imbalance (i.e., relatively few households relocate), and includes a wide range of potentially interacting variables, demographic, behavioral, geographic, and economic. Support Vector Machines (SVM), particularly when adjusted with weighting schemes (e.g., Weighted SVM or WSVM), are effective for such imbalanced classification tasks. SVMs maximize the margin between classes and are capable of learning complex decision boundaries, especially when coupled with kernel functions such as the Radial Basis Function (RBF). In applications where one class is underrepresented, as is typical in disaster relocation datasets, weighting helps avoid model bias toward the dominant class, thereby improving sensitivity for rare but important cases like relocation [29].
Furthermore, ML models are increasingly being equipped with tools to enhance interpretability. While traditionally viewed as “black boxes”, techniques such as Partial Dependence Plots (PDPs), Shapley values, and feature importance rankings allow researchers to explain model predictions in a more transparent and policy-relevant manner [31]. These tools bridge the gap between predictive power and interpretability, enabling machine learning to support both rigorous scientific inquiry and practical decision making. Moreover, the use of cross-validation, bootstrap resampling, and hyperparameter tuning in ML workflows enhances the generalizability of results and mitigates the risk of overfitting, a persistent challenge in small or medium-sized disaster datasets. Krstajic et al. [31] emphasize that multiple repetitions of k-fold cross-validation provide a more stable estimate of performance metrics, such as the F1 score, which is particularly valuable in class-imbalanced settings.

3. Methodology

To evaluate the ability of different algorithms to predict post-disaster household relocation, this study employs a comparative modeling framework using logistic regression, random forest, and Weighted Support Vector Machine (WSVM). These models were chosen to reflect both traditional statistical approaches and machine learning techniques, allowing for a balanced comparison of interpretability and predictive performance. The analysis is grounded in the Displaced New Orleans Residents Survey (DNORS), which provides rich data on household characteristics, disaster impacts, and recovery outcomes following Hurricane Katrina. Figure 1 is the overview of methodology.

3.1. Data Description

This study utilizes household-level data from the Displaced New Orleans Residents Survey (DNORS). The Displaced New Orleans Residents Survey (DNORS) is a longitudinal study conducted by the RAND Corporation, with fieldwork carried out by the University of Michigan Survey Research Center between mid-2009 and mid-2010. The survey aimed to collect data on individuals and households who resided in New Orleans, Louisiana, in August 2005, just before Hurricane Katrina struck. The primary objective was to analyze the location, living arrangements, health, and well-being of residents displaced by the hurricane. Fieldwork for DNORS was conducted from mid-2009 to mid-2010, approximately four years after Hurricane Katrina. This timing allowed researchers to assess medium-term outcomes related to displacement, resettlement, and recovery among affected individuals and households.
DNORS employed a stratified sampling design based on pre-Katrina dwellings within the city of New Orleans. The sampling frame was constructed using address-based listings of dwellings occupied in August 2005. Researchers identified the pre-storm residents of these dwellings and tracked them to their locations at the time of the survey, whether they had returned to New Orleans or resettled elsewhere. The survey achieved interviews with 1380 pre-Katrina households, encompassing 3760 residents, with detailed individual interviews conducted with 1761 selected respondents. To accommodate the dispersed nature of the displaced population, DNORS utilized a mixed-mode data collection approach, including telephone and face-to-face interviews. This methodology facilitated the inclusion of participants regardless of their relocation status and helped mitigate potential non-response biases associated with single-mode surveys. Table 1 is the data description. The analytical sample used in this study includes 1304 households with complete interview data. Among these, 1067 households had returned to the City of New Orleans following the disaster.
While DNORS provides valuable insights into the experiences of displaced New Orleans residents, certain limitations must be acknowledged:
  • Selection Bias: Individuals who were more difficult to locate or contact, such as those experiencing prolonged or multiple displacements, may be underrepresented in the sample.
  • Non-Response Bias: Households that declined participation or could not be reached may differ systematically from respondents, potentially affecting the generalizability of the findings.
  • Recall Bias: Given the retrospective nature of some survey questions, participants’ recollections of pre- and post-Katrina experiences may be subject to inaccuracies.
Despite these limitations, DNORS remains a robust dataset for analyzing the medium-term impacts of Hurricane Katrina on displaced populations. The comprehensive tracking and mixed-mode data collection strategies employed enhance the representativeness and reliability of the findings.

3.2. Models

3.2.1. Logistic Regression (LR)

Logistic regression, an extension of linear regression, is widely used for modeling binary classification problems [32]. It estimates the probability of a binary outcome based on one or more explanatory variables. The model employs the logistic sigmoid function, as defined in Equation (1), where y denotes the binary response variable, xi (i = 1, 2, …, p) represents the explanatory variables, and βj (j = 0, 1, 2, …, p) are the model parameters estimated through Maximum Likelihood Estimation (MLE).
P y = 0   o r   1 = 1 1 + e β 0 + β 1 x 1 + + β p x p
For a 2-class problem, we used a threshold c = 0.5 in our research for prediction:
c l a s s   1   i f   P y = 1 > c , o t h e r w i s e   c l a s s   2
The performance of logistic regression is highly dependent on the assumption that the data conforms to its underlying model structure. In contrast, machine learning algorithms are non-parametric and do not require predefined mathematical formulations, allowing them to adapt more flexibly to complex and non-linear data patterns.

3.2.2. Random Forest (RF)

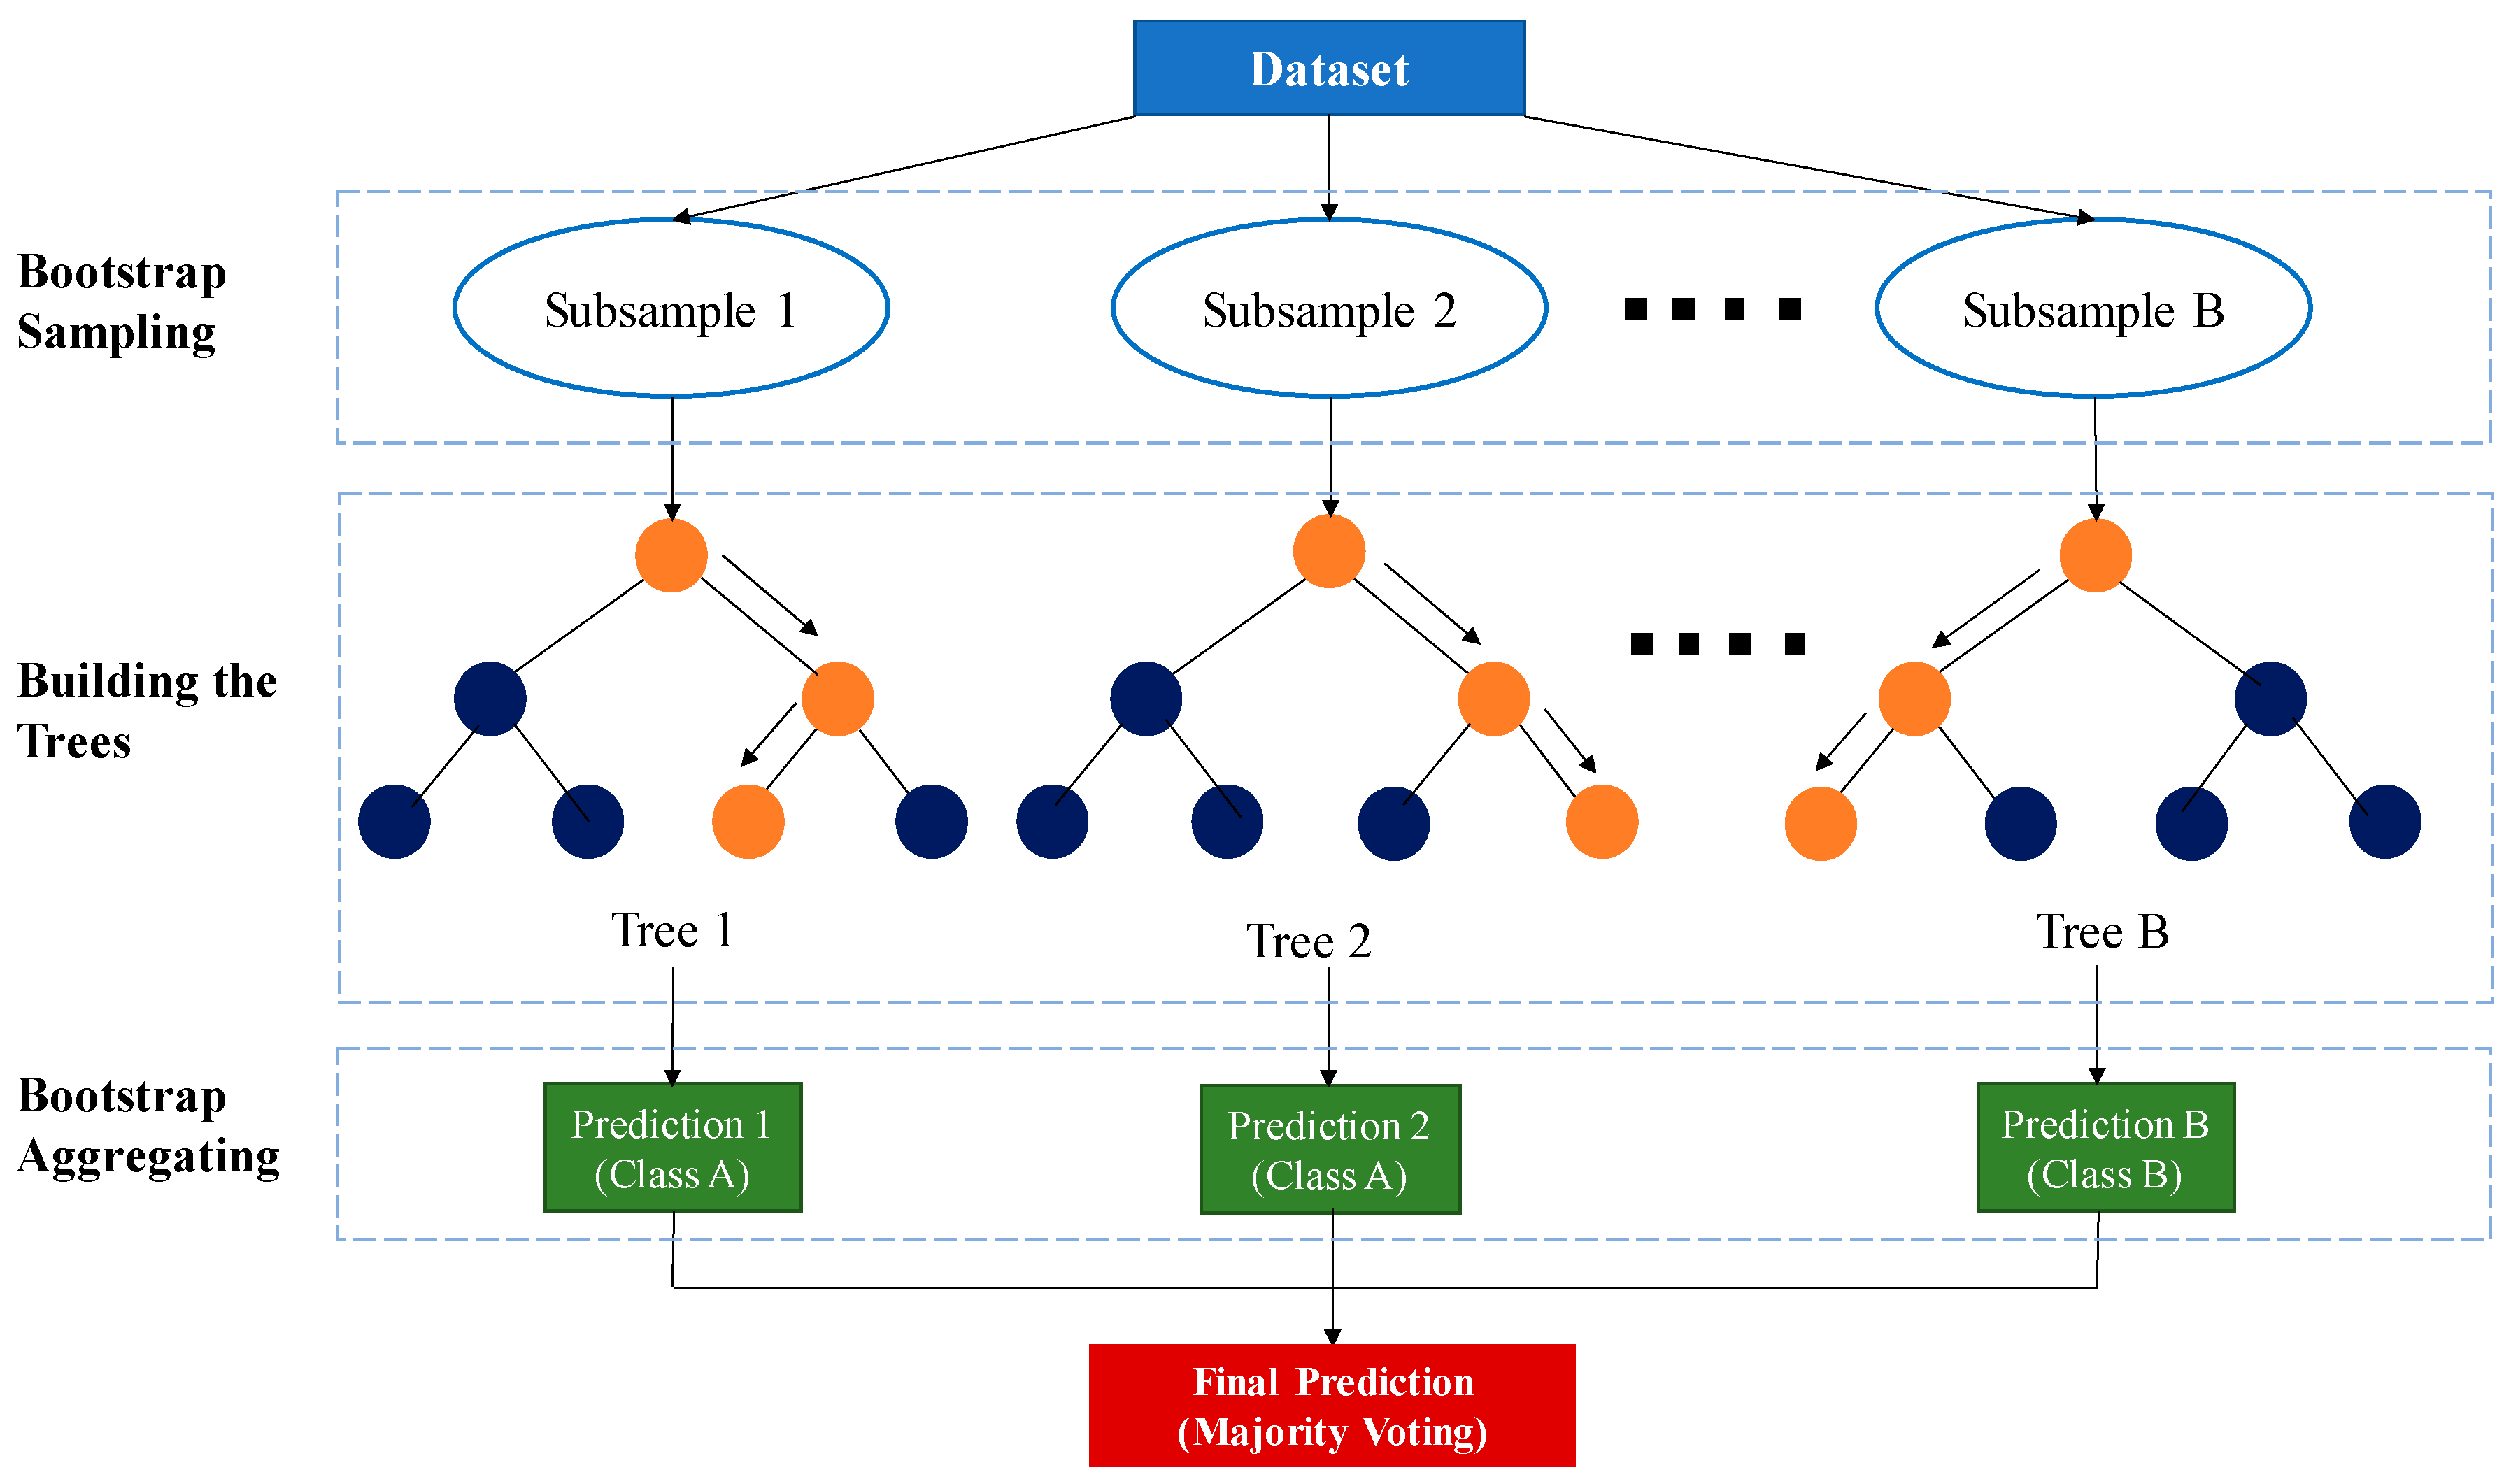
Unlike logistic regression, which is model-based, random forest is a data-driven classification technique [33]. As a supervised learning algorithm, random forest combines bootstrap aggregating (bagging) with random feature selection to improve predictive performance. While bagging constructs multiple decision trees using bootstrapped datasets, random forest introduces an additional layer of randomness by selecting a random subset of features at each split, thereby reducing the correlation between individual trees. This approach helps to lower variance without significantly increasing bias, overcoming a key limitation of traditional bagging methods. The inclusion of random feature selection has been shown to significantly enhance model accuracy, particularly in high-dimensional or correlated datasets. Two critical hyperparameters in random forest construction are the number of trees (B) and the number of randomly selected variables (m) at each split. These parameters are typically optimized through grid search in conjunction with cross-validation. An overview of the random forest modeling process is illustrated in Figure 2.

3.2.3. Weighted Support Vector Machine (WSVM)

Support Vector Machine (SVM) is a widely used supervised learning algorithm, particularly effective for classification tasks. The core idea of SVM is to find an optimal hyperplane that maximizes the margin between data points belonging to two distinct classes.
The Weighted Support Vector Machine (WSVM) extends the standard SVM by assigning weights to individual training instances, allowing the model to handle class imbalances more effectively. The WSVM formulation is given in Equation (3), where xi ∈ ℝn represents the training instances and yi ∈ {−1, 1} denotes their corresponding class labels. The parameter μi is the weight associated with instance xi, w is the normal vector to the hyperplane in the feature space, b is the bias term, and C is a regularization parameter that controls the trade-off between maximizing the margin and minimizing classification errors, thus balancing training accuracy and generalization performance.
Min w , b , ξ i   1 2 w 2 + C i = 1 n μ i ξ i s . t .         y i w · x i + b 1 ξ i ,   ξ i 0 ,   i = 1,2 , ,   n
Equation (3) can be reformulated into Equation (4) by solving the Lagrangian dual optimization problem, a standard approach in support vector machine formulations. In this dual form, α denotes the Lagrange multipliers and K(xi, j) represents the kernel function used to compute the similarity between training instances xi and j. This kernel-based representation allows the algorithm to operate in high-dimensional feature spaces without explicitly computing the transformations. In this study, the Radial Basis Function (RBF) kernel is employed due to its effectiveness in capturing non-linear relationships in the data.
Max α   i = 1 n α i 1 2 i = 1 n j = 1 n y i y j α i α j x i , x j s . t .         i = 1 n y i α i = 0 ,   0 α i C μ i , i = 1,2 , ,   n

4. Results

4.1. Metrics

In this study, only 18% of households permanently resettled outside New Orleans following Hurricane Katrina, resulting in a highly imbalanced dataset. Such class imbalance poses a significant challenge for classification models, as they tend to favor the majority class, in this case, households that returned to the city, while underrepresenting the minority class that relocated elsewhere. This imbalance can lead to biased decision making and poor generalization for the minority class. To address this issue, the F1 score was used as the primary evaluation metric during model training [34]. The F1 score, defined in Equation (5), is the harmonic mean of precision and recall and provides a more balanced assessment of model performance in the presence of class imbalance by penalizing extreme values of either metric.
F 1 = 2 × P r e c i s i o n × R e c a l l P r e c i s i o n + R e c a l l
Precision (Equation (6)) measures the proportion of correctly predicted positive cases among all predicted positives, while recall (Equation (7)) captures the proportion of actual positives correctly identified. Together, they provide a comprehensive view of model performance, especially in imbalanced settings where overall accuracy may be misleading. In this context, a model that predicts most households as returning would yield high accuracy but fail to identify relocated households—our primary concern. By harmonizing precision and recall, the F1 score offers a more appropriate assessment, ensuring that both types of classification errors are accounted for. This is particularly important for post-disaster planning, where misclassifying relocated households could result in misdirected resources or unmet recovery needs. Thus, the F1 score enables a more informative and equitable evaluation of predictive models in the face of class imbalance.
P r e c i s i o n = T P T P + F P
R e c a l l = T P T P + F N

4.2. Model Comparison

To evaluate model performance, k-fold Cross-Validation (CV) was employed. In this method, the original dataset is randomly partitioned into k equally sized subsets, or “folds”. During each iteration, one fold is designated as the testing set, while the remaining k − 1 folds are combined to form the training set. This process is repeated k times, ensuring that each fold is used exactly once as the testing set. The evaluation metrics from each iteration are then averaged to produce an overall estimate of model performance. This approach reduces the potential bias associated with a single train–test split and ensures a more robust and reliable assessment. Furthermore, increasing the value of k generally leads to a lower variance in the performance estimate, providing a more stable and generalized evaluation of the model.
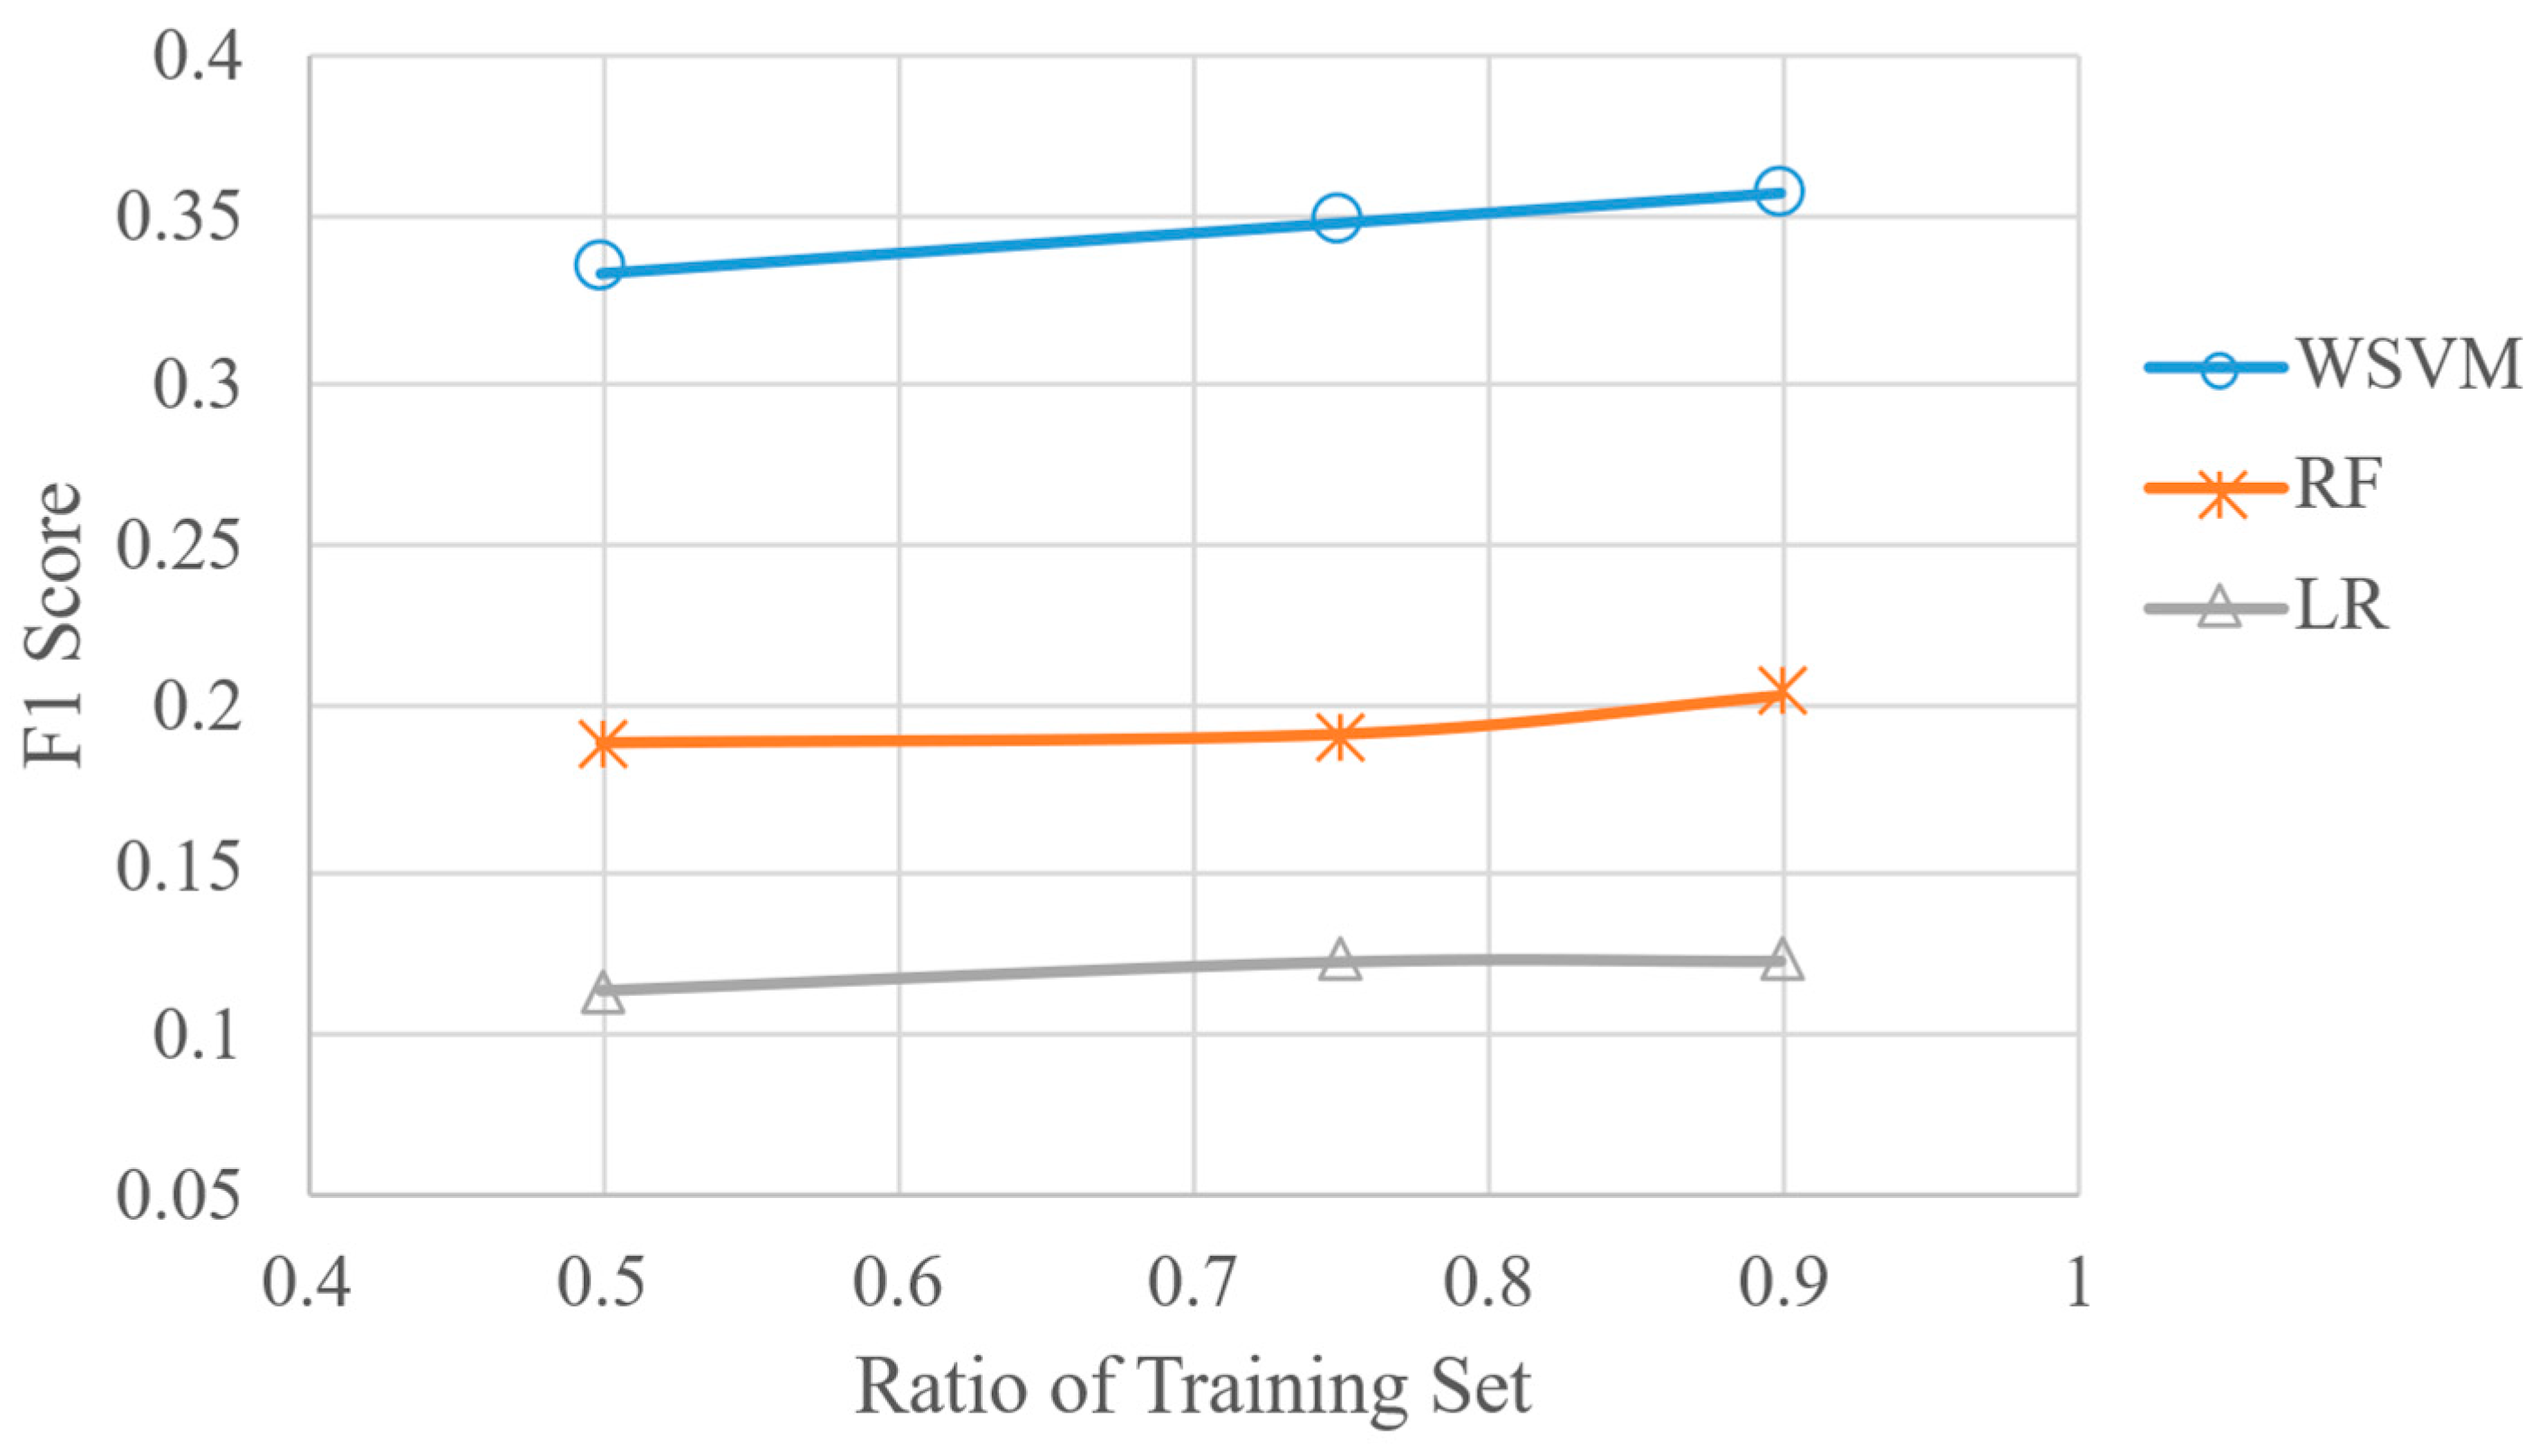
In this study, 50 repetitions of k-fold cross-validation were conducted, following the recommendation of [31]. Specifically, “50 repetitions” refers to repeating the entire cross-validation process, randomly partitioning the dataset into k folds a total of 50 times to yield more stable and reliable performance estimates. To explore the impact of training data proportions, we evaluated model performance using k values of 2, 4, and 10, corresponding to different training-to-testing set ratios. Figure 3 presents a comparative analysis of Logistic Regression (LR), Random Forest (RF), and Weighted Support Vector Machine (WSVM) in terms of their F1 scores on the relocation category. Notably, the F1 score is particularly useful in this context, as it reflects the model’s ability to predict the minority class, households that relocated, more effectively. A higher F1 score indicates better predictive accuracy for these relocated households, which is vital for informing disaster recovery policy decisions. The results demonstrate that WSVM consistently outperforms both LR and RF, achieving the highest F1 scores across all fold settings. Additionally, the F1 score of the random forest model surpasses that of logistic regression, suggesting that machine learning algorithms offer superior performance for imbalanced classification problems. Furthermore, an increasing training ratio is associated with higher F1 scores, underscoring the value of more training data in enhancing model accuracy.

4.3. Variable Interpretation

Feature selection plays a pivotal role in the training of predictive models, yet not all features contribute equally to model accuracy. The importance of a feature is determined by the extent to which the model relies on it for making accurate predictions. One commonly used technique for estimating feature importance is the recursive partitioning method, which evaluates the total reduction in mean squared error attributed to each feature across all decision splits. Features associated with greater reductions are deemed more influential. However, while feature importance provides insights into which variables are influential, it does not clarify how those variables influence the model’s predictions. In linear regression, model coefficients offer straightforward interpretability. In contrast, complex models such as Support Vector Machines (SVM) and random forests lack a direct parametric interpretation, making them inherently more difficult to explain. To overcome this limitation, Friedman [35] introduced the concept of Partial Dependence Plots (PDPs). This approach allows for the interpretation of any predictive model, regardless of its structure, by examining how the model’s predicted outcomes vary with changes in a specific feature, while averaging out the effects of all other features. Given a dataset with N observations and p covariates, where yk is the response for observation k and xi,k is the value of the i-th feature for the k-th observation, the model predictions can be expressed as shown in Equation (8).
y ^ k = F x 1 , k , x 2 , k , , x p , k
To compute Friedman’s Partial Dependence Plot (PDP) for a single covariate j, the partial dependence function ϕj(x) is estimated by averaging the model’s predictions over the joint distribution of all other variables, as defined in Equation (9). This function captures the marginal effect of j on the predicted outcome by effectively “averaging out” the influence of the remaining features. By evaluating ϕj(x) over a suitable range of j values and plotting the result, one can visualize how the model’s prediction changes in response to variations in xj, independent of interactions with other covariates. This approach is particularly useful for interpreting complex, non-parametric models such as random forests and support vector machines, where direct interpretation of model parameters is not feasible.
j x j = 1 n k = 1 n F x 1 , k , , x j 1 , k , x j + 1 , k , , x p , k
The analysis began with an examination of the logistic regression results, as presented in Table 2, to identify key factors influencing households’ decisions to relocate or return following Hurricane Katrina. The Odds Ratio (OR), calculated as the exponential of the regression coefficient (eβ), provides insight into the direction and magnitude of each predictor’s effect. A negative coefficient yields an OR less than 1, indicating that a one-unit increase in the predictor reduces the odds of returning to a pre-Katrina address, with relocation as the reference outcome. Conversely, a positive coefficient results in an OR greater than 1, signifying increased odds of returning. Among the significant predictors, homeownership exhibited the strongest effect, with an OR of 2.927, suggesting that homeowners were nearly three times more likely to return than renters. This makes homeownership the most influential variable in the model. Another significant factor was religious affiliation: households identified as “slightly religious” had an OR of 2.873, indicating a 187.3% increase in the odds of returning compared to those identified as “very religious”. These findings highlight the importance of socioeconomic factors in shaping post-disaster relocation decisions.
The education, housing damage, and household income variables were also identified as significant contributors to the relocations of households. Specifically, the variable “a lot of damage” has the smallest odds ratio (OR = 0.122), indicating that households experiencing the most severe damage were the least likely to return. The OR value of a moderate amount of damage (OR = 0.151) variable is found to be the second smallest, indicating that households were more likely to relocate after experiencing a higher level of damage compared to households experiencing no damage. Householders with a high school degree (OR = 0.636) or some college (OR = 0.423) or college graduates (OR = 0.522) were more likely to relocate to other places than those with less than a high school education. A negative and significant effect was observed for the variable household income of USD 50,001 to USD 75,000 (OR = 0.635).
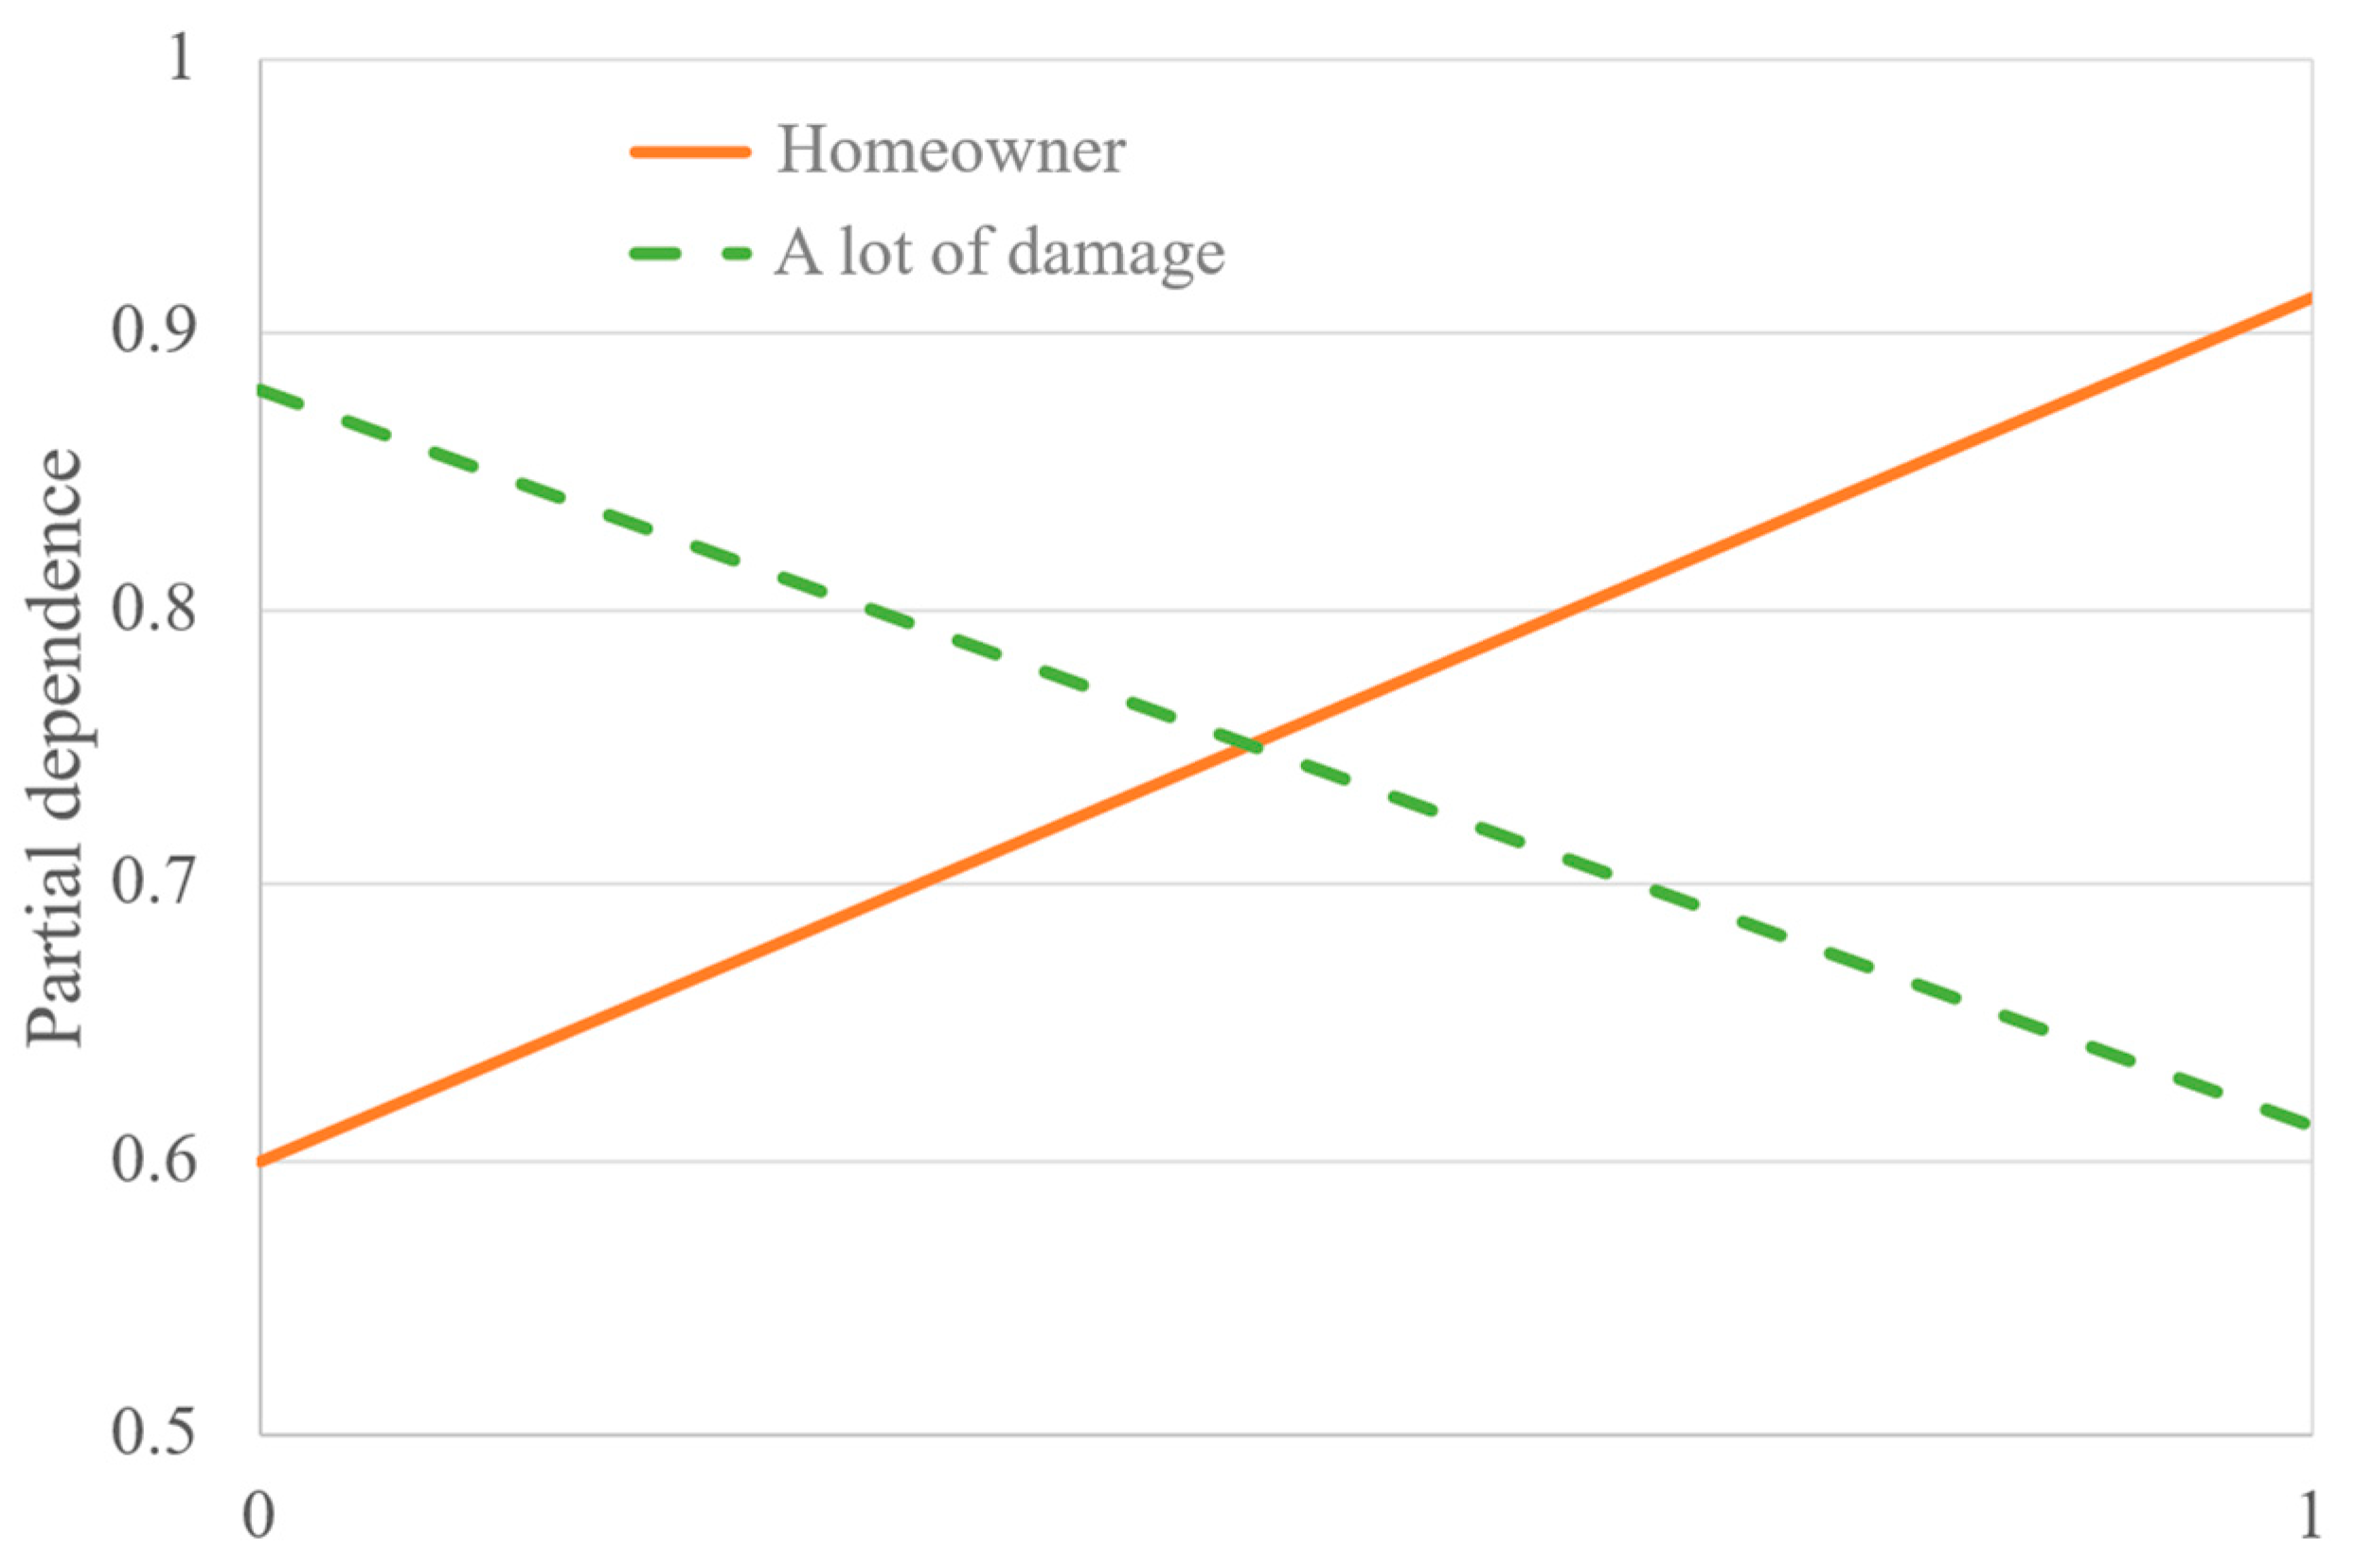
While logistic regression is straightforward to implement and interpret, it falls short in accurately predicting the minority class, in this case, households that relocated after Hurricane Katrina. To address this limitation, we further analyzed the results using the Weighted Support Vector Machine (WSVM) model. Given the stochastic nature of machine learning algorithms, slight variations in results are expected across different runs. To ensure stability, the WSVM model was executed ten times, with each run involving 10 repetitions of 10-fold cross-validation. We then examined the influence of individual predictors using Partial Dependence Plots (PDPs), which provide a visual representation of how each variable affects the model’s predictions while averaging out the influence of other features. For binary (dummy) variables, this influence can be interpreted as either positive or negative. Figure 4 displays sample PDPs for two key variables. For example, the “a lot of damage” variable shows a negative effect on the probability of return, suggesting that households experiencing severe housing damage were less likely to return and rebuild. These plots offer intuitive insights into the relationship between predictors and the model’s output, supporting a more nuanced interpretation of complex models like WSVM.
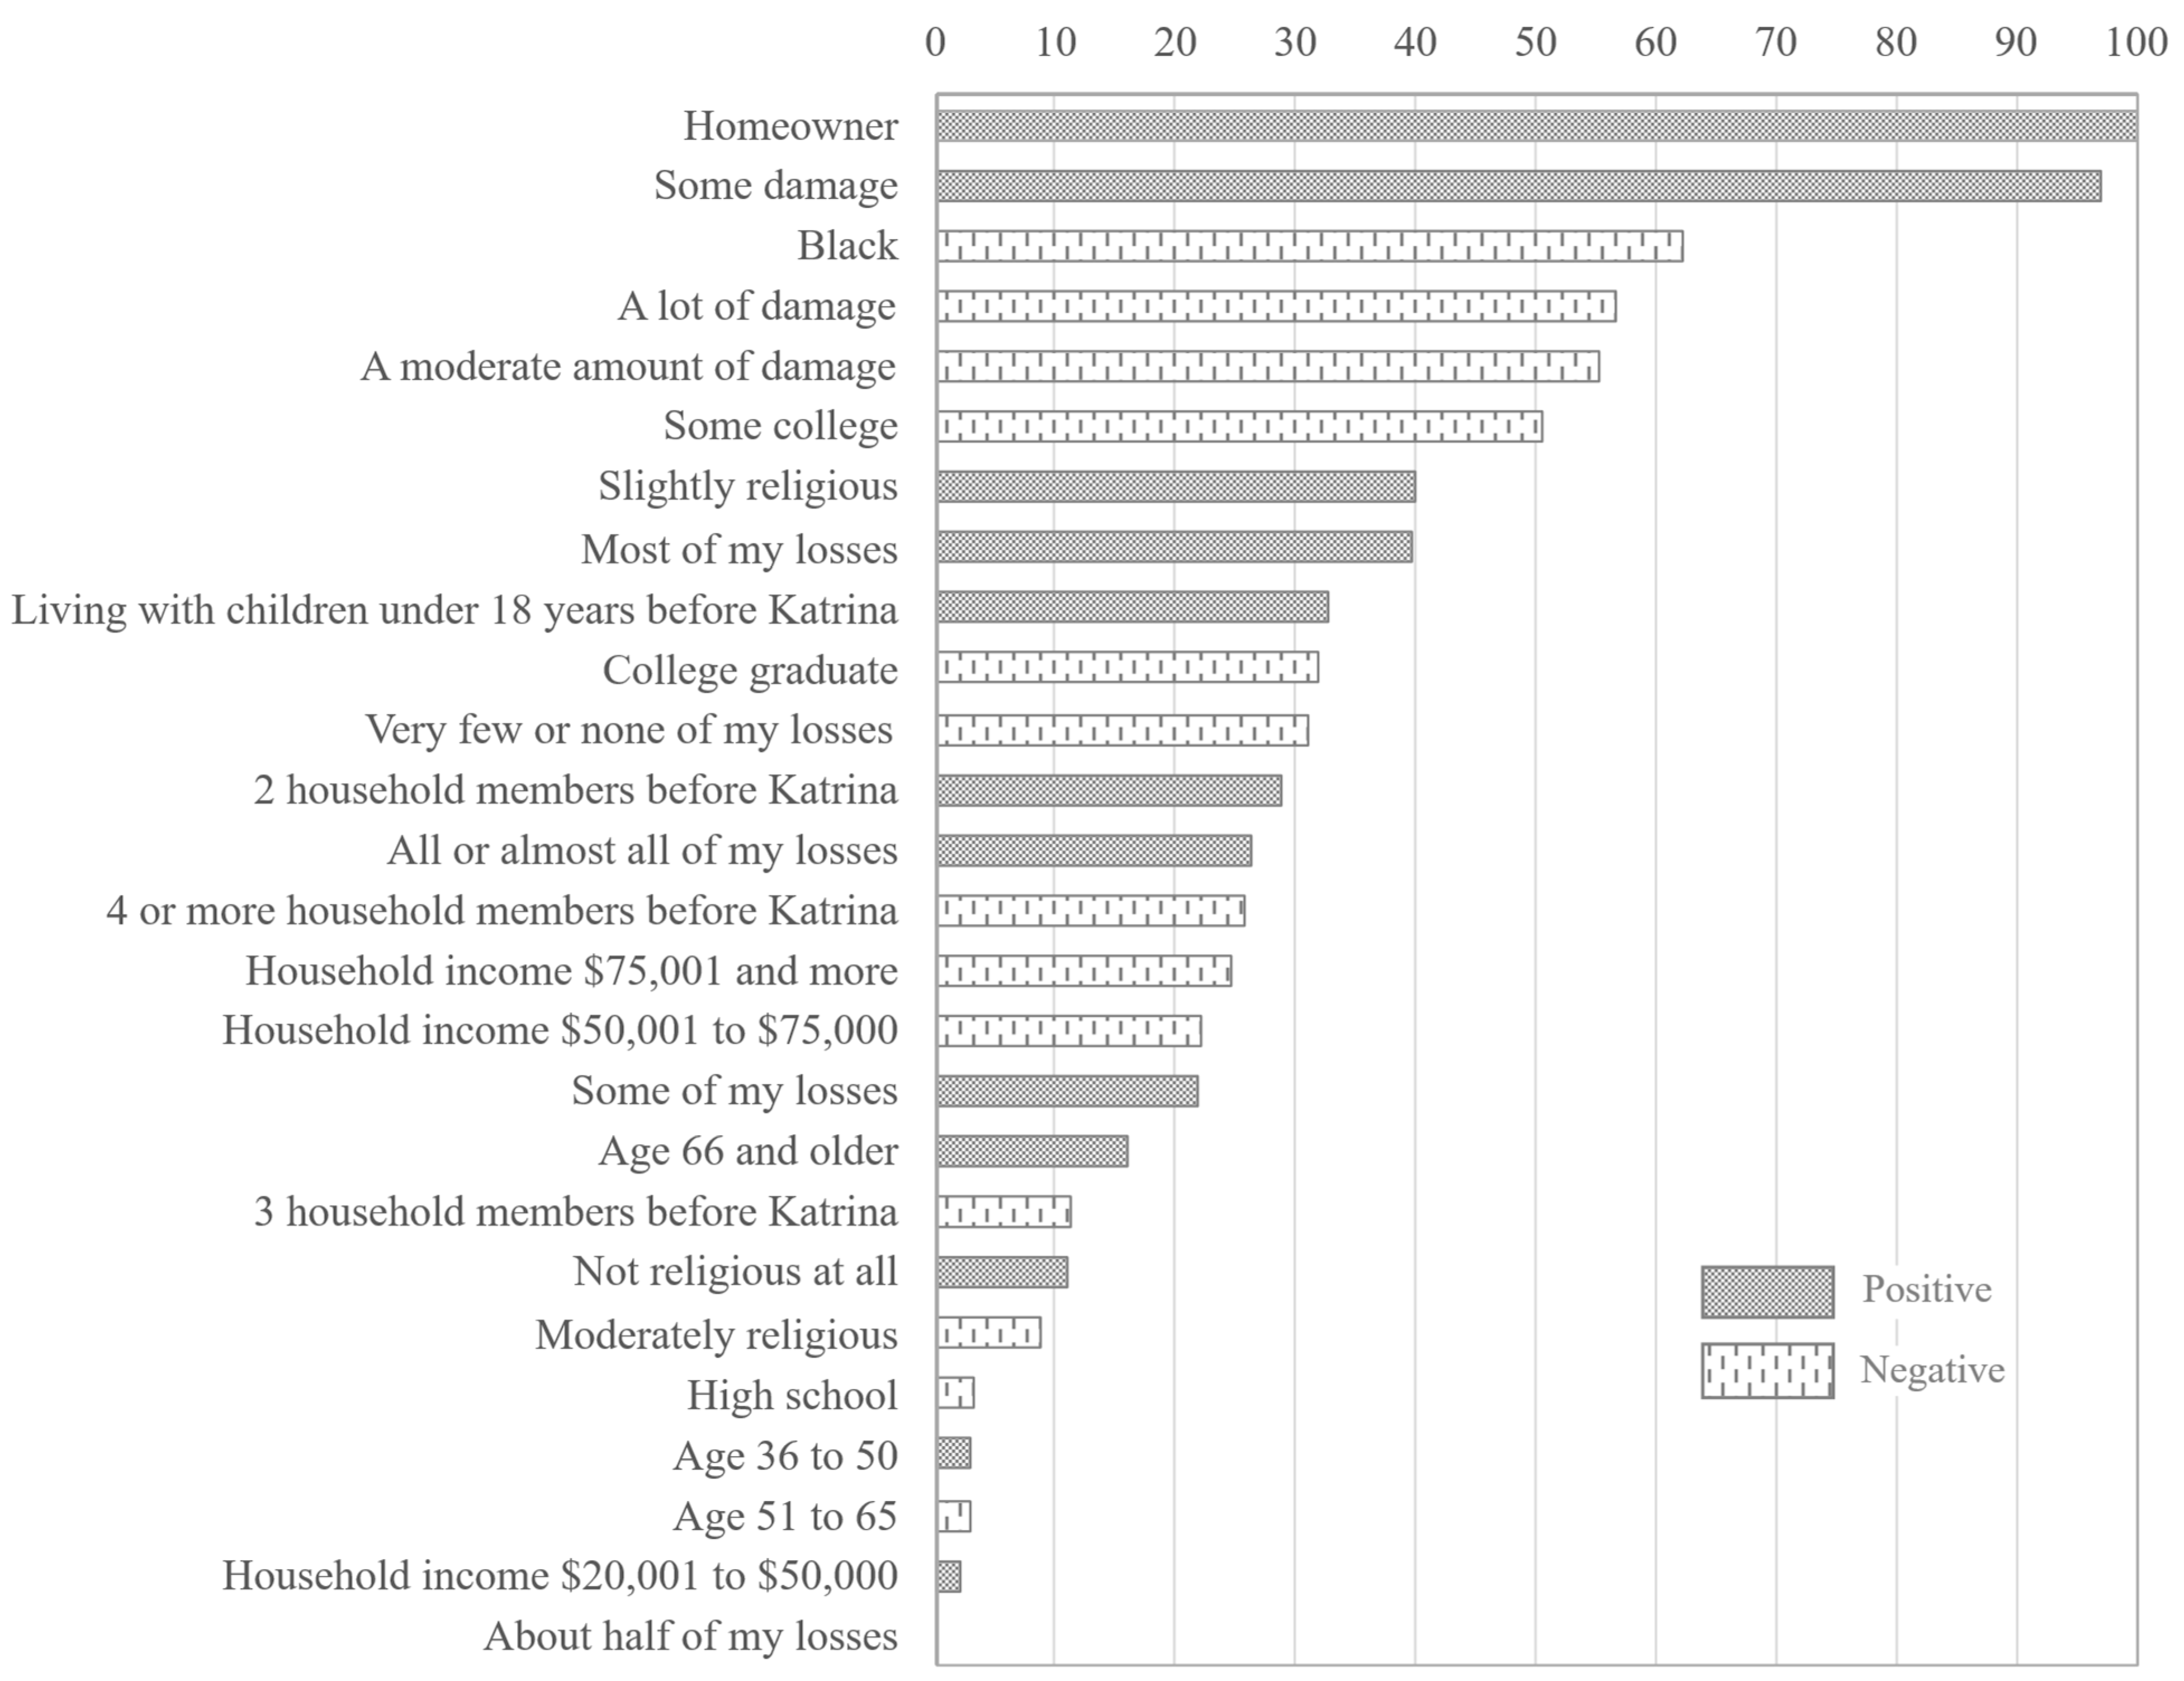
Figure 5 illustrates the relative importance and directional effect of variables in the Weighted Support Vector Machine (WSVM) model. The importance scores for each variable are averaged across ten independent runs to ensure stability and reliability. Negative values indicate that the corresponding variable is associated with an increased likelihood of households returning to their pre-disaster locations, while positive values suggest a greater probability of relocation. Among all variables, homeownership emerges as the most influential predictor, aligning with findings from prior studies [23]. This result reinforces the critical role of housing tenure in shaping post-disaster recovery decisions, particularly the tendency of homeowners to return and rebuild.

5. Discussion

5.1. Interpretation of Findings

The model estimation results highlight the superior performance of machine learning algorithms in predicting household relocation following disasters, as compared to traditional logistic regression. This improvement is evident in the significantly higher F1 scores achieved by the machine learning models, indicating enhanced predictive accuracy, particularly for the minority class of relocated households. Among the evaluated algorithms, the Weighted Support Vector Machine (WSVM) outperformed random forest, demonstrating the highest F1 score and thus emerging as the preferred model. The top three most influential factors identified by the WSVM model were homeownership, moderate housing damage, and race. These findings align closely with prior research [25,36], which has consistently emphasized the role of homeownership, damage severity, race, and insurance in shaping post-disaster relocation decisions. This alignment with established literature lends further credibility to the use of machine learning techniques in disaster recovery research and supports their broader application in policy-relevant predictive modeling.
Traditional methods such as logistic regression exhibit significant limitations in predicting minority classes, particularly in imbalanced datasets. This study focuses on the critical issue of post-disaster household relocation, where the number of relocated households is substantially lower than those who returned to their pre-disaster residences after events like Hurricane Katrina [11,14,37]. Given the imbalanced nature of the data, machine learning algorithms offer a more suitable alternative. For researchers aiming to develop predictive models in this context, statistical learning methods such as random forest should be strongly considered. Logistic regression may yield biased estimates when applied to imbalanced data and is further constrained by assumptions related to linearity, independence of predictors (i.e., lack of multicollinearity), and homoskedasticity. When these assumptions are violated, the predictive accuracy of logistic regression is compromised. In contrast, machine learning algorithms like random forest are more flexible and robust, capable of capturing complex, non-linear interactions and producing more reliable predictions for rare but important outcomes, such as household relocation.

5.2. Limitations and Future Work

Despite the strengths and contributions of this study, several limitations must be acknowledged. First, the relatively small size of the dataset, derived from the Displaced New Orleans Residents Survey (DNORS), may limit the generalizability of the findings. While the models performed well within the available data, predictive performance and variable stability may change when applied to larger or more diverse populations affected by different disasters. Future research should aim to incorporate larger datasets from multiple disaster events to validate model performance across various geographic, demographic, and hazard-specific contexts. Second, although machine learning models are powerful in capturing complex relationships and handling imbalanced data, they often lack the transparency and interpretability associated with traditional statistical models. While we mitigated this issue using partial dependence plots and variable importance rankings, these methods provide only partial insight into model reasoning. This may limit the adoption of machine learning models by practitioners and policymakers who prioritize model transparency, especially in high-stakes applications. Future work should explore the integration of Explainable AI (XAI) techniques or develop hybrid models that combine the interpretability of logistic regression with the predictive strength of machine learning.
Third, the current study focused on two specific algorithms, random forest and WSVM, which, while effective, do not exhaust the spectrum of available modeling techniques. Emerging approaches, such as ensemble learning methods [38], and deep neural networks [39], may offer further improvements in predictive performance. Future research should systematically evaluate these models and compare their advantages and trade-offs, especially in relation to computational efficiency, interpretability, and data requirements. Lastly, while this study identified key predictors of relocation, it did not examine interactions between variables or account for spatial, temporal, or social network effects, which could play a significant role in household decision making. Incorporating such contextual dimensions into predictive models could provide a more comprehensive understanding of post-disaster mobility and enable the design of more targeted and equitable recovery interventions.

6. Conclusions

Accurately predicting household relocation is crucial for facilitating effective community recovery in the aftermath of disasters. This study evaluated the predictive performance of machine learning algorithms versus logistic regression in identifying households that relocated following Hurricane Katrina. Utilizing household-level data from the Displaced New Orleans Residents Survey (DNORS), we modeled relocation decisions and compared three approaches using F1 score as the evaluation metric. The results clearly demonstrate that machine learning algorithms, particularly the weighted support vector machine, outperform logistic regression in predicting the minority class of relocated households. Furthermore, the use of variable importance rankings and partial dependence plots enhances the interpretability of machine learning models, enabling the identification of key factors and their directional influence on relocation outcomes. These findings underscore the value of adopting advanced statistical learning techniques in disaster recovery research and planning.

Author Contributions

Conceptualization, D.H.; methodology, D.H.; validation, C.H.; formal analysis, C.H.; investigation, C.H.; data curation, C.H.; writing—original draft preparation, C.H.; writing—review and editing, D.H.; visualization, C.H.; supervision, D.H. All authors have read and agreed to the published version of the manuscript.

Funding

This research received no external funding.

Data Availability Statement

The original data presented in the study are openly available at https://www.rand.org/well-being/social-and-behavioral-policy/data/dnors/dnorps.html (accessed on 20 April 2025).

Acknowledgments

This research is based on data from the Displaced New Orleans Residents Survey which was funded by grants from the Eunice Kennedy Shriver National Institute of Child Health and Human development (Grant R01-HD059106 and R01-HD059106-S1) to the RAND Corporation in Santa Monica, California. For further information on DNORS, go to www.rand.org/labor/projects/dnors (accessed on 11 June 2025). The funders had no role in the design of this study; in the analysis or interpretation of the data in this study; in the writing of the manuscript; or in the decision to publish the results.

Conflicts of Interest

The authors declare no conflicts of interest.

References

  1. Weather-Related Disasters Are Increasing. Available online: https://www.economist.com/graphic-detail/2017/08/29/weather-related-disasters-are-increasing (accessed on 25 April 2025).
  2. Hill, C. 43% of U.S. Homes Are at High Risk of Natural Disaster. Available online: https://www.marketwatch.com/story/43-of-us-homes-are-at-high-risk-of-natural-disaster-2015-09-03 (accessed on 25 April 2025).
  3. Comerio, M. Disaster Hits Home: New Policy for Urban Housing Recovery, 1st ed.; University of California Press: Oakland, CA, USA, 1998; ISBN 978-0-520-20780-6. [Google Scholar]
  4. Hu, D.; Nejat, A. Role of Spatial Effect in Postdisaster Housing Recovery: Case Study of Hurricane Katrina. J. Infrastruct. Syst. 2021, 27, 05020009. [Google Scholar] [CrossRef]
  5. Mayer, J.; Moradi, S.; Nejat, A.; Ghosh, S.; Cong, Z.; Liang, D. Drivers of Post-Disaster Relocations: The Case of Moore and Hattiesburg Tornados. Int. J. Disaster Risk Reduct. 2020, 49, 101643. [Google Scholar] [CrossRef]
  6. Hu, D.; Yu, W.; Zhao, J.; Liu, W.; Han, F.; Yi, X. A Hierarchical Mixed Logit Model of Individuals’ Return Decisions after Hurricane Katrina. Int. J. Disaster Risk Reduct. 2019, 34, 443–447. [Google Scholar] [CrossRef]
  7. Morrice, S. Heartache and Hurricane Katrina: Recognising the Influence of Emotion in Post-Disaster Return Decisions. Area 2013, 45, 33–39. [Google Scholar] [CrossRef]
  8. Kytola, K.L.; Cherry, K.E.; Marks, L.D.; Hatch, T.G. When Neighborhoods Are Destroyed by Disaster: Relocate or Return and Rebuild? In Traumatic Stress and Long-Term Recovery: Coping with Disasters and Other Negative Life Events; Cherry, K.E., Ed.; Springer International Publishing: Cham, Switzerland, 2015; pp. 211–229. ISBN 978-3-319-18866-9. [Google Scholar]
  9. Hu, D.; Nejat, A.; Shankar, V. Random Parameter Model of Postdisaster Household Relocation. Nat. Hazards Rev. 2021, 22, 04021027. [Google Scholar] [CrossRef]
  10. Moradi, S.; Nejat, A.; Hu, D.; Ghosh, S. Perceived Neighborhood: Preferences versus Actualities. Int. J. Disaster Risk Reduct. 2020, 51, 101824. [Google Scholar] [CrossRef]
  11. Groen, J.A.; Polivka, A.E. Going Home after Hurricane Katrina: Determinants of Return Migration and Changes in Affected Areas. Demography 2010, 47, 821–844. [Google Scholar] [CrossRef]
  12. Finn, D.; Chandrasekhar, D. Influence of Household Recovery Capacity and Urgency on Post-Disaster Relocation. Available online: https://hazards.colorado.edu/quick-response-report/influence-of-household-recovery-capacity-and-urgency-on-post-disaster-relocation (accessed on 30 May 2025).
  13. Binder, S.B. Resilience and Postdisaster Relocation: A Study of New York’s Home Buyout Plan in the Wake of Hurricane Sandy. Ph.D. Thesis, University of Hawaii at Manoa, Waikiki, HI, USA, 2014. [Google Scholar]
  14. Fussell, E.; Sastry, N.; VanLandingham, M. Race, Socioeconomic Status, and Return Migration to New Orleans after Hurricane Katrina. Popul. Environ. 2010, 31, 20–42. [Google Scholar] [CrossRef]
  15. Elliott, J.R.; Pais, J. Race, Class, and Hurricane Katrina: Social Differences in Human Responses to Disaster. Soc. Sci. Res. 2006, 35, 295–321. [Google Scholar] [CrossRef]
  16. Weng, S.F.; Reps, J.; Kai, J.; Garibaldi, J.M.; Qureshi, N. Can Machine-Learning Improve Cardiovascular Risk Prediction Using Routine Clinical Data? PLoS ONE 2017, 12, e0174944. [Google Scholar] [CrossRef]
  17. Hamby, S.E.; Hirst, J.D. Prediction of Glycosylation Sites Using Random Forests. BMC Bioinform. 2008, 9, 500. [Google Scholar] [CrossRef] [PubMed]
  18. Bukvic, A.; Smith, A.; Zhang, A. Evaluating Drivers of Coastal Relocation in Hurricane Sandy Affected Communities. Int. J. Disaster Risk Reduct. 2015, 13, 215–228. [Google Scholar] [CrossRef]
  19. Jamali, M.; Nejat, A. Place Attachment and Disasters: Knowns and Unknowns. J. Emerg. Manag. 2016, 14, 349–364. [Google Scholar] [CrossRef]
  20. Xiao, Y.; Van Zandt, S. Building Community Resiliency: Spatial Links between Household and Business Post-Disaster Return. Urban Stud. 2012, 49, 2523–2542. [Google Scholar] [CrossRef]
  21. Najarian, L.M.; Goenjian, A.K.; Pelcovttz, D.; Mandel, F.; Najarian, B. Relocation after a Disaster: Posttraumatic Stress Disorder in Armenia after the Earthquake. J. Am. Acad. Child Adolesc. Psychiatry 1996, 35, 374–383. [Google Scholar] [CrossRef]
  22. Tierney, K.J. Businesses and Disasters: Vulnerability, Impacts, and Recovery. In Handbook of Disaster Research; Rodríguez, H., Quarantelli, E.L., Dynes, R.R., Eds.; Springer: New York, NY, USA, 2007; pp. 275–296. ISBN 978-0-387-32353-4. [Google Scholar]
  23. Lee, J.Y.; Van Zandt, S. Housing Tenure and Social Vulnerability to Disasters: A Review of the Evidence. J. Plan. Lit. 2019, 34, 156–170. [Google Scholar] [CrossRef]
  24. Peek, L.; Morrissey, B.; Marlatt, H. Disaster Hits Home: A Model of Displaced Family Adjustment After Hurricane Katrina. J. Fam. Issues 2011, 32, 1371–1396. [Google Scholar] [CrossRef]
  25. Binder, S.; Baker, C.; Barile, J. Rebuild or Relocate? Resilience and Postdisaster Decision-Making After Hurricane Sandy. Am. J. Community Psychol. 2015, 56, 180–196. [Google Scholar] [CrossRef]
  26. Marjanović, M.; Kovačević, M.; Bajat, B.; Voženílek, V. Landslide Susceptibility Assessment Using SVM Machine Learning Algorithm. Eng. Geol. 2011, 123, 225–234. [Google Scholar] [CrossRef]
  27. Ganggayah, M.D.; Taib, N.A.; Har, Y.C.; Lio, P.; Dhillon, S.K. Predicting Factors for Survival of Breast Cancer Patients Using Machine Learning Techniques. BMC Med. Inform. Decis. Mak. 2019, 19, 48. [Google Scholar] [CrossRef]
  28. Zhao, X.; Lovreglio, R.; Nilsson, D. Modelling and Interpreting Pre-Evacuation Decision-Making Using Machine Learning. Autom. Constr. 2020, 113, 103140. [Google Scholar] [CrossRef]
  29. Ganguly, K.K.; Nahar, N.; Hossain, B.M. A Machine Learning-Based Prediction and Analysis of Flood Affected Households: A Case Study of Floods in Bangladesh. Int. J. Disaster Risk Reduct. 2019, 34, 283–294. [Google Scholar] [CrossRef]
  30. Muchlinski, D.; Siroky, D.; He, J.; Kocher, M. Comparing Random Forest with Logistic Regression for Predicting Class-Imbalanced Civil War Onset Data. Polit. Anal. 2016, 24, 87–103. [Google Scholar] [CrossRef]
  31. Krstajic, D.; Buturovic, L.J.; Leahy, D.E.; Thomas, S. Cross-Validation Pitfalls When Selecting and Assessing Regression and Classification Models. J. Cheminform. 2014, 6, 10. [Google Scholar] [CrossRef] [PubMed]
  32. Pregibon, D. Logistic Regression Diagnostics. Ann. Stat. 1981, 9, 705–724. [Google Scholar] [CrossRef]
  33. Liaw, A.; Wiener, M. Classification and Regression by randomForest. R News 2002, 2, 18–22. [Google Scholar]
  34. Ferri, C.; Hernández-Orallo, J.; Modroiu, R. An Experimental Comparison of Performance Measures for Classification. Pattern Recognit. Lett. 2009, 30, 27–38. [Google Scholar] [CrossRef]
  35. Friedman, J.H. Greedy Function Approximation: A Gradient Boosting Machine. Ann. Stat. 2001, 29, 1189–1232. [Google Scholar] [CrossRef]
  36. Kim, J.; Oh, S. The Virtuous Circle in Disaster Recovery: Who Returns and Stays in Town after Disaster Evacuation? J. Risk Res. 2014, 17, 5. [Google Scholar] [CrossRef]
  37. Myers, C.A.; Slack, T.; Singelmann, J. Social Vulnerability and Migration in the Wake of Disaster: The Case of Hurricanes Katrina and Rita. Popul. Environ. 2008, 29, 271–291. [Google Scholar] [CrossRef]
  38. Huan, Y.; Song, L.; Khan, U.; Zhang, B. Stacking Ensemble of Machine Learning Methods for Landslide Susceptibility Mapping in Zhangjiajie City, Hunan Province, China. Environ. Earth Sci. 2022, 82, 35. [Google Scholar] [CrossRef]
  39. Zhang, B.; Tang, J.; Huan, Y.; Song, L.; Shah, S.Y.A.; Wang, L. Multi-Scale Convolutional Neural Networks (CNNs) for Landslide Inventory Mapping from Remote Sensing Imagery and Landslide Susceptibility Mapping (LSM). Geomat. Nat. Hazards Risk 2024, 15, 2383309. [Google Scholar] [CrossRef]
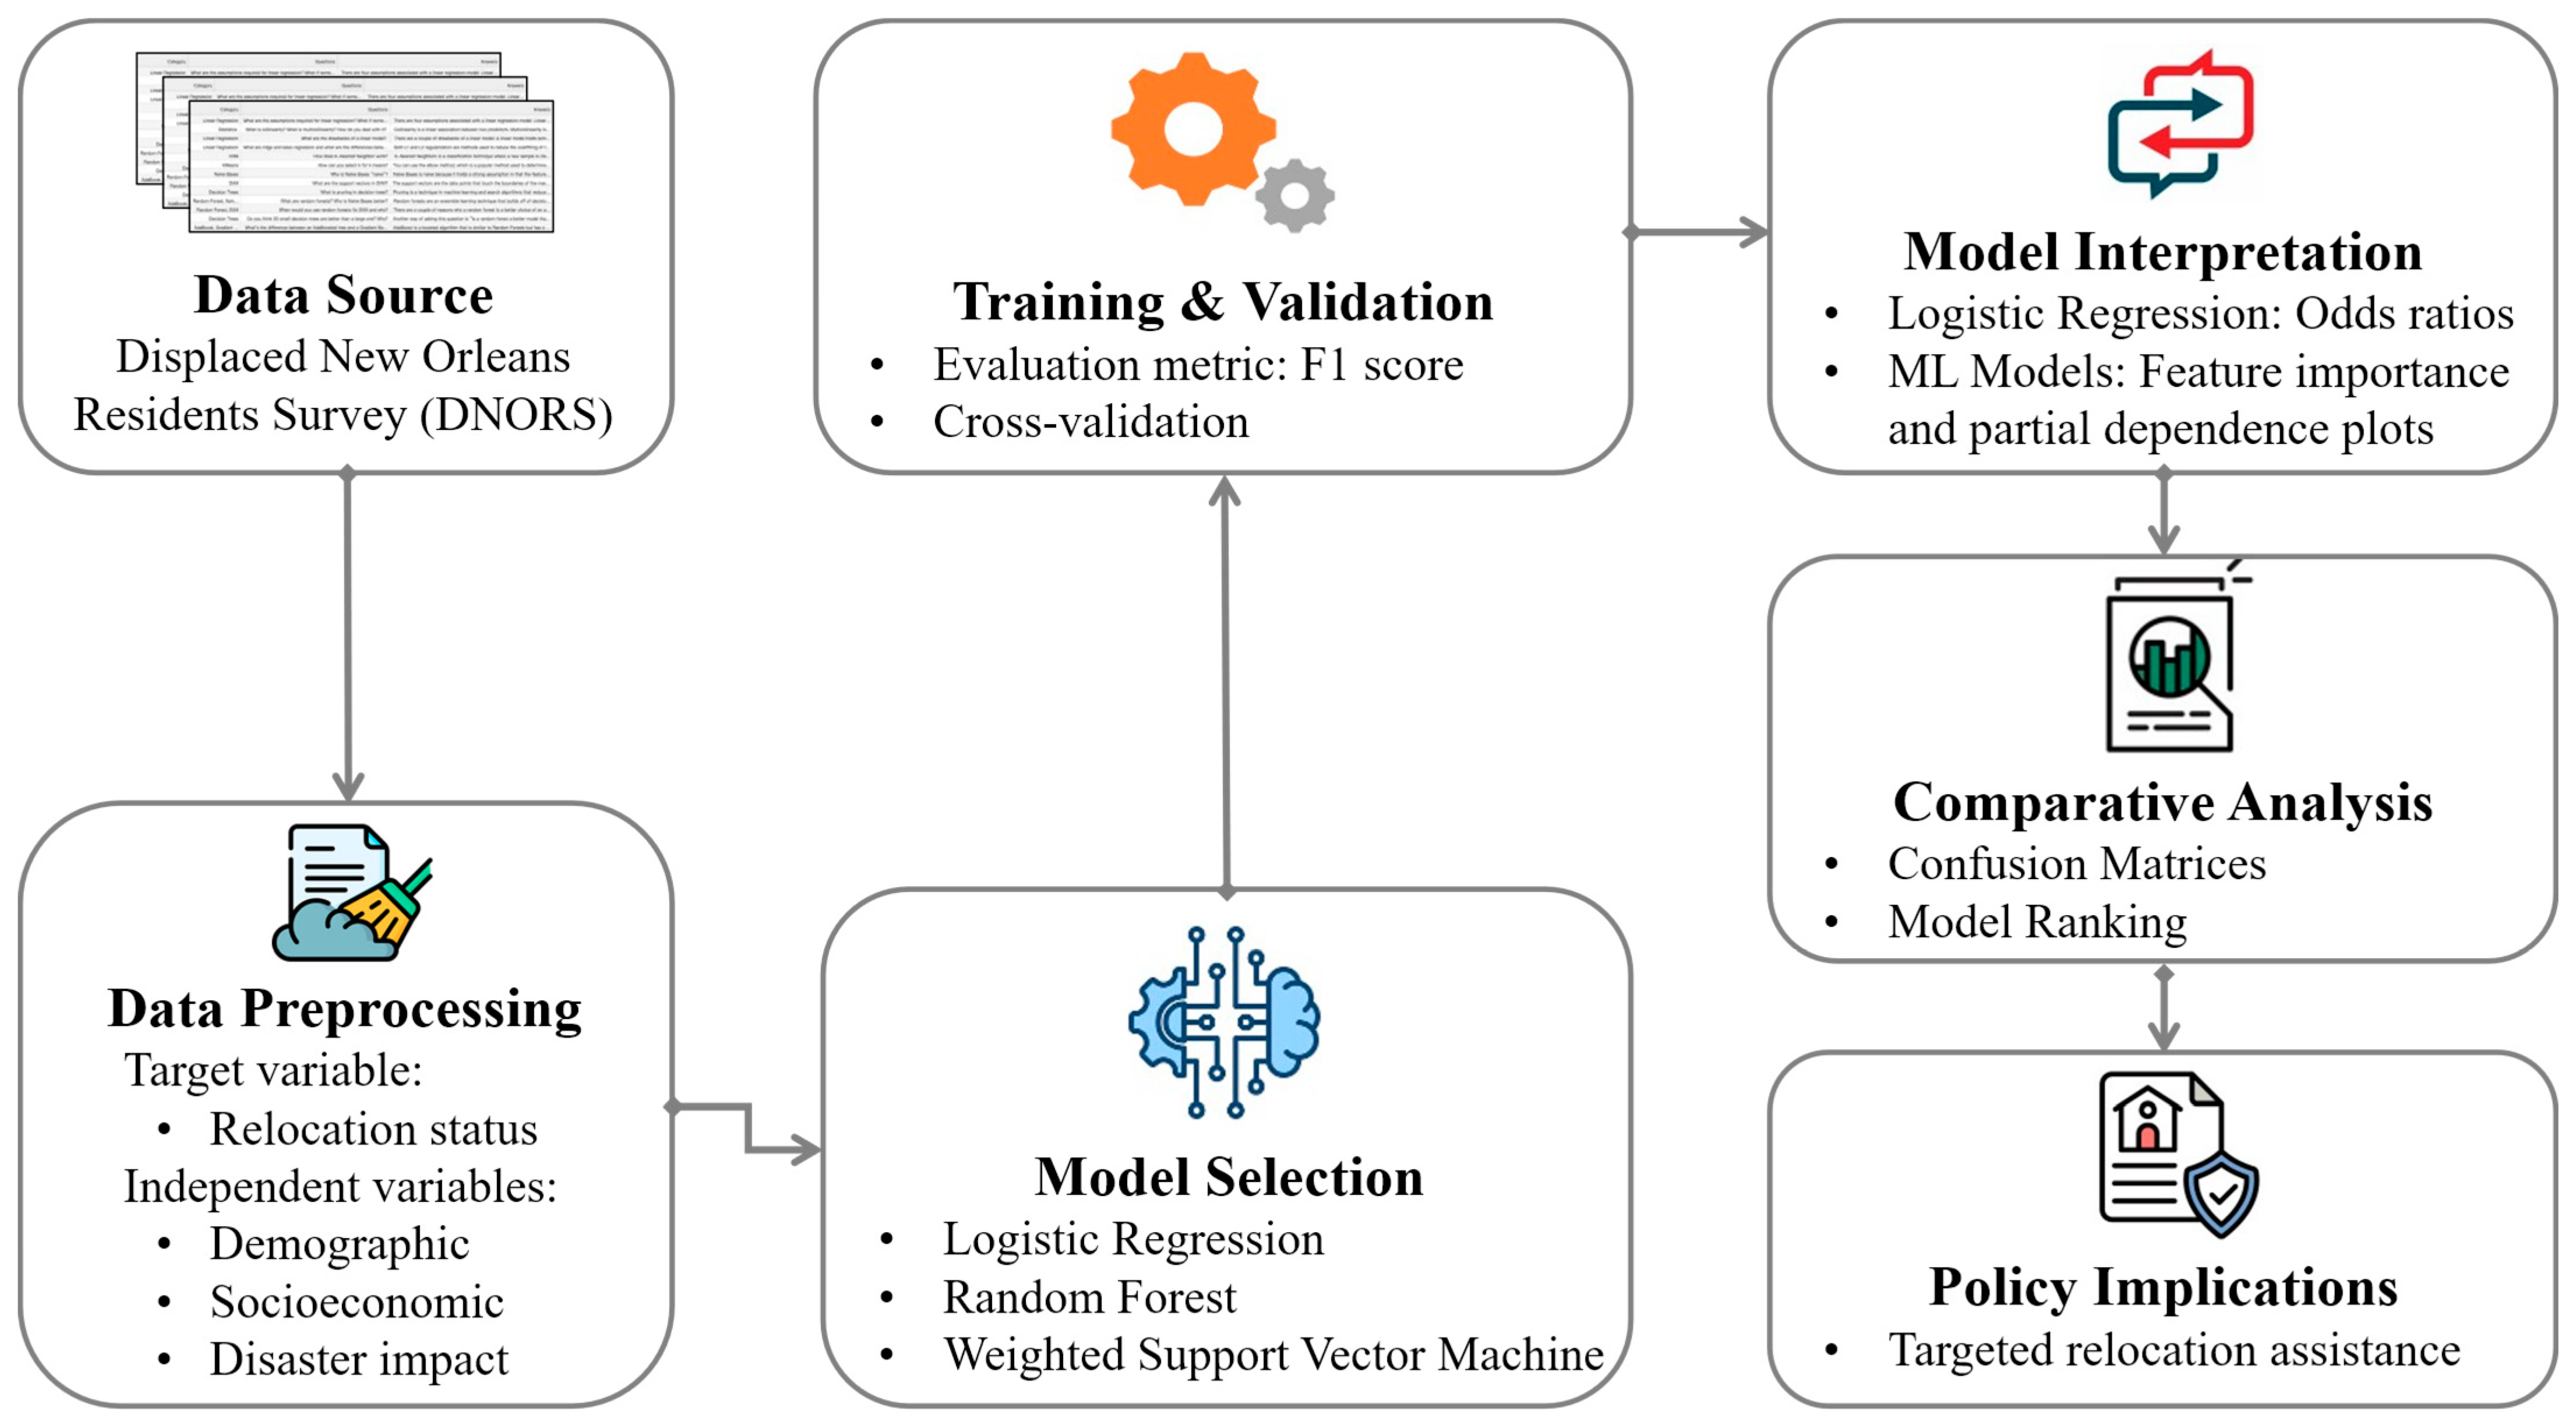
Figure 1. Overview of methodology.
Computers 14 00240 g001
Figure 2. Scheme of Random Forest algorithm.
Computers 14 00240 g002
Figure 3. Comparison of F1 score for the relocated household category across different training-to-testing set ratios.
Computers 14 00240 g003
Figure 4. Exemplary results of the partial dependence plot.
Computers 14 00240 g004
Figure 5. Relative importance of variables.
Computers 14 00240 g005
Table 1. Data Description.
VariableNVariableN
Age Education
  19 to 35 168  Less than high school223
  36 to 50 407  High school302
  51 to 65 473  Some college312
  66 and older256  College graduate467
Household income Religion
  0 to USD 20,000 393  Very religious493
  USD 20,001 to USD 50,000 477  Moderately religious561
  USD 50,001 to USD 75,000173  Slightly religious152
  USD 75,001 and more 261  Not religious at all98
Living with children under 18 years before Katrina Number of pre-Katrina household members
  Yes516  1329
  No788  2 423
Insurance coverage   3232
  All or almost all of my losses143  4 or more320
  Most of my losses201Homeownership
  About half of my losses143  Owner942
  Some of my losses294  Renter362
  Very few or none of my losses189Housing damage
  No insurance334  No damage56
Race/Ethnicity   Some damage375
  Black807  A moderate amount of damage611
  White and others497  A lot of damage262
Note: N represents the number of observations.
Table 2. Results of logistic regression.
VariableOdds Ratio
Black0.983
Homeowner2.927 ***
Living with children under 18 years before Katrina1.131
High school0.636
Some college0.423 **
College graduate0.522 *
Moderately religious1.155
Slightly religious2.873 **
Not religious at all1.486
All or almost all of my losses1.277
Most of my losses1.500
About half of my losses0.809
Some of my losses1.195
Very few or none of my losses0.747
Some damage0.401
A moderate amount of damage0.151 ***
A lot of damage0.122 **
Age 36 to 501.035
Age 51 to 650.927
Age 66 and older0.835
Household income USD 20,001 to USD 50,0001.077
Household income USD 50,001 to USD 75,0000.635
Household income USD 75,001 and more0.945
2 household members before Katrina1.056
3 household members before Katrina0.733
4 or more household members before Katrina0.706
Notes:  p < 0.1, * p < 0.05, ** p < 0.01, *** p < 0.001.
Disclaimer/Publisher’s Note: The statements, opinions and data contained in all publications are solely those of the individual author(s) and contributor(s) and not of MDPI and/or the editor(s). MDPI and/or the editor(s) disclaim responsibility for any injury to people or property resulting from any ideas, methods, instructions or products referred to in the content.