
Energy Transitions over Five Decades: A Statistical Perspective on Global Energy Trends

 ,
,  and
and
Abstract
1. Introduction
2. Data Description
- Date
- Total Fossil Fuels Production
- Nuclear Energy Production
- Total Renewable Energy Production
- Total Primary Energy Production
- Primary Energy Imports
- Primary Energy Exports
- Primary Energy Net Imports
- Primary Energy Stock Change and Other
- Total Fossil Fuels Consumption
- Nuclear Electric Power Consumption
- Total Renewable Energy Consumption
- Total Primary Energy Consumption
- Consistency with Official Sources:We compared selected indicators—such as total primary energy production, fossil fuel consumption, and renewable energy growth—with figures reported by the BP Statistical Review of World Energy (2022) and the IEA World Energy Outlook (2022). The values were consistent across both sources, with deviations within acceptable statistical margins.
- 2.
- Correlation Analysis with EIA Data:A Pearson correlation analysis was performed between our dataset and publicly accessible data from the EIA. High correlation coefficients (>0.95) were observed across key variables, confirming the dataset’s alignment with officially reported statistics.
- 3.
- Limitations and Transparency:While the dataset reflects robust historical trends, we acknowledge that it may not incorporate the most recent policy-driven updates or late data revisions made by original agencies. However, for the scope of this analysis—focused on long-term trends, the dataset provides a reliable and comprehensive foundation.
3. Methodology
- Data Consistency and Completeness: While the dataset includes entries from 1973, records from 1980 onward are more complete across all features and exhibit consistent formatting, allowing for more robust modeling.
- Comparability Across Features: Some key features used in the regression and time series models—such as renewable energy indicators—are either missing or sparse before 1980.
- Forecasting Stability: We excluded 2022 data from the time series forecasting models to preserve a clean historical time window (1980–2021) for training, reserving the most recent year for validation and comparison.
3.1. Statistical Analysis
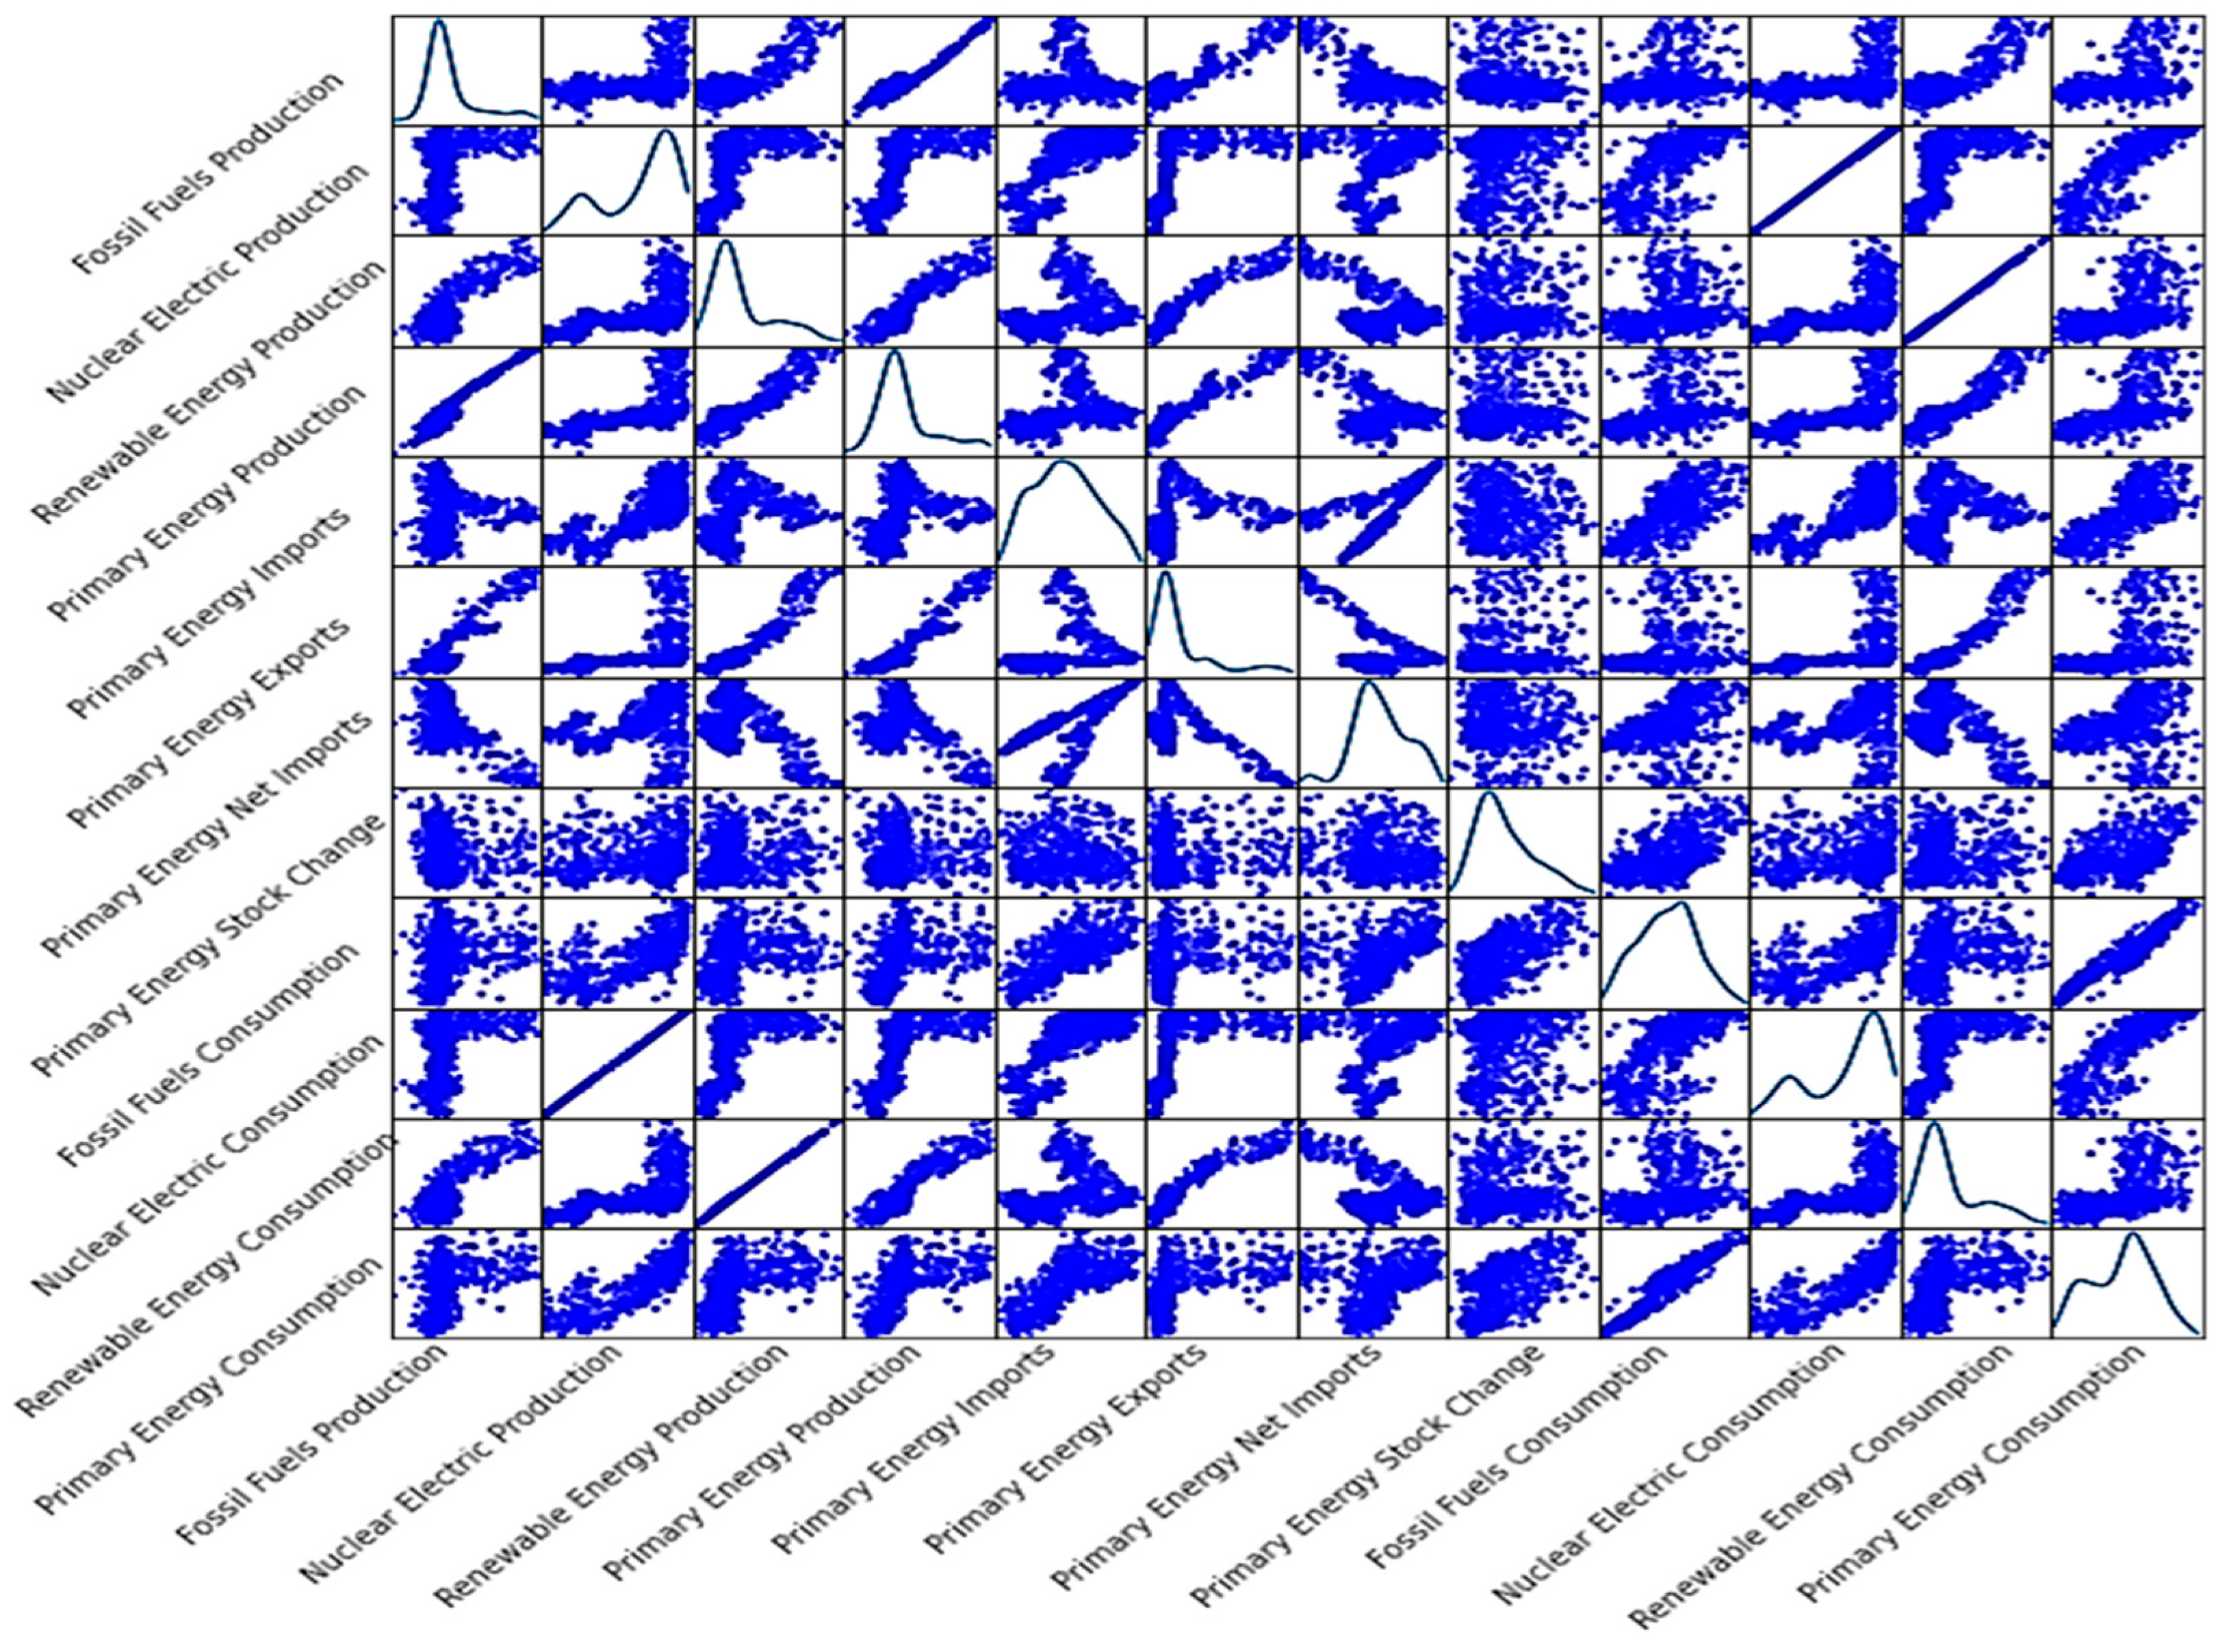
3.1.1. Correlation
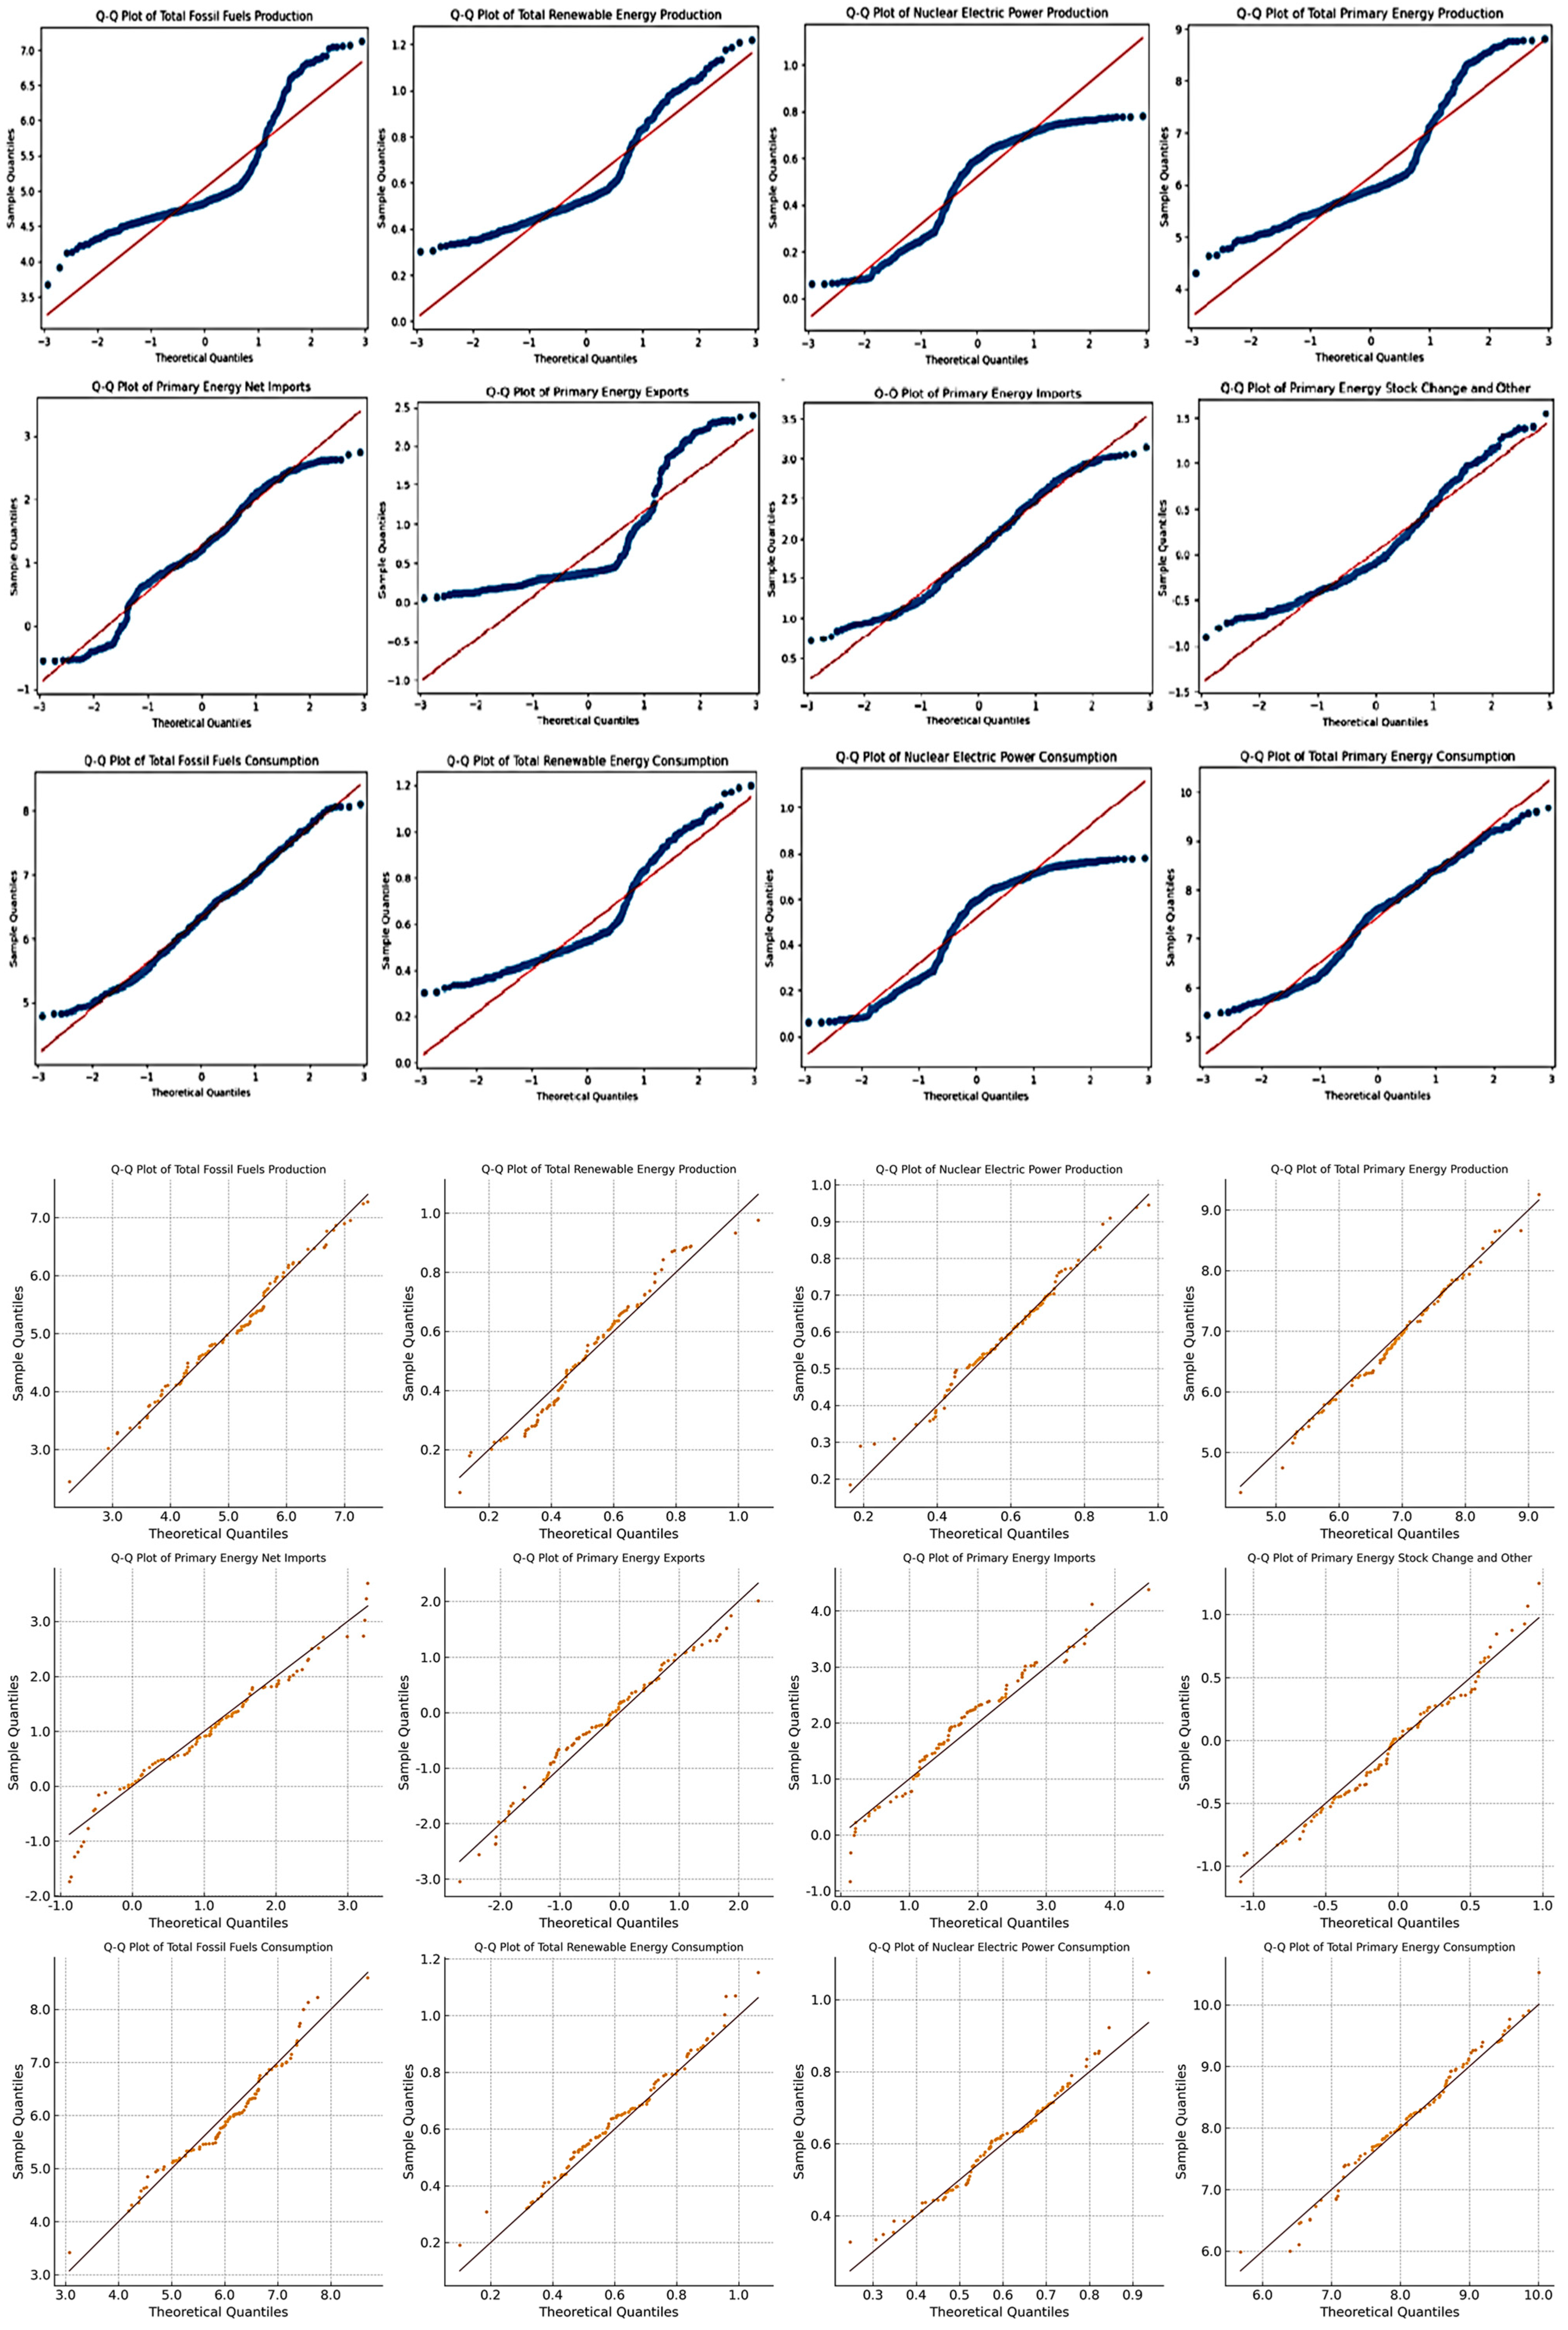
3.1.2. Quantile–Quantile (Q–Q) Plots
- The distribution of your data (sample)
- Against a theoretical distribution (e.g., normal, exponential), or another dataset
- Is my data normally distributed?
- Does it follow the distribution I expect?
3.2. Predictive Modeling
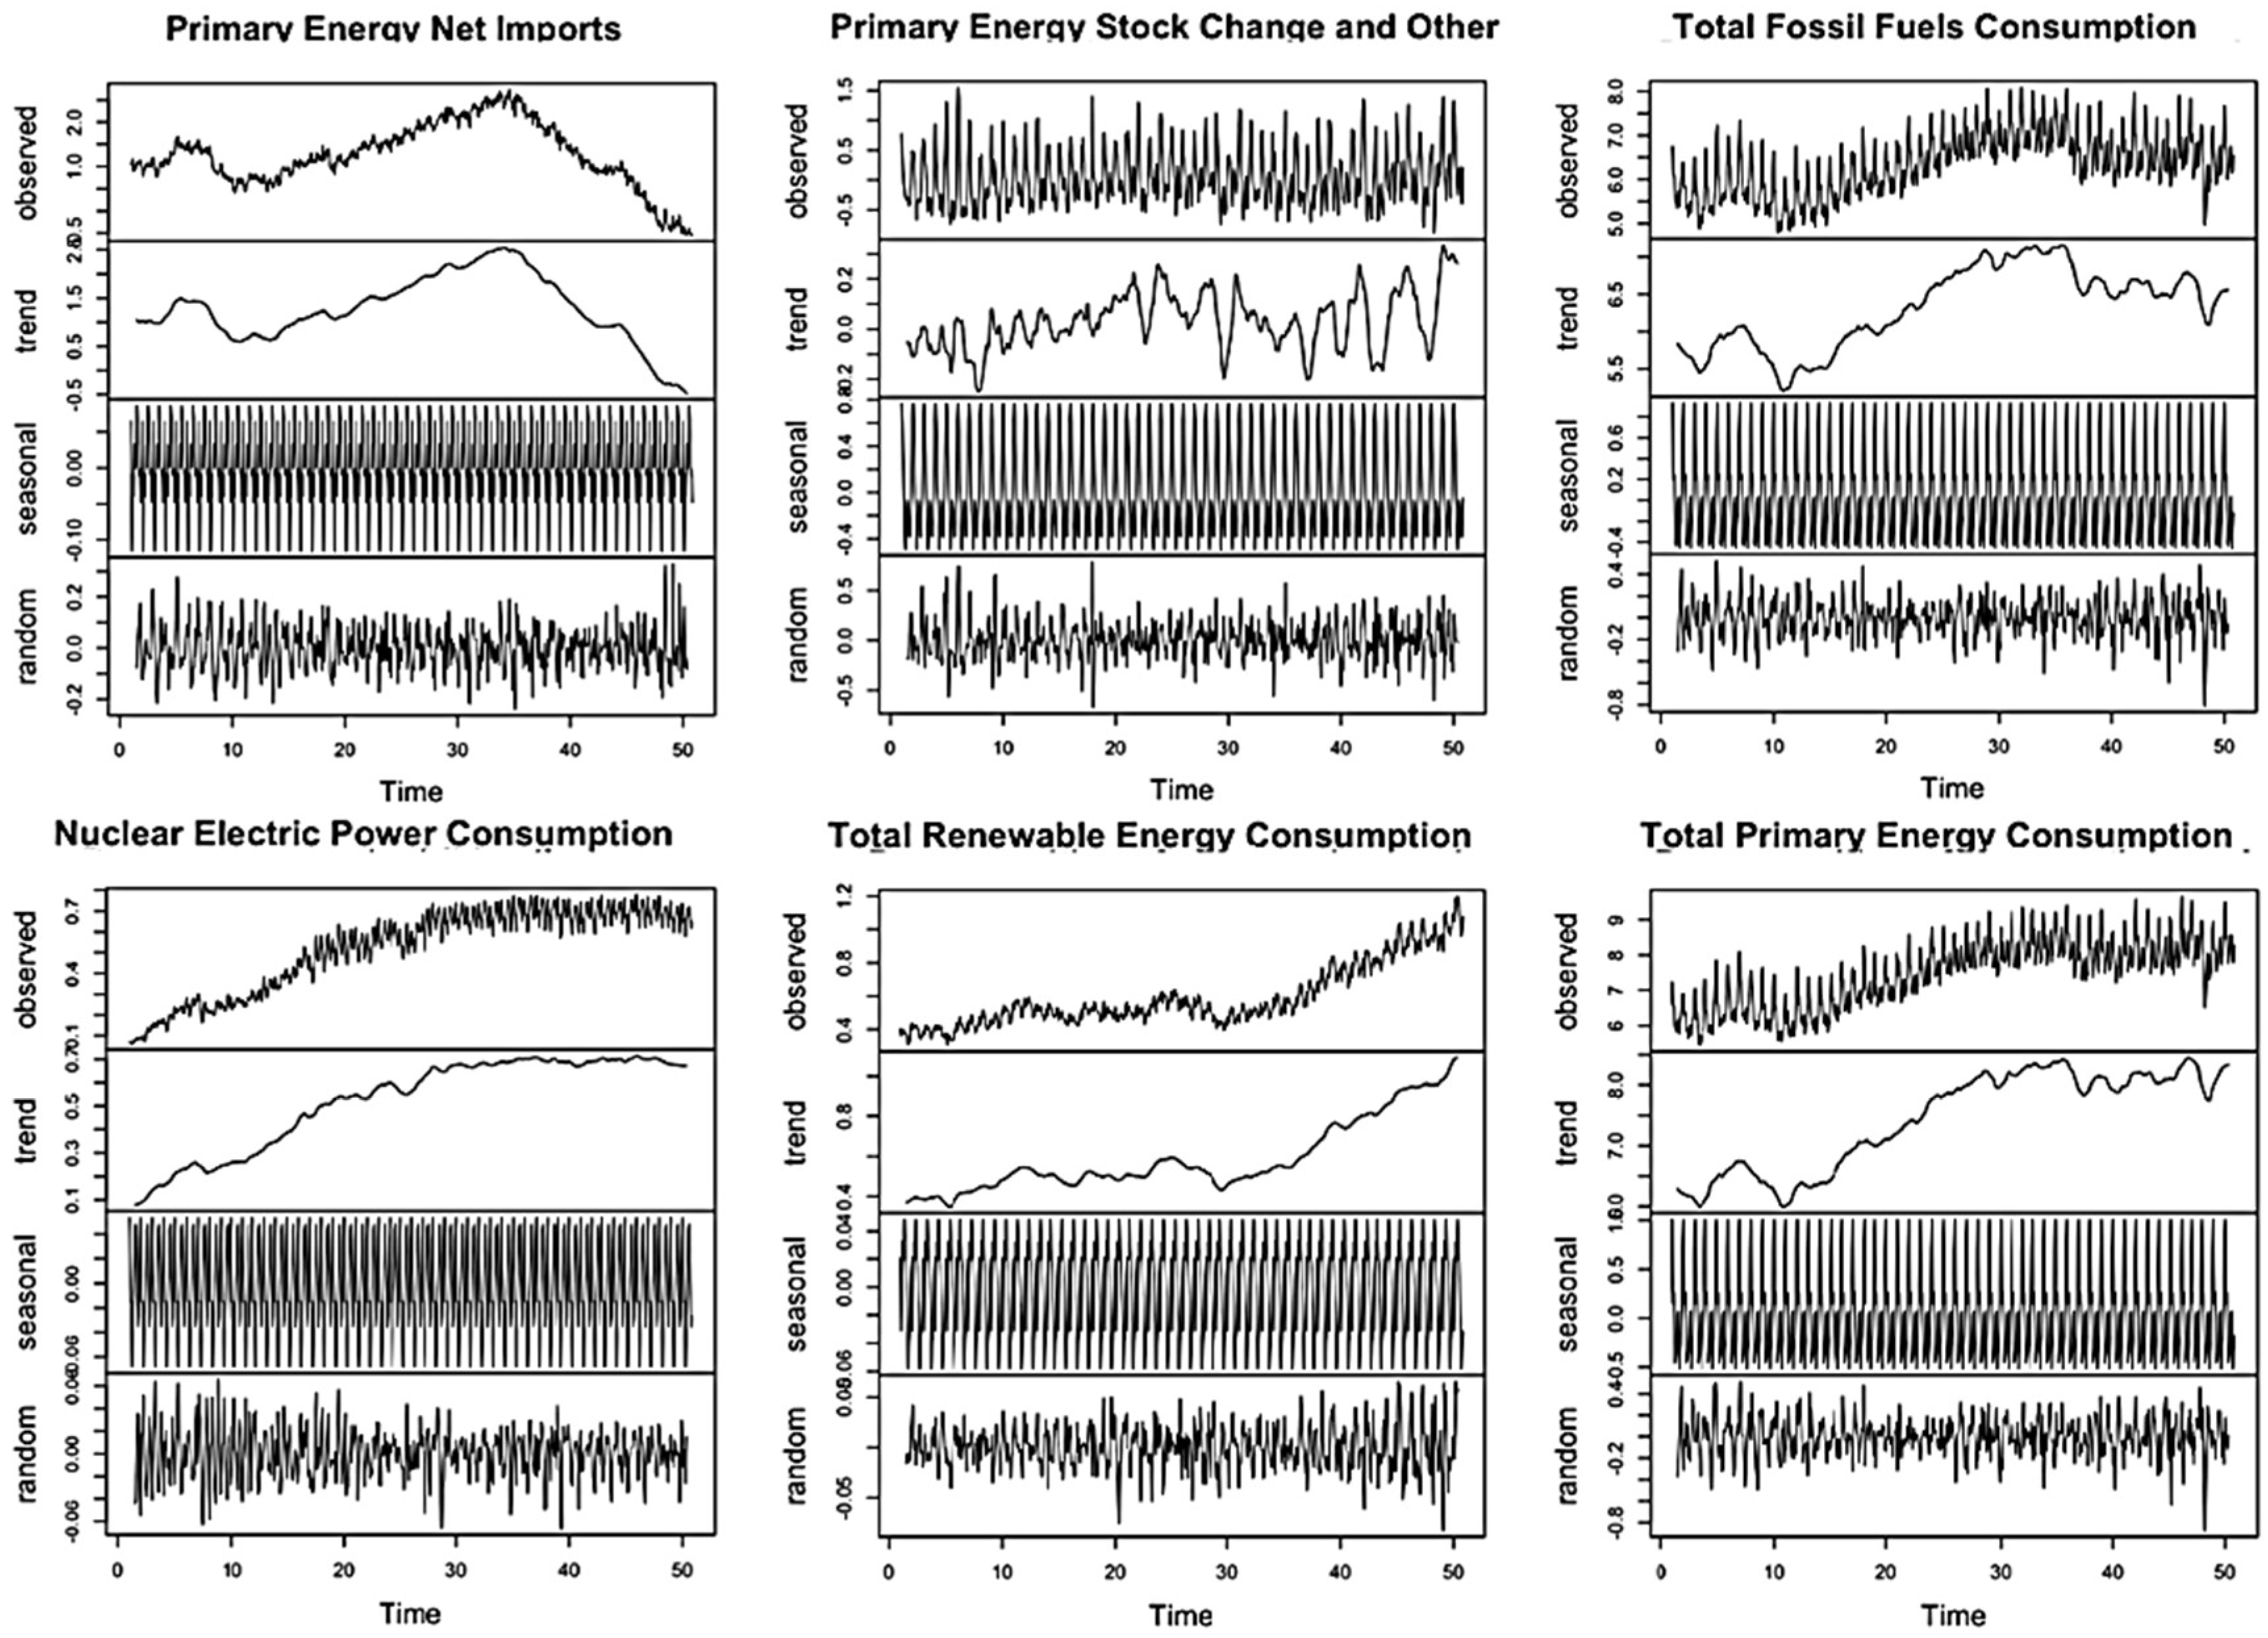
3.2.1. Decomposition Graph
- Trend—the long-term movement or direction of the data
- Seasonality—regular, repeating patterns (like monthly or yearly cycles)
- Residual (or remainder)—what is left after removing trend and seasonality (random noise)
3.2.2. Seasonal ARIMA
- AR—Autoregressive: relationship between an observation and a number of lagged observations.
- I—Integrated: differencing of raw observations to make the time series stationary.
- MA—Moving Average: relationship between an observation and a residual error from a moving average model applied to lagged observations.
- p = the number of autoregressive terms
- d = the number of non-seasonal differences needed for stationarity
- q = the number of lagged forecast errors in the prediction equation.
4. Results and Conclusions
Key Findings
- Statistical Insights:
- ○
- Linear regression identified nuclear electric power production, total renewable energy consumption, and primary energy imports as significant predictors of energy consumption trends.
- ○
- Correlation analysis revealed strong relationships between nuclear energy production and consumption, as well as renewable energy production and consumption.
- Machine Learning Results:
- ○
- Seasonal ARIMA models effectively captured seasonal patterns in energy data, providing accurate forecasts of future energy consumption and production.
- ○
- Projections indicate a steady rise in renewable energy consumption and a gradual decline in fossil fuel dependency, reflecting global sustainability efforts.
- Visual and Temporal Insights:
- ○
- Time series decomposition exposed clear seasonal trends, especially in renewable energy production, influenced by resource availability and evolving global policies.
- ○
- Diagnostic plots validated the reliability of regression and SARIMA models, ensuring robust predictions.
5. Implications
Author Contributions
Funding
Data Availability Statement
Conflicts of Interest
References
- BP. BP Statistical Review of World Energy 2022. British Petroleum, 2022. Available online: https://www.bp.com/en/global/corporate/energy-economics/statistical-review-of-world-energy.html (accessed on 1 January 2023).
- International Energy Agency (IEA). World Energy Outlook 2022; IEA: Paris, France, 2022; Available online: https://www.iea.org/reports/world-energy-outlook-2022 (accessed on 1 January 2022).
- U.S. Energy Information Administration (EIA). International Energy Statistics. 2022. Available online: https://www.eia.gov/international/data/world (accessed on 1 January 2022).
- World Bank. Energy Use (kg of Oil Equivalent per Capita). 2022. Available online: https://data.worldbank.org/indicator/EG.USE.PCAP.KG.OE (accessed on 1 January 2022).
- Weron, R. Electricity price forecasting: A review of the state-of-the-art with a look into the future. Int. J. Forecast. 2014, 30, 1030–1081. [Google Scholar] [CrossRef]
- Hong, T.; Pinson, P.; Fan, S. Global Energy Forecasting Competition 2012. Int. J. Forecast. 2014, 30, 357–363. [Google Scholar] [CrossRef]
- Shahbaz, M.; Lean, H.H.; Farooq, A. Natural gas consumption and economic growth in Pakistan. Renew. Sustain. Energy Rev. 2013, 18, 87–94. [Google Scholar] [CrossRef]
- Kirschen, D.S.; Strbac, G. Fundamentals of Power System Economics, 2nd ed.; Wiley: Hoboken, NJ, USA, 2018; Available online: https://www.wiley.com/en-us/Fundamentals+of+Power+System+Economics%2C+2nd+Edition-p-9781119213253 (accessed on 1 January 2018).
- Zeng, J.; Yang, Z.; Sun, H. Time Series Analysis and Forecasting of Energy Consumption Using Seasonal ARIMA Model. Energy Rep. 2020, 6, 61–66. Available online: https://www.researchgate.net/publication/301535039_Energy_Consumption_Forecasting_Using_Seasonal_ARIMA_with_Artificial_Neural_Networks_Models (accessed on 1 January 2020).
- Asiri, M.M.; Aldehim, G.; Abdullah Alotaibi, F.; Alnfiai, M.M.; Assiri, M.; Mahmud, A. Short-Term Load Forecasting in Smart Grids Using Hybrid Deep Learning. IEEE Access 2024, 12, 23504–23513. [Google Scholar] [CrossRef]
- Hastie, T.; Tibshirani, R.; Friedman, J. The Elements of Statistical Learning: Data Mining, Inference, and Prediction, 2nd ed.; Springer: New York, NY, USA, 2009. [Google Scholar] [CrossRef]
- Makridakis, S.; Spiliotis, E.; Assimakopoulos, V. Statistical and Machine Learning Forecasting Methods: Concerns and Ways Forward. PLoS ONE 2018, 13, e0194889. [Google Scholar] [CrossRef] [PubMed]
- Sun, Q.; Wu, Z.; Gu, W.; Zhang, X.-P.; Liu, P.; Pan, G.; Qiu, H. Tri-Level Multi-Energy System Planning Method for Zero Energy Buildings Considering Long- and Short-Term Uncertainties. IEEE Trans. Sustain. Energy 2022, 14, 339–355. [Google Scholar] [CrossRef]
- Granger, C.W.J.; Newbold, P. Forecasting Economic Time Series, 2nd ed.; Academic Press: Orlando, FL, USA, 1986; Available online: https://econpapers.repec.org/bookchap/eeemonogr/9780122951831.htm (accessed on 1 January 1986).
- Amin-Naseri, A.A.; Gharacheh, M.R. A Hybrid Artificial Intelligence Approach to Monthly Forecasting of Crude Oil Price Time Series. Computer Science, Economics, 2007. Available online: https://www.semanticscholar.org/paper/A-Hybrid-Artificial-Intelligence-Approach-to-of-Oil-Amin-Naseri-Gharacheh/c453a4e953874d9096201b61e366b64250e98a34 (accessed on 1 January 2007).
- Hyndman, A.; Athanasopoulos, G. Forecasting: Principles and Practice, 3rd ed.; OTexts: Melbourne, Australia, 2021; Available online: https://otexts.com/fpp3/ (accessed on 1 January 2021).
- Birol, F. Energy Economics: A Place for Energy Poverty in the Agenda? Energy J. 2007, 28, iv-6. [Google Scholar] [CrossRef]
- Taylor, J.W. Short-Term Load Forecasting with Exponentially Weighted Methods. IEEE Trans. Power Syst. 2012, 27, 458–464. [Google Scholar] [CrossRef]
- McMichael, A.J.; Butler, C.D.; Folke, C. New Visions for Addressing Sustainability. Science 2003, 302, 1919–1920. [Google Scholar] [CrossRef] [PubMed]
- Böhringer, C.; Löschel, A. Climate Policies. In Climate Change Policies and Global Trade. ResearchGate, 2004. Available online: https://www.researchgate.net/publication/321594156_Climate_Change_Policy_and_Global_Trade (accessed on 1 January 2004).
- Mutezo, G.; Mulopo, J. A review of Africa’s transition from fossil fuels to renewable energy using circular economy principles. Renew. Sustain. Energy Rev. 2021, 137, 110609. [Google Scholar] [CrossRef]
- Meier, P.; Vagliasindi, M.; Imran, M. The Design and Sustainability of Renewable Energy Incentives: An Economic Analysis; Energy & Mining; World Bank Publications: Washington, DC, USA, 2014. [Google Scholar]


| Variable | Mean | Std Dev | Min | 25% | 50% | 75% | Max |
|---|---|---|---|---|---|---|---|
| Fossil Fuels Production | 5.035 | 0.61 | 3.676 | 4.684 | 4.832 | 5.087 | 7.127 |
| Nuclear Electric Production | 0.52 | 0.203 | 0.062 | 0.329 | 0.594 | 0.681 | 0.78 |
| Renewable Energy Production | 0.594 | 0.193 | 0.304 | 0.467 | 0.527 | 0.685 | 1.219 |
| Primary Energy Production | 6.148 | 0.895 | 4.307 | 5.59 | 5.906 | 6.29 | 8.81 |
| Primary Energy Imports | 1.873 | 0.561 | 0.711 | 1.447 | 1.849 | 2.281 | 3.15 |
| Primary Energy Exports | 0.612 | 0.545 | 0.057 | 0.311 | 0.373 | 0.68 | 2.386 |
| Primary Energy Net Imports | 1.262 | 0.725 | −0.555 | 0.856 | 1.201 | 1.76 | 2.742 |
| Primary Energy Stock Change | 0.032 | 0.477 | −0.895 | −0.328 | −0.081 | 0.325 | 1.551 |
| Fossil Fuels Consumption | 6.321 | 0.708 | 4.784 | 5.798 | 6.339 | 6.789 | 8.006 |
| Nuclear Electric Consumption | 0.52 | 0.203 | 0.062 | 0.329 | 0.594 | 0.681 | 0.78 |
| Renewable Energy Consumption | 0.592 | 0.189 | 0.304 | 0.467 | 0.527 | 0.684 | 1.199 |
| Primary Energy Consumption | 7.441 | 0.947 | 5.436 | 6.659 | 7.617 | 8.112 | 9.664 |
Disclaimer/Publisher’s Note: The statements, opinions and data contained in all publications are solely those of the individual author(s) and contributor(s) and not of MDPI and/or the editor(s). MDPI and/or the editor(s) disclaim responsibility for any injury to people or property resulting from any ideas, methods, instructions or products referred to in the content. |
© 2025 by the authors. Licensee MDPI, Basel, Switzerland. This article is an open access article distributed under the terms and conditions of the Creative Commons Attribution (CC BY) license (https://creativecommons.org/licenses/by/4.0/).
Share and Cite
Pali, F.; Dsouza, R.; Ryu, Y.; Oishee, J.; Aikkarakudiyil, J.; Gaikwad, M.A.; Norouzzadeh, P.; Buckner, S.; Rahmani, B. Energy Transitions over Five Decades: A Statistical Perspective on Global Energy Trends. Computers 2025, 14, 190. https://doi.org/10.3390/computers14050190
Pali F, Dsouza R, Ryu Y, Oishee J, Aikkarakudiyil J, Gaikwad MA, Norouzzadeh P, Buckner S, Rahmani B. Energy Transitions over Five Decades: A Statistical Perspective on Global Energy Trends. Computers. 2025; 14(5):190. https://doi.org/10.3390/computers14050190
Chicago/Turabian StylePali, Francina, Roschlynn Dsouza, Yeeon Ryu, Jennifer Oishee, Joel Aikkarakudiyil, Manali Avinash Gaikwad, Payam Norouzzadeh, Steven Buckner, and Bahareh Rahmani. 2025. "Energy Transitions over Five Decades: A Statistical Perspective on Global Energy Trends" Computers 14, no. 5: 190. https://doi.org/10.3390/computers14050190
APA StylePali, F., Dsouza, R., Ryu, Y., Oishee, J., Aikkarakudiyil, J., Gaikwad, M. A., Norouzzadeh, P., Buckner, S., & Rahmani, B. (2025). Energy Transitions over Five Decades: A Statistical Perspective on Global Energy Trends. Computers, 14(5), 190. https://doi.org/10.3390/computers14050190